Embed Size (px)
Citation preview
HLT02 METVES
EMRP JRP – HLT 02 MetVes
List of stakeholder requirements for the use of method for dimensional
characterisation of microvesicles in medical centres
Yuana Yuana1,2, Rienk Nieuwland2,3
1Amsterdam Medical Research B.V., 2Laboratory Experimental Clinical Chemistry, Academic Medical
Centre of University of Amsterdam, and 3van Swinden Laboratory, Delft, The Netherlands
This report is part of deliverable D2.3.1 in work package WP2
Contents
I. Introduction .......................................................................................................................................... 4
II. Contributors ........................................................................................................................................ 5
III. List of applied methods and specifications ........................................................................................ 6
IV. General comments from the contributors ......................................................................................... 8
V. Required methods for dimensional characterization of microvesicles............................................. 12
VI. Conclusions ...................................................................................................................................... 13
VII. References ....................................................................................................................................... 14
VII. Appendix A: Text of original questionnaire .................................................................................... 15
Abbreviations
DLS Dynamic light scattering detection
FF Freeze‐fracture
FSC Forward scatter
LALS Large angle light scattering
MV Microvesicles
NP Nanopore
NTA Nanoparticle tracking analysis
PS Polystyrene
RPS Resistive pulse sensing
SAXS Small‐angle X‐ray scattering
SALS Small angle light scattering
SEC Size exclusion chromatography
SiO2 Silicon dioxide
SSC Side scatter
TEM Transmission electron microscopy
I. Introduction
Within the European Metrology Research Programme (EMRP), the 3 year project “Metrological
characterisation of microvesicles from body fluids as non‐invasive diagnostic biomarkers” (METVES)
has started in June 2012. The aim of the project is to develop traceable measurement techniques for
the characterisation of MV as biomarkers.
The publishable Joint Research Project summary report can be found here:
http://www.euramet.org/index.php?id=emrp_call_2011#c10983
The project has 6 work packages (WPs). This questionnaire is part of WP 2 task 2.3: Comparison of
the dimensional characterization of MV. The stakeholders committee for HLT02 has been contacted
to take part in the questionnaire. Information obtained from the questionnaire is used to produce a
list of stakeholder requirements with regard to the use of methods for dimensional characterization
of MV in medical centers. This list contains the outcome of the survey.
The collected questionnaire contains existing information about:
1. Methods used or intended to be used for characterisation of MV in medical centres
2. Resolution, detection limit, and measurement time of the used methods
3. Outcomes from MV measured by the used methods
4. Reference materials used to calibrate size distribution and concentration of MV
About 70% completed questionnaires were received. This report compiles the information obtained
from the stakeholders.
The original questionnaire is attached in appendix A (page 15).
5
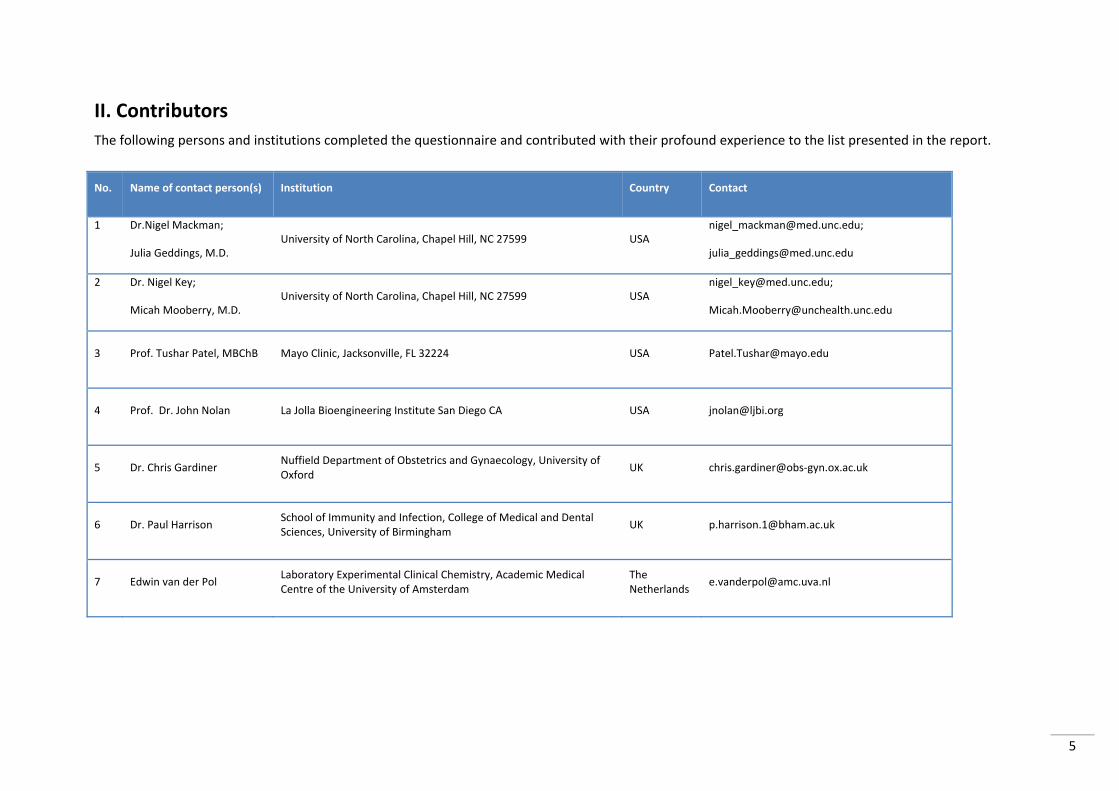
II. Contributors
The following persons and institutions completed the questionnaire and contributed with their profound experience to the list presented in the report.
No. Name of contact person(s) Institution Country Contact
1 Dr.Nigel Mackman;
Julia Geddings, M.D. University of North Carolina, Chapel Hill, NC 27599 USA
2 Dr. Nigel Key;
Micah Mooberry, M.D. University of North Carolina, Chapel Hill, NC 27599 USA
3 Prof. Tushar Patel, MBChB Mayo Clinic, Jacksonville, FL 32224 USA [email protected]
4 Prof. Dr. John Nolan La Jolla Bioengineering Institute San Diego CA USA [email protected]
5 Dr. Chris Gardiner Nuffield Department of Obstetrics and Gynaecology, University of Oxford
UK chris.gardiner@obs‐gyn.ox.ac.uk
6 Dr. Paul Harrison School of Immunity and Infection, College of Medical and Dental Sciences, University of Birmingham
7 Edwin van der Pol Laboratory Experimental Clinical Chemistry, Academic Medical Centre of the University of Amsterdam
The Netherlands
6
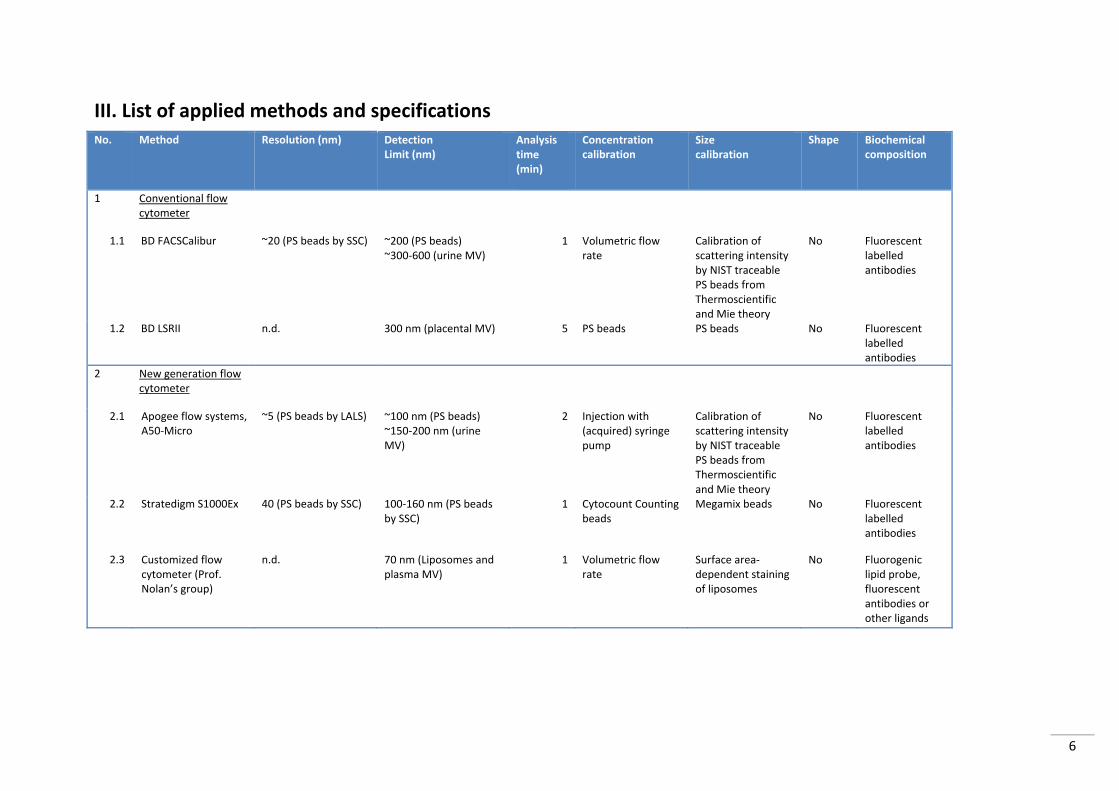
III. List of applied methods and specifications No. Method Resolution (nm) Detection
Limit (nm) Analysis time (min)
Concentration calibration
Size calibration
Shape Biochemical composition
1 Conventional flow cytometer
1.1 BD FACSCalibur ~20 (PS beads by SSC) ~200 (PS beads) ~300‐600 (urine MV)
1 Volumetric flow rate
Calibration of scattering intensity by NIST traceable PS beads from Thermoscientific and Mie theory
No Fluorescent labelled antibodies
1.2 BD LSRII n.d. 300 nm (placental MV) 5 PS beads PS beads No Fluorescent labelled antibodies
2 New generation flow cytometer
2.1 Apogee flow systems, A50‐Micro
~5 (PS beads by LALS) ~100 nm (PS beads) ~150‐200 nm (urine MV)
2 Injection with (acquired) syringe pump
Calibration of scattering intensity by NIST traceable PS beads from Thermoscientific and Mie theory
No Fluorescent labelled antibodies
2.2 Stratedigm S1000Ex
40 (PS beads by SSC) 100‐160 nm (PS beads by SSC)
1 Cytocount Counting beads
Megamix beads No Fluorescent labelled antibodies
2.3 Customized flow cytometer (Prof. Nolan’s group)
n.d. 70 nm (Liposomes and plasma MV)
1 Volumetric flow rate
Surface area‐dependent staining of liposomes
No Fluorogenic lipid probe, fluorescent antibodies or other ligands
7
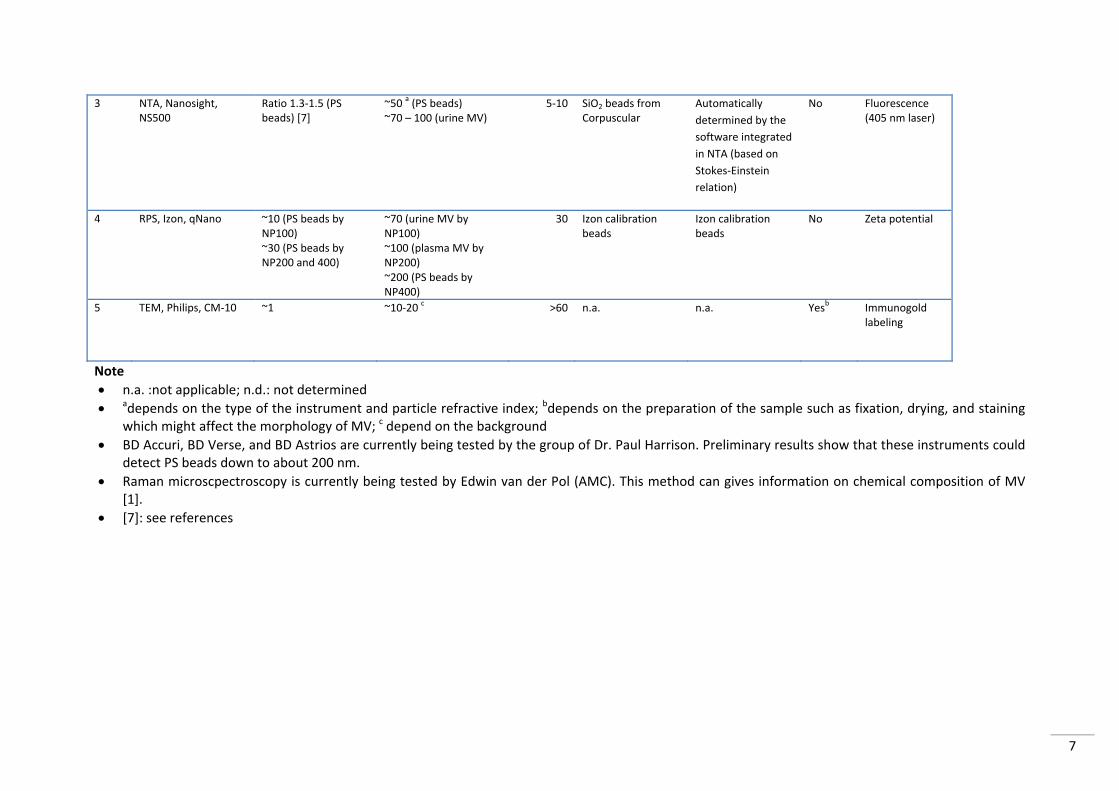
3 NTA, Nanosight, NS500
Ratio 1.3‐1.5 (PS beads) [7]
~50 a (PS beads)
~70 – 100 (urine MV) 5‐10 SiO2 beads from
Corpuscular Automatically
determined by the
software integrated
in NTA (based on
Stokes‐Einstein
relation)
No Fluorescence (405 nm laser)
4 RPS, Izon, qNano ~10 (PS beads by NP100) ~30 (PS beads by NP200 and 400)
~70 (urine MV by NP100) ~100 (plasma MV by NP200) ~200 (PS beads by NP400)
30 Izon calibration beads
Izon calibration beads
No Zeta potential
5 TEM, Philips, CM‐10 ~1 ~10‐20 c >60 n.a. n.a. Yesb Immunogold
labeling
Note
n.a. :not applicable; n.d.: not determined
adepends on the type of the instrument and particle refractive index; bdepends on the preparation of the sample such as fixation, drying, and staining which might affect the morphology of MV; c depend on the background
BD Accuri, BD Verse, and BD Astrios are currently being tested by the group of Dr. Paul Harrison. Preliminary results show that these instruments could detect PS beads down to about 200 nm.
Raman microscpectroscopy is currently being tested by Edwin van der Pol (AMC). This method can gives information on chemical composition of MV [1].
[7]: see references
IV. General comments from the contributors
Flow cytometry
Minimum detection limit: The new generation of flow cytometers, e.g. Apogee A50‐Micro,
Stratedigm S1000Ex, BD Accuri, BD Verse, and BD Astrios, are able to detect PS beads between
100 nm and 200 nm by using light scatter. However, PS beads are not comparable to MV
because the refractive index of PS beads is higher (~1.61) than that of MV (~1.38). Therefore,
MV with sizes 100‐200 nm will not be detected by these flow cytometers. To be noted, Apogee
A50‐Micro was developed for small (<1 µm) particle detection. Thus far, this flow cytometer is
more sensitive in MV detection in comparison to other commercially available flow cytometers
[2‐4].
Calibration using beads: The advantages of using synthetic particles such as PS and SiO2 beads
for calibrating flow cytometer are that these beads are reasonably monodisperse and their
measurement can be made traceable. Mixtures of beads also could be formulated for size
calibration purposes. The downside of PS bead is the refractive index, which is ~1.61, and thus
much higher than the refractive index of MV (~1.38). The influence of the difference in refractive
index between PS bead and MV can be eliminated by calibrating the flow cytometer using
traceable PS beads and application of Mie theory [4]. To calibrate flow cytometry for the
purpose of MV measurement, SiO2 beads with a refractive index of 1.43‐1.46, closer to the
refractive index of MV, may be more appropriate than PS beads.
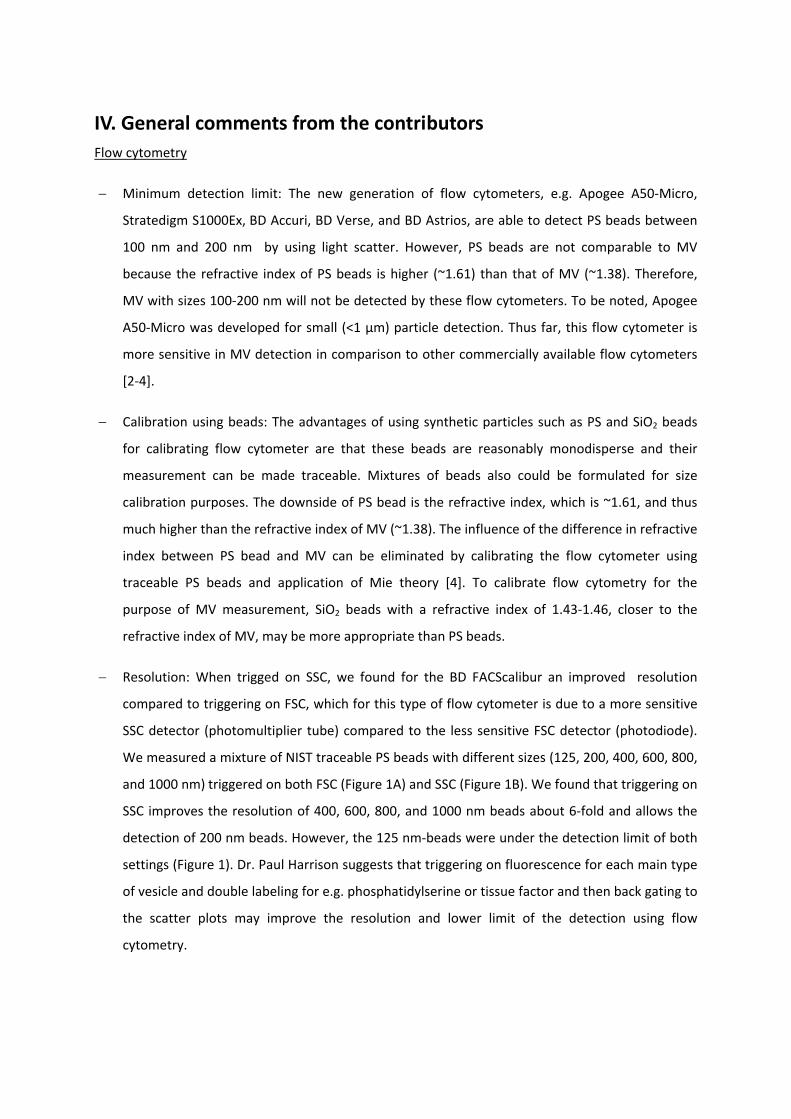
Resolution: When trigged on SSC, we found for the BD FACScalibur an improved resolution
compared to triggering on FSC, which for this type of flow cytometer is due to a more sensitive
SSC detector (photomultiplier tube) compared to the less sensitive FSC detector (photodiode).
We measured a mixture of NIST traceable PS beads with different sizes (125, 200, 400, 600, 800,
and 1000 nm) triggered on both FSC (Figure 1A) and SSC (Figure 1B). We found that triggering on
SSC improves the resolution of 400, 600, 800, and 1000 nm beads about 6‐fold and allows the
detection of 200 nm beads. However, the 125 nm‐beads were under the detection limit of both
settings (Figure 1). Dr. Paul Harrison suggests that triggering on fluorescence for each main type
of vesicle and double labeling for e.g. phosphatidylserine or tissue factor and then back gating to
the scatter plots may improve the resolution and lower limit of the detection using flow
cytometry.
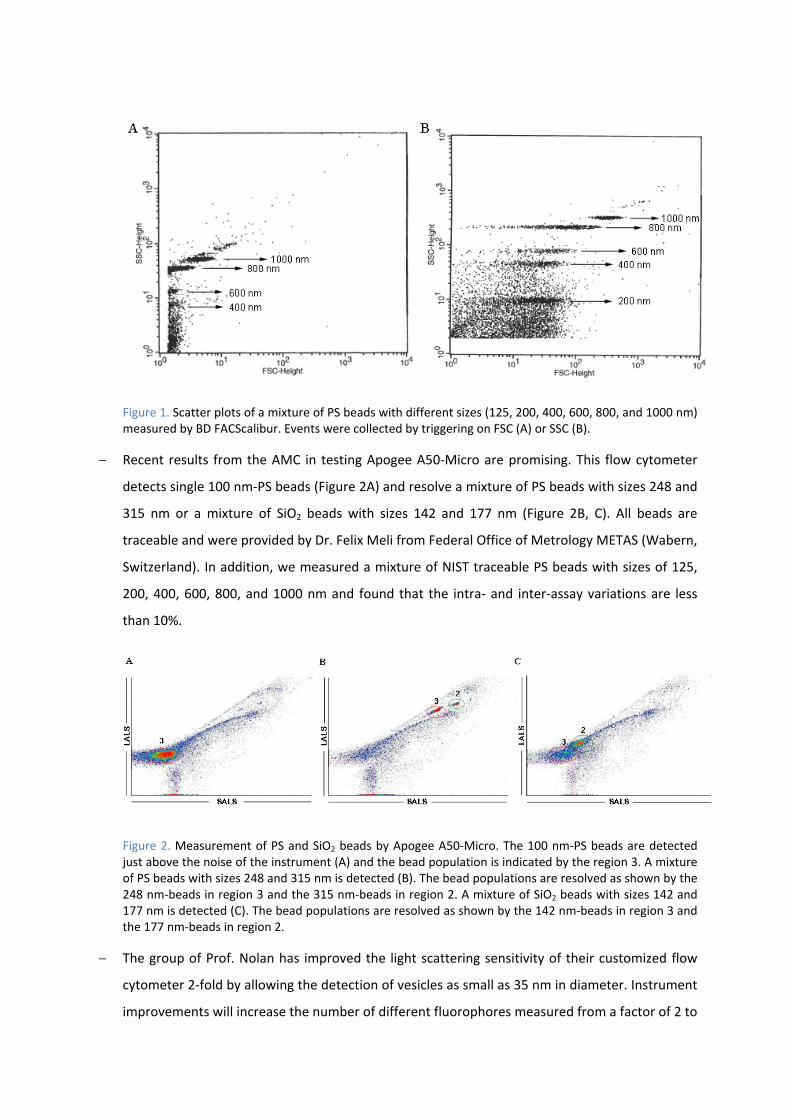
Figure 1. Scatter plots of a mixture of PS beads with different sizes (125, 200, 400, 600, 800, and 1000 nm) measured by BD FACScalibur. Events were collected by triggering on FSC (A) or SSC (B).
Recent results from the AMC in testing Apogee A50‐Micro are promising. This flow cytometer
detects single 100 nm‐PS beads (Figure 2A) and resolve a mixture of PS beads with sizes 248 and
315 nm or a mixture of SiO2 beads with sizes 142 and 177 nm (Figure 2B, C). All beads are
traceable and were provided by Dr. Felix Meli from Federal Office of Metrology METAS (Wabern,
Switzerland). In addition, we measured a mixture of NIST traceable PS beads with sizes of 125,
200, 400, 600, 800, and 1000 nm and found that the intra‐ and inter‐assay variations are less
than 10%.
Figure 2. Measurement of PS and SiO2 beads by Apogee A50‐Micro. The 100 nm‐PS beads are detected just above the noise of the instrument (A) and the bead population is indicated by the region 3. A mixture of PS beads with sizes 248 and 315 nm is detected (B). The bead populations are resolved as shown by the 248 nm‐beads in region 3 and the 315 nm‐beads in region 2. A mixture of SiO2 beads with sizes 142 and 177 nm is detected (C). The bead populations are resolved as shown by the 142 nm‐beads in region 3 and the 177 nm‐beads in region 2.
The group of Prof. Nolan has improved the light scattering sensitivity of their customized flow
cytometer 2‐fold by allowing the detection of vesicles as small as 35 nm in diameter. Instrument
improvements will increase the number of different fluorophores measured from a factor of 2 to
more than a factor of 10. This also should improve the fluorescence detection limits from about
240 green fluorophores to less than about 100 fluorophores, with concomitant improvements in
detection of fluorescent antibodies. However, this customized flow cytometer is not yet
commercially available and only for research purposes.
Nanoparticle tracking analysis
SiO2 beads (100 nm) represent an improvement on PS beads for concentration calibration by
NTA [5]. However, refractive index of silica is similar, but not identical, to that of MV. Clearly, a
biological reference standard with traceable size and concentration is highly desirable for
calibration of NTA and measurement of MV. Concentration measurement by NTA also remains
intensity weighted, and thus particle size and refractive index weighted, while broadening of the
size distribution occurs, particularly for polydisperse samples. Therefore, NTA is inaccurate in
measurements of size distribution and concentration of vesicles.
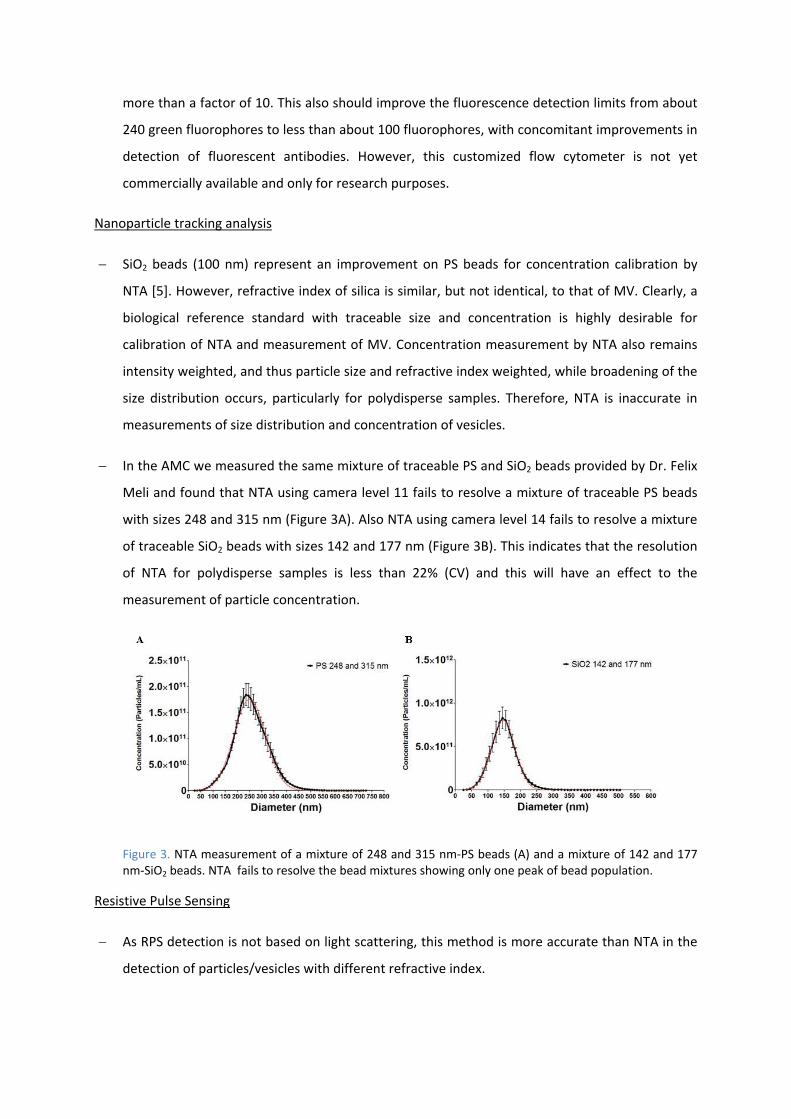
In the AMC we measured the same mixture of traceable PS and SiO2 beads provided by Dr. Felix
Meli and found that NTA using camera level 11 fails to resolve a mixture of traceable PS beads
with sizes 248 and 315 nm (Figure 3A). Also NTA using camera level 14 fails to resolve a mixture
of traceable SiO2 beads with sizes 142 and 177 nm (Figure 3B). This indicates that the resolution
of NTA for polydisperse samples is less than 22% (CV) and this will have an effect to the
measurement of particle concentration.
Figure 3. NTA measurement of a mixture of 248 and 315 nm‐PS beads (A) and a mixture of 142 and 177 nm‐SiO2 beads. NTA fails to resolve the bead mixtures showing only one peak of bead population.
Resistive Pulse Sensing
As RPS detection is not based on light scattering, this method is more accurate than NTA in the
detection of particles/vesicles with different refractive index.
The dynamic range of RPS is limited by the use of the non‐conductive pores which are made by
certain defined size range (NP100: 70‐200 nm; NP200: 100‐400 nm; and NP400: 200‐800 nm).
For a polydisperse sample, measurement using pores with different size range should be done in
order to get the absolute concentration of particles/vesicles in the sample. Clogging caused by
protein aggregates or clustering of vesicles is also a problem in measurement using RPS,
particularly when measuring biological samples. The particle rate will change when clogging
occurs, which will have an effect on the measurement of particle concentration. Also, clogging
makes this system low‐throughput.
Besides all limitations of the RPS pores, two major concerns are that the concentration of
calibration beads provided by the manufacturer of RPS is not traceable, and there is a pore‐to‐
pore variation. The pore‐to‐pore variation causes variation in the minimum detectable particle
size. Thus, the concentration and size measurements of MV by RPS are not traceable.
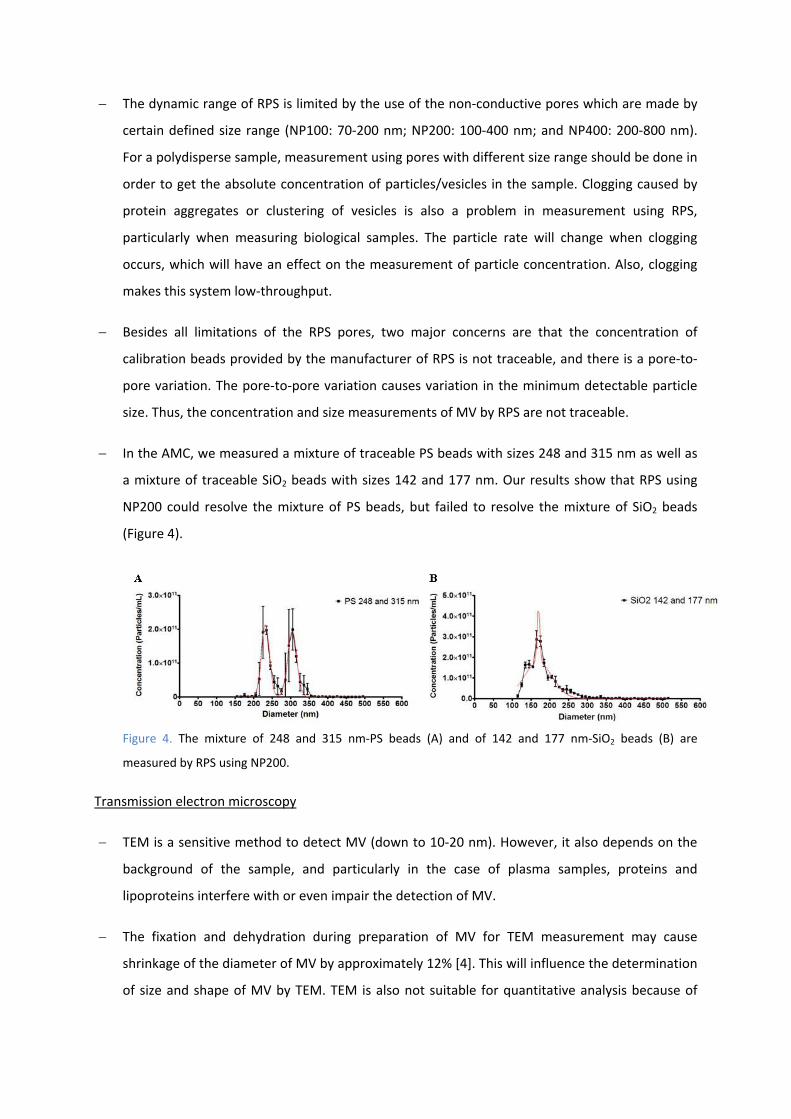
In the AMC, we measured a mixture of traceable PS beads with sizes 248 and 315 nm as well as
a mixture of traceable SiO2 beads with sizes 142 and 177 nm. Our results show that RPS using
NP200 could resolve the mixture of PS beads, but failed to resolve the mixture of SiO2 beads
(Figure 4).
Figure 4. The mixture of 248 and 315 nm‐PS beads (A) and of 142 and 177 nm‐SiO2 beads (B) are
measured by RPS using NP200.
Transmission electron microscopy
TEM is a sensitive method to detect MV (down to 10‐20 nm). However, it also depends on the
background of the sample, and particularly in the case of plasma samples, proteins and
lipoproteins interfere with or even impair the detection of MV.
The fixation and dehydration during preparation of MV for TEM measurement may cause
shrinkage of the diameter of MV by approximately 12% [4]. This will influence the determination
of size and shape of MV by TEM. TEM is also not suitable for quantitative analysis because of
several steps in the sample preparation (e.g. centrifugation and washing steps, adherence of MV
on the grid, and blotting with filter paper). It has been observed that about 21% of the vesicles
are recovered after centrifugation and binding to the formvar coating [4].
V. Required methods for dimensional characterization of
microvesicles
When comparing results of MV measurements using different methods, we have to bear in mind that
each method has a different minimum detection limit which may cause differences in the
measurements of the particle size distribution and concentration. In the medical centres, flow
cytometry, NTA, RPS, and TEM are used to detect MV. Thus far, flow cytometry is still the method of
choice, due to high‐throughput (minutes/sample), and the ability to detect subsets of MV using
commercially available fluorescently labelled‐antibodies in a small volume of sample (~50 µL for
certain flow cytometers). The new generation of flow cytometers, such as Apogee, are relatively fast
and allow multiple fluorescence detection, making them most applicable to clinical research. Apogee
provides more sensitive detection of vesicles down to about 200 nm in comparison to conventional
flow cytometers, which are only able to sensitively detect MV down to about 300 nm. In general,
smaller MV, 100‐200 nm, should be possible to be detected by flow cytometers dedicated to particle
detection. Triggering on fluorescence for these smaller sizes MV may improve the sensitivity. For this
purpose, specific fluorescently labelled‐antibodies and bright fluorescent (lipid) dyes are needed.
All stakeholders agree that reliable measurements of MV can only be achieved by calibrating
methods using appropriate reference standards. These reference standards should be from materials
which at least reflect the characteristics of MV such as refractive index, biochemical composition,
polydispersity, and surface charge. There are two types of reference materials tested for method
calibration. One is synthetic reference materials such as PS and SiO2 beads. These beads are
reasonably monodisperse and they can be made polydisperse to mimic polydispersity of MV in
solution by mixing beads with different sizes. Also, these synthetic reference particles can be made
traceable. As the refractive index of PS bead is around 1.61, which is higher than that of MV (1.38),
SiO2 beads with refractive index of 1.43‐1.46 may be more suitable to be used as a reference
standard. However, PS and SiO2 beads do not have the same biochemical composition as MV and
probably also have a different surface charge.
Alternatively, reference material may come from biological materials such as liposomes, which are
phospholipid vesicles with a refractive index of about 1.45. Liposomes can be produced in different
sizes with certain concentrations and also loaded with different fluorescent dyes. When the sizes of
liposomes and fluorescent‐loaded liposomes are made traceable, they can be used to calibrate the
method based either on light scatters or fluorescent, and subsequently to calibrate the measurement
of MV concentration.
Another important point in the measurement of MV concentration is that the stakeholders require
reference standards with traceable particle concentration. This type of reference standard is not yet
available and should be developed in the near future.
In the MetVes project, we have characterized the size distributions of an erythrocyte‐derived MV
sample by FF‐TEM, NTA, RPS, SEC‐DLS, and SAXS. As reported by Varga et al [6], all of the methods
are capable of characterizing the mode diameter of the studied MV sample within small deviations,
but traceability is not reached in this study. For traceable size determination of MV, the
polydispersity of MV samples, for example due to the presence of (aggregates of) proteins and
lipoproteins, is one of the key problems that need to be solved. In a more complex sample such as
plasma, separation of vesicles with narrow size ranges and removal of (aggregates of) proteins and
lipoproteins prior to measurement will be required. Techniques such as SEC and field‐flow
fractionation chromatography may be used to separate MV from proteins and lipoproteins.
VI. Conclusions
Based on the inputs of the stakeholders through the questionnaire, we conclude that for dimensional
characterization of vesicles the instrument design needs to be improved for allowing measurement
of MV in broader size range (e.g. 30 nm to 1 µm) and in much better resolution (e.g. 10 nm) with
parallel improvements in detection of fluorescent antibodies, (lipid) dyes, or other ligands. Size and
concentration calibration using traceable reference standards with comparable characteristics as MV
will help to reliably determine the size and concentration of MV; and also to compare results of MV
measurements in different medical centres. Traceable measurement of MV will be reached by
acquiring less polydisperse MV samples and for this purpose, purification of MV from other
contaminants such as proteins and lipoproteins is urgently required. Altogether, the most suitable
method required for routine analysis of MV in medical centre in the near future is a method that can
provide a high throughput traceable measurement of size, concentration, and biochemical
composition (e.g. cholesterol, phospholipid composition, protein content) of MV based on single
vesicles in suspension.
VII. References
1. van der Pol E, Coumans F, Varga Z, Krumrey M, Nieuwland R. Innovation in detection of
microparticles and exosomes. J Thromb Haemost 2013; 11 (Suppl. 1): 36–45.E.
2. Chandler WL, Yeung W, Tait JF. A new microparticle size calibration standard for use in
measuring smaller microparticles using a new flow cytometer. J Thromb Haemost. 2011 Jun;
9(6):1216‐24.
3. Montoro‐García S, Shantsila E, Orenes‐Piñero E, Lozano ML, Lip GY. An innovative flow
cytometric approach for small‐size platelet microparticles: influence of calcium. Thromb
Haemost. 2012 Aug;108(2):373‐83.
4. van der Pol E, Coumans FAW, Grootemaat AE, Gardiner C, Sargent IL, Harrison P, Sturk A, van
Leeuwen TG, Nieuwland R. Particle size distribution of exosomes and microvesicles determined
by transmission electron microscopy, flow cytometry, nanoparticle tracking analysis, and
resistive pulse sensing. J Thromb Haemost 2014; DOI:10.1111/jth.12602.
5. Gardiner C, Ferreira YJ, Dragovic RA, Redman CWG, Sargent IL. Extracellular vesicle sizing and
enumeration by nanoparticle tracking analysis. J Extracell Vesicles 2013, 2: 19671.
6. Varga Z, Yuana Y, Grootemaat AE, van der Pol E, Gollwitzer C, Krumrey M, Nieuwland R. Towards
traceable size determination of extracellular vesicles. J Extracell Vesicles. 2014; 3: 10.3402.
7. Car R, Smith J, Hole P, Malloy A, Nelson P, Warren J. The real‐time visualisation and size analysis
of nanoparticles in liquids ‐ nanoparticle tracking analysis. Wiltshire, UK: NanoSight Ltd. and Lost
Artifact Ltd., 2008, 1‐11.

15
VII. Appendix A: Text of original questionnaire
No. Method Resolution
(nm)
Detection limit
(nm)
Measurement time
(minutes)
Concentration1 Concentration calibration2
Size distribution1
Size calibration2
Shape1 Biochemical composition1
1 please indicate with ‘yes/no’; 2if applicable, please specify your calibration procedure
Notification:
Satisfied with the method used Yes *No N.a.
* Please explain the reasons and what need to be improved:
General comments: