Embed Size (px)
Citation preview
EXECUTIVE SUMMARY 14-40
2014 Taxpayer
Satisfaction Survey
July 2014
Patti Wilson Local Government Liaison & Customer Service Advocate
Department of Revenue State of Washington
PO Box 47467 Olympia, WA 98504-7467
Submitted by
Danna Moore Principal Investigator
and
Kent Miller
Study Director
PO Box 644014 | Washington State University | Pullman, Washington 99164-4014 Telephone: (509) 335-1511 | www.sesrc.wsu.edu
Contents Contents ..................................................................................................................................................... ii Project Profile ......................................................................................................................................... iii List of Figures ........................................................................................................................................... iv List of Tables ............................................................................................................................................ iv Introduction .............................................................................................................................................. 6 Summary of Key Findings .................................................................................................................... 7 Questionnaire ........................................................................................................................................ 18 Methodology.......................................................................................................................................... 21 Background and Objectives ............................................................................................................. 21 Sample ...................................................................................................................................................... 21 Design....................................................................................................................................................... 23 Data Collection ...................................................................................................................................... 24 Response Rates ..................................................................................................................................... 25 File Weighting ....................................................................................................................................... 26 Conclusion .............................................................................................................................................. 28
Project Profile Title: 2014 Taxpayer Satisfaction Survey Abstract: From May through July 2014, the Social & Economic Sciences Research Center conducted a survey of businesses for the Washington State Department of Revenue. The purpose of the survey is to ask about the services provided by DOR and where improvements could be made. Businesses were conducted by email or postal mail and respondents had the option of completing the survey either online or by answering a paper questionnaire. Overall 750 respondents completed the survey by web, 22 partially completed the web survey, and 373 returned the paper questionnaire. This return yields a response rate of 28.5%. For analysis purposes, the responses are weighted to ensure that the survey results are representative of the overall population of businesses. Methods: Respondents with an email address were initially contacted by email and those without an email address were sent a paper questionnaire. Respondents with email addresses received up to four contacts by email and one by postal mail. Respondents without email addresses were contacted twice by postal mail. All email contacts were sent by SESRC and contained a link to the web survey and the respondent’s unique access code. Timeframe: May-July 2014
Agreement with: Patti Wilson Local Government Liaison & Customer Service Advocate Department of Revenue State of Washington PO Box 47467 Olympia, WA 98504-7467 360-534-1543 [email protected] SESRC Acronym: DREV14 Report Number: 14-40
List of Figures
Q4. How satisfied are you with the overall quality of service you receive from the Department of Revenue? ............................................................................................................................... 7
Q5. In the last year, how often have you interacted with the Department of Revenue using each of the
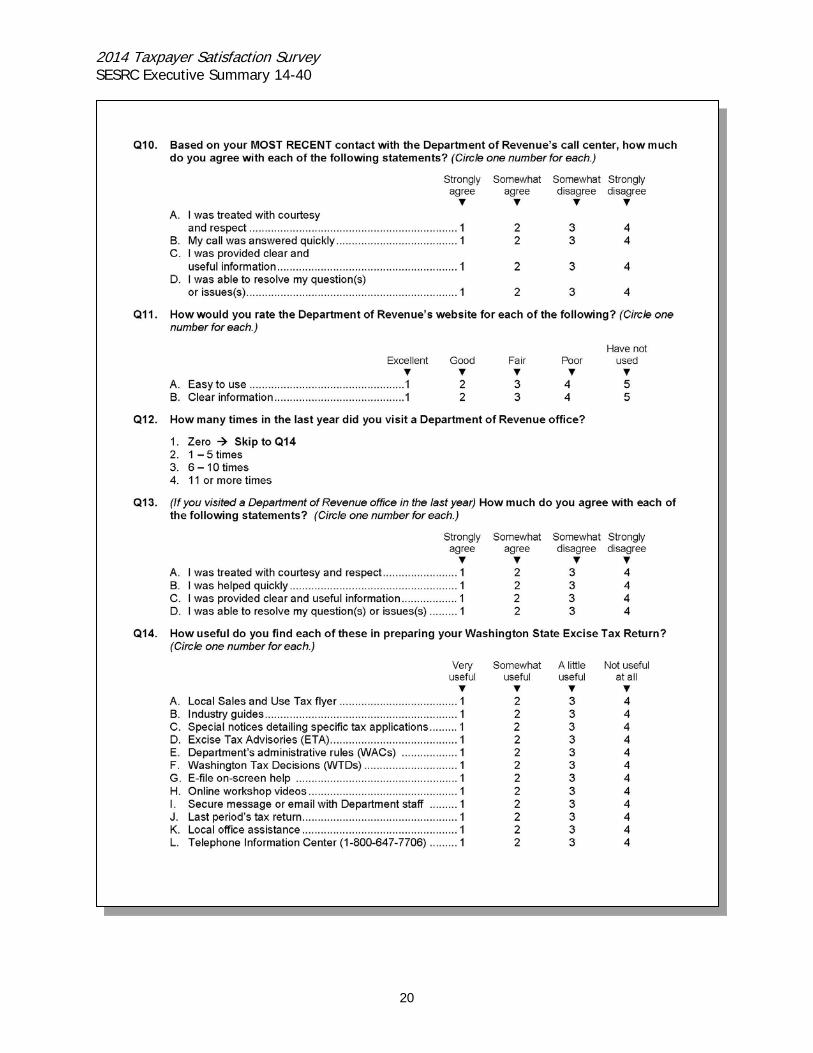
following? ............................................................................................................................... 8 Q7. How do you prefer to get tax assistance and information? .............................................................. 9 Q8. How long of a wait is acceptable when you contact the call center? .............................................. 10 Q9. Have you contacted the Department of Revenue's call center in the last year? .............................. 11 Q10. Based on your MOST RECENT contact with the Department of Revenue's call center, how much do
you agree with each of the following statements? ................................................................... 12 Q11. How would you rate the Department of Revenue's web site for each of the following? ................. 13 Q13. (If you visited a Department of Revenue office in the last year) How much do you agree with each
of the following statements? .................................................................................................. 14 Q14. How useful do you find each of these in preparing your Washington State Excise Tax Return? (%
answering very or somewhat useful) ...................................................................................... 15 Q15. How much do you agree with each of these statements about the Department of Revenue and its
services? .............................................................................................................................. 16 Q17. How important is it to access each of these services on a phone, tablet, or other mobile device? .. 17
List of Tables
Table 1. Number and Percent of Businesses in Each Strata of the Population and Sample ..................... 22 Table 2. Response Rate .................................................................................................................... 25 Table 3. Completes and Weights for Each Strata ................................................................................. 26

This page intentionally left blank
v
2014 Taxpayer Satisfaction Survey SESRC Executive Summary 14-40
1. Introduction
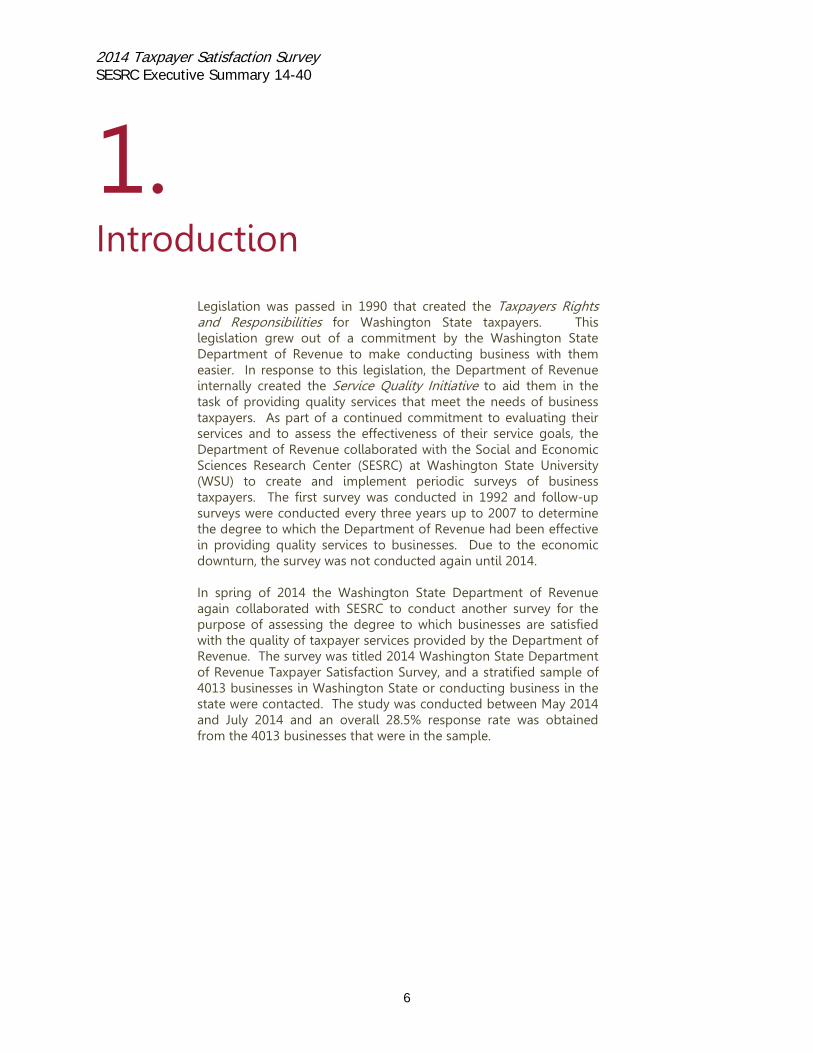
Legislation was passed in 1990 that created the Taxpayers Rights and Responsibilities for Washington State taxpayers. This legislation grew out of a commitment by the Washington State Department of Revenue to make conducting business with them easier. In response to this legislation, the Department of Revenue internally created the Service Quality Initiative to aid them in the task of providing quality services that meet the needs of business taxpayers. As part of a continued commitment to evaluating their services and to assess the effectiveness of their service goals, the Department of Revenue collaborated with the Social and Economic Sciences Research Center (SESRC) at Washington State University (WSU) to create and implement periodic surveys of business taxpayers. The first survey was conducted in 1992 and follow-up surveys were conducted every three years up to 2007 to determine the degree to which the Department of Revenue had been effective in providing quality services to businesses. Due to the economic downturn, the survey was not conducted again until 2014. In spring of 2014 the Washington State Department of Revenue again collaborated with SESRC to conduct another survey for the purpose of assessing the degree to which businesses are satisfied with the quality of taxpayer services provided by the Department of Revenue. The survey was titled 2014 Washington State Department of Revenue Taxpayer Satisfaction Survey, and a stratified sample of 4013 businesses in Washington State or conducting business in the state were contacted. The study was conducted between May 2014 and July 2014 and an overall 28.5% response rate was obtained from the 4013 businesses that were in the sample.
6
2014 Taxpayer Satisfaction Survey SESRC Executive Summary 14-40
2. Summary of Key Findings
• Businesses were asked whether the person completing the questionnaire was also the person
who fills out the tax return (Q01). 91% of respondents said yes, that they were also the person filling out the return.
• The most common response to which best describes your position (Q02) was “Business Owner” at 54.1% followed by “Employee” at 20.4% and “CPA or other tax professional” at 11.5%.
General Satisfaction with Services
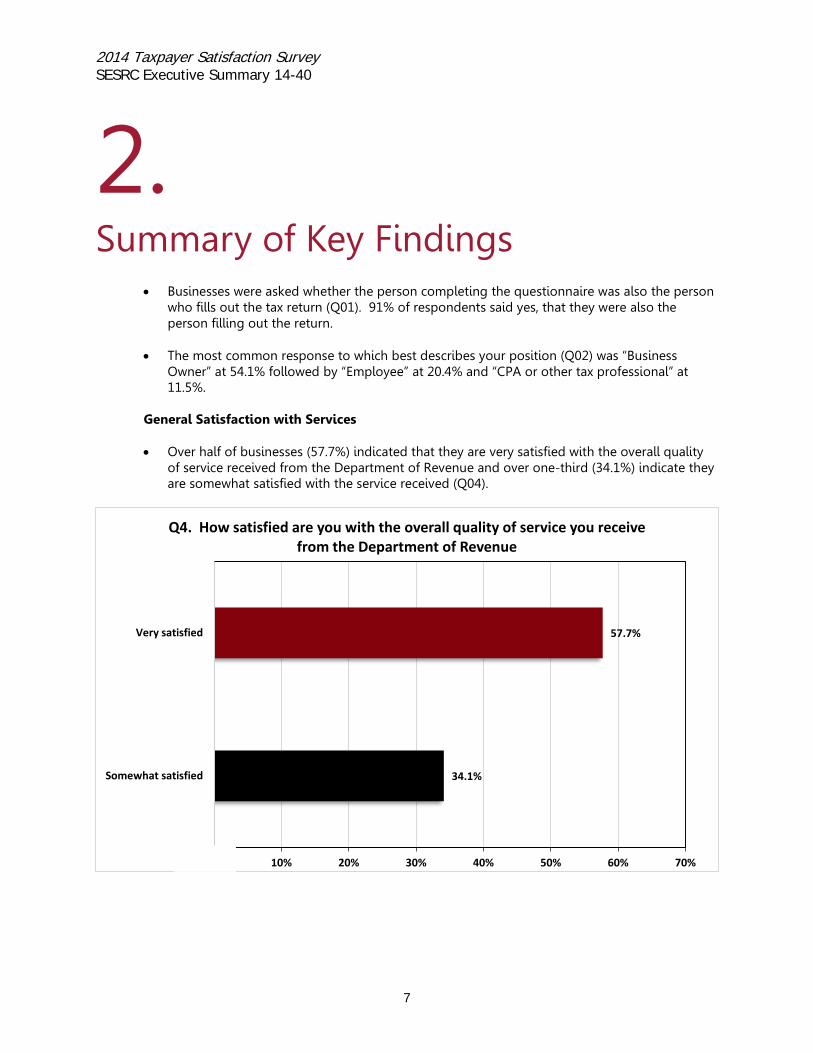
• Over half of businesses (57.7%) indicated that they are very satisfied with the overall quality of service received from the Department of Revenue and over one-third (34.1%) indicate they are somewhat satisfied with the service received (Q04).
34.1%
57.7%
0% 10% 20% 30% 40% 50% 60% 70%
Somewhat satisfied
Very satisfied
Q4. How satisfied are you with the overall quality of service you receive from the Department of Revenue
7
2014 Taxpayer Satisfaction Survey SESRC Executive Summary 14-40
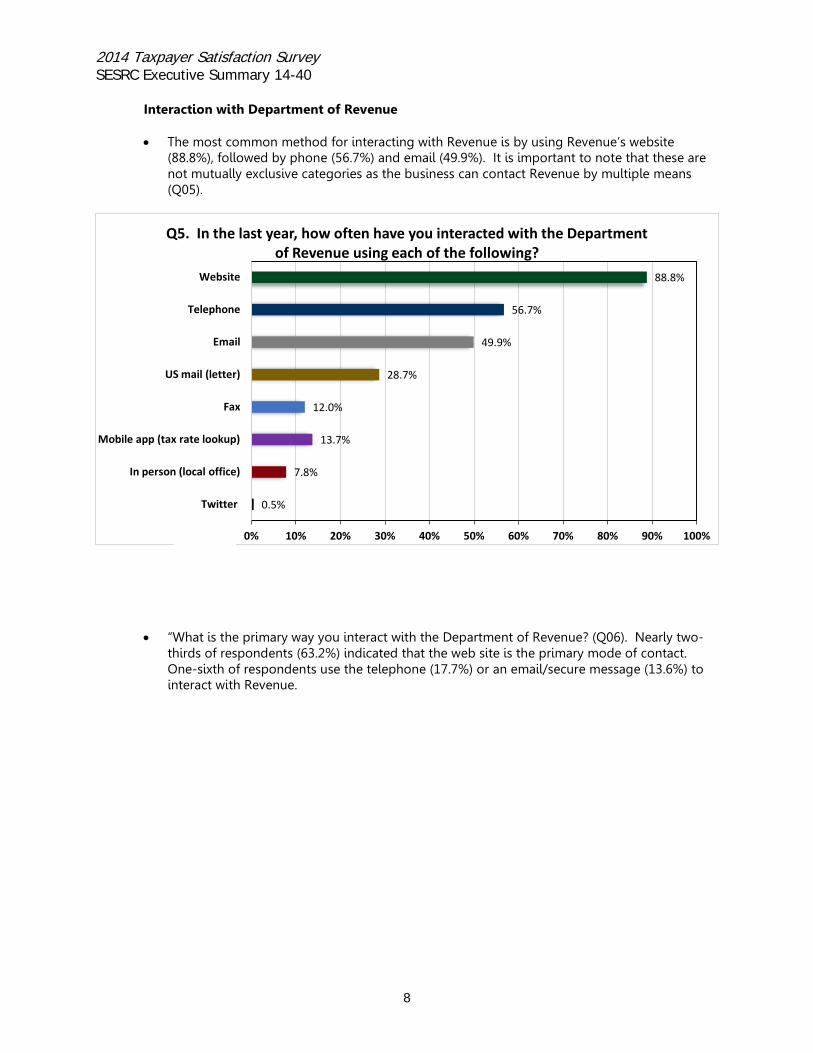
Interaction with Department of Revenue • The most common method for interacting with Revenue is by using Revenue’s website
(88.8%), followed by phone (56.7%) and email (49.9%). It is important to note that these are not mutually exclusive categories as the business can contact Revenue by multiple means (Q05).
• “What is the primary way you interact with the Department of Revenue? (Q06). Nearly two-
thirds of respondents (63.2%) indicated that the web site is the primary mode of contact. One-sixth of respondents use the telephone (17.7%) or an email/secure message (13.6%) to interact with Revenue.
0.5%
7.8%
13.7%
12.0%
28.7%
49.9%
56.7%
88.8%
0% 10% 20% 30% 40% 50% 60% 70% 80% 90% 100%
In person (local office)
Mobile app (tax rate lookup)
Fax
US mail (letter)
Telephone
Website
Q5. In the last year, how often have you interacted with the Department of Revenue using each of the following?
8
2014 Taxpayer Satisfaction Survey SESRC Executive Summary 14-40
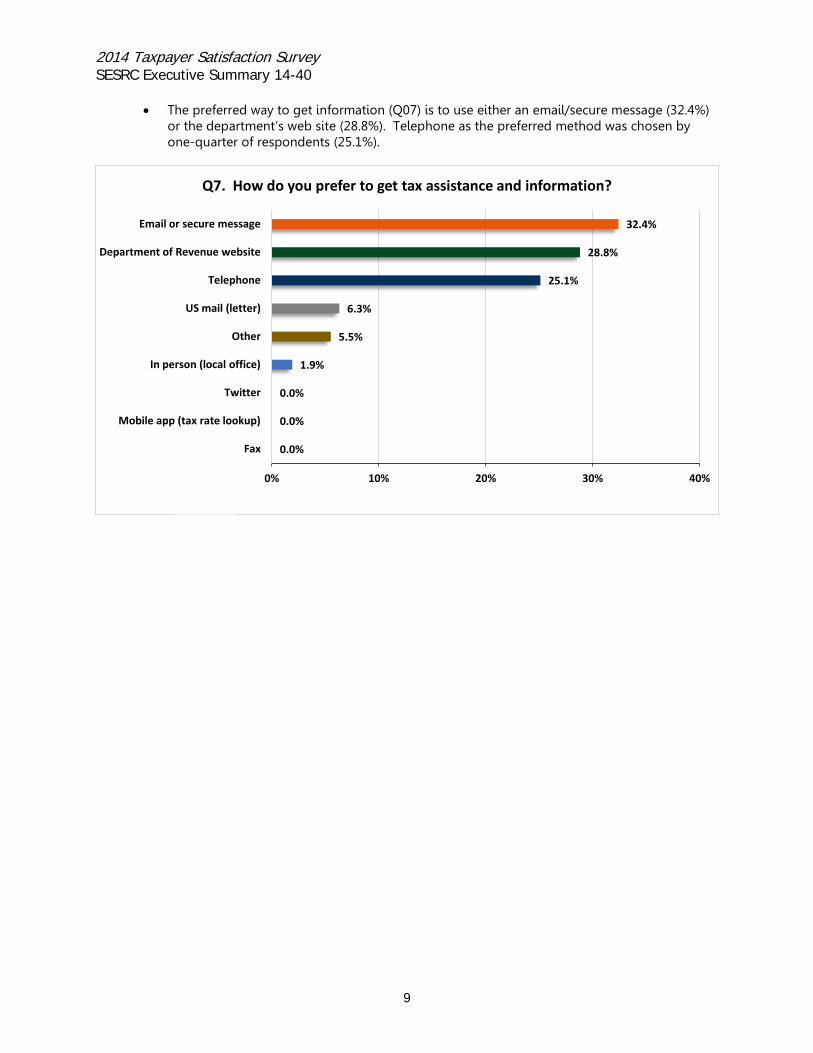
• The preferred way to get information (Q07) is to use either an email/secure message (32.4%) or the department’s web site (28.8%). Telephone as the preferred method was chosen by one-quarter of respondents (25.1%).
0.0%
0.0%
0.0%
1.9%
5.5%
6.3%
25.1%
28.8%
32.4%
0% 10% 20% 30% 40%
Fax
Mobile app (tax rate lookup)
In person (local office)
Other
US mail (letter)
Telephone
Department of Revenue website
Email or secure message
Q7. How do you prefer to get tax assistance and information?
9
2014 Taxpayer Satisfaction Survey SESRC Executive Summary 14-40 Call Center
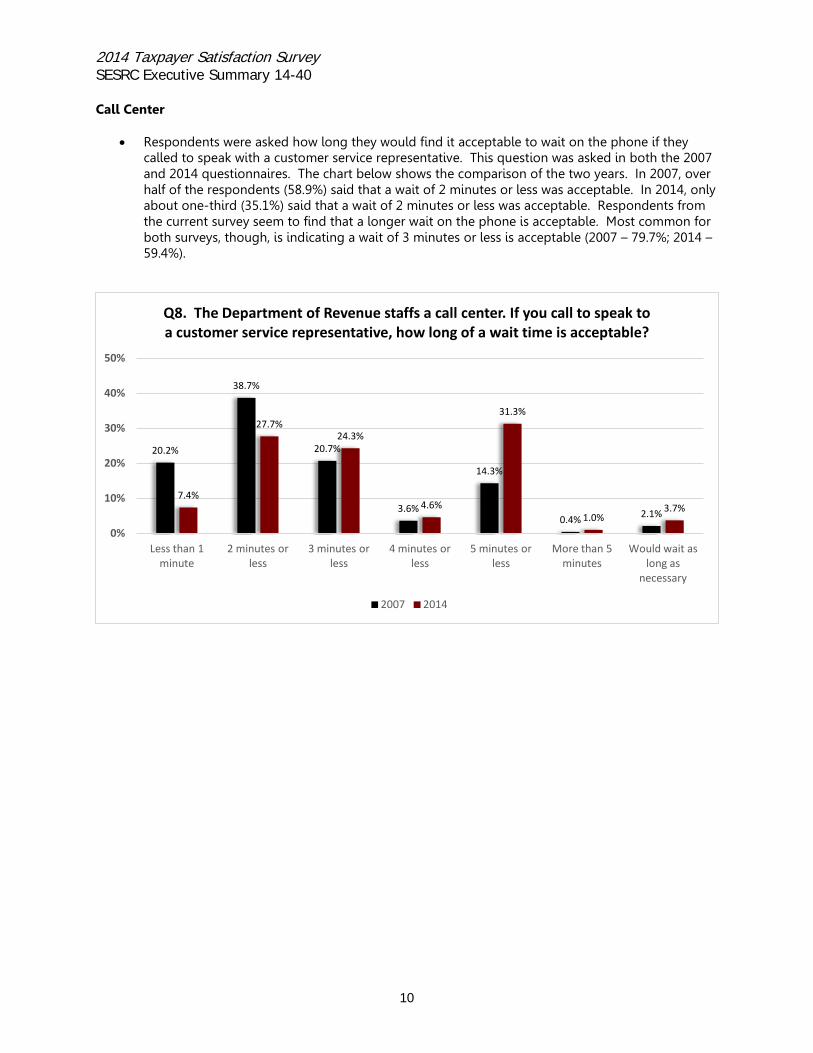
• Respondents were asked how long they would find it acceptable to wait on the phone if they called to speak with a customer service representative. This question was asked in both the 2007 and 2014 questionnaires. The chart below shows the comparison of the two years. In 2007, over half of the respondents (58.9%) said that a wait of 2 minutes or less was acceptable. In 2014, only about one-third (35.1%) said that a wait of 2 minutes or less was acceptable. Respondents from the current survey seem to find that a longer wait on the phone is acceptable. Most common for both surveys, though, is indicating a wait of 3 minutes or less is acceptable (2007 – 79.7%; 2014 – 59.4%).
20.2%
38.7%
20.7%
3.6%
14.3%
0.4% 2.1%
7.4%
27.7% 24.3%
4.6%
31.3%
1.0% 3.7%
0%
10%
20%
30%
40%
50%
Less than 1 minute
2 minutes or less
3 minutes or less
4 minutes or less
5 minutes or less
More than 5 minutes
Would wait as long as
necessary
Q8. The Department of Revenue staffs a call center. If you call to speak to a customer service representative, how long of a wait time is acceptable?
2007 2014
10
2014 Taxpayer Satisfaction Survey SESRC Executive Summary 14-40
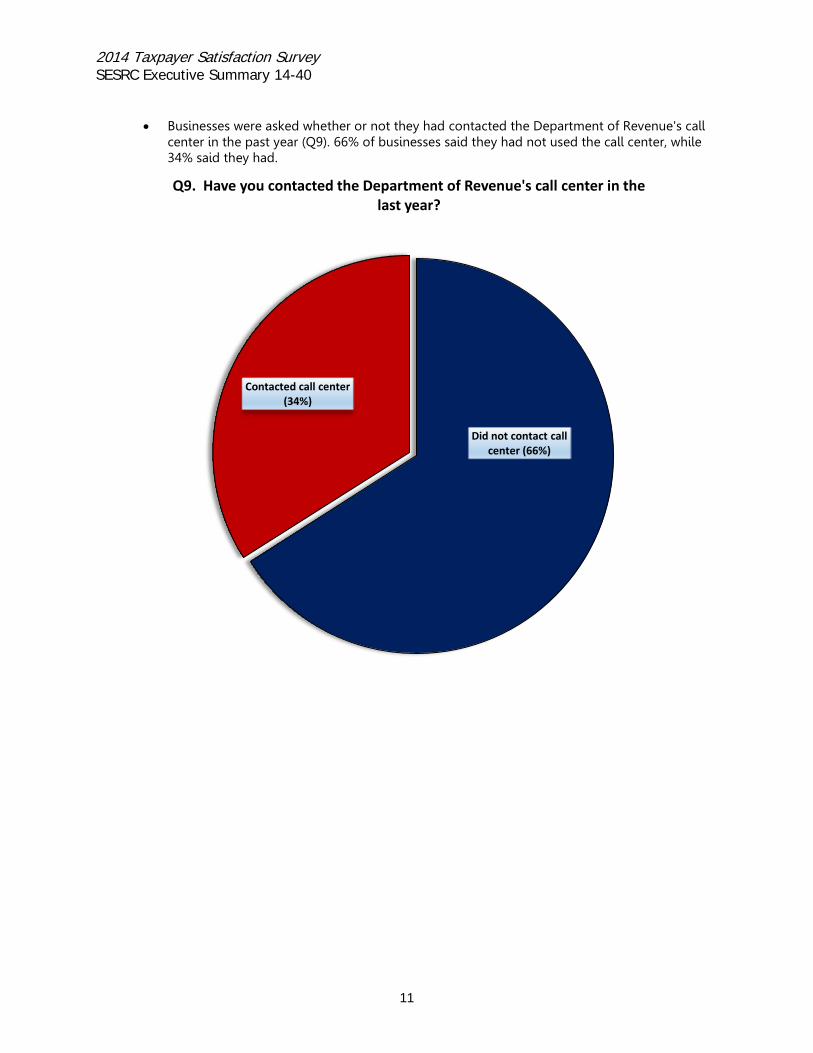
• Businesses were asked whether or not they had contacted the Department of Revenue's call center in the past year (Q9). 66% of businesses said they had not used the call center, while 34% said they had.
Did not contact call center (66%)
Contacted call center (34%)
Q9. Have you contacted the Department of Revenue's call center in the last year?
11
2014 Taxpayer Satisfaction Survey SESRC Executive Summary 14-40
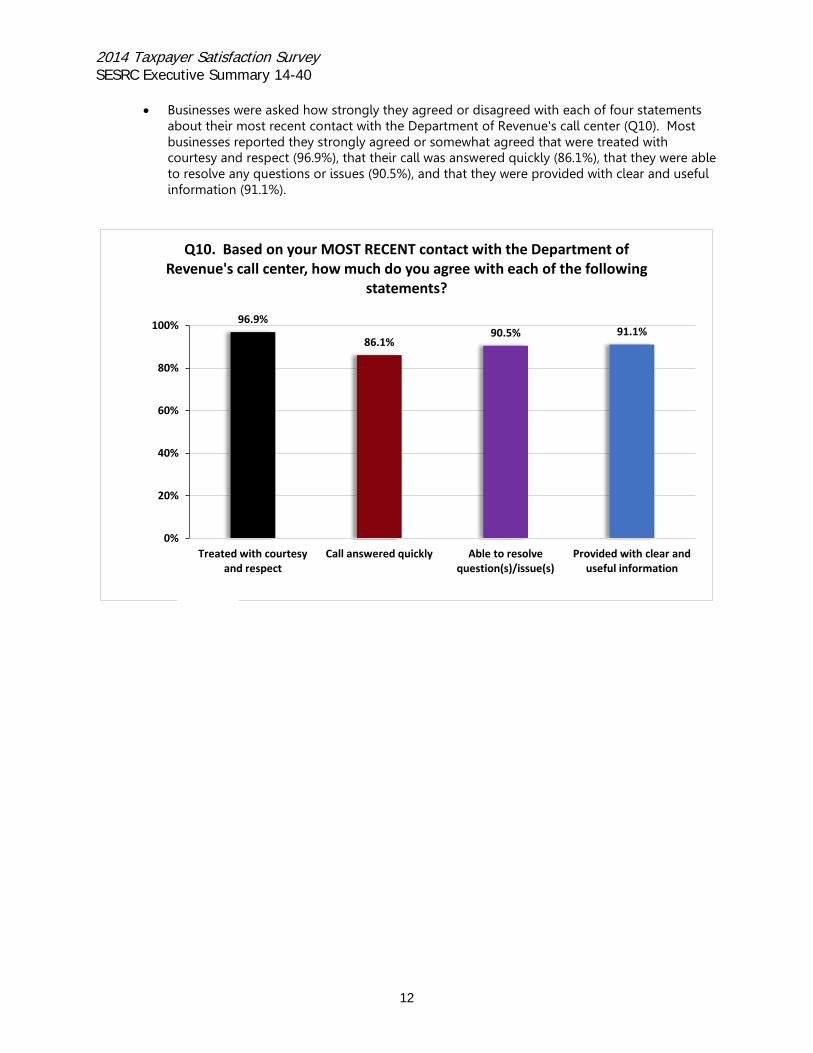
• Businesses were asked how strongly they agreed or disagreed with each of four statements about their most recent contact with the Department of Revenue's call center (Q10). Most businesses reported they strongly agreed or somewhat agreed that were treated with courtesy and respect (96.9%), that their call was answered quickly (86.1%), that they were able to resolve any questions or issues (90.5%), and that they were provided with clear and useful information (91.1%).
96.9%
86.1% 90.5% 91.1%
0%
20%
40%
60%
80%
100%
Treated with courtesy and respect
Call answered quickly Able to resolve question(s)/issue(s)
Provided with clear and useful information
Q10. Based on your MOST RECENT contact with the Department of Revenue's call center, how much do you agree with each of the following
statements?
12
2014 Taxpayer Satisfaction Survey SESRC Executive Summary 14-40 Website
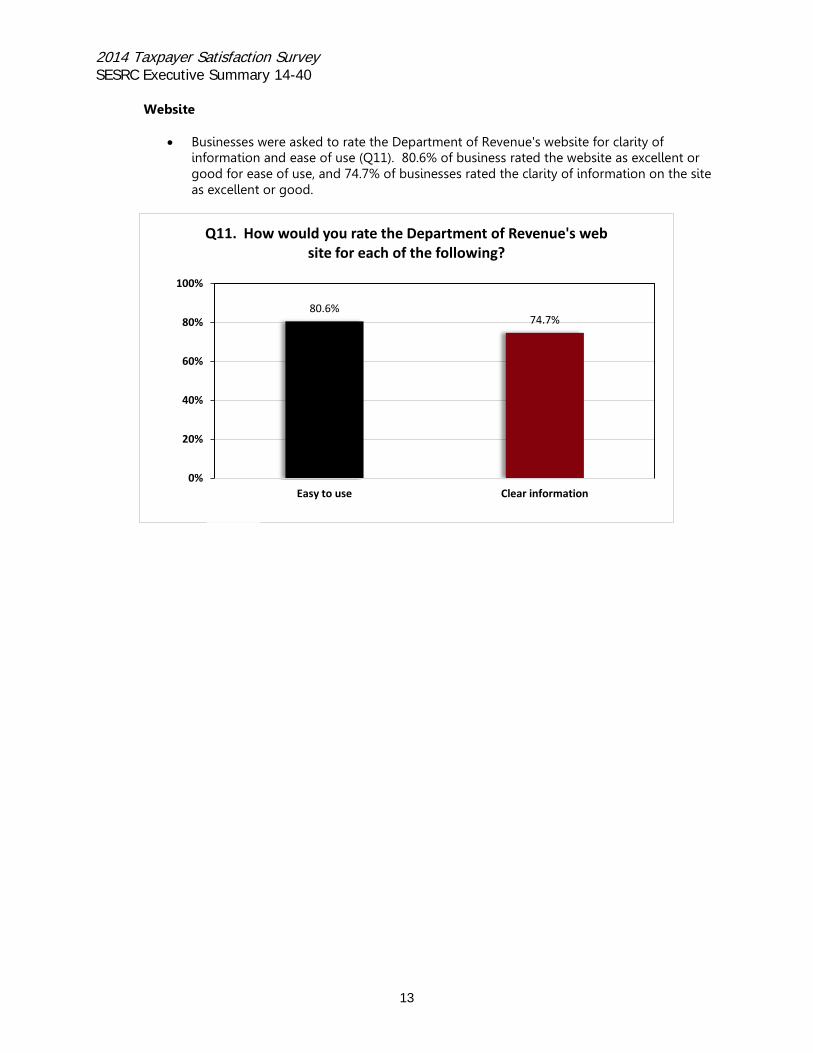
• Businesses were asked to rate the Department of Revenue's website for clarity of
information and ease of use (Q11). 80.6% of business rated the website as excellent or good for ease of use, and 74.7% of businesses rated the clarity of information on the site as excellent or good.
80.6% 74.7%
0%
20%
40%
60%
80%
100%
Easy to use Clear information
Q11. How would you rate the Department of Revenue's web site for each of the following?
13
2014 Taxpayer Satisfaction Survey SESRC Executive Summary 14-40
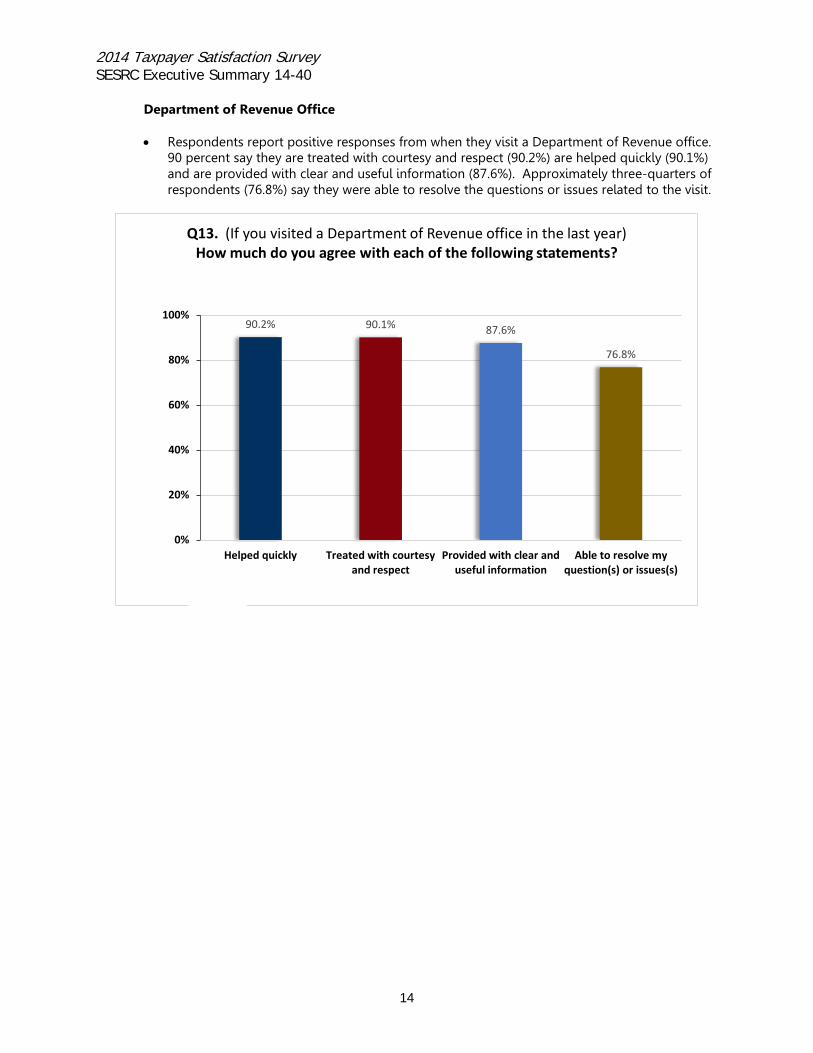
Department of Revenue Office • Respondents report positive responses from when they visit a Department of Revenue office.
90 percent say they are treated with courtesy and respect (90.2%) are helped quickly (90.1%) and are provided with clear and useful information (87.6%). Approximately three-quarters of respondents (76.8%) say they were able to resolve the questions or issues related to the visit.
90.2% 90.1% 87.6%
76.8%
0%
20%
40%
60%
80%
100%
Helped quickly Treated with courtesy and respect
Provided with clear and useful information
Able to resolve my question(s) or issues(s)
Q13. (If you visited a Department of Revenue office in the last year) How much do you agree with each of the following statements?
14
2014 Taxpayer Satisfaction Survey SESRC Executive Summary 14-40
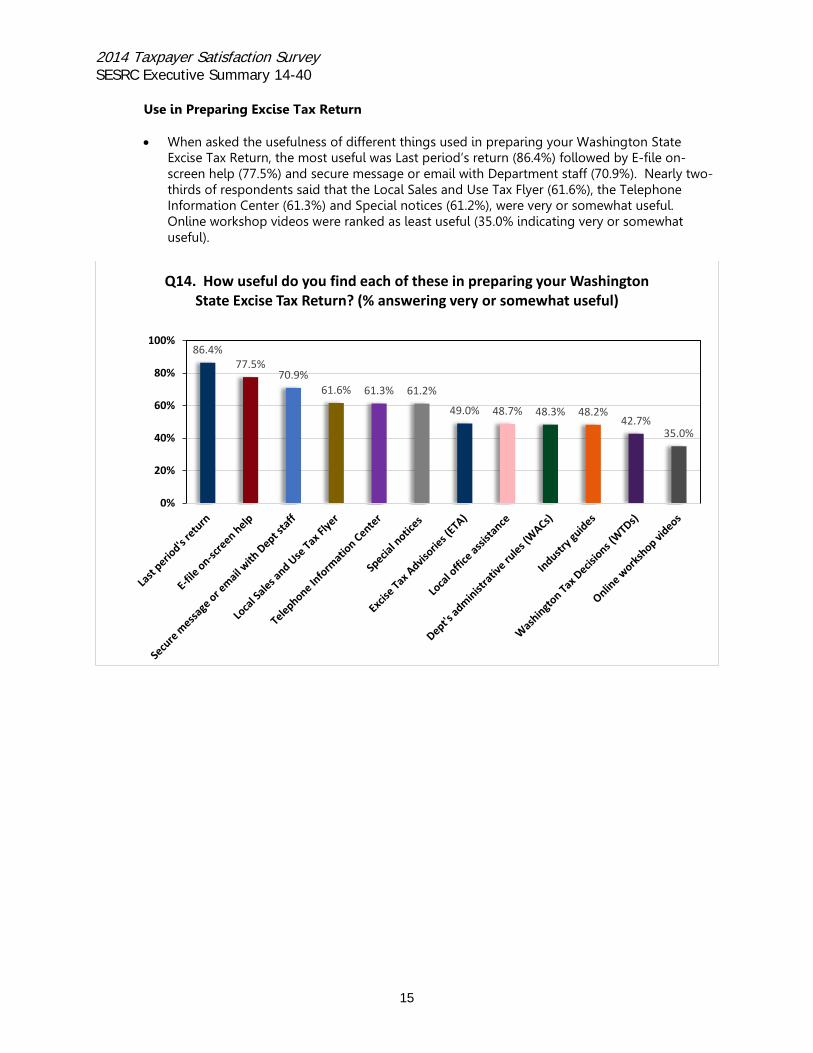
Use in Preparing Excise Tax Return • When asked the usefulness of different things used in preparing your Washington State
Excise Tax Return, the most useful was Last period’s return (86.4%) followed by E-file on-screen help (77.5%) and secure message or email with Department staff (70.9%). Nearly two-thirds of respondents said that the Local Sales and Use Tax Flyer (61.6%), the Telephone Information Center (61.3%) and Special notices (61.2%), were very or somewhat useful. Online workshop videos were ranked as least useful (35.0% indicating very or somewhat useful).
86.4% 77.5%
70.9% 61.6% 61.3% 61.2%
49.0% 48.7% 48.3% 48.2% 42.7%
35.0%
0%
20%
40%
60%
80%
100%
Q14. How useful do you find each of these in preparing your Washington State Excise Tax Return? (% answering very or somewhat useful)
15
2014 Taxpayer Satisfaction Survey SESRC Executive Summary 14-40
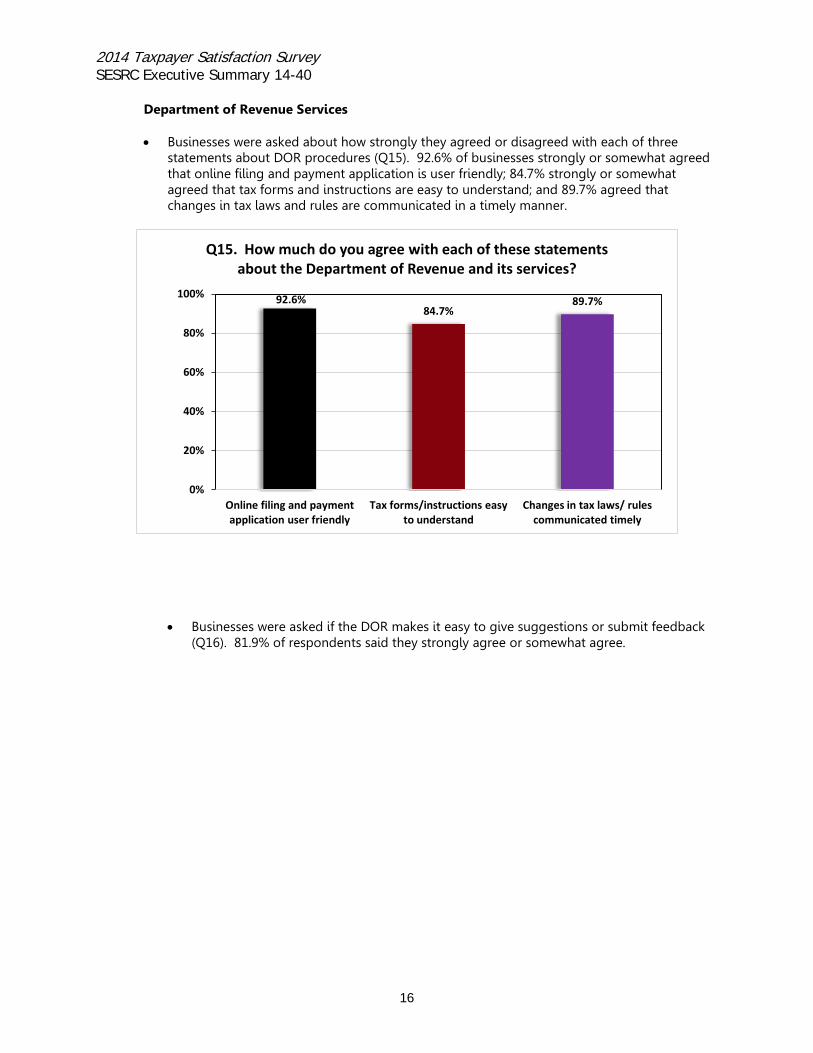
Department of Revenue Services • Businesses were asked about how strongly they agreed or disagreed with each of three
statements about DOR procedures (Q15). 92.6% of businesses strongly or somewhat agreed that online filing and payment application is user friendly; 84.7% strongly or somewhat agreed that tax forms and instructions are easy to understand; and 89.7% agreed that changes in tax laws and rules are communicated in a timely manner.
• Businesses were asked if the DOR makes it easy to give suggestions or submit feedback (Q16). 81.9% of respondents said they strongly agree or somewhat agree.
92.6% 84.7%
89.7%
0%
20%
40%
60%
80%
100%
Online filing and payment application user friendly
Tax forms/instructions easy to understand
Changes in tax laws/ rules communicated timely
Q15. How much do you agree with each of these statements about the Department of Revenue and its services?
16
2014 Taxpayer Satisfaction Survey SESRC Executive Summary 14-40
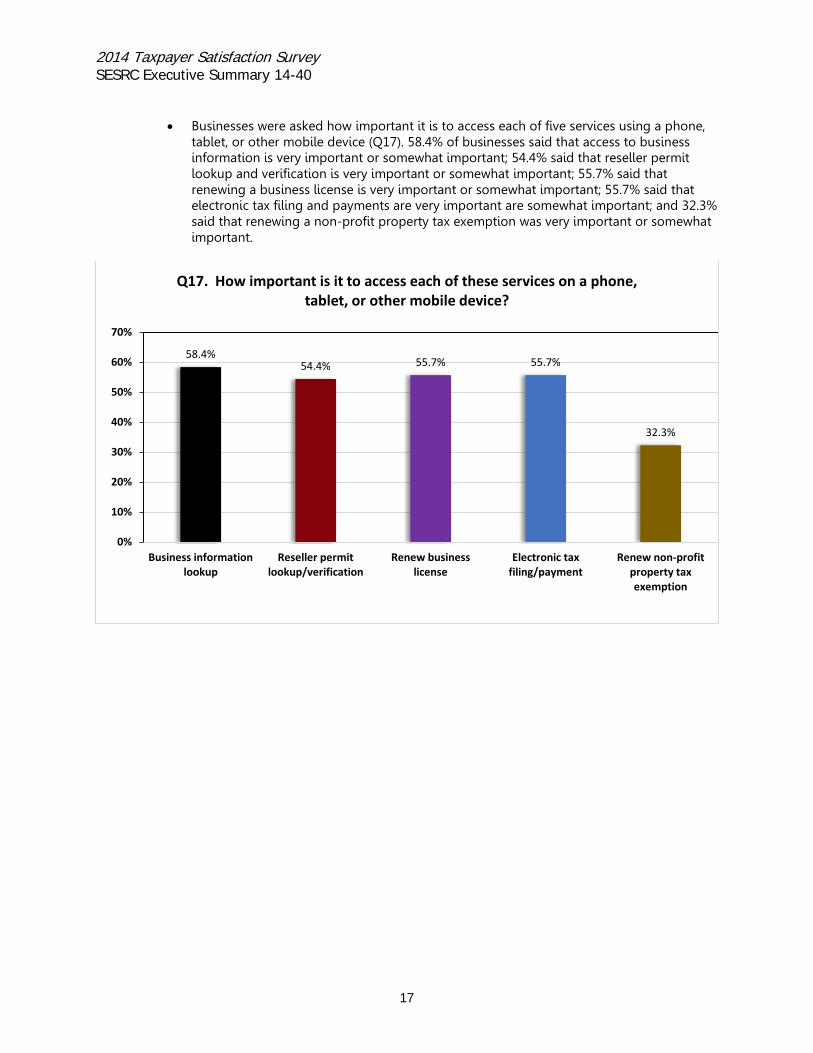
• Businesses were asked how important it is to access each of five services using a phone,
tablet, or other mobile device (Q17). 58.4% of businesses said that access to business information is very important or somewhat important; 54.4% said that reseller permit lookup and verification is very important or somewhat important; 55.7% said that renewing a business license is very important or somewhat important; 55.7% said that electronic tax filing and payments are very important are somewhat important; and 32.3% said that renewing a non-profit property tax exemption was very important or somewhat important.
58.4% 54.4% 55.7% 55.7%
32.3%
0%
10%
20%
30%
40%
50%
60%
70%
Business information lookup
Reseller permit lookup/verification
Renew business license
Electronic tax filing/payment
Renew non-profit property tax exemption
Q17. How important is it to access each of these services on a phone, tablet, or other mobile device?
17
2014 Taxpayer Satisfaction Survey SESRC Executive Summary 14-40
18
2014 Taxpayer Satisfaction Survey SESRC Executive Summary 14-40
19
2014 Taxpayer Satisfaction Survey SESRC Executive Summary 14-40
20
2014 Taxpayer Satisfaction Survey SESRC Executive Summary 14-40
3. Methodology
From May through July 2014, the Social and Economic Sciences Research Center (SESRC) implemented a mail and web-based survey for the Washington State Department of Revenue (DOR). The purpose of the survey is to ask about the services provided by DOR and where improvements could be made.
This report details the process of collecting the survey data.
The sample for this study consists of businesses who are registered with the Washington State Department of Revenue. The sample included both large and small businesses; east, west, or out of state businesses; and businesses in different sectors of the economy. The final sample was drawn by DOR and provided to SESRC. It contains 4013 records.
The sample consisted of a stratified random sample of selected businesses in Washington State or doing business in the state. Revenue provided the list of businesses to contact to SESRC for this project. The population was stratified by eight categories derived from the eleven general categories of the North American Industry Classification System (NAICS) listed in the Standard Industrial Classification Manual. Additionally, each NAICS class was stratified according to whether the business had been identified as being a large or a small business Revenue. The final sample consisted of 4013 businesses. Business size was determined by the Department of Revenue using the amount of Gross Business Income (GBI) reported by the business in relation to one-half the total GBI of all the businesses included in each NAICS class. This was accomplished in the following manner. First, a total GBI was calculated for all of the businesses in each of the eight NAICS classes and then each total was divided in half. Next, all businesses in each NAICS class were ranked according to the amount of GBI reported, with the business having the lowest amount of GBI ranked first and the business having the highest amount of GBI ranked last. Then, businesses
Sample
Background and Objectives
21
2014 Taxpayer Satisfaction Survey SESRC Executive Summary 14-40
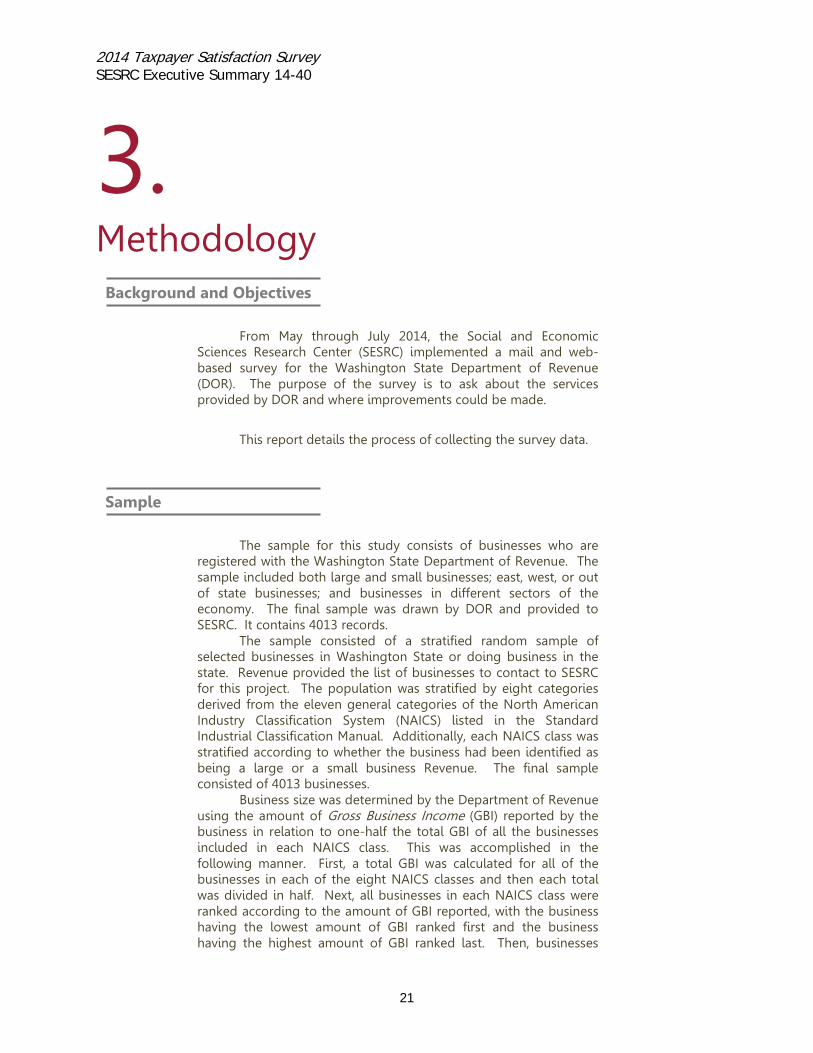
were included in the small business strata, starting with the business having the lowest amount of GBI until the total amount of GBI equaled one-half of the total GBI for all businesses in that NAICS class. The remaining businesses in that NAICS class constituted the large business strata. Finally, each NAICS class was further stratified geographically, according to whether the business was located in Eastern or Western Washington or out of state.
Table 1. Number and Percent of Businesses in Each Strata of the Population and Sample
Population Sample
Category titles Business
size Geographic
location number percent number percent
Construction
Small East 7,413 2.35% 104 2.59%
Small West 28,401 8.99% 103 2.57%
Small OOSt 4,141 1.31% 109 2.72%
Large East 47 0.01% 46 1.15%
Large West 275 0.09% 159 3.96%
Large OOSt 99 0.03% 93 2.32%
subtotals 40,376 12.78% 614 15.30%
Manufacturing
Small East 2,212 0.70% 103 2.57%
Small West 8,390 2.65% 109 2.72%
Small OOSt 2,312 0.73% 108 2.69%
Large East 20 0.01% 20 0.50%
Large West 76 0.02% 70 1.74%
Large OOSt 40 0.01% 35 0.87%
subtotals 13,050 4.13% 445 11.09%
Transportation /Warehouse/
Utilities
Small East 2,208 0.70% 105 2.62%
Small West 7,287 2.31% 108 2.69%
Small OOSt 963 0.30% 104 2.59%
Large East 15 0.00% 13 0.32%
Large West 44 0.01% 39 0.97%
Large OOSt 11 0.00% 10 0.25%
subtotals 10,528 3.33% 379 9.44%
Wholesale trade
Small East 1,752 0.55% 103 2.57%
Small West 8,170 2.59% 107 2.67%
Small OOSt 10,261 3.25% 103 2.57%
Large East 9 0.00% 9 0.22%
Large West 79 0.02% 75 1.87%
Large OOSt 149 0.05% 103 2.57%
subtotals 20,420 6.46% 500 12.46%
Retail trade Small East 8,707 2.76% 103 2.57%
22
2014 Taxpayer Satisfaction Survey SESRC Executive Summary 14-40
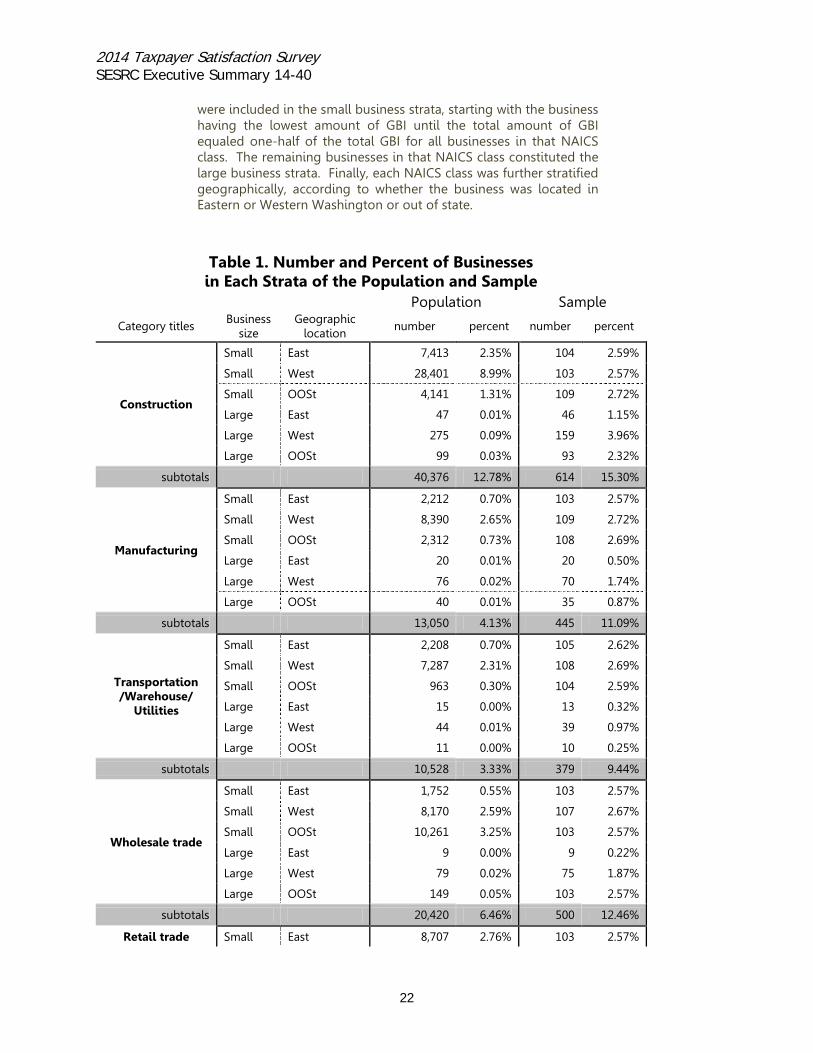
Table 1. Number and Percent of Businesses in Each Strata of the Population and Sample
Small West 33,865 10.72% 120 2.99%
Small OOSt 6,819 2.16% 103 2.57%
Large East 23 0.01% 23 0.57%
Large West 135 0.04% 118 2.94%
Large OOSt 140 0.04% 103 2.57%
subtotals 49,689 15.72% 570 14.20%
Financial, Insurance,
and Real Estate
Small East 2,563 0.81% 103 2.57%
Small West 11,276 3.57% 104 2.59%
Small OOSt 3,120 0.99% 118 2.94%
Large East 5 0.00% 5 0.12%
Large West 17 0.01% 16 0.40%
Large OOSt 58 0.02% 43 1.07%
subtotals 17,039 5.39% 389 9.69%
Prof/Science/ Tech/Info Service
Small East 6,844 2.17% 103 2.57%
Small West 43,639 13.81% 109 2.72%
Small OOSt 7,407 2.34% 103 2.57%
Large East 4 0.00% 4 0.10%
Large West 82 0.03% 76 1.89%
Large OOSt 131 0.04% 103 2.57%
subtotals 58,107 18.39% 498 12.41%
All Other Services
Small East 18,222 5.77% 107 2.67%
Small West 81,174 25.68% 103 2.57%
Small OOSt 6,776 2.14% 103 2.57%
Large East 70 0.02% 66 1.64%
Large West 331 0.10% 136 3.39%
Large OOSt 256 0.08% 103 2.57%
subtotals 106,829 33.80% 618 15.40%
Totals
316,038
4013
The Social & Economic Sciences Research Center worked together with the client to develop the survey instrument. The final questionnaire had 18 questions and 52 variables. It asked questions on overall satisfaction with DOR, number and types of interaction with DOR, the usefulness of the web site and importance of access using a different mobile devices. Four of the questions were open-ended, asking the respondent to provide a response in the space
Design
23
2014 Taxpayer Satisfaction Survey SESRC Executive Summary 14-40
provided. The questionnaire was designed to be administered by web or paper. The layout of each question was designed using TDM (Tailored Design Method) protocols for maximizing respondent comprehension and ease of navigation through the questions.
Each respondent in the email group was sent up to four email requests and one paper request to complete the questionnaire. Respondents without an email address were sent up to two paper questionnaires. Each mailing described the purpose of the evaluation, gave the URL of the evaluation website and the participant’s unique access code used to log in to the evaluation form. All emails were sent from SESRC. The four different email requests were sent on different days of the week and different times of the day in the hopes of reaching respondents at their most convenient time.
Data Collection
24
2014 Taxpayer Satisfaction Survey SESRC Executive Summary 14-40
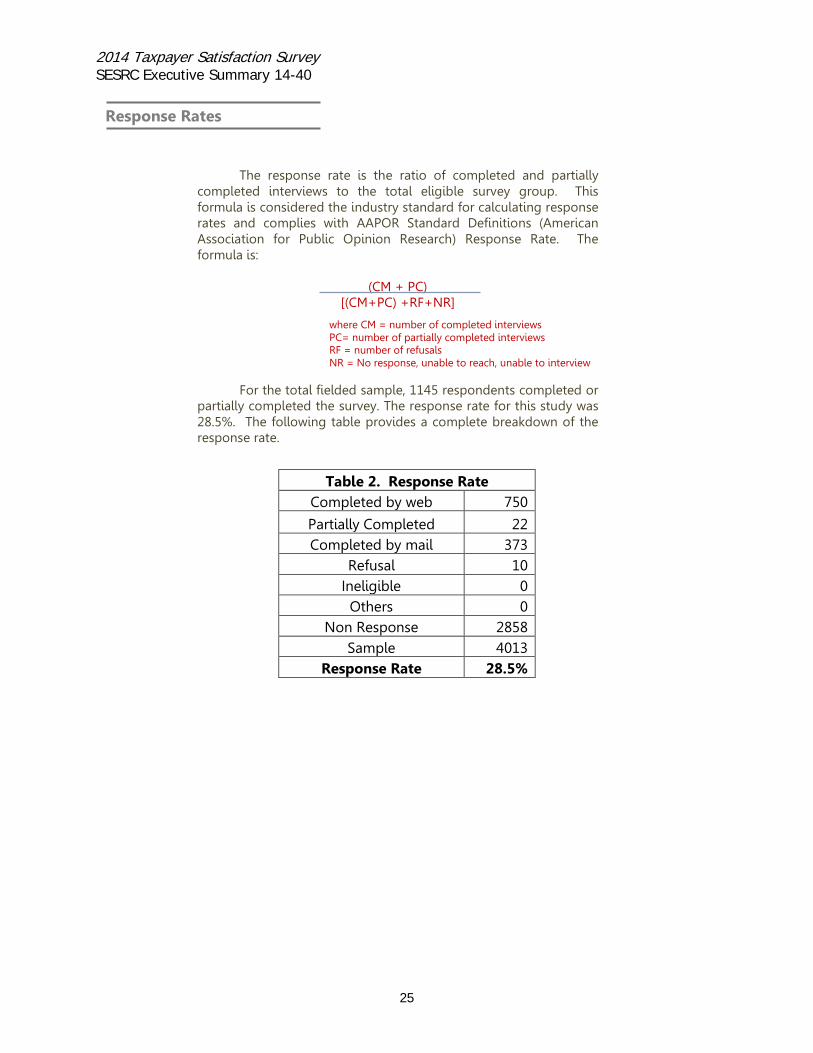
The response rate is the ratio of completed and partially
completed interviews to the total eligible survey group. This formula is considered the industry standard for calculating response rates and complies with AAPOR Standard Definitions (American Association for Public Opinion Research) Response Rate. The formula is:
(CM + PC)
[(CM+PC) +RF+NR]
where CM = number of completed interviews PC= number of partially completed interviews RF = number of refusals NR = No response, unable to reach, unable to interview
For the total fielded sample, 1145 respondents completed or partially completed the survey. The response rate for this study was 28.5%. The following table provides a complete breakdown of the response rate.
Table 2. Response Rate Completed by web 750
Partially Completed 22 Completed by mail 373
Refusal 10 Ineligible 0
Others 0 Non Response 2858
Sample 4013 Response Rate 28.5%
Response Rates
25
2014 Taxpayer Satisfaction Survey SESRC Executive Summary 14-40
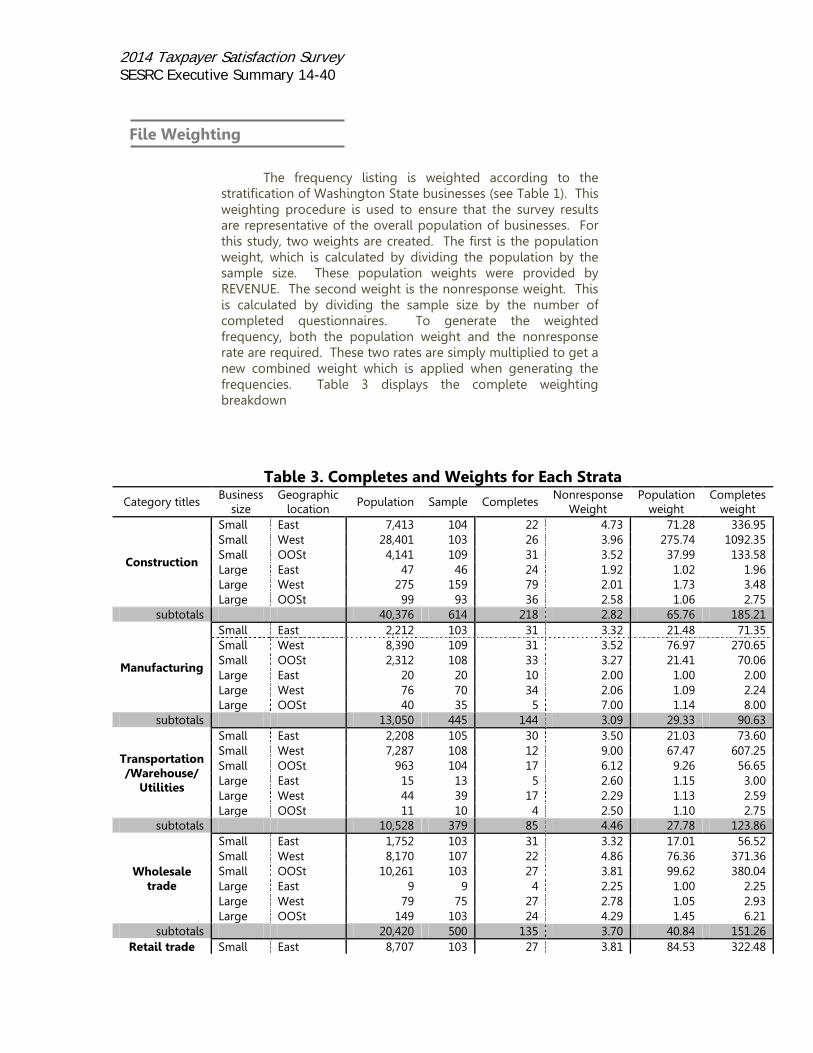
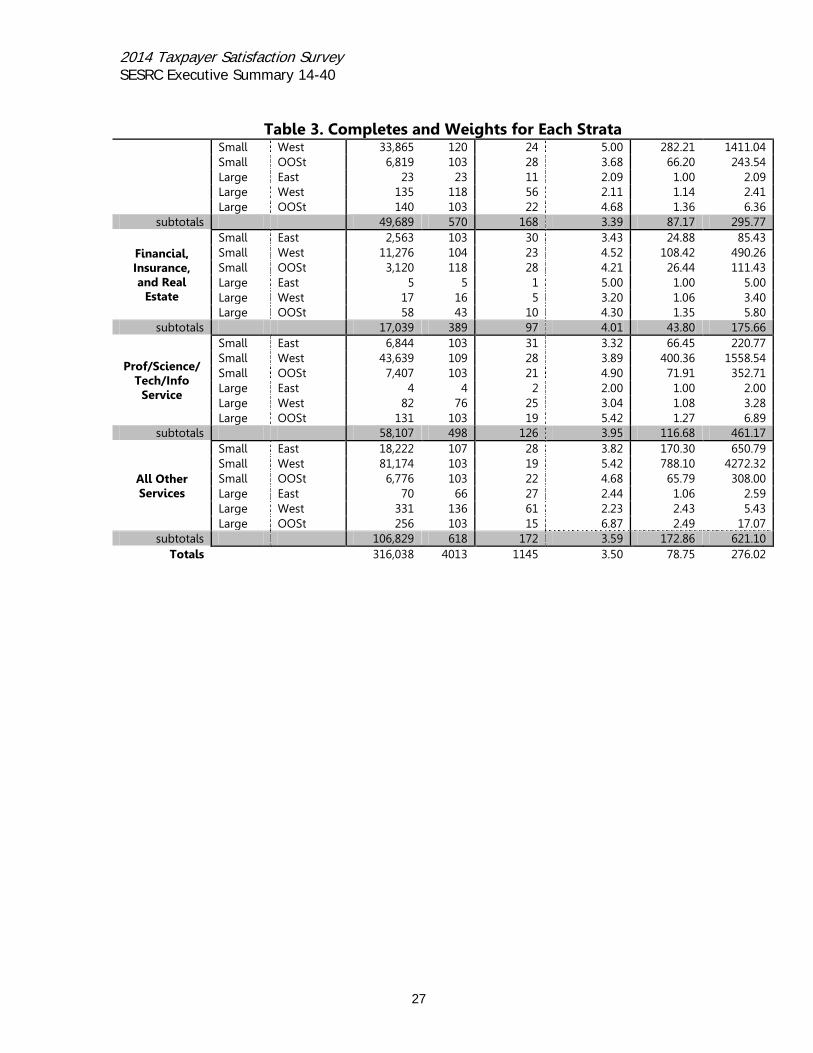
The frequency listing is weighted according to the stratification of Washington State businesses (see Table 1). This weighting procedure is used to ensure that the survey results are representative of the overall population of businesses. For this study, two weights are created. The first is the population weight, which is calculated by dividing the population by the sample size. These population weights were provided by REVENUE. The second weight is the nonresponse weight. This is calculated by dividing the sample size by the number of completed questionnaires. To generate the weighted frequency, both the population weight and the nonresponse rate are required. These two rates are simply multiplied to get a new combined weight which is applied when generating the frequencies. Table 3 displays the complete weighting breakdown
Table 3. Completes and Weights for Each Strata
Category titles Business
size Geographic
location Population Sample Completes
Nonresponse Weight
Population weight
Completes weight
Construction
Small East 7,413 104 22 4.73 71.28 336.95 Small West 28,401 103 26 3.96 275.74 1092.35 Small OOSt 4,141 109 31 3.52 37.99 133.58 Large East 47 46 24 1.92 1.02 1.96 Large West 275 159 79 2.01 1.73 3.48 Large OOSt 99 93 36 2.58 1.06 2.75
subtotals 40,376 614 218 2.82 65.76 185.21
Manufacturing
Small East 2,212 103 31 3.32 21.48 71.35 Small West 8,390 109 31 3.52 76.97 270.65 Small OOSt 2,312 108 33 3.27 21.41 70.06 Large East 20 20 10 2.00 1.00 2.00 Large West 76 70 34 2.06 1.09 2.24 Large OOSt 40 35 5 7.00 1.14 8.00
subtotals 13,050 445 144 3.09 29.33 90.63
Transportation /Warehouse/
Utilities
Small East 2,208 105 30 3.50 21.03 73.60 Small West 7,287 108 12 9.00 67.47 607.25 Small OOSt 963 104 17 6.12 9.26 56.65 Large East 15 13 5 2.60 1.15 3.00 Large West 44 39 17 2.29 1.13 2.59 Large OOSt 11 10 4 2.50 1.10 2.75
subtotals 10,528 379 85 4.46 27.78 123.86
Wholesale trade
Small East 1,752 103 31 3.32 17.01 56.52 Small West 8,170 107 22 4.86 76.36 371.36 Small OOSt 10,261 103 27 3.81 99.62 380.04 Large East 9 9 4 2.25 1.00 2.25 Large West 79 75 27 2.78 1.05 2.93 Large OOSt 149 103 24 4.29 1.45 6.21
subtotals 20,420 500 135 3.70 40.84 151.26 Retail trade Small East 8,707 103 27 3.81 84.53 322.48
File Weighting
2014 Taxpayer Satisfaction Survey SESRC Executive Summary 14-40
Table 3. Completes and Weights for Each Strata Small West 33,865 120 24 5.00 282.21 1411.04 Small OOSt 6,819 103 28 3.68 66.20 243.54 Large East 23 23 11 2.09 1.00 2.09 Large West 135 118 56 2.11 1.14 2.41 Large OOSt 140 103 22 4.68 1.36 6.36
subtotals 49,689 570 168 3.39 87.17 295.77
Financial, Insurance, and Real
Estate
Small East 2,563 103 30 3.43 24.88 85.43 Small West 11,276 104 23 4.52 108.42 490.26 Small OOSt 3,120 118 28 4.21 26.44 111.43 Large East 5 5 1 5.00 1.00 5.00 Large West 17 16 5 3.20 1.06 3.40 Large OOSt 58 43 10 4.30 1.35 5.80
subtotals 17,039 389 97 4.01 43.80 175.66
Prof/Science/ Tech/Info
Service
Small East 6,844 103 31 3.32 66.45 220.77 Small West 43,639 109 28 3.89 400.36 1558.54 Small OOSt 7,407 103 21 4.90 71.91 352.71 Large East 4 4 2 2.00 1.00 2.00 Large West 82 76 25 3.04 1.08 3.28 Large OOSt 131 103 19 5.42 1.27 6.89
subtotals 58,107 498 126 3.95 116.68 461.17
All Other Services
Small East 18,222 107 28 3.82 170.30 650.79 Small West 81,174 103 19 5.42 788.10 4272.32 Small OOSt 6,776 103 22 4.68 65.79 308.00 Large East 70 66 27 2.44 1.06 2.59 Large West 331 136 61 2.23 2.43 5.43 Large OOSt 256 103 15 6.87 2.49 17.07
subtotals 106,829 618 172 3.59 172.86 621.10 Totals
316,038 4013 1145 3.50 78.75 276.02
27
2014 Taxpayer Satisfaction Survey SESRC Executive Summary 14-40
4. Conclusion
The survey was designed and implemented in much the same way as it has
been several times during the past fifteen years. We have consistently followed the
survey procedures as described in Don Dillman’s Total Design Method book to obtain
high response rates. This includes personalization of all mailings to business
respondents, multiple contacts, an initial email to all businesses that have an email
address included in the sample, an initial mailing to businesses without an email
address (with a business reply return envelope), email reminder and follow-up
contacts, and a second questionnaire mailing to non-respondents, again with a
business reply return envelope. We are thankful to all of those businesses that
participated in this survey and took the time to respond candidly to the questions in
the survey.
The survey results presented in this report represent only an overview of the
survey data. There is much more analysis that could be done with these data, for
example, describing results by industry group, by geographic region, or by size of
businesses.
We are pleased to have been involved in this very significant research effort,
and would like to thank the Department of Revenue, its Director, and its staff for
giving us the opportunity to collaborate on this research project.