Embed Size (px)
Citation preview

2014 SummerWeather Outlook
Temperatures, Precipitation,
Drought, and Hurricanes

Introduction
Today’s weather outlook is intended to offer a preliminary look at the summer temperature and precipitation potential. We’ll learn how this may impact the current drought in Texas. And we’ll see if the hurricane season can offer any assistance.

Objectives
At the completion of this course of instruction you will:
Identify the summer month, which has experienced above normal temperatures each of the past six years.
Recognize which major city is most likely to experience above normal temperatures this coming summer, and which is most likely to experience below normal
Be able to identify the historical year that is being applied as the primary historical match (analog) for the summer of 2014.
Be able to identify the driest summer on record for Texas as a whole. Recognize the total combined number of tropical storms and hurricanes (named
storms) expected in the Gulf of Mexico in 2014.

Precipitation:Winter 2010-11
Precipitation:Winter 2013-14
Precipitation:Spring 2011
Precipitation:Spring 2014
Repeat of 2011?

Temperature:Spring 2011
Temperature:Spring 2014
Repeat of 2011?
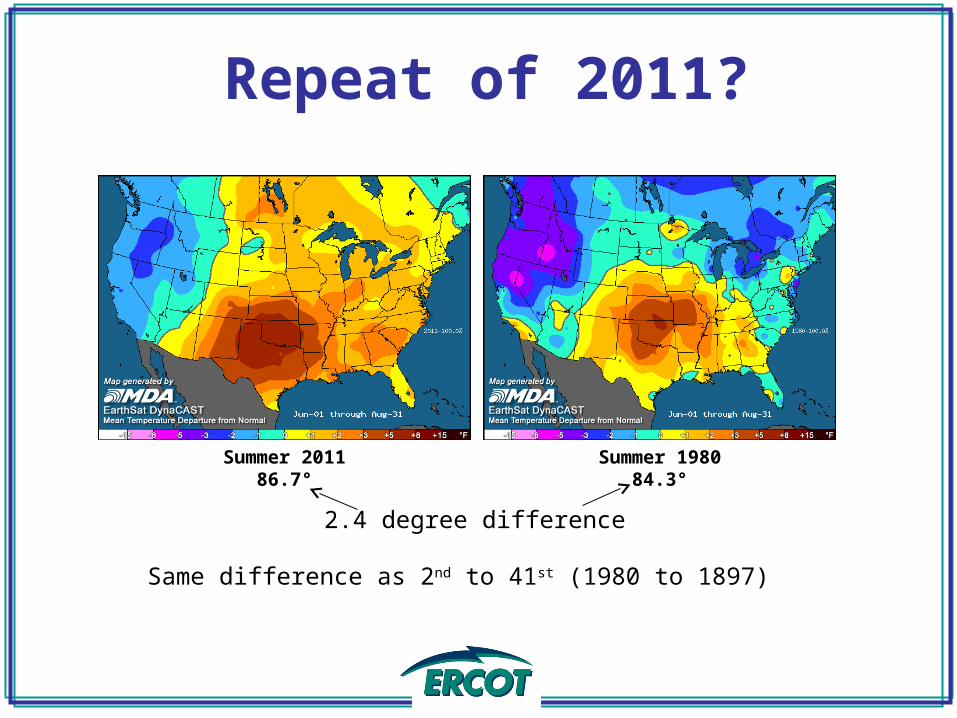
Summer 201186.7°
Summer 198084.3°
Repeat of 2011?
Same difference as 2nd to 41st (1980 to 1897)
2.4 degree difference

Number of 100-degree Days for Select Texas Cities
-- Wichita Falls: 100 days (1980) -- San Angelo: 98 days (60 days in 1969) -- Waco: 87 days (63 days in 1980) -- Houston: 46 days (32 in 1980) -- Austin (Mabry): 90 days (69 days in 1925) -- Abilene: 80 days (46 days in 1934) -- Dallas: 71 days (69 days in 1980)
ERCOTRecord Peak: 68,305MWAugust 3, 2011

Past Six Summers
2013: 24th hottest, 81.1° 2012: 15th hottest, 81.4° 2010: 13th hottest, 81.6° 2009: 40th hottest, 80.7°
(POR 1895-current, Jun-Sep; all of Texas)
2011: 1st hottest, 84.5° 2008: 82th hottest, 79.6°

Past Six Summers
2013: 71st driest, 11.44” 2012: 49th driest, 10.28” 2010: 104th driest, 13.98” 2009: 67th driest, 11.14”
(POR 1895-current, Jun-Sep; all of Texas)
2011: 1st driest, 3.65”2008: 80th driest, 12.02”

TEMPERATURE OUTLOOKSummer 2014

Building the Forecast1. Winter temperature and precipitation patterns2. Winter upper level steering currents3. Winter sea surface temperature pattern4. El Niño Southern Oscillation (ENSO)5. PDO, AMO, PNA, WPO, EPO6. Drought

Winter of 2013-1430th Coldest Winter on Record in Texas (1895-current)
10th Driest Winter on Record in Texas

ENSO

ENSOPast Six El Nino Events

Top Historical Matches
2009 1996 1957
198419941978
1986 1951 2001 1990

Summer Temperatures
2009 is being applied at the best historical match
Latest set of historical years

Summer Temperatures
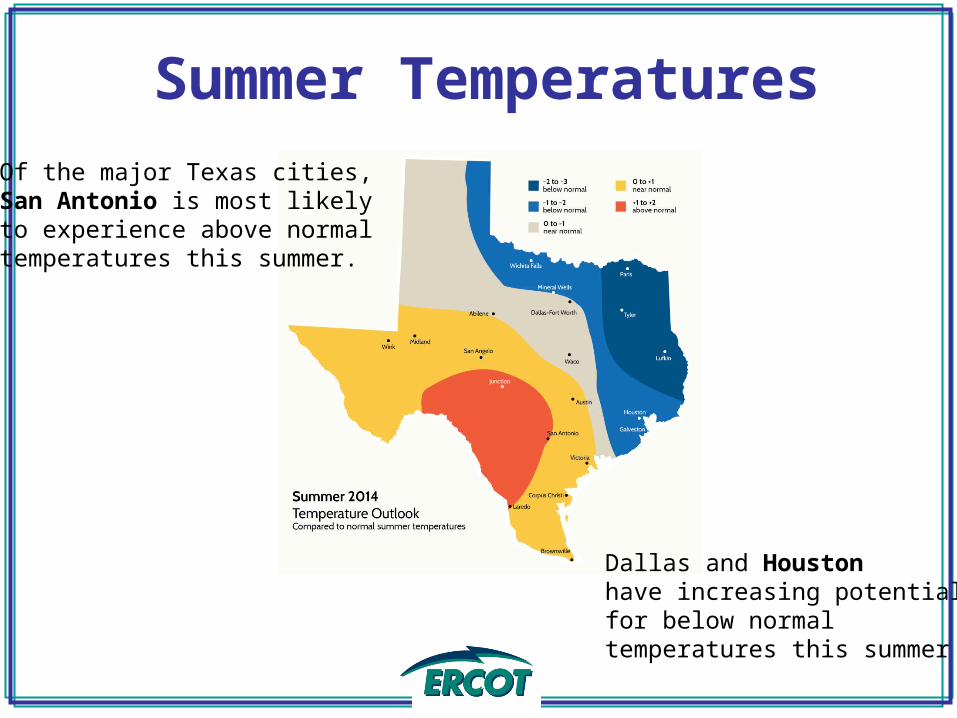
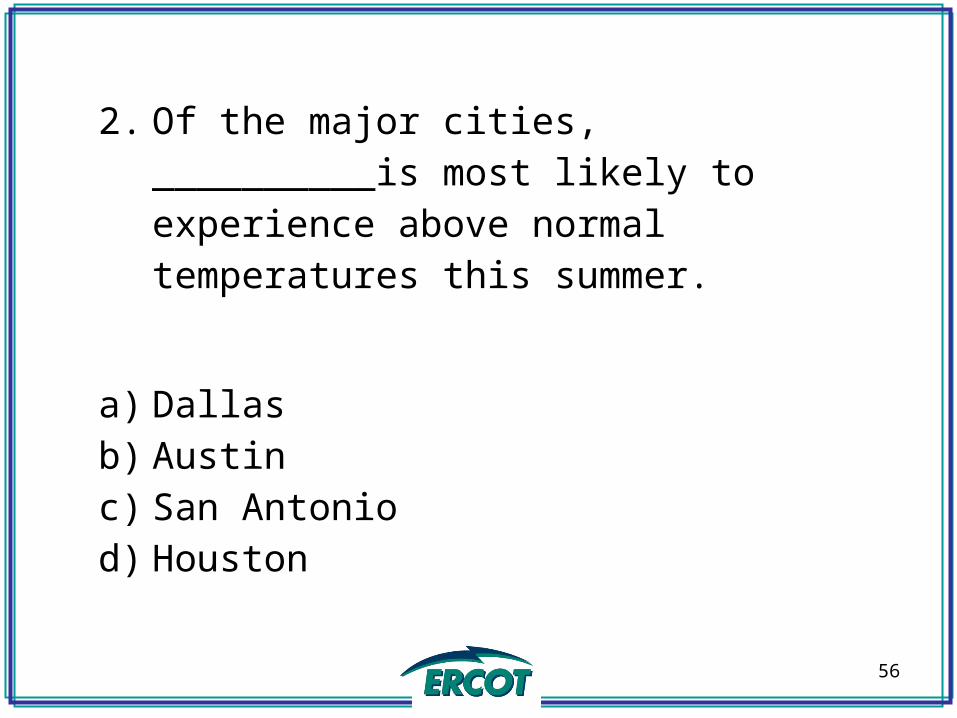
Summer TemperaturesOf the major Texas cities, San Antonio is most likelyto experience above normaltemperatures this summer.
Dallas and Houstonhave increasing potentialfor below normaltemperatures this summer

Summer TemperaturesBy month

June Temperatures
2009 1996
1963
1967
2013
1979
Top two analogs

June Temperatures
June has recorded abovenormal temperatures everymonth since 2008 – the pastsix years consecutively.
The primary historical match,2009, suggests a hot June, but most of the other historicalmatches are much milder.
This region (0 to +1) Could slip to 0 to -1.

July Temperatures

July Temperatures
July shows greater potentialfor above normal temperaturesthan any other summer month.

August Temperatures

August Temperatures
With the most recentupdates, August has trended toward a significantly less hot (milder) look.

September Temperatures

September Temperatures
September shows the greatest likelihood for belownormal temperatures.
Overall, the back half of the summer shows more belownormal opportunities thanthe front half.

What Others Are Saying

PRECIPITATION OUTLOOKSummer 2014

ENSOPast Six El Nino Events

Top Historical Matches
2009 1996 1963
197919672013
1991 1951 1957 1986

Summer Precipitation

Summer Precipitation
Latest

Summer Precipitation

DROUGHT OUTLOOKSummer 2014
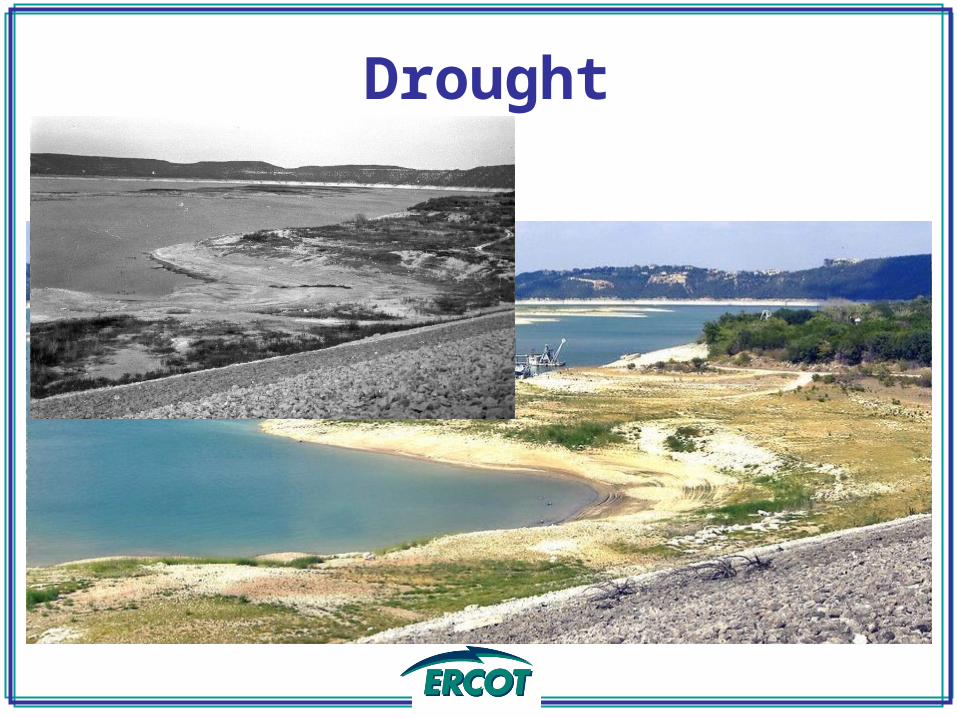
Drought

Drought
Lake Travis at 34.8% of capacity
Colorado River Basin at 26.0%
Texas Reservoirs at 64.7%
Lake Travis
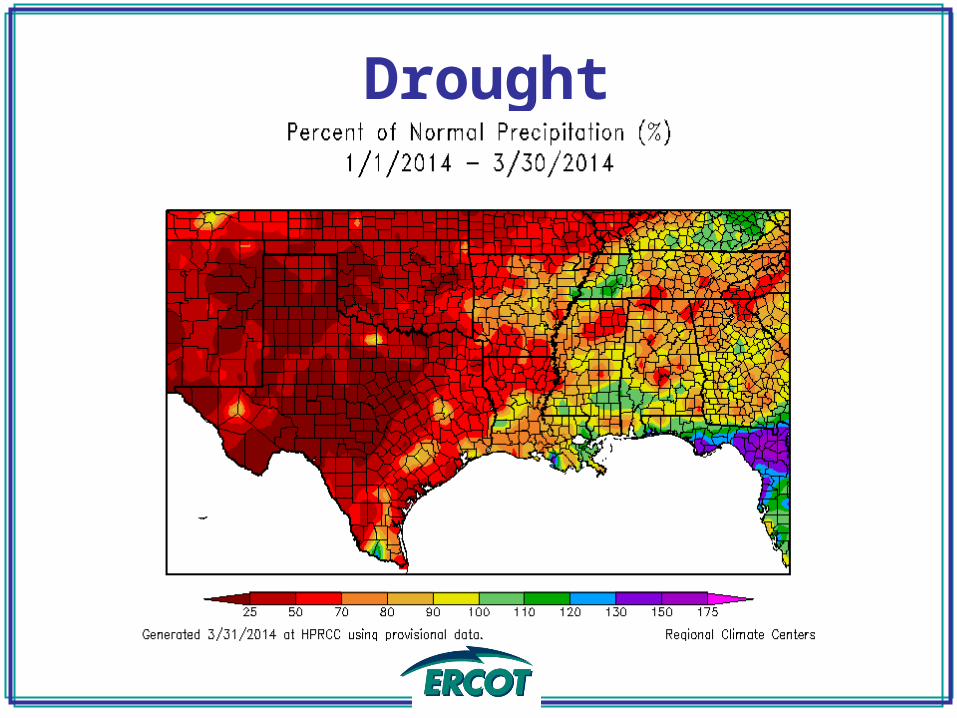
Drought

Drought

Drought

Drought

HURRICANE OUTLOOKSummer (and Fall) 2014


Hurricane Forecast
Historical Averages
Named Storms: 11.3Hurricanes: 6.2Major Hurricanes: 2.3

Hurricane Forecast

Hurricane ForecastENSO is a strong factor in determiningthe Hurricane season (number and intensities).
At this point, ENSO is neutral and likely to remain neutral into early- summer. At some point, summer or fall, El Niño development is possible.

Hurricane Forecast
Factors in DeterminingNumbers and Intensities
ENSOSaharan DustDry AirVertical Wind ShearOcean Temperatures

Hurricane ForecastWhat happened last year?

Hurricane ForecastWhat happened last year?
MDA/EarthSat: 19/10/4
NOAA: 13-19/7-11/3-6
Colorado State University: 18/9/4
The Weather Channel: 16/9/5
Weather Underground: 18/11/5
ERCOT: 10/5/2
Normal: 11/6/2
2013 Actual: 14/2/0
Prior three seasons each had 19 named storms.Prior three seasons have each had a La Nina influence.
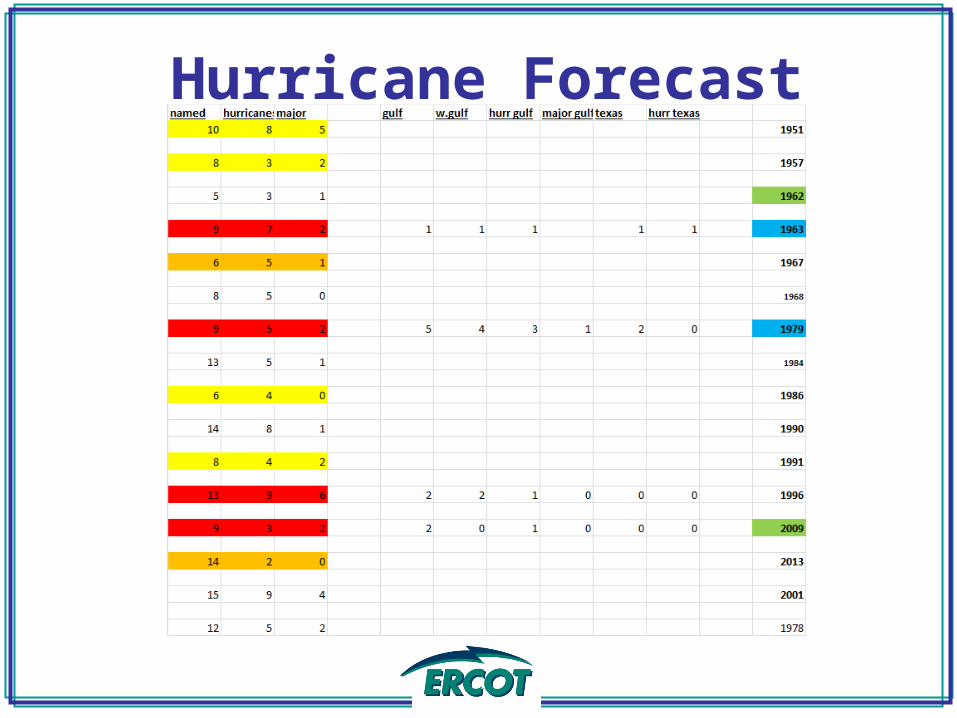
Hurricane Forecast

Hurricane ForecastTotal Named Storms: 9Total Hurricanes: 5Major Hurricanes: 3
Named Storms in Gulf: 2-4Named Storms in Western Gulf: 1-2Hurricane in Gulf: 1-2Major Hurricane in Gulf: 0-1Named Storms with Texas Landfall: 0 or 1Hurricanes with Texas Landfall: 0 or 1
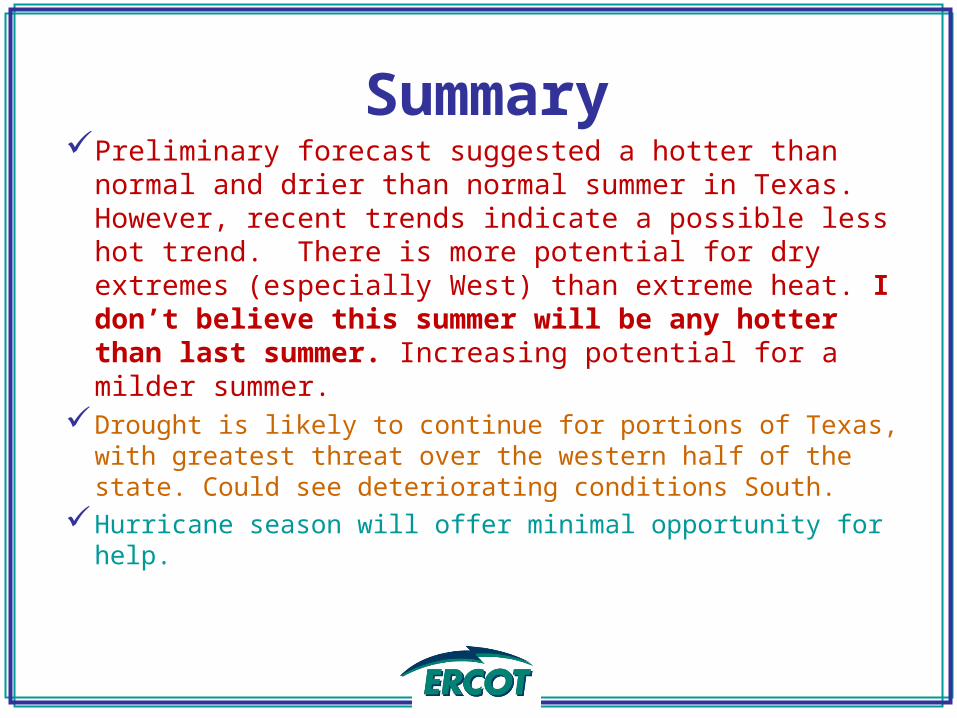
SummaryPreliminary forecast suggested a hotter than normal
and drier than normal summer in Texas. However, recent trends indicate a possible less hot trend. There is more potential for dry extremes (especially West) than extreme heat. I don’t believe this summer will be any hotter than last summer. Increasing potential for a milder summer.
Drought is likely to continue for portions of Texas, with greatest threat over the western half of the state. Could see deteriorating conditions South.
Hurricane season will offer minimal opportunity for help.

Visit www.ercot.com/about/weather for daily weather updates.

QuestionsQuestions
????

55
1. ______ has recorded above normal temperatures every month since 2008 – the past six years consecutively.
a) Mayb) Junec) Julyd) August
56
2. Of the major cities, __________is most likely to experience above normal temperatures this summer.
a) Dallasb) Austinc) San Antoniod) Houston

57
3. The historical year that is being applied as the primary historical match for the Summer 2014 is______?
a) 2008b) 2009c) 2010d) 2011

58
4. The driest summer on record as a whole for Texas was_______?
a) 2008b) 2009c) 2010d) 2011

59
5. The forecasted named storms in the Gulf of Mexico for 2014 are _______?
a) 0-1b) 2-4c) 5-6