Embed Size (px)
Citation preview

July 2014
2014 Patent Litigation Study As case volume leaps, damages continue general decline

1PwCPatent litigation study
Contents
Introduction 2
Summary of key observations 3
Detailed findings 5Patents issued and cases filed reach new highs 5Median damages trends 6 Median damages are on a downward trend 6 But for NPEs, median damages are increasing 6 No 2013 cases cracked the top ten overall awards 7Jury vs. bench comparisons 8 Jury trials are favored overall 8 However, the jury vs. bench success gap is narrowing 8 Still, median jury awards substantially outpace the bench 9Reasonable royalties are the most prevalent measure of damages 9Success rates 10 Success rates vary by type of entity and stage of decision 10 Practicing entities are generally more successful than NPEs 11 NPEs and practicing entities are more successful with juries 11Industry segmentation 12 Patent litigation across industries: consumer products lead in terms of volume 12 Median damages are largest in telecommunications 13 Fourofthetopfiveindustriesseehigherthanaveragesuccessrates 14 Telecommunications and computer hardware/electronics lead in jury use 15Time-to-trial analysis 16 Median time-to-trial: approximately 2.5 years 16 Median damages rise with longer time-to-trial 16District rankings 17 Certain districts are more favorable to patent holders 17 NPE decisions are concentrated in certain districts 18Further NPE details 19 Practicing entities and NPEs by the numbers 19 MediandamagesawardsvarysignificantlyamongNPEtypes 19 Individual NPEs experience lower success rates 20ANDA litigation statistics 20 ANDA litigation continues to trend upward 20 HistoricalANDAsuccessrateshavevariedsignificantly 21Statistics by judge for top ten most active judges 22
Patent litigation appeals, 2007–2011 23Summary appellate statistics 23Which party appeals more often? It depends on your perspective… 24Appellate outcomes: A mixed bag 25Results can vary by originating district 26
Our methodology 27
Our authors 28

2 PwC Patent litigation study
Introduction
In some ways, 2013 appeared to be a moderating year in patent infringement
litigation. The “mega” verdicts of prior years (2012 saw three cases that
resulted in damages awards of over $1 billion) were missing, with the largest
new award falling to just over $200 million.1 Four of the ten largest awards
frompreviousyearsweresettled,overturned,modifiedorremainunderappeal
in 2013. And the median damages award continued its gradual downward
tapering, to $4.3 million in the most recent four-year period.
On the other hand, both the number of patent cases filed and the number of patents granted continued to grow rapidly in 2013—by 25% (to almost 6,500 cases) and 7% (to almost 300,000 patents), respectively, over 2012. And mega-cases continued to make headlines, including one involving an “at-risk” launch of a generic pharmaceutical that was settled mid-trial for $2.15 billion, and another matter involving medical devices where post-trial bench consider-ation added substantial punitive damages, potentially bringing total damages to over $1 billion. The year 2013 also saw the continuation of the multi-year “smartphone wars,” both in district courts and before the International Trade Commission (ITC).
Nonpracticing entities (NPEs) continued to play a growing role in patent litigation in 2013. One recent analysis reported that in 2013 NPEs filed 67% of all new patent infringement cases, compared to 28% in 2009.2 Our statistics indicate that only 20% of identified decisions in 2013 involved NPE patent holders, reflecting the much higher tendency for NPE-filed cases to settle or be dismissed. However, as further detailed in this year’s study, NPEs’ median damages award in recent years has been triple that of practicing entities.
These statistics, along with some notorious examples of aggressive NPE tactics, not only caught the attention of practicing entities, but also instigated multiple political responses. As widely reported in the media and discussed by numerous commentators, these responses include strong anti-NPE comments by President Obama, several executive actions aimed at tightening patent ownership disclosures and narrowing patent claims, a formal probe of NPE litigation activity initi-ated by the Federal Trade Commission (FTC), and a myriad of legislative proposals and state Attorneys General actions that generally seek to rein in NPE litigation.
Finally, the US Supreme Court has gotten fully involved in the patent litigation fray, with six patent matters granted certiorari in the most recent term. These matters related to issues such as: the scope of patentable subject matter in business method patents; the extent to which activities outside US borders can infringe US patents; under what circumstances defendants can recover litiga-tion costs from losing plaintiffs; and certain technical patenting and procedural issues.
1 The largest patent infringe-ment award in 2013 resulted from a retrial of damages related to certain products in the well-known Apple v. Samsung matter, which was originally tried in 2012.
2 See RPX Corporation’s “2013 NPE Litigation Report.”
3PwCPatent litigation study
Summary of key observations
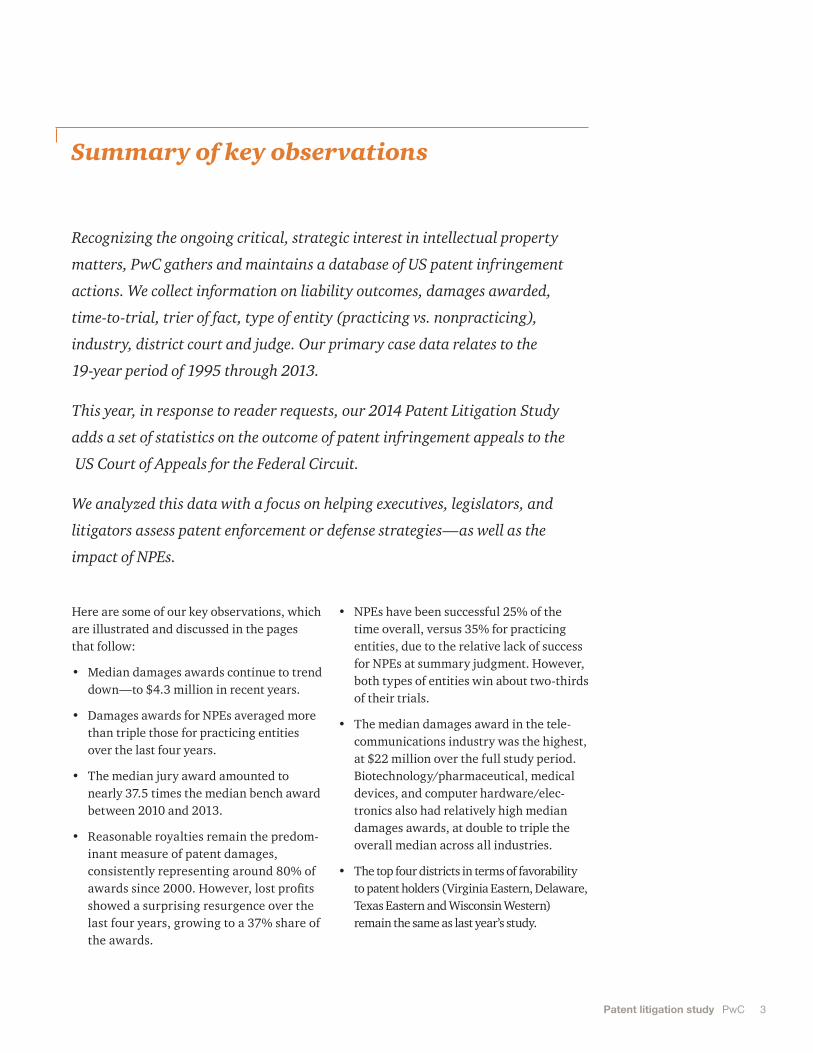
Recognizing the ongoing critical, strategic interest in intellectual property
matters, PwC gathers and maintains a database of US patent infringement
actions. We collect information on liability outcomes, damages awarded,
time-to-trial, trier of fact, type of entity (practicing vs. nonpracticing),
industry, district court and judge. Our primary case data relates to the
19-year period of 1995 through 2013.
This year, in response to reader requests, our 2014 Patent Litigation Study
adds a set of statistics on the outcome of patent infringement appeals to the
US Court of Appeals for the Federal Circuit.
We analyzed this data with a focus on helping executives, legislators, and
litigators assess patent enforcement or defense strategies—as well as the
impact of NPEs.
Here are some of our key observations, which are illustrated and discussed in the pages that follow:
• Median damages awards continue to trend down—to $4.3 million in recent years.
• Damages awards for NPEs averaged more than triple those for practicing entities over the last four years.
• The median jury award amounted to nearly 37.5 times the median bench award between 2010 and 2013.
• Reasonable royalties remain the predom-inant measure of patent damages, consistently representing around 80% of awards since 2000. However, lost profits showed a surprising resurgence over the last four years, growing to a 37% share of the awards.
• NPEs have been successful 25% of the time overall, versus 35% for practicing entities, due to the relative lack of success for NPEs at summary judgment. However, both types of entities win about two-thirds of their trials.
• The median damages award in the tele-communications industry was the highest, at $22 million over the full study period. Biotechnology/pharmaceutical, medical devices, and computer hardware/elec-tronics also had relatively high median damages awards, at double to triple the overall median across all industries.
• The top four districts in terms of favorability to patent holders (Virginia Eastern, Delaware, Texas Eastern and Wisconsin Western) remain the same as last year’s study.

4 PwC Patent litigation study
• NPE cases continue to be concentrated in certain district courts: five district courts (out of a total of 94) accounted for 41% of all identified decisions where the patent holder was an NPE, with the Eastern District of Texas alone accounting for 12% of all identified NPE decisions.
• Median damages awards and success rates vary significantly among types of NPE, with individual NPEs experiencing markedly lower award and success rates.
• Abbreviated New Drug Application (ANDA) litigation continues its dramatic growth trajectory, representing almost one-tenth of all adjudicated cases in the last eight years. The overall ANDA success rate since 2006 is 52%—much higher than the study’s overall 33% patentee success rate.
• Of the ten currently sitting judges with most active patent dockets, five are in Delaware and the Eastern District of Texas.
Eight of these most active judges’ cases yielded damages awards significantly exceeding the overall median.
• About 71% of district court patent deci-sions are appealed to the Federal Circuit, generally by the losing side or by both parties, and usually on multiple grounds. Of these, 64% received a reasoned opinion, 11% concluded with a summary affirmance and the remaining 25% were dismissed, settled or are still pending.
• Of the appeals decided by the Federal Circuit, most (65%) received a mixed decision; that is, of the multiple issues raised, the court affirmed some issues but also reversed or vacated others. The remaining appellate decisions were entirely one-sided: 24% were affirmed in total, while 11% were reversed/vacated/remanded in total. Accordingly, 76% of patent cases appealed to the Federal Circuit were modified in some manner.

5PwCPatent litigation study
As Chart 1 illustrates, the annual number of patent actions filed once again estab-lishes a new record high, with close to 6,500 cases filed in 2013. The number of cases has increased at an overall compound annual growth rate (CAGR) of 8% since 1991. However, since 2009, the CAGR of the number of patent cases filed has been 24%, or almost three times the growth over the entire period. Two factors driving growth in recent years were the anti-joinder provision of the America Invents Acts (AIA), which went into effect in 2011, and the temporary crush of false marking cases in 2010 and 2011.
Meanwhile, the number of patents granted by the United States Patent and Trademark Office (USPTO) has also grown steadily, increasing at a CAGR of 5% since 1991. Similar to patent cases filed, the CAGR of patents granted since 2009 has been much higher than the longer-term growth at 11%. As the chart further shows, 2013 continued the trend of high correlation (approx-imately 94% since 1991) between the numbers of patent cases filed and patents granted by the USPTO.
Patents issued and cases filed reach new highs
1,000
2,000
3,000
4,000
5,000
6,000
7,000
100,000
120,000
140,000
160,000
180,000
200,000
220,000
240,000
260,000
280,000
300,000
Pat
ent
case
s fil
edP
atents granted
’91 ’92 ’93 ’94 ’95 ’96 ’97 ’98 ’99 ’00 ’01 ’02 ’03 ’04 ’05 ’06 ’07 ’08 ’09 ’10 ’12’11 ’13
CAGR = 8%
CAGR = 5%
Patent cases Patents granted
Year
Years are based on September year-end.Sources: Performance & Accountability Report (US Patent and Trademark Office) and Judicial Facts and Figures (US Courts)
Chart 1. Patent case filings and grants
Detailed findings

6 PwC Patent litigation study
Adjusting for inflation using the consumer price index (CPI), the annual median damages award between 1995 and 2013 ranged from $2.1 million to $16.7 million, with an overall median award of $5.5 million over the last 19 years (the 2013 figure was $5.9 million).
As Chart 2a illustrates, when we segment the period from 1995 through 2013 into fourths, we see that the median damages award has declined from its high-water mark in the early 2000s.
Median damages are on a downward trend
But for NPEs, median awards are increasing
$0
$1
$2
$3
$4
$5
$6
$7
$8
Med
ian
dam
ages
aw
ard
ed (i
n $M
M)
Median damages are adjusted for inflation to 2013 US dollars.
The number of identified decisions is indicated within the respective column.
1995
–199
920
00–2
004
2005
–200
920
10–2
013
$4.3
$5.5
61 100 153 114
$7.5
$4.9
Chart 2a. Median damages awarded
$0
$2
$4
$6
$8
$10
$12
Med
ian
dam
ages
aw
ard
ed (i
n $M
M)
Median damages are adjusted for inflation to 2013 US dollars.
1995–1999 2000–2004 2005–2009 2010–2013
Nonpracticing entities
Practicing entities
$5.7
$4.3
$5.6 $5.5
$11.3
$7.3
$2.5
$8.5
Chart 2b. Median damages awarded: nonpracticing entities vs. practicing entities
Chart 2b shows the continuation of a trend that began in the early 2000s: a wide disparity in the damages awarded to NPEs relative to practicing entities. While median awards for practicing entities have declined steadily since the 2000–2004 period, NPE awards actually increased during the 2010–2013 period.
7PwCPatent litigation study
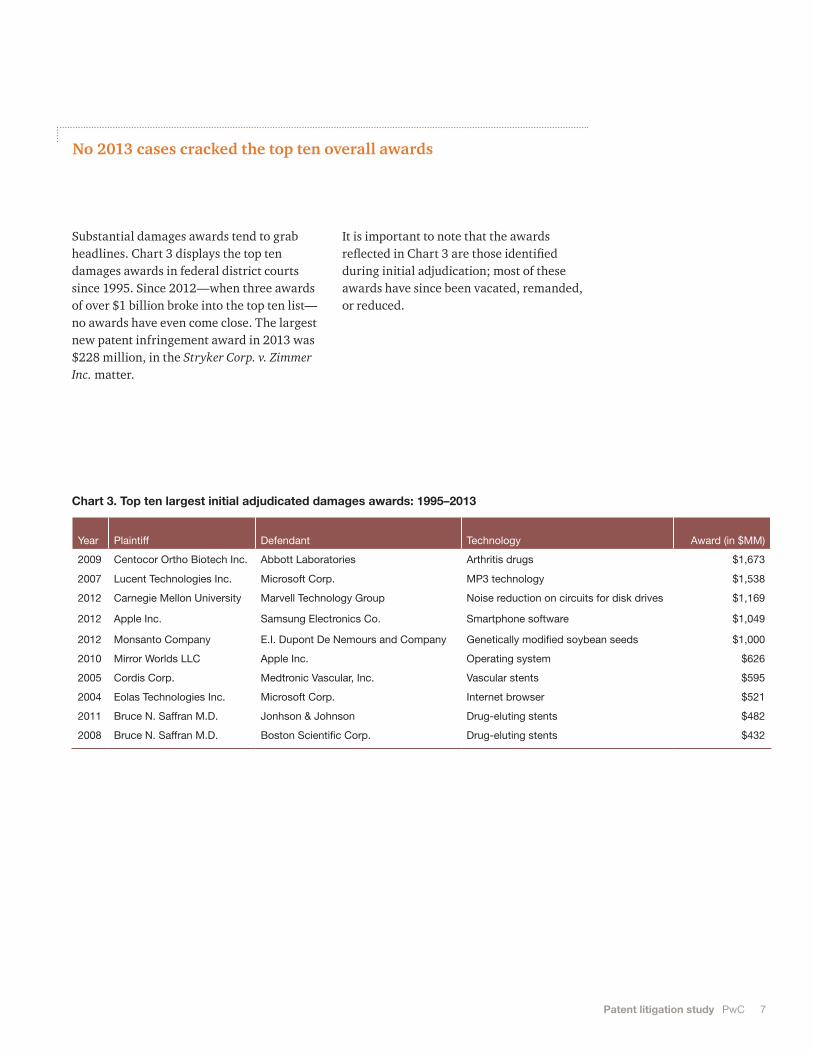
Substantial damages awards tend to grab headlines. Chart 3 displays the top ten damages awards in federal district courts since 1995. Since 2012—when three awards of over $1 billion broke into the top ten list—no awards have even come close. The largest new patent infringement award in 2013 was $228 million, in the Stryker Corp. v. Zimmer Inc. matter.
No 2013 cases cracked the top ten overall awards
It is important to note that the awards reflected in Chart 3 are those identified during initial adjudication; most of these awards have since been vacated, remanded, or reduced.
Year Plaintiff Defendant Technology Award (in $MM)
2009 Centocor Ortho Biotech Inc. Abbott Laboratories Arthritis drugs $1,673
2007 Lucent Technologies Inc. Microsoft Corp. MP3 technology $1,538
2012 Carnegie Mellon University Marvell Technology Group Noise reduction on circuits for disk drives $1,169
2012 Apple Inc. Samsung Electronics Co. Smartphone software $1,049
2012 Monsanto Company E.I. Dupont De Nemours and Company Genetically modified soybean seeds $1,000
2010 Mirror Worlds LLC Apple Inc. Operating system $626
2005 Cordis Corp. Medtronic Vascular, Inc. Vascular stents $595
2004 Eolas Technologies Inc. Microsoft Corp. Internet browser $521
2011 Bruce N. Saffran M.D. Jonhson & Johnson Drug-eluting stents $482
2008 Bruce N. Saffran M.D. Boston Scientific Corp. Drug-eluting stents $432
Chart 3. Top ten largest initial adjudicated damages awards: 1995–2013

8 PwC Patent litigation study
Unlike the 1980s and 1990s, the last decade-plus has seen juries evolve as the preferred trier of fact in patent infringement litigation. (The results in Chart 4a exclude ANDA-related litigation, as these cases are, with rare exceptions, tried by the bench, and their increasing prevalence in recent years would otherwise skew this measure.)
Jury trials are favored overall However, the jury vs. bench success gap is narrowing
Numerous factors contribute to the increased use of juries as the preferred fact finder for patent cases. Over the last 19 years, patent holders generally have experienced higher trial success rates when their cases are decided by juries rather than by the bench. However, as Chart 4b illustrates, the margin between bench and jury success rates has been steadily narrowing—from almost 40% in the earliest period of our Study to only about 10% between 2010 and 2013.
Chart 4a. Use of jury trials by decade
0%
10%
20%
30%
40%
50%
60%
70%
1980s 1990s 2000s 2010s
14%
26%
61% 62%
Chart 4b. Trial success rates: bench vs. jury
0%
10%
20%
30%
40%
50%
60%
70%
80%
90%
100%
1995–1999 2000–2004 2005–2009 2010–2013
Bench
Jury
43%
81%
55%
78% 77%74%
64%
58%

9PwCPatent litigation study
Since 2000, median jury awards have been significantly greater than median awards by the bench, with jury awards running many multiples of the amounts awarded by judges over the last 14 years. This growing gap partially reflects the decrease in high-stakes damages cases that are heard by the bench. For example, the jury share of all cases with damages awarded increased from 24% in 1995–1999 to 61% in 2010–2013. Large-dollar damages cases are almost always tried by juries.
Still, median jury awards substantially outpace the bench
$0
$2
$4
$6
$8
$10
$12
$14
$16
Med
ian
dam
ages
aw
ard
ed (i
n $M
M)
Median damages are adjusted for inflation to 2013 US dollars.
1995–1999 2000–2004 2005–2009 2010–2013
Bench
Jury
$0.5 $0.4
$5.7
$4.7
$1.5
$13.1
$15.0
$7.8
Chart 4c. Median damages awarded: bench vs. jury trials
Reasonable royalties are the most prevalent measure of damages
Reasonable royalties are the type of damages most frequently awarded in patent cases—constituting a share that continues to increase every year, as Chart 5 shows. However, in the most recent period (2010–2013), lost profits as a measure of damage have resurged somewhat, being awarded in 37% of decided cases.3 Patent law sets a reasonable royalty as the minimum level of compensation due to the patent holder from an infringer.
There are several reasons why lost profits damages are not as common as reasonable royalties:
• NPEs, which bring an increasing propor-tion of patent actions, are ineligible for lost profits damages. Excluding NPE results from Chart 5, the proportion of damages awarded through reasonable royalties decreases by about 7%.
• Even patentees eligible for lost profits awards might eschew lost profits claims. Patent holders might not want to risk disclosing proprietary cost and profit information necessary for the calculation of lost profits.
• Lost profits entitlement can be more difficult to establish. The proliferation of competition and specialized distribution channels provides greater access to substi-tute products; therefore, even without an alleged infringer’s products on the market, consumers may not have bought the patent holder’s products.
3 Because some litigants receive damages awards of both lost profits and reasonable royalties, the totals exceed 100%.

10 PwC Patent litigation study
Success rates vary by type of entity and stage of decision
Finally, damages awards for price erosion claims have become almost non-existent over the last nine years. The cost and complexity of price erosion analyses have reduced the recovery (and, most likely, the pursuit) of price erosions claims.
0%
10%
20%
30%
40%
50%
60%
70%
80%
90%
1995–1999 2000–2004 2005–2009 2010–2013
Price erosion
Lost profits
Reasonable royalty
8%
41%
69%
29%
78%80%
29%
2% 1%
37%
81%
9%
Chart 5. Composition of damages awards
Chart 6a shows that the overall success rate for practicing entities is 10% higher than that for NPEs over the last 19 years. NPEs are much less successful at the summary judg-ment stage: winning in only 3% of identified decisions, as opposed to 10% for practicing entities. Conversely, the trial success rate for practicing entities is nearly identical to that for NPEs, at roughly two-thirds.
0%
10%
20%
30%
40%
50%
60%
70%
Overall Summaryjudgment
Trial
Nonpracticing entities
Practicing entities
10%
66%
25%
35%
3%
65%
Chart 6a. Patent holder success rates: 1995–2013
11PwCPatent litigation study
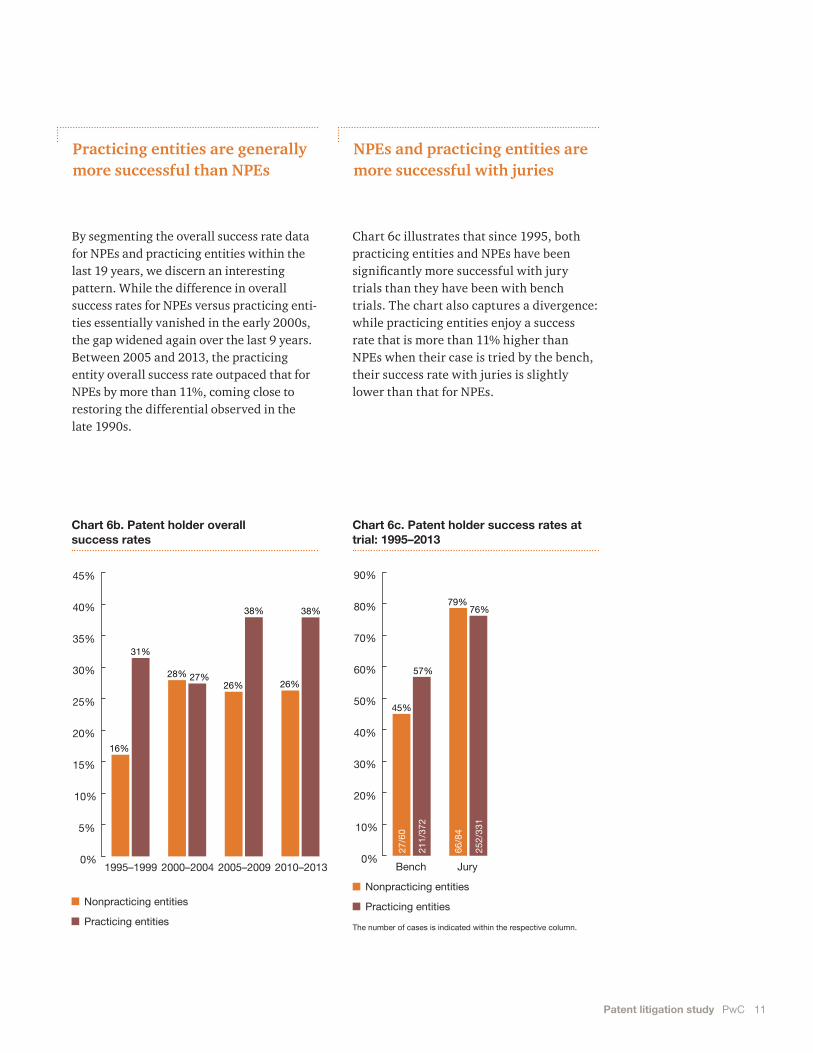
Practicing entities are generally more successful than NPEs
0%
5%
10%
15%
20%
25%
30%
35%
40%
45%
Nonpracticing entities
Practicing entities
27%26% 26%
38%38%
16%
31%
28%
1995–1999 2000–2004 2005–2009 2010–2013
Chart 6b. Patent holder overall success rates
By segmenting the overall success rate data for NPEs and practicing entities within the last 19 years, we discern an interesting pattern. While the difference in overall success rates for NPEs versus practicing enti-ties essentially vanished in the early 2000s, the gap widened again over the last 9 years. Between 2005 and 2013, the practicing entity overall success rate outpaced that for NPEs by more than 11%, coming close to restoring the differential observed in the late 1990s.
0%
10%
20%
30%
40%
50%
60%
70%
80%
90%
Nonpracticing entities
Practicing entities
76%
45%
27/6
0
211/
372
66/8
4
252/
331
57%
79%
Bench Jury
The number of cases is indicated within the respective column.
Chart 6c. Patent holder success rates at trial: 1995–2013
Chart 6c illustrates that since 1995, both practicing entities and NPEs have been significantly more successful with jury trials than they have been with bench trials. The chart also captures a divergence: while practicing entities enjoy a success rate that is more than 11% higher than NPEs when their case is tried by the bench, their success rate with juries is slightly lower than that for NPEs.
NPEs and practicing entities are more successful with juries

12 PwC Patent litigation study
Patent litigation across industries: consumer products lead in terms of volume
Chart 7a shows the distribution of cases for the ten most active industry classifications (out of 20), which collectively account for almost 90% of total identified decisions.
0%
2%
4%
6%
8%
10%
12%
14%
16%
18%
20%
Per
cent
of c
ases
Consu
mer
pro
ducts
Biotec
hnolo
gy/p
harm
a
Indus
trial/
cons
truct
ion
Comput
er h
ardwar
e/ele
ctro
nics
Med
ical d
evice
s
Softw
are
Busine
ss/c
onsu
mer
serv
ices
Telec
omm
unica
tions
Autom
otive
/tran
spor
tatio
n
Chem
icals/
synt
hetic
mat
erial
s
10%
17%
14%
11%
7%
9%
5%6%
5%5%
Chart 7a. Distribution of cases: top ten industries, 1995–2013
Patents associated with the consumer prod-ucts industry led in terms of the percentage of identified decisions between 1995 through 2013, representing 17% of the total.
13PwCPatent litigation study
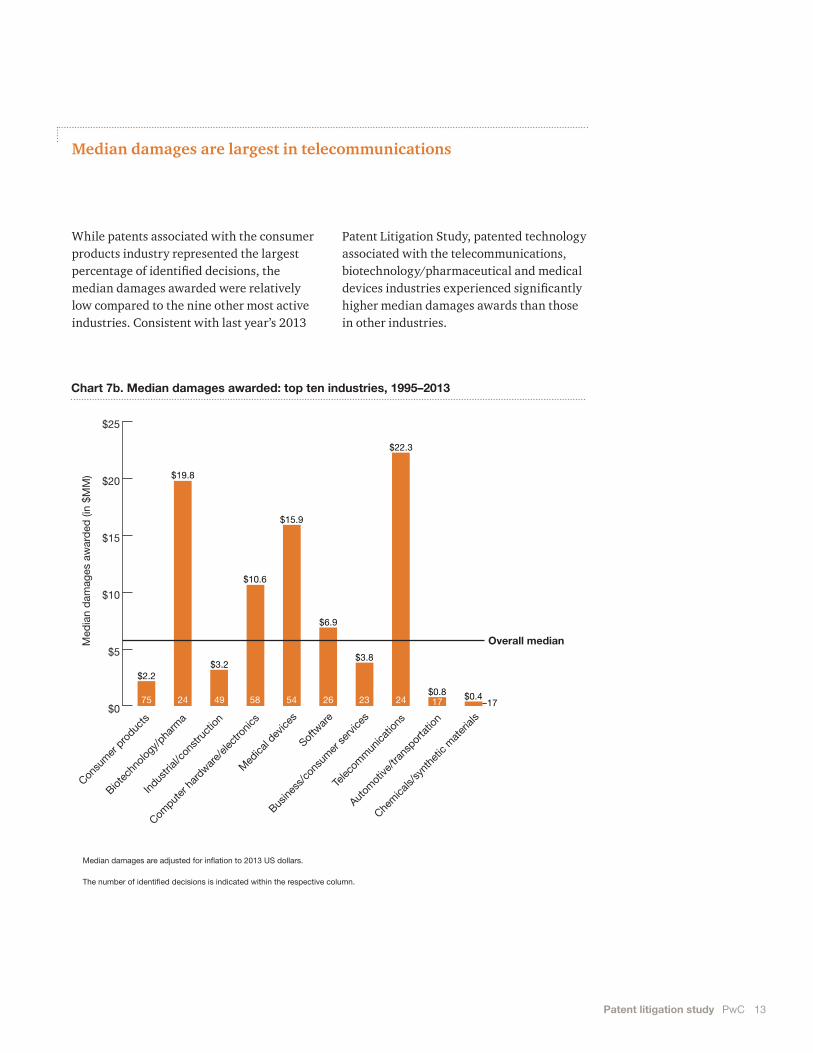
Median damages are largest in telecommunications
While patents associated with the consumer products industry represented the largest percentage of identified decisions, the median damages awarded were relatively low compared to the nine other most active industries. Consistent with last year’s 2013
Patent Litigation Study, patented technology associated with the telecommunications, biotechnology/pharmaceutical and medical devices industries experienced significantly higher median damages awards than those in other industries.
$0
$5
$10
$15
$20
$25
Overall medianMed
ian
dam
ages
aw
ard
ed (i
n $M
M)
Consu
mer
pro
ducts
Biotec
hnolo
gy/p
harm
a
Indus
trial/
cons
truct
ion
Comput
er h
ardwar
e/ele
ctro
nics
Med
ical d
evice
s
Softw
are
Busine
ss/c
onsu
mer
serv
ices
Telec
omm
unica
tions
Autom
otive
/tran
spor
tatio
n
Chem
icals/
synt
hetic
mat
erial
s
$10.6
58
$2.2
75
$19.8
24
$3.2
49
$6.9
26
$15.9
54
$22.3
24
$3.8
23 $0.417
$0.817
Median damages are adjusted for inflation to 2013 US dollars.
The number of identified decisions is indicated within the respective column.
Chart 7b. Median damages awarded: top ten industries, 1995–2013
14 PwC Patent litigation study
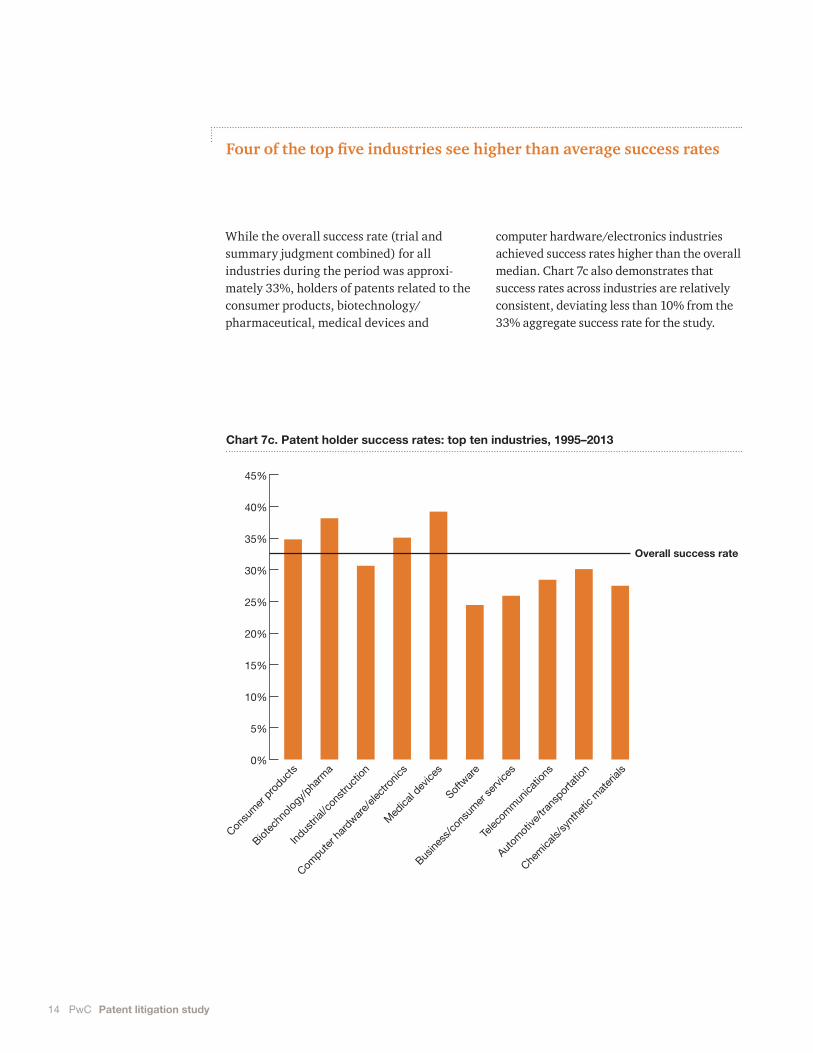
While the overall success rate (trial and summary judgment combined) for all industries during the period was approxi-mately 33%, holders of patents related to the consumer products, biotechnology/ pharmaceutical, medical devices and
computer hardware/electronics industries achieved success rates higher than the overall median. Chart 7c also demonstrates that success rates across industries are relatively consistent, deviating less than 10% from the 33% aggregate success rate for the study.
Four of the top five industries see higher than average success rates
0%
5%
10%
15%
20%
25%
30%
35%
40%
45%
Overall success rate
Consu
mer
pro
ducts
Biotec
hnolo
gy/p
harm
a
Indus
trial/
cons
truct
ion
Comput
er h
ardwar
e/ele
ctro
nics
Med
ical d
evice
s
Softw
are
Busine
ss/c
onsu
mer
serv
ices
Telec
omm
unica
tions
Autom
otive
/tran
spor
tatio
n
Chem
icals/
synt
hetic
mat
erial
s
Chart 7c. Patent holder success rates: top ten industries, 1995–2013

15PwCPatent litigation study
Telecommunications and computer hardware/electronics lead in jury use
The use of jury trials varies widely by industry, as illustrated in Chart 7d. The wide disparity is highlighted by the difference in jury use between the biotechnology/pharmaceutical and telecommunications industries. As previously noted, the telecom-munications industry also experienced the highest median damages award.
The biotechnology/pharmaceutical industry had a considerably lower use of jury trials than the other top-ten industries; this is partly due to the frequent incidence of ANDA-related litigations, which are tried primarily by the bench. Removing ANDA-related litigation from the biotechnology/pharmaceutical industry would increase its jury use percentage to 52%.
0%
10%
20%
30%
40%
50%
60%
70%
80%
Overall jury %
Consu
mer
pro
ducts
Biotec
hnolo
gy/p
harm
a
Indus
trial/
cons
truct
ion
Comput
er h
ardwar
e/ele
ctro
nics
Med
ical d
evice
s
Softw
are
Busine
ss/c
onsu
mer
serv
ices
Telec
omm
unica
tions
Autom
otive
/tran
spor
tatio
n
Chem
icals/
synt
hetic
mat
erial
s
Chart 7d. Use of jury trials: top ten industries, 1995–2013

16 PwC Patent litigation study
Overall, time-to-trial has remained rela-tively steady, at about 2.5 years, since 2005. An increase of about a half-year is evident since the shortest time-to-trial period of 2000–2004, when the median was just over two years, but the case volume was signifi-cantly lower.
Median time-to-trial: approximately 2.5 years
Median damages rise with longer time-to-trial
Chart 8b displays the direct relationship between the median damages award and time-to-trial. Several factors might influence this relationship. Cases involving higher potential damages awards can be more complex and take a longer time to reach trial. A longer time-to-trial also provides a longer period over which infringing sales can occur, increasing the potential damages base.
0
10
20
30
40
50
60
0.0
0.5
1.0
1.5
2.0
2.5
3.0
Med
ian time-to-trial (in years)
Number of trials per year
Median time-to-trial
Num
ber
of t
rials
/yea
r w
ith t
ime-
to-t
rial d
ata
avai
lab
le
1995
-199
9
2005
-200
9
2000
-200
4
2010
-201
3
Chart 8a. Median time-to-trial
$0
$2
$4
$6
$8
$10
$12
$14M
edia
n d
amag
es (i
n $M
M)
Median damages are adjusted for inflation to 2013 US dollars.
The number of identified decisions is indicated within the respective column.
$3.7
127 155 84
$8.8
$11.5
0–2 2–4 4+
Time-to-trial in years
Chart 8b. Median damages based on time-to-trial: 1995–2013

17PwCPatent litigation study
Certain districts are more favorable to patent holders
Certain jurisdictions (particularly Virginia Eastern, Delaware, and Texas Eastern) continue to be more favorable venues for patent holders, with shorter time-to-trial, higher success rates, and greater median damages awards. Chart 9a presents the top 15 most active districts and their categorical rankings for each of the three key metrics, with the overall ranking based on a simple average of the three.
Relative to last year’s study, the top four districts in terms of favorability to patent holders remain the same. Florida’s Middle District rounds out the top five districts in this year’s study (despite having the lowest median damages), replacing New Jersey, which dropped to seventh place.
Chart 9a. District court rankings: 1995–2013
Overall rank District
Median time-to-trial
(in years) Rank
Overall success
rate Rank
Median damages awarded Rank
1 Virginia Eastern 0.97 1 32% 6 $37,334,272 2
2 Delaware 1.97 4 41% 4 $19,105,617 3
3 Texas Eastern 2.21 6 57% 1 $9,101,683 5
4 Wisconsin Western 1.08 2 31% 7 $4,901,798 9
5 Florida Middle 1.80 3 54% 2 $322,927 15
6 Texas Southern 2.01 5 23% 14 $57,046,837 1
7 New Jersey 2.71 12 34% 5 $16,584,682 4
8 Texas Northern 2.42 8 46% 3 $3,643,782 11
9 California Central 2.23 7 29% 10 $3,139,412 12
10 California Northern 2.44 9 23% 15 $8,425,257 6
11 New York Southern 2.88 13 28% 11 $5,581,695 8
12 Massachusetts 3.58 14 31% 8 $4,237,438 10
13 Minnesota 2.66 11 29% 9 $1,648,192 13
14 Illinois Northern 3.67 15 26% 12 $5,978,390 7
15 Florida Southern 2.50 10 25% 13 $380,052 14
Overall (all decisions identified)
2.31 33% $5,493,971
Median damages are adjusted for inflation to 2013 US dollars. The rankings for these courts are based on their relative ranking for each of the three statistical measures, equally weighted.

18 PwC Patent litigation study
Cases with NPEs as patent holders were concentrated in a relatively small number of districts: the top five districts (out of 94 total) with the most identified decisions accounted for 41% of all identified NPE cases—and the top ten districts accounted for 57%. The percentage of NPE decisions in the most active NPE districts continues to increase, indicating continued concentration of NPE cases in certain courts.
The districts with the most identified NPE decisions, however, present a dichotomy in relative NPE success rates. Texas Eastern, with the most identified NPE cases by far, also has one of the highest success rates, almost double the NPE average. However, the next three districts yielded success rates roughly 10% below the overall NPE average of 25%.
NPE decisions are concentrated in certain districts
Chart 9b. District courts with most identifed decisions with NPE as patent holder: 1995–2013
DistrictDecisions
involving NPEsTotal identified
decisionsNPE % of
total decisions NPE success rate
Texas Eastern 50 136 37% 46%
Illinois Northern 33 136 24% 15%
New York Southern 31 132 23% 13%
California Northern 28 149 19% 14%
Delaware 23 196 12% 35%
California Central 15 84 18% 33%
Massachusetts 14 77 18% 36%
Florida Southern 13 40 33% 15%
Pennsylvania Eastern 11 35 31% 18%
Minnesota 10 48 21% 40%
Texas Southern 10 47 21% 10%
DC 10 23 43% 0%
Texas Northern 9 35 26% 56%
US Court of Federal Claims 8 20 40% 13%
Virginia Eastern 8 47 17% 25%
Florida Middle 8 35 23% 63%
Colorado 7 24 29% 43%
Pennsylvania Western 6 17 35% 67%
Maryland 6 17 35% 0%
Michigan Eastern 6 39 15% 0%
New Jersey 6 87 7% 17%
All identified decisions 403 1,985 20% 25%
Includes districts with more than 5 identified decisions involving an NPE as the patent holder.

19PwCPatent litigation study
Chart 10 summarizes critical patent litigation statistics for practicing entities and NPEs. The median damage award for NPEs was significantly higher than that for
Charts 11a and 11b represent an analysis of NPE litigation by NPE type: (1) companies/for-profit organizations, (2) universities/non-profit organizations, and (3) individuals/inventors. Chart 11a illustrates that the median damages award for NPEs that are companies/for-profit organizations is only slightly higher than that for university/non-profit, but significantly higher than that for individual NPEs.
Practicing entities and NPEs by the numbers
Median damages awards vary significantly among NPE types
Chart 9b. District courts with most identifed decisions with NPE as patent holder: 1995–2013
Chart 10. Key statistics for practicing and nonpracticing entities: 1995–2013
Median time-to-trial (in years) Overall success rate Median damages awarded
Nonpracticing Entity 2.55 25% $8,755,381
Practicing Entity 2.28 35% $5,306,408
Median damages are adjusted for inflation to 2013 US dollars.
practicing entities, while practicing entities enjoyed higher success rates and slightly shorter median time-to-trial.
$0
$2
$4
$6
$8
$10
$12
Med
ian
dam
ages
aw
ard
ed (i
n $M
M)
Median damages are adjusted for inflation to 2013 US dollars.
The number of cases is indicated within the respective column.
Com
pany
Uni
vers
ity &
non
-pro
fit
Indi
vidu
al
$11.3
$10.1
$3.1
34958
Chart 11a. Patent holder median damages awarded by NPE type: 1995–2013

20 PwC Patent litigation study
While company NPEs are awarded higher damages, university/non-profit NPEs have by far the highest success rate among NPEs. Individual NPEs lag far behind, as shown in Chart 11b.
Individual NPEs experience lower success rates
ANDA litigation continues to trend upward
0%
5%
10%
15%
20%
25%
30%
35%
40%
45%
50%
The number of cases is indicated within the respective column.
Com
pany
Uni
vers
ity a
nd n
on-p
rofit
Indi
vidu
al
31%
58/1
88
9/20
34/1
94
45%
18%
Chart 11b. Patent holder success rates by NPE type: 1995–2013
0
2
4
6
8
10
12
14
16
18
20
Num
ber
of c
ases
per
yea
r
1995
–199
920
00–2
004
2005
–200
920
10–2
013
18
3
6
8
Chart 12a. ANDA cases: 1995–2013
Abbreviated New Drug Application (ANDA) litigation transpires when a generic drug manufacturer files with the Food and Drug Administration (FDA) an ANDA paragraph IV certification challenging a brand drug manu-facturer’s patent(s).
While damages are rarely awarded—because the alleged infringer does not generally make any infringing sales prior to the filing of the liti-gation—the economic ramifications of ANDA litigation are significant due to the potential for lost patent protection of highly profitable brand-name drugs. In addition, the first generic filer of a successful patent challenge is awarded a period of exclusivity in the generic drug market.
Chart 12a shows that the number of court decisions from ANDA litigation has grown substantially, consistent with the upward trend of overall patent litigation identified in Chart 1.

21PwCPatent litigation study
Historical ANDA success rates have varied significantly
Overall ANDA success rate since 2006
0%
10%
20%
30%
40%
50%
60%
70%
80%
90%
2006 2007 2008 2009 2010 2011 2012 2013
50%
83%
22%
40%
53% 50%
67%
50%
Chart 12b. ANDA success rate
Chart 12b reflects ANDA success rates, which we define as the patent holder’s (the brand-name drug manufacturer’s) success. Since 2006, ANDA litigation success rates have ranged from a low of 22% to a high of 83%. However, the sample size in the
earlier years was low, possibly explaining the wide swings in success rates. Because the majority of ANDA litigations continue to end in settlement, the adjudicated case sample size remains modest.

22 PwC Patent litigation study
We also captured information on the presiding judge in identified patent litiga-tion disputes. This table represents statistics for the currently-active judges with the most identified decisions from 1995-2013. Overwhelmingly, the median damages awarded in cases presided over by many of these judges significantly exceeds the overall
Statistics by judge for top ten most active judges
median damages awarded from 1995 to 2013, possibly indicating that larger disputes tend to be handled by more experienced judges. Interestingly, patent holder success rates for the top seven judges also tend to exceed the overall success rate, particularly in the Eastern District of Texas.
Chart 13. Top ten most active district court judges: 1995–2013
Rank Judge last name Judge first name
District court
Identified decisions
Identified trial decisions
Median damages
Overall
success rateTime
to trialPercent of decisions
that are SJs
1 Robinson Sue Delaware 65 41 $21,555,613 38% 1.88 37%
2 Sleet Gregory Delaware 29 25 $21,284,375 55% 1.88 10%
3 Davis Leonard Texas Eastern 27 20 $9,752,865 63% 2.29 26%
4 Stark Leonard Delaware 17 7 $13,083,385 41% 2.12 41%
5 Wilken Claudia California Northern 16 7 $9,675,832 38% 2.20 56%
6 Clark Ron Texas Eastern 15 13 $6,841,200 73% 1.79 13%
7 Huff Marilyn California Southern 11 6 $25,419,854 36% 2.07 45%
8 Young William Massachusetts 11 4 $233,159 18% 1.72 64%
9 Darrah John Illinois Northern 11 3 $10,139,484 9% 3.50 73%
10 Alsup William California Northern 10 4 $18,807,241 10% 1.61 60%
23PwCPatent litigation study
Summary appellate statistics
Patent litigation appeals, 2007–2011
New to this year’s study is an analysis of patent litigation appellate outcomes from
theFederalCircuit.Weidentifiedcasespreviouslycapturedinourdatabasewhere
a trial occurred at district court and a resulting decision was made by the bench or
jury.Wethenresearchedtheappellatestatusofsuchcasesoverarecentfive-year
period. Our analysis began with district court trial decisions that occurred between
2007 and 2011, so that the majority of cases reviewed had reached a conclusion
at the Federal Circuit by the time of publication.
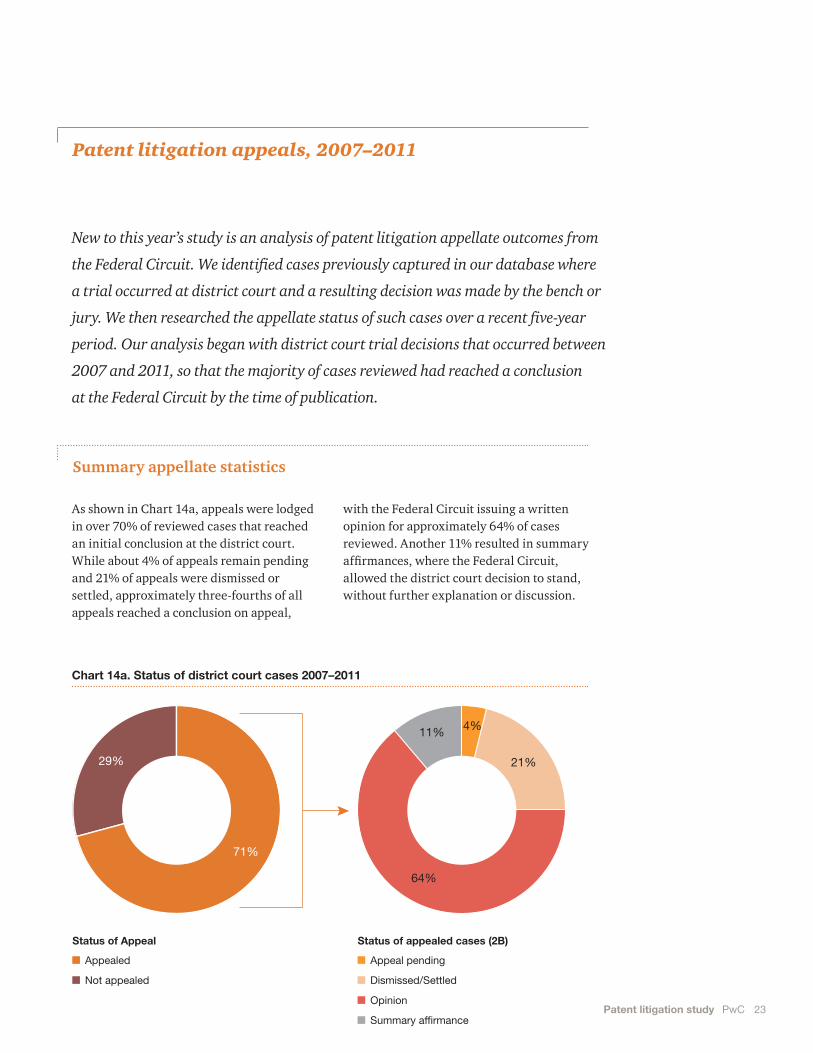
As shown in Chart 14a, appeals were lodged in over 70% of reviewed cases that reached an initial conclusion at the district court. While about 4% of appeals remain pending and 21% of appeals were dismissed or settled, approximately three-fourths of all appeals reached a conclusion on appeal,
with the Federal Circuit issuing a written opinion for approximately 64% of cases reviewed. Another 11% resulted in summary affirmances, where the Federal Circuit, allowed the district court decision to stand, without further explanation or discussion.
Appealed
Status of Appeal
Not appealed
29%
71%
Appeal pending
Status of appealed cases (2B)
Dismissed/Settled
Opinion
Summary affirmance
11%
64%
4%
21%
Chart 14a. Status of district court cases 2007–2011

24 PwC Patent litigation study
As illustrated in Chart 14b, the alleged infringer appeals more often overall (27% individually) than patent holders (19% individually). This reflects the fact that patent holders win more often at the district court (69% trial win rate in 2007–2011), and thus, have less reason to appeal. As would be expected, the “loser” of the district court case appeals more often, whether the loser is the patent holder or the alleged infringer.
Adding this perspective to the appellate equation—that is, who won and who lost at district court—gives a more nuanced view of who appeals most often. Chart 14b shows
that losing patent holders appeal more often (40% individually) than losing alleged infringers (36% individually).
Further, 10% of successful patent holders and 6% of successful alleged infringers appeal individually. This demonstrates that even a relatively favorable outcome at the district court can leave a party not fully satisfied, whether on issues regarding the patent claims themselves, product and territory coverage, damages awarded, pre-/post-judgment interest, enhanced damages, or permanent injunc tion, among other potential issues.
Which party appeals more often? It depends on your perspective…
0% 10% 20% 30% 40% 50% 60% 70% 80% 90% 100%
Patent holder success at district court
Patent holder loss at district court
Not appealed
Party appealing
Both parties appealed
Alleged infringer appealed
Patent holder appealed
28% 25% 6% 40%
29% 25% 36% 10%
% of total number of district court decisions
Overall 29% 25% 27% 19%
Chart 14b. Appeals after district court decisions 2007–2011

25PwCPatent litigation study
Appellate outcomes: a mixed bag
0%
5%
10%
15%
20%
25%
30%
35%
40%
45%
50%
55%
60%
65%
Patent holder loss at district court
Patent holder success at district court
(*) Mixed decisions are decisions in wich the appeal was both affirmed in part and reversed, vacated or remanded in part.
9%
15%
4%
7%
17%
48%
Affirm
ed in
tota
l
Rever
sed/v
acat
ed/re
man
ded
Mixe
d dec
ision
(*)
% o
f Tot
al n
umb
er o
f rec
ord
s
Chart 14c. Appeal outcome by success of patent holder in district court 2007–2011
Chart 14c shows that in total, 65% of appealed patent infringement cases were mixed decisions; that is, some aspects of the appeal were affirmed while others were reversed, remanded or vacated. Twenty-four percent of cases were affirmed in total and 11% were entirely reversed, vacated and/or remanded.
Furthermore, the likelihood of any given appeal outcome does not materially differ depending on which party won or lost the initial district court case. Regardless of which party appeals, mixed decisions are 2-3 times more likely than total affirmances, and 4-7 times more likely than decisions that are entirely reversed, remanded or vacated.

26 PwC Patent litigation study
0%
10%
20%
30%
40%
50%
60%
70%
80%
90%
100%
Affirmed in total
Mixed decision (*)
(*) Mixed decisions are decisions in wich the appeal was both affirmed in part and reversed, vacated or remanded in part.
Reversed/vacated/remanded
22%
67%
11%
Califo
rnia
North
ern
Delawar
e
New Je
rsey
New Yo
rk S
outh
ern
Texa
s Eas
tern
% o
f Tot
al n
umb
er o
f dec
ided
ap
pea
ls
30%
59%
11%
39%
61%
38%
54%
8%
21%
72%
7%
Chart 14d. Appeal outcomes from top 5 district courts 2007–2011
Chart 14d shows the distribution of appeal outcomes among the five district courts with the most appeals during the period reviewed. The Texas Eastern and California Northern districts align with the overall percentage of cases affirmed in total, in the low 20s, but a consider-ably higher rate of affirmances in total
is seen in the New Jersey and New York Southern districts. Rates of cases reversed, remanded and vacated in total were generally consistent with the overall 11% finding, with outlier observation in the New Jersey district, where no matters were completely overturned.
Results can vary by originating district

27PwCPatent litigation study
Our methodology
Tostudythetrendsrelatedtopatentdecisions,PwCidentifiedfinaldecisions
at summary judgment and trial recorded in two Westlaw databases, US
District Court Cases (DCT) and Combined Jury Verdicts and Settlements
(JV-ALL), as well as in corresponding Public Access to Court Electronic Records
(PACER) system records.
The study identified 1,985 district court patent decisions issued since 1995. Definitions for important terms used throughout the study are listed here:
• Cases decided at summary judgment include those district court patent infringement cases where a judge has issued a dispositive opinion regarding invalidity and/or infringe-ment at summary judgment.
• Cases decided at trial include those district court patent infringement cases where a decision was rendered by a judge or jury after trial.
• A success includes instances where a liability decision was made in favor of the patent holder.
• Time-to-trial is calculated from the complaint date to the first day of either the bench or jury trial for each case.
• A nonpracticing entity (NPE) is defined as an entity that does not have the capability to design, manufacture, or distribute products with features protected by the patent.

28 PwC Patent litigation study
Chris Barry has 30 years of experience in PwC’s Forensic Services practice. Mr. Barry has worked extensively in the intellectual property field, including damage quantification and testimony in infringement actions, determining reasonable royalty rates, valuing IP for transaction and financial reporting purposes, and performing royalty inspections for licensors with running rate agreements. Mr. Barry has testified at trial more than 60 times as an expert witness. He is a CPA, holding the AICPA credential of Certified in Financial Forensics. He earned a BA in accounting from Franklin & Marshall College and an MBA from the University of California at Berkeley.
Ronen Arad is a Director in PwC’s Forensic Services practice. Mr. Arad has been involved in many aspects of complex financial analyses and forensic assessments, both in the normal course of business and in the context of litigation. He has worked extensively in the intellectual property field, including quantifying damages in infringement and misappropriation actions, performing royalty inspections for licensors in a range of industries, and valuing intellectual property. Mr. Arad is a Chartered Financial Analyst (CFA) charter-holder and holds a BS degree in commerce, with concentrations in finance and accounting, from the University of Virginia.
Landan Ansell is a Manager in PwC’s Forensic Services practice in Atlanta. He specializes in financial analysis and modeling for the valuation of economic damages for commercial disputes, as well as forensic accounting matters. Mr. Ansell has over seven years of experience assisting clients in solving complex, crisis-related issues by providing litigation and investigation services, as well as financial and economic analysis, including the analysis of significant volumes of data and the development of comprehensive and user-friendly financial models. Mr. Ansell is a CPA and holds a BBA with a concentration in accounting from Emory University and a JD from Georgia State University’s College of Law.
Evan Clark is a Senior Associate in the Forensic Services practice in San Francisco. He specializes in financial modeling and analysis and focuses on the quantification of damages for business interruption claims. Mr. Clark earned a BBA with a concentration in finance from Emory University.
Our authors
Additionally,thefollowingindividualscontributedsignificantlytothisstudy:
Addis Workalemahu, Alexander E. Wagner, Amber Yang, Amy Lea, Chikako Shimura, Chad Halbur, Davida Jones, Fareed Yousif, Heather Fugate, Holly Mills, HyeYun Lee, Jennifer Beaudoin, Kyung Jin Chu, Katherine Hou, Matthew Hynes, Meredith Cartier, Miles Robinson, Nicholas Baccash, Paul Conboy, Paulina Boonman, Pichon Duplan, Sarah Stanley, Severin Ritchie, Sonia Mehta and Zhihua Wu.
© 2014 PricewaterhouseCoopers LLP, a Delaware limited liability partnership. All rights reserved. PwC refers to the US member firm, and may sometimes refer to the PwC network. Each member firm is a separate legal entity. Please see www.pwc.com/structure for further details.
This content is for general information purposes only, and should not be used as a substitute for consultation with professional advisors. PwC US helps organizations and individuals create the value they’re looking for. We’re a member of the PwC network of firms in 157 countries with more than 184,000 people who are committed to delivering quality in assurance, tax and advisory services. Tell us what matters to you and find out more by visiting us at www.pwc.com/us.
NY-14-0601
www.pwc.com
To have a deeper conversation about how this subject may affect your business, please contact:
Chris Barry (617) 530-6304 christopher.c.barry@ us.pwc.com
Kris Swanson (312) 298-6195 [email protected]
Ronen Arad (678) 419-7309 [email protected]