Embed Size (px)
Citation preview
1
2014 Online Pupil Survey Summary Report for Gloucestershire County Council
By
Pauline Foster
Foster and Brown Research
Unit 9, Cirencester office Park Tetbury Road Cirencester
Gloucestershire GL7 6JJ
E-mailmailto:[email protected]
Web address: www.fabresearchonline.co.uk
Telephone: 01285 700759
Prepared by Pauline Foster, Foster and Brown Research [email protected] September 2014
2
Online Pupil Survey 2014
Summary Report
Gloucestershire County Council
October 2014
3
Background and Scope
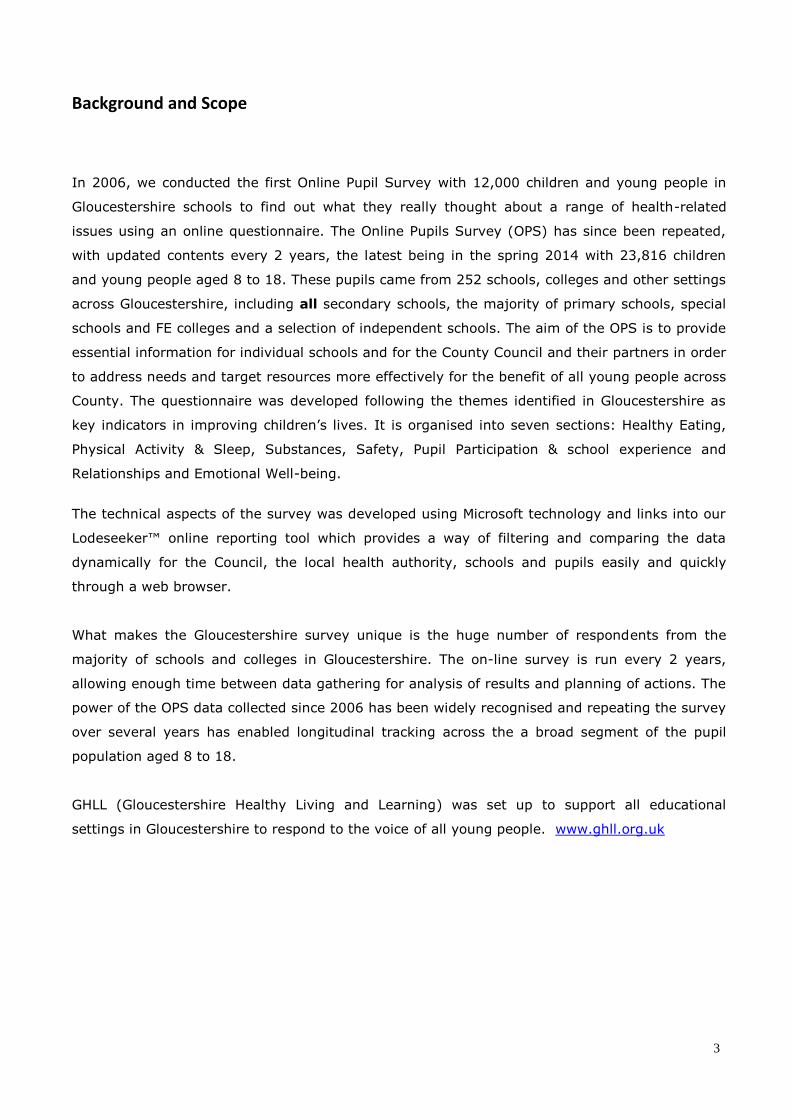
In 2006, we conducted the first Online Pupil Survey with 12,000 children and young people in
Gloucestershire schools to find out what they really thought about a range of health-related
issues using an online questionnaire. The Online Pupils Survey (OPS) has since been repeated,
with updated contents every 2 years, the latest being in the spring 2014 with 23,816 children
and young people aged 8 to 18. These pupils came from 252 schools, colleges and other settings
across Gloucestershire, including all secondary schools, the majority of primary schools, special
schools and FE colleges and a selection of independent schools. The aim of the OPS is to provide
essential information for individual schools and for the County Council and their partners in order
to address needs and target resources more effectively for the benefit of all young people across
County. The questionnaire was developed following the themes identified in Gloucestershire as
key indicators in improving children’s lives. It is organised into seven sections: Healthy Eating,
Physical Activity & Sleep, Substances, Safety, Pupil Participation & school experience and
Relationships and Emotional Well-being.
The technical aspects of the survey was developed using Microsoft technology and links into our
Lodeseeker™ online reporting tool which provides a way of filtering and comparing the data
dynamically for the Council, the local health authority, schools and pupils easily and quickly
through a web browser.
What makes the Gloucestershire survey unique is the huge number of respondents from the
majority of schools and colleges in Gloucestershire. The on-line survey is run every 2 years,
allowing enough time between data gathering for analysis of results and planning of actions. The
power of the OPS data collected since 2006 has been widely recognised and repeating the survey
over several years has enabled longitudinal tracking across the a broad segment of the pupil
population aged 8 to 18.
GHLL (Gloucestershire Healthy Living and Learning) was set up to support all educational
settings in Gloucestershire to respond to the voice of all young people. www.ghll.org.uk
4
Content Purpose and coverage of Online Pupil Survey and key findings of the survey Page 5 Demographics Page 6
1. The extent to which pupils feel safe Page 7
2. The extent to which pupils adopt healthy lifestyles Page 11
3. Relationships and emotional wellbeing Page 15
4. Citizenship and aspirations Page 16
5. The effectiveness of care, support and guidance Page 17
5
Purpose and coverage of Online Pupil Survey The Online Pupil Survey was commissioned by Gloucestershire County Council and carried out by an independent research company Foster and Brown Research. This was to develop a better understanding of our young people’s experiences of life, both inside and outside school. The aims of the survey are to help schools identify areas for improvement and address particular issues raised by their own pupils and to provide evidence to influence future services provided by the County Council and their partners that improve the health and wellbeing of our young people. The survey was first carried out in 2006 and has been repeated every 2 years, inviting all schools, including special schools, to take part on a voluntary basis. The questionnaire, which was completed online at school by pupils, was aimed at Year groups 4, 6, 8, 10 and 12. Further Education (FE) colleges were also invited to take part for the first time in 2012 and independent schools in 2014. The 2014 pupil survey, the fifth in Gloucestershire, attracted over 252 schools/FE colleges and other settings and 23,816 pupils completed an online questionnaire. This was the highest response since the survey started eight years ago. There were three versions of questionnaire designed separately for primary, secondary and Year 12/FE college pupils, plus a special version for children and young people with learning difficulties. The questions covered a wide range of aspects of young people’s lives: lifestyles; learning experience; relationships; wellbeing; safety, aspirations and support requirements.
Key findings of the Survey This summary report provides key headline findings of the survey 2014, which are structured around five key areas that have major policy implications for Gloucestershire County Council and its partners in improving our young people’s health, wellbeing and life chances: 1. The extent to which pupils feel safe
2. The extent to which pupils adopt healthy lifestyles
3. Relationships and emotional wellbeing
4. Citizenship and aspirations
5. The effectiveness of care, guidance and support
The opinions and concerns reflected in this survey suggest that the children and young people of Gloucestershire are in the main, typical of young people across the UK when compared to the national data available. The results of the Online Pupil Survey give a broad portrayal of pupil lifestyles across the county, but care should be taken when interpreting individual questions as due to the nature of the survey, there are a tremendous number of variables to take into account.
6
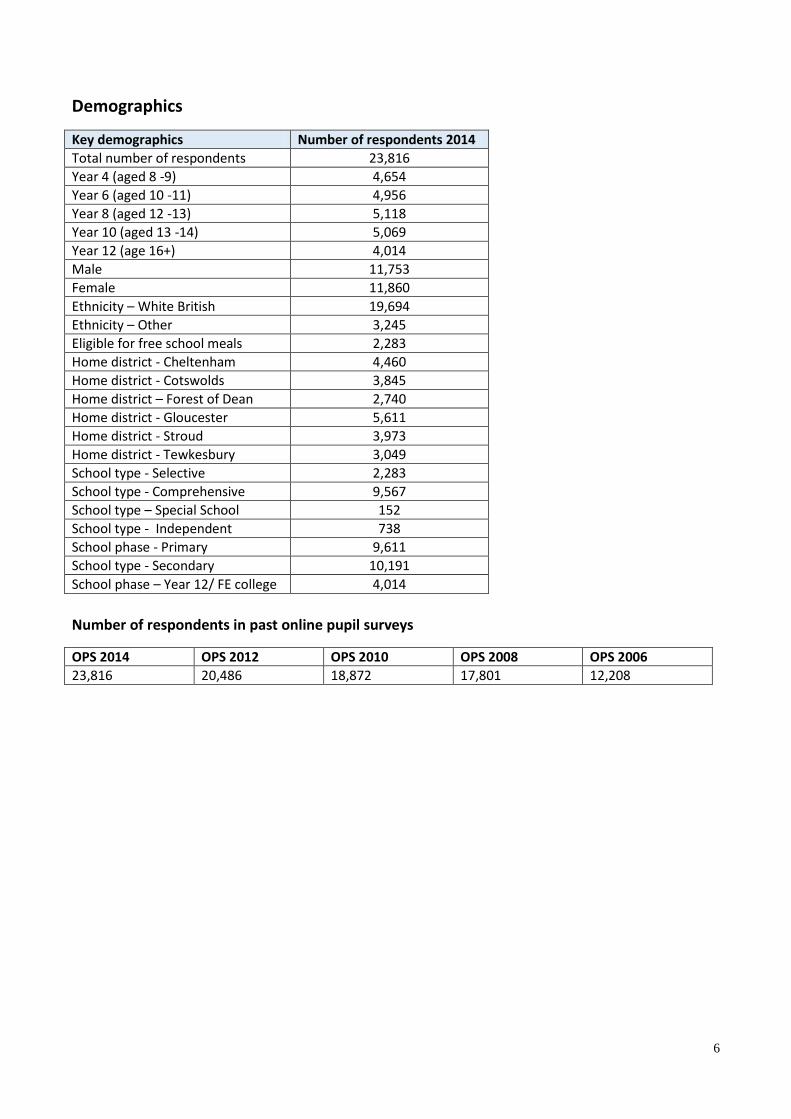
Demographics
Key demographics Number of respondents 2014
Total number of respondents 23,816
Year 4 (aged 8 -9) 4,654
Year 6 (aged 10 -11) 4,956
Year 8 (aged 12 -13) 5,118
Year 10 (aged 13 -14) 5,069
Year 12 (age 16+) 4,014
Male 11,753
Female 11,860
Ethnicity – White British 19,694
Ethnicity – Other 3,245
Eligible for free school meals 2,283
Home district - Cheltenham 4,460
Home district - Cotswolds 3,845
Home district – Forest of Dean 2,740
Home district - Gloucester 5,611
Home district - Stroud 3,973
Home district - Tewkesbury 3,049
School type - Selective 2,283
School type - Comprehensive 9,567
School type – Special School 152
School type - Independent 738
School phase - Primary 9,611
School type - Secondary 10,191
School phase – Year 12/ FE college 4,014
Number of respondents in past online pupil surveys
OPS 2014 OPS 2012 OPS 2010 OPS 2008 OPS 2006
23,816 20,486 18,872 17,801 12,208
7
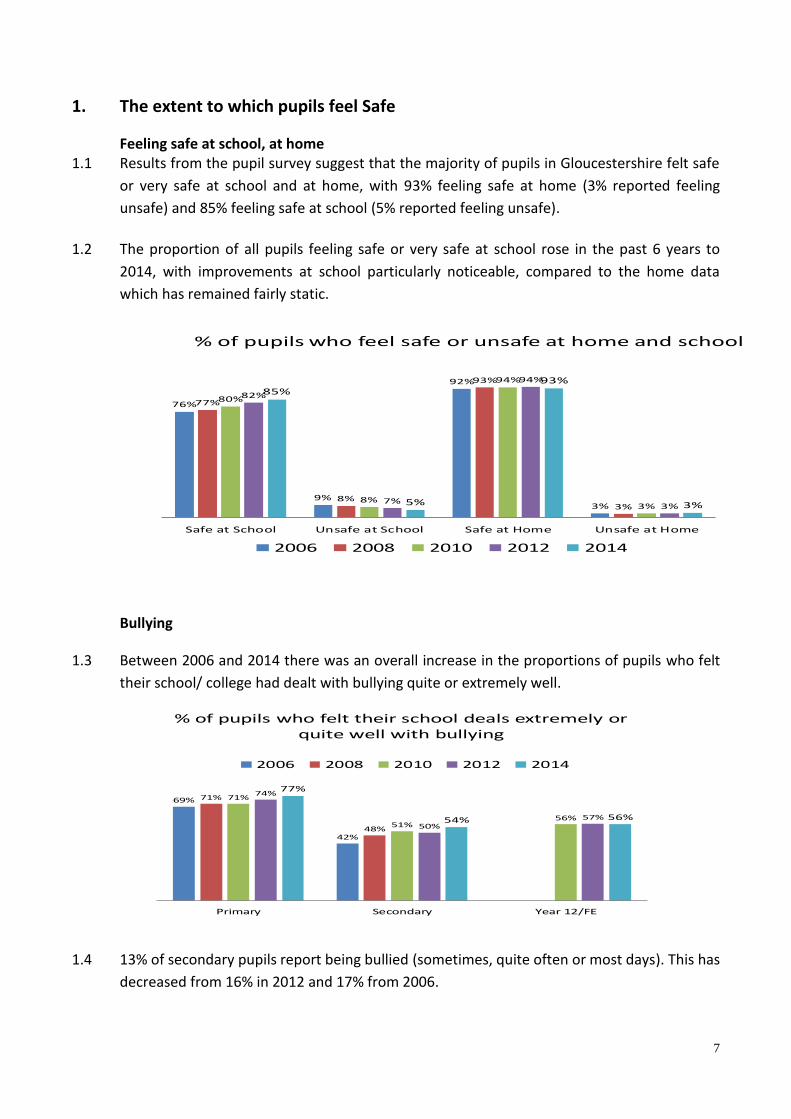
1. The extent to which pupils feel Safe
Feeling safe at school, at home 1.1 Results from the pupil survey suggest that the majority of pupils in Gloucestershire felt safe
or very safe at school and at home, with 93% feeling safe at home (3% reported feeling
unsafe) and 85% feeling safe at school (5% reported feeling unsafe).
1.2 The proportion of all pupils feeling safe or very safe at school rose in the past 6 years to
2014, with improvements at school particularly noticeable, compared to the home data
which has remained fairly static.
% of pupils who feel safe or unsafe at home and school
76%
9%
92%
3%
77%
8%
93%
3%
80%
8%
94%
3%
82%
7%
94%
3%
85%
5%
93%
3%
Safe at School Unsafe at School Safe at Home Unsafe at Home
2006 2008 2010 2012 2014
Bullying
1.3 Between 2006 and 2014 there was an overall increase in the proportions of pupils who felt
their school/ college had dealt with bullying quite or extremely well.
% of pupils who felt their school deals extremely or quite well with bullying
69%
42%
71%
48%
71%
51%56%
74%
50%57%
77%
54% 56%
Primary Secondary Year 12/FE
2006 2008 2010 2012 2014
1.4 13% of secondary pupils report being bullied (sometimes, quite often or most days). This has
decreased from 16% in 2012 and 17% from 2006.
8
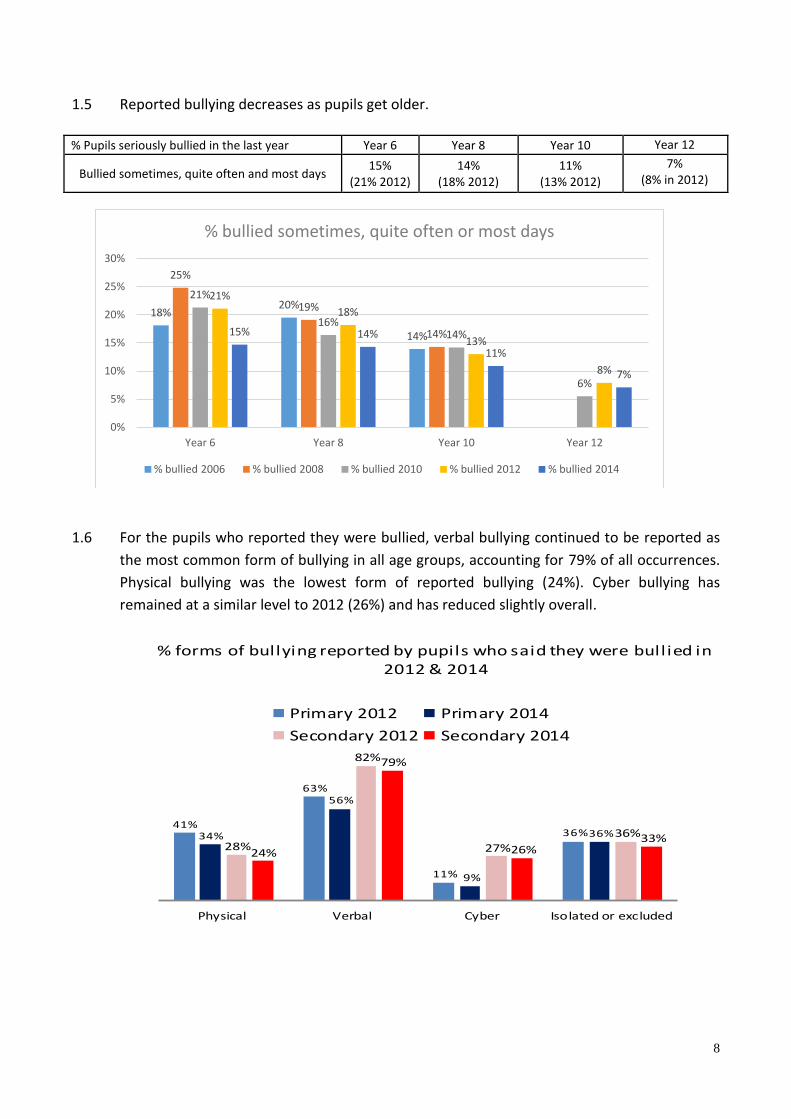
1.5 Reported bullying decreases as pupils get older.
% Pupils seriously bullied in the last year Year 6 Year 8 Year 10 Year 12
Bullied sometimes, quite often and most days 15%
(21% 2012) 14%
(18% 2012) 11%
(13% 2012)
7% (8% in 2012)
1.6 For the pupils who reported they were bullied, verbal bullying continued to be reported as
the most common form of bullying in all age groups, accounting for 79% of all occurrences.
Physical bullying was the lowest form of reported bullying (24%). Cyber bullying has
remained at a similar level to 2012 (26%) and has reduced slightly overall.
% forms of bullying reported by pupils who said they were bullied in 2012 & 2014
41%
63%
11%
36%34%
56%
9%
36%
28%
82%
27%
36%
24%
79%
26%33%
Physical Verbal Cyber Isolated or excluded
Primary 2012 Primary 2014
Secondary 2012 Secondary 2014
18% 20%
14%
25%
19%
14%
21%
16% 14%
6%
21%
18%
13%
8%
15% 14%
11%
7%
0%
5%
10%
15%
20%
25%
30%
Year 6 Year 8 Year 10 Year 12
% bullied sometimes, quite often or most days
% bullied 2006 % bullied 2008 % bullied 2010 % bullied 2012 % bullied 2014
9
Domestic Abuse
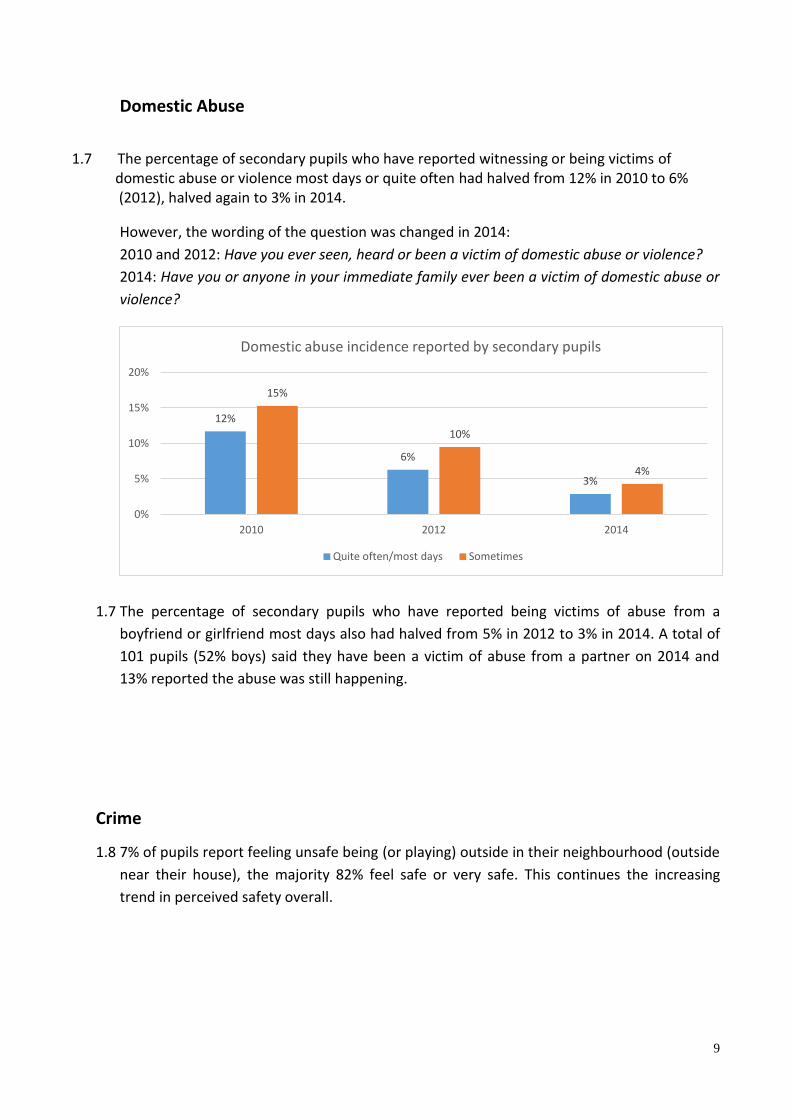
1.7 The percentage of secondary pupils who have reported witnessing or being victims of domestic abuse or violence most days or quite often had halved from 12% in 2010 to 6% (2012), halved again to 3% in 2014.
However, the wording of the question was changed in 2014:
2010 and 2012: Have you ever seen, heard or been a victim of domestic abuse or violence?
2014: Have you or anyone in your immediate family ever been a victim of domestic abuse or
violence?
1.7 The percentage of secondary pupils who have reported being victims of abuse from a
boyfriend or girlfriend most days also had halved from 5% in 2012 to 3% in 2014. A total of
101 pupils (52% boys) said they have been a victim of abuse from a partner on 2014 and
13% reported the abuse was still happening.
Crime
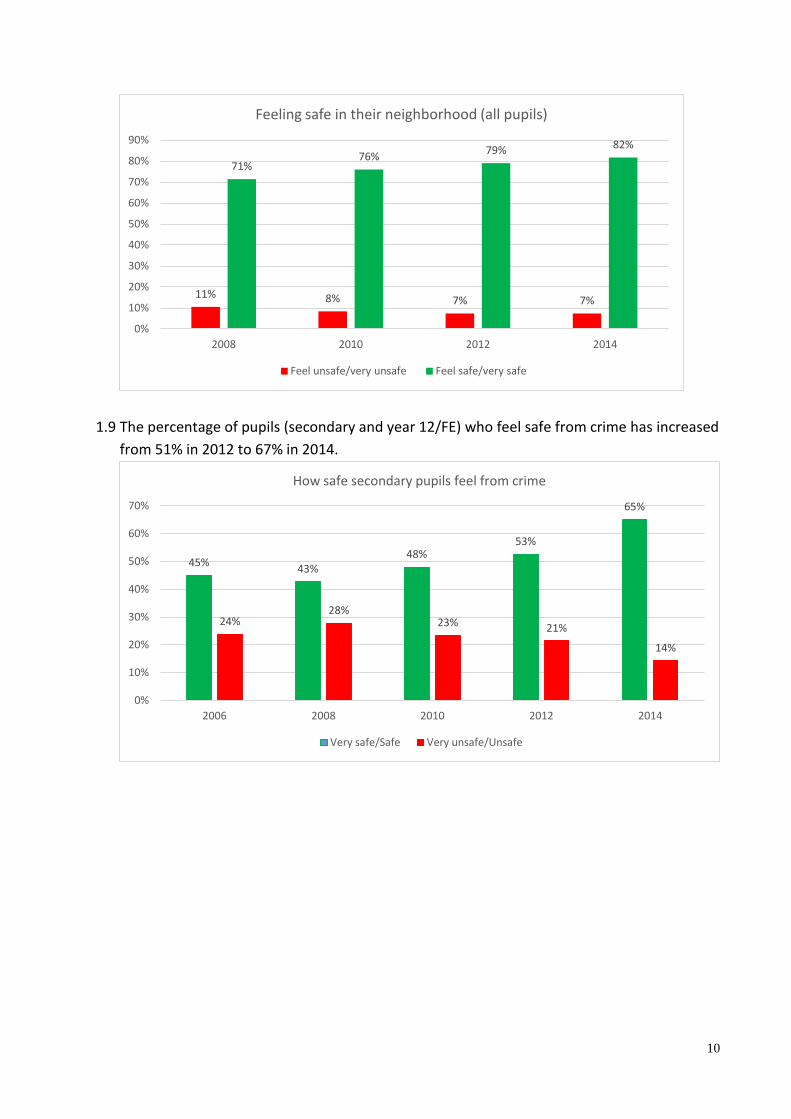
1.8 7% of pupils report feeling unsafe being (or playing) outside in their neighbourhood (outside
near their house), the majority 82% feel safe or very safe. This continues the increasing
trend in perceived safety overall.
12%
6%
3%
15%
10%
4%
0%
5%
10%
15%
20%
2010 2012 2014
Domestic abuse incidence reported by secondary pupils
Quite often/most days Sometimes
10
1.9 The percentage of pupils (secondary and year 12/FE) who feel safe from crime has increased
from 51% in 2012 to 67% in 2014.
11% 8% 7% 7%
71% 76%
79% 82%
0%
10%
20%
30%
40%
50%
60%
70%
80%
90%
2008 2010 2012 2014
Feeling safe in their neighborhood (all pupils)
Feel unsafe/very unsafe Feel safe/very safe
45% 43%
48% 53%
65%
24% 28%
23% 21%
14%
0%
10%
20%
30%
40%
50%
60%
70%
2006 2008 2010 2012 2014
How safe secondary pupils feel from crime
Very safe/Safe Very unsafe/Unsafe
11
2. The extent to which pupils adopt healthy lifestyles
Healthy eating
2.1 The survey found that the 76% of pupils ate breakfast regularly every morning or usually
every morning) in 2014; this is similar to 2012 (74%) and 2010 (75%). The number of pupils
who eat breakfast declines as pupils get older. Girls consistently eat breakfast less
frequently than boys. Only 64% of girls in Year 10 usually eat breakfast compared to 89% in
Year 4. At secondary school, 17% of boys report never or not often eating their breakfast,
compared to 30% of girls.
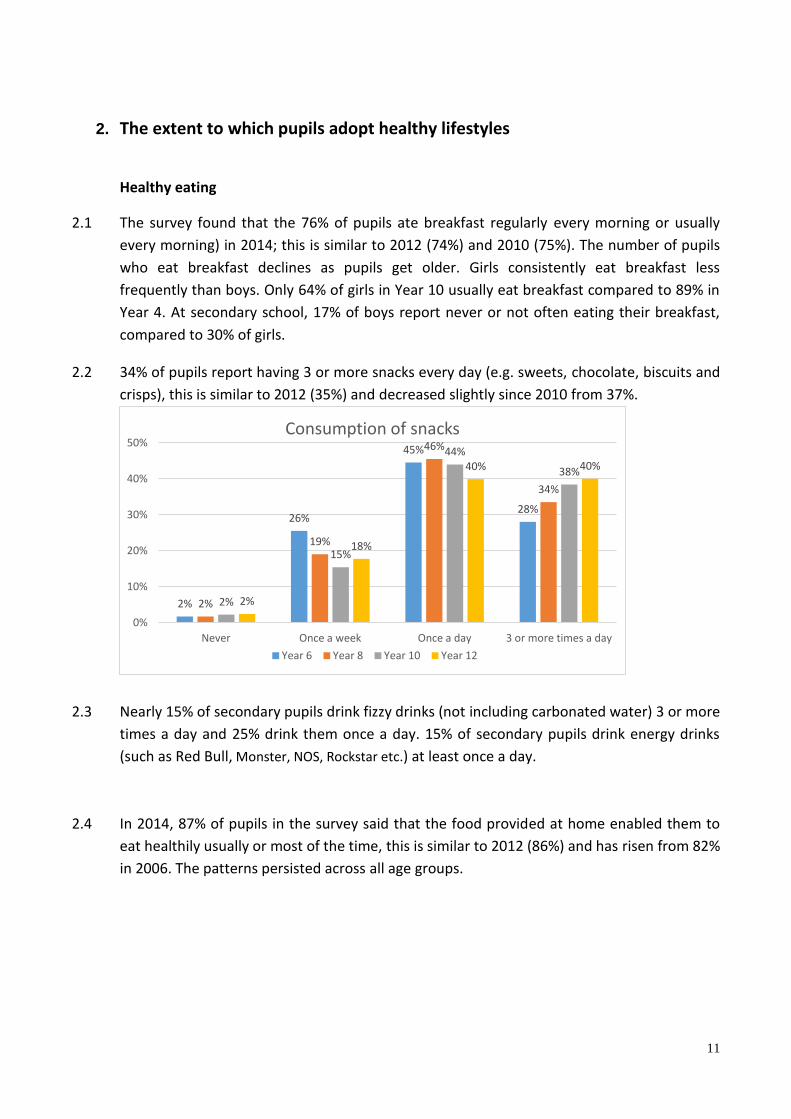
2.2 34% of pupils report having 3 or more snacks every day (e.g. sweets, chocolate, biscuits and
crisps), this is similar to 2012 (35%) and decreased slightly since 2010 from 37%.
2.3 Nearly 15% of secondary pupils drink fizzy drinks (not including carbonated water) 3 or more
times a day and 25% drink them once a day. 15% of secondary pupils drink energy drinks
(such as Red Bull, Monster, NOS, Rockstar etc.) at least once a day.
2.4 In 2014, 87% of pupils in the survey said that the food provided at home enabled them to
eat healthily usually or most of the time, this is similar to 2012 (86%) and has risen from 82%
in 2006. The patterns persisted across all age groups.
2%
26%
45%
28%
2%
19%
46%
34%
2%
15%
44%
38%
2%
18%
40% 40%
0%
10%
20%
30%
40%
50%
Never Once a week Once a day 3 or more times a day
Consumption of snacks
Year 6 Year 8 Year 10 Year 12
12
Physical activity
2.5 75% of pupils in the county had at least 4 hours of physical activity (including play) each
week and the proportion has remained at a similar level since the survey began 6 years ago.
80% of pupils in secondary schools took part in physical activity for at least 4 hours a week,
compared to 74% of primary pupils.
2.6 The survey found that in primary and secondary phases, the proportion of girls doing at least
4 hours of physical activity (70%) each week was lower than boys (80%). This drops to 50%
of girls and 73% of boys in year 12/FE.
2.7 82% of pupils felt they did enough exercise to keep them healthy (78% of girls and 86% of
boys).
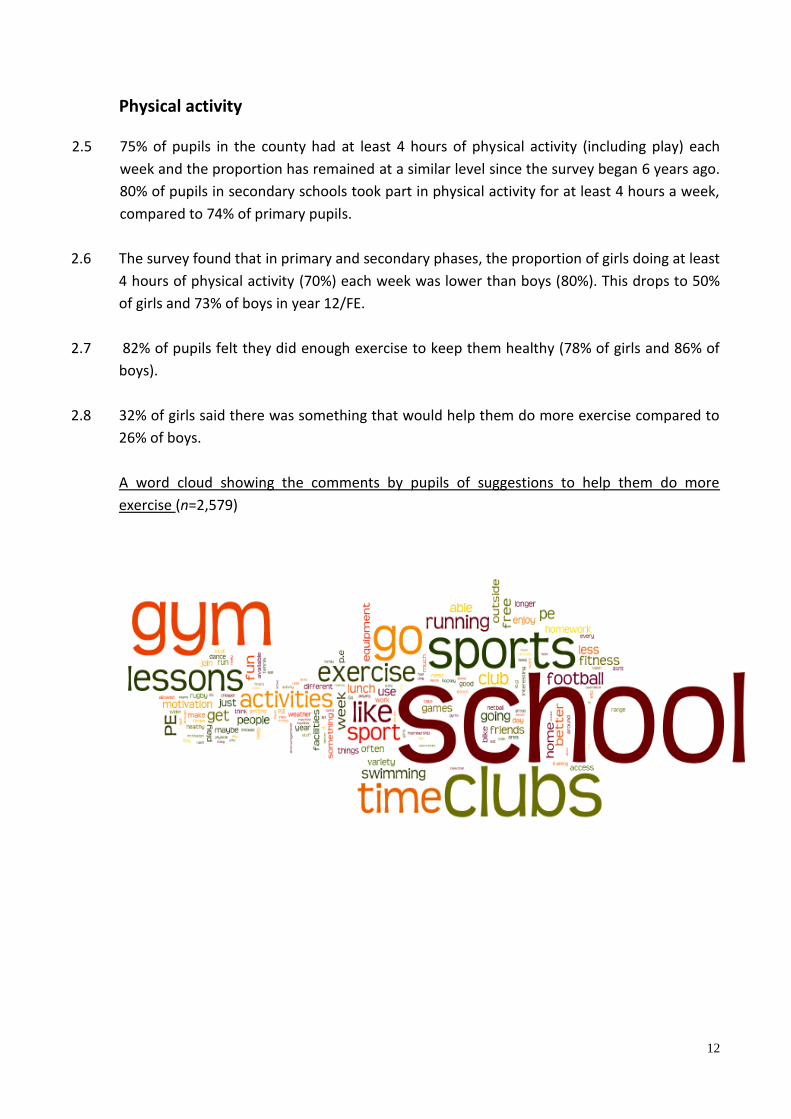
2.8 32% of girls said there was something that would help them do more exercise compared to
26% of boys.
A word cloud showing the comments by pupils of suggestions to help them do more
exercise (n=2,579)
13
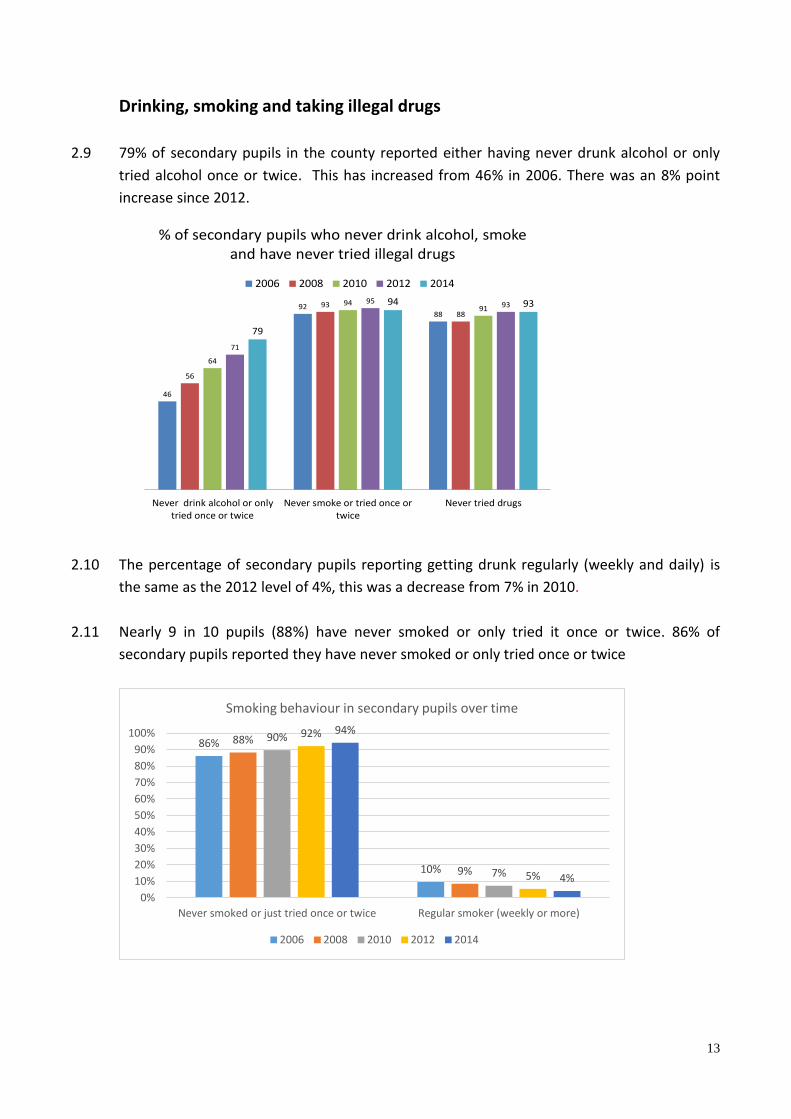
Drinking, smoking and taking illegal drugs
2.9 79% of secondary pupils in the county reported either having never drunk alcohol or only
tried alcohol once or twice. This has increased from 46% in 2006. There was an 8% point
increase since 2012.
2.10 The percentage of secondary pupils reporting getting drunk regularly (weekly and daily) is
the same as the 2012 level of 4%, this was a decrease from 7% in 2010.
2.11 Nearly 9 in 10 pupils (88%) have never smoked or only tried it once or twice. 86% of
secondary pupils reported they have never smoked or only tried once or twice
86%
10%
88%
9%
90%
7%
92%
5%
94%
4%
0%
10%
20%
30%
40%
50%
60%
70%
80%
90%
100%
Never smoked or just tried once or twice Regular smoker (weekly or more)
Smoking behaviour in secondary pupils over time
2006 2008 2010 2012 2014
% of secondary pupils who never drink alcohol, smoke and have never tried illegal drugs
46
9288
56
9388
64
9491
71
95 93
79
94 93
Never drink alcohol or onlytried once or twice
Never smoke or tried once ortwice
Never tried drugs
2006 2008 2010 2012 2014
14
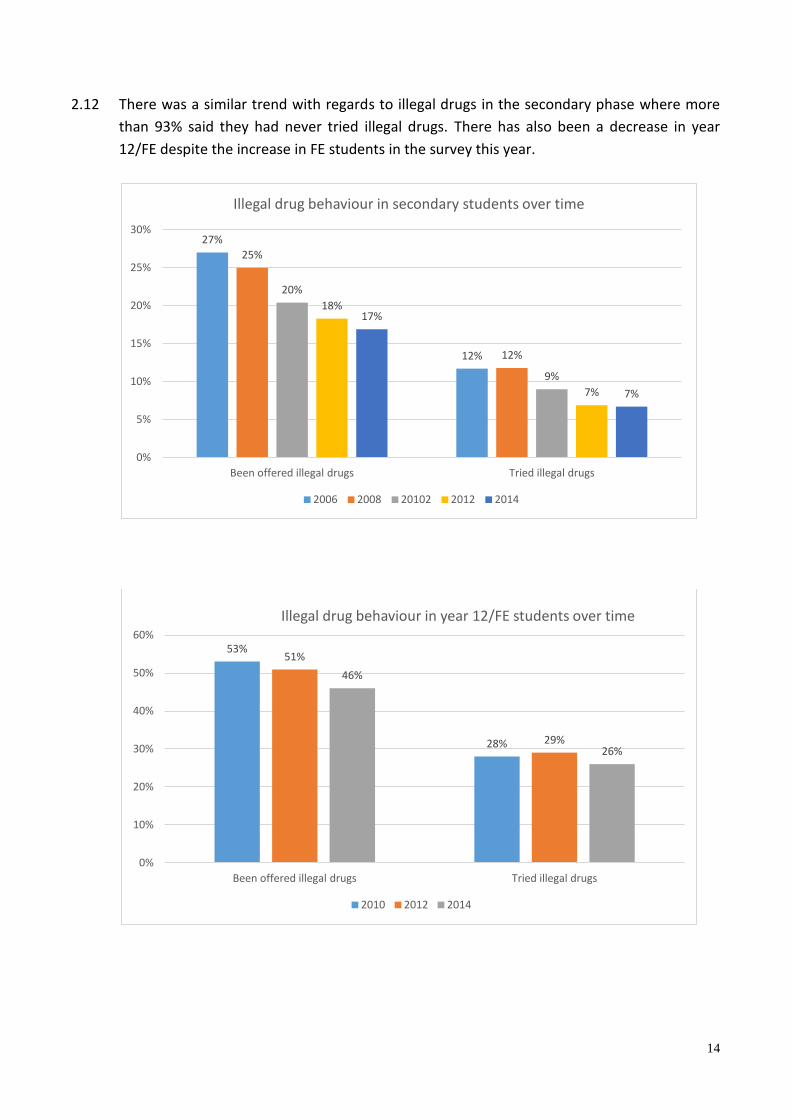
2.12 There was a similar trend with regards to illegal drugs in the secondary phase where more
than 93% said they had never tried illegal drugs. There has also been a decrease in year
12/FE despite the increase in FE students in the survey this year.
27%
12%
25%
12%
20%
9%
18%
7%
17%
7%
0%
5%
10%
15%
20%
25%
30%
Been offered illegal drugs Tried illegal drugs
Illegal drug behaviour in secondary students over time
2006 2008 20102 2012 2014
53%
28%
51%
29%
46%
26%
0%
10%
20%
30%
40%
50%
60%
Been offered illegal drugs Tried illegal drugs
Illegal drug behaviour in year 12/FE students over time
2010 2012 2014
15
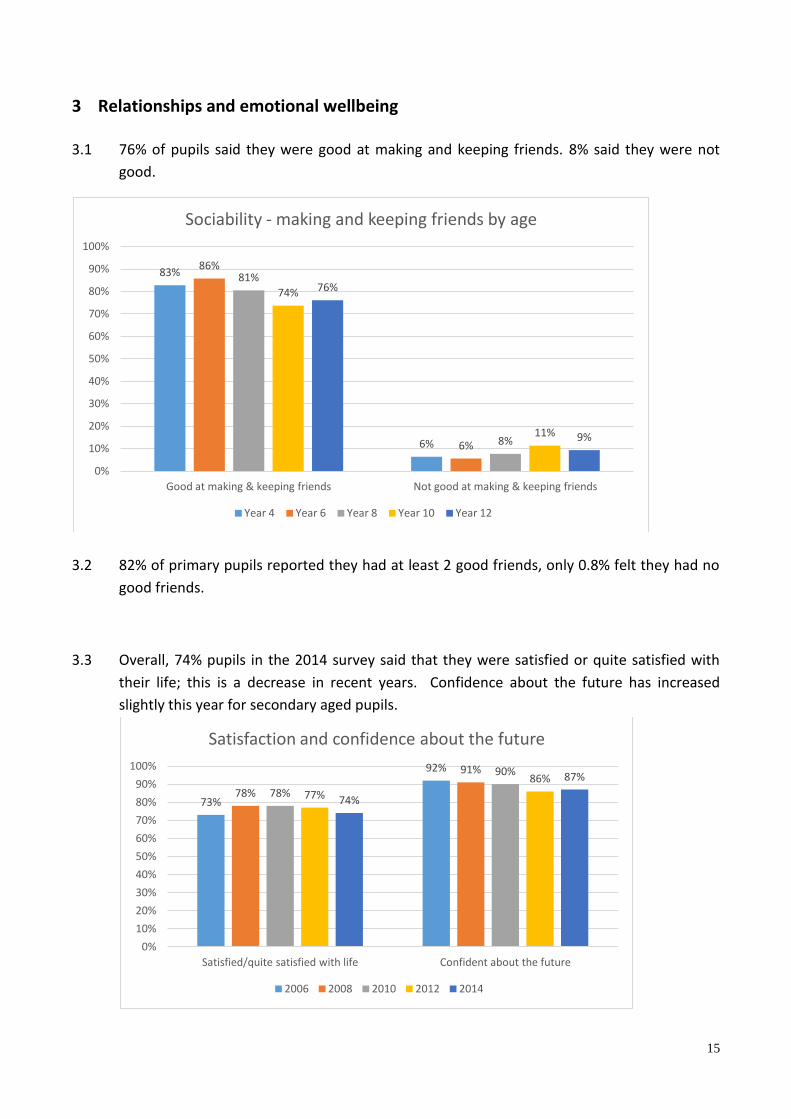
3 Relationships and emotional wellbeing
3.1 76% of pupils said they were good at making and keeping friends. 8% said they were not
good.
3.2 82% of primary pupils reported they had at least 2 good friends, only 0.8% felt they had no
good friends.
3.3 Overall, 74% pupils in the 2014 survey said that they were satisfied or quite satisfied with
their life; this is a decrease in recent years. Confidence about the future has increased
slightly this year for secondary aged pupils.
83%
6%
86%
6%
81%
8%
74%
11%
76%
9%
0%
10%
20%
30%
40%
50%
60%
70%
80%
90%
100%
Good at making & keeping friends Not good at making & keeping friends
Sociability - making and keeping friends by age
Year 4 Year 6 Year 8 Year 10 Year 12
73%
92%
78%
91%
78%
90%
77%
86%
74%
87%
0%
10%
20%
30%
40%
50%
60%
70%
80%
90%
100%
Satisfied/quite satisfied with life Confident about the future
Satisfaction and confidence about the future
2006 2008 2010 2012 2014
16
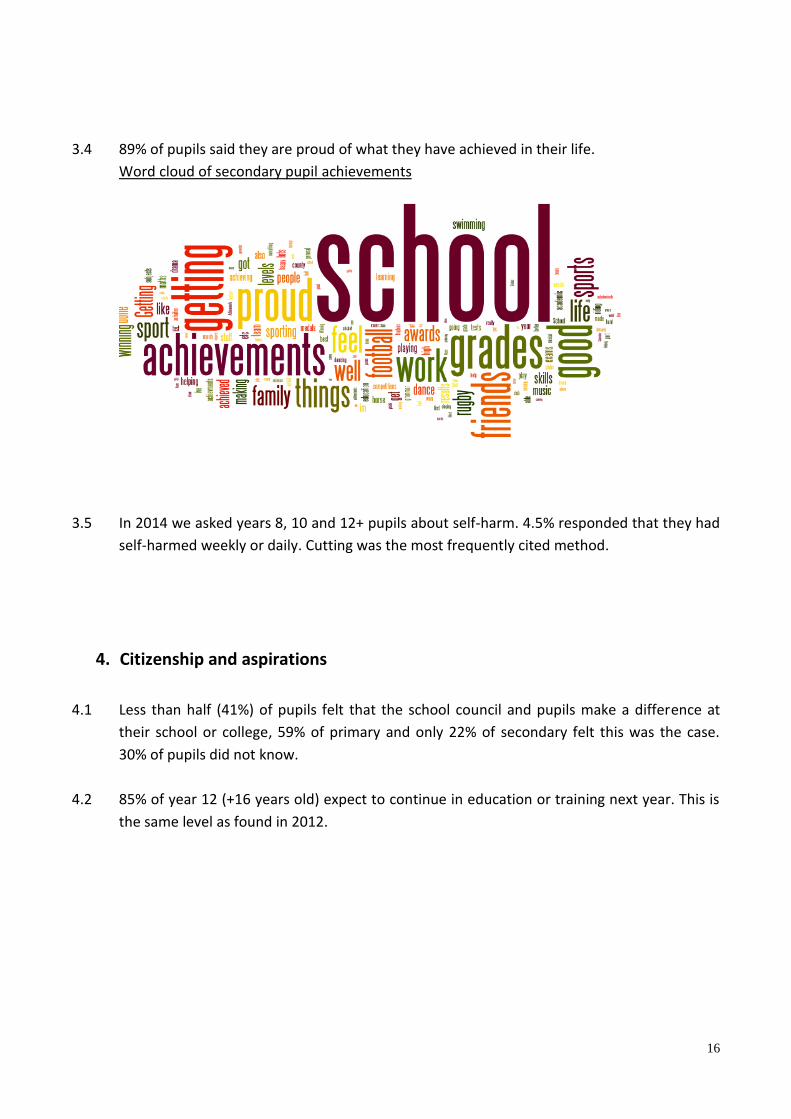
3.4 89% of pupils said they are proud of what they have achieved in their life.
Word cloud of secondary pupil achievements
3.5 In 2014 we asked years 8, 10 and 12+ pupils about self-harm. 4.5% responded that they had
self-harmed weekly or daily. Cutting was the most frequently cited method.
4. Citizenship and aspirations
4.1 Less than half (41%) of pupils felt that the school council and pupils make a difference at
their school or college, 59% of primary and only 22% of secondary felt this was the case.
30% of pupils did not know.
4.2 85% of year 12 (+16 years old) expect to continue in education or training next year. This is
the same level as found in 2012.
17
5. The effectiveness of care, support and guidance
Part of the Online Pupil Survey was to gather views from our young people on the support and guidance that they had obtained or sought on areas that mattered to them. The findings are important for schools and all agencies to review how effective the care and support is that they currently provide to our young people, and to help identify areas where improvements are needed in the future.
5.1 Secondary pupils and year 12 young people were asked who they were most likely to go to
for further help and advice about contraception/ not getting pregnant or preventing STI’s.
As pupils got older, friends became the main people they would go to for further help or
advice about sex and relationships. Parents, siblings and other family members also
remained key sources of guidance for older pupils.
Summary The Gloucestershire Online Pupil Survey is funded by Gloucestershire County Council, and facilitated by the Gloucestershire Healthy Living and Learning Team, on behalf of Gloucestershire’s Children’s Partnership in partnership with local schools, colleges, independents, alternative provision and other local agencies. We initially developed the survey with Gloucestershire County Council and health partners in 2005 and the full survey was run in 2006, 2008, 2010, 2012 and most recently in the spring term of 2014 with schools, colleges and other educational settings across Gloucestershire. It is run as on-going partnership project, envisaged to be run every 2 years following a cohort of children from year 4 to year 12.