Embed Size (px)
Citation preview
www.intertek.com 1
2 March 2015
Wolfhart Hauser Chief Executive Officer
Edward Leigh Chief Financial Officer
2014 Full Year Results Presentation
www.intertek.com 2
Edward Leigh Chief Financial Officer
Financial Performance
2014 Full Year Results Presentation
www.intertek.com 3
This presentation contains certain forward-looking statements with respect to the financial condition, results, operations and business of Intertek Group plc. These statements and forecasts involve risk and uncertainty because they relate to events and depend upon circumstances that will occur in the future. There are a number of factors that could cause actual results or developments to differ materially from those expressed or implied by these forward-looking statements and forecasts. Nothing in this presentation should be construed as a profit forecast.
2 March 2015
Cautionary statement regarding forward-looking statements
www.intertek.com 4
Results Overview
• Good growth across most businesses and geographies
• Specific revenue headwinds
• Focus on cash management and profitability
• Dividend up 6.7%
www.intertek.com 5
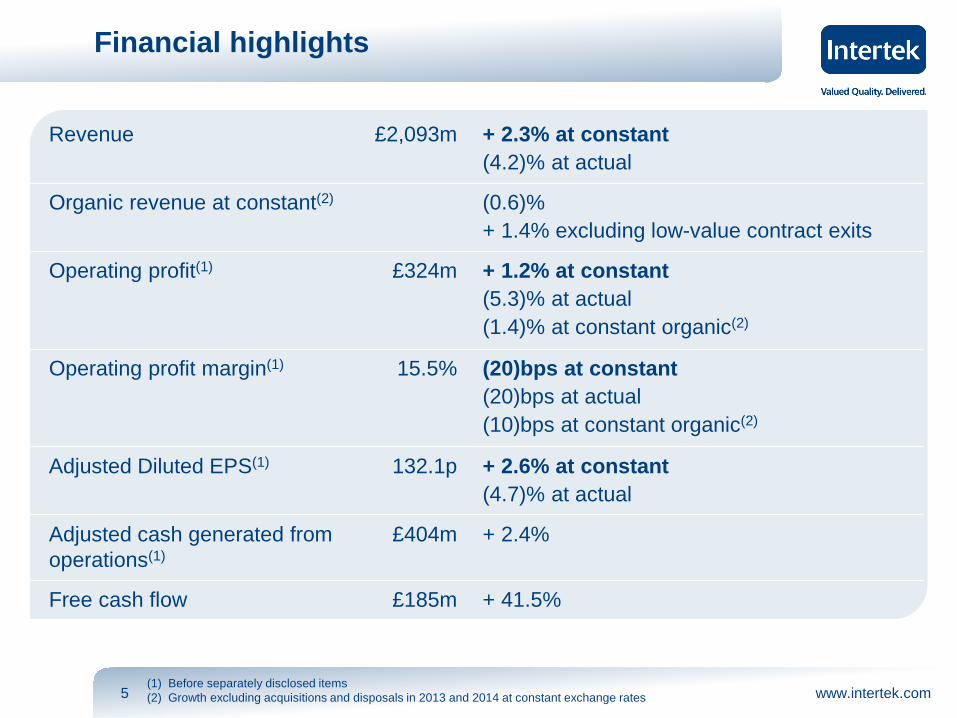
Revenue £2,093m + 2.3% at constant (4.2)% at actual
Organic revenue at constant(2)
(0.6)%
+ 1.4% excluding low-value contract exits
Operating profit(1) £324m + 1.2% at constant (5.3)% at actual (1.4)% at constant organic(2)
Operating profit margin(1) 15.5% (20)bps at constant (20)bps at actual (10)bps at constant organic(2)
Adjusted Diluted EPS(1) 132.1p + 2.6% at constant (4.7)% at actual
Adjusted cash generated from operations(1)
£404m + 2.4%
Free cash flow £185m + 41.5%
Financial highlights
(1) Before separately disclosed items (2) Growth excluding acquisitions and disposals in 2013 and 2014 at constant exchange rates
www.intertek.com 6
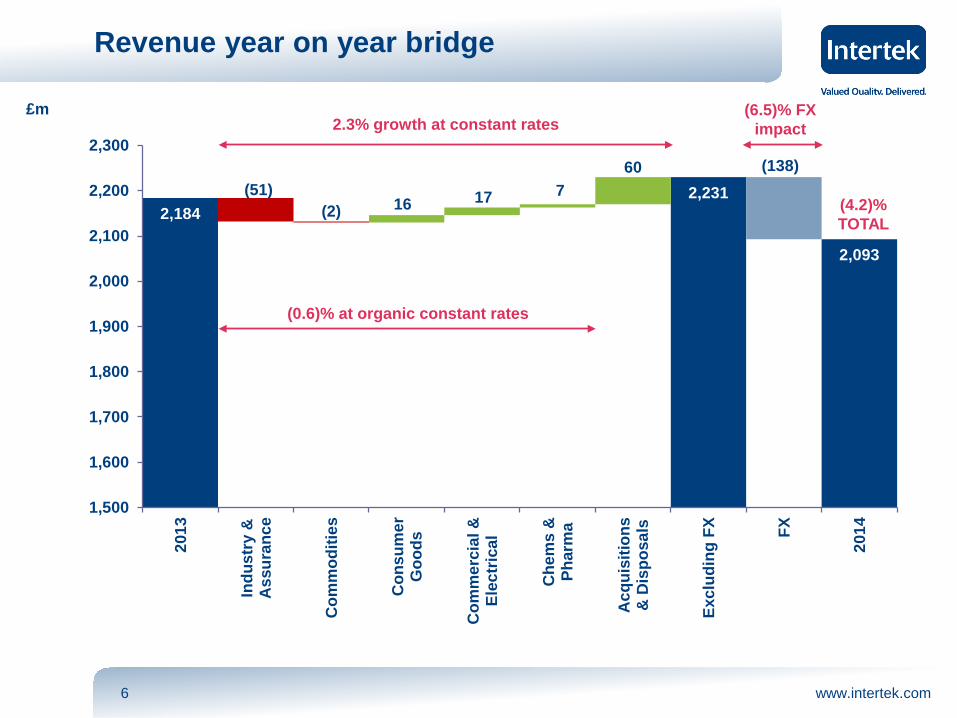
2,184 2,231
2,093
(51) (2) 16 17 7
60 (138)
1,500
1,600
1,700
1,800
1,900
2,000
2,100
2,200
2,300
2013
Indu
stry
&A
ssur
ance
Com
mod
ities
Con
sum
erG
oods
Com
mer
cial
&El
ectr
ical
Che
ms
&Ph
arm
a
Acq
uisi
tions
& D
ispo
sals
Excl
udin
g FX FX
2014
£m
Revenue year on year bridge
2.3% growth at constant rates
(0.6)% at organic constant rates
(6.5)% FX impact
(4.2)% TOTAL
www.intertek.com 7
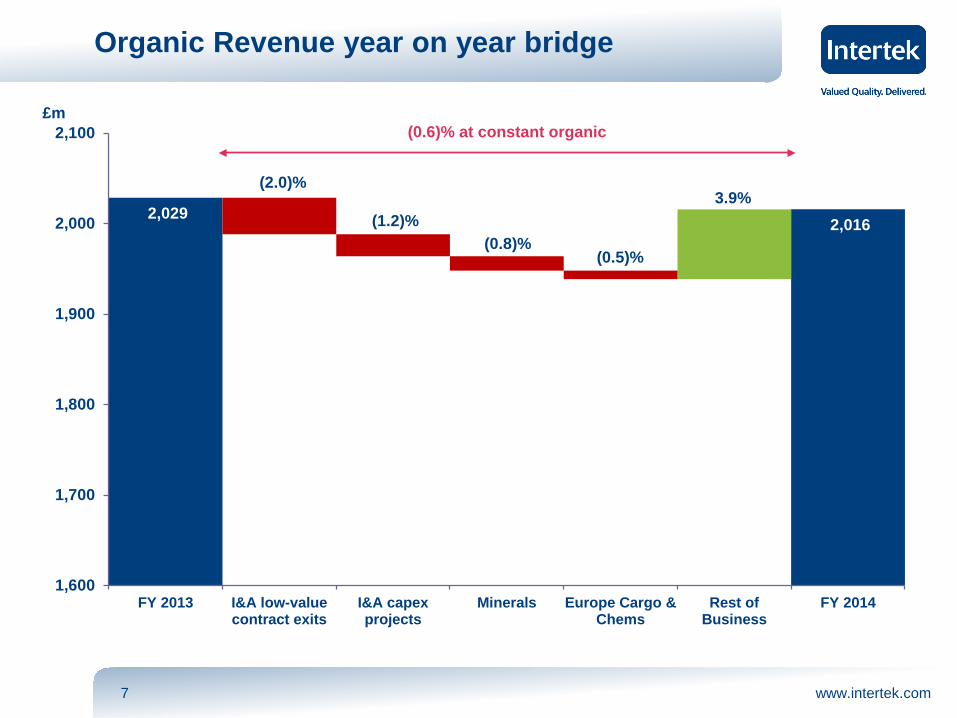
Organic Revenue year on year bridge
2,029 2,016
3.9% (2.0)%
(1.2)% (0.8)%
(0.5)%
1,600
1,700
1,800
1,900
2,000
2,100
FY 2013 I&A low-valuecontract exits
I&A capexprojects
Minerals Europe Cargo &Chems
Rest ofBusiness
FY 2014
£m (0.6)% at constant organic
www.intertek.com 8
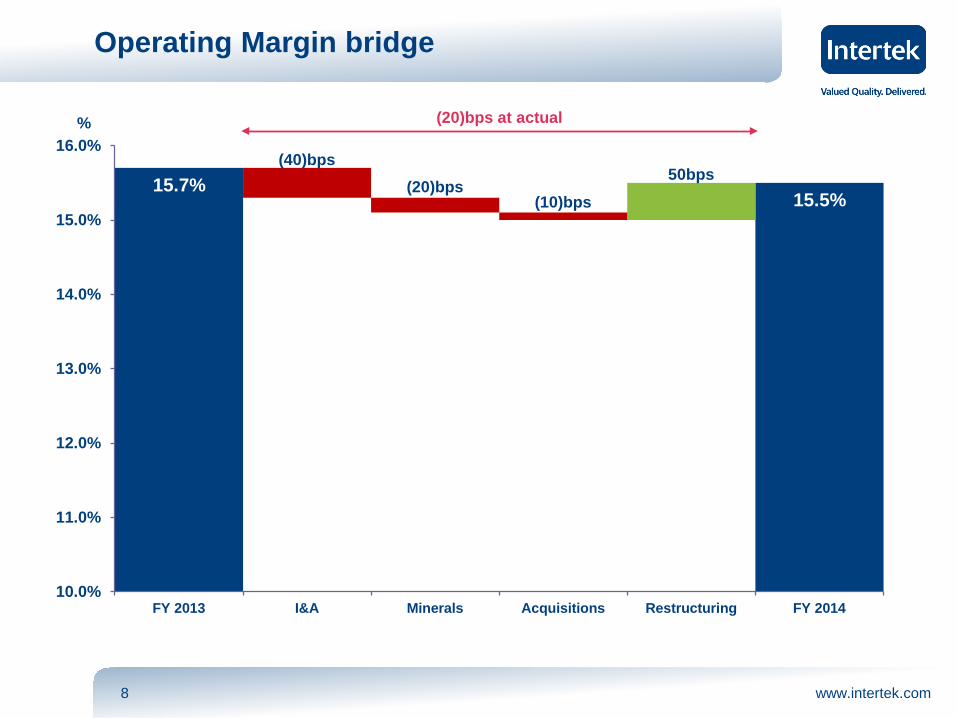
15.7% 15.5%
50bps (40)bps
(20)bps (10)bps
10.0%
11.0%
12.0%
13.0%
14.0%
15.0%
16.0%
FY 2013 I&A Minerals Acquisitions Restructuring FY 2014
%
Operating Margin bridge
(20)bps at actual
www.intertek.com 9
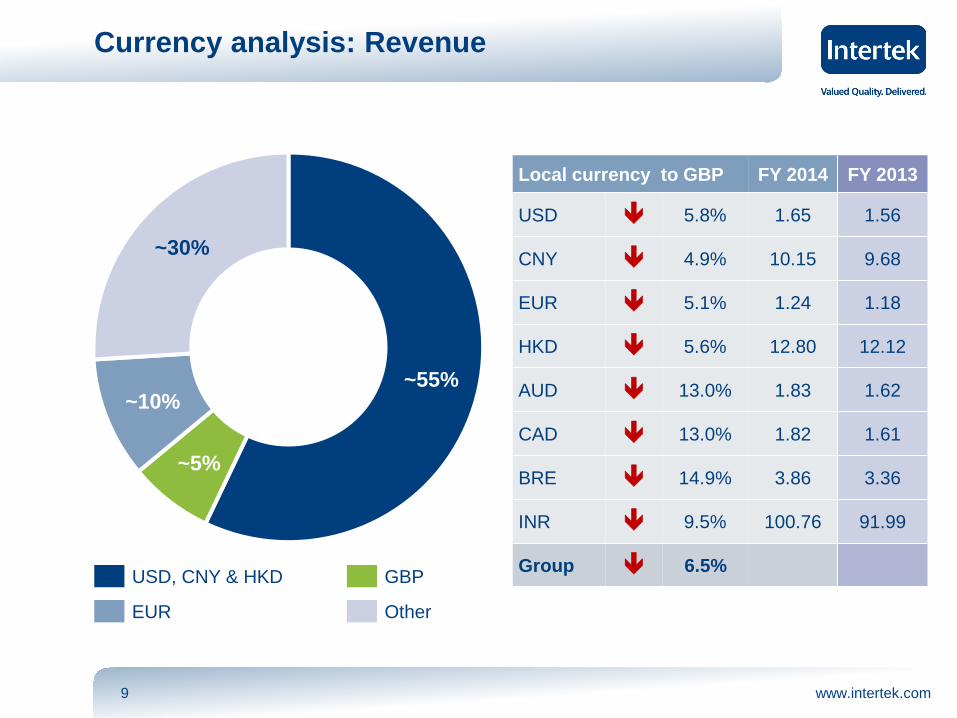
~55%
~5%
~10%
~30%
Currency analysis: Revenue
USD, CNY & HKD GBP
EUR Other
Local currency to GBP FY 2014 FY 2013
USD 5.8% 1.65 1.56
CNY 4.9% 10.15 9.68
EUR 5.1% 1.24 1.18
HKD 5.6% 12.80 12.12
AUD 13.0% 1.83 1.62
CAD 13.0% 1.82 1.61
BRE 14.9% 3.86 3.36
INR 9.5% 100.76 91.99
Group 6.5%
www.intertek.com 10
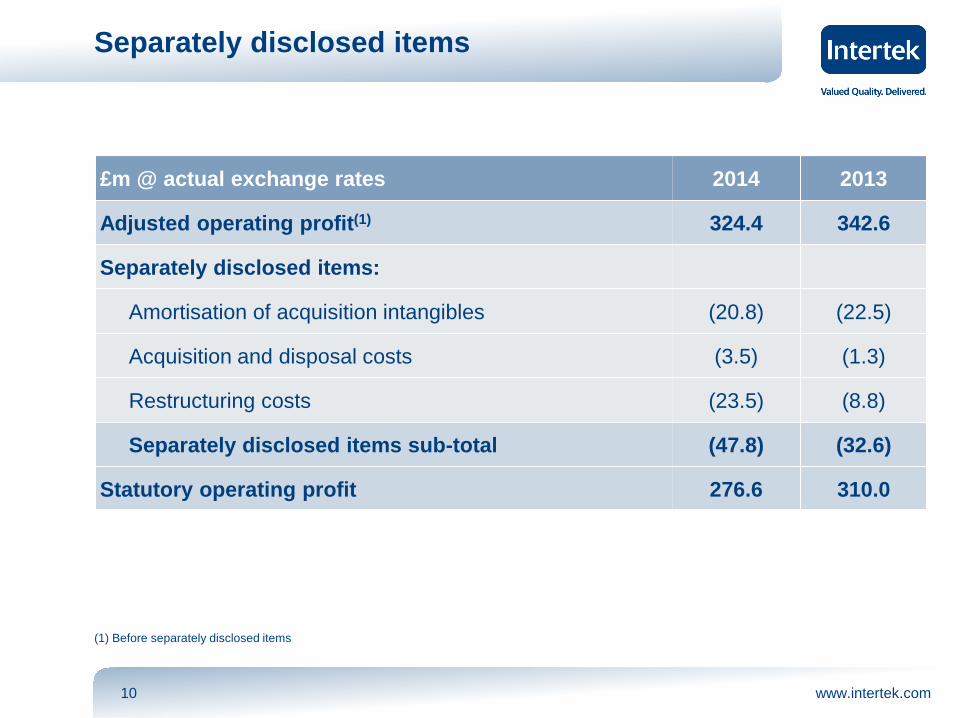
Separately disclosed items
£m @ actual exchange rates 2014 2013
Adjusted operating profit(1) 324.4 342.6
Separately disclosed items:
Amortisation of acquisition intangibles (20.8) (22.5)
Acquisition and disposal costs (3.5) (1.3)
Restructuring costs (23.5) (8.8)
Separately disclosed items sub-total (47.8) (32.6)
Statutory operating profit 276.6 310.0
(1) Before separately disclosed items
www.intertek.com 11
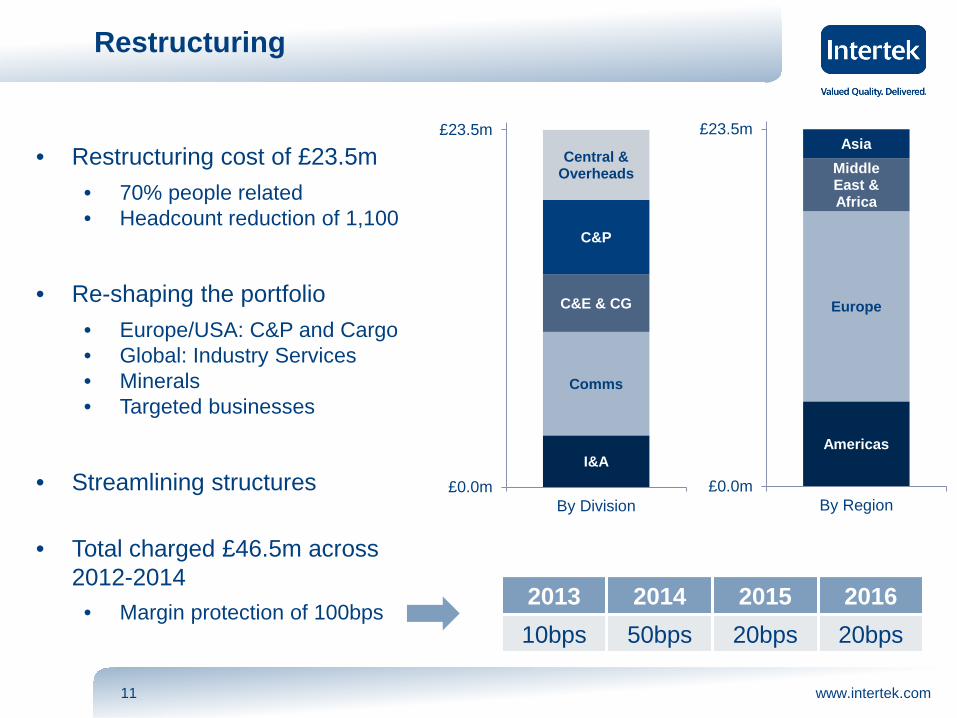
Restructuring
I&A
Comms
C&E & CG
C&P
Central & Overheads
£0.0m
£23.5m
By Division
Americas
Europe
Middle East & Africa
Asia
£0.0m
£23.5m
By Region
• Restructuring cost of £23.5m • 70% people related • Headcount reduction of 1,100
• Re-shaping the portfolio • Europe/USA: C&P and Cargo • Global: Industry Services • Minerals • Targeted businesses
• Streamlining structures
• Total charged £46.5m across 2012-2014
• Margin protection of 100bps
2013 2014 2015 2016 10bps 50bps 20bps 20bps
www.intertek.com 12
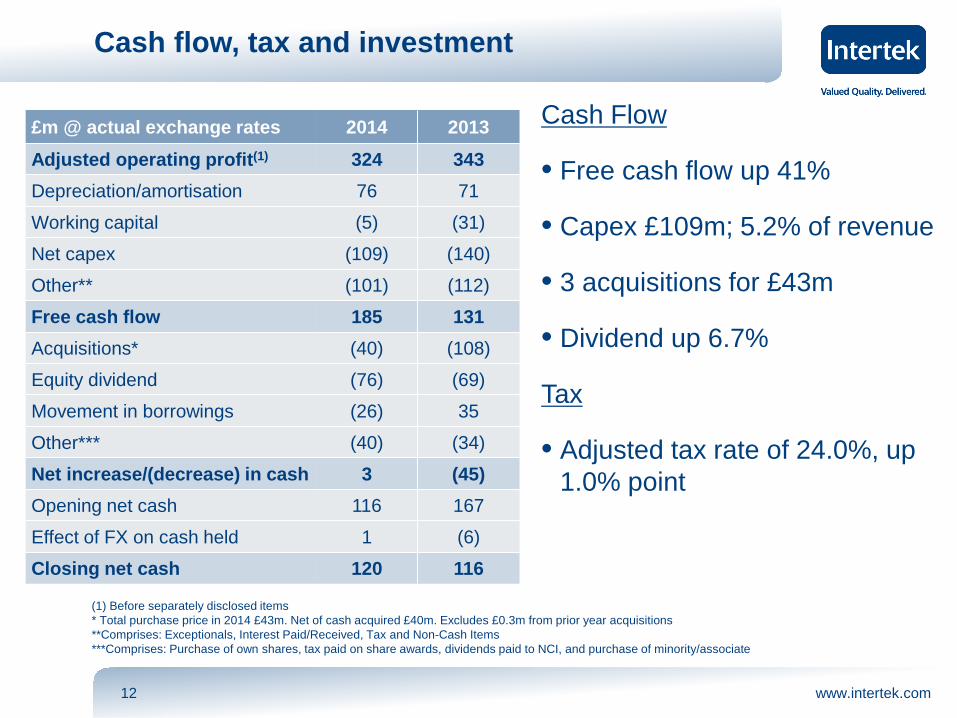
Cash flow, tax and investment
+3%
£m @ actual exchange rates 2014 2013 Adjusted operating profit(1) 324 343 Depreciation/amortisation 76 71 Working capital (5) (31) Net capex (109) (140) Other** (101) (112) Free cash flow 185 131 Acquisitions* (40) (108) Equity dividend (76) (69) Movement in borrowings (26) 35 Other*** (40) (34) Net increase/(decrease) in cash 3 (45) Opening net cash 116 167 Effect of FX on cash held 1 (6) Closing net cash 120 116
(1) Before separately disclosed items * Total purchase price in 2014 £43m. Net of cash acquired £40m. Excludes £0.3m from prior year acquisitions **Comprises: Exceptionals, Interest Paid/Received, Tax and Non-Cash Items ***Comprises: Purchase of own shares, tax paid on share awards, dividends paid to NCI, and purchase of minority/associate
Cash Flow
• Free cash flow up 41%
• Capex £109m; 5.2% of revenue
• 3 acquisitions for £43m
• Dividend up 6.7%
Tax
• Adjusted tax rate of 24.0%, up 1.0% point
www.intertek.com 13
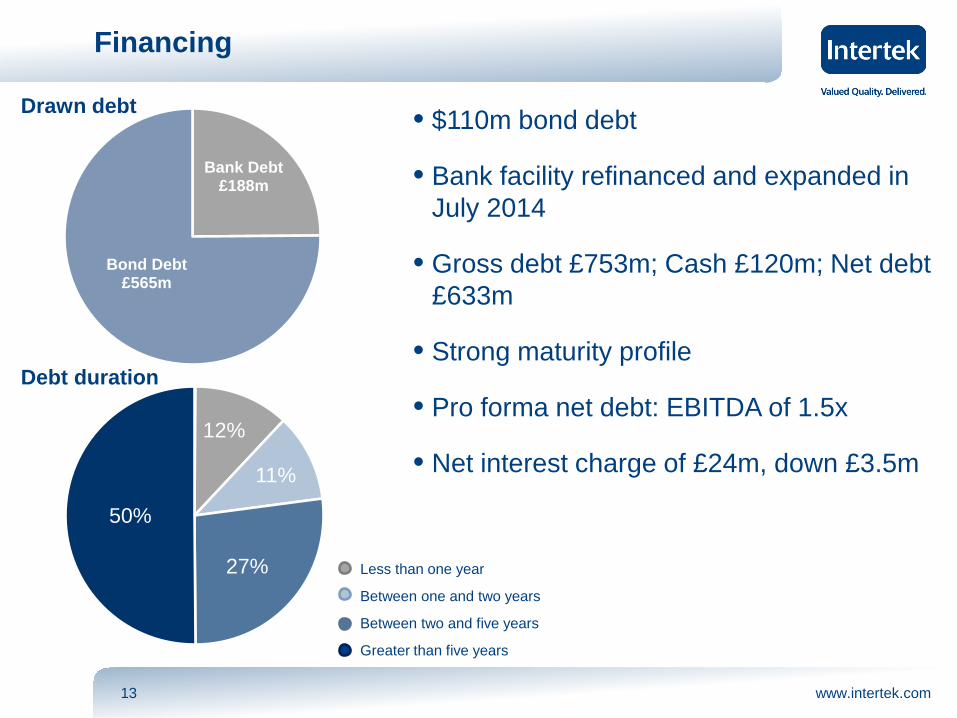
Financing
• $110m bond debt
• Bank facility refinanced and expanded in July 2014
• Gross debt £753m; Cash £120m; Net debt £633m
• Strong maturity profile
• Pro forma net debt: EBITDA of 1.5x
• Net interest charge of £24m, down £3.5m
12%
11%
27%
50%
Drawn debt
Debt duration
Bank Debt £188m
Bond Debt £565m
Less than one year
Between one and two years
Between two and five years
Greater than five years
www.intertek.com 14
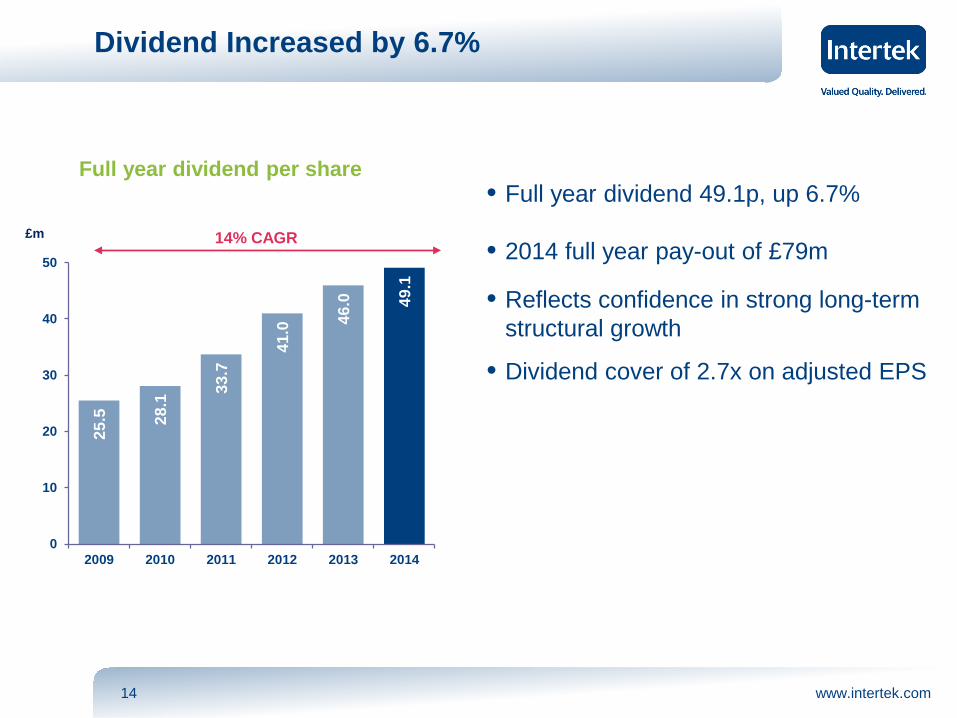
25.5
28.1
33.7
41.0
46.0
49.1
0
10
20
30
40
50
2009 2010 2011 2012 2013 2014
£m
Dividend Increased by 6.7%
• Full year dividend 49.1p, up 6.7%
• 2014 full year pay-out of £79m
• Reflects confidence in strong long-term structural growth
• Dividend cover of 2.7x on adjusted EPS
14% CAGR
Full year dividend per share
www.intertek.com 15
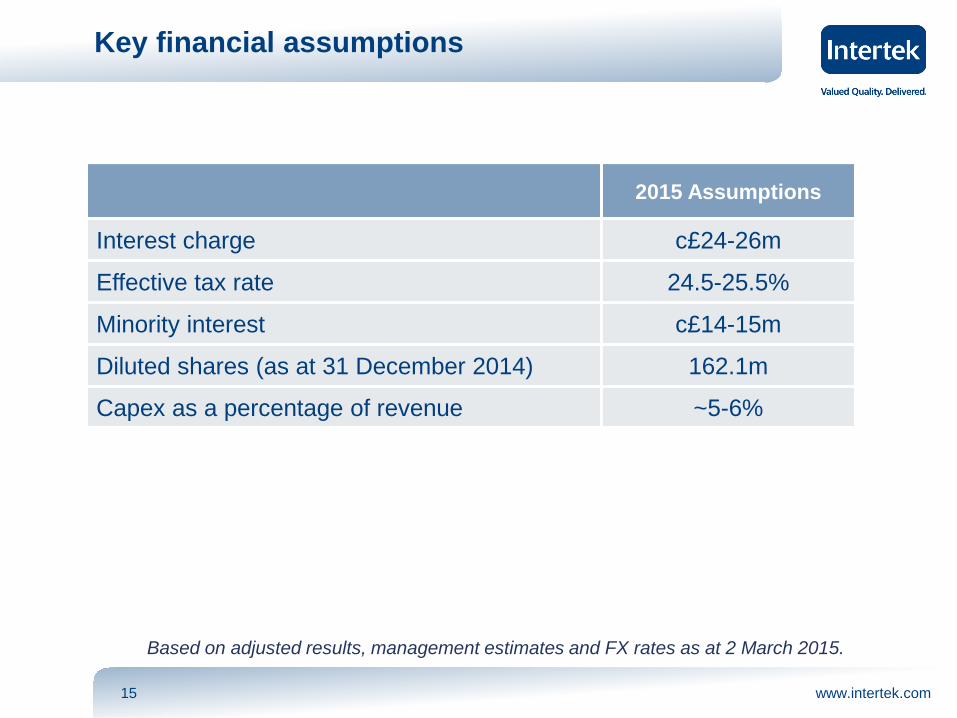
Key financial assumptions
Based on adjusted results, management estimates and FX rates as at 2 March 2015.
2015 Assumptions
Interest charge c£24-26m
Effective tax rate 24.5-25.5%
Minority interest c£14-15m
Diluted shares (as at 31 December 2014) 162.1m
Capex as a percentage of revenue ~5-6%
www.intertek.com 16
Financial priorities
• Invest for growth
• Cost management and efficiency
• Margin development
www.intertek.com 17
Wolfhart Hauser Chief Executive Officer
Operating Performance
2014 Full Year Results Presentation
www.intertek.com 19
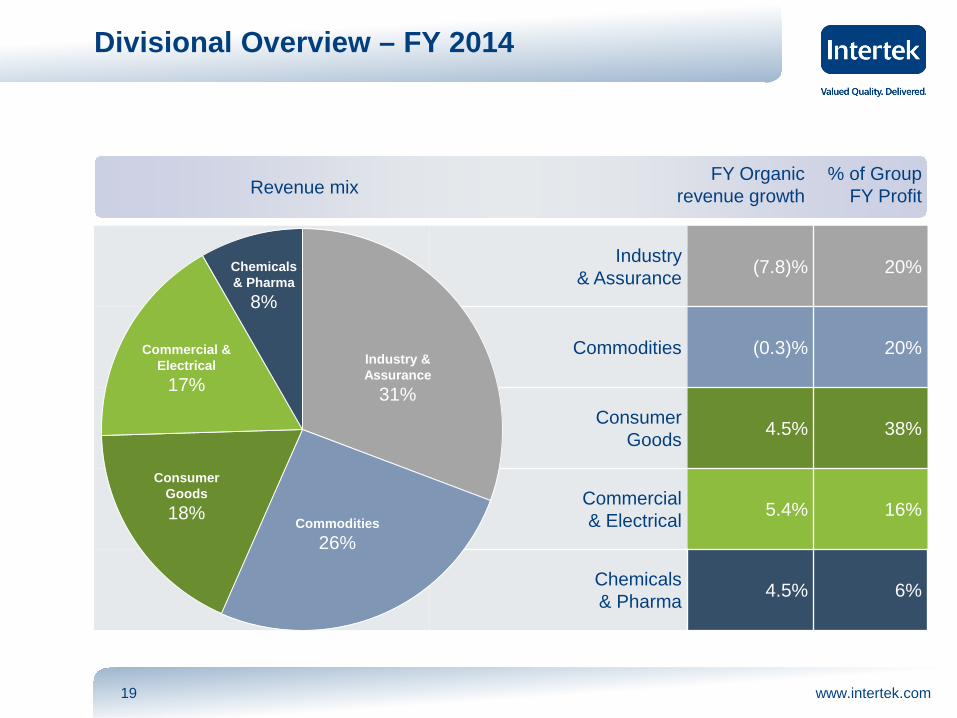
Industry & Assurance (7.8)% 20%
Commodities (0.3)% 20%
Consumer Goods 4.5% 38%
Commercial & Electrical 5.4% 16%
Chemicals & Pharma 4.5% 6%
Divisional Overview – FY 2014
FY Organic revenue growth
% of Group FY Profit
Industry & Assurance
31%
Commodities 26%
Consumer Goods 18%
Commercial & Electrical
17%
Chemicals & Pharma
8%
Revenue mix
www.intertek.com 20
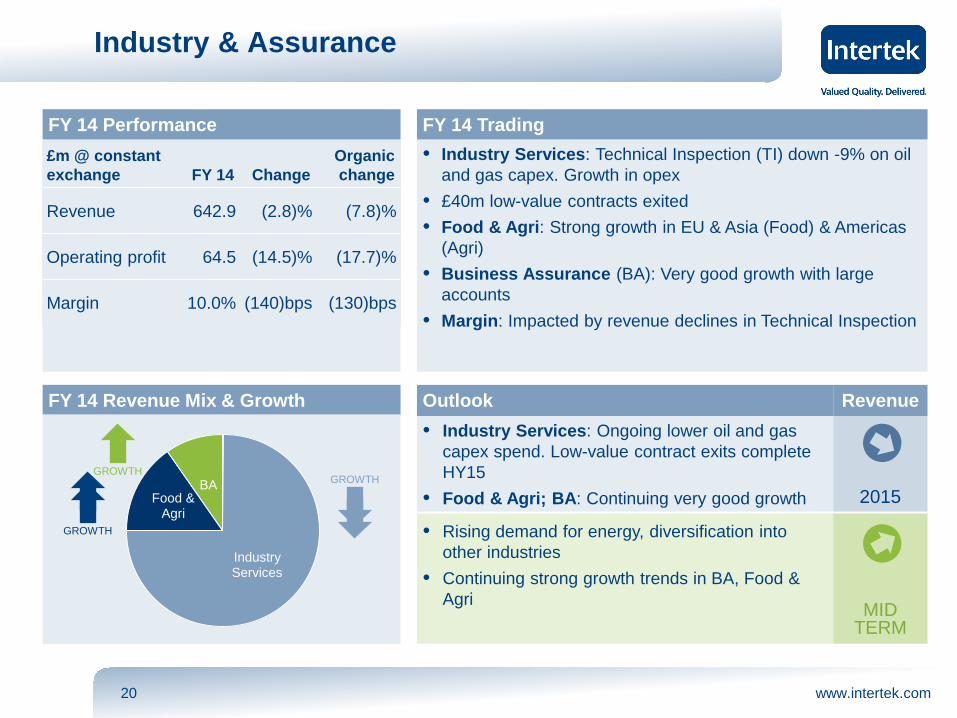
FY 14 Performance
FY 14 Revenue Mix & Growth
Industry & Assurance
£m @ constant exchange
FY 14 Change
Organic change
Revenue 642.9 (2.8)% (7.8)%
Operating profit 64.5 (14.5)% (17.7)%
Margin 10.0% (140)bps (130)bps
Industry Services
Food & Agri
BA
• Industry Services: Technical Inspection (TI) down -9% on oil and gas capex. Growth in opex
• £40m low-value contracts exited • Food & Agri: Strong growth in EU & Asia (Food) & Americas
(Agri) • Business Assurance (BA): Very good growth with large
accounts • Margin: Impacted by revenue declines in Technical Inspection
FY 14 Trading
Outlook Revenue • Industry Services: Ongoing lower oil and gas
capex spend. Low-value contract exits complete HY15
• Food & Agri; BA: Continuing very good growth 2015
• Rising demand for energy, diversification into other industries
• Continuing strong growth trends in BA, Food & Agri
MID
TERM
GROWTH
GROWTH
GROWTH
www.intertek.com 21
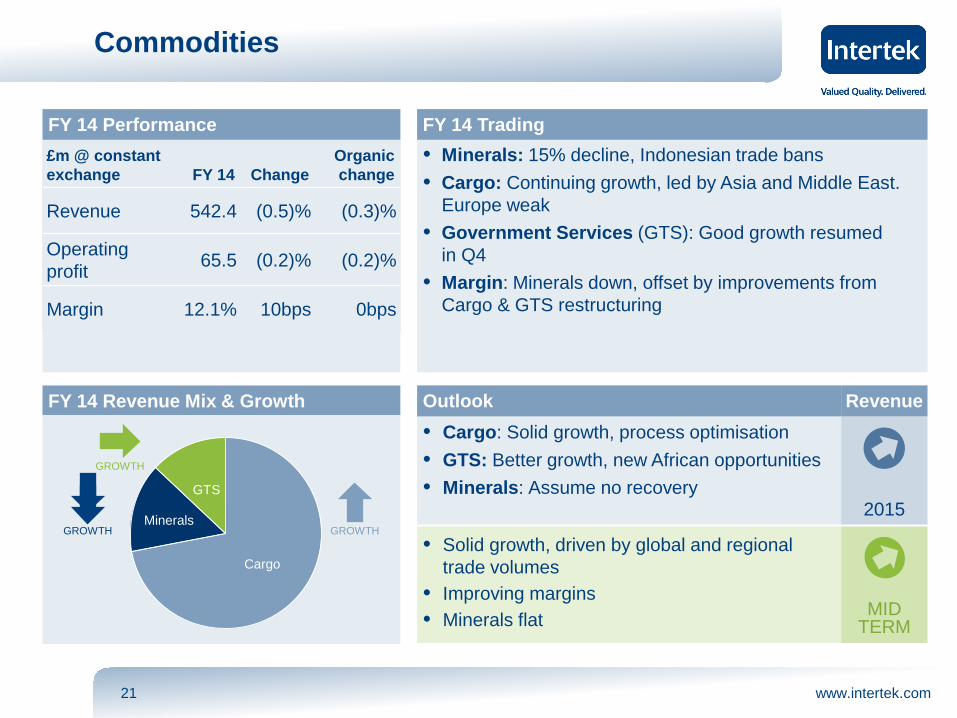
FY 14 Performance
FY 14 Revenue Mix & Growth
Cargo
Minerals
GTS
Commodities
£m @ constant exchange
FY 14 Change
Organic change
Revenue 542.4 (0.5)% (0.3)%
Operating profit 65.5 (0.2)% (0.2)%
Margin 12.1% 10bps 0bps
• Minerals: 15% decline, Indonesian trade bans • Cargo: Continuing growth, led by Asia and Middle East.
Europe weak • Government Services (GTS): Good growth resumed
in Q4 • Margin: Minerals down, offset by improvements from
Cargo & GTS restructuring
FY 14 Trading
Outlook Revenue • Cargo: Solid growth, process optimisation • GTS: Better growth, new African opportunities • Minerals: Assume no recovery
2015
• Solid growth, driven by global and regional trade volumes
• Improving margins • Minerals flat MID
TERM
GROWTH GROWTH
GROWTH
www.intertek.com 22
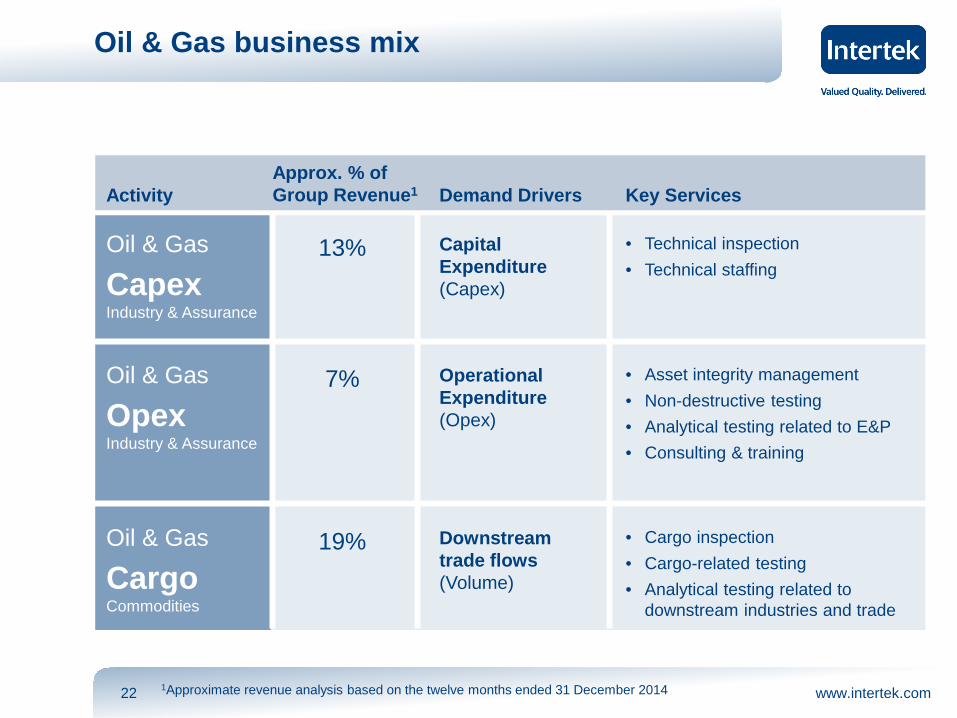
Oil & Gas business mix
Approx. % of Group Revenue1 Demand Drivers Key Services Activity
• Technical inspection • Technical staffing
Capital Expenditure (Capex)
Oil & Gas 13% Capex Industry & Assurance
• Asset integrity management • Non-destructive testing • Analytical testing related to E&P • Consulting & training
Operational Expenditure (Opex)
Oil & Gas 7% Opex Industry & Assurance
• Cargo inspection • Cargo-related testing • Analytical testing related to
downstream industries and trade
Downstream trade flows (Volume)
Oil & Gas 19% Cargo Commodities
1Approximate revenue analysis based on the twelve months ended 31 December 2014
www.intertek.com 23
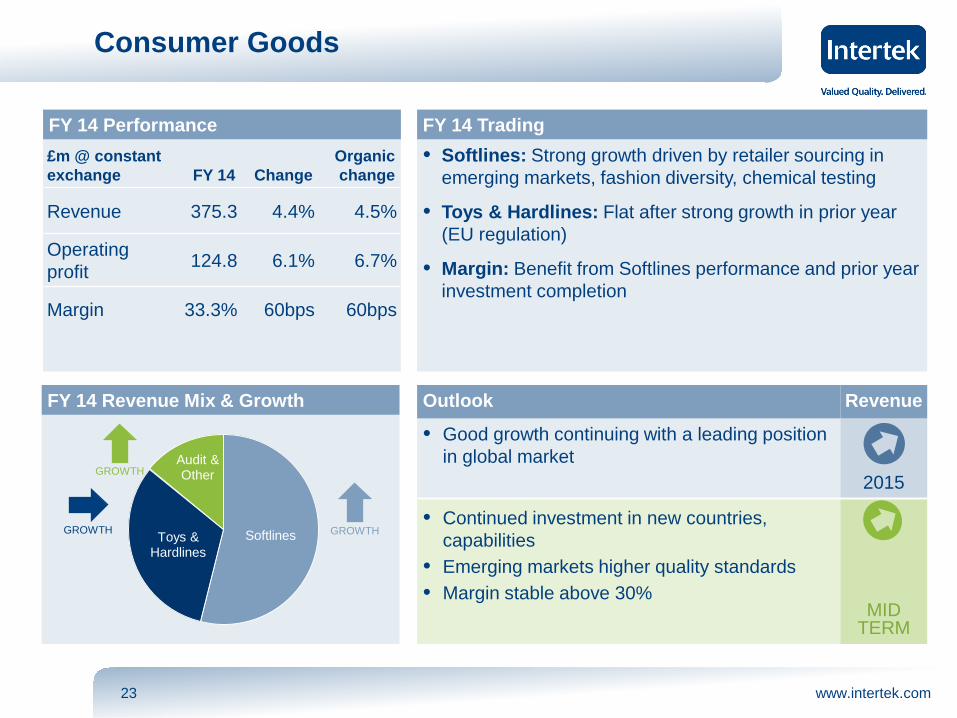
Outlook Revenue
• Good growth continuing with a leading position in global market
2015
• Continued investment in new countries, capabilities
• Emerging markets higher quality standards • Margin stable above 30% MID
TERM
FY 14 Performance
FY 14 Revenue Mix & Growth
Softlines Toys & Hardlines
Audit & Other
Consumer Goods
£m @ constant exchange
FY 14 Change
Organic change
Revenue 375.3 4.4% 4.5%
Operating profit 124.8 6.1% 6.7%
Margin 33.3% 60bps 60bps
• Softlines: Strong growth driven by retailer sourcing in emerging markets, fashion diversity, chemical testing
• Toys & Hardlines: Flat after strong growth in prior year (EU regulation)
• Margin: Benefit from Softlines performance and prior year investment completion
FY 14 Trading
GROWTH
GROWTH GROWTH
www.intertek.com 24
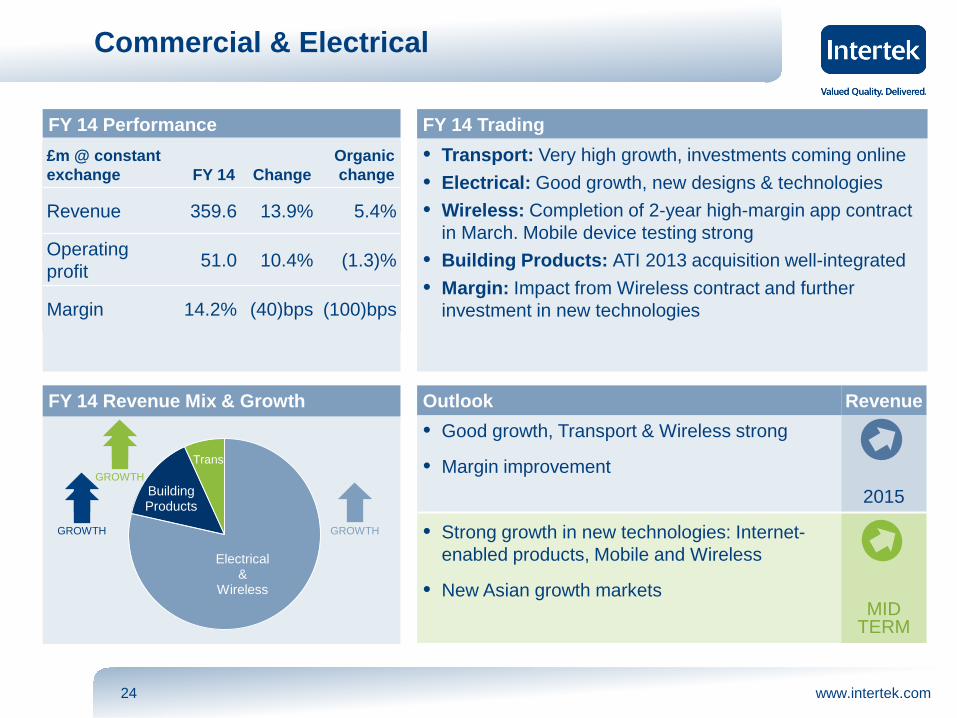
Outlook Revenue • Good growth, Transport & Wireless strong
• Margin improvement 2015
• Strong growth in new technologies: Internet-enabled products, Mobile and Wireless
• New Asian growth markets MID
TERM
FY 14 Performance
FY 14 Revenue Mix & Growth
Electrical &
Wireless
Building Products
Trans
Commercial & Electrical
£m @ constant exchange
FY 14 Change
Organic change
Revenue 359.6 13.9% 5.4%
Operating profit 51.0 10.4% (1.3)%
Margin 14.2% (40)bps (100)bps
• Transport: Very high growth, investments coming online • Electrical: Good growth, new designs & technologies • Wireless: Completion of 2-year high-margin app contract
in March. Mobile device testing strong • Building Products: ATI 2013 acquisition well-integrated • Margin: Impact from Wireless contract and further
investment in new technologies
FY 14 Trading
GROWTH
GROWTH
GROWTH
www.intertek.com 25
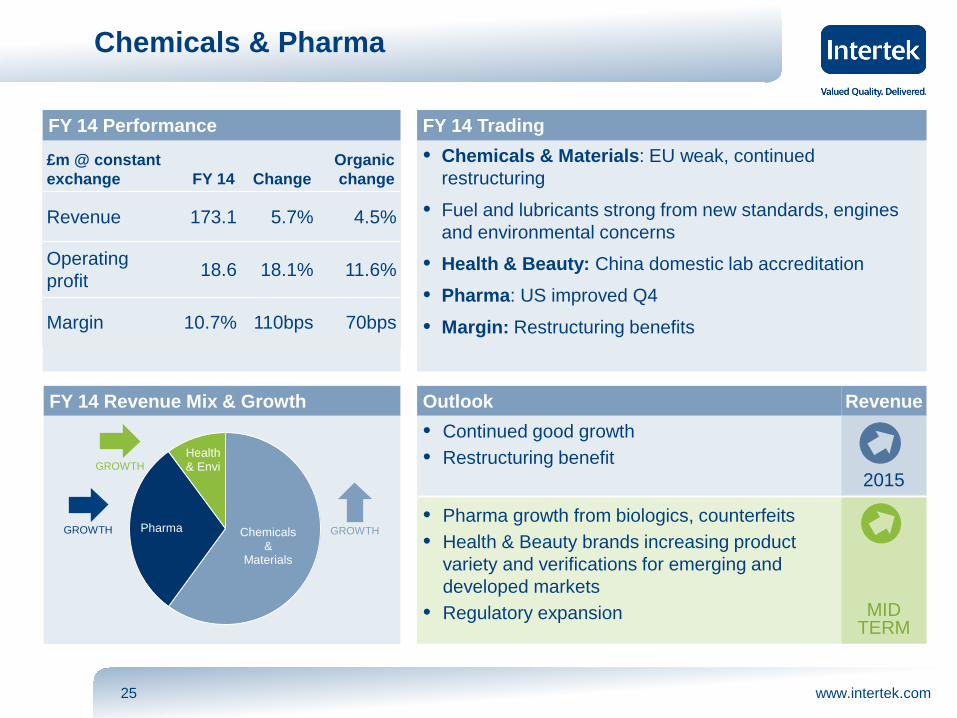
Outlook Revenue • Continued good growth • Restructuring benefit
2015
• Pharma growth from biologics, counterfeits • Health & Beauty brands increasing product
variety and verifications for emerging and developed markets
• Regulatory expansion MID TERM
FY 14 Performance
FY 14 Revenue Mix & Growth
Chemicals &
Materials
Pharma
Health & Envi
Chemicals & Pharma
£m @ constant exchange
FY 14 Change
Organic change
Revenue 173.1 5.7% 4.5%
Operating profit 18.6 18.1% 11.6%
Margin 10.7% 110bps 70bps
• Chemicals & Materials: EU weak, continued restructuring
• Fuel and lubricants strong from new standards, engines and environmental concerns
• Health & Beauty: China domestic lab accreditation • Pharma: US improved Q4 • Margin: Restructuring benefits
FY 14 Trading
GROWTH GROWTH
GROWTH
www.intertek.com 26
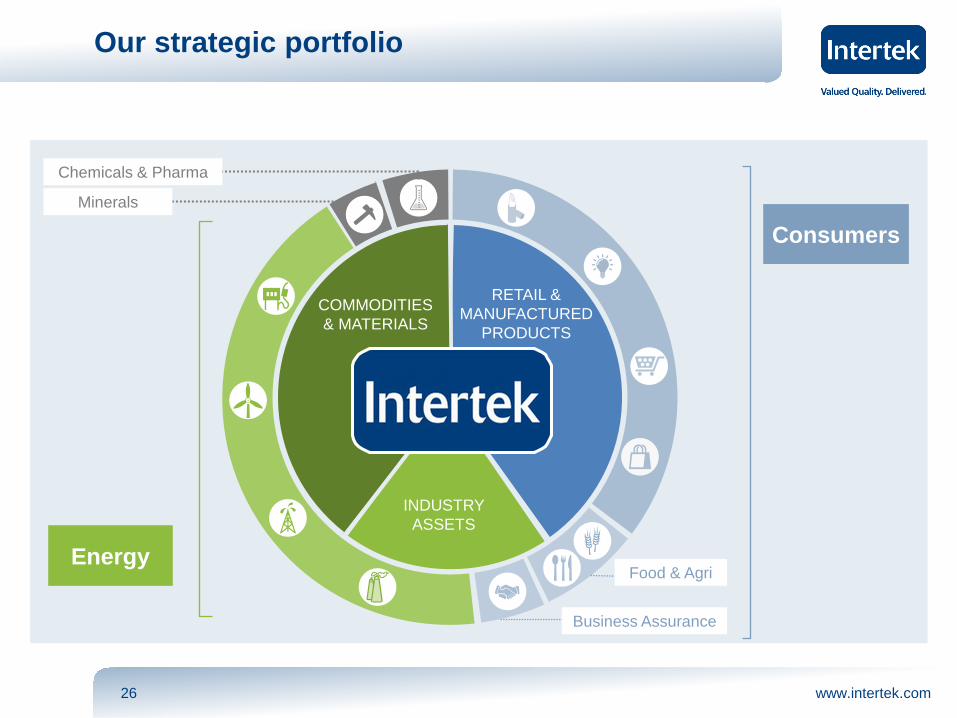
Our strategic portfolio
RETAIL & MANUFACTURED
PRODUCTS
COMMODITIES & MATERIALS
INDUSTRY ASSETS
Consumers
Business Assurance
Chemicals & Pharma
Minerals
Food & Agri Energy
www.intertek.com 27
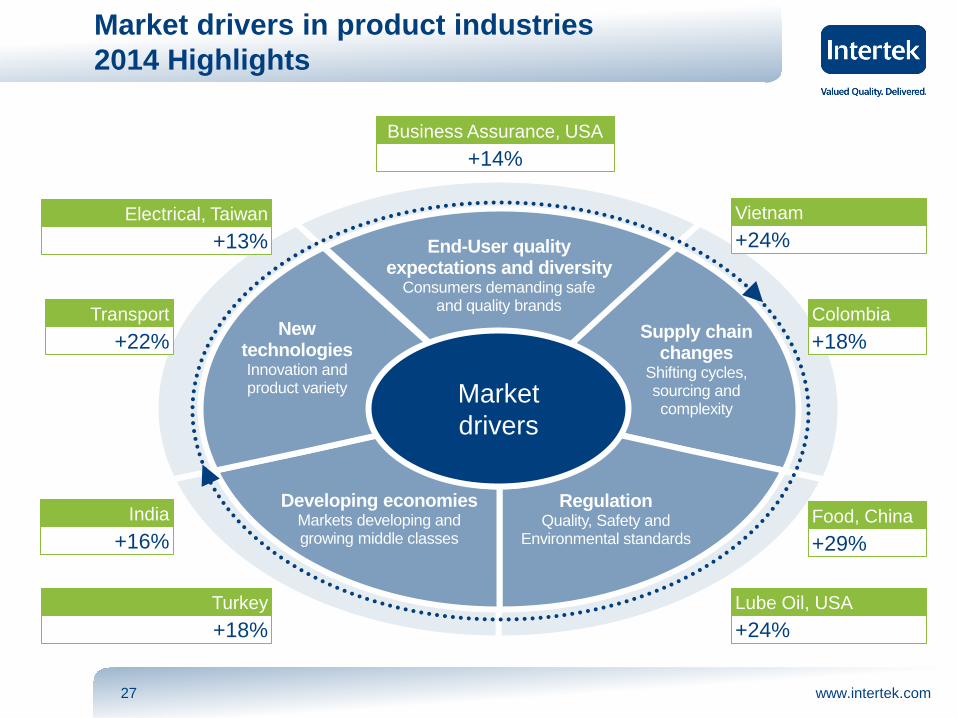
Market drivers in product industries 2014 Highlights
Wh
Regulation Quality, Safety and
Environmental standards
Supply chain changes
Shifting cycles, sourcing and complexity
New technologies Innovation and product variety
End-User quality expectations and diversity
Consumers demanding safe and quality brands
Developing economies Markets developing and growing middle classes
Market drivers
Food, China +29%
Lube Oil, USA +24%
Vietnam +24%
Colombia +18%
Business Assurance, USA +14%
India +16%
Turkey +18%
Transport +22%
Electrical, Taiwan +13%
www.intertek.com 28
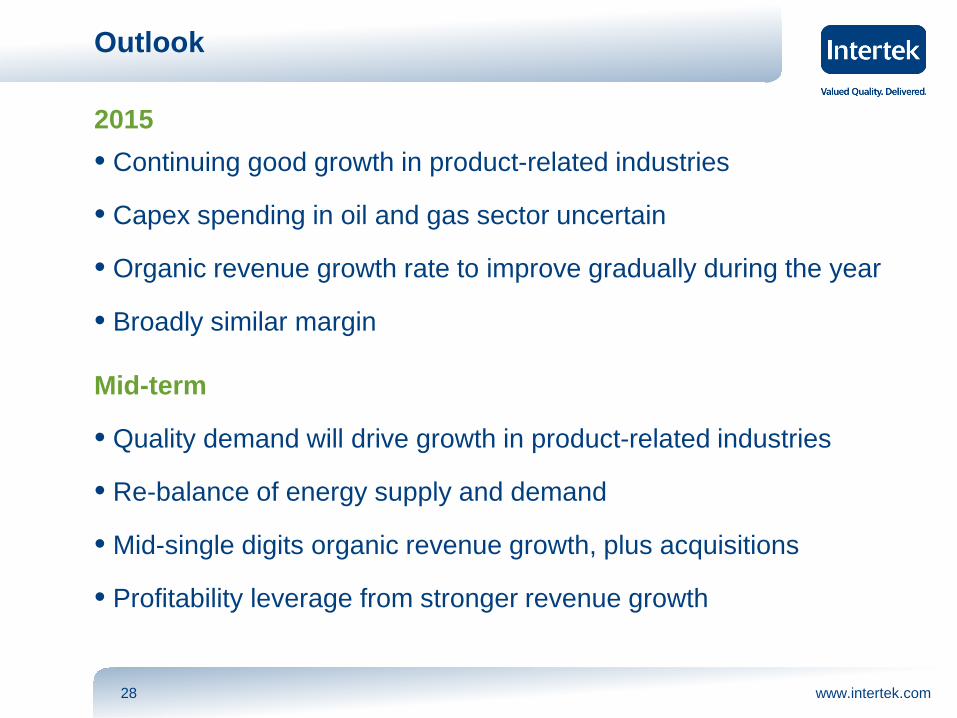
Outlook
2015 • Continuing good growth in product-related industries
• Capex spending in oil and gas sector uncertain
• Organic revenue growth rate to improve gradually during the year
• Broadly similar margin
Mid-term
• Quality demand will drive growth in product-related industries
• Re-balance of energy supply and demand
• Mid-single digits organic revenue growth, plus acquisitions
• Profitability leverage from stronger revenue growth
www.intertek.com 29
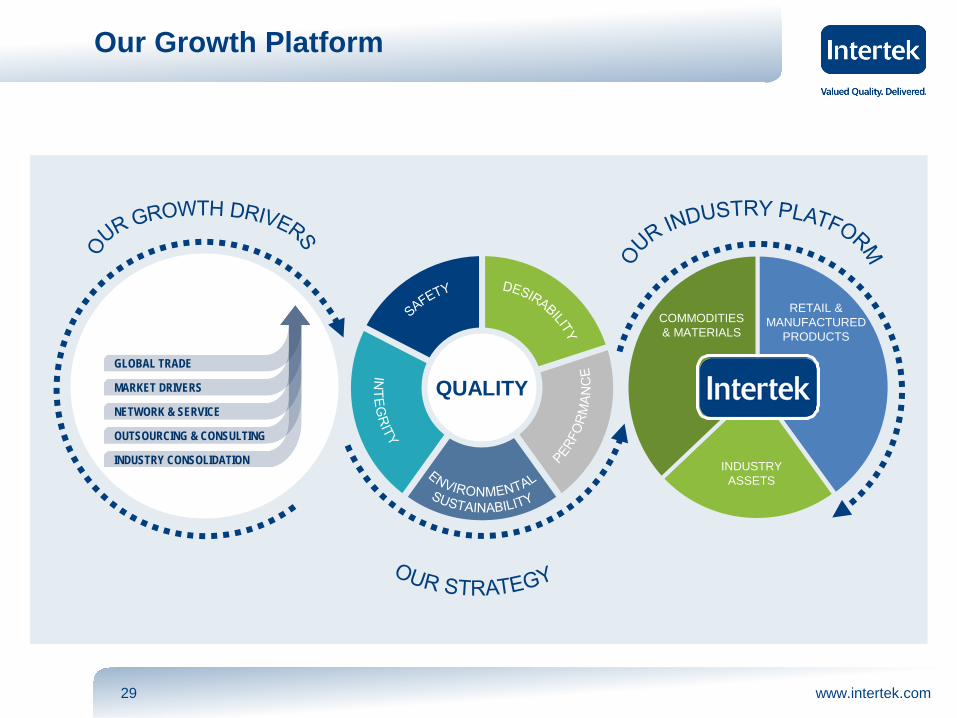
Our Growth Platform
QUALITY
COMMODITIES & MATERIALS
RETAIL & MANUFACTURED
PRODUCTS
INDUSTRY ASSETS
GLOBAL TRADE
MARKET DRIVERS
NETWORK & SERVICE
OUTSOURCING & CONSULTING
INDUSTRY CONSOLIDATION
www.intertek.com 30
2014 Full Year Results Presentation
Appendix
www.intertek.com 31
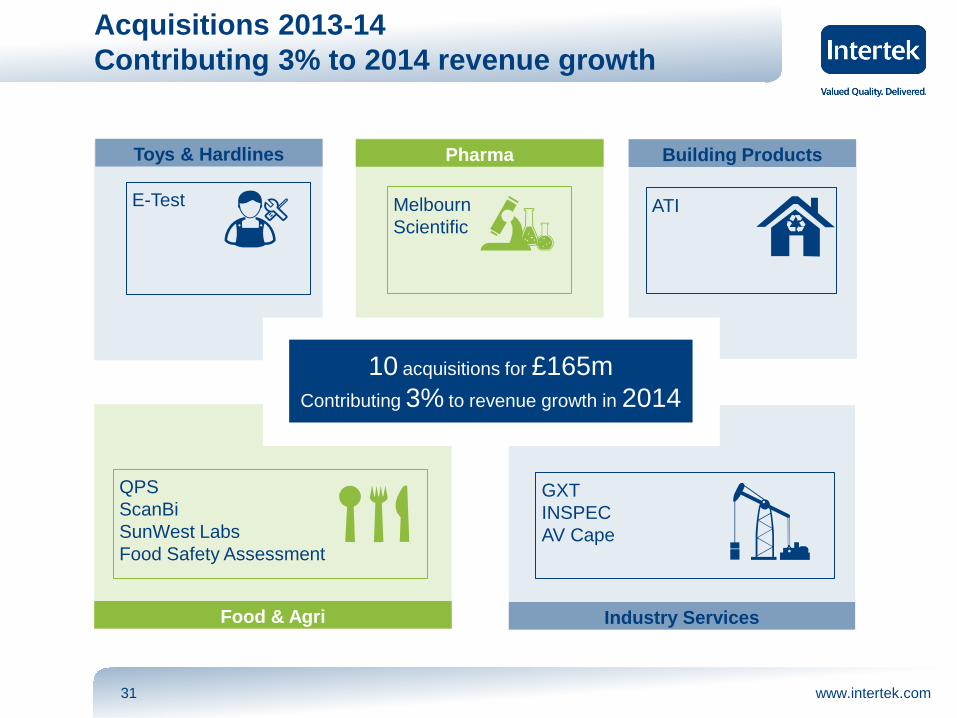
QPS ScanBi SunWest Labs Food Safety Assessment
Pharma
Acquisitions 2013-14 Contributing 3% to 2014 revenue growth
Food & Agri Industry Services
Melbourn Scientific
GXT INSPEC AV Cape
E-Test ATI
10 acquisitions for £165m Contributing 3% to revenue growth in 2014
Toys & Hardlines Building Products
www.intertek.com 32
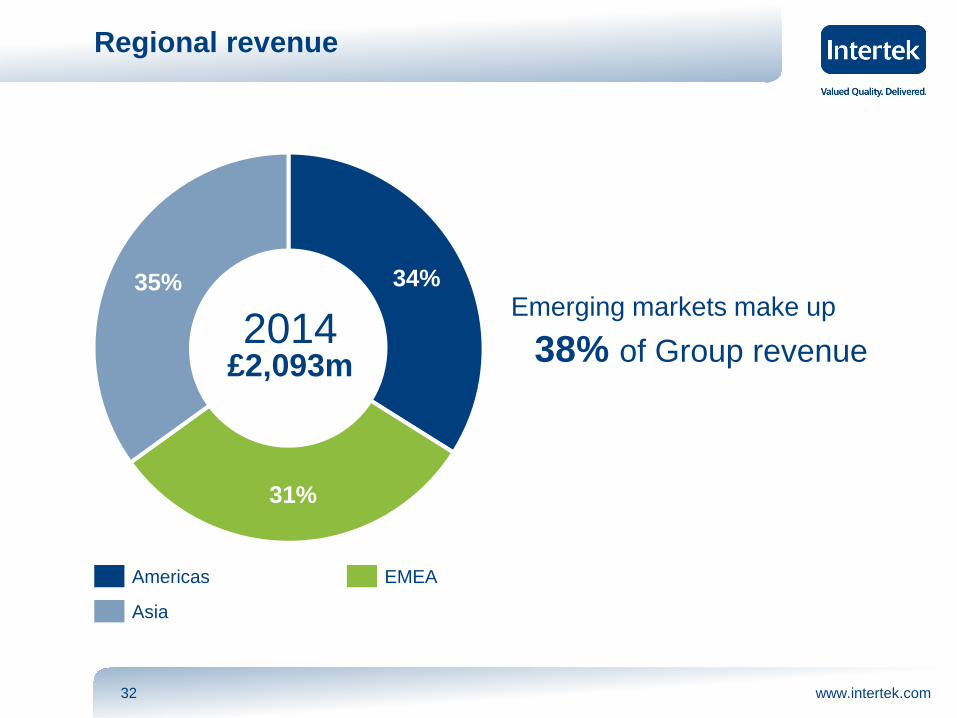
Regional revenue
Emerging markets make up 34%
31%
35%
Americas EMEA
Asia
2014 £2,093m 38% of Group revenue
www.intertek.com 33
(5.3)%
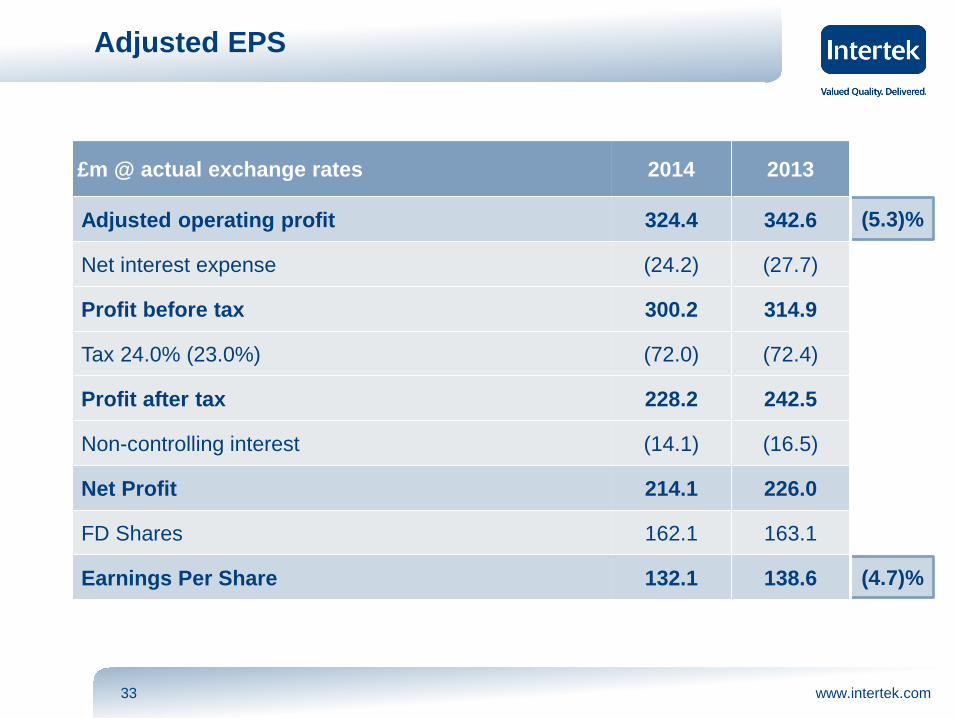
Adjusted EPS
(4.7)%
£m @ actual exchange rates 2014 2013
Adjusted operating profit 324.4 342.6
Net interest expense (24.2) (27.7)
Profit before tax 300.2 314.9
Tax 24.0% (23.0%) (72.0) (72.4)
Profit after tax 228.2 242.5
Non-controlling interest (14.1) (16.5)
Net Profit 214.1 226.0
FD Shares 162.1 163.1
Earnings Per Share 132.1 138.6
www.intertek.com 34
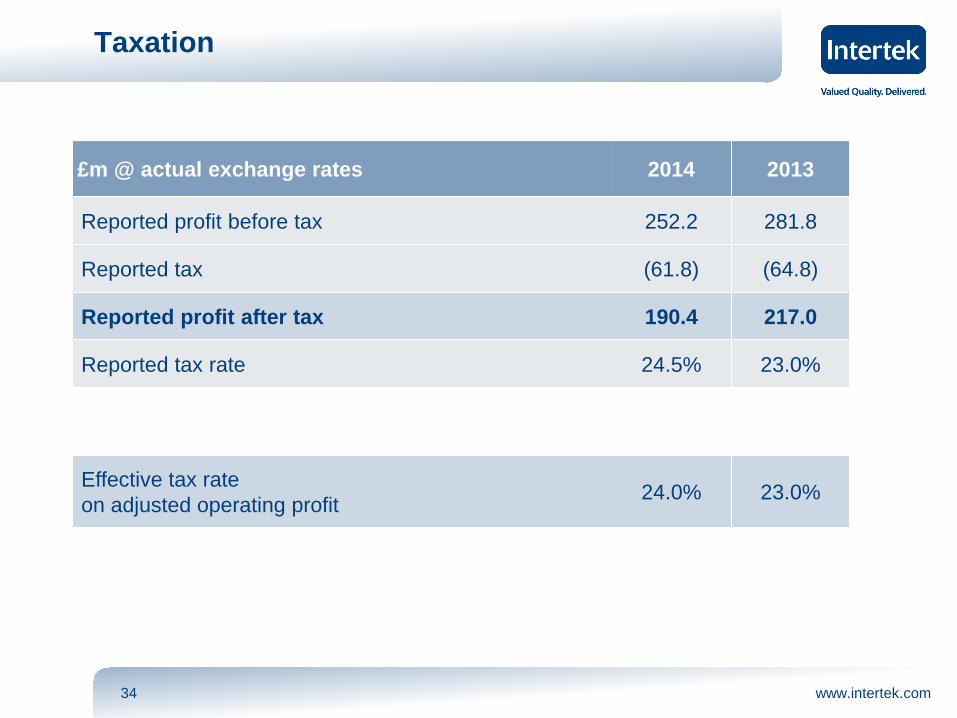
Taxation
£m @ actual exchange rates 2014 2013
Reported profit before tax 252.2 281.8
Reported tax (61.8) (64.8)
Reported profit after tax 190.4 217.0
Reported tax rate 24.5% 23.0%
Effective tax rate on adjusted operating profit 24.0% 23.0%
www.intertek.com 35
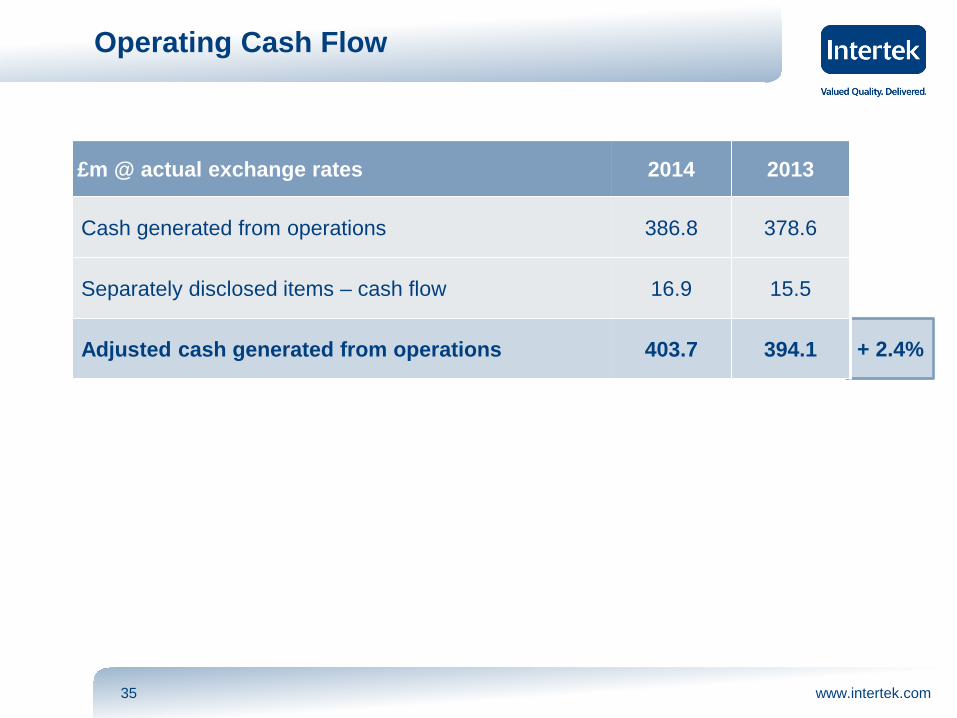
Operating Cash Flow
+ 2.4%
£m @ actual exchange rates 2014 2013
Cash generated from operations 386.8 378.6
Separately disclosed items – cash flow 16.9 15.5
Adjusted cash generated from operations 403.7 394.1
www.intertek.com 36
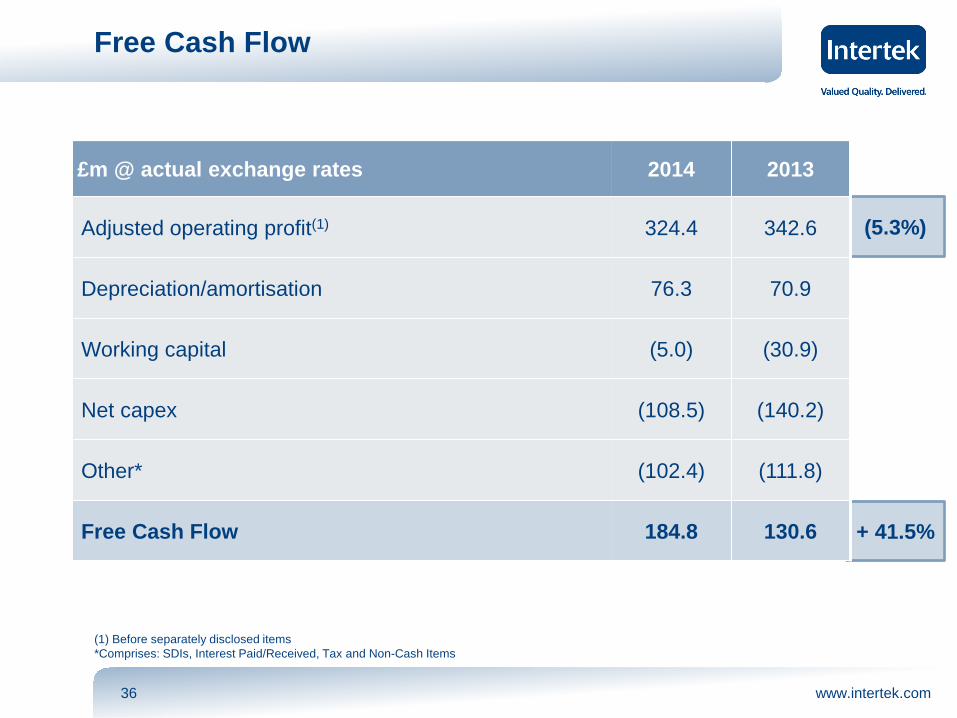
Free Cash Flow
+ 41.5%
(5.3%)
£m @ actual exchange rates 2014 2013
Adjusted operating profit(1) 324.4 342.6
Depreciation/amortisation 76.3 70.9
Working capital (5.0) (30.9)
Net capex (108.5) (140.2)
Other* (102.4) (111.8)
Free Cash Flow 184.8 130.6
(1) Before separately disclosed items *Comprises: SDIs, Interest Paid/Received, Tax and Non-Cash Items
www.intertek.com 37
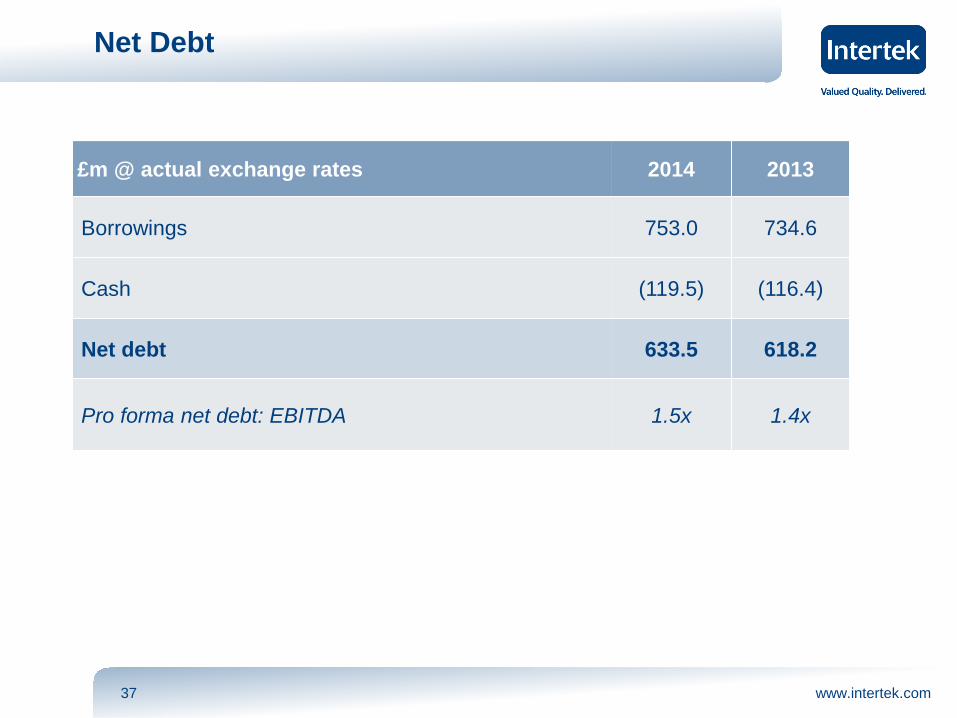
Net Debt
£m @ actual exchange rates 2014 2013
Borrowings 753.0 734.6
Cash (119.5) (116.4)
Net debt 633.5 618.2
Pro forma net debt: EBITDA 1.5x 1.4x
www.intertek.com 38
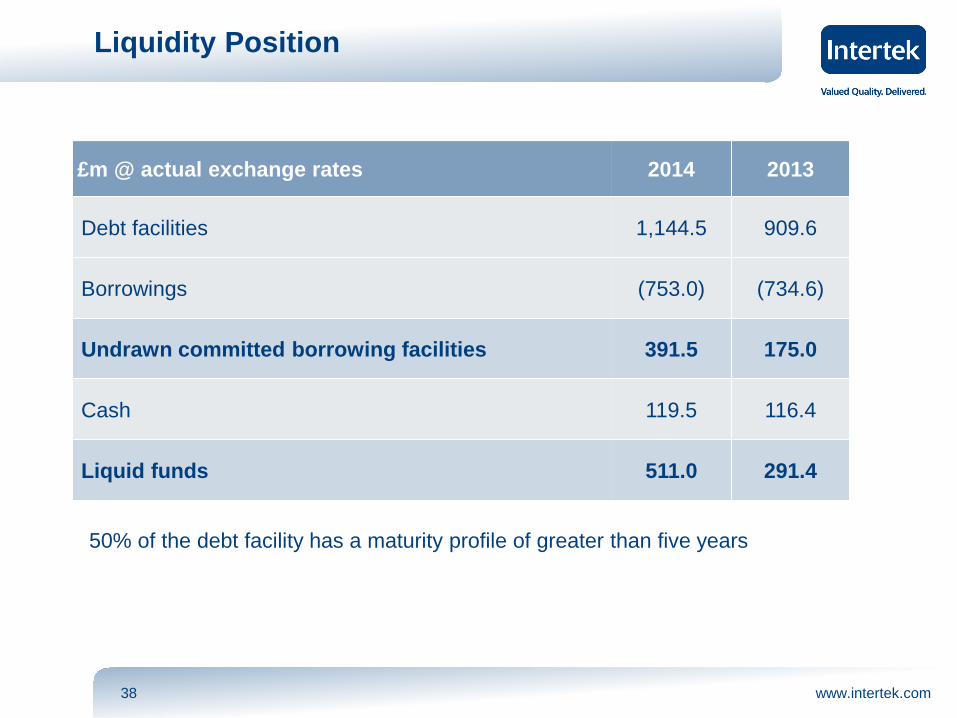
Liquidity Position
£m @ actual exchange rates 2014 2013
Debt facilities 1,144.5 909.6
Borrowings (753.0) (734.6)
Undrawn committed borrowing facilities 391.5 175.0
Cash 119.5 116.4
Liquid funds 511.0 291.4
50% of the debt facility has a maturity profile of greater than five years
www.intertek.com 39
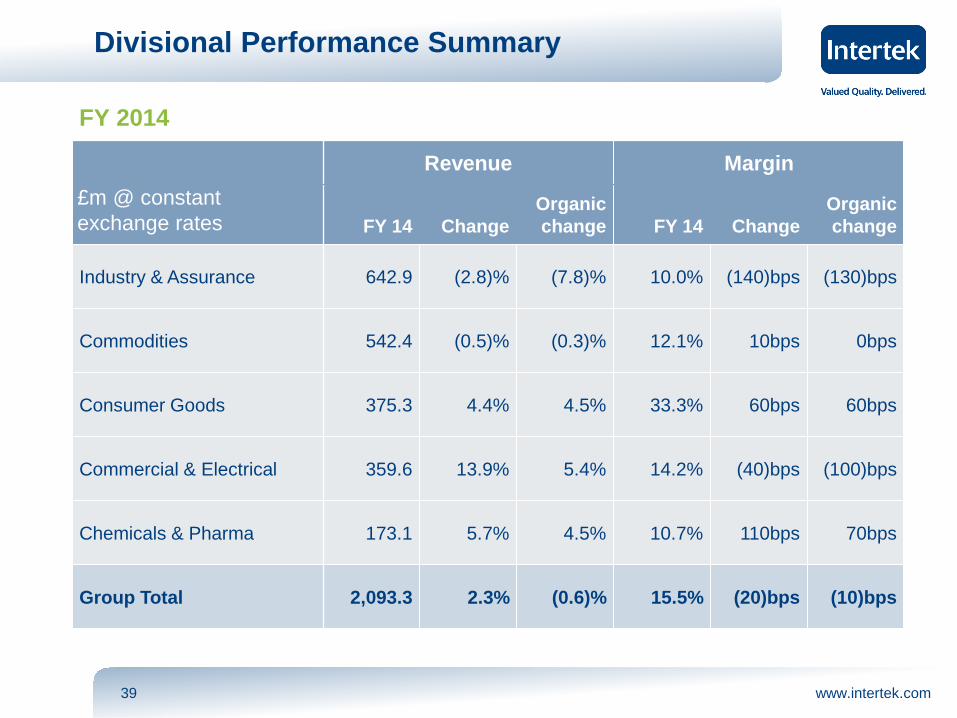
Divisional Performance Summary
£m @ constant exchange rates
Revenue Margin
FY 14 Change Organic change FY 14 Change
Organic change
Industry & Assurance 642.9 (2.8)% (7.8)% 10.0% (140)bps (130)bps
Commodities 542.4 (0.5)% (0.3)% 12.1% 10bps 0bps
Consumer Goods 375.3 4.4% 4.5% 33.3% 60bps 60bps
Commercial & Electrical 359.6 13.9% 5.4% 14.2% (40)bps (100)bps
Chemicals & Pharma 173.1 5.7% 4.5% 10.7% 110bps 70bps
Group Total 2,093.3 2.3% (0.6)% 15.5% (20)bps (10)bps
FY 2014
www.intertek.com 40
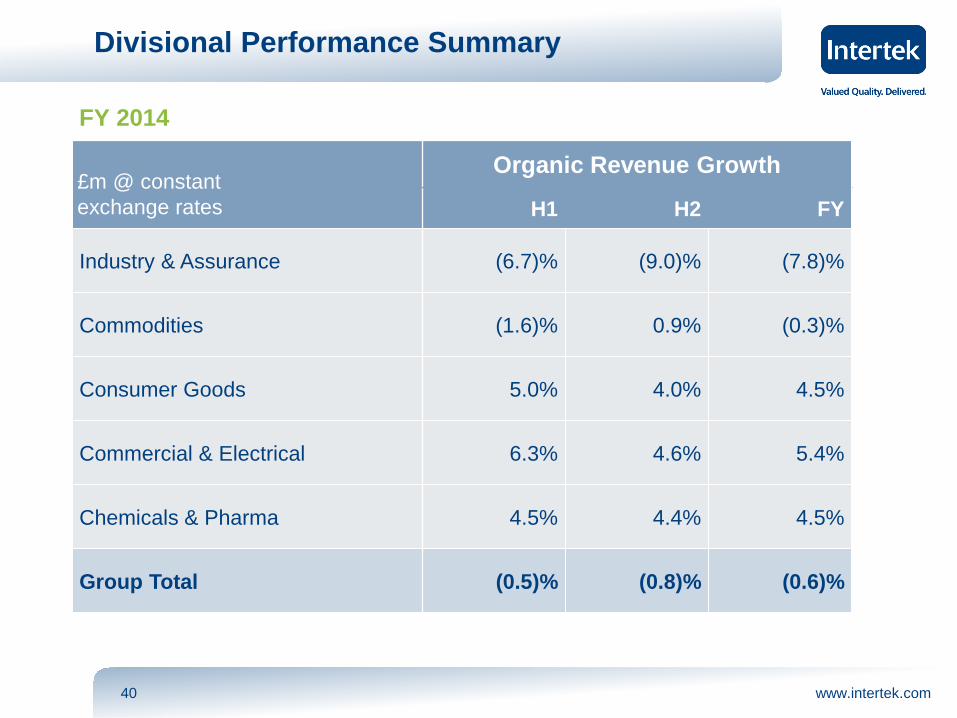
Divisional Performance Summary
£m @ constant exchange rates
Organic Revenue Growth
H1 H2 FY
Industry & Assurance (6.7)% (9.0)% (7.8)%
Commodities (1.6)% 0.9% (0.3)%
Consumer Goods 5.0% 4.0% 4.5%
Commercial & Electrical 6.3% 4.6% 5.4%
Chemicals & Pharma 4.5% 4.4% 4.5%
Group Total (0.5)% (0.8)% (0.6)%
FY 2014