Embed Size (px)
Citation preview

1
2014 Community Needs Assessment
Main Office:
3880 Foothills Rd. Ste A
Las Cruces, NM 88011
www.caasnm.org
2
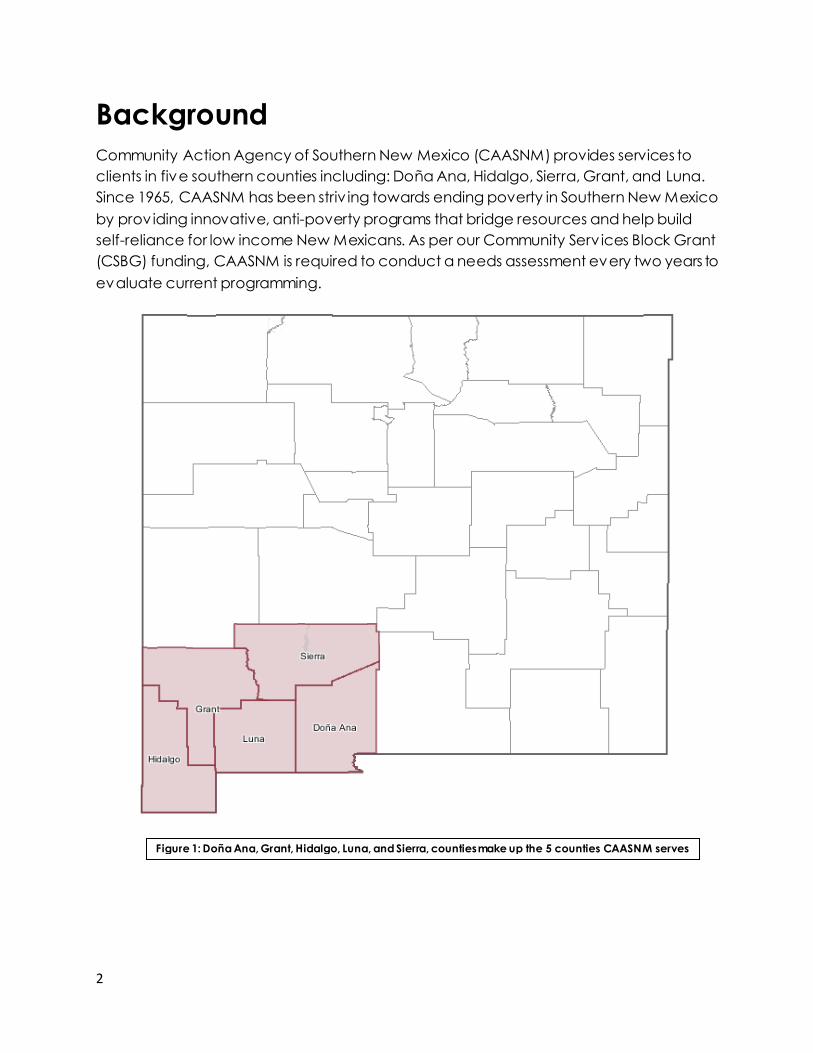
Background
Community Action Agency of Southern New Mexico (CAASNM) provides services to
clients in five southern counties including: Doña Ana, Hidalgo, Sierra, Grant, and Luna.
Since 1965, CAASNM has been striv ing towards ending poverty in Southern New Mexico
by providing innovative, anti-poverty programs that bridge resources and help build
self-reliance for low income New Mexicans. As per our Community Serv ices Block Grant
(CSBG) funding, CAASNM is required to conduct a needs assessment every two years to
evaluate current programming.
Figure 1: Doña Ana, Grant, Hidalgo, Luna, and Sierra, counties make up the 5 counties CAASNM serves
3
Introduction
I. CAASNM’s Mission, Vision, and Values
Mission:
Building self-reliance for low-income New Mexicans by connecting our community to
high-impact programs that encourage family wellness, empower families, and bridge
resources.
Vision:
To create a community where opportunity exists for all to become self-sufficient.
Values:
We BELIEVE:
Families with limited resources are first and foremost people.
People can guide their own lives and escape poverty.
Everyone should have access to food, housing, education, employment, and
clothing.
A positive and consistent attitude toward behavior and learning is effective in
guiding people toward a quality of life prev iously thought impossible.
In being ethical and honest – doing what is right.
We are a learning organization that values the contributions, collaboration, and
can-do spirit of our staff, volunteers and Board of Directors.
People need to be connected to their families and significantly connected to
their communities.
Innovation is necessary to foster our vision and mission.
II. History of Community Action Agency
Community Action Agencies (CAAs) began as grass-roots, community controlled
groups in 1964 in conjunction with President Lyndon Johnson’s War on Poverty, the
Economic Opportunity Act of 1964 (EOA) and the Civ il Rights Act of 1964. CAAs were
formed to mobilize communities, represent the poor, voice community concerns and
insist on change. Today there are nearly 1,000 CAAs across the United States.
In 1965, CAA of Doña Ana County (CAADAC) was chartered as a private, nonprofit
corporation in New Mexico addressing needs that were important to our local
communities through local resources. Steering six community improvement associations,
CAADAC’s programs included School Drop-Out Prevention, Tutoring, English as a
Second Language, GED programs, Planned Parenthood Family Planning,
Outreach Serv ices, Day Care Programs at Community Centers, Meals on Wheels,
Winterization/Energy Conservation, Alcoholism Programs, Food Stamps Certification,

4
Income Tax Assistance, 4-H Sparks (Special Programs Assistance for Responsible Kids),
the WIN Program, Drug Information Rewards Program, ManPower Delivery Services, Well
Baby Clinic, Community Development Housing Programs, Arts and Crafts Classes, and
the Farmer’s Market in the Las Cruces Downtown Mall.
Many CAAs closed in the late 1970s and early 1980s as serv ing the poor became less of
a priority for both the nation and the federal government, but CAADAC endured. In
1991, CAA-Doña Ana County became Community Action Agency of Southern New
Mexico, Inc. (CAASNM), expanding the reach of its many programs to include all of
Southern New Mexico.
With the assistance of New Mexico Senator, Pete Domenici, CAASNM secured $1 million
in funds to help build its own building, sav ing over $50,000 each year in lease payments
that instead went directly into services helping move the organization itself toward self-
sufficiency.
III. Census Data and Current Conditions
We rely on current Census information, relevant research, and other resources to inform
us on current and emerging poverty issues and trends. We know from these sources that
as of February, 2014 the federal Health and Human Serv ices Department poverty
guideline for a family of four is $23,850.00. At this income level, almost 25 percent of the
families in Doña Ana County are below the poverty level. New Mexico Voices for
Children has created a basic
family budget calculator that
shows a family of 4 liv ing at or
below $37,584.00 is liv ing in
poverty in Dona Ana County.
With current research, we
believe that close to 45% of the
population of southern New
Mexico lives in poverty (in
contrast to the federal
government’s statistics of
closer to one-quarter of the
population). Struggling families
are often faced with cruel
choices between housing,
health care, food, and basic
needs. Poverty impacts families
within their various contexts.
At home, parents in poverty struggle to provide adequate housing and may be forced
into homelessness. Inadequate access to quality food can lead to poor nutrition,
hunger or obesity. Poverty and economic hardship is particularly difficult for parents
who may experience chronic stress, which may result in child abuse and neglect.
Figure 2: 2013 income levels of the clients that CAASNM served

5
In school, poorer children and teens are at greater risk for poor academic achievement
and dropping out of school. Poor teens are more likely to participate in risky behaviors
such as smoking or engaging in early sexual activ ity. Children born into poverty may be
malnourished from the womb, which can lead to compromised cognitive ability and
health issues that interfere with a stable learning environment. Inadequate education
contributes to the cycle of poverty by making it more difficult for low -income children
to lift themselves and future generations out of poverty.
Many neighborhoods where poverty is concentrated demonstrate high rates of crime.
Unsafe neighborhoods may expose low-income children to v iolence which can cause a number of psychosocial difficulties, trauma, injury, disability, and mortality. Violence
exposure can also predict future v iolent behavior in youth which places them at
greater risk of injury and mortality and entry into the juvenile justice system.
These effects are combined to create communities with fewer skilled or educated
workers, exposure to environmental contaminants, families with chronic health
conditions, and developmental delays in children. A more insidious consequence of
poverty in communities is the lack of a network of support to lead children in positive
directions. This lack of opportunity creates a disproportionate share of intergenerational
and persistent poverty, wherein families stay poor from one generation to the next.
IV. Current Programming
CAASNM serves over 30,000 people annually in the five southwestern counties of New
Mexico. We address the most challenging issues our communities face, fighting to
improve the lives of low-income children, youth, adults, and families with programs that
empower, build self-sufficiency, and connect to community resources. CAASNM’s
serv ices are structured into four distinct groups:
1) Family Empowerment helps families increase their personal assets through
training, financial literacy, and business development.
Computer Literacy and Skill Up Test ing classes are provided free of charge to
clients who wish to obtain basic, fundamental computer skills. Classes cover
basic computer knowledge, introduction to the Internet, social media and
internet tools for businesses, and Skill Up. Through our Skill Up classes, participants
will be introduced to WorkKeys. WorkKeys is used by thousands of companies
worldwide as a tool to help select, hire, train, develop, and retain a high-
performance workforce. In this class, participants will be introduced to an
online, self-paced tutorial known as KeyTrain. This tool will help job-seekers
identify and enhance the work skills that employers are looking for.
Financial Literacy classes are presented to clients to learn about the
importance of credit, sav ings, interest rates, and more. Financial literacy is v ital
to our work helping clients build self-reliance. Through these financial literacy
classes, clients are taught how to budget and stretch their dollar, so that
eventually, they can rely less on outside assistance.

6
Children’s Savings Accounts are one of our newer programs. With the
implementation of this exciting opportunity, CAASNM offers savings accounts to
income-eligible children to save for their future.
Individual Development Accounts or IDAs are currently being offered to
teenagers who wish to get a head start on saving money towards achieving
higher education goals. IDA clients are matched 4:1 for contributions into their
account, up to $1000 of their sav ings, for an end total of $5000. Since 2007, 156
savers have successfully completed the IDA program and were able to
accomplish their goals. Out of 156 savers, 50 purchased a home, 43 started or
expanded a business, and 33 attended post-secondary education.
2) Bridging Resources connects families to community resources and benefits
which can increase financial stability.
Total Benefits Services connects clients to services by pre-screening them for
benefits, including: SNAP (formerly Food Stamps), access to health insurance
through Medicaid, utility and cash assistance. Without this v ital service, clients
may not know they qualify for one or more of these programs. Our highly trained
and dedicated benefits counselors have been briefed on the new policies
under the Affordable Care Act and are well prepared to assist new and existing
clients with the changes. Access to these programs can make the difference for
families struggling daily to make ends meet. Clients can make an appointment
to come into the office, or conveniently apply online or over the phone. Our
one-on-one TBS counseling is confidential and staff can assist you with any
questions you may have throughout the application process and waiting
period.
iReach is a software that was developed by Infocom System Serv ices, Inc. I t
prov ides a uniform screening criteria of patients and streamlines the process for
helping clients find health insurance such as State Medicaid or the County
Indigent Program as well as other social programs offered through Community
Action Agency of Southern New Mexico.
Covering Kids assists indiv iduals, families, and children in obtaining free or low
cost Health Insurance who cannot afford private insurance on their
own. Through Covering Kids, we advocate for families with the State Income
Support Div ision in obtaining State Medicaid. How do we help? We assist in the
application process, advocate for you during the process, conduct follow-up
calls, remind you of recertification, help you choose a Salud or Doctor, answer
healthcare insurance questions, and link you to other needed community
resources.
3) Family Wellness keeps families healthy by prov iding supplemental funding for
nutritional meals to children and disabled adults in home-based daycares and
educating their caregivers.

7
Child and Adult Food Care Program is a nutrition program designed to
upgrade the quality of food for children and disabled adults who are in
daycare. Daycare providers are given a reimbursement for food costs for each
child claimed; to include their own if the household is income-eligible. The
applicants are taught about the importance of nutritious meals and health
practices which will not only benefit the children in care, but the entire family for
healthier liv ing. Any person 18 years of age or older that prov ides child care
serv ices for children that do not live with them is eligible for this program. Disabled adults are eligible only if a doctor's letter is available. All
prov iders must first undergo a background check and have a clearance in
hand before they can be registered in the program. The background check
takes approximately 4-6 weeks to clear and a copy of the clearance letter must
be provided to our offices before a monitor can be assigned. The registration
v isits can be conducted as early as a week.
Healthy Eating and Active Living Nutrition and exercise go hand in hand,
which is why CAA strives to encourage our clients to not only eat healthily, but
also encourage daily exercise practices. Through CAA’s Healthy Eating and
Active Living program, nutrition and are encouraged as a way of life and not a
diet.
4) Community Connections are made by working with community partners to
leverage resources and increase the impact of our serv ices for our clients and the
community.
Free Tax Preparation is another core service that CAASNM offers clients every
year. By prov iding this free program, clients are able to confidently have their
taxes filed without the burden of costly tax preparation businesses. In 2013,
clients received over $4 million in refunds by taking advantage of this free
serv ice! While clients are waiting in line to have their taxes done, our Total
Benefits Services case managers screen clients for services they may not know
they qualify for.
Coats4Kids provides warm winter jackets to nearly 3,000 children residing in the
Las Cruces area. Without the aid of this program, our fellow community children
would lack the proper attire to stay safe and warm during the winter months.
New coats/gently used coats are given out to children ages birth-5th grade who
preregister. US Bank partners with Community Action Agency of Southern New
Mexico, Comet Cleaners, and KVLC 101 Gold to sponsor Coats for Kids every
year. The event has taken place since 1995, distributing 33,000 coats to needy
children in Doña Ana County.
Cancer Aid Resources and Education (CARE) is a nonprofit organization
dedicated to establishing or assisting in serv ices, resources, general education,
and other additional serv ices that will help address the challenges that many
Doña Ana County cancer patients, children and adults, face while receiving
treatment for any type of cancer. CARE is committed to prov iding services to
improve the quality of life of our cancer patients and their loved ones so that
cancer suffering may be allev iated in Doña Ana County.

8
Children’s Reading Foundation provides reading materials to children in the
community so they can foster a love of reading at a young age. In addition,
CRF’s work allows children to get a head start on school readiness.
Population Profile: Doña Ana County
Doña Ana County is one of 33 counties in the state of New Mexico. I t was created in
1852 and is the second-most populated county in the state. The county comprises
3,804 square miles in south-central New Mexico, and borders El Paso County, Texas, to
the east and southeast. The county also shares its borders with the state of Chihuahua,
Mexico, directly south, Luna County to the west, Sierra County to the north and Otero
County to the east. There are many physically diverse areas within Doña Ana, including
mountain ranges, valleys and deserts.
Doña Ana County includes 37 of New Mexico’s 55 federally designated
underdeveloped communities, also referred to as "colonias". According to the U.S.
Department of Housing and Urban Development, 97 percent of colonias residents are
Hispanic with an average annual income of $5,000. About 85 percent of colonias
residents are U.S. citizens. These rural areas are without safe, sanitary and affordable
housing, drinkable water, sewer, and/or drainage systems (U.S. Department of Housing
and Urban Development). Many of the colonias are located in the northern and
southern areas of the county.
In 1900, the county hosted an agriculturally based society with a population of 10,187.
The market centers were Las Cruces, El Paso and Ciudad Juarez. By 1990, the county
was urbanized with a population of 135,510 and boasted an economy based on
serv ice and retail. Rapid population growth has occurred in and around the city of Las
Cruces, as well as in the southern part of the county. The part of the county north of Hill
remains primarily rural in nature.
The population has risen dramatically since 1900 and is expected to continue to grow
at a rapid pace (4 - 6 percent) during the next year. This translates to a 2015 population
of more than 300,000 people. The primary areas of growth will be in the Las Cruces
metropolitan area and in the southern sector of Doña Ana County.
The following data was collected throughout a 5 year period from 2007-2011 and
published in a Data Release in December 2012. Below the findings and data highlight
areas from population changes in Doña Ana County to the different levels of poverty
among indiv iduals and families. This data gives CAASNM the information needed to
know where the community stands in these different areas and thus work towards
finding out what it is that the community is already doing and what areas could be
improved upon.
Population Change. Total population of Doña Ana County increased by 17.72%
in an 11 year period; growing from 174,682 persons in 2000 to 205,637 persons in
2011.

9
Age and Gender Demographics. According to ACS 2007-2011 5 year population
estimates for the report area, the female population comprised 51.21% of the
report area, while the male population represented 48.79%.
Race Demographics. According to the American Community Survey 5 year
averages, white population comprised 94.22% of the report area, black
population represented 1.73%, and other races combined were 2.39%. Persons
identifying themselves as mixed race made up 1.66% of the population.
Poverty, 2011. 2011 poverty estimates show a total of 61,023 persons or 29.2% are
liv ing below the poverty rate in the report area.
Poverty Rate Change, 2000-2011. According to the U.S. Census, the poverty rate
for the 1 county area increased by 5.6%, compared to a statewide increase of
5.2%.
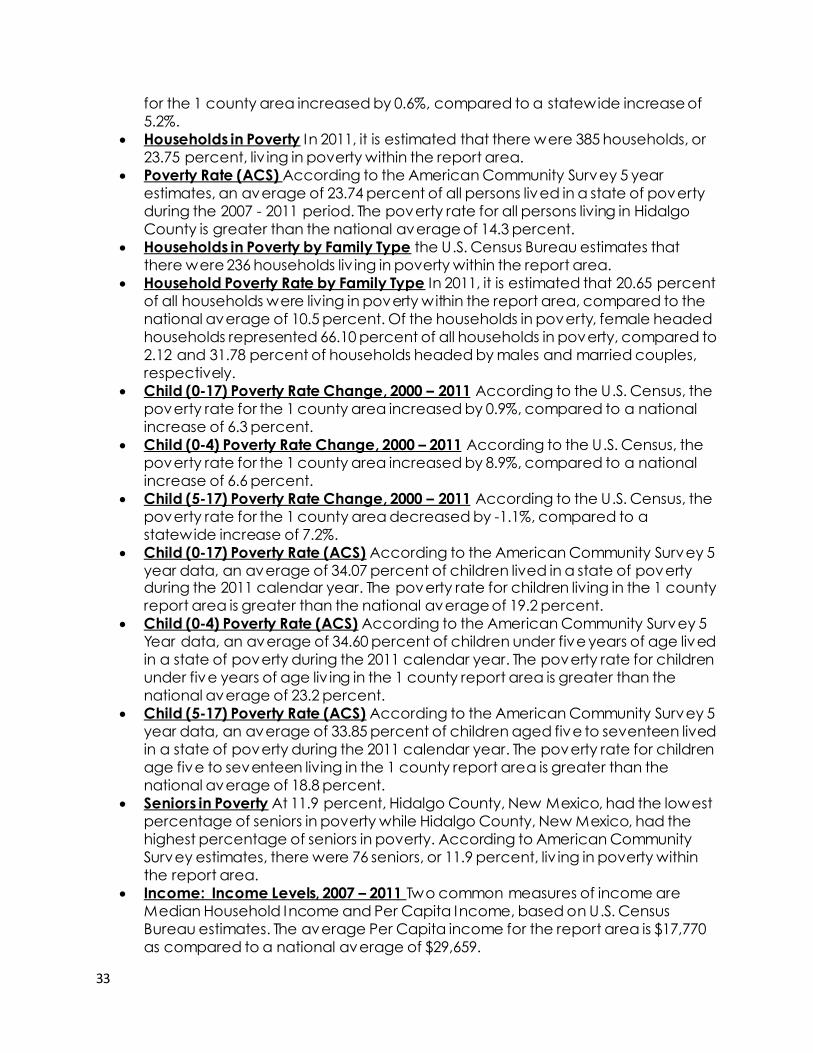
Households in Poverty. In 2011, it is estimated that there were 16,790 households,
or 23.08 percent, liv ing in poverty within the report area.
Poverty Rate (ACS) According to the American Community survey 5 years
estimates, an average of 25.55% of all persons lived in a state of poverty during
the 2007-2011 period. The poverty rate for all persons living in the 1 county report area is greater than the national average of 14.3%.
Households in Poverty by Family Type .The U.S. Census Bureau estimates that
there were 10,433 households liv ing in poverty within the report area.
Household Poverty Rate Family Type In 2011, it is estimated that 20.61 percent of
all households were living in poverty within the report area, compared to the
national average of 10.5%. Of the households in poverty, female headed
households represented 46.36 % of all households in poverty, compared to 8.62
and 45.02% of households headed by males and married couples, respectively.
Child (0-17) Poverty Rate Change, 2000-2011 The poverty rate change for all
children in the 1 county report area from 2000 to 2011 increased by 5.7%,
compared to a national increase of 6.3%
Child (0-17) Poverty Rate (ACS). According to the American Community Survey 5
year data, an average of 36.12 percent of children lived in a state of poverty
during the 2011 calendar year. The poverty rate for children living in the 1 county
report area is greater than the national average of 19.2 percent.
Child (0-4) Poverty Rate Change, 2000-2011. According to the U.S. Census, the
poverty rate for Dona Ana County increased by 10.9%, compared to a national
increase of 6.6%.
Child (0-4) Poverty Rate (ACS) . According to the American Community Survey 5
Year data, an average of 41.81 percent of children under five years of age lived
in a state of poverty during the 2011 calendar year. The poverty rate for children
under five years of age liv ing in the 1 county report area is greater than the
national average of 23.2 percent.
Child (5-17) Poverty Rate (ACS). According to the American Community Survey 5
year data, an average of 33.86 percent of children aged five to seventeen lived
in a state of poverty during the 2011 calendar year. The poverty rate for children
age five to seventeen living in the 1 county report area is greater than the
national average of 18.8 percent.
Seniors in Poverty. At 14.4 percent, Doña Ana County, New Mexico, had the
lowest percentage of seniors in poverty while Doña Ana County, New Mexico,

10
had the highest percentage of seniors in poverty. According to American
Community Survey estimates, there were 3,576 seniors, or 14.4 percent, liv ing in
poverty within the report area.
Income: Average annual income in Doña Ana County, New Mexico are $36,136
compared to the state average of $42,097.
POPULATION
POPULATION BY RACE
Las Cruces City Doña Ana County New Mexico United States
Number Percent Number Percent Number Percent Number (In
Millions) Percent
Total population 101,053 214,445 2,085,538 309.2
White 87,275 86.4% 191,507 89.3% 1,499,853 71.9% 229.3 74.2%
Black or African American
1,767 1.7% 3,597 1.7% 42,843 2.1% 38.8 12.6%
Asian 2,201 2.2% 2,602 1.2% 27,714 1.3% 14.8 4.8%
American Indian and Alaska Native
1,982 2.0% 2,787 1.3% 192,903 9.2% 2.5 0.8%
Native Hawaiian and
Other Pacific Islander 0 0.0% 0 0.0% 1,431 0.1% 0.5 0.2%
Some Other Race 4,806 4.8% 9,449 4.4% 255,095 12.2% 15.0 4.8%
Two or more Races 3,022 3.0% 4,503 2.1% 65,699 3.2% 8.3 2.7%
HISPANIC OR LATINO
Las Cruces City Dona Ana County New Mexico United States
Number Percent Number Percent Number Percent Number (In
Millions) Percent
Total population 101,053 214,445 2,085,538 309.2
Hispanic or Latino
(of any race) 58,575 58.0% 142,403 66.4% 979,724 47.0% 51 16.4%
Not Hispanic or Latino 42,478 42% 72,042 33.6% 1,105,814 53% 258,537,226 83.6%
White alone 35,627 35% 62,619 29.2% 827,066 39.7% 196,891,497 63.7%
Source: United States Census Bureau American Community Survey 2012 1-Year Estimates.
The U.S. Census Bureau treats race and ethnicity separately: the Bureau does not
classify Hispanic/Latino as a race, but rather as an identification of origin and
ethnicity.
In both the city of Las Cruces and Doña Ana County, Hispanics comprised the
majority of residents at 58% and 66%, respectively.

11
Needs Assessment Data for Doña Ana
County (Clients) Clients from Doña Ana County were surveyed and 86 people answered survey
questions regarding problem areas in southern New Mexico. 24 responders identified as
male, 55 as female. 57 identified as Hispanic/Mexican/Latino(a), 1 as Black, and 6 as
White/Caucasian.
The top 10: Responders were asked to select the top 10 issues they believed to be the
worst in their county. The biggest problem areas in Doña Ana County were identified as:
1. Unemployment 44.29% (31)
2. Child abuse and neglect 35.71% (25)
3. Family/domestic v iolence 32.86% (23)
4. Teenage pregnancy 32.86% (23)
5. Utilities (gas, water, electric, etc.) assistance 30.00% (21)
6. Gang v iolence 30.00% (21)
7. Transportation 25.71% (18)
8. Vacant buildings and run-down houses 24.29% (17)
9. Lack of affordable healthcare 17.14% (12)
10. Lack of low-income housing 15.71% (11)
Clients wrote in three answers that were not from the list of available choices:
Lack of facility to help youth with dyslexia
Cruelty to animals and drunk driv ing
Drugs and drug pushers
Outside of public assistance, have you used services in your area? 27 stated no and 9
stated yes. Of those that stated yes, the following services were used:
Utility assistance
Food assistance
What do you think are the
reasons for poverty where you
live?
Clients in DAC were asked from
the following reasons: lack of
jobs, lack of educational
opportunities, lack of financial
assistance for basic resources,
lack of transportation, and
disease/illness. Figure 3: Reasons for poverty in DAC

12
73.61% (53) stated lack of jobs, 11.11% (8) said lack of educational opportunities,
19.44% (14) said lack of financial assistance for basic resources, 15.28% (11) said lack of
transportation, and 11.11% (8) said disease/illness. Another client wrote in better wages.
What programs or services do you think your community needs?
More jobs 67.90% (55)
Better existing jobs 33.33% (27)
More assistance for basic necessities (rent, utilities, food, etc.) 25.93% (21)
More programs for youth 23.46% (19)
More programs for senior citizens 18.52% (15)
More programs for disabled indiv iduals 18.52% (15)
Better schools 17.28% (14)
More social/recreational outlets 16.05% (13)
More programs available in Spanish 14.81% (12)
Better transportation routes 12.35% (10)
Food assistance (pantries, community meals, etc.) 1.23% (1)
Better access to healthcare 0
A client also wrote in: more programs in the community for mentally disabled persons.
What serv ices do you think are most needed in your community for children?
More social/recreational outlets 41.10% (30)
Affordable daycare 36.99% (27)
Better access to healthy foods 35.60% (26)
Affordable healthcare 30.14% (22)
Better school system 24.66% (18)
More educational outlets (museums, libraries, etc.) 15.07% (11)
What serv ices that currently exist could be expanded to better meet your needs?
Improved school system Transportation More affordable health insurance
Unemployment Better jobs Childcare
Summer food program Free bus serv ice
What can the community do differently to improve the quality of life for people/families
liv ing in your county?
Create new jobs with higher wages
More activities for seniors living in the community and more affordable
healthcare
More jobs
More education
Nothing
Provide more liv ing units
Get rid of pollution and gangs
Take pride in what we have

13
What are three things you like about liv ing in your community?
First Choice Second Choice Third Choice Not much violence Friendly people Food assistance programs
Help from community Know a lot of people Living by relatives
Quiet Fresh air Close to hospital
Small size Close to everything Hospitality
Country living Education Right size town
Mild winters Weather Location
People get involved Traffic Climate
Friendly people Away from the city Friendly people
Peaceful Variety of stores Safe
Quiet Transportation Quick commute
What are three things you don’t like about liv ing in your community?
First Choice Second Choice Third Choice Not enough jobs No fences No stores
No transportation Animal roaming Nothing for teens
Not enough help Need more activ ities Domestic v iolence
No classes for adults Jobs available for seniors No streetlights
Not enough good paying jobs Child abuse No assistance for low incomes
Gangs Lack of transportation Rent is expensive
Dust Trash
Schools Daycares Water Bad water No money for education Racing No sidewalks Streets not paved No programs at senior center Crime Traffic Minimum wage too low Apathy Drugs and alcohol
What is an effective way to get residents more involved in the community?
Create more recreation/community centers
Get more people to attend events
Provide more activities
Encourage volunteer work
Better advertising
Have a day for residents to clean up the streets and recycle
Hold community meetings
Provide more family friendly activ ities
Hold fundraisers at the parks
Communication and advertising could be better
Provide free items for them

14
The rankings. Residents of Doña Ana County were asked to rank the following
programs/service in their county on a scale of 1-5. 1=low need, 5= high need, and
6=don’t know. Below you fill find the rankings:
1 Low Need– 2– 3– 4– 5 High Need– 6 Don't Know– Total– Average Rating–
Food assistance
20.69% 12
10.34% 6
18.97% 11
17.24% 10
24.14% 14
8.62% 5
58
3.40
Clothing/furniture assistance
18.64% 11
8.47% 5
30.51% 18
6.78% 4
23.73% 14
11.86% 7
59
3.44
Utility bill assistance
10.77% 7
4.62% 3
23.08% 15
29.23% 19
27.69% 18
4.62% 3
65
3.72
Emergency shelter
22.95% 14
6.56% 4
21.31% 13
19.67% 12
14.75% 9
14.75% 9
61
3.41
Affordable rental housing
15.15% 10
3.03% 2
19.70% 13
21.21% 14
30.30% 20
10.61% 7
66
3.80
First time home buyer's assistance
16.67% 10
5.00% 3
6.67% 4
23.33% 14
31.67% 19
16.67% 10
60
3.98
Availability of low-income housing
0.00% 0
0.00% 0
0.00% 0
0.00% 0
100.00% 1
0.00% 0
1
5.00
Employment placement
assistance
10.00% 6
6.67% 4
20.00% 12
15.00% 9
38.33% 23
10.00% 6
60
3.95
Job training: Adult
12.90% 8
8.06% 5
16.13% 10
30.65% 19
24.19% 15
8.06% 5
62
3.69
Job training: Youth
12.07% 7
8.62% 5
22.41% 13
25.86% 15
24.14% 14
6.90% 4
58
3.62
Job training: Bilingual
18.52% 10
7.41% 4
20.37% 11
18.52% 10
24.07% 13
11.11% 6
54
3.56
Job training: Disabled
14.29% 8
7.14% 4
17.86% 10
21.43% 12
25.00% 14
14.29% 8
56
3.79
Job training: Vocational
13.79% 8
5.17% 3
17.24% 10
20.69% 12
29.31% 17
13.79% 8
58
3.88
Money for education
5.08% 3
3.39% 2
15.25% 9
25.42% 15
38.98% 23
11.86% 7
59
4.25
Financial literacy classes
14.29% 8
7.14% 4
17.86% 10
26.79% 15
16.07% 9
17.86% 10
56
3.77
GED/HS completion support programs
16.07% 9
7.14% 4
16.07% 9
17.86% 10
33.93% 19
8.93% 5
56
3.73
Transition to college support programs
16.95% 10
3.39% 2
18.64% 11
20.34% 12
30.51% 18
10.17% 6
59
3.75

15
1 Low Need– 2– 3– 4– 5 High Need– 6 Don't Know– Total– Average Rating–
Nutritional education
15.52% 9
8.62% 5
20.69% 12
18.97% 11
25.86% 15
10.34% 6
58
3.62
Parenting classes 16.95% 10
3.39% 2
16.95% 10
22.03% 13
27.12% 16
13.56% 8
59
3.80
Low cost
counseling (adult)
8.93% 5
7.14% 4
10.71% 6
16.07% 9
42.86% 24
14.29% 8
56
4.20
Low cost counseling (youth)
10.91% 6
7.27% 4
16.36% 9
12.73% 7
36.36% 20
16.36% 9
55
4.05
Emergency counseling services
12.73% 7
5.45% 3
16.36% 9
21.82% 12
29.09% 16
14.55% 8
55
3.93
Affordable childcare
20.00% 11
5.45% 3
9.09% 5
20.00% 11
29.09% 16
16.36% 9
55
3.82
Affordable adult care
13.79% 8
12.07% 7
5.17% 3
20.69% 12
34.48% 20
13.79% 8
58
3.91
Budget and/or credit counseling
18.52% 10
7.41% 4
22.22% 12
16.67% 9
22.22% 12
12.96% 7
54
3.56
Tax preparation assistance
22.41% 13
12.07% 7
13.79% 8
20.69% 12
29.31% 17
1.72% 1
58
3.28
Legal assistance 15.52% 9
13.79% 8
17.24% 10
18.97% 11
27.59% 16
6.90% 4
58
3.50
Accessing health insurance coverage
17.24% 10
5.17% 3
10.34% 6
25.86% 15
32.76% 19
8.62% 5
58
3.78
Assistance buying prescriptions
15.79% 9
7.02% 4
15.79% 9
22.81% 13
33.33% 19
5.26% 3
57
3.67
Home
healthcare/in home nursing
16.67% 10
8.33% 5
13.33% 8
23.33% 14
31.67% 19
6.67% 4
60
3.65
General medical expenses
13.21% 7
5.66% 3
18.87% 10
22.64% 12
35.85% 19
3.77% 2
53
3.74
Dental care 14.29% 8
10.71% 6
8.93% 5
25.00% 14
37.50% 21
3.57% 2
56
3.71
Eyeglasses 15.79% 9
10.53% 6
12.28% 7
17.54% 10
40.35% 23
3.51% 2
57
3.67
Transportation services
15.79% 9
7.02% 4
10.53% 6
19.30% 11
36.84% 21
10.53% 6
57
3.86

16
Do you feel that this is your community? 55 people responded to this question. 80.00%
(44) stated yes and 20.00% (11) stated no. No reasons were given for answering no and
the following reasons were given for yes:
Because I live here
Nice and welcoming people
Just feel accepted
Work
Friendly people
Born and raised here
Family and friends
Help for senior citizens
When you come to CAASNM for help, do you feel that you have a say in what it is
you/your family needs? 49 people answered this question: 73.47% (36) stated yes and
26.53 % (13) stated no.
Do you help out or support agencies in this community? 51 clients responded to this
question with 54.90% (28) stating yes and 45.10% (23) stating no. The following
information was given:
Volunteer
Donate clothing and furniture
Canvassing and registering people to vote
Donate clothes and canned goods
Provide assistance to elderly neighbor
Make financial contributions
Make referrals to proper
agencies
Help with commodities
distribution
Do you have a computer (or
other device with wireless
internet) at home? 52
responders answered this
question and 42.31% (22) stated
yes while 57.69% (30) stated no.
Why do you use the internet?
Clients were asked why they use
the internet. 46.43% (13) stated
because of work/employment,
39.29% (11) for school, 53.57%
(15) for bill pay, 50.00% (14) for social media, and 21.43% (6) stated for healthcare
purposes. An “other” column was provided and the following reasons were given:
Figure 4: Internet Use DAC
17
Children use it for school
I don’t use the internet
Not computer savvy
Sweepstakes
Pleasure
Research
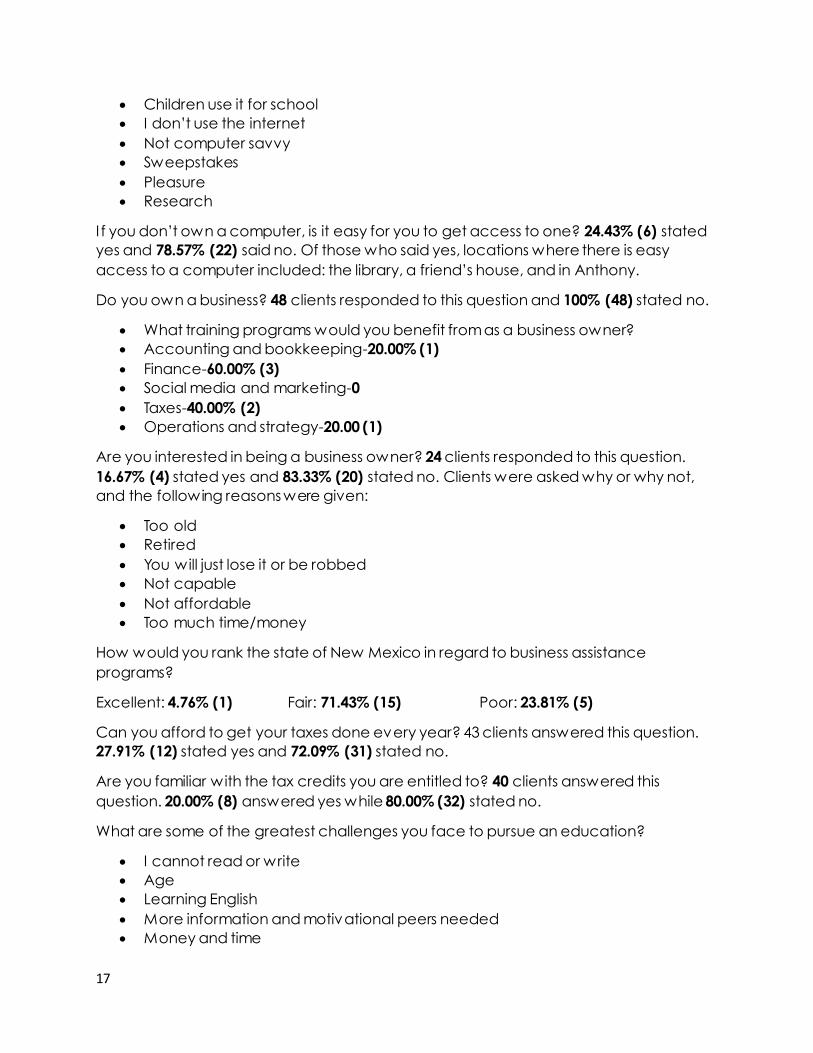
I f you don’t own a computer, is it easy for you to get access to one? 24.43% (6) stated
yes and 78.57% (22) said no. Of those who said yes, locations where there is easy
access to a computer included: the library, a friend’s house, and in Anthony.
Do you own a business? 48 clients responded to this question and 100% (48) stated no.
What training programs would you benefit from as a business owner?
Accounting and bookkeeping-20.00% (1)
Finance-60.00% (3)
Social media and marketing-0
Taxes-40.00% (2)
Operations and strategy-20.00 (1)
Are you interested in being a business owner? 24 clients responded to this question.
16.67% (4) stated yes and 83.33% (20) stated no. Clients were asked why or why not,
and the following reasons were given:
Too old
Retired
You will just lose it or be robbed
Not capable
Not affordable
Too much time/money
How would you rank the state of New Mexico in regard to business assistance
programs?
Excellent: 4.76% (1) Fair: 71.43% (15) Poor: 23.81% (5)
Can you afford to get your taxes done every year? 43 clients answered this question.
27.91% (12) stated yes and 72.09% (31) stated no.
Are you familiar with the tax credits you are entitled to? 40 clients answered this
question. 20.00% (8) answered yes while 80.00% (32) stated no.
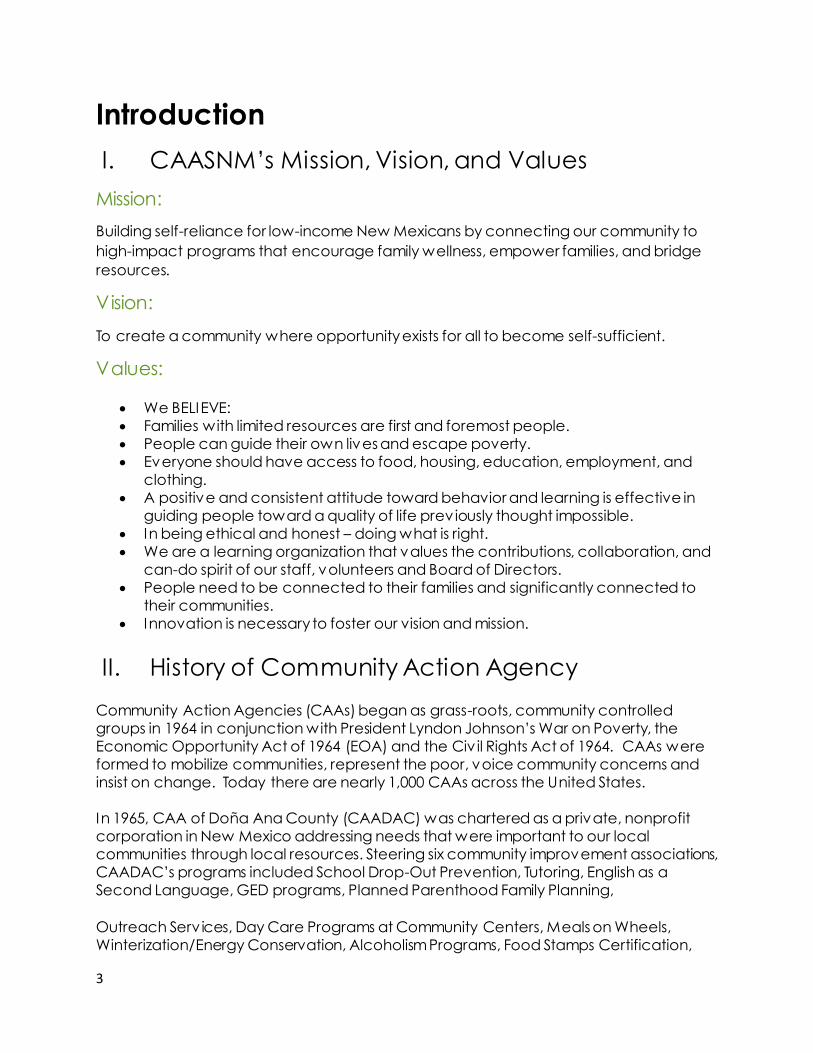
What are some of the greatest challenges you face to pursue an education?
I cannot read or write
Age
Learning English
More information and motivational peers needed
Money and time

18
Lack of a ride
Lack of support
Finding work
I llness
CAASNM has identified the needs from the community and as we strive to expand
programming to reflect the needs of our community, we are already currently
addressing needs through several of our existing programs. Below you will find a chart to
reflect these programs in Doña Ana County.
Need: How CAASNM is addressing it:
Utility bill assistance Total Benefits Screening
Affordable healthcare Total Benefits Screening
Healthy foods for children CACFP/Healthy Kids Healthy Childcare
Needs Assessment Data for Doña Ana
County (Organizational) Representatives from social service organizations in Doña Ana County were asked to
prov ide information regarding programs and services for low-income residents in their
county. Below you will find the results from people who represent the areas of:
Healthcare Youth serv ices Housing
Senior serv ices Homeless serv ices Education Energy Food Faith based serv ices
Gov ernment Transportation Hospice
Parenting skills/support Tax serv ices Domestic v iolence
Disabilities and advocacy serv ices Small business assistance
Responders were asked to identify the top three needs of their county from the
following needs:
Transportation Mental health Education
Unemployment Environmental hazards Teenage pregnancy
Domestic violence Substance abuse Lack of affordable childcare
Gang violence Physical health Lack of low-income housing
Programs for seniors Programs in Spanish Programs for LGBTQ
Child abuse/neglect Safety for citizens Vacant buildings/rundown houses
Teenage delinquency Utilities assistance More recreation/social outlets
Roads/street repair Lack of transportation Flooding, sewage, water services
Communicable diseases Healthcare Services for deaf/hard of hearing
Other

19
The top three needs identified in Dona Aña County are:
1. Education-38
2. Unemployment-34
3. Low-income housing-25
Responders wrote in the following issues that they believe to be the worst that weren’t
on the original list:
Citizenship
Lack of jobs that pay a liv ing wage
Food insecurity
Skills classes for entry-level positions
Food insecurity
Literacy classes and ESL classes
Substance abuse issues
Besides lack of funding, what are the systematic barriers to addressing the needs you
just described?
Lack of education/awareness of need (57)
Policy (46)
Lack of agencies offering services (40)
Responder also wrote in that they believe:
Politics
Insufficient public funding
Lack of jobs that pay a liv ing wage
And funding for agencies that offer services
Are systematic barriers to addressing needs.
What basic family sustainability programs are missing from your community?
Community information services
Educational programs
Spanish speaking mental health prov iders
Transportation, especially for southern residents
Affordable housing
Serv ices in rural communities, not just Las Cruces

20
Parenting classes
Are existing serv ices in your
community adequate to address
self-sufficiency or are there gaps?
91.46% (75) believed that there
are gaps in services while 8.54%
(7) think current services are
adequate.
What other services are needed?
Agencies that work
together, not in silos
Access to affordable mental health serv ices for all for substance abuse, dv, and
child abuse
Low cost legal services
County wide transportation
More affordable housing
More homeless shelters
Support for children (tutoring, mentoring, early childhood programs/intervention,
activ ities for youth, etc.)
No other services are needed-we need to appropriately fund the existing
serv ices
Childcare
Sports for everyone
More housing programs
Beyond funding, what would be needed to implement these needed serv ices in your
county?
Partnerships-54
Community involvement/awareness-51
Building space-26
Responders also wrote in the following suggestions:
Adequately trained and sustained leaders
Working together is a must for nonprofit organizations
A sense of a priority about this
I s your community doing a good job or coordinating service delivery and leveraging
resources?
Knowledge of community resources-33
Strong partnerships-19
Strong referral program-13
Figure 5: Services in Doña Ana County

21
How is this being done?
We give our program participants community resources that they have
indicated they need. I t’s up to them to make the phone call and set up an
appointment
No, we are not doing a good job-but we are doing better since we have an
interagency council
I think we are lacking in all three resources listed above
Coalition meetings
Things are coming along much better than five years ago
Need to improve and formalize partnerships
What community resources are having the greatest impact and should be enhanced
or expanded?
Health services
Food programs
Homeless shelters and serv ices for transient population
Income support-SNAP benefits and Medicaid
Pomotoras, Colonias Development Council, Catholic Charities, Tierra del Sol, NM
Center on Law and Poverty
Doña Ana Community College
Serv ices are needed in rural areas
What new programs would you like to see offered for families to become more self-
sufficient?
Day care programs
Parenting classes along with budgeting, nutrition, mental health wellness, and
job skill building
Training and apprenticeship programs
Training on navigating public agencies
Closer case management and better follow up
Civ ic engagement and leadership development
More literacy programs for deaf and hard of hearing indiv iduals
Opportunities for graduates to stay in New Mexico instead of leaving the state to
find a job
Stop with the sense of “entitlement”
How do you currently get people to participate/engaged in community events?
Accessible location/advertising-40
Free food/free admission to event-37
Social media-29
Giveaways-22
Other suggestions were:
Free childcare so parents can participate

22
Pulpit announcements
Safe environment
Interpreters are provided
Emails are sent out
Door to door recruitment
Community resource fairs
What would you like to see happen to get people more engaged in the community?
More programs for teens
More support from local, county, and state politicians
More outreach efforts
Pastors partnering with agencies in the community for the common good
Neighborhood meetings
Stronger referral program
Collaboration
CAASNM has identified the needs from the community and as we strive to expand
programming to reflect the needs of our community, we are already currently
addressing needs through several of our existing programs. Below you will find a chart to
reflect these programs in Doña Ana County.
Need: How CAASNM is addressing it:
Education Free computer literacy courses
Literacy classes Free financial literacy courses
Population Profile: Grant County
Located in southwestern New Mexico, Grant County is home to the Gila National Forest
and Wilderness, several mountain ranges, desert lands, and the Mimbres and Gila
Rivers. The County’s southern border extends to the border with Mexico and the
northern border touches rural Catron County. The state of Arizona and Hidalgo County
border Grant County to the west with Luna and Sierra Counties to the east. Grant
County’s 29,514 residents make up only 1.4% of the state’s total population and are
scattered across the county’s 3,966 square miles. Grant County has the 19th highest
population of the 33 counties in New Mexico, according to the 2010 Census. Residents
can be isolated, with 7.4 people per square mile as compared with New Mexico’s 17.0
people per square mile or the nation’s 87.4 people per square mile. Over half of the
county’s residents (54%) live in the county’s four incorporated municipalities: Silver City,
Bayard, Santa Clara, and Hurley. Silver City is the County Seat and the commercial and
government center for the region. The majority of the county’s physical assets, including
health care and social serv ices facilities, are located in Silver City.

23
The following data represents information obtained from the U.S. 2010 Census and
estimates from the American Community Survey 5 year population estimates for Grant
County, NM:
Population Change During the eleven-year period, total population estimates for
the report area declined by -4.25%, decreasing from 31,002 persons in 2000 to
29,684 persons in 2011.
Age and Gender Demographics The female population comprised 50.88% of the
report area, while the male population represented 49.12%.
Race Demographics White population comprised 93.5% of the report area, black
population represented 0.61%, and other races combined were 3.12%. Persons
identifying themselves as mixed race made up 2.77% of the population.
Poverty, 2011 2011 poverty estimates show a total of 5,924 persons living below
the poverty rate in the report area.
Poverty Rate Change, 2000 – 2011 The poverty rate for the 1 county area
increased by 2.3%, compared to a statewide increase of 5.2%.
Households in Poverty In 2011, it is estimated that there were 1,957 households, or
15.82 percent, liv ing in poverty within the report area.
Poverty Rate (ACS) An average of 16.58 percent of all persons lived in a state of
poverty during the 2007 - 2011 period. The poverty rate for all persons living in the
1 county report area is greater than the national average of 14.3 percent.
Child (0-17) Poverty Rate Change, 2000 - 2011According to the U.S. Census, the
poverty rate for the 1 county area increased by 5.8%, compared to a national
increase of 6.3 percent.
Child (0-4) Poverty Rate Change, 2000 – 2011 According to the U.S. Census, the
poverty rate for the 1 county area increased by 1.9%, compared to a national
increase of 6.6 percent
Child (5-17) Poverty Rate Change, 2000 - 2011According to the U.S. Census, the poverty rate for the 1 county area increased by 8%, compared to a statewide
increase of 7.2%.
Child (0-17) Poverty Rate (ACS) An average of 26.30 percent of children lived in
a state of poverty during the 2011 calendar year. The poverty rate for children
liv ing in the 1 county report area is greater than the national average of 19.2
percent
Child (0-4) Poverty Rate (ACS) An average of 36.51 percent of children under
five years of age lived in a state of poverty during the 2011 calendar year. The
poverty rate for children under five years of age liv ing in the 1 county report area
is greater than the national average of 23.2 percent.
Child (5-17) Poverty Rate (ACS) An average of 22.31 percent of children aged
five to seventeen lived in a state of pov erty during the 2011 calendar year. The
poverty rate for children age five to seventeen living in the 1 county report area
is greater than the national average of 18.8 percent.
Seniors in Poverty At 5.6 percent, Grant County, New Mexico, had the lowest
percentage of seniors in poverty while Grant County, New Mexico, had the
highest percentage of seniors in poverty. There were 339 seniors, or 5.6 percent,
liv ing in poverty within the report area
Income: Income Levels, 2007 - 2011Two common measures of income are
Median Household Income and Per Capita Income, based on U.S. Census

24
Bureau estimates. Both measures are shown for the 1 county report area in Table
32. The average Per Capita income for the report area is $21,726 as compared
to a national average of $29,659.
Needs Assessment Data for Grant County
(Clients) The survey was sent to clients residing in Grant county and 2 persons responded. 1
identified as male and 1 identified as female. 1 identified as white and the other client
did not respond.
Responders in Grant County believe that the top 10 needs of people in their community
are as follows:
1. Substance abuse issues- 50.00% (1)
2. Lack of affordable healthcare-50.00% (1)
3. Unemployment-50.00% (1)
4. Environmental hazards-50.00% (1)
5. Teenage pregnancy-50.00% (1)
6. Lack of childcare-50.00% (1)
7. Family/domestic v iolence-50.00% (1)
8. Education-50.00% (1)
9. Gang v iolence-50.00% (1)
10. Mental health services-50.00% (1)
1 person also added to the “other” section and identified: low access to participate in
the creative process as one of the biggest needs for Grant County that was not on the
list.
Clients were asked, outside of public assistance, have you ever used services in your
area? 1 responder said no and 1 said yes-indigent fund for surgery.
Clients were asked what they thought were the reasons for poverty in their county and
none of the presented choices were selected. Respondents wrote in the following:
Indifference to education by students and parents
Lack of leadership, v ision, and resiliency
Clients were then asked what programs or services they thought their county needed.
Responders responded with the following:
Better existing jobs
Multi-cultural, intergenerational programs for working and learning together
Clients were asked what services that currently exist could be enhanced or expanded
to better meet your needs. Clients responded with the following:

25
Getting a cinema and a decent newspaper
Collaborative engagement in civ il improvement and community building
What can the community do differently to improve the quality of life for people/families
liv ing in your county?
Get rid of the v ictim mentality and foster an appreciation of the value of
education
Recognize our common interests, celebrate our diversity, and help each other
Three things you like about liv ing in your community:
Three things you don’t like about liv ing in your community:
What is an effective way to get residents involved in the community?
I only wish I knew
Initiate a small, community-based effort with a simple objective that can be
v isibly successful
Use appreciative inquiry and community mapping to identify community
capitals
Invest those to address one or two improvements that people can work together
Rankings: Clients were asked to rank the following programs/services in their county
with the following scale of 1-5. 1=low need, 5=high need, and 6= don’t know.
–
1 Low Need 2 3 4 5 High Need 6 Don't Know Total Average Rating
Food assistance 100.00% 2
0.00% 0
0.00% 0
0.00% 0
0.00% 0
0.00% 0
2
1.00
Clothing/furniture assistance
100.00% 2
0.00% 0
0.00% 0
0.00% 0
0.00% 0
0.00% 0
2
1.00
Utility bill assistance
100.00% 2
0.00% 0
0.00% 0
0.00% 0
0.00% 0
0.00% 0
2
1.00
Emergency shelter
100.00% 2
0.00% 0
0.00% 0
0.00% 0
0.00% 0
0.00% 0
2
1.00
Affordable rental
housing
50.00% 1
0.00% 0
0.00% 0
0.00% 0
50.00% 1
0.00% 0
2
3.00
First time home buyer's assistance
50.00% 1
0.00% 0
0.00% 0
0.00% 0
50.00% 1
0.00% 0
2
3.00
First Choice Second Choice Third Choice Climate Size Friendly attitude
Outdoors Small Interesting people
First Choice Second Choice Third Choice Lack of enforcement on dog ordinance
Lack of cinema Lack of a decent newspaper
Requirement of having a vehicle

26
–
1 Low Need 2 3 4 5 High Need 6 Don't Know Total Average Rating
Availability of low-income housing
0.00% 0
0.00% 0
0.00% 0
0.00% 0
0.00% 0
0.00% 0
0
0.00
Employment placement
assistance
50.00% 1
0.00% 0
0.00% 0
0.00% 0
50.00% 1
0.00% 0
2
3.00
Job training: Adult
50.00% 1
0.00% 0
0.00% 0
0.00% 0
50.00% 1
0.00% 0
2
3.00
–Job training: Youth
50.00% 1
0.00% 0
0.00% 0
0.00% 0
50.00% 1
0.00% 0
2
3.00
Job training: Bilingual
50.00% 1
0.00% 0
0.00% 0
0.00% 0
50.00% 1
0.00% 0
2
3.00
Job training: Disabled
50.00% 1
0.00% 0
0.00% 0
0.00% 0
50.00% 1
0.00% 0
2
3.00
Job training: Vocational
50.00% 1
0.00% 0
0.00% 0
0.00% 0
50.00% 1
0.00% 0
2
3.00
Money for education
50.00% 1
0.00% 0
0.00% 0
0.00% 0
50.00% 1
0.00% 0
2
3.00
Financial literacy classes
50.00% 1
0.00% 0
0.00% 0
0.00% 0
50.00% 1
0.00% 0
2
3.00
GED/HS completion support programs
50.00% 1
0.00% 0
0.00% 0
0.00% 0
50.00% 1
0.00% 0
2
3.00
Transition to college support programs
50.00% 1
0.00% 0
0.00% 0
0.00% 0
50.00% 1
0.00% 0
2
3.00
Nutritional education
50.00% 1
0.00% 0
0.00% 0
0.00% 0
50.00% 1
0.00% 0
2
3.00
Parenting classes 50.00% 1
0.00% 0
0.00% 0
0.00% 0
50.00% 1
0.00% 0
2
3.00
Low cost counseling (adult)
50.00% 1
0.00% 0
0.00% 0
0.00% 0
50.00% 1
0.00% 0
2
3.00
Low cost counseling (youth)
50.00% 1
0.00% 0
0.00% 0
0.00% 0
50.00% 1
0.00% 0
2
3.00
Emergency counseling services
50.00% 1
0.00% 0
0.00% 0
0.00% 0
50.00% 1
0.00% 0
2
3.00
Affordable childcare
50.00% 1
0.00% 0
0.00% 0
0.00% 0
50.00% 1
0.00% 0
2
3.00
Affordable adult care
50.00% 1
0.00% 0
0.00% 0
0.00% 0
50.00% 1
0.00% 0
2
3.00
Budget and/or credit counseling
50.00% 1
0.00% 0
0.00% 0
0.00% 0
50.00% 1
0.00% 0
2
3.00

27
–
1 Low Need 2 3 4 5 High Need 6 Don't Know Total Average Rating
Tax preparation assistance
50.00% 1
0.00% 0
0.00% 0
0.00% 0
50.00% 1
0.00% 0
2
3.00
Legal assistance 50.00% 1
0.00% 0
0.00% 0
0.00% 0
50.00% 1
0.00% 0
2
3.00
Accessing health
insurance coverage
50.00% 1
0.00% 0
0.00% 0
0.00% 0
50.00% 1
0.00% 0
2
3.00
Assistance buying prescriptions
50.00% 1
0.00% 0
0.00% 0
0.00% 0
50.00% 1
0.00% 0
2
3.00
Home healthcare/in home nursing
0.00% 0
50.00% 1
0.00% 0
0.00% 0
50.00% 1
0.00% 0
2
3.50
General medical expenses
0.00% 0
0.00% 0
0.00% 0
0.00% 0
100.00% 1
0.00% 0
1
5.00
Dental care 50.00% 1
0.00% 0
0.00% 0
0.00% 0
50.00% 1
0.00% 0
2
3.00
Eyeglasses
50.00% 1
0.00% 0
0.00% 0
0.00% 0
50.00% 1
0.00% 0
2
3.00
Transportation services
50.00% 1
0.00% 0
0.00% 0
0.00% 0
50.00% 1
0.00% 0
2
3.00
Do you feel that this is your community? Both responders answered yes to this question
When you come to CAASNM for help, do you feel you have a say in what it is you/your
family needs? 1 responder answered this question and stated no because they have
never been here before
Do you help out or support agencies in your community? Both responders answered
yes and one wrote in that they volunteer through the American Legion programs
Do you have a computer (or other device with internet) at home? Both responders
answered yes to this question.
Why do you use the internet? 1 responder answered and stated they use the internet
for work/employment purposes
Do you own a business? 1 responder answered yes and the other answered no
What are some challenges you face as a business owner? Distance
What training programs would you benefit from as a business owner? Accounting and
bookkeeping, social media and marketing
Are you interested in being a business owner? 1 person answered this question and
stated no

28
How would you rate the state of New Mexico in regard to the availability of business
assistance programs?
Poor-50.00% (1) Fair-50.00%(1)
Can you afford to get your taxes done every year? 2 responders answered this question
and both stated yes.
Are you familiar with the tax credits you are entitled to? Both responders answered this
question. 1 answered yes and the other stated no.
What are your greatest challenges to pursue an education?
Costs
CAASNM has identified the needs from the community and as we strive to expand
programming to reflect the needs of our community, we are already currently
addressing needs through several of our existing programs. Below you will find a chart to
reflect these programs in Grant County.
Need: How CAASNM is addressing it:
Healthcare Total Benefits Screening
Education Free financial literacy courses and free
computer courses
Education costs IDA program for students
Needs Assessment Data for Grant County
(Organizational)
Social serv ice providers in Grant County were asked to answer questions regarding
issues related to poverty in their county. 14 prov iders responded from Grant County and
below you will find the results to these surveys. Responders represented the following
areas:
Healthcare Youth serv ices Housing
Senior serv ices Homeless serv ices Education
Food Faith-based serv ices Government
Env ironmental protection Immediate disaster relief Alternative financial services
Art/cultural literacy
Responders were asked to identify the top three needs of their county from the
following needs:
Transportation Mental health Education
Unemployment Environmental hazards Teenage pregnancy
Domestic violence Substance abuse Lack of affordable childcare
Gang violence Physical health Lack of low-income housing

29
Programs for seniors Programs in Spanish Programs for LGBTQ
Child abuse/neglect Safety for citizens Vacant buildings/rundown houses
Teenage delinquency Utilities assistance More recreation/social outlets
Roads/street repair Lack of transportation Flooding, sewage, water services
Communicable diseases Healthcare Services for deaf/hard of hearing
Other
The top 3 needs for Grant County are:
1. Education-8
2. Unemployment-5
3. Low-income housing-5
Responders were asked aside from funding, what are the systematic barriers to
addressing these needs addressed? All 14 responded to this question and 10 stated
because of lack of education/awareness of need, 6 believed it was because of a lack
of agencies offering services, and 4 stated due to policy. Responders also wrote in: job
training programs do not place trainees into permanent positions and collaboration
between organizations is not present.
What basic family sustainability programs are missing from your county?
Grassroots leadership development and civ ic engagement opportunities for
community residents
Programs based and trying to aid an indiv idual/family out of their current
situation
Teaching clients how to change lifestyles/habits for the better, so they don’t
require additional assistance
Lack of information on agencies’ methods of program qualifications
Fair, low-cost small loans
Livable wage of permanent employment
Lack of fair and affordable lending and financial serv ices for homes, land site,
and small business
Art workshops for audiences of all ages

30
Are the serv ices in your county adequate
or are there gaps in serv ices?
84.62% (11) believe there are gaps while
15.38% (2) believe existing services are
adequate
What other services are needed? The
following services have been identified as
the most needed in Grant County:
Transportation
Affordable housing
Small business assistance
Outcome-based programs as opposed
to the Band-Aid approach
Rehab/detox center
Financial literacy programs
Leadership and governance training
Mentoring of local and state elected government officials
Crisis emergency housing and relocation during fires, floods, disasters
Assistance for colonias (gas heating)
Arts/culture workshops
Beyond funding, what would be required to implement needed services in your
community? Responders were asked from the following selections: Community
involvement/awareness 9, partnerships 9, and building space 4. Another responder
wrote in that there needs to be collaboration within the local entities to incorporate
needed serv ices in Grant County.
I s your community doing a good job coordinating service delivery and of leveraging
resources? Strong partnerships-5, knowledge of community resources-5, and strong
referral program-2.
What community resources are having the greatest impact and should be enhanced
or expanded?
Promotoras Colonias development council Food systems
United Way Art workshops
What new programs would you like to see offered to help low -income indiv iduals
become more self-sufficient?
Civ ic engagement and leadership development
IDA programs
Partnerships between business and social sector
Small loan industries that are not predatory
Accountability for existing programs
Figure 6: Services in Grant County

31
Improved jobs and liv ing wage
Fair lending to purchase homes
Small business financing
Family writing and arts workshops
How do you currently get people to participate/engage in community events?
Accessible location-9, free admission-8, advertising-7, social media-6, free food-6,
giveaways- 4. Another responder wrote in word of mouth as many low -income people
do not buy newspapers and don’t own a computer.
What would you like to see happen to get more people engaged in the community?
Representatives from Grant County answered with the following:
More investments in models that work
An army of outreach workers/promotoras trained to facilitate access to services
and information
Ability to join forces and shared v isions to come to reality
Greater media presence on important issues
Asking residents what they need and want…don’t assume we know
More family workshops and interactive events
CAASNM has identified the needs from the community and as we strive to expand
programming to reflect the needs of our community, we are already currently
addressing needs through several of our existing programs. Below you will find a chart to
reflect these programs in Grant County.
Need: How CAASNM is addressing:
Asking residents what they need and want;
don’t assume we know
Conducting Community Needs Assessments
Education/awareness of community needs Conducting needs assessments (awareness)
and community resources fairs and events
(education)
Education Free computer literacy courses and free
financial literacy courses
Financial literacy courses Free financial literacy courses
Population Profile: Hidalgo County
Located in the deep southwest along the borders of Arizona and Mexico, Hidalgo
County began as farming, ranching, and mining communities long before statehood in
1912. With a population of 4,894 and an area of 3,445.63 square miles, it averages 1.4
persons per square mile.

32
Hidalgo County was formed from Grant County in 1919, with the county seat in
Lordsburg. I t was named in honor of Miguel Dolores Hidalgo, who led the revolution in
Mexico in 1810, which eventually led to its independence from Spain. The county
“towns” are Virden, Lordsburg, Cotton City, Animas, and Rodeo.
Panoramic mountain horizons and spectacular views of the sky are only part of the
county’s appeal.
The area that is now southern Hidalgo County belonged to Mexico until 1853, when the
Gadsden Purchase finally resolved border disputes following the Treaty of Guadalupe
Hidalgo, which ended the Mexican-American War. The purchase added lands south of
the Gila River and east of the Rio Grande to United States holdings. The U.S. particularly
wanted the land in order to build a southern transcontinental railroad.
After New Mexico became a state in 1912, the residents of southern Grant County had
to travel up to 130 miles north to the county seat of Silver City. The land was sparsely
populated and few roads maintained. This caused problems that were best solved by a
shift of county distribution.
On February 25, 1919, state legislators passed a bill to create Hidalgo County from the southernmost section of Grant County. The county seat was to be Lordsburg, which
was named after railroad supervisor Delbert Lord, who envisioned a town
halfway between El Paso, Texas and Tucson, Arizona.
The county courthouse was not built until 1927 and is still in use today.
The following data was collected throughout a 5 year period from 2007-2011 and
published in a Data Release in December 2012. Below the findings and data highlight
areas from population changes in Hidalgo County to the different levels of poverty
among indiv iduals and families. This data gives CAASNM the information needed to
know where the community stands in these different areas and thus work towards
finding out what it is that the community is already doing right and what areas could be
improved upon.
Population Change During the eleven-year period, total population estimates for
the report area declined by -16.5%, decreasing from 5,932 persons in 2000 to
4,953 persons in 2011.
Age and Gender Demographics According to ACS 2007-2011 5 year population
estimates for Hidalgo County, the female population comprised 50.93% of the
report area, while the male population represented 49.07%.
Race Demographics. According to the American Community Survey 5 year
averages, white population comprised 95.35% of the report area, black
population represented 3.47%, and other races combined were 0.64%. Persons
identifying themselves as mixed race made up 0.54% of the population.
Poverty, 2011 2011 poverty estimates show a total of 1,237 persons liv ing below
the poverty rate in the report area.
Poverty Rate Change, 2000 - 2011 According to the U.S. Census, the poverty rate
33
for the 1 county area increased by 0.6%, compared to a statewide increase of
5.2%.
Households in Poverty In 2011, it is estimated that there were 385 households, or
23.75 percent, liv ing in poverty within the report area.
Poverty Rate (ACS) According to the American Community Survey 5 year
estimates, an average of 23.74 percent of all persons lived in a state of poverty
during the 2007 - 2011 period. The poverty rate for all persons living in Hidalgo
County is greater than the national average of 14.3 percent.
Households in Poverty by Family Type the U.S. Census Bureau estimates that
there were 236 households liv ing in poverty within the report area.
Household Poverty Rate by Family Type In 2011, it is estimated that 20.65 percent
of all households were living in poverty within the report area, compared to the
national average of 10.5 percent. Of the households in poverty, female headed
households represented 66.10 percent of all households in poverty, compared to
2.12 and 31.78 percent of households headed by males and married couples,
respectively.
Child (0-17) Poverty Rate Change, 2000 – 2011 According to the U.S. Census, the
poverty rate for the 1 county area increased by 0.9%, compared to a national
increase of 6.3 percent.
Child (0-4) Poverty Rate Change, 2000 – 2011 According to the U.S. Census, the
poverty rate for the 1 county area increased by 8.9%, compared to a national
increase of 6.6 percent.
Child (5-17) Poverty Rate Change, 2000 – 2011 According to the U.S. Census, the
poverty rate for the 1 county area decreased by -1.1%, compared to a
statewide increase of 7.2%.
Child (0-17) Poverty Rate (ACS) According to the American Community Survey 5
year data, an average of 34.07 percent of children lived in a state of poverty during the 2011 calendar year. The poverty rate for children living in the 1 county
report area is greater than the national average of 19.2 percent.
Child (0-4) Poverty Rate (ACS) According to the American Community Survey 5
Year data, an average of 34.60 percent of children under five years of age lived
in a state of poverty during the 2011 calendar year. The poverty rate for children
under five years of age liv ing in the 1 county report area is greater than the
national average of 23.2 percent.
Child (5-17) Poverty Rate (ACS) According to the American Community Survey 5
year data, an average of 33.85 percent of children aged five to seventeen lived
in a state of poverty during the 2011 calendar year. The poverty rate for children
age five to seventeen living in the 1 county report area is greater than the
national average of 18.8 percent.
Seniors in Poverty At 11.9 percent, Hidalgo County, New Mexico, had the lowest
percentage of seniors in poverty while Hidalgo County, New Mexico, had the
highest percentage of seniors in poverty. According to American Community
Survey estimates, there were 76 seniors, or 11.9 percent, liv ing in poverty within
the report area.
Income: Income Levels, 2007 – 2011 Two common measures of income are
Median Household Income and Per Capita Income, based on U.S. Census
Bureau estimates. The average Per Capita income for the report area is $17,770
as compared to a national average of $29,659.

34
Needs Assessment Data for Hidalgo County
(Clients) The survey was sent to clients residing in Hidalgo County and 3 clients responded. 1
identified as female and the other 2 as male. Responders ranged in age from 48-59. 1 is
married, 1 is single, and 1 is divorced.
Top needs of Hidalgo County:
1. Unemlployement-100% (3)
2. Transportation-66.67% (2)
3. Education-66.67% (2)
4. Utilities (gas, water, electric, etc.) assistance-66.67% (2)
5. More recreational/social outlets-66.67% (2)
6. Lack of transportation-33.33% (1)
7. Lack of programs available in Spanish-33.33% (1)
8. Lack of affordable healthcare-33.33% (1)
9. Lack of low-income housing-33.33% (1)
10. Vacant buildings and run-down houses-33.33% (1)
Outside of public assistance, have you used emergency services in your community?
Yes, emergency food assistance.
What do you think are the reasons for poverty where you live?
Lack of educational opportunities and a weak job market
What programs of serv ices do you think your county needs?
More jobs
What services do you think are most needed for children?
More educational outlets (museums, libraries, etc.)
What services that currently exist could be enhanced or expanded to better meet your
needs?
Home health care
What can the community do differently to improve the quality of life for people/families
liv ing in your community?
Persuade officials to build more housing
What are three things you like about liv ing in your community?
1. Family
2. Friends
3. Safe and secure town with plenty of law enforcement
What are three things you don’t like about liv ing in your community?
1. No grocery stores

35
2. No movie theater
3. No Walmart in the neighborhood
The Rankings: Clients were asked to rank the following services in their community using
1=low need to 5=high need and 6=don’t know. The rankings for Grant County are as
follows: –
1 Low Need– 2– 3– 4– 5 High Need– 6 Don't Know–
Total– Average Rating–
Food assistance
0.00% 0
0.00% 0
0.00% 0
0.00% 0
100.00% 1
0.00% 0
1
5.00
Clothing/furniture assistance
0.00% 0
0.00% 0
0.00% 0
0.00% 0
100.00% 1
0.00% 0
1
5.00
Utility bill assistance
0.00% 0
0.00% 0
100.00% 1
0.00% 0
0.00% 0
0.00% 0
1
3.00
Emergency shelter
0.00% 0
100.00% 1
0.00% 0
0.00% 0
0.00% 0
0.00% 0
1
2.00
Affordable rental housing
0.00% 0
0.00% 0
0.00% 0
0.00% 0
100.00% 1
0.00% 0
1
5.00
First time home buyer's assistance
0.00% 0
0.00% 0
0.00% 0
0.00% 0
100.00% 1
0.00% 0
1
5.00
Availability of low-income housing
0.00% 0
0.00% 0
0.00% 0
0.00% 0
0.00% 0
0.00% 0
0
0.00
Employment placement assistance
0.00% 0
0.00% 0
0.00% 0
0.00% 0
100.00% 1
0.00% 0
1
5.00
Job training: Adult
0.00% 0
0.00% 0
0.00% 0
0.00% 0
0.00% 0
0.00% 0
0
0.00
Job training: Youth
0.00% 0
0.00% 0
0.00% 0
0.00% 0
100.00% 1
0.00% 0
1
5.00
Job training: Bilingual
0.00% 0
0.00% 0
0.00% 0
100.00% 1
0.00% 0
0.00% 0
1
4.00
Job training: Disabled
0.00% 0
0.00% 0
0.00% 0
0.00% 0
100.00% 1
0.00% 0
1
5.00
Job training: Vocational
0.00% 0
0.00% 0
0.00% 0
0.00% 0
100.00% 1
0.00% 0
1
5.00
Money for education
0.00% 0
0.00% 0
0.00% 0
0.00% 0
100.00% 1
0.00% 0
1
5.00
Financial literacy classes
0.00% 0
0.00% 0
0.00% 0
0.00% 0
100.00% 1
0.00% 0
1
5.00

36
–
1 Low Need– 2– 3– 4– 5 High Need– 6 Don't Know–
Total– Average Rating–
GED/HS completion support programs
0.00% 0
0.00% 0
0.00% 0
0.00% 0
100.00% 1
0.00% 0
1
5.00
Transition to
college support programs
0.00% 0
0.00% 0
0.00% 0
100.00
% 1
0.00% 0
0.00% 0
1
4.00
Nutritional education
0.00% 0
0.00% 0
100.00% 1
0.00% 0
0.00% 0
0.00% 0
1
3.00
Parenting classes 0.00% 0
0.00% 0
0.00% 0
0.00% 0
100.00% 1
0.00% 0
1
5.00
Low cost counseling (adult)
0.00% 0
0.00% 0
0.00% 0
0.00% 0
100.00% 1
0.00% 0
1
5.00
Low cost counseling (youth)
0.00% 0
0.00% 0
0.00% 0
0.00% 0
100.00% 1
0.00% 0
1
5.00
Emergency counseling services
0.00% 0
0.00% 0
0.00% 0
0.00% 0
100.00% 1
0.00% 0
1
5.00
Affordable childcare
0.00% 0
100.00% 1
0.00% 0
0.00% 0
0.00% 0
0.00% 0
1
2.00
Affordable adult care
0.00% 0
0.00% 0
0.00% 0
0.00% 0
100.00% 1
0.00% 0
1
5.00
Budget and/or credit counseling
0.00% 0
0.00% 0
0.00% 0
0.00% 0
100.00% 1
0.00% 0
1
5.00
Tax preparation
assistance
0.00% 0
0.00% 0
0.00% 0
0.00% 0
100.00% 1
0.00% 0
1
5.00
Legal assistance 0.00% 0
0.00% 0
0.00% 0
0.00% 0
100.00% 1
0.00% 0
1
5.00
Accessing health insurance coverage
0.00% 0
0.00% 0
0.00% 0
0.00% 0
100.00% 1
0.00% 0
1
5.00
Assistance buying prescriptions
0.00% 0
0.00% 0
0.00% 0
0.00% 0
100.00% 1
0.00% 0
1
5.00
Home healthcare/in home nursing
0.00% 0
0.00% 0
0.00% 0
0.00% 0
100.00% 1
0.00% 0
1
5.00
General medical
expenses
0.00% 0
0.00% 0
0.00% 0
0.00% 0
100.00% 1
0.00% 0
1
5.00
Dental care 0.00% 0
0.00% 0
0.00% 0
0.00% 0
0.00% 0
0.00% 0
0
0.00

37
–
1 Low Need– 2– 3– 4– 5 High Need– 6 Don't Know–
Total– Average Rating–
Eyeglasses 0.00% 0
0.00% 0
0.00% 0
0.00% 0
0.00% 0
0.00% 0
0
0.00
Transportation services
0.00% 0
0.00% 0
0.00% 0
0.00% 0
0.00% 0
0.00% 0
0
0.00
When you come to CAASNM for help, do you feel that this is your community? Yes
Do you help out or support agencies in this community? Yes
Do you have a computer (or other device with internet) at home? Yes
Why do you use the internet? Social media, healthcare, and communicate with friends
and family out of state
I f you don’t own a computer, is it easy for you to get access to one? Yes
What are some of the challenges you face as a business owner? Product prices
What training program would you benefit from as a business owner? Operations and
strategy
Are you interested in being a business owner? Yes because I would like to help my
community with better or more food quality
How would you rank the state of New Mexico in regard to the availability of business
assistance programs? Fair
Can you afford to get your taxes done every year? No
Are you familiar with the tax credits you are entitled to? Yes
What are some of the greatest challenges you face to pursue an education? Age/physical limits
CAASNM has identified the needs from the community and as we strive to expand
programming to reflect the needs of our community, we are already currently
addressing needs through several of our existing programs. Below you will find a chart to
reflect these programs in Hidalgo County.
Need: How CAASNM is addressing it:
Education Free computer courses
Needs Assessment Data for Hidalgo County

38
(Organizational)
Representatives from social service organizations in Hidalgo County were asked to
participate in taking a survey to identify the greatest needs in their county. 15 persons
responded to the questions in the survey that related to issues faced by low -income
indiv iduals. Below you will find the results from representatives in the following areas:
Healthcare Youth serv ices Housing
Senior serv ices Education Energy
Food Government Transportation
Responders were asked to identify the top three needs of their county from the
following needs:
Transportation Mental health Education
Unemployment Environmental hazards Teenage pregnancy
Domestic violence Substance abuse Lack of affordable childcare
Gang violence Physical health Lack of low-income housing
Programs for seniors Programs in Spanish Programs for LGBTQ
Child abuse/neglect Safety for citizens Vacant buildings/rundown houses
Teenage delinquency Utilities assistance More recreation/social outlets
Roads/street repair Lack of transportation Flooding, sewage, water services
Communicable diseases Healthcare Services for deaf/hard of hearing
Other
The top three needs of Hidalgo County are:
1. Education-8
2. Unemployment-5
3. Health care-4
A responder also wrote in the following as a need not identified: healthy nutrition to
reduce obesity problems.
Besides lack of funding, what are the systematic barriers to addressing the needs you
just described?
Lack of education/awareness of need-11
Lack of agencies offering services-7
Policy-6
Another responder wrote in: locally produced food
What basic family sustainability programs are missing from your community?
Programs to help low-income seniors
Nutrition education and locally produced food movement

39
Are the existing serv ices in your community adequate to address self-sufficiency, or are
there gaps? 78.57% (11)
believed there are gaps in
serv ices while 21.43% (3) feel
that current service are
adequate.
What other services are
needed?
Health services and insurance
Beyond funding, what would
be required to implement
needed serv ices in your
community?
Partnerships-9
Community involvement/awareness-8
Building space-2
Other reasons given included: having support inside community vs. outside so it is
accessible to them and community vegetable garden.
I s the community doing a good job coordinating service delivery and leveraging
resources?
Knowledge of community resources-6
Strong partnerships-5
Strong referral program-3
Another client wrote in: participatory organizing groups in the community along common goals.
What community resources are having the greatest impact and should be enhanced
or expanded?
What new programs would you like to see offered to help low -income indiv iduals
become more self-sufficient?
Assisting families with needs such as heating, cooling, and food
Farming training in rural areas
How do you currently get people to participate/engage in community events?
Free admission to event-8
Accessible location-8
Advertising-7
Social media-5
Giveaways-4
Free food-4
Another responder also wrote in: have trainings in their own communities and have
tours of successful farms
What would you like to see happen to get people more engaged in the community?
Figure 7: Services in Hidalgo County

40
More awareness/education on the need
Send flyers and inv itations to workshops at the best days and times the
participants prefer (after work)
CAASNM has identified the needs from the community and as we strive to expand
programming to reflect the needs of our community, we are already currently
addressing needs through several of our existing programs. Below you will find a chart to
reflect these programs in Hidalgo County.
Need: How CAASNM is addressing it:
Education Free computer literacy courses
Healthcare Total Benefits services
Population Profile: Luna County
Luna County, New Mexico was created by an act of the New Mexico Legislature
adopted on March 16, 1901. The new County was comprised of the eastern portion of
Grant County and the western portion of Doña Ana County. I t is said that the impulse to
create the county of Luna arose from the intense rivalry between the cities of Deming
and Silver City in Grant County. Beginning in 1881 legislation was annually introduced in
the Territorial legislature to create a new county and separate the two cities. Finally, the
local leaders of the effort secured the support of Don Solomon Luna a prominent
Republican politician in the New Mexico Territory, and a successful sheep rancher and
banker from Valencia County who took up their cause in Santa Fe. With Mr. Luna’s
support, the effort was successful. Logan and Florida were proposed as names for the
new county, but when the county was finally created it was named in honor of Solomon
Luna, without whose support the effort would not have succeeded.
The County is situated in southwest New Mexico and the County seat is located in the
City of Deming. Luna County is a transportation hub with three railroads, an Interstate Highway and an airport with a 6,626 foot long asphalt-surfaced runway. The famous old-
West Butterfield Stage Line ran through Luna County. Luna County is the site of the historic
completion of the second transcontinental railroad across the United States. The
ceremonial silver spike joining the east-bound construction of the Southern Pacific
Railroad with the west-bound construction of the Atchison, Topeka & Santa Fe Railroad
was driven in Deming on March 9, 1881.
Luna County has a population of 25,095 and shares a 54-mile border with the Republic of
Mexico. A large modern International Port of Entry located three miles south of the Luna
County Village of Columbus on State Highway 11, prov ides 24-hour per day service
between the Mexican State of Chihuahua and the U.S. market for a variety of agricultural
products. Luna County owns and operates an international livestock import crossing
located just west of the Port of Entry where more than 80,000 head of cattle are crossed
into the U.S. annually.
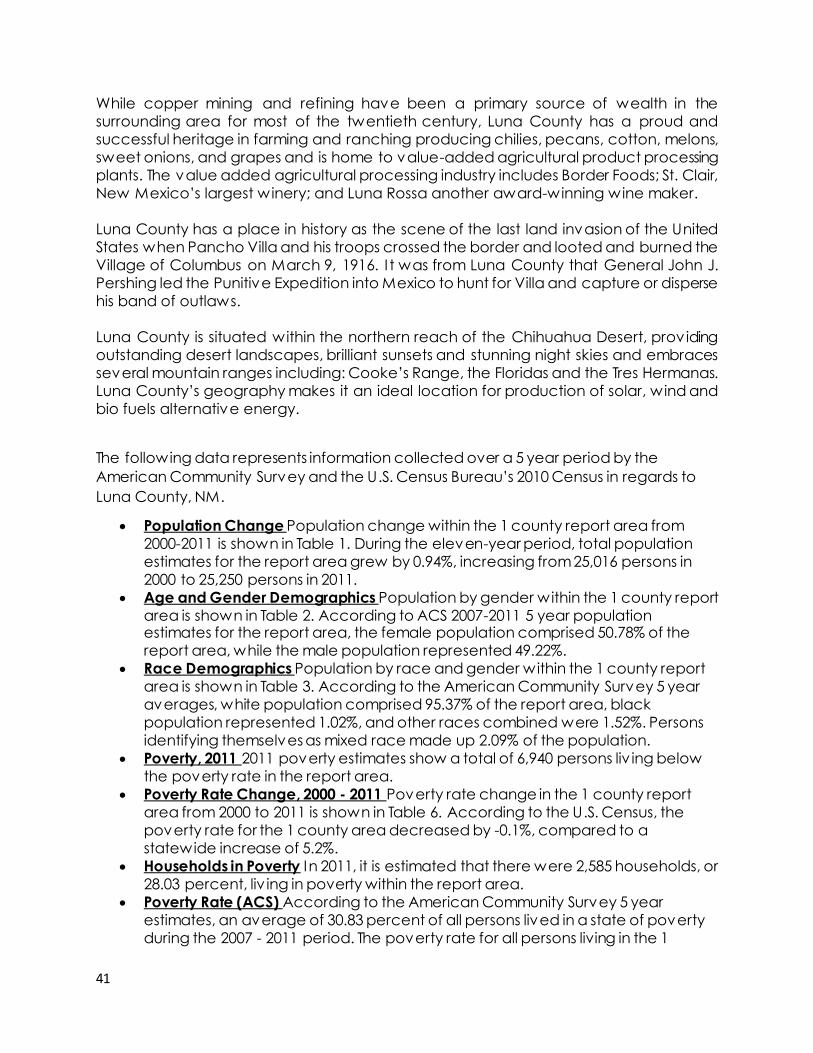
41
While copper mining and refining have been a primary source of wealth in the
surrounding area for most of the twentieth century, Luna County has a proud and
successful heritage in farming and ranching producing chilies, pecans, cotton, melons,
sweet onions, and grapes and is home to value-added agricultural product processing
plants. The value added agricultural processing industry includes Border Foods; St. Clair,
New Mexico’s largest winery; and Luna Rossa another award-winning wine maker.
Luna County has a place in history as the scene of the last land invasion of the United
States when Pancho Villa and his troops crossed the border and looted and burned the
Village of Columbus on March 9, 1916. I t was from Luna County that General John J.
Pershing led the Punitive Expedition into Mexico to hunt for Villa and capture or disperse
his band of outlaws.
Luna County is situated within the northern reach of the Chihuahua Desert, prov iding
outstanding desert landscapes, brilliant sunsets and stunning night skies and embraces
several mountain ranges including: Cooke’s Range, the Floridas and the Tres Hermanas.
Luna County’s geography makes it an ideal location for production of solar, wind and
bio fuels alternative energy.
The following data represents information collected over a 5 year period by the
American Community Survey and the U.S. Census Bureau’s 2010 Census in regards to
Luna County, NM.
Population Change Population change within the 1 county report area from
2000-2011 is shown in Table 1. During the eleven-year period, total population
estimates for the report area grew by 0.94%, increasing from 25,016 persons in
2000 to 25,250 persons in 2011.
Age and Gender Demographics Population by gender within the 1 county report
area is shown in Table 2. According to ACS 2007-2011 5 year population estimates for the report area, the female population comprised 50.78% of the
report area, while the male population represented 49.22%.
Race Demographics Population by race and gender within the 1 county report
area is shown in Table 3. According to the American Community Survey 5 year
averages, white population comprised 95.37% of the report area, black
population represented 1.02%, and other races combined were 1.52%. Persons
identifying themselves as mixed race made up 2.09% of the population.
Poverty, 2011 2011 poverty estimates show a total of 6,940 persons liv ing below
the poverty rate in the report area.
Poverty Rate Change, 2000 - 2011 Poverty rate change in the 1 county report
area from 2000 to 2011 is shown in Table 6. According to the U.S. Census, the
poverty rate for the 1 county area decreased by -0.1%, compared to a
statewide increase of 5.2%.
Households in Poverty In 2011, it is estimated that there were 2,585 households, or
28.03 percent, liv ing in poverty within the report area.
Poverty Rate (ACS) According to the American Community Survey 5 year
estimates, an average of 30.83 percent of all persons lived in a state of poverty
during the 2007 - 2011 period. The poverty rate for all persons living in the 1

42
county report area is greater than the national average of 14.3 percent.
Households in Poverty by Family Type The U.S. Census Bureau estimates that
there were 1,458 households liv ing in poverty within the report area.
Household Poverty Rate by Family Type In 2011, it is estimated that 23.55 percent
of all households were living in poverty within the report area, compared to the
national average of 10.5 percent. Of the households in poverty, female headed
households represented 46.36 percent of all households in poverty, compared to
6.79 and 46.84 percent of households headed by males and married couples,
respectively.
Child (0-17) Poverty Rate Change, 2000 – 2011 According to the U.S. Census, the
poverty rate for the 1 county area decreased by -2.3%, compared to a national
increase of 6.3 percent.
Child (0-4) Poverty Rate Change, 2000 – 2011 According to the U.S. Census, the
poverty rate for the 1 county area increased by 9.7%, compared to a national
increase of 6.6 percent.
Child (5-17) Poverty Rate Change, 2000 - 2011According to the U.S. Census, the
poverty rate for the 1 county area decreased by -6.8%, compared to a
statewide increase of 7.2%.
Child (0-17) Poverty Rate (ACS) According to the American Community Survey 5
year data, an average of 50.10 percent of children lived in a state of poverty
during the 2011 calendar year. The poverty rate for children living in the 1 county
report area is greater than the national average of 19.2 percent.
Child (0-4) Poverty Rate (ACS) According to the American Community Survey 5
Year data, an average of 52.78 percent of children under five years of age lived
in a state of poverty during the 2011 calendar year. The poverty rate for children
under five years of age liv ing in the 1 county report area is greater than the
national average of 23.2 percent. Child (5-17) Poverty Rate (ACS) According to the American Community Survey 5
year data, an average of 49.08 percent of children aged five to seventeen lived
in a state of poverty during the 2011 calendar year. The poverty rate for children
age five to seventeen living in the 1 county report area is greater than the
national average of 18.8 percent.
Seniors in Poverty At 18.3 percent, Luna County, New Mexico, had the lowest
percentage of seniors in poverty while Luna County, New Mexico, had the
highest percentage of seniors in poverty. According to American Community
Survey estimates, there were 881 seniors, or 18.3 percent, liv ing in poverty within
the report area.
Income: Income Levels, 2007 – 2011 Two common measures of income are
Median Household Income and Per Capita Income, based on U.S. Census
Bureau estimates. Both measures are shown for the 1 county report area in Table
32. The average Per Capita income for the report area is $16,281 as compared
to a national average of $29,659.
Needs Assessment Data for Luna County
(Clients)

43
Clients from Luna County were asked questions regarding programs and services in
their county. 3 clients prov ided feedback, all of which were female and identified as
Hispanic/Latina. Ages of responders ranged from 18-43. Two are married and one is
single. All responders are currently unemployed and did not finish high school.
Clients were asked to identify the top 10 problems that are the biggest in Luna County.
The results are as follows:
1. Transportation-100% (3)
2. Unemployment-100% (3) 3. Education-100% (3) 4. Vacant buildings/rundown houses-66.67% (2) 5. Lack of childcare-33.33% (1) 6. Lack of low-income housing-33.33% (1) 7. Utilities (gas, water, electric, etc.) assistance-33.33% (1) 8. Physical health of the community-33.33% (1) 9. Mental health services-33.33% (1) 10. Teenage pregnancy-33.33% (1)
Outside of public assistance, have you used services in your area? 2 yes, for emergency
serv ices and 1 no.
What do you think are the reasons for poverty where you live? 66.67% (2) clients
believe the reason for
poverty in Luna County
is a lack of financial
assistance for basic
resources and 33.33%
(1) thinks it is because a
lack of jobs. What programs or
serv ices do you think
your community needs?
More jobs 66.67% (2)
and more programs for
youth 33.33% (1).
What programs or serv ices do you think are most needed in your community for
children?
Better school system-33.33% (1)
Better access to healthy foods-33.33% (1)
More social/recreational outlets-33.33% (1)
Figure 8: Reasons for poverty in Luna County

44
What serv ices that currently exist could be enhanced or expanded to better meet your
needs?
More affordable childcare
Better paying jobs
More jobs
What can the community do differently to improve the quality of life for people/families
liv ing in your community? Bring more and better programs was the suggestion made by
one person.
The rankings: Clients were asked to rank programs and serv ices in their areas based on
needs. 1=low need, 5=high need, and 6= I don’t know. Below you will find the results.
–
1 Low Need–
2– 3– 4– 5 High Need– 6 Don't Know– Total– Average Rating–
Food assistance 0.00% 0
0.00% 0
0.00% 0
100.00% 3
0.00% 0
0.00% 0
3
4.00
Clothing/furniture assistance
0.00% 0
0.00% 0
66.67% 2
0.00% 0
33.33% 1
0.00% 0
3
3.67
Utility bill assistance
0.00% 0
0.00% 0
0.00% 0
66.67% 2
33.33% 1
0.00% 0
3
4.33
Emergency shelter
0.00% 0
0.00% 0
33.33% 1
33.33% 1
33.33% 1
0.00% 0
3
4.00
Affordable rental housing
0.00% 0
0.00% 0
33.33% 1
33.33% 1
33.33% 1
0.00% 0
3
4.00
First time home buyer's assistance
0.00% 0
0.00% 0
33.33% 1
33.33% 1
33.33% 1
0.00% 0
3
4.00
Availability of low-income housing
0.00% 0
0.00% 0
0.00% 0
0.00% 0
0.00% 0
0.00% 0
0
0.00
Employment
placement assistance
0.00% 0
0.00% 0
66.67
% 2
33.33% 1
0.00% 0
0.00% 0
3
3.33
Job training: Adult
0.00% 0
0.00% 0
33.33% 1
66.67% 2
0.00% 0
0.00% 0
3
3.67
Job training: Youth
0.00% 0
0.00% 0
33.33% 1
66.67% 2
0.00% 0
0.00% 0
3
3.67
Job training: Bilingual
0.00% 0
0.00% 0
33.33% 1
66.67% 2
0.00% 0
0.00% 0
3
3.67

45
–
1 Low Need–
2– 3– 4– 5 High Need– 6 Don't Know– Total– Average Rating–
Job training: Disabled
0.00% 0
0.00% 0
0.00% 0
100.00% 3
0.00% 0
0.00% 0
3
4.00
Job training: Vocational
0.00% 0
0.00% 0
66.67% 2
33.33% 1
0.00% 0
0.00% 0
3
3.33
Money for education
0.00% 0
0.00% 0
66.67% 2
33.33% 1
0.00% 0
0.00% 0
3
3.33
Financial literacy classes
0.00% 0
0.00% 0
66.67% 2
33.33% 1
0.00% 0
0.00% 0
3
3.33
GED/HS completion support programs
0.00% 0
0.00% 0
33.33% 1
66.67% 2
0.00% 0
0.00% 0
3
3.67
Transition to college support programs
0.00% 0
0.00% 0
33.33% 1
66.67% 2
0.00% 0
0.00% 0
3
3.67
Nutritional education
0.00% 0
0.00% 0
0.00% 0
100.00% 3
0.00% 0
0.00% 0
3
4.00
Parenting classes
0.00% 0
0.00% 0
0.00% 0
100.00% 3
0.00% 0
0.00% 0
3
4.00
Low cost counseling (adult)
0.00% 0
0.00% 0
33.33% 1
66.67% 2
0.00% 0
0.00% 0
3
3.67
Low cost counseling (youth)
0.00% 0
0.00% 0
66.67% 2
33.33% 1
0.00% 0
0.00% 0
3
3.33
Emergency counseling services
0.00% 0
0.00% 0
66.67% 2
33.33% 1
0.00% 0
0.00% 0
3
3.33
Affordable childcare
0.00% 0
0.00% 0
33.33% 1
66.67% 2
0.00% 0
0.00% 0
3
3.67
Affordable adult care
0.00% 0
0.00% 0
66.67% 2
0.00% 0
33.33% 1
0.00% 0
3
3.67
Budget and/or credit counseling
0.00% 0
0.00% 0
33.33% 1
33.33% 1
33.33% 1
0.00% 0
3
4.00
Tax preparation assistance
0.00% 0
0.00% 0
33.33% 1
33.33% 1
33.33% 1
0.00% 0
3
4.00
Legal
assistance
0.00% 0
0.00% 0
33.33
% 1
33.33% 1
33.33% 1
0.00% 0
3
4.00
Accessing health
0.00% 0
0.00% 0
33.33%
33.33% 1
33.33% 1
0.00% 0
3
4.00

46
–
1 Low Need–
2– 3– 4– 5 High Need– 6 Don't Know– Total– Average Rating–
insurance coverage
1
Assistance buying prescriptions
0.00% 0
0.00% 0
33.33% 1
33.33% 1
33.33% 1
0.00% 0
3
4.00
Home healthcare/in home nursing
0.00% 0
0.00% 0
33.33% 1
33.33% 1
33.33% 1
0.00% 0
3
4.00
General medical expenses
0.00% 0
0.00% 0
0.00% 0
66.67% 2
33.33% 1
0.00% 0
3
4.33
Dental care 0.00% 0
0.00% 0
0.00% 0
66.67% 2
33.33% 1
0.00% 0
3
4.33
Eyeglasses 0.00% 0
0.00% 0
33.33% 1
33.33% 1
33.33% 1
0.00% 0
3
4.00
Transportation services
0.00% 0
0.00% 0
33.33% 1
33.33% 1
33.33% 1
0.00% 0
3
4.00
Do you feel that this is your community? 100% (3) answered yes to this question.
When you come to CAASNM for help, do you feel that you have a say in what it is you
or your family needs? 100% (3) stated yes.
Do you help our or support agencies in this community? 100% (3) stated yes.
Do you have a computer (or other device with internet) at home?
100% (3) stated yes.
Why do you use the internet? Bill pay 66.67% (2) and social media 66.667% (2)
I f you don’t own a computer, is it easy for you to get access to one? 100% of clients
answered and stated either at a friend’s house or at the library.
Do you own a business? 100% (3) clients stated no.
Are you interested in being a business owner? 100% (3) stated yes.
How would you rate the state of New Mexico in regard to the availability of business
assistance programs? 100% (3) clients stated Fair.
Can you afford to get your taxes done every year? 33.33% (1) stated yes and 66.67%
(2) stated no.
Are you familiar with the tax credits you are entitled to? 100% (3) clients stated yes.

47
Lastly, clients were asked what are the greatest challenges they face to pursue an
education.
I don’t have a job
Money
I don’t speak English well
CAASNM has identified the needs from the community and as we strive to expand
programming to reflect the needs of our community, we are already currently
addressing needs through several of our existing programs. Below you will find a chart to
reflect these programs in Luna County.
Need: How CAASNM is addressing it:
Education Free financial literacy courses/free
computer literacy courses
Mental health TBS screening
Needs Assessment Date for Luna County
(Organizations)
Representatives from social service organizations in Luna County were asked to share
their thoughts regarding services and programs for low-income individuals in their
county. 19 responders represent Luna County and below you will find their results.
Responders represent the following areas:
Healthcare Youth serv ices Housing
Senior serv ices Education Energy
Food Government Transportation
Adult day care Respite care Case management
The top three: Luna County representatives were asked to select the top three areas
that they believe to be the biggest needs in their county. Luna County responders
believe the top three to be:
1. Education-11
2. Unemployment-7
3. Healthcare-6
A responder also wrote in the following: low-income assistance programs in general is
the top need of Luna County.

48
Besides lack of funding, what are the systematic barriers to addressing the needs you
just described?
Lack of education/awareness-13
Policy-10
Lack of agencies offering services-9
A responder also wrote in the economy as a barrier to addressing needs.
What basic family sustainability programs are missing from your community?
Lack of information on agencies’ methods of program qualifications
Programs/services for families in rural areas
Programs/services for low-income seniors
Are existing serv ices in your
community adequate to address
self-sufficiency or are there gaps?
82.35% stated gaps and 17.65%
stated serv ices are adequate
What other services are needed?
Not enough housing
More training programs are
needed
Beyond funding, what would be
required to implement needed
serv ices in your community?
1. Partnerships-12
2. Community involvement/awareness-11
3. Building space-3
I s your community doing a good job coordinating service delivery and leveraging
resources?
1. Knowledge of community resources-10
2. Strong partnerships-8
3. Strong referral program-4
What community resources are currently having the greatest impact and should be
enhanced or expanded?
What new programs would you like to see offered to help low -income indiv iduals
become more self-sufficient?
How do you currently get people to participate/engage in community events?
Figure9: Services in Luna County

49
Advertising/free admission to event-11
Accessible location-10
Social media/free food-7
Giveaways-5
CAASNM has identified the needs from the community and as we strive to expand
programming to reflect the needs of our community, we are already currently
addressing needs through several of our existing programs. Below you will find a chart to
reflect these programs in Luna County.
Need: What CAASNM is doing to address it:
Education Free financial literacy and free computer
courses
Healthcare TBS screening
Population Profile: Sierra County Sierra County, NM is located in southwest New Mexico approximately 70 miles north of
Las Cruces. One of 33 counties in New Mexico, it has two cities and one v illage
communities: Truth or Consequences (the county seat), Elephant Butte, and the Village
of Williamsburg. The county is approximately 4,200 square miles and houses one of the
largest lake in the state (Elephant Butte Lake). The 2010 Census reveals that Sierra
County has a population of 11,988.
The following information highlights data collected in a five year span through the U.S.
Census Bureau regarding demographics of Sierra County, NM.
Population Change During the eleven-year period, total population estimates for
the report area declined by -10.14%, decreasing from 13,270 persons in 2000 to
11,925 persons in 2011.
Age and Gender Demographics According to ACS 2007-2011 5 year population
estimates for the report area, the female population comprised 51.85% of the
report area, while the male population represented 48.15%.
Race Demographics According to the American Community Survey 5 year
averages, white population comprised 93.64% of the report area, black
population represented 0.47%, and other races combined were 1.95%. Persons
identifying themselves as mixed race made up 3.94% of the population.
Poverty, 2011 2011 poverty estimates show a total of 2,688 persons liv ing below
the poverty rate in the report area.
Poverty Rate Change, 2000 - 2011 According to the U.S. Census, the poverty rate
for the 1 county area increased by 0.9%, compared to a statewide increase of
5.2%.
Households in Poverty In 2011, it is estimated that there were 938 households, or
21.62 percent, liv ing in poverty within the report area.
Poverty Rate (ACS) According to the American Community Survey 5 year
estimates, an average of 19.96 percent of all persons lived in a state of poverty

50
during the 2007 - 2011 period. The poverty rate for all persons living in the 1
county report area is greater than the national average of 14.3 percent.
Households in Poverty by Family Type The U.S. Census Bureau estimates that
there were 261 households liv ing in poverty within the report area. Household Poverty Rate by Family Type In 2011, it is estimated that 11.69 percent
of all households were living in poverty within the report area, compared to the
national average of 10.5 percent. Of the households in poverty, female headed
households represented 25.29 percent of all households in poverty, compared to
4.60 and 70.11 percent of households headed by males and married couples, respectively.
Child (0-17) Poverty Rate Change, 2000 - 2011According to the U.S. Census, the
poverty rate for the 1 county area increased by 6%, compared to a national
increase of 6.3 percent.
Child (0-4) Poverty Rate Change, 2000 - 2011 According to the U.S. Census, the
poverty rate for the 1 county area increased by 8.8%, compared to a national
increase of 6.6 percent.
Child (5-17) Poverty Rate Change, 2000 - 2011According to the U.S. Census, the
poverty rate for the 1 county area increased by 4.8%, compared to a statewide
increase of 7.2%.
Child (0-17) Poverty Rate (ACS) According to the American Community Survey 5
year data, an average of 26.14 percent of children lived in a state of poverty
during the 2011 calendar year. The poverty rate for children living in the 1 county
report area is greater than the national average of 19.2 percent.
Child (0-4) Poverty Rate (ACS) According to the American Community Survey 5
Year data, an average of 48.59 percent of children under five years of age lived
in a state of poverty during the 2011 calendar year. The poverty rate for children
under five years of age liv ing in the 1 county report area is greater than the
national average of 23.2 percent.
Child (5-17) Poverty Rate (ACS) According to the American Community Survey 5
year data, an average of 21.89 percent of children aged five to seventeen lived
in a state of poverty during the 2011 calendar year. The poverty rate for children
age five to seventeen living in the 1 county report area is greater than the
national average of 18.8 percent.
Seniors in Poverty At 9.4 percent, Sierra County, New Mexico, had the lowest
percentage of seniors in poverty while Sierra County, New Mexico, had the
highest percentage of seniors in poverty. According to American Community
Survey estimates, there were 321 seniors, or 9.4 percent, liv ing in poverty within
the report area
Income: Income Levels, 2007 - 2011Two common measures of income are
Median Household Income and Per Capita Income, based on U.S. Census
Bureau estimates. The average Per Capita income for the report area is $17,033
as compared to a national average of $29,659.
Needs Assessment Data for Sierra County
(Clients)
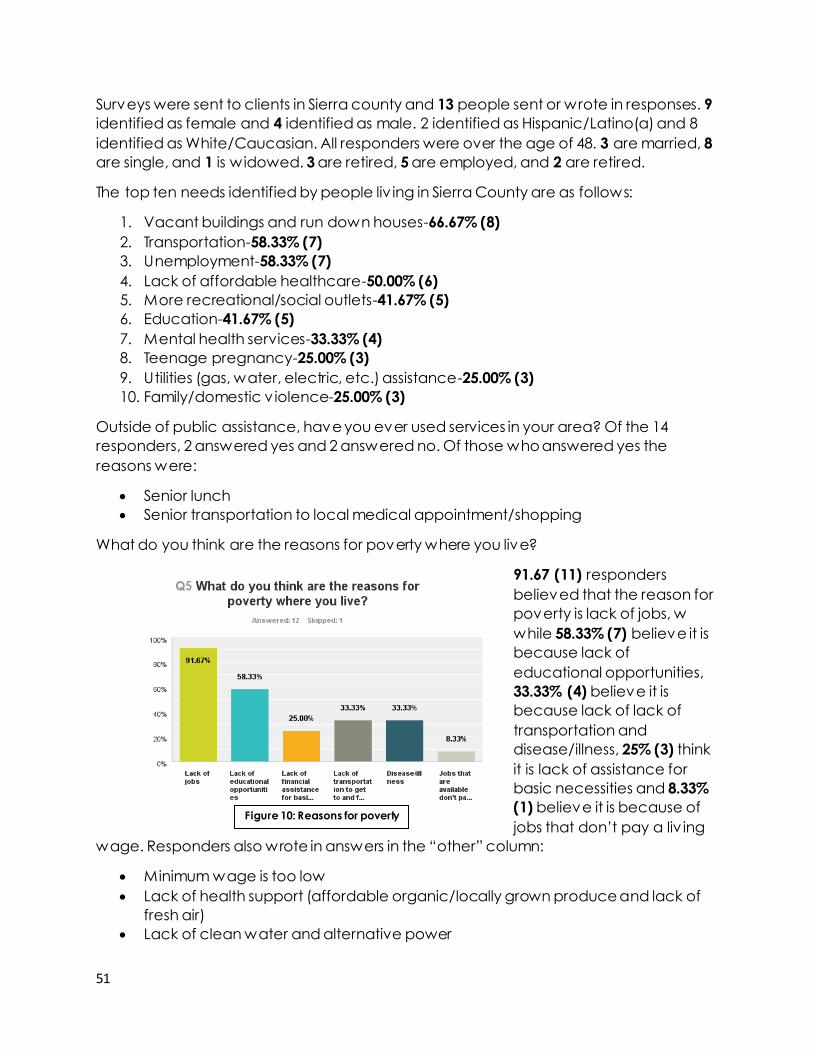
51
Surveys were sent to clients in Sierra county and 13 people sent or wrote in responses. 9
identified as female and 4 identified as male. 2 identified as Hispanic/Latino(a) and 8
identified as White/Caucasian. All responders were over the age of 48. 3 are married, 8
are single, and 1 is widowed. 3 are retired, 5 are employed, and 2 are retired.
The top ten needs identified by people liv ing in Sierra County are as follows:
1. Vacant buildings and run down houses-66.67% (8)
2. Transportation-58.33% (7)
3. Unemployment-58.33% (7)
4. Lack of affordable healthcare-50.00% (6)
5. More recreational/social outlets-41.67% (5)
6. Education-41.67% (5)
7. Mental health services-33.33% (4)
8. Teenage pregnancy-25.00% (3)
9. Utilities (gas, water, electric, etc.) assistance-25.00% (3)
10. Family/domestic v iolence-25.00% (3)
Outside of public assistance, have you ever used services in your area? Of the 14
responders, 2 answered yes and 2 answered no. Of those who answered yes the
reasons were:
Senior lunch
Senior transportation to local medical appointment/shopping
What do you think are the reasons for poverty where you live?
91.67 (11) responders
believed that the reason for
poverty is lack of jobs, w
while 58.33% (7) believe it is
because lack of
educational opportunities,
33.33% (4) believe it is
because lack of lack of
transportation and
disease/illness, 25% (3) think
it is lack of assistance for
basic necessities and 8.33%
(1) believe it is because of
jobs that don’t pay a liv ing
wage. Responders also wrote in answers in the “other” column:
Minimum wage is too low
Lack of health support (affordable organic/locally grown produce and lack of
fresh air)
Lack of clean water and alternative power
Figure 10: Reasons for poverty

52
What programs or serv ices do you think your community needs?
Better schools 30.77% (4) More jobs 92.31% (12)
Better existing jobs 53.85% (7) Better transportation routes 23.08% (3)
More social/recreational outlets 23.08% (3) More programs for youth 53.85% (7)
More programs for senior citizens 46.15% (6) More programs for disabled indiv iduals 23.08% (3)
More programs in Spanish 23.08% (3) More assistance for basic necessities 38.46% (5)
Food assistance 0 Better access to healthcare 7.69% (1)
An “other” column was provided and 1 responder stated that Sierra County needs city
planning for future environmental safety and health.
What serv ices do you think are most needed in your community for children?
An “other” column was provided and clients also responded with:
Elimination of bad health care practices, such as fluoride use in infants and
toddlers
Programs to teach tolerance and concern for the planet
Clients were then asked what programs and services that currently exist could be
enhanced or expanded to better meet their needs? Responses were as follows:
Computer lab available on weekends
SJOA
Healthcare system
Free computer trainings
Phone program
Monetary assistance for food
Food cooperative
Hospital quality
After school programs
Better community college
What can the community do differently to improve the quality of life for people/families
liv ing in your community?
Transportation options
Education and planning for the ecosystem in which we live
What are three things you like about liv ing in your community?
Affordable daycare 45.45% (5) Better school system 45.45 % (5)
Better access to healthy foods 45.45% (5) More social/recreational outlets 81.82% (9)
Affordable healthcare 54.55% (6) More educational outlets (museums, libraries, etc.)
18.18% (2)

53
First Choice Second Choice Third Choice The computer lab State park and showers Walmart allows overnight parking
Peaceful Beautiful geography Water/walking/hiking
Country liv ing Affordable Climate
Small Healing waters Interesting people
Community garden Good weather Town functions
Everything Church Hot springs
Friendly people Friendly people Clean air
Know a lot of people No traffic
What are three things you don’t like about liv ing in your community?
First Choice Second Choice Third Choice Lack of air quality in senior
center/library
Idling cars and smoking Lack of organic produce
Too small for shopping Lack of available healthy foods at
grocery stores
Cliques run T or C
Lack of entertainment Hospital Narrow-mindedness
Not enough educational
opportunities
Poverty The schools are not good
Not enough recreation for kids or adults
Sidewalks are awful Jobs
Hospital lacks quality Food programs Too much secrecy
Needs business diversity Community college Lack of cultural events
What is an effective way to get residents involved in the community?
Fewer cliques/more representation
Most people don’t want to get involved
Offer relevant, affordable courses
More outreach
7Ps
The Rankings: Clients in Sierra County were asked to rate the following services in their
community using the following scale: 1=low need, 5=high need, and 6=I don’t know.
The results are below:
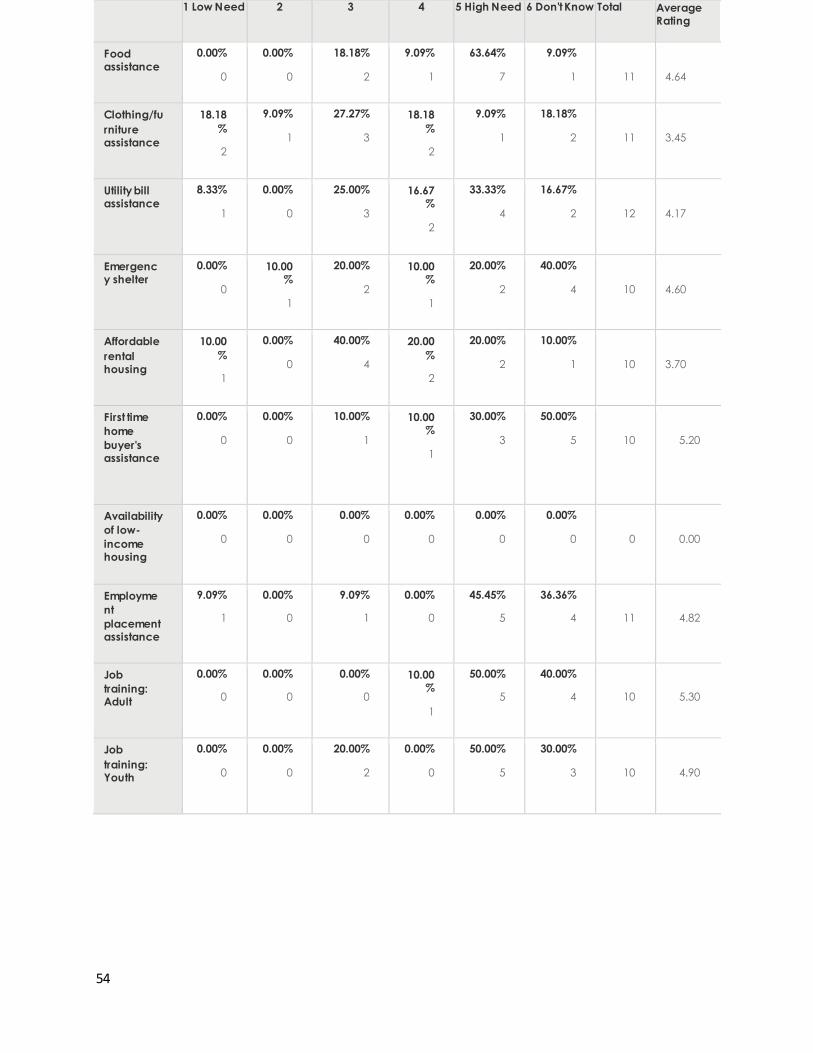
54
1 Low Need 2 3 4 5 High Need 6 Don't Know Total Average Rating
Food assistance
0.00%
0
0.00%
0
18.18%
2
9.09%
1
63.64%
7
9.09%
1
11
4.64
Clothing/fu
rniture assistance
18.18
%
2
9.09%
1
27.27%
3
18.18
%
2
9.09%
1
18.18%
2
11
3.45
Utility bill assistance
8.33%
1
0.00%
0
25.00%
3
16.67%
2
33.33%
4
16.67%
2
12
4.17
Emergency shelter
0.00%
0
10.00%
1
20.00%
2
10.00%
1
20.00%
2
40.00%
4
10
4.60
Affordable
rental housing
10.00
%
1
0.00%
0
40.00%
4
20.00
%
2
20.00%
2
10.00%
1
10
3.70
First time
home
buyer's assistance
0.00%
0
0.00%
0
10.00%
1
10.00%
1
30.00%
3
50.00%
5
10
5.20
Availability
of low-
income housing
0.00%
0
0.00%
0
0.00%
0
0.00%
0
0.00%
0
0.00%
0
0
0.00
Employme
nt
placement assistance
9.09%
1
0.00%
0
9.09%
1
0.00%
0
45.45%
5
36.36%
4
11
4.82
Job
training: Adult
0.00%
0
0.00%
0
0.00%
0
10.00%
1
50.00%
5
40.00%
4
10
5.30
Job
training: Youth
0.00%
0
0.00%
0
20.00%
2
0.00%
0
50.00%
5
30.00%
3
10
4.90

55
Job
training: Bilingual
10.00%
1
0.00%
0
10.00%
1
0.00%
0
50.00%
5
30.00%
3
10
4.70
Job
training: Disabled
0.00%
0
0.00%
0
18.18%
2
0.00%
0
45.45%
5
36.36%
4
11
5.00
Job
training: Vocational
0.00%
0
0.00%
0
10.00%
1
0.00%
0
50.00%
5
40.00%
4
10
5.20
Money for
education
0.00%
0
11.11
%
1
0.00%
0
33.33
%
3
44.44%
4
11.11%
1
9
4.44
–
Financial
literacy classes
0.00%
0
0.00%
0
0.00%
0
40.00%
4
30.00%
3
30.00%
3
10
4.90
GED/HS
completio
n support programs
0.00%
0
0.00%
0
10.00%
1
20.00%
2
10.00%
1
60.00%
6
10
5.20
Transition
to college
support programs
0.00%
0
10.00%
1
20.00%
2
0.00%
0
30.00%
3
40.00%
4
10
4.70
Nutritional education
0.00%
0
11.11%
1
11.11%
1
11.11%
1
33.33%
3
33.33%
3
9
4.67
Parenting
classes
0.00%
0
10.00
%
1
0.00%
0
10.00
%
1
50.00%
5
30.00%
3
10
4.90
Low cost
counseling (adult)
0.00%
0
11.11%
1
0.00%
0
22.22%
2
33.33%
3
33.33%
3
9
4.78
Low cost
counseling (youth)
0.00%
0
0.00%
0
0.00%
0
22.22%
2
33.33%
3
44.44%
4
9
5.22

56
Emergenc
y
counseling services
0.00%
0
0.00%
0
11.11%
1
33.33%
3
22.22%
2
33.33%
3
9
4.78
Affordable childcare
0.00%
0
10.00%
1
20.00%
2
10.00%
1
30.00%
3
30.00%
3
10
4.50
Affordable adult care
0.00%
0
11.11%
1
11.11%
1
11.11%
1
33.33%
3
33.33%
3
9
4.67
Budget
and/or
credit counseling
0.00%
0
0.00%
0
10.00%
1
10.00
%
1
30.00%
3
50.00%
5
10
5.20
Tax
preparatio
n assistance
20.00%
2
20.00%
2
0.00%
0
20.00%
2
20.00%
2
20.00%
2
10
3.60
Legal assistance
0.00%
0
0.00%
0
10.00%
1
0.00%
0
50.00%
5
40.00%
4
10
5.20
Accessing
health
insurance coverage
10.00%
1
0.00%
0
20.00%
2
20.00%
2
40.00%
4
10.00%
1
10
4.10
Assistance
buying
prescriptions
11.11%
1
0.00%
0
22.22%
2
11.11%
1
11.11%
1
44.44%
4
9
4.44
Home
healthcare
/in home nursing
11.11%
1
22.22%
2
22.22%
2
11.11%
1
22.22%
2
11.11%
1
9
3.44
General
medical expenses
10.00%
1
0.00%
0
20.00%
2
0.00%
0
40.00%
4
30.00%
3
10
4.50
Dental
care
10.00
%
1
0.00%
0
10.00%
1
20.00
%
2
40.00%
4
20.00%
2
10
4.40

57
Do you feel that this is your community?
80% (8) of clients felt that this is their community while 20 % (2) stated no. Reasons for
yes included: been here for 20 years and I am active in community affairs, born and
raised here, and family has been here before New Mexico was even a state. One
reason for no was because the city is run by cliques who break rules and laws every
day.
When you come to CAASNM for help, do you feel you have a say what you/your family
needs? 42.86% (3) said yes while 57.14 % (4) stated no. Reasons for yes: I live alone and
new to computers, so it has made me more know-how and comfortable. Reason for
no: don’t know this program.
Do you help out or support agencies in this community? 90.91% (10) said yes while
9.09% (1) stated no. Of those that stated yes, the following was given:
Volunteer
Provide alternative healthcare services
Attend senior citizen functions, volunteer with community theater, church reader,
and in the past prepared taxes
Donate clothing and other items; money for animals
Volunteer for Election Day, Rotary, and Christmas wrapping
Volunteer at the food pantry and paint murals
Do you have a computer (or other device with internet) at home? 60.00% (6) stated yes
while 40.00% (4) stated no.
Why do you use the internet? 7 clients responded to this question.
Eyeglasses
0.00%
0
0.00%
0
0.00%
0
11.11%
1
66.67%
6
22.22%
2
9
5.11
Transportat
ion services
0.00%
0
0.00%
0
0.00%
0
10.00%
1
70.00%
7
20.00%
2
10
5.10

58
Work/employment-57.14% (4)
School-28.57% (2)
Bill pay-42.86% (3)
Social media-100% (7)
Healthcare-42.86% (3)
Other: Research, news, and learning Contact with friends and
groups I support
Entertainment
Email friends
Information and news access
I f you don’t own a computer, is it easy for you to get access to one? 60.00% (4) stated
yes while 40.00% (2) said no. Those who answered yes stated they v isit the senior center
or the 4th St. Lab when they need access to a computer. \
Do you own a business? 100% (8) of responders answered no.
What are some challenges you face as a business owner?
Other businesses in T or C running in the black market-no business license, no GRTs paid,
taking cash, not claiming income, paying workers in cash, undercutting my prices at my
former business as a result
What training programs would you benefit from as a business owner?
Are you interested in being a business owner? 100% (7) of responders answered no.
Reasons that were given for no:
Age
Tried already
No money
Retired and on disability
Too much stress
How would you rate the state of New Mexico in regard to the availability of business
assistance programs? 3 people answered this question and 33.33% (1) stated Fair and
66.67% (2) stated Poor.
Can you afford to get your taxes done every year? 10 people answered this question.
60% (6) answered yes and 40% (4) stated no.
Are you familiar with the tax credits you are entitled to? 9 answered this question.
44.44% (4) stated yes and 55.56% (5) stated no.
Figure 11: Internet use

59
What are some of the greatest challenges you face to pursue an education?
None-been there, done that
I do not want to travel
Limited courses
Money
Available colleges are limited
CAASNM has identified the needs from the community and as we strive to expand
programming to reflect the needs of our community, we are already currently
addressing needs through several of our existing programs. Below you will find a chart to
reflect these programs in Sierra County.
Need: How CAASNM is addressing it:
Healthcare TBS and healthcare enrollment
Education Free financial literacy/computer literacy
courses
Needs Assessment Data for Sierra County
(Organizational) Representatives from social service organizations in Sierra County were asked to
participate in taking a survey to identify the greatest needs in their county. 14 persons
responded to the questions in the survey that related to issues faced by low -income
indiv iduals. Below you will find the results from representatives in the following areas: Healthcare Youth serv ices Housing
Senior serv ices Education Food
Faith based serv ices Government Transportation
The top three: Sierra County representatives were asked to select the top three areas
that they believe to be the biggest needs in their county. Sierra County responders
believe the top three to be:
1. Education-7
2. Unemployment-6
3. Healthcare-4
Besides lack of funding, what are the systematic barriers to addressing the needs you
just described?
Lack of education/awareness of need-10
Lack of agencies offering services-6
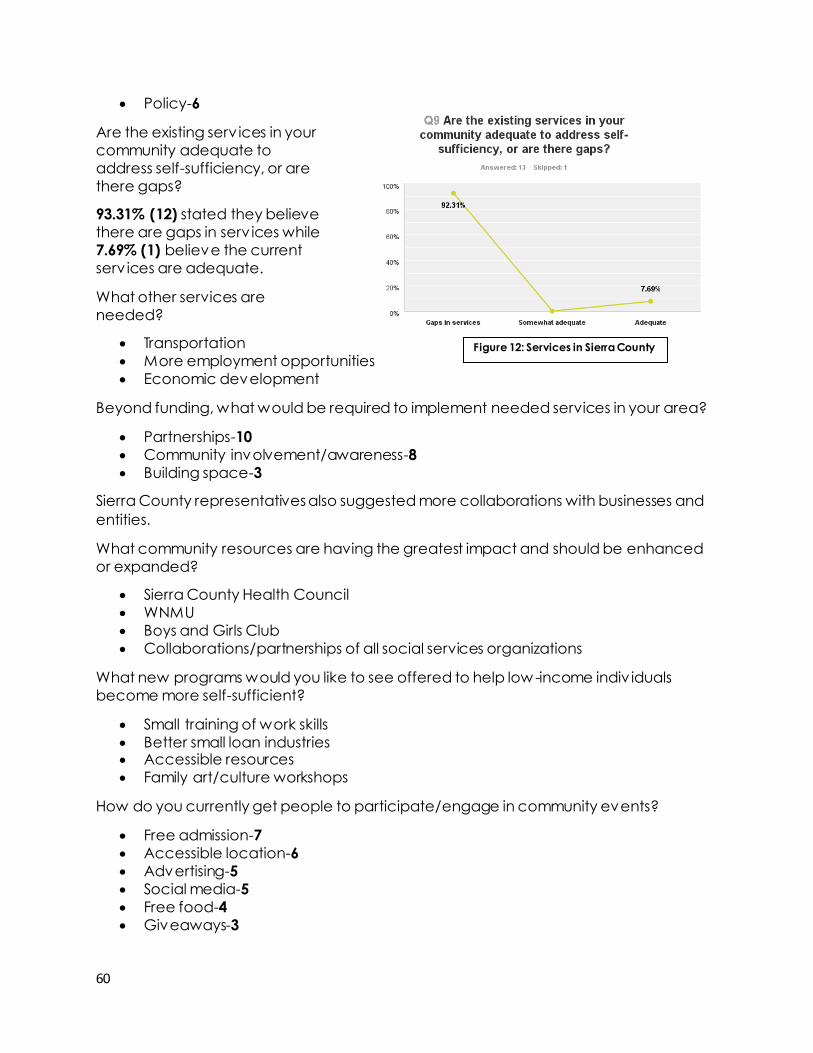
60
Policy-6
Are the existing serv ices in your
community adequate to
address self-sufficiency, or are
there gaps?
93.31% (12) stated they believe
there are gaps in serv ices while
7.69% (1) believe the current
serv ices are adequate.
What other services are
needed?
Transportation
More employment opportunities
Economic development
Beyond funding, what would be required to implement needed services in your area?
Partnerships-10
Community involvement/awareness-8
Building space-3
Sierra County representatives also suggested more collaborations with businesses and
entities.
What community resources are having the greatest impact and should be enhanced
or expanded?
Sierra County Health Council
WNMU
Boys and Girls Club
Collaborations/partnerships of all social services organizations
What new programs would you like to see offered to help low -income indiv iduals
become more self-sufficient?
Small training of work skills
Better small loan industries Accessible resources
Family art/culture workshops
How do you currently get people to participate/engage in community events?
Free admission-7
Accessible location-6
Advertising-5
Social media-5
Free food-4
Giveaways-3
Figure 12: Services in Sierra County

61
What would you like to see happen to get more people involved in the community?
Hope
Volunteer fairs for agencies
More family workshops and interactive events
Summary and Priority of Needs Different strategies have been used to identify and address the needs of the
communities in Southern New Mexico. Several months of research and data
collection/analysis made this needs assessment possible. These strategies included: 1)
surveys sent v ia email from SurveyMonkey.com to staff and board of directors of the
Community Action Agency of Southern New Mexico to identify area needs and
strengths and 2) surveys sent via SurveyMonkey.com to over 350 representatives of
community organizations in the 5 counties CAASNM serves. From this process, CAASNM
was able to identify not only what the community leaders see as a strong and
necessary program, but also where the community is lacking in regards to services for
low-income individuals living in the southern counties. This “boots on the ground”
approach highlights exactly the needs to build not only a stronger community
economically, but to also continue CAASNM’s mission of “building self-reliance for low-
income New Mexicans by connecting our community to high impact programs that
encourage family wellness, empower families, and bridge resources”. The survey
allowed leaders in the community to voice their opinions and forge collaborations.
The questions in the survey asked participants the following questions:
1) What county do you serve?
2) Have you heard of Community Action Agency of Southern New Mexico?
(internal use)
3) Do you know what services CAASNM offers? (internal use)
4) Have you made referrals to our agency? (internal use)
5) Please select what best describes your role in addressing economic sustainability
for low-income families in your community. (selected from a list)
6) In your opinion, what are the top three needs of people liv ing in your
community?
7) Besides lack of funding, what are the systematic barriers to addressing the needs
you just described?
8) In your opinion, what basic family sustainability programs are missing from your
community?
9) Are the existing serv ices in your community adequate to address self-sufficiency,
or are there gaps?
10) What other services are needed?
11) Beyond funding, what would be required to implement needed services in your
community?
12) I s your community doing a good job coordinating service delivery and
leveraging resources? (selected from a list)

62
13) What community resources are having the greatest impact and should be
enhanced or expanded?
14) What new programs would you like to see offered to help low-income New
Mexicans become more self-sufficient?
15) How do you currently get people to participate/engage in community events?
(selected from a list)
16) What would you like to see happen to get people more engaged in the
community?
A second survey was sent out to CAASNM clients in all 5 counties. Surveys were sent electronically via SurveyMonkey.com in both English and Spanish to ensure all clients
could equally participate in sharing their feedback. The survey was sent out to over 445
clients and a total of 98 responded. The survey was also administered to clients coming
in for direct services at CAASNM, which represented opinions for those residing in Dona
Ana County. Surveys were given out in person at computer literacy trainings and
healthcare enrollment events in Sierra counties.
Results: Organizational (All Counties) Below you will find the results of the survey from the organizational standpoint.
Over 350 surveys were sent out to various organizations in 5 counties and a total of 112
indiv iduals completed the survey.
92.79% (103) of responders represented
Dona Ana County
17.12% (19) of responders represented
Luna County
13.51% (15) of responders represented
Hidalgo County
12.61% (14) of responders represented
Grant County
12.61% (14) of responders represented
Sierra County
The respondents were a diverse group representing the areas of:
Healthcare(23) Youth serv ices(26) Housing (17)
Figure 13: Respondents from the 5 counties CAASNM serves

63
In your opinion, what are the top three needs of low-income people in your
community? Survey responders were asked to choose their top three needs from the
following list:
Transportation Mental health
Homeless serv ices (11) Education (54) Energy (8)
Faith-based serv ices (10) Government (20) Transportation (10)
Employment Behavioral health Art, literature, culture and literacy
Alternative financial services/lending Community organizing Civ il rights
Case management Respite care Immediate disaster assistance
Disability advocacy services Domestic v iolence Tax serv ices
Child and adult mental health Hospice Senior serv ices (15)
Food (20) Leadership Small business assistance
Parent engagement Env ironmental protection
Figure 14: Areas responders represented

64
Education Unemployment
Environmental hazards Teenage pregnancy
Lack of affordable childcare Family/domestic v iolence
Lack of low-income housing Substance abuse issues
Gang v iolence Physical health of the community
Programs for senior citizens Programs available in Spanish
Programs for LGBTQ community Vacant buildings/run-down houses
Child abuse/neglect Safety for citizens/violent crime
Safety for citizens/violent crime Teenage delinquency
More recreational/social outlets Utilities assistance
Flooding, sewage, and water services Roads and street repair
Lack of transportation Communicable diseases
Healthcare Other
Serv ices for deaf or hard of hearing indiv iduals
The top three needs that community leaders identified were:
1. Unemployment-24.7% (22)
2. Education-16.9% (15)
3. Healthcare-11.4% (15)
The following responses were under the “other” category in regards to what
organizations thought were the highest needs of their county:
Citizenship
Lack of jobs that pay a liv ing wage
Food insecurity/access to good food/food
Substance abuse
Low-income assistance
Nutrition and programs for obesity prevention
Alternative financial services to mitigate predatory lending
Financial literacy
Workshops in the arts
Besides lack of funding, what are the systematic barriers to addressing the needs you
just described? Responders were then asked what the systematic barriers (beyond
funding) were to the needs that they just described. Their responses were as follows:

65
59 responders felt that the
biggest issue to addressing
needs in our community is the
lack of education/awareness of
need
47 agreed on policy
42 believed lack of agencies
offering services to address
needs.
19 people chose “other” and
their answers are as follows:
Politics
Lack of jobs that pay a
liv ing wage
Lack of leadership for those with disabilities
Lack of industry/business opportunities in southern New Mexico
Economy
Locally produced food
Stigma of mental illness
No clear definition of problem and what government’s role should be
Collaborations between organizations
Lack of personal responsibility
Responders were asked what they believed were the basic family sustainability
programs that were missing from the community and were given an open text box to
respond. There were a total of 49 responses, and they were as follows:
Educational programs
Spanish speaking mental health prov iders
Limited transportation within city limits; no transportation for southern DAC
residents
Affordable housing, services provided within rural communities, transportation
serv ices
Parenting classes
Employment for the unemployed
Job skills programs and after-hours transportation for those who work 2nd/3rd shift
Programs for homeless indiv iduals
Grassroots leadership development and civ ic engagement opportunities for
community residents
Literacy programs
Programs based on helping to aid indiv iduals/families out of their current
situation, allev iating reliance on government assistance programs
Lack of information on agencies’ methods of program qualifications
Figure 15: Barriers preventing addressing needs of the community
66
Single women getting on their feet without assistance of a man
Lack of a cohesive core to help people confront all of their issues; education,
substance abuse, and employment issues need to be more readily dealt with
Career planning
Basic computer and ESL classes in rural areas
Teaching trade skills
Educating young parents on how to raise children and educate children on the
importance of education and staying in school
Free broadband
Helping families to access programs that are already available in
DAC/education and awareness on available programs
Lack of programs available in areas that need them most
Education on how to get and KEEP a job
School health based clinics, total parent-teacher involvement in schools, PTOs,
school based workshops for teenage parents
Programs to help low-income seniors
Serv ices that address immigrant populations
Fair, low-cost, small loans
Nutrition programs and local food movement
Small business assistance
Affordable childcare
Not enough programs for youths to become engaged and active citizens
Community centers
Art workshops for all ages
Family values
Are the existing services in your community adequate to address self-sufficiency or
are there gaps? Responders were then asked if they believed that the current
serv ices in their county were adequate or if they believed that there were gaps in
serv ices. Out of 88 total response to this question, 88.64% (78) believed there were
gaps, 0 believed the existing programs were somewhat adequate, and 11.36% (10)
believed the current services available are adequate. Responders who replied that
serv ices were inadequate were asked to share what other services are needed to
close the gaps in serv ices. 44 responders replied with the following:
Agencies do not work together
Affordable access to mental health serv ices, address substance
abuse/dv/child abuse issues
County wide transportation/affordable housing/childcare services/low cost
legal serv ices
More homeless shelters are needed
Support for children to achieve in school (tutoring, mentoring, early childhood
programs/intervention, activities for youth, etc.)
No other services are needed-we need to appropriately fund the services we
have

67
Sports for everyone
Small business assistance/small loans to avoid predatory lending
Literacy and independent liv ing courses
Advancing a person out of their situation/outcome-based programs as
opposed to a “Band-Aid” approach
More food banks
Parenting classes for teen moms/domestic v iolence classes for other than
shelter residents/teaching
that there is more to life than
just “I deserve the help”
Aligning serv ices so there is
no duplication and spread
out into counties that also
need assistance
Financial education/credit
counseling/self-sufficiency
classes/money
management
Low-cost legal
serv ices/labor laws
Rehab/detox center
leadership and
governance training and mentoring on local and state elected officials; crisis
emergency housing and relocation during fires, flood, disasters; in colonias all
have gaps in accessing gas heating
Recreational programs for both youth and seniors
An independent audit of all social programs to determine if existing
bureaucracies are being careful stewards of resources entrusted them
Arts/culture workshops
Transitional serv ices from food services to food production through
gardening, beginning farming education, and value-added business
development
Serv ice for middle income indiv iduals
Employment opportunities
Survey recipients were asked what would be required to implement needed services in
their community (beyond funding)? A total of 67 responders answered this question.
(more than one choice was allowed) and the results were as follows: 57 responders
believed partnerships, 53 community involvement/awareness, and 28 building space.
Adequately trained and sustained leaders
Due to cutbacks, working together is a must for programs
A sense of priority about this
Having support inside the community versus outside, so services are more easily
accessible
Figure 16: Where do existing services fall?

68
Organizational development and community vegetable gardens
Remedy to address county’s anti-donation restrictions
Public input
Needed services suffer because of resources misspent on ineffective programs.
All social programs cry out for some sort of external audit to eliminate waste,
fraud, abuse, and ineffectiveness
Community interest
Business and industry
Responders were asked what community resources are having the greatest
impact and should be enhanced or expanded? Answers were open-ended and
39 people responded. Below you will find their responses:
Health services
Food programs such as CAASNM, soup kitchens, shelters for homeless/transient
population
Income support, SNAP benefits, and Medicaid for the transient population
Promotoras (Colonias Development Council), Catholic Charities, Tierra del Sol,
NM Center on Law and Poverty
Dona Ana Community College
Income Tax programs
United Way
Food programs
Low-income housing
Housing authority and Community of Hope
Rental assistance, IDA program, computer classes, Coats4Kids
CAASNM is the most comprehensive resource
Headstart and early Headstart, utility assistance
Food delivery, homework help/tutoring, and transportation options
Mentoring for individuals who want to run their own business
Casa De Peregrinos, WIC, SNAP, ISD offices, CAASNM
El Solar and CALA groups (Chaparall, NM)
Collaborations of compatible entities
Serv ices for seniors
Family planning serv ices and government human services
School systems
No existing programs should be enhanced; all programs should be evaluated for
effectiveness, duplication, and overlap
Art workshops for individuals of all ages
Localized food system
Job placement programs
Access to healthcare AppleTree Education Center, the Club, WNMU, Health Council

69
What new programs would you like to see offered to help low-income individuals
become more self-sufficient? Responders were also asked what new programs they
would like to see in their community to make indiv iduals become more self-sufficient. 49
individuals responded and below you will find their responses:
Daycare programs Parenting classes
Nutrition classes Mental health classes
Wellness classes Job/skill building
Training programs Apprenticeship programs
Child care Co-ops
Referrals Financial help
Help navigating public programs Educational programs
Closer case management Civ ic engagement/leadership
Partnerships between nonprofit/business sector Programs for deaf/hard of hearing
Help with obtaining affordable housing Improved transportation system
Better employment opportunities Employment classes
Benefits for people who work Food stamps
Opportunities for youth who leave the state upon graduation Stop the sense of entitlement
Affordable/subsidized housing Free education
Small business development programs Financial literacy courses
Engaging young parents to be involved in their child's education Utilities assistance
See what programs are available before adding new ones Less dependence on services
Communications trainings on all levels Small loans
Family arts workshops Farming training
More civic engagement: voting, interacting with politicians, etc. Family writing/arts workshops
Gardening and food production courses More CAASNM programs
More programs for middle income families 1st time home-buyers courses

70
How do you currently get people to participate/engage in
community events? Responders were asked how they currently get their clients to
participate/engage in community events. The respondents could choose from the
following categories: social media, advertising, giveaways, free food and free
admission to event, easily
accessible location, and other.
45 said advertising, 31use social
media, 24 giveaways, 41 free
food, 38 free admission to the
event, and 44 accessible
location.
Additional responses included:
What would you like to see happen to get people more engaged in the community?
Lastly, respondents were asked what they would like to see happen to get more
community engagement. Below you will find the results:
Flyers at local stores Collaborating with partners Flexible schedule
Childcare available Host event in clients' communities Convenient times
Door to door recruiting Community resources fair Email
Free materials Have interpreters available Safe environment
Pulpit announcement Children's program available Word of mouth
Provide a loud voice for politicians Neighborhood meetings
Pastors partnering with community Interpreting and captioning services
Classes/workshops on recruitment More information fairs
Outreach workers trained in accessing services Creation of job opportunities
More community participation More promotoras for home v isits
Figure 17: Current methods for community engagement

71
Results: Clients (All Counties) Clients of Community Action Agency of Southern New Mexico in the 5 southern
counties that we serve were also asked their views on the current conditions in the
community. Below you will find the results regarding what the biggest needs of southern
New Mexico are and suggestions on how we can achieve those goals.
Clients were asked:
1) What county they live in and demographic information. 2) What are the 10 biggest problems in your community?
3) I f they had ever used assistance programs in their community?
4) The reasons for poverty where they lived.
5) Programs or services that their community needs.
6) Serv ices that are most needed in the community for children.
7) Current programs that could be enhanced or expanded to better meet their
needs.
8) Three things they like about liv ing in their community.
9) Three things they don’t like about liv ing in their community.
10) An effective way to get residents involved in their community.
11) Rankings of current initiatives in their community
12) Do you feel that this is your community?
13) When you come to CAASNM for help, do you feel you have a role in saying what
it is your or your family needs?
14) Do you support your community in any way? (Volunteer, donate, etc.)
CAASNM Specific program questions:
1) Do you own a computer at home (or other device) with internet?
2) Why do you use the internet? 3) I f you don’t have access to the internet, is it easy for you to get it?
4) Do you own a business?
Less reliance on services in Las Cruces Leadership in the community
More minorities involved with leadership and higher education Awareness/education of needs
Stronger community networks linking all services Media presence on important issues
After business hours workshops Generate pride in the community
Don't assume we know what clients need-ask them Transportation for grassroots events
Space for community meetings-libraries, community centers, etc. Volunteer fairs for agencies
Hope More advertising
Better media coverage Start reading clubs
Parent education classes Male involvement/leadership
One on one v isits Educational outreach
Less government involvement Volunteerism
Family workshops Interactive events

72
5) What are some challenges you face as a business owner?
6) What training would you benefit from as a business owner?
7) Are you interested in being a business owner? Why or why not?
8) How would you rate NM’s availability of business assistance programs?
9) Can you afford to get your taxes done every year?
10) Are you familiar with the tax credits you are entitled to?
11) Greatest challenges in pursuing and education
98 total responses have been collected from clients at the time of
the publication of this document.
86 (87.76%) of responders reside in
Dona Ana county
2 (2.04%) of responders reside in
Grant county
7 (7.14%) of responders reside in
Sierra county
1 (1.02%) of responders reside in
Hidalgo county
1 (1.02%) of responders reside in
Valencia county
1 (1.02%) of responders reside in
Otero county
Demographic Information:
Of the 97 responders, 65 identified as female and 32 identified as male. Of those
elected to give information regarding their race, 53 identified as Hispanic/Latino(a)
/Mexican, 15 as White/Caucasian, and 1 as Black. 25 are married, 53 are single, Susare
separated/divorced/widowed.
Please select the problems that are the worst in your area (select up to 10).
Clients were asked to choose what they believed to be the top 10 problem areas in
their community a total of 87 people responded to the question. Below you will find the
categories the clients chose from:
Transportation Mental health serv ices Education Unemployment
Env ironmental hazards Teen pregnancy Lack of childcare Family/domestic
v iolence
Lack of low-income
housing
Substance abuse issues Gang v iolence Physical health
Lack of programs for
senior citizens
Lack of programs
available in Spanish
Lack of programs for
LGBTQ community
Vacant buildings and
run-down houses
Figure 18: Counties represented in client survey

73
Child abuse and neglect
Safety for citizens/violent crime
Teenage delinquency More recreational / social outlets
Utilities (gas, water, electric, etc.) assistance
Flooding, sewage, and water serv ices
Roads and street repair Lack of transportation
Communicable
diseases (HIV/AIDS, etc.)
Lack of affordable
healthcare
Serv ices for deaf or
hard of hearing
Other
The top 10 needs identified were:
1. Unemployment 47.13%
2. Transportation 32.18%
3. Teenage pregnancy 32.18%
4. Family/domestic v iolence 32.18%
5. Child abuse/neglect 32.18%
6. Vacant buildings and run-down houses 29.89%
7. Gang v iolence 27.59%
8. Utilities (gas, water, electric, etc.) assistance 27.59%
9. Lack of affordable healthcare 24.14%
10. More social and recreational outlets 22.99%
Responders were also given the opportunity to provide feedback in the “other”
column. 6 responders provided the following information:
1. Lack of programs for youth, smoking, and lack of programs for homeless people
2. Grocery store options (monopoly by one store)
3. Low access to participate in the creative process
4. Lack of facility to help youth with dyslexia
5. Cruelty to animals and drunk driv ing
6. Drugs and drug pushers
Outside of public assistance, have you used emergency services in your area?
Responders were asked if they used additional emergency services other than public
assistance programs. 30 responders stated no and 14 stated yes. Of those that said yes,
the following programs were utilized:
Senior lunch Senior transportation Emergency food assistance (5)
Indigent fund for surgery Utility assistance (8)
What do you think are the reasons for poverty where you live?
Responders were asked to choose the reason they believe poverty exists for the
following options:
Lack of jobs-75.86% (66)
Lack of educational opportunities-18.39% (16)
Lack of financial assistance for basic resources-19.54% (17)

74
Lack of transportation to
get to and from school,
work, or other
appointments- 18.39% (16)
Disease/illness-13.79% (12)
Jobs that don’t pay
enough-1.15% (1)
Responders also were given
an “other” choice and the
following answers were
submitted:
Minimum wage is too low
and lack of health support
(affordable
organically/locally grown produce and lack of fresh
air)
Lack of clean water and alternative power
Better wages
Weak job market
Indifference to education by students and parents
Lack of v ision, leadership, and resiliency
What programs or services do you think your community needs?
An “other” column was provided
for additional answers and the
following was suggested as
needed programs/services:
City planning for future
environmental safety and health
More programs in the community
for mentally disabled persons
Housing for low-income people
Multi-cultural, intergenerational
opportunities for working and liv ing
together
What services do you think are most needed in your community for children?
Better schools More jobs Better existing jobs
Better transportation routes More social/recreational outlets More programs for youth
More programs for senior citizens More programs disabled indiv iduals More programs available in Spanish
More assistance for basic necessities (rent, utilit ies, and food)
Food assistance (pantries, community meals, etc.)
Better access to healthcare
Figure 19: Reasons for poverty
Figure 20: Needed services

75
Affordable daycare
Better school system
Better access to healthy foods
More social/recreational outlets
(museums, libraries, etc.)
The most needed service for
children in the community was
identified as more social and
recreational outlets, with 44.83%
of responders choosing this need.
What services that currently exist could
be expanded to better meet your
needs?
Computer lab availability Healthcare Improv ement of school systems Transportation (4)
Unemployment Free bus serv ice Summer food program More jobs
Tax prep. assistance Childcare Better jobs Better community college
More after school programs Hospital quality Collaborative engagement Cinema and newspaper
Home healthcare Free computer/phone trainings Food buying education Food cooperativ e
What can the community do differently to improve the quality of life for people/families
living in your community?
Education and planning for ecosystem in which we liv e
Creating new jobs with higher wages More activ ities for seniors
More affordable healthcare More housing/jobs Get rid of v ictim mentality and foster the v alue of education
Recognize our common interests, celebrate div ersity, and help each other
More education People can work more
Get rid of pollution and gangs Take pride in what we have Nothing
What are three things you like about living in your community?
First Choice Second Choice Third Choice Climate Friendly people Climate
Community Stores Friendly people
Country liv ing Traffic Interesting people
Friendly people Weather Safe town
Peaceful State park Water/walking/hiking trails
Figure 21: Needed service for children

76
Responders were asked what they liked most about liv ing in their community. 38
people prov ided a top choice, 28 prov ided a second choice, and 22 prov ided a third
choice.
What are three things you don’t like about living in your community?
What is an effective way to get residents involved in the community?
Responders suggested the following ways to get residents more involved in the
community:
Communication
Advertising/outreach/7Ps
Provide incentives such as food or giveaways
Offer relevant and affordable courses
Create recreational/community centers
More representation/fairness and fewer cliques in the community
Provide more activities
Encourage more volunteer work
Hold community meetings
Have family-friendly activities
The Rankings Clients were asked to rank several different needs/programs in their area using a
number system. 1=low need, 5=high need, and 6= don’t know. Clients were asked to
identify what the barrier was if they selected the service as a high need. Below you will
find a chart with the rankings.
First Choice Second Choice Third Choice Gangs Child abuse Lack of organic/local produce
Lack of jobs Idling cars and smoking Too few people run gov. in T or C
Apathy for community problems Lack of healthy foods at store Narrow-mindedness from people who don’t travel
Lack of programs for children/adults
Hospital is only good for ER No stores
Schools Poverty Lack of decent newspaper

77
Clients were then asked if they felt that this was there community and if they answered
yes, why did they feel this was their community? Below you will find responses to this
question.

78
68 people answered
this question and
79.41% answered yes
while 20.59% felt no.
The following reasons
were given why they
felt yes:
Lived here for 20
years and am active
in community affairs
Lived here 50 years
and never plan to
leave
I make an effort to
be involved
Born and raised here
Seeing many of the same people walking through town and belonging to
different groups
Family was here for 75 years, before New Mexico was even a state
Nice and welcoming people
I live here
Just feel accepted
Work
Help for senior citizens
The following reason was given for not feeling like this is your community:
Run by cliques who break rules and laws everyday
When you come to CAASNM for help, do
you feel you have a say in what it is
you/your family needs?
67.80% (40) responders said yes while
32.20% (19) said no. 59 people answered
this and 45 skipped this question.
Figure 22: Community acceptance
Figure 23: Help from CAASNM

79
Do you help out or support agencies
in this community? (Volunteer,
donate clothing, money, etc.)
66 people answered this question
and 38 skipped it. 62.12% (41) stated
they did volunteer in their
community in some way and 37.88%
(25) said they did not.
The last few questions were asked in regard to specific, current CAASNM programming,
specifically our Family Empowerment program that focuses on asset development.
Do you have a computer (or other device with wireless internet) at home?
66 chose to answer this question and 38 skipped it. 46.97% (31) stated yes and 53.03%
(35) stated no.
Why do you use the internet?
Responders were asked
why they use the internet
and were given the
following selections:
Work/employment
School
Bill pay
Social media
Healthcare
Other
Respondents could select
more than one option.
Figure 24: Community support
Figure 25: Internet use

80
50% (19) responders selected for work/employment purposes, 34.21% (13) selected for
school, 47.37% (18) for bill pay, 57.89% (22) selected social media, and 26.32% (10)
chose healthcare. Responders were also given an “other” box to input data. The
following response were collected:
Research, news, and learning
Contact with friends and groups I support and entertainment
My children use it for school
Email friends
News access and information
Sweepstakes
Driv ing directions
If you don’t own a computer, is it easy for you get access one?
35 responders answered this while 69 skipped this question. 31.43% (11) said yes while
68.57% (24)
Do you own a business?
59 people answered this while 45 skipped this question. 1 person responded yes to this
question and 58 (98.31%) stated no.
What are some of the challenges you face as a business owner?
The following response were given in regard to challenges faced as a current or past
business owner:
Other business in T or C are running in the “black market” i.e. no business license,
no GRTs paid, taking cash, not claiming income, paying workers in cash,
undercutting my prices at my former business as a result
Product prices
Distance
What training programs would you benefit from as a business owner?
Accounting and bookkeeping
Finance
Social media and marketing
Taxes
Operations and strategy
Figure 26: Beneficial programs for business owners
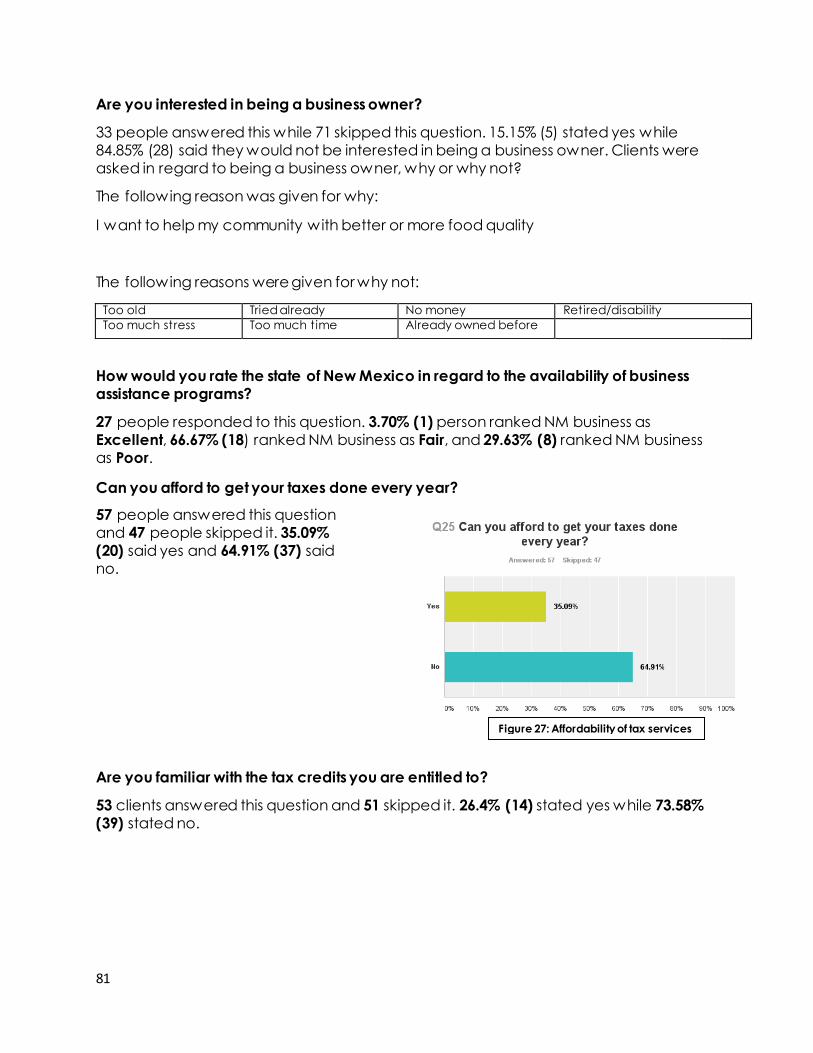
81
Are you interested in being a business owner?
33 people answered this while 71 skipped this question. 15.15% (5) stated yes while
84.85% (28) said they would not be interested in being a business owner. Clients were
asked in regard to being a business owner, why or why not?
The following reason was given for why:
I want to help my community with better or more food quality
The following reasons were given for why not:
Too old Tried already No money Retired/disability
Too much stress Too much time Already owned before
How would you rate the state of New Mexico in regard to the availability of business
assistance programs?
27 people responded to this question. 3.70% (1) person ranked NM business as
Excellent, 66.67% (18) ranked NM business as Fair, and 29.63% (8) ranked NM business
as Poor.
Can you afford to get your taxes done every year?
57 people answered this question
and 47 people skipped it. 35.09%
(20) said yes and 64.91% (37) said
no.
Are you familiar with the tax credits you are entitled to?
53 clients answered this question and 51 skipped it. 26.4% (14) stated yes while 73.58%
(39) stated no.
Figure 27: Affordability of tax services

82
Lastly, clients were asked: what are some of the greatest challenges you face to pursue
an education?
The following reasons were given:
Cannot read or write Age Learning English
Physical limitations Costs Travel
Limited courses Limited school choices Transportation
Time Lack of support Finding financial aid
Health issues I care for my disabled husband

83
Resources:
http://donaanacounty.org/about/
http://www.hidalgocounty.org/index.php/about/county-history/
http://silvercitytourism.org/about/elevation-climate-and-weather/
http://www.census.gov/acs
http://www.gcchc.org/
http://swnmcog.org/communitydevelopment.html
http://www.lunacountynm.us/Luna%20County%20History.html
http://www.sierracountynm.gov/about/
http://www.sierrahealthcouncil.com/attachments/article/646/CHNA%20Final%20Report.pdf
http://familiesusa.org/product/federal-poverty-guidelines
http://portal.hud.gov/hudportal/HUD?src=/states/new_mexico/groups/coloniasnm