Embed Size (px)
Citation preview

2014 Annual Report on
Carbon Monoxide Poisoning In Michigan
May 2016

2
2014 ANNUAL REPORT ON CARBON MONOXIDE POISONING
IN MICHIGAN
A Joint Report Of Michigan Department of Health and Human Services
Division of Environmental Health 201 Townsend Street
Lansing, MI 48909
Ahmed Elhindi, MD, MPH Martha Stanbury, MSPH
and
Michigan State University Department of Medicine
West Fee Hall 909 Fee Rd, Room 118 East Lansing, MI 48824
Kenneth D. Rosenman, MD
This publication was supported by grant numbers 5U90TP000528 and U60 OH008466 from the US Centers for Disease Control and Prevention (CDC). Its contents are solely the responsibility of the authors and do not represent the official views of CDC. Author affiliations; Ahmed Elhindi is with the Public Health Associate Program, Office for State, Tribal, Local and Territorial Support, CDC. Martha Stanbury is with the Michigan Department of Health and Human Services. Kenneth Rosenman is with the Michigan State University, Department of Medicine.

3
Table of Contents
SUMMARY………………………………………………………………………………………………………………….…4
BACKGROUND……………………………………………………………………………………..…………………….…4
METHODS………………………………………………………………………………………………………………….….6
RESULTS…………………………………………………………………………………………………………………….….7
Source of Reports………………………………………………………………………………………………………….8
Month of Exposure………………………………………………………………………………………………….….…8
Sex and Age……………………………………….……………………………………………………………………..…10
Race………………………………………………………………………………………………………………………….…11
County of Residence…………………………………………………………………………………………….……..11
Source of Exposure……………………………………………………………………………………….……………..14
Fire………………………………………………………………………………………………………………………………15
Exposure Site ………………………………………..……………………………………..…………………………….15
Events with Multiple Cases….........................................................................................16
Carboxyhemoglobin Testing …………………………………………………………………………..………..…17
Treatment Location………………………………………………………………………………………….…….……18
Hyperbaric Treatment………………………………………………………………………………………………….18
Death………………………………………………………………………..…………………………………………………19
ANALYSIS OF OCCUPATIONAL EXPOSURES………………………………………………………..…………20
DISCUSSION…………………………………………………………………………………………………………………24
REFERENCES…………………………………………………………………………………………………………………27
APPENDIX A………………………………………………………………………………………………………..….……28

4
SUMMARY
This is the sixth annual report on carbon monoxide (CO) poisoning surveillance in Michigan. This report
provides information about 659 cases of unintentional CO poisoning involving 653 individuals in 616 CO
exposure events in Michigan in 2014, including 15 individuals who died from CO exposure. The report is
based on data collected as a result of regulations promulgated September 18, 2007, by the Michigan
Department of Health and Human Services (MDHHS). The State’s public health code requirement for
health care facilities to report unintentional CO poisoning was phased out in 2014, due to resource
constraints at MDHHS for processing reports, thus hospitals reported cases for only approximately half
of the year.
BACKGROUND
Carbon monoxide (CO) is a leading cause of poisoning in the United States.1 CO exposure results in
nearly 450 deaths, more than 2,000 hospitalizations, and more than 50,000 emergency department (ED)
visits per year in the United States.2 CO is a colorless, odorless, tasteless, non-irritant gas that is
produced as a result of incomplete combustion of hydrocarbon.3 Sources of CO can occur both indoors
and outdoors, including faulty furnaces, poorly maintained and inadequately ventilated home heating
systems and cooking appliances, motor vehicle exhaust, and fuel-powered equipment (e.g., space
heaters and generators).3 The Environmental Protection Agency (EPA) allowable limit for environmental
exposure to CO in outdoor ambient air is 9 parts per million (ppm) for an 8-hour average.3 Workplace
standards set by the Michigan Occupational Safety and Health Administration (MIOSHA) for general
industry require the CO level be kept below a time weighted average (TWA) of 35 ppm for an 8-hour day
and a 200 ppm ceiling that should never be exceeded; for the construction industry, the TWA is 50 ppm
averaged over an 8-hour work day without a standard for a ceiling level.4,5 The National Institute for
Occupational Safety and Health (NIOSH) Immediately Dangerous to Life and Health (IDLH) ceiling is 1200
ppm.6
When inhaled, CO binds to hemoglobin in the blood as well as other proteins in the body, such as
myoglobin, reducing the delivery of oxygen to the brain, heart, and all other body tissues. Hemoglobin
combines with CO to form a bright red compound called carboxyhemoglobin (COHb), which can be
measured in the blood. Non-smoking individuals generally have less than 1.0% COHb in their blood as a
consequence of the normal breakdown of red blood cells. Cigarette smokers have an average 4.0%
COHb, with heavier smokers having higher values. Breathing CO at the MIOSHA TWA for general

5
industry of 35 ppm will cause a 5.4% COHb blood level. Breathing CO at the TWA for construction of 50
ppm will cause a 7.4% COHb blood level.7 CO home detectors manufactured to meet the requirements
of ANSI/UL 2034 are designed to alarm at levels that would result in a COHb level of 10% in adults.8
Exposure to CO from multiple sources is additive (e.g., the average cigarette smoker working at the
MIOSHA general industry TWA would be expected to have 9.4% COHb level).7 COHb has a half-life in the
blood of four to six hours. Oxygen administration reduces the half-life to approximately an hour or less;
hyperbaric oxygen treatment will reduce the half-life to less than half an hour.7 In individuals with
atherosclerosis, COHb levels as low as 3–4% can increase the frequency and severity of angina or
claudication, 6% can induce cardiac arrhythmias, and 10% may precipitate a myocardial infarction.7 In
individuals without atherosclerosis, COHb levels above 10–20% can cause headaches, nausea, muscle
weakness, and decreased mental awareness. COHb levels above 30% can cause increased weakness and
confusion. Breathing COHb levels higher than 50% can result in coma and death.7
Figure 1: Common used Triad for Diagnosis of Acute Carbon Monoxide Poisoning
Table 1: Level of Blood CO and Associated Symptoms % of CO in blood Symptoms and signs 10–20 Headache, shortness of breath 20–30 Nausea, dizziness, severe headache, difficulty concentrating 30–40 Lethargy, fainting, visual and auditory impairment, chest pain 40–50 Fainting, rapid heart rate, seizure >50 Coma, convulsion, death
Source: Sullivan, JB Jr; Krieger, GR (eds.). Clinical environmental health and toxic exposure (2nd ed.). Philadelphia: Lippincott, Williams & Wilkins, 2001, p.75.
History of potential exposure to a CO source
Symptoms consistent with CO poisoning (e.g., headache, dizziness, nausea, vomiting, confusion, fatigue, chest pain, shortness of breath, loss of consciousness)
Elevation of arterial and venous blood COHb level (>3–4% in non-
smokers or >10% in smokers)
*ICD-9 code definitions: 986 = “”Toxic effects of CO”; E868.3 = “CO from incomplete combustion of other domestic fuels”; E868.8 = “CO from other sources”; E868.9 = “Unspecified CO”; E982.1 =“Poisoning by other CO” **An individual could be count more than once, as a case, if the individual was involved in more than one unrelated exposure event
METHODS
The major data sources for this report were the Michigan Poison Control Center (PCC), Michigan
hospitals, and death certificates for the period January 1–December 31, 2014. The PCC reported all calls
where the substance was CO, the case had one or more “clinical effects” (symptoms), and the reason for
exposure was “unintentional”. Hospitals were required to report patients who had any inpatient,
outpatient, or ED visit with ICD-9 discharge codes of 986, E868.3, E868.8, E868.9, or E982.1* as a
discharge diagnosis. Death certificates were obtained where a contributing cause of death was ICD-10
code T58 (“Toxic effects of carbon monoxide accidental [unintentional]”).
Hospital medical records and PCC case reports were reviewed to determine whether they met the
following surveillance case definition. A confirmed case of CO poisoning was defined as an individual
who was treated by a health care provider for symptoms related to unintentional CO exposure in a
single event, excluding cigarette smoke. ** If a person called PCC about CO and/or CO-related symptoms
but did not seek medical care, they were excluded. Also excluded were cases in which the physician
ruled out CO poisoning in the medical record notes, even though CO poisoning may have been
suspected initially and thus assigned a CO ICD code in the discharge diagnosis string. It should be noted
that individuals were included as cases regardless of laboratory confirmation based on the COHb result.
In many cases the COHb result was not available or the blood specimen from the patient was collected
too long after exposure or after treatment with oxygen to still be elevated. All death certificate cases
with cause of death code T58 were considered confirmed cases.
Confirmed cases were abstracted into a data system that included, for each individual case report,
demographic information (i.e., age, sex, and race), admission date, discharge date, exposure date, COHb
test result, cigarette smoking status, report source(s), source of CO exposure (e.g., furnace, forklift), and
treatment (including hyperbaric chamber).
For individuals who had multiple reports for the same exposure, records were combined and considered
as one case. This was done for individuals who had multiple reports from different reporting sources as
well as multiple entries of the same report source (e.g., transfers between hospitals for treatment with
hyperbaric oxygen, multiple hospital visits due to the same exposure).

7
Frequencies and rates of CO poisoning were generated from these data. Denominators used to calculate
rates were from the US Census Bureau.9
RESULTS
A total of 659 reports of unintentional CO poisoning were reported on 653 individuals in 2014. Four
individuals were reported with two different exposures, and one individual with three different
exposures. Figure 2 shows the number of unintentional carbon monoxide poisoning in Michigan, 2009–
2014.
Figure 2: Number of Unintentional CO Poisoning Cases, Michigan, 2009-2014
*Hospital reporting for 2014 was incomplete because hospitals were notified that they no longer needed to report CO poisoning cases. Thirty (28%) 138 hospitals reported cases for all quarters of the year, 42 (31%) reported for three quarters of the year, and 56 (41%) only reported for the first two quarters. (See p. 24 for additional discussion).
1050 986 934
765 823
659
0
200
400
600
800
1000
1200
2009 2010 2011 2012 2013 2014*

8
Source of Reports
Hospital/ED reports identified 548 cases, PCC 154 cases, and vital records 11 cases. Hospital/ED reports
matched 55 PCC reports.
Figure 3: Reporting Sources of Unintentional CO Poisoning Cases, Michigan, 2014
Hospital/ED (548)
Vital Records (11) 493 Other (1) 11 55 1 99
PCC (154)
Month of Exposure
Month of exposure was known for 614 (93.0%) cases (Table 2 and Figure 4). January and February were
the months with the highest number of exposures, 139 (22.6%) and 100 (16.3), respectively. September
was the month with the lowest number of exposures, 15 (2.4%) cases.

9
Table 2: Unintentional CO Poisoning Cases by Month, Michigan, 2014 (n=614)
Month No. % January 139 22.6 February 100 16.3 March 86 14 April 64 10.4 May 25 4.1 June 29 4.7 July 19 3.1 August 20 3.3 September 15 2.4 October 30 4.9 November 48 7.8 December 39 6.4 Total 614 100
Figure 4: Percentage of Unintentional CO Poisoning Cases by Month of Exposure, Michigan, 2014(n=614)
22.6
16.3 14.0
10.4
4.1 4.7 3.1 3.3 2.4
4.9 7.8 6.4
0
5
10
15
20
25
Perc
enta
ge
MONTH

10
Sex and Age Sex was known for 652 individuals, of which 342 (52.5%) were male and 310 (47.4%) were female. Of
the 650 individuals where both age and sex were known, 116 (17.9%) were 17 years old or younger, 307
(47.0%) were 18–44 years old, 158 (24.2%) were 45–64 years old, and 69 (10.6%) were 65 years old or
older (Table 2 and Figure 5).
Table 2: Unintentional CO Poisoning by Sex and Age, Michigan, 2014
Age group (years)
Male Female Total No. % No. % No. %
≤17 60 17.6 56 18.1 116 17.8 18–44 153 45.0 154 49.7 307 47.2 45–64 85 25.0 73 23.5 158 24.4 ≥65 42 12.4 27 8.7 69 10.6 Total 340 100 310 100 650 100
Figure 5: Number of Unintentional CO Poisoning Cases by Sex and Age, Michigan, 2014
0
20
40
60
80
100
120
140
160
180
≤ 17 18-44 54-64 ≥ 65
Male
Female

11
Race
Race was known for 349 (53.5%) individuals. Of the cases for which race was known, 238 (68.2%) were
Caucasian, 93 (26.6%) were African American, one (0.3%) was Native American, and 17 (4.9%) were
other, which included Hispanic. Other race had the highest incidence rate of unintentional CO poisoning
(11.6/100,000), followed by African American (6.6/100,000).
Table 3: Number of Unintentional CO Poisoning Cases by Race, Michigan, 2014 (n=350)
Race Michigan Population
No. Cases Rate/100,000
Caucasian 7,803,120 238 3.1 African American 1,400,362 93 6.6 Native American 64,611 1 1.6 Other 147,029 17 11.6
County of Residence
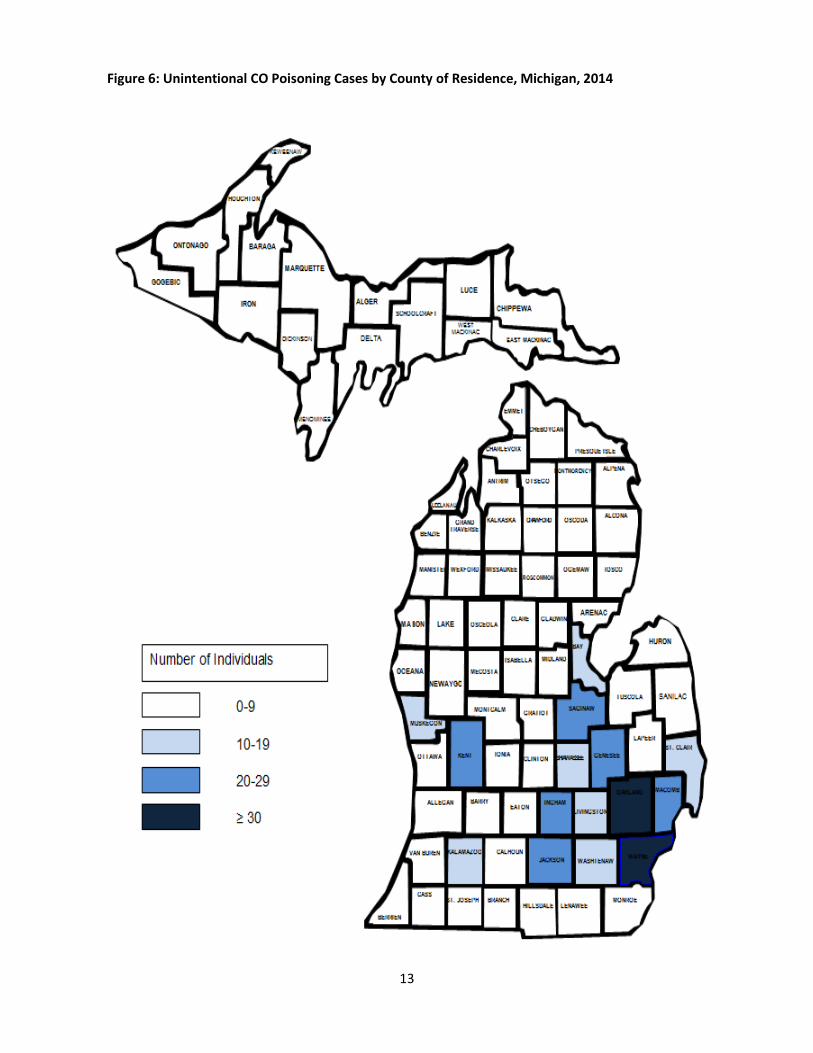
Table 4 and Figure 6 illustrate the number of individuals with unintentional CO poisoning and the
corresponding county of residence. County of residence was known for 578 (88.5%) individuals. Eleven
(1.7%) of the total number of individuals were classified as out of state. Thirteen counties had no cases,
59 counties had less than ten cases, seven counties had between 11 and 19 cases, six counties had
between 20 and 29 cases, and only two counties had more than 30 cases. Wayne County had the
highest number of cases; 131 (22.1%).

12
Table 4: Unintentional CO Poisoning Cases by County of Residence, Michigan 2014
County No. % County No. % Alcona County 3 0.5 Lake County 5 0.9 Alger County 2 0.3 Lapeer County 0 0.0 Allegan County 1 0.2 Leelanau County 1 0.2 Alpena County 2 0.3 Lenawee County 6 1.0 Antrim County 4 0.7 Livingston County 17 2.9 Arenac County 1 0.2 Luce County 0 0.0 Baraga County 0 0.0 Mackinac County 0 0.0 Barry County 1 0.2 Macomb County 25 4.3 Bay County 17 2.9 Manistee County 3 0.5 Benzie County 0 0.0 Marquette County 10 1.7 Berrien County 4 0.7 Mason County 1 0.2 Branch County 2 0.3 Mecosta County 6 1.0 Calhoun County 4 0.7 Menominee County 1 0.2 Cass County 1 0.2 Midland County 2 0.3 Charlevoix County 2 0.3 Missaukee County 1 0.2 Cheboygan County 2 0.3 Monroe County 8 1.4 Chippewa County 2 0.3 Montcalm County 7 1.2 Clare County 1 0.2 Montmorency County 0 0.0 Clinton County 4 0.7 Muskegon County 13 2.2 Crawford County 3 0.5 Newaygo County 3 0.5 Delta County 1 0.2 Oakland County 35 6.1 Dickinson County 2 0.3 Oceana County 6 1.0 Eaton County 4 0.7 Ogemaw County 0 0.0 Emmet County 1 0.2 Ontonagon County 0 0.0 Genesee County 27 4.7 Osceola County 4 0.7 Gladwin County 0 0.0 Oscoda County 1 0.2 Gogebic County 5 0.9 Otsego County 1 0.2 Grand Traverse County 4 0.7 Ottawa County 6 1.0 Gratiot County 1 0.2 Presque Isle County 3 0.5 Hillsdale County 0 0.0 Roscommon County 1 0.2 Houghton County 2 0.3 Saginaw County 26 4.5 Huron County 1 0.2 St. Clair County 13 2.2 Ingham County 23 4.0 St. Joseph County 0 0.0 Ionia County 6 1.0 Sanilac County 1 0.2 Iosco County 5 0.9 Schoolcraft County 0 0.0 Iron County 0 0.0 Shiawassee County 11 1.9 Isabella County 0 0.0 Tuscola County 5 0.9 Jackson County 21 3.6 Van Buren County 5 0.9 Kalamazoo County 12 2.1 Washtenaw County 15 2.6 Kalkaska County 7 1.2 Wayne County 131 22.7 Kent County 24 4.2 Wexford County 3 0.5 Keweenaw County 0 0.0 Total 578 100.0
13
Figure 6: Unintentional CO Poisoning Cases by County of Residence, Michigan, 2014
14
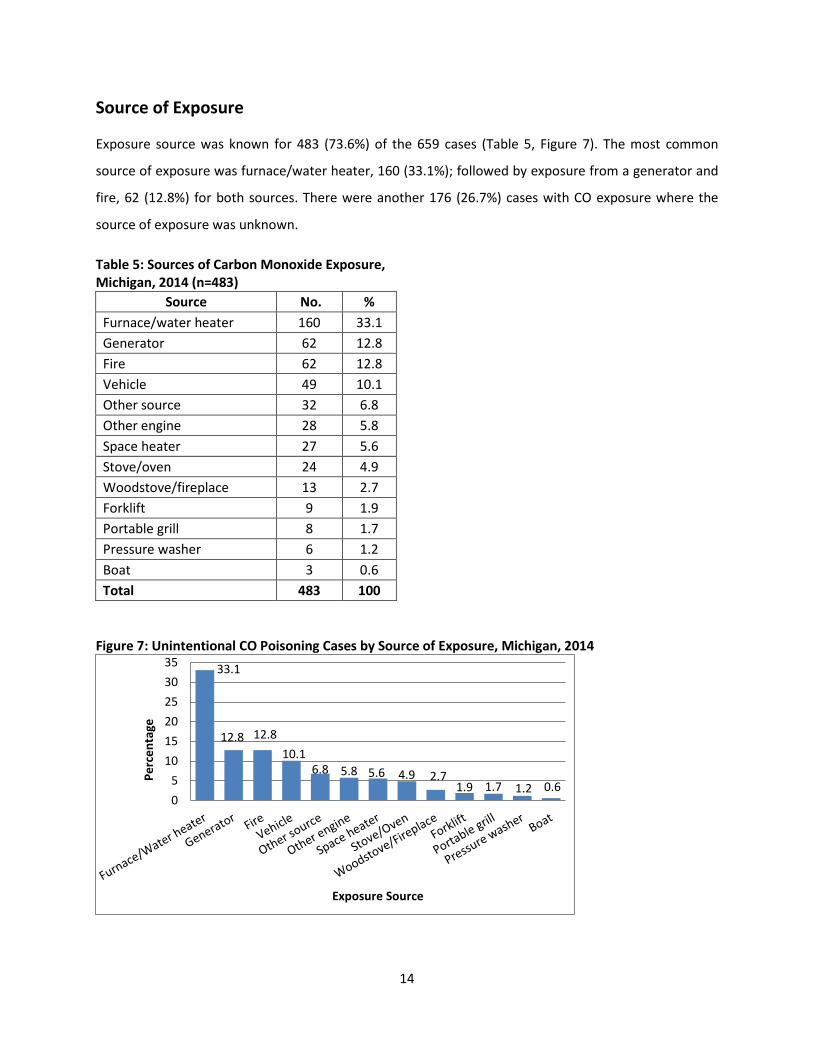
Source of Exposure
Exposure source was known for 483 (73.6%) of the 659 cases (Table 5, Figure 7). The most common
source of exposure was furnace/water heater, 160 (33.1%); followed by exposure from a generator and
fire, 62 (12.8%) for both sources. There were another 176 (26.7%) cases with CO exposure where the
source of exposure was unknown.
Table 5: Sources of Carbon Monoxide Exposure, Michigan, 2014 (n=483)
Source No. % Furnace/water heater 160 33.1 Generator 62 12.8 Fire 62 12.8 Vehicle 49 10.1 Other source 32 6.8 Other engine 28 5.8 Space heater 27 5.6 Stove/oven 24 4.9 Woodstove/fireplace 13 2.7 Forklift 9 1.9 Portable grill 8 1.7 Pressure washer 6 1.2 Boat 3 0.6 Total 483 100
Figure 7: Unintentional CO Poisoning Cases by Source of Exposure, Michigan, 2014
33.1
12.8 12.8 10.1
6.8 5.8 5.6 4.9 2.7 1.9 1.7 1.2 0.6
05
101520253035
Perc
enta
ge
Exposure Source

15
Fire Fire was the source of CO exposure for 62 (12.8%) of the 483 cases where a source was known. Seven of
the fire exposures were work related. Four (6.5%) of the fire related exposures resulted in death; none
of the four deaths were work-related.
Exposure Site Exposure sites were known for 627 (95.1%) of the 659 cases. The most common exposure site was
house, 460 (73.3%) of the known exposure sites; followed by exposure at work, 117 (18.7%).
Table 6: Number and Percent of Unintentional CO poisoning Cases by Exposure Site (n=627)
Exposure Site No. % House 460 73.3 Work 117 18.7 School 1 0.2 Public area 2 0.3 Other 47 7.5 Total 627 100
Figure 8: Percentage of Unintentional CO Poisoning Cases by Exposure Site, Michigan, 2014(n=627)
73.3
18.7
0.2 0.3 7.5
0
10
20
30
40
50
60
70
80
House Work School Public area Other
Perc
enta
ge
Exposure Site

16
Events with Multiple Cases The number of people in each exposure event was known for 648 (98.3%) cases. Of these cases, 293
(45.2%) events involved more than one individual, and 355 (54.8%) events involved only one individual.
Six cases were classified as a multiple cases with unknown exposure site. Twenty six cases were single
cases with unknown exposure sites.
Table7: Unintentional CO Poisoning Events by Exposure Site, Multiple and Single Patient, Michigan 2014 (n=616)
Exposure Site Multiple Cases
Yes No No. % No. %
Home 211 73.5 241 73.3 Work site 61 21.3 56 17 School 1 0.3 0 0 Public area 0 0 2 0.6 Other 14 4.9 30 9.1 Total 287 100 329 100
Figure 9: Percentage of Unintentional CO Poisoning Cases with Multiple and Cases by Exposure Site, Michigan, 2014
73.5
21.3
0.3 0.0 4.9
73.3
17.0
0.0 0.6 9.1
0
10
20
30
40
50
60
70
80
Home Work site School Publicarea
Other
Perc
enta
ge
Exposure Site
Multiple Cases
Single Case
17
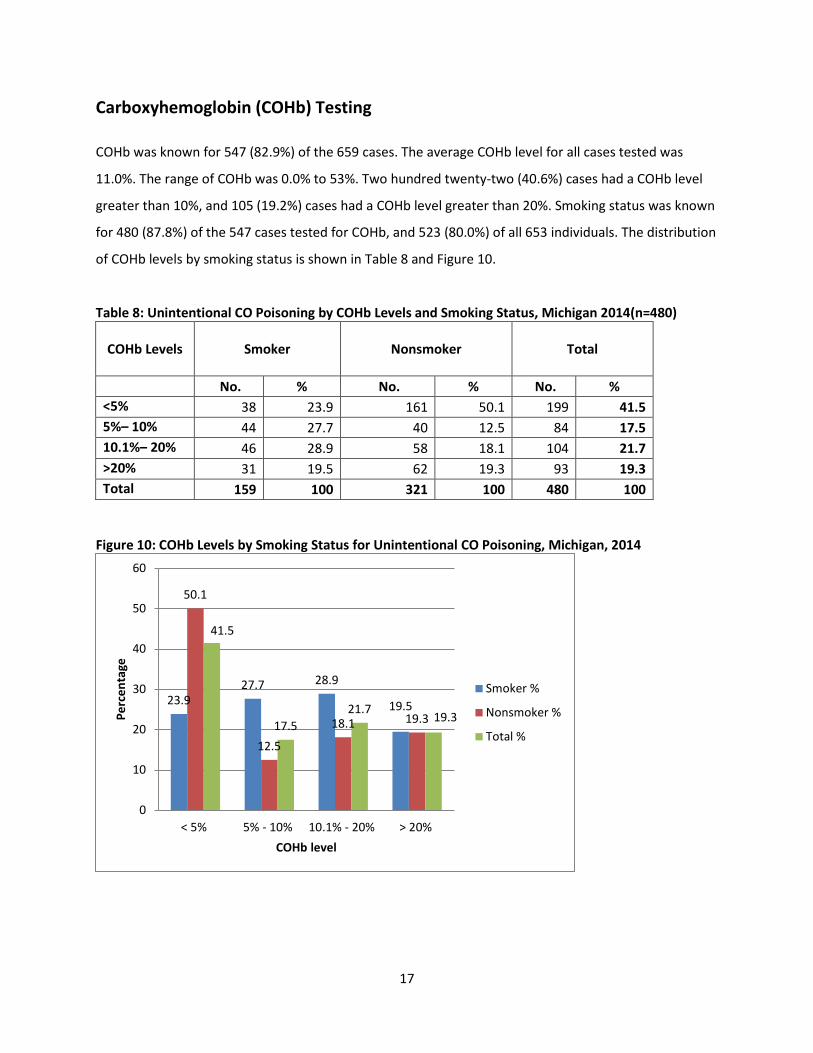
Carboxyhemoglobin (COHb) Testing
COHb was known for 547 (82.9%) of the 659 cases. The average COHb level for all cases tested was
11.0%. The range of COHb was 0.0% to 53%. Two hundred twenty-two (40.6%) cases had a COHb level
greater than 10%, and 105 (19.2%) cases had a COHb level greater than 20%. Smoking status was known
for 480 (87.8%) of the 547 cases tested for COHb, and 523 (80.0%) of all 653 individuals. The distribution
of COHb levels by smoking status is shown in Table 8 and Figure 10.
Table 8: Unintentional CO Poisoning by COHb Levels and Smoking Status, Michigan 2014(n=480)
COHb Levels
Smoker
Nonsmoker
Total
No. % No. % No. % <5% 38 23.9 161 50.1 199 41.5 5%– 10% 44 27.7 40 12.5 84 17.5 10.1%– 20% 46 28.9 58 18.1 104 21.7 >20% 31 19.5 62 19.3 93 19.3 Total 159 100 321 100 480 100
Figure 10: COHb Levels by Smoking Status for Unintentional CO Poisoning, Michigan, 2014
23.9 27.7 28.9
19.5
50.1
12.5
18.1 19.3
41.5
17.5 21.7 19.3
0
10
20
30
40
50
60
< 5% 5% - 10% 10.1% - 20% > 20%
Perc
enta
ge
COHb level
Smoker %
Nonsmoker %
Total %

18
Treatment Location
There were 625 (94.8%) of the cases with known treatment location. Most of the case 513 (81.9%)
received treatment at an ED. Only 111 (17.7%) stayed overnight in a hospital. Fire was the most
common CO source for hospitalized patients and accounted for 38 (34.2%) of the hospitalized patients.
Hyperbaric Treatment
Thirty-four (5.2%) cases were known to have been treated with hyperbaric chamber oxygen. All of the
34 cases had their COHb reported. The average COHb level recorded for these individuals was 24.3%. All
of the 34 cases of the hyperbaric treatments were non-occupational exposures. Source of exposure was
known for 26 (76.5%) of the 34 cases, including four from generator exposures, five from a fire, two
from vehicle exposures, nine from furnace or water heater exposures, three from space heaters, one
from stove/ovens, and two from other sources. For eight cases the source of exposure was unknown. Of
the 34 cases, 20 (58.8%) treated cases were over age 35 years.
CDC recommends: “Consider hyperbaric oxygen therapy (HBO) therapy when the patient has a COHb
level of more than 25–30%, there is evidence of cardiac involvement, severe acidosis, transient or
prolonged unconsciousness, neurological impairment, abnormal neuropsychiatric testing, or the patient
is ≥36 years in age. HBO is also administered at lower COHb (<25%) levels if suggested by clinical
condition and/history of exposure.”10 Table 8 shows the hyperbaric treatment status of the 275 cases
age 36 and older with known age, hyperbaric status and COHb level stratified by their COHb levels.
Table 8: Hyperbaric Treatment for Cases 36 Years of Age and Older, Michigan, 2014
Received Hyperbaric Treatment Average COHb
No. Cases Total COHb < 25% COHb 25-30% COHb >30%
Yes 28.7 20 9 0 11 No 10.5 255 225 16 14

19
Death
There were 15 (2.3%) deaths from unintentional CO poisoning. Twelve deaths occurred at home and
three deaths occurred at an “Other location”. Source of CO was known for 11 deaths; four deaths were
fire related four were from a generator, two were from propane leak, and one was from a portable grill.

20
ANALYSIS OF OCCUPATIONAL EXPOSURES
One hundred and seventeen (18.7%) of the total cases with known exposure site (n=627) were identified
as having occurred at work. Gender was known for 116 (99.1%) of the work-related cases: 68 (58.6%)
were male, 48 (41.4%) were female. Eighty three (71.6%) were between the age of 18 and 44 years old,
and 33 (28.4%) were more than 44 years old. (Table 11)
Table 11: Unintentional Occupational CO Poisoning Cases by Age and Gender, Michigan, 2014
Age (years)
Gender
Male Female Total
No. % No. % No. %
≤17 0 0.0 0 0.0 0 0.0
18–44 47 69.1 36 75 83 71.6
>44 21 30.9 12 25 33 28.4
Total 68 58.6 48 41.4 116* 100 *One case with unknown gender
Forty-three (70.5%) of the 61 cases with known race were Caucasian, 11 (18.0%) were African American,
and 7 (11.5%) were other, which included Hispanic.
COHb tests were reported for 101 cases with occupational exposure. The average COHb level for
occupationally exposed individuals tested was 8.6%. Smoking status was known for 92 (91.1%) of the
101 occupationally exposed individuals with COHb levels. The distribution of
COHb levels by smoking status are shown in Table 12.
Table 12: Unintentional Occupational CO Poisoning Cases by COHb Levels and Smoking Status, Michigan 2014
COHB % Smoker Nonsmoker Total
No. % No. % No. % <5 8 20.5 34 64.2 42 45.7 5–10 15 38.5 4 7.5 19 20.7 10.1–20 13 33.3 9 17 22 23.9 >20 3 7.7 6 11.3 9 9.7 Total 39 42.4 53 57.6 92 100

21
Of the 117 occupationally exposed cases, the month of exposure was known for 116 (99.1%). (Table 13
and Figure 11) The largest percentage of cases occurred in February and June (35 [30.2%] and 14 [12.1],
respectively).
Table 13: Unintentional Occupational CO Poisoning Cases by Month of Exposure, Michigan, 2014 (n=116)
Month No. Cases %
Jan 12 10.3 Feb 35 30.2 Mar 13 11.2 Apr 6 5.2 May 3 2.6 Jun 14 12.1 Jul 6 5.2 Aug 5 4.3 Sep 3 2.6 Oct 7 6 Nov 3 2.6 Dec 9 7.7 Total 116 100
Figure 11: Percentage of Unintentional CO Poisoning Cases by Month of Exposure, Michigan, 2014
10.3
30.2
11.2
5.2 2.6
12.1
5.2 4.3 2.6
6.0 2.6
7.7
0
5
10
15
20
25
30
35
Jan Feb Mar Apr May Jun Jul Aug Sep Oct Nov Dec
Perc
enta
ge
Month of Reported Exposure

22
Of the 117 occupationally exposed cases, the source of exposure was known for 81 (69.2%) cases. The
most common source of work-related exposure was from generators, 21 (25.9%) cases, followed by
furnaces/water heaters, 15 (18.5%) cases (Table 14, Figure 12).
Table 14: Unintentional Occupational CO Poisoning Cases by Source of Exposure, Michigan, 2014
CO Source No. % Vehicle 11 13.6 Pressure washer 1 1.2 Forklift 8 9.9 Space heater 3 3.7 Furnace/water heater 15 18.5 Generator 21 25.9 Portable grill 1 1.2 Fire 7 8.6 Woodstove/fireplace 1 1.2 Other engine 8 9.9 Other source 5 6.3 Total 81 100
Figure 12: Percentage of Occupational CO Poisoning Cases by Source of Exposure, Michigan, 2014
13.6
1.2
9.9
3.7
18.5
25.9
1.2
8.6
1.2
9.9 6.3
0
5
10
15
20
25
30
Perc
enta
ge
Exposure Source

23
Of the 117 individuals occupationally exposed, insurance type was known for 96 (82.1%) workers. For 49
(51.0%) of these, worker’s compensation was the expected payer, 26 (27.1%) had private insurance, and
6 (6.3%) were self-pay or did not have insurance (Table 15, Figure 13).
Table 15: Unintentional Occupational CO Poisoning Cases by Insurance Type, Michigan 2014 (n=96)
Insurance Type No. %
Private 26 27.1
Worker’s compensation 49 51.0
Medicare/Medicaid 15 15.6
Self-pay 6 6.3
Total 96 100
Figure 13: Unintentional Occupational CO Poisoning Cases by Insurance Type, Michigan, 2014
27.1
51.0
15.6 6.3
0
10
20
30
40
50
60
Private Worker'scompensation
Medicare/aid Self-pay
Perc
enta
ge
Primary Insurance Type

24
DISCUSSION
The toxicity of CO and its impact on health is well documented. Exposure to CO can come from
numerous sources and affect all population groups. Sub-groups at increased risk of adverse health
effects from CO exposure are pregnant women and their fetus children, the elderly, and health-impaired
individuals.11 Although most cases of CO poisoning can be successfully treated depending on severity
with either removal from exposure, oxygen therapy or hyperbaric oxygen, in some severe cases, long-
term negative effects (cardiovascular abnormalities and neurological disturbances) can occur.11
In Michigan, for the year 2014, reports were received on 659 cases with confirmed unintentional CO
poisoning. Four persons were treated for CO poisoning more than once. The reduced number of cases in
2014 was secondary to reduced hospital/ED reporting requests being sent rather than evidence of a
decrease in CO exposure in the state.
Fifteen (2.3%) deaths were reported. Four of were fire related, four were from a generator, two were
from a propane leak, one was from a portable grill, and four were from an unknown source. The most
common source of CO exposure was a furnace or water heater in 160 (33.1%) cases with 15 (9.3%) cases
took place at work.
A major limitation of the data for 2014 was the reduced number of cases compared to previous years,
due to reduced hospital/ED reporting rather than evidence of a decrease in CO exposure in the state.
This was because partway through the year the hospitals were notified that reporting was no longer
required. Despite the usefulness of the data derived from the CO surveillance system, the collection,
review and abstraction of CO poisoning medical records from Michigan’s 136 hospitals proved to be too
labor intensive and the project was phased out. We estimate that up to half the cases of CO poisoning
may have been missed. Data compilation and analysis of the 2014 case reports that had been submitted
became possible in 2015 with additional support from a public health professional in the CDC’s Public
Health Associate Program with a limited term assignment to MDHHS. For the future, MDHHS is
transitioning to a passive surveillance system using administrative data from hospital discharges and
death certificates, which will be posted on a web portal where the public can query the data. This web
portal is under development by the MDHHS Michigan Tracking Network (www.michigan.gov/mitracking,
which is funded by the CDC’s Environmental Public Health Tracking Program
25
(www.cdc.gov/nceh/tracking). The MI Tracking web portal, which is expected to go live in late 2016, will
make a range of environmental health, exposure and hazards data available.
Other limitations with the data presented in this report include: 1) Information may be missing in the
different reporting sources (e.g., multiple vs single patient, treatment type). 2) Hospitals and other
sources may not be reporting all cases and some cases are just simply missed. 3) The surveillance system
does not capture Michigan residents who were treated for CO poisoning in out-of-state hospitals. 4) CO
poisoning, particularly at lower levels of exposure, is a difficult condition to diagnose. In addition, some
individuals exposed to CO may not seek medical attention. 5) Transfer patient from one hospital to
another for hyperbaric treatment resulted in missing information about the length of hospitalization and
type of treatment. Thus we presume there are additional cases of unrecognized CO poisoning.
Prevention of exposure to CO and appropriate diagnosis are important to protect the health of the
public. The following activities are needed:
Improved awareness by medical professionals in the recognition of CO poisoning.
Enhanced education of the general population of the possible harmful effects of CO poisoning after
both mild and severe exposure would increase overall awareness.
Targeted awareness campaigns to inform susceptible groups are particularly important.
Increased awareness of the importance of the correct installation and maintenance of gas
appliances is vital, including adequate ventilation, and on-going maintenance. Awareness of the
potential sources of CO in the home is critical.
Highlighted benefits of installing CO audible alarms as a preventative measure and installation of a
CO alarm with furnace/water heater maintenance visits should increase the use of CO monitors.
Interventions
Identification of individuals diagnosed with CO poisoning is the first step to initiate preventive
interventions. The four most common sources of CO were from furnaces (160 [33.1%]), generators (62
[12.8%]), and vehicles (49 [10.1%]). After natural disasters or during prolonged periods of power
interruptions, including construction projects, winter storms, and floods, the use of generators is quite
common, increasing the potential for CO exposure. In many cases of CO poisoning, the generator is
operated too close to a window, in an attached garage, or even inside the home. Sometimes these

26
inappropriate placements are done to prevent theft of the generator. These generators are often run
under full load which increases the amount of CO produced. A generator operating in the basement of a
home can produce a lethal level of CO in 15 minutes.12 Educational materials and campaigns to address
this issue have been developed by CDC (www.cdc.gov/co) and MDHHS
(www.michigan.gov/carbononoxide). Topics for public education include the potential sources of CO
exposure, common symptoms associated with CO poisoning, and the hazards associated with CO,
especially in the colder months when the frequency of adverse effects is greatest. Prevention strategies
in both the home and workplace include not allowing motor vehicles to idle in enclosed areas, regularly
checking and maintaining motor vehicle emissions, ensuring all gas appliances are installed correctly and
are located in properly ventilated areas, and substituting electric powered forklifts and other electric
powered equipment for fuel powered equipment during indoor work. For the workplace, at the
minimum, periodic air monitoring should be conducted to ensure that the Michigan Occupational Safety
and Health Administration (MIOSHA) standard for General Industry of 35 parts per million (ppm) as an 8-
hour time-weighted-average (TWA) exposure limit, with a 200 ppm ceiling, and, for construction 50 ppm
TWA, with no ceiling limit is being met.
Ongoing vigilance is needed by the public to protect itself from CO exposure wherever combustion takes
place. Health care providers need to be vigilant in recognizing CO toxicity by considering where a
patient’s symptoms are occurring and confirmation by measurement of COHb levels.
Carbon Monoxide Detectors
Most of Michigan’s unintentional CO exposures occurred in non-occupational settings. There are no
non-occupational indoor air standards for CO in Michigan. Installation of CO detectors is recommended
in homes that burn natural gas, oil or wood. Effective March 23, 2009, a modification to Michigan’s
Uniform Construction Code (Act 230 of 1972) mandated that all single-family and multi-family dwellings
have CO detectors installed at the time of initial construction, addition of a bedroom, or other
renovation in which a permit is required. The location of these detectors and other specifics are outlined
in section 125.1504f of Michigan Compiled Laws. The CO detectors cited in the Construction Code are
required to meet ANSI/UL Standard 2034. Standard 2034 was designed to protect adults by alarming at
a CO level which would produce a level of 10% COHb in an adult. For 2014, 547 cases had a COHb level
recorded. Of the 547, 283 (51.7%) had a COHb level of less than 10%.

27
Before Standard 2034 was revised, CO detectors alarmed at lower levels. This created a large number of
false alarms in some communities during particular weather patterns or in areas of high vehicle traffic.
In order to reduce the number of false alarms, CO detectors meeting Standard 2034 will not alarm at
constant level of 30 ppm or less for 30 days. Individuals with atherosclerosis or history of heart disease
or stroke may want to consider purchasing a CO detector with a digital readout and a button that can be
pressed to give the highest reading recorded. Depending on the CO detector, the level on the readout
may be lower than 30 ppm. Background readings in the general environment are less than 4pmm. This
type of detector can be used to give an earlier warning of elevated CO in the home.

28
REFERENCES
1. CDC. Carbon Monoxide-Related Deaths—United States, 1999–2004. MMWR 2007; 56:1309–12. 2. Shahed I, Jacquelyn H, Sandra A, et al. A review of disaster-related carbon monoxide poisoning:
Surveillance, Epidemiology, and Opportunities for Prevention. American Journal of Public Health October 2012; 102(10):1957–1963.
3. EPA. 2015. Carbon monoxide. Available at http://epa.gov/airquality/carbonmonoxide/ 4. http://michigan.gov/documents/CIS_WSH_part301_35589_7.pdf. 5. http://michigan.gov/documents/CIS_WSH_part601_35654_7.pdf. 6. CDC. NIOSH Pocket Guide to Chemical Hazards. Atlanta, GA: US Department of Health and
Human Services, CDC: 2013. Available at http://cdc.gov/niosh/npg. 7. Rosenman KD. Cardiovascular Disorders in Occupational and Environmental Health, 6th Edition.
Eds Levy B, Sokas R, Wegman D, et al. Philadelphia: Lippincott Williams & Wilkins 2011; 492–504.
8. Underwriters Laboratories. Carbon Monoxide Alarm Consideration for Code Authorities. March 2009. Available at http://ul.com/wpcontent/uploads/2014/04/ul_CarbonMonoxideAlarms.pdf.
9. United States Census Bureau. Available at http://census.gov/quickfacts/table/PST045215/26. 10. Clinical guidance for carbon monoxide (CO) poisoning after a disaster. Atlanta, GA: US
Department of Health and Human Services, CDC: 2014. Available at http://emergency.cdc.gov/disasters/co_guidance.asp.
11. Christina T, Derrick C. Carbon Monoxide, A Review Focusing on the Public Health Impacts of Exposure from Gas Appliances in the UK. Institute of Environment and Health 2009. Available at http://gassafecharity.org.uk/media/17426/public_health_impact_of_carbon_monoxide_exposure.pdf.
12. Health hazard assessment of CO poisoning associated with emissions from a portable, 5.5 kilowatt, gasoline-powered generator. United States Consumer Product Safety Commission September 21, 2004. Available at http://cpsc.gov/en/Research--Statistics/Carbon-Monoxide/Portable-Generator-Technical-Reports/.

29
Appendix A: Michigan Uniform Construction Code (Act 230 of 1972), Section 125.1504 of Michigan Compiled Laws