Embed Size (px)
Citation preview

2014
ANNUAL REPORT
PRESS RELEASE DATED MARCH 5, 2015
OVERVIEW OF JACQUET METAL SERVICE GROUP 2
2014 FINANCIAL REPORT 20 1.
2.
3.
4.
5.
6.
7.
8.
9.
Management report - Information on the Group
Management report - Information on the parent company Jacquet Metal Service S.A.
Consolidated financial position and earnings for 2014
Statutory auditors’ report on consolidated results
2014 Financial Statements - Jacquet Metal Service S.A.
Statutory auditors’ report on the financial statements
Statutory auditors’ special report on regulated agreements and commitments
Chairman’s report concerning the preparation and organization of the Board of Directors’ work
and internal control procedure
Statutory auditors’ report on the report prepared by the Chairman of the Board of Directors
20
35
54
97
99
117
119
123
136
OTHER INFORMATION 138 1.
2.
3.
4.
5.
6.
7.
8.
9.
10.
11.
12.
Person responsible for the annual report and the annual financial report
Auditors
Person responsible for the financial report information and investor relationships
Information on the share issuer
Information on the share capital
Related-party transactions
Information concerning the company, society and the environment
Independent verifier’s report on consolidated social, environmental and societal information
presented in the management report
Group infrastructures
Annual disclosure document
Cross-reference table of the annual report 2014
Cross-reference table of the financial report 2014
138
139
139
140
144
146
147
150
153
154
156
159
This is a free translation into English of Jacquet Metal Service group’s annual report for 2014, which is
issued in the French language, and is provided solely for the convenience of English speaking readers.

2014 ANNUAL RESULTS – PRESS RELEASE DATED MARCH 5, 2015
2014 annual results
• Sales €1,126 million (+8.5% from 2013)
• EBITDA + €58.1 million (5.2% of sales)
• Net income, Group share + €25.2 million
The Board of Directors’ meeting on March 4, 2015, which was chaired by Eric Jacquet, approved the consolidated financial statements for the year ended December 31, 2014.
€m Q4 2014 Q4 2013 2014 2013
Sales 269.3 244.8 1,126.0 1,037.6
Gross margin 71.3 61.5 283.5 242.6
% of sales 26.5% 25.1% 25.2% 23.4%
EBITDA 11.6 6.9 58.1 30.1
% of sales 4.3% 2.8% 5.2% 2.9%
Operating income 10.5 4.4 45.2 18.4
% of sales 3.9% 1.8%
4.0% 1.8%
Net income (Group share) 7.1 0.8 25.2 3.8
2014 sales and earnings
The Group generated sales of €1.13 billion, up 8.5% from 2013, including a price effect of -2.2% and a +10.7% increase in volumes (of which 3.7 percentage points were due to scope effect). The increase in volumes was boosted by the Group’s sustained investment.
The gross margin rate rose 1.8 percentage points to 25.2% of sales, while the gross margin itself amounted to €283.5 million.
Operating expenses excluding scope effect were kept under tight control with a 2.3% increase from 2013 primarily due to the increase in activity and results.
Against this backdrop, EBITDA rose by +93% to €58.1 million (5.2% of sales), while operating income amounted to €45.2 million (4% of sales).
All the brands made a positive contribution to the increase in the Group's revenues as well as to the improvements in the gross margin and EBITDA.
Net income (Group share) amounted to €25.2 million (i.e. €1.05 per share) compared with €3.8 million in 2013.
Early 2015 demand remains favorably oriented while market prices remain low.
Financial position
Group’s net debt at the end of 2014 amounted to €137.3 million compared with shareholder’s equity of €261.7 million, resulting in a net debt ratio (gearing) of 52.5%.
The Group’s cash flow amounted to €52.7 million in 2014, compared with €25.1 million in 2013.
Inventory increased by €50 million due to the rise in activity and to the projects implemented in 2014. Accordingly, operating working capital amounted to 25% of sales at the end of 2014.
Capital expenditure for the financial year amounted to €14.2 million (primarily related to new finishing capacity) following €14.9 million in 2013.
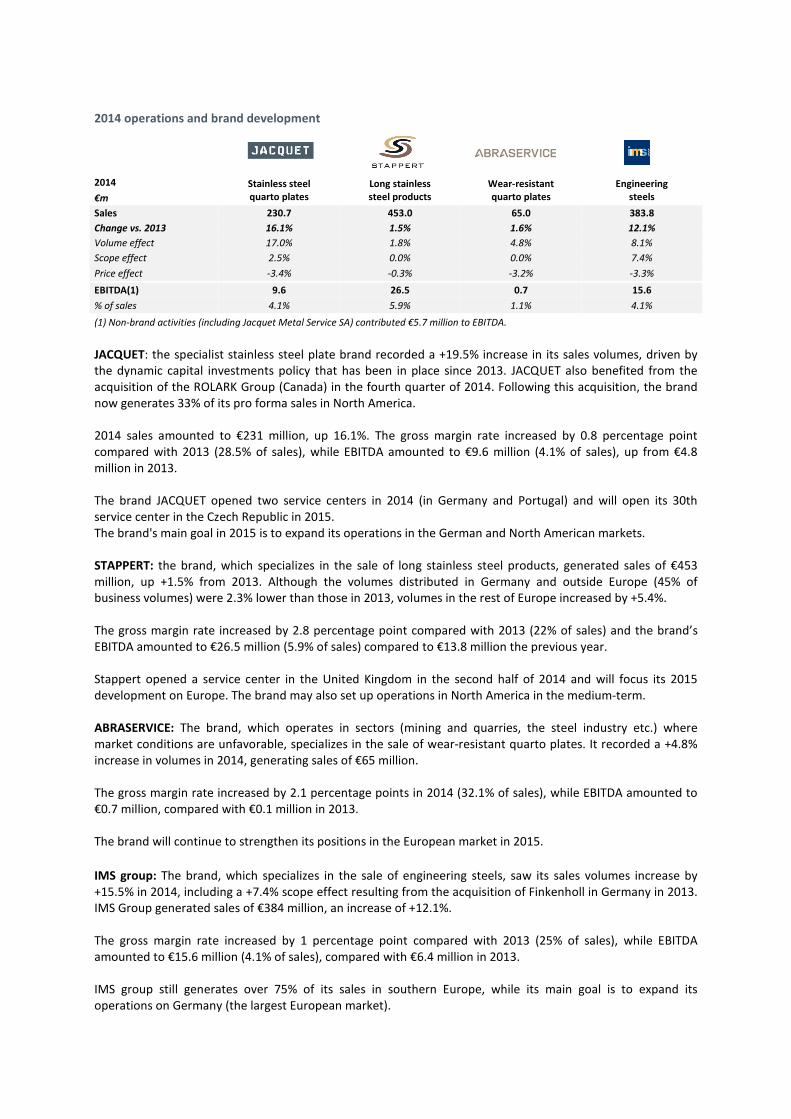
2014 operations and brand development
2014 Stainless steel
quarto plates
Long stainless
steel products
Wear-resistant
quarto plates
Engineering
steels €m
Sales 230.7 453.0 65.0 383.8
Change vs. 2013 16.1% 1.5% 1.6% 12.1%
Volume effect 17.0% 1.8% 4.8% 8.1%
Scope effect 2.5% 0.0% 0.0% 7.4%
Price effect -3.4% -0.3% -3.2% -3.3%
EBITDA(1) 9.6 26.5 0.7 15.6
% of sales 4.1% 5.9% 1.1% 4.1%
(1) Non-brand activities (including Jacquet Metal Service SA) contributed €5.7 million to EBITDA.
JACQUET: the specialist stainless steel plate brand recorded a +19.5% increase in its sales volumes, driven by the dynamic capital investments policy that has been in place since 2013. JACQUET also benefited from the acquisition of the ROLARK Group (Canada) in the fourth quarter of 2014. Following this acquisition, the brand now generates 33% of its pro forma sales in North America. 2014 sales amounted to €231 million, up 16.1%. The gross margin rate increased by 0.8 percentage point compared with 2013 (28.5% of sales), while EBITDA amounted to €9.6 million (4.1% of sales), up from €4.8 million in 2013. The brand JACQUET opened two service centers in 2014 (in Germany and Portugal) and will open its 30th service center in the Czech Republic in 2015. The brand's main goal in 2015 is to expand its operations in the German and North American markets.
STAPPERT: the brand, which specializes in the sale of long stainless steel products, generated sales of €453 million, up +1.5% from 2013. Although the volumes distributed in Germany and outside Europe (45% of business volumes) were 2.3% lower than those in 2013, volumes in the rest of Europe increased by +5.4%. The gross margin rate increased by 2.8 percentage point compared with 2013 (22% of sales) and the brand’s EBITDA amounted to €26.5 million (5.9% of sales) compared to €13.8 million the previous year. Stappert opened a service center in the United Kingdom in the second half of 2014 and will focus its 2015 development on Europe. The brand may also set up operations in North America in the medium-term. ABRASERVICE: The brand, which operates in sectors (mining and quarries, the steel industry etc.) where market conditions are unfavorable, specializes in the sale of wear-resistant quarto plates. It recorded a +4.8% increase in volumes in 2014, generating sales of €65 million. The gross margin rate increased by 2.1 percentage points in 2014 (32.1% of sales), while EBITDA amounted to €0.7 million, compared with €0.1 million in 2013. The brand will continue to strengthen its positions in the European market in 2015.
IMS group: The brand, which specializes in the sale of engineering steels, saw its sales volumes increase by +15.5% in 2014, including a +7.4% scope effect resulting from the acquisition of Finkenholl in Germany in 2013. IMS Group generated sales of €384 million, an increase of +12.1%. The gross margin rate increased by 1 percentage point compared with 2013 (25% of sales), while EBITDA amounted to €15.6 million (4.1% of sales), compared with €6.4 million in 2013. IMS group still generates over 75% of its sales in southern Europe, while its main goal is to expand its operations on Germany (the largest European market).

2
THE GROUP
1. A LEADING DISTRIBUTOR OF SPECIALTY STEELS
Employees 2,413
Distribution centers 86
Countries 23
A global player Breakdown of sales 2014
Jacquet Metal Service is a European market leader in the distribution of specialty steels and also operates in China and North America. The Group manages and develops a portfolio of brands: JACQUET (stainless steel quarto plates), Stappert (long stainless steel products), Abraservice (wear-resistant quarto plates) and IMS group (engineering steels).
3
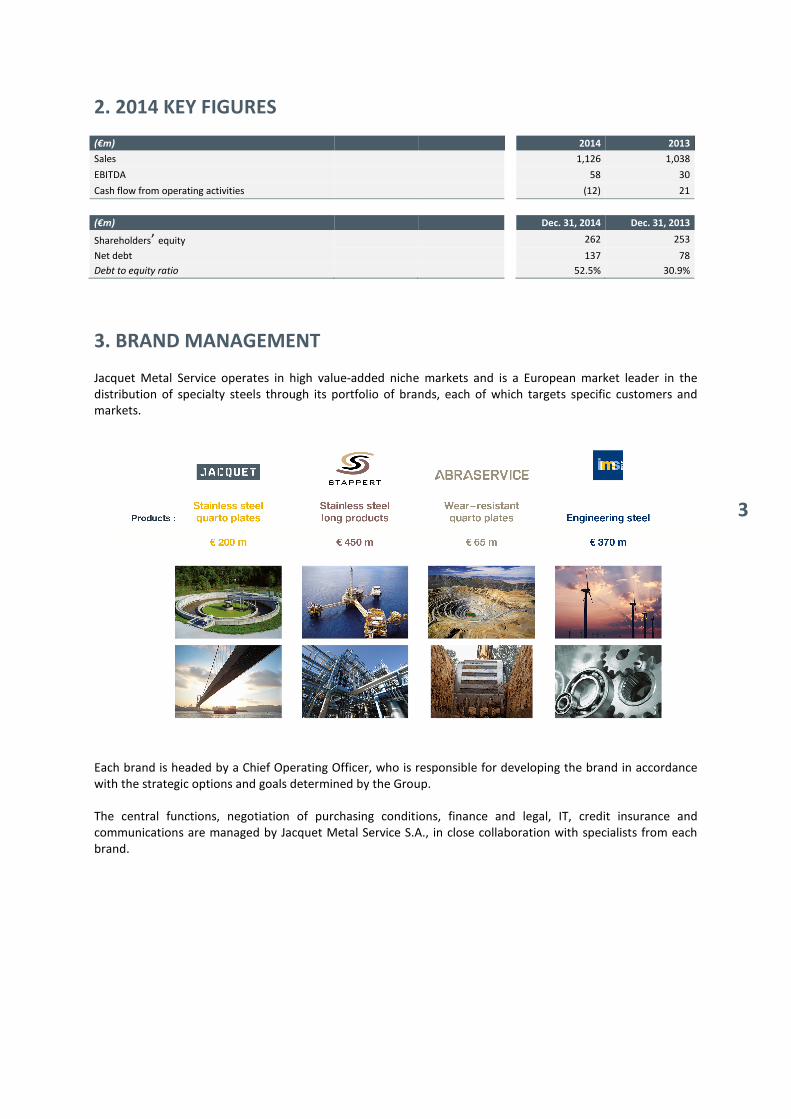
2. 2014 KEY FIGURES
(€m) 2014 2013
Sales 1,126 1,038
EBITDA 58 30
Cash flow from operating activities (12) 21
(€m) Dec. 31, 2014 Dec. 31, 2013
Shareholders’ equity 262 253
Net debt 137 78
Debt to equity ratio 52.5% 30.9%
3. BRAND MANAGEMENT Jacquet Metal Service operates in high value-added niche markets and is a European market leader in the distribution of specialty steels through its portfolio of brands, each of which targets specific customers and markets.
Each brand is headed by a Chief Operating Officer, who is responsible for developing the brand in accordance with the strategic options and goals determined by the Group. The central functions, negotiation of purchasing conditions, finance and legal, IT, credit insurance and communications are managed by Jacquet Metal Service S.A., in close collaboration with specialists from each brand.
>
OVERVIEW OF GROUP
4
4. GOVERNANCE
4.1. The Board of Directors As of June 30, 2010 the Company adopted a governance model based on a Board of Directors. The General Meeting of June 26, 2014 appointed the following individuals as directors for a two-year term of office expiring at the end of the General Meeting called to approve the financial statements for the financial year ended December 31, 2015:
- Eric Jacquet, a French national, 56, who has been the Chairman and Chief Executive Officer of Jacquet Metal Service since July 20, 2010. He was previously Chairman and Chief Executive Officer of Jacquet Metals (formerly Jacquet Industries) from that company’s foundation in 1994. Eric Jacquet also held the positions of Vice-Chairman of the Supervisory Board and member of the Strategy Committee of IMS International Metal Service from June 16, 2009 to February 3, 2010. Eric Jacquet has spent his entire career at the Jacquet Metal Service Group, where he held positions including Sales Manager (1980-1985), and Marketing and Export Development Manager (1986-1993). Eric Jacquet is also a member of the Lyon Commercial Court Association of Judges and Former Judges. He was first appointed to the Board of Directors on June 30, 2010.
- Françoise Papapietro (who is considered as an independent director), a French national, 50, spent
most of her career in investment banking (Paribas and Barclays), where she gained expertise in financial transactions (M&A, equity capital transactions and tax engineering). She has also held positions as Head of Institutional and Financial Communications for Infogrames, Chief Executive Officer of Henri Germain and Chief Executive Officer of Loze Partners & Vostok. Françoise Papapietro is an auditor at the French Institute of Advanced National Defense Studies and a Senior Advisor at Leyders Associates. She was first appointed to the Board of Directors on June 29, 2012.
- Gwendoline Arnaud (who is considered as an independent director), a French national, 42, has been a lawyer since 1998. In 2003 she set up her firm specializing in property and business law. Gwendoline Arnaud holds a Master’s Degree in Private Law and a Certificate of Legal Proficiency (CAPA). She was first appointed to the Board of Directors on June 26, 2014.
- Jean Jacquet (who is considered as an independent director), a French national, 82, held the positions
of Chairman of Faïence et Cristal de France until 2012, Chairman and Chief Executive Officer of SOMERGIE (the Metz urban public-private waste management company) until 2011 and Chairman and Chief Executive Officer of TCRM (Metz area public transport system) until 2010. Jean Jacquet represented JSA as a member of the Supervisory Board and member of the Appointment and Compensation Committee of IMS International Metal Service from June 16, 2009 to February 3, 2010. Jean Jacquet began his career at the Renault Group, where he worked until 1984. He was then Chairman and Chief Executive Officer of Unimetal-Ascometal, from 1984 to 1988, and Chairman of the Special Steel Dealers Union (UNAS) from 1988 to 1999. He has also held positions as Chairman of the Supervisory Board of Winwise, Director of the Metz National Engineering School, Chairman of the Inter-Ministerial Development Mission for the development of the Longwy European Hub, Chairman of the Board of Directors of the Metz power plant, Deputy Vice-Chairman of the French National Association of Electricity Concessions and Vice-Chairman of the Metz urban district (now the Metz metropolitan urban district grouping). We would remind you that Jean Jacquet is no relation to Eric Jacquet.

5
Jean Jacquet holds a Law Degree and is a graduate of the Paris Institute of Political Studies. He was first appointed to the Board of Directors on June 30, 2010.
- Henri-Jacques Nougein (who is considered as an independent director), a French national, 67, is an arbitration expert, mediator, amicable liquidation expert and insurance broker (specializing in corporate risk and liability). He is also the Honorary President of the Lyon Commercial Court, former Chairman of the Inter-Professional Mediation and Arbitration Center and Joint Manager of the European Arbitration and Mediation Network. He is the founder and Joint Manager of the Franco-Argentinian Mediation and Arbitration Center, the Franco-Chinese Mediation Center (in partnership with the Shanghai government authorities), and the Franco-Indian Mediation and Arbitration Center (in partnership with the Indian Federation of Chambers of Commerce and Industry). Henri-Jacques Nougein is also a lecturer at Lyon III University (Economic Procedural Law) and is the author of legal and technical research publications. He holds a degree in Private Law and is a graduate of the Lyon Legal Studies Institute, a graduate of the Advanced School of Private Law and a Government Doctor in Law (1976). He was first appointed to the Board of Directors on June 30, 2010.
- Xavier Gailly (who is considered to be an independent director), a Belgian national, 67, spent virtually
his entire career at Fabrique de Fer de Charleroi, which subsequently became Industeel Belgium, a subsidiary of the Arcelor Mittal Group. He held a number of positions in a wide variety of fields (maintenance, capital expenditure, purchasing, production, human resources, etc.), before becoming the company’s Chief Industrial Officer, Executive Director and finally Chief Executive Officer. He was then appointed as Sales Director for Industeel, Arcelor Mittal’s specialty flat steels division. Xavier has been a director or the Chairman of several Arcelor Mittal subsidiaries in Belgium and abroad. He has also held the offices of Director of the Mons Polytechnic Faculty, Director of IGRETEC (inter-district association for the management and performance of technical and economic research, which include 68 towns and cities in the province of Hainaut in Belgium), Vice-Chairman of the Belgian Steel Industry Consortium and Chairman of its French-speaking division. Xavier Gailly is the Chairman of GAMI, a member of the Outlook Committee for the city of Charleroi and a member of the Regional Advisory Committee for CERA (a cooperative financial grouping that includes 415,000 members). He is a civil electrical engineer and a graduate of the Mons Polytechnic Faculty (Belgium). He was first appointed to the Board of Directors on June 30, 2010.
- Jacques Leconte, (who is considered to be an independent director), a French national, 70, was the Director of the Crédit Agricole Sud Rhône-Alpes Business Center. He was specifically in charge of the financing activities for large companies, cooperatives and institutional investors for the Rhône-Alpes regional districts at the Crédit Agricole Regional Development Agency. He has been a director of Jacquet Metals since 2009 and is also a member of the Strategy Committee of Thermcross SA. Jacques Leconte studied geography at university and is a graduate of the Lyon Institute of Political Studies. He was first appointed to the Board of Directors on June 30, 2010.
- Hiscan Patrimonio S.A. (which is considered to be an independent director), a company governed by
Spanish law, represented by Jorge Galera Garcia Montes. Hiscan Patrimonio resigned from its director's office on October 10, 2014.
>
OVERVIEW OF GROUP
6
- JSA, a limited company governed by Belgian Law, controlled by Eric Jacquet and represented by Philippe Goczol. Philippe Goczol, a Belgian national, 48, is also the Deputy Chief Executive Officer of Jacquet Metal Service. He holds several appointments as a legal representative within the JMS Group. Philippe Goczol was a member of IMS International Metal Service’s Supervisory Board and Audit and Risk Committee from June 16, 2009 to February 3, 2010, the date on which he resigned. He was Chief Development Officer for Jacquet Metals from 2001 to 2004 and Chief Executive Officer from 2004 to 2008 Before joining Jacquet Metals, he was a member of the Executive Board and the CEO of Anysteel (2000-2001), and held positions as Sales Director (1999-2000), Proxy (1992-2000) and Commercial Engineer (1988-1992) at Industeel (formerly CLI-Fafer and Fafer). Philippe Goczol is a sales engineer and holds a degree from Mons University (Belgium). He was first appointed to the Board of Directors on June 30, 2010.
To the Company’s knowledge, no member of the Board of Directors has been the subject of an official public sanction, has been sentenced for fraud during the past five years, has been involved in any receivership, has been sanctioned by any statutory or regulatory authorities, including designated professional bodies, or has been the subject of any measure preventing them from directing, managing, administering or controlling a company during the past five years. To the Company’s knowledge, there is no potential conflict of interest between the private interests of the members of the Board of Directors and their duties to the Company. There are no arrangements or agreements with the main shareholders, or with customers or suppliers, pursuant to which a member of the Board of Directors might have been appointed as a director of the Company. There are no family ties between the members of the Board of Directors, including between Eric Jacquet and Jean Jacquet. A list of the offices and positions held by the corporate officers, as well as information on the number of shares they hold in Jacquet Metal Service is disclosed in paragraph 2.15 of the Management Report – Information on the parent company. The remuneration paid to the corporate officers is set out in paragraph 2.13 of the Management Report – Information on the parent company.
7
4.2 Senior management Jacquet Metal Service
Eric Jacquet Chairman & Chief Executive Officer Philippe Goczol Deputy Chief Executive Officer Thierry Philippe Chief Financial Officer, Investor Relations David Farias Chief Executive Officer responsible for the Jacquet and Abraservice brands Patrick Guien IT Director Jean Révérand Group Procurement Director Cédric Chaillol Brand communications and corporate identity manager
Brand operating divisions
David Farias Jacquet - Abraservice Wolfgang Hartmann Stappert José Berthelier IMS group
4.3. The Board of Directors committees Appointment and Compensation Committee
The Appointment and Compensation Committee consists of the following directors appointed by the Board of Directors for the term of their office as director on June 26, 2014:
- Henri-Jacques Nougein, Chairman; - Jacques Leconte; - Jean Jacquet.
Audit and Risk Committee
The Audit and Risk Committee consists of the following directors appointed by the Board of Directors for the term of their office as director on June 29, 2012:
- Jean Jacquet, Chairman; - Françoise Papapietro; - Xavier Gailly.
The offices of the Audit and Risk Committee members were renewed at the Board of Directors meeting on June 26, 2014.
4.4. Honorary Chairman Jacques-Didier Champalbert, the founder of IMS International Metal Service and Honorary Chairman of Jacquet Metal Service, died on April 25, 2014.
>
OVERVIEW OF GROUP
8
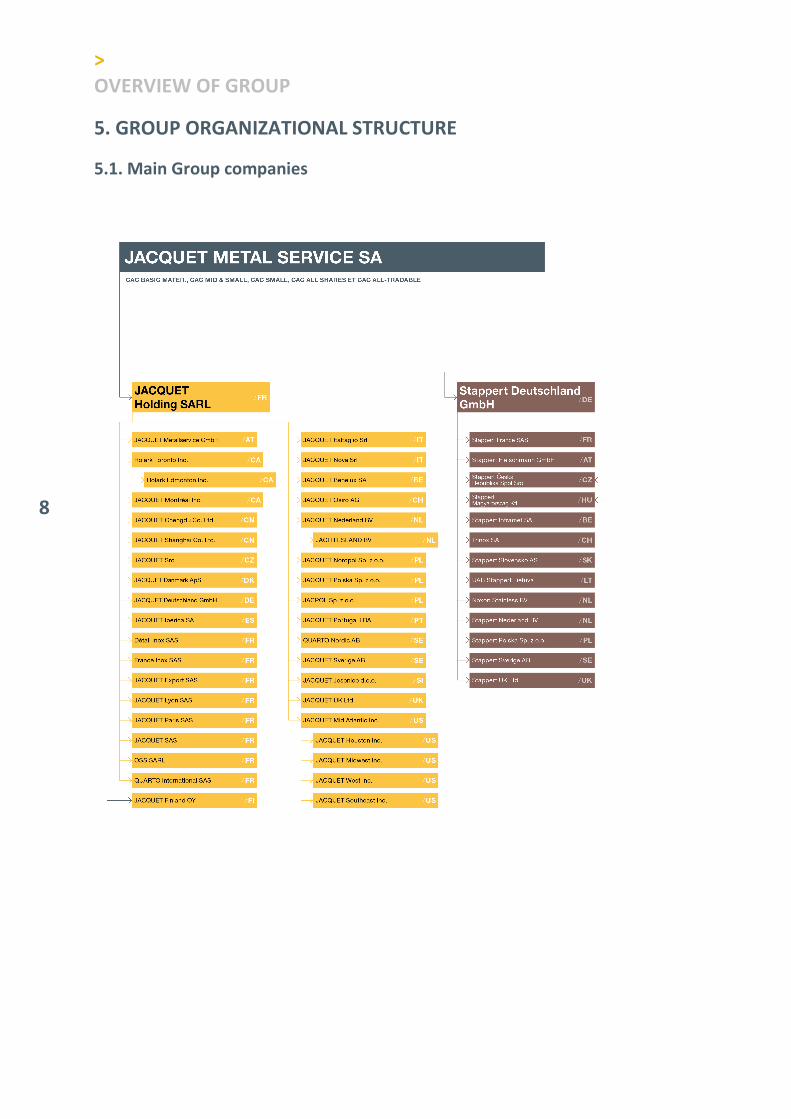
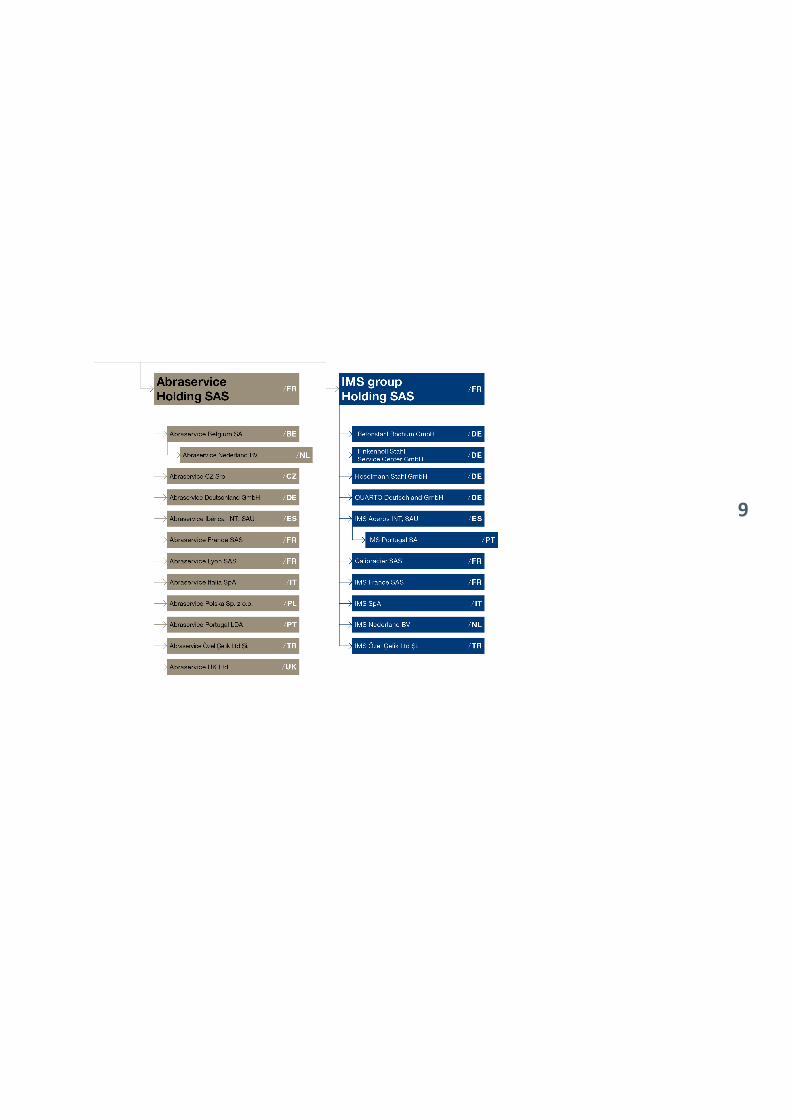
5. GROUP ORGANIZATIONAL STRUCTURE
5.1. Main Group companies
9
>
OVERVIEW OF GROUP
10
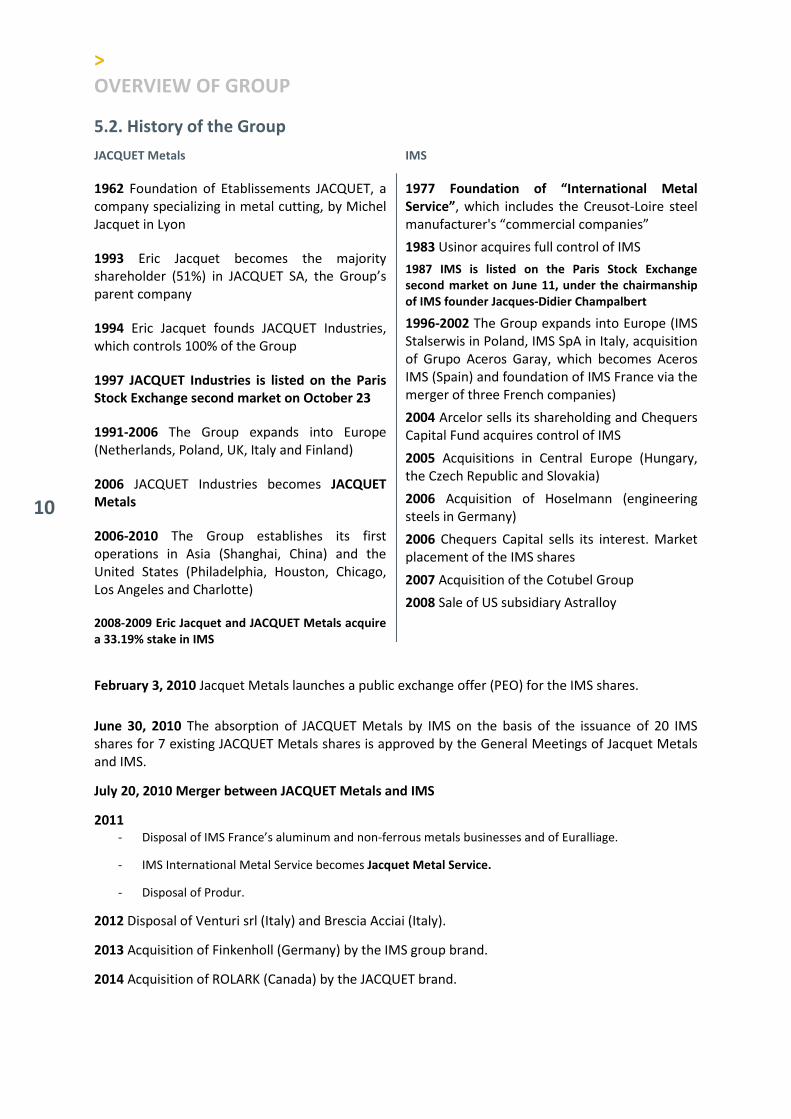
5.2. History of the Group
JACQUET Metals
1962 Foundation of Etablissements JACQUET, a company specializing in metal cutting, by Michel Jacquet in Lyon
1993 Eric Jacquet becomes the majority shareholder (51%) in JACQUET SA, the Group’s parent company
1994 Eric Jacquet founds JACQUET Industries, which controls 100% of the Group
1997 JACQUET Industries is listed on the Paris
Stock Exchange second market on October 23
1991-2006 The Group expands into Europe (Netherlands, Poland, UK, Italy and Finland)
2006 JACQUET Industries becomes JACQUET
Metals
2006-2010 The Group establishes its first operations in Asia (Shanghai, China) and the United States (Philadelphia, Houston, Chicago, Los Angeles and Charlotte) 2008-2009 Eric Jacquet and JACQUET Metals acquire
a 33.19% stake in IMS
IMS
1977 Foundation of “International Metal
Service”, which includes the Creusot-Loire steel manufacturer's “commercial companies”
1983 Usinor acquires full control of IMS
1987 IMS is listed on the Paris Stock Exchange
second market on June 11, under the chairmanship
of IMS founder Jacques-Didier Champalbert
1996-2002 The Group expands into Europe (IMS Stalserwis in Poland, IMS SpA in Italy, acquisition of Grupo Aceros Garay, which becomes Aceros IMS (Spain) and foundation of IMS France via the merger of three French companies)
2004 Arcelor sells its shareholding and Chequers Capital Fund acquires control of IMS
2005 Acquisitions in Central Europe (Hungary, the Czech Republic and Slovakia)
2006 Acquisition of Hoselmann (engineering steels in Germany)
2006 Chequers Capital sells its interest. Market placement of the IMS shares
2007 Acquisition of the Cotubel Group
2008 Sale of US subsidiary Astralloy
February 3, 2010 Jacquet Metals launches a public exchange offer (PEO) for the IMS shares.
June 30, 2010 The absorption of JACQUET Metals by IMS on the basis of the issuance of 20 IMS shares for 7 existing JACQUET Metals shares is approved by the General Meetings of Jacquet Metals and IMS.
July 20, 2010 Merger between JACQUET Metals and IMS
2011 - Disposal of IMS France’s aluminum and non-ferrous metals businesses and of Euralliage.
- IMS International Metal Service becomes Jacquet Metal Service.
- Disposal of Produr.
2012 Disposal of Venturi srl (Italy) and Brescia Acciai (Italy).
2013 Acquisition of Finkenholl (Germany) by the IMS group brand.
2014 Acquisition of ROLARK (Canada) by the JACQUET brand.
11
6. INFORMATION ON THE GROUP’S BUSINESS
6.1. The business The Jacquet Metal Service Group’s main business is the purchase, storage and delivery of various categories of products to a customer base that is primarily local and consists of small and medium-sized industrial companies. The Group buys large quantities from specialty steel producers (20 suppliers account for over 50% of Group purchases, with lead times ranging between 1 and 12 months) and sells them to a scattered customer base (60,000 active customers, average invoices of less than €3,000). Jacquet Metal Service provides the following value-added between the producer and the end-customer:
- A wide range of products in stock, which are delivered within short timeframes (order books rarely exceed a few weeks);
- Security of supply and product traceability; - Managing requirements on a just-in-time basis (customized inventory, defined supply strategies); - Competitive sale prices; - Managing price fluctuation on the customer’s behalf; - Cutting and finishing services.
In addition to selling its standard product range, the Group is able to offer its customers the choice of various customized initial processing operations in order to meet the final users' specifications. These services, which are performed at the Group’s warehouses, vary according to the products sold but usually involve light cutting, straightening and bending, folding or drilling operations. These services provide an obvious commercial advantage: they enable the Group to increase customer loyalty by positioning itself as a single contact point, thereby avoiding the use of a sub-contractor. The sales teams account for around 40% of the staff. They consist of sedentary or traveling salespersons whose remit is to follow up and advise customers, while ensuring that the Group’s offering meets their requirements on an ongoing basis.
6.2. Positioning The Group currently operates on four separate markets that form part of the distribution of specialty steels to industry, via four brands:
- JACQUET: stainless steel quarto plates; - Stappert: long stainless steel products; - Abraservice: wear-resistant quarto plates; - IMS group: engineering steels.
The Group’s strategy is to be physically close to its customers on the markets targeted by each Group brand. To date, Jacquet Metal Service is primarily positioned in European markets with the Stappert, Abraservice and IMS group brands. The JACQUET brand is established in Europe, in North America and China.
>
OVERVIEW OF GROUP
12
6.3. The market Sources: Jacquet Metal Service
The global steel market amounted to around 1.66 billion tons in 2014, of which alloy steels (steels containing alloy components such as chrome, nickel, molybdenum and titanium) accounted for around 5% across all product ranges. In the steel alloy category, stainless steels accounted for around 37 million tons across all products, i.e. around 2% of the global steel market. As the specialty steels market covers a large number of product niches, geopolitical situations and types of distribution role, the Group has little quantified information of an official nature. JACQUET and Stappert – stainless steels
Stainless steels are characterized by their strong resistance to corrosion and their stability when treated with fluids or gas. The main sectors that consume stainless steels are industries operating in:
- the chemicals sector (including pharmaceuticals and cosmetics); - the food-processing sector (hygiene restrictions and ease of maintenance); - the gas processing and storage sector (cryogenics, industrial gas); - the water treatment sector (waste water precipitation basins, desalination of sea water, transmission
and supply); - the environmental and decontamination sector (emissions and waste treatment); - the energy sector (hydraulic, nuclear and thermal power plants, etc.).
From 2013 to 2014, the consumption of stainless steel increased by 4% in Europe, 5% in America and 6% in Asia. In 2014, the consumption of stainless steel in Europe increased compared to 2013 by 4%, by 5% in North America and 6% in Asia. The stainless steel sector is characterized by the regular adjustment of the alloys to the increasingly high requirements of various industrial sectors. While there were two main varieties of stainless steel in 1960, JACQUET and Stappert currently stock several dozen, in addition to nickel alloy varieties, whose corrosion resistance is even higher than that of stainless steel. JACQUET – stainless steel quarto plates
The annual global stainless steel quarto plate market represents just over 1.25 million tons, i.e. around 3.9% of the global stainless steel market. It is a typically niche market in this regard and accounts for the bulk of JACQUET’s sales. This market is usually equally divided between projects (direct supply from the producer to the end-customer) and distribution. JACQUET is the leading global distributor of stainless steel quarto plates. Stappert – long stainless steel products
The annual global long stainless steel product market represents around 5.5 million tons. The global stainless steel rod market represents around 3 million tons, while the European market represents around 800,000 tons. Distribution accounts for around 50% of the long stainless steel product market in Europe. Stappert is one of the leading operators on the distribution market.
13
Abraservice – wear-resistant quarto plates
Wear-resistant quarto plates are intended for industrial sectors that face issues related to wear, shock-resistance, friction, temperature or tension that require the use of particularly hard materials, i.e. public works machinery, steel production, mines and quarries, cement plants, dredging, recycling, handling, agricultural machinery and the lifting and transportation of aggregates, etc. The wear-resistant quarto plates distributed by Abraservice meet particularly stringent quality and durability requirements. In addition to its offer, Abraservice also distributes plates with a high elasticity threshold designed for the heavy machinery, telescopic crane and civil engineering sectors. In fact, both categories of products share the same manufacturing methods (“hardened and tempered steels”) and the same shaping processes (pre-manufacturing operations performed by Abraservice, including cutting, drilling, folding and rolling). The annual European wear-resistant steels market is usually estimated at around 350,000 tons, 70% of which is supplied via distribution channels while the remainder is sold directly to end-users by producers. The wear-resistant steel market has struggling to recover since 2012. The European market for high-elasticity steels is usually estimated at around 500,000 tons, 30% of which is supplied via distribution channels. This market has been hit hard since 2012 in Europe. Abraservice is one of the market leaders for the distribution of wear-resistant plates. IMS group – engineering steels
These steels are used to manufacture parts that are subject to stringent engineering specifications. Engineering steels are distributed by the IMS group brand, primarily in the form of seamless rods and tubes, and are produced in accordance with specific standards and specifications that guarantee their suitability for processing by the customer (forging, machining, folding, welding, heat treatment) so as to achieve specific engineering features following their treatment. They are used in many industrial sectors, including: general engineering, public works equipment, agricultural machinery, transportation (engines, automotive drives, heavy goods vehicles and the railway sector), lifting machinery, oil industry and energy (wind turbines, etc.), and machining plants. The engineering steels market includes many forms and categories of products. The annual European engineering alloy steel market is estimated at around 9.5 million tons, including 4.5 million tons of rods. The two largest geographical markets in Europe are Germany and Italy, which jointly account for 60% of the market, followed by France and Spain, which represent 20% of the European market. The distribution sector’s share of the engineering steel rod market is estimated at 50%. IMS group’s market share varies significantly depending on the country, with strong positions in Italy, France and Spain. IMS group still has significant room to expand in other European countries, especially in Germany (first European market).
>
OVERVIEW OF GROUP
14
6.4. Competition JACQUET
The main competitors in the cut plate market, which accounts for most of the volumes distributed by JACQUET, fall into two categories:
- In-house departments of large European steel groups (e.g. Outokumpu, which absorbed the Inoxum Division including the ThyssenKrupp stainless steel businesses in December 2012) in several countries;
- Family-owned companies, which operate in just one country. There are also two kinds of competitors in the trade segment (sale of unprocessed plates), a business where JACQUET implements an opportunistic policy depending on market conditions, i.e.
- Stainless steel producers who have their own in-house distribution network (Acerinox, Outokumpu, Daekyung and Thyssen);
- Companies that are independent from the producers, such as Nichelcrom in Italy and Salzgitter in Germany; As product availability, and therefore inventories, is a key factor in this business, there are few direct competitors in the trading segment.
Stappert
Stappert’s competition breaks down between:
- Operators who are established at the European level, including producers of long stainless steel products who distribute their products via their own distribution network (Schmolz + Bickenbach, Cogne, Valbruna) or distributors who are independent from the producers (Amari, Damstahl, ThyssenKrupp Materials);
- Independent distributors, whose size may be significant at regional or national level but who do not operate on a European scale.
Abraservice
Wear-resistant products are often brand steels that are developed and distributed by steel producers. Abraservice’s main competitor in Europe is SSAB, the Swedish steel producer, which only markets its own products. There are a few independent competitors, whose size can be significant, at regional or national level. They often distribute entry-level products from remote or second-tier producers. IMS group
The engineering steel distribution market includes a small number of major international operators at European level (Schmolz + Bickenbach, ThyssenKrupp Materials, Cogne). IMS group is the only operator that has no production activities. The remainder of the market is divided between a large number of independent distributors, whose size may be significant at regional or national level but who do not operate on a European scale. Competition in the engineering steel distribution segment rarely comes from the actual producers. A large number of those producers do not hold any inventories. The different varieties are often not produced on an ongoing basis and are sold through the order book as soon as they leave the plant. This means that the producers only target major end-users directly.
15
6.5. The customers Specialty steels are used for specific applications by a wide variety of industrial sectors. Larger end-users such as automotive manufacturers are supplied directly by producers. Conversely, Jacquet Metal Service’s core target market consists of a local network of SMEs operating in a wide variety of industrial sectors. The Group supplies over 60,000 active customers based in around 100 countries, while its commercial relationships are based on a large quantity of small orders (less than €3,000 on average). Accordingly, the Group is not dependent on any specific customer. Customers place their orders directly with the Group companies, with no call for tender process. Every customer order is invoiced once the products have been dispatched. A significant portion of the sales are insured by various credit insurance companies. JACQUET's and Stappert's customers primarily operate in the chemicals, food-processing, energy and environmental sectors, as well as the water and gas storage and treatment sectors. Abraservice’s customers are industrial companies that operate in the mining and quarries, public works machinery, handling, lifting and haulage sectors, as well as cement plants. IMS group offers products that display resistance to engineering constraints. Therefore the brand primarily targets industrial companies in the transportation equipment (engines, drives, railways, etc.), energy (wind turbines, petrochemicals and refining, etc.) and more broadly in the general engineering and machining plant sectors. The commercial relationships are recurring and involve a large quantity of small orders, which account for most of the Group’s sales. The order book represents around one month’s sales.
6.6. Purchases The terms and conditions of purchase are negotiated between the main producers’ management teams and the Jacquet Metal Service S.A. managers, working together with the Chief Operating Officer for each brand. By aggregating the volumes for each brand, Jacquet Metal Service provides producers with greater visibility on their business volumes and on the organization of their production schedule. The Group benefits from optimal purchasing terms and conditions in return. The “framework terms and conditions” obtained in this way are disclosed to the subsidiaries involved, which place their orders with the producers directly. The Group is not dependent on a specific supplier and only uses sub-contractors on an occasional basis. A given supplier is only in a position to provide a limited number of stock items. In the case of so-called specialty products distributed on niche markets, the number of suppliers is also limited. In the case of some niche products, the Group purchases its supplies primarily from producers with which it has a close relationship (VDM for nickel alloys, Arcelor Mittal Industeel for the Creusabro range, etc.). The Group also has exclusive agreements for some products and in some countries.
>
OVERVIEW OF GROUP
16
7. OTHER INFORMATION
7.1. IT system All the companies belonging to the JACQUET and Abraservice brands use the Integrated Management Program (IMP), which was developed in-house. This program includes a business application and a localized accounting solution. These centralized tools are one of the keys to an effective and responsive management control process. This IMP is being installed for Stappert brand and will be operational in 2015. The dedicated IT tool provides optimal solutions aimed at simplifying the sales process. It is also an essential tool for implementing purchasing systems based on pooled negotiations. The user interface benefits from the user-friendliness of a full web mode. Every user can access all their brand’s inventories in real-time. “Intra-group” sales are processed automatically. Marketing documents are published in the local language and comply with national presentation specifications. The business application for each brand is available in many languages, which simplifies the day-to-day work of all users throughout the world. For instance, all user interface screens are available in Chinese; when a Chinese employee handles an order in Shanghai in their native tongue, this order can be viewed in French at the Group’s head office. The business application has been developed using state-of-the-art technologies (full web mode on a LAOP Linux-Apache platform, Oracle database, PHP), while all Group websites are connected to the central website via an MPLS and VPN IPsec network. The high degree of scalability of the chosen solution enables the Group’s developments over the coming years to be supported without problems, regardless of the number of users and/or volumes handled. The IMS group and Stappert brands companies primarily use the Stratix IMP and specific IMSX developments, which supplement the logistic functionalities of the Stratix product. Adapting the in-house developed IMP to the long product distribution businesses (Stappert and IMS group brands) required a significant number of changes and the development of additional modules. The main IMP modules have now been developed and the first Stappert Polska website has been rolled out. Local customization and the roll-out of the IMP developed on Stappert brand companies will be operational in 2015.
17
7.2. A unique development method The Group is developing the use of its brands via an unusual and innovative business model in the metal distribution sector. Joint ventures (JVs) are set up with a local partner, who is usually the manager of the JV. This partner invests and receives an equity interest in the JV that ranges between 10 and 49%; the partner commits to recapitalizing the JV at least up to the amount initially invested in the event of losses. The JV benefits from the exclusive right to use the brand and can therefore market the full range of the brand’s products in a specified area. The local partner benefits from a set of resources made available to them by the Group, such as terms and conditions of purchase, a product/market information system tailored to their business, staff training, access to an information network, etc. Every effort is made to enable the local partner to focus on their main goal, i.e. generating profitable sales. Local managers manage their inventories in accordance with the marketing policy that they have determined. Managers' compensation is largely based on the JV’s results. The Group invoices the JV for services performed, primarily management fees and IT services. Where applicable, managers also receive dividends in proportion to the units that they hold.
7.3. Capital expenditure policy This information is provided in paragraph 1.5 “Consolidated financial position/Capital expenditure” in the Management Report – Information on the Group.
7.4. Risk factors This information is provided in paragraph 1.7 “Risk factors” in the Management Report – Information on the Group.
8. STOCK MARKET INFORMATION
8.1. General features of shares and market capitalization
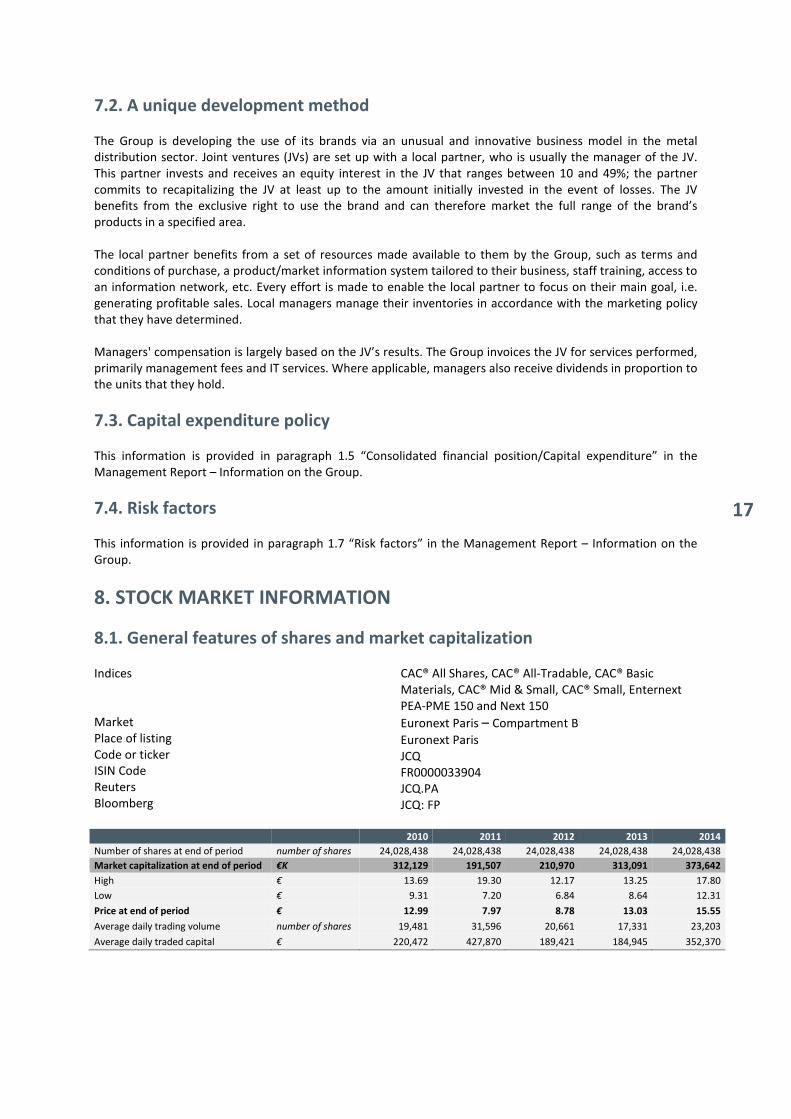
Indices Market Place of listing Code or ticker ISIN Code Reuters Bloomberg
CAC® All Shares, CAC® All-Tradable, CAC® Basic Materials, CAC® Mid & Small, CAC® Small, Enternext PEA-PME 150 and Next 150
Euronext Paris – Compartment B
Euronext Paris JCQ FR0000033904 JCQ.PA JCQ: FP
2010 2011 2012 2013 2014
Number of shares at end of period number of shares 24,028,438 24,028,438 24,028,438 24,028,438 24,028,438
Market capitalization at end of period €K 312,129 191,507 210,970 313,091 373,642
High € 13.69 19.30 12.17 13.25 17.80
Low € 9.31 7.20 6.84 8.64 12.31
Price at end of period € 12.99 7.97 8.78 13.03 15.55
Average daily trading volume number of shares 19,481 31,596 20,661 17,331 23,203
Average daily traded capital € 220,472 427,870 189,421 184,945 352,370
>
OVERVIEW OF GROUP
18
STOXX® Europe TMI Industrial Metals (indexed to JCQ at Jan. 1, 2014
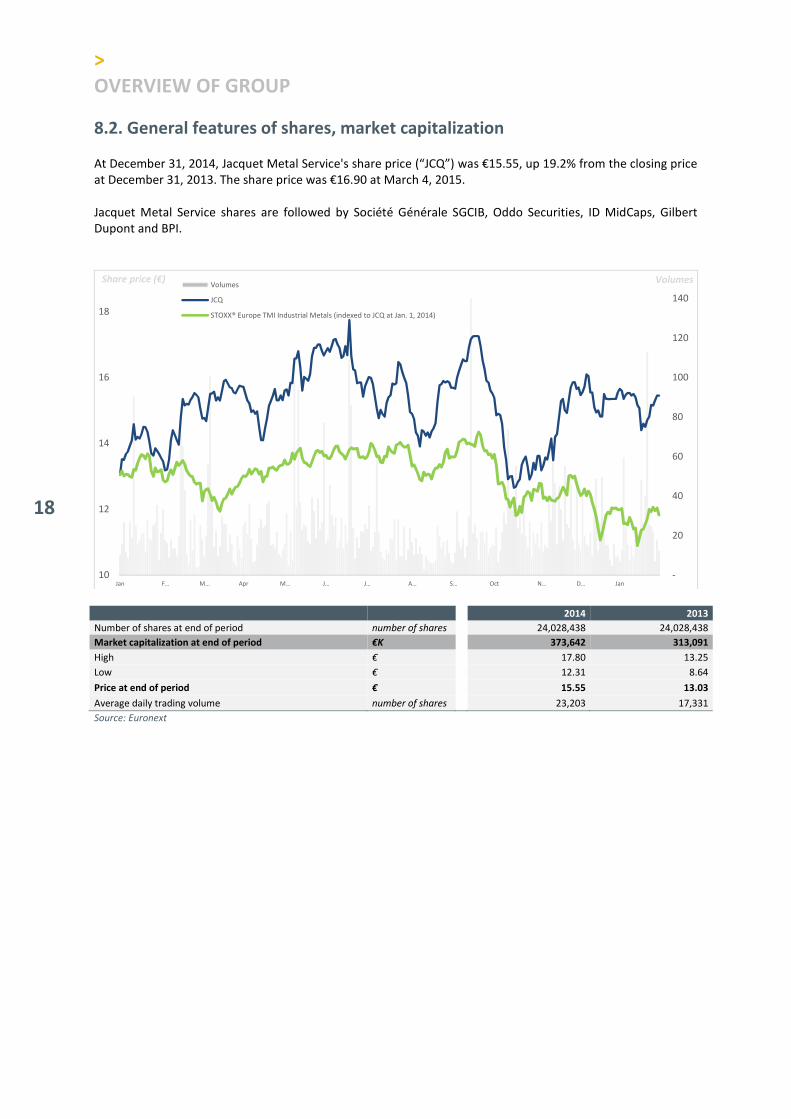
8.2. General features of shares, market capitalization
At December 31, 2014, Jacquet Metal Service's share price (“JCQ”) was €15.55, up 19.2% from the closing price at December 31, 2013. The share price was €16.90 at March 4, 2015. Jacquet Metal Service shares are followed by Société Générale SGCIB, Oddo Securities, ID MidCaps, Gilbert Dupont and BPI.
2014 2013
Number of shares at end of period number of shares 24,028,438 24,028,438
Market capitalization at end of period €K 373,642 313,091
High € 17.80 13.25
Low € 12.31 8.64
Price at end of period € 15.55 13.03
Average daily trading volume number of shares 23,203 17,331
Source: Euronext
-
20
40
60
80
100
120
140
10
12
14
16
18
Jan F… M… Apr M… J… J… A… S… Oct N… D… Jan
Volumes Share price (€)Volumes
JCQ
STOXX® Europe TMI Industrial Metals (indexed to JCQ at Jan. 1, 2014)
19
NewCap
Emmanuel Huynh / Julien Perez Tel: +33 (0)1 44 71 94 94 [email protected]
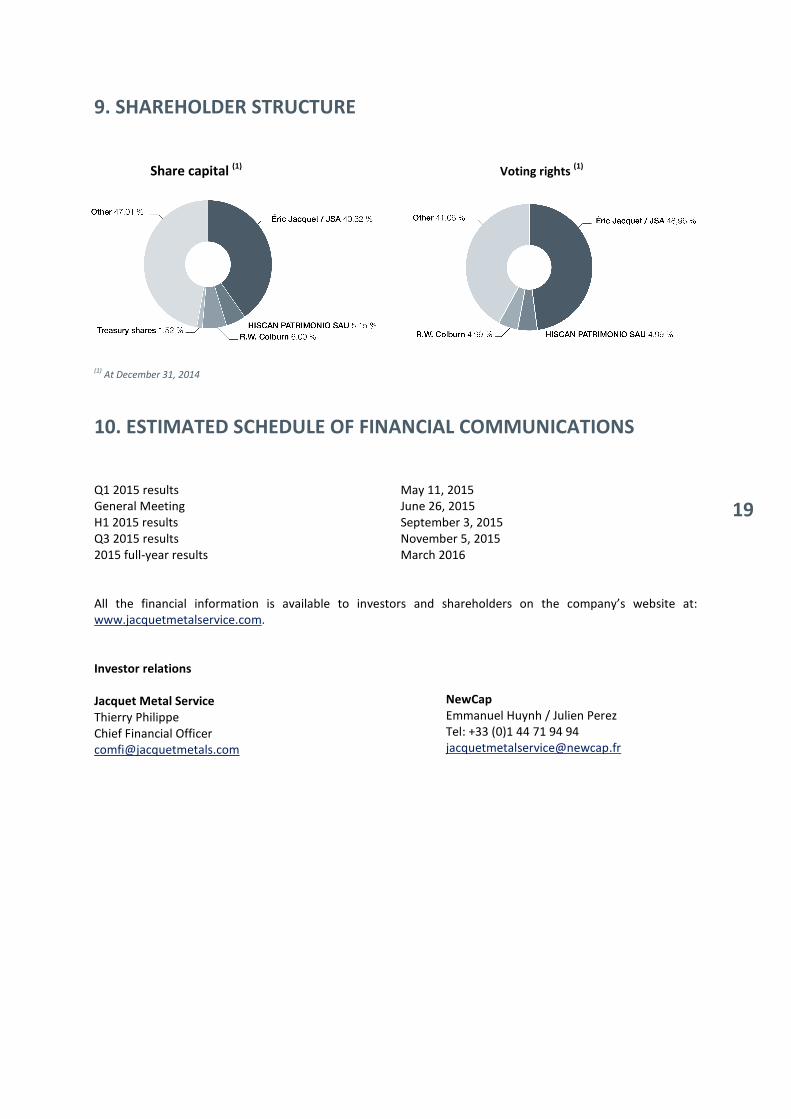
9. SHAREHOLDER STRUCTURE
Share capital (1) Voting rights
(1)
(1)
At December 31, 2014
10. ESTIMATED SCHEDULE OF FINANCIAL COMMUNICATIONS
Q1 2015 results General Meeting H1 2015 results Q3 2015 results 2015 full-year results
May 11, 2015 June 26, 2015 September 3, 2015 November 5, 2015 March 2016
All the financial information is available to investors and shareholders on the company’s website at: www.jacquetmetalservice.com.
Investor relations
Jacquet Metal Service
Thierry Philippe Chief Financial Officer [email protected]
20
2014
FINANCIAL
REPORT
1. MANAGEMENT REPORT – INFORMATION ON THE GROUP
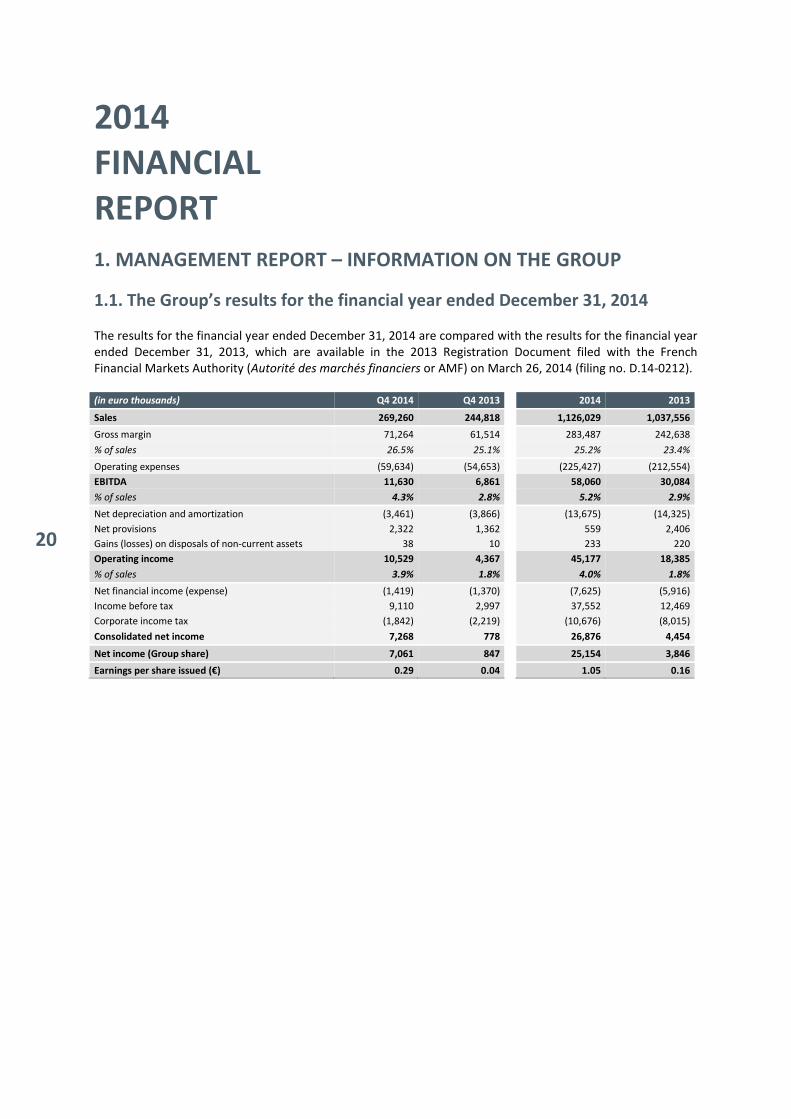
1.1. The Group’s results for the financial year ended December 31, 2014 The results for the financial year ended December 31, 2014 are compared with the results for the financial year ended December 31, 2013, which are available in the 2013 Registration Document filed with the French Financial Markets Authority (Autorité des marchés financiers or AMF) on March 26, 2014 (filing no. D.14-0212). (in euro thousands) Q4 2014 Q4 2013 2014 2013
Sales 269,260 244,818 1,126,029 1,037,556
Gross margin 71,264 61,514 283,487 242,638
% of sales 26.5% 25.1% 25.2% 23.4%
Operating expenses (59,634) (54,653) (225,427) (212,554)
EBITDA 11,630 6,861 58,060 30,084
% of sales 4.3% 2.8% 5.2% 2.9%
Net depreciation and amortization (3,461) (3,866) (13,675) (14,325)
Net provisions 2,322 1,362 559 2,406
Gains (losses) on disposals of non-current assets 38 10 233 220
Operating income 10,529 4,367 45,177 18,385
% of sales 3.9% 1.8% 4.0% 1.8%
Net financial income (expense) (1,419) (1,370) (7,625) (5,916)
Income before tax 9,110 2,997 37,552 12,469
Corporate income tax (1,842) (2,219) (10,676) (8,015)
Consolidated net income 7,268 778 26,876 4,454
Net income (Group share) 7,061 847 25,154 3,846
Earnings per share issued (€) 0.29 0.04 1.05 0.16
21
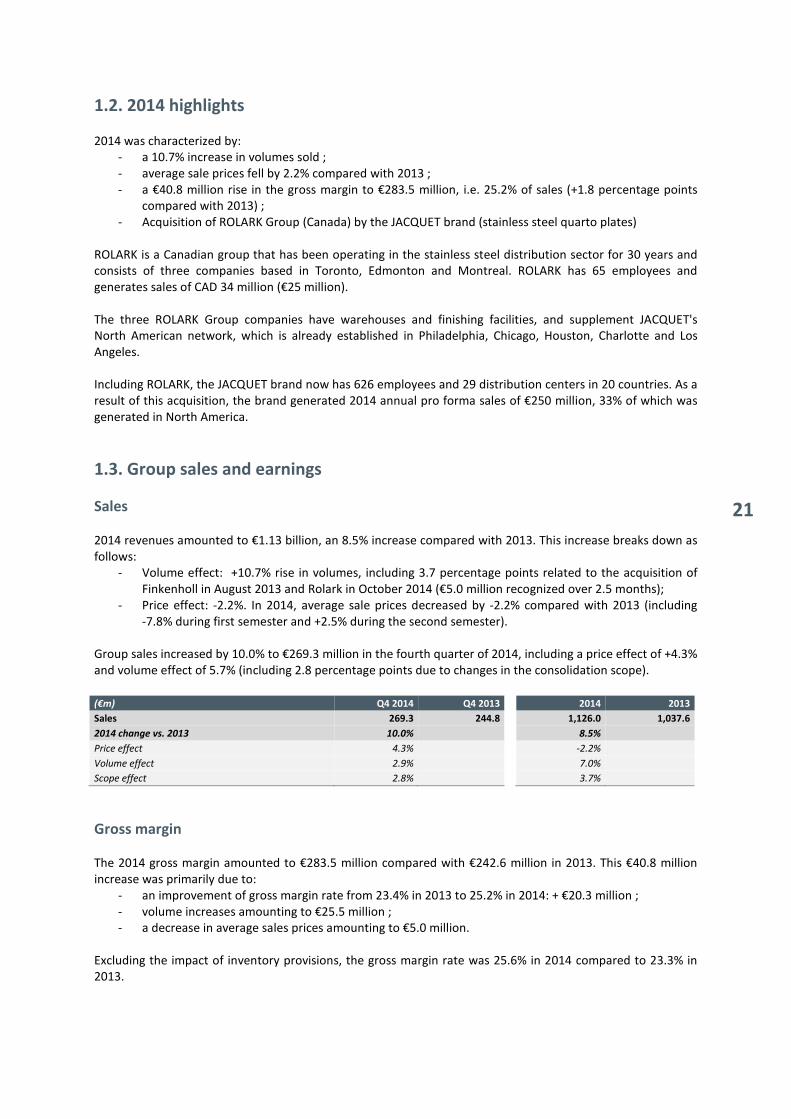
1.2. 2014 highlights
2014 was characterized by:
- a 10.7% increase in volumes sold ; - average sale prices fell by 2.2% compared with 2013 ; - a €40.8 million rise in the gross margin to €283.5 million, i.e. 25.2% of sales (+1.8 percentage points
compared with 2013) ; - Acquisition of ROLARK Group (Canada) by the JACQUET brand (stainless steel quarto plates)
ROLARK is a Canadian group that has been operating in the stainless steel distribution sector for 30 years and consists of three companies based in Toronto, Edmonton and Montreal. ROLARK has 65 employees and generates sales of CAD 34 million (€25 million). The three ROLARK Group companies have warehouses and finishing facilities, and supplement JACQUET's North American network, which is already established in Philadelphia, Chicago, Houston, Charlotte and Los Angeles. Including ROLARK, the JACQUET brand now has 626 employees and 29 distribution centers in 20 countries. As a result of this acquisition, the brand generated 2014 annual pro forma sales of €250 million, 33% of which was generated in North America.
1.3. Group sales and earnings
Sales 2014 revenues amounted to €1.13 billion, an 8.5% increase compared with 2013. This increase breaks down as follows:
- Volume effect: +10.7% rise in volumes, including 3.7 percentage points related to the acquisition of Finkenholl in August 2013 and Rolark in October 2014 (€5.0 million recognized over 2.5 months);
- Price effect: -2.2%. In 2014, average sale prices decreased by -2.2% compared with 2013 (including -7.8% during first semester and +2.5% during the second semester).
Group sales increased by 10.0% to €269.3 million in the fourth quarter of 2014, including a price effect of +4.3% and volume effect of 5.7% (including 2.8 percentage points due to changes in the consolidation scope).
(€m) Q4 2014 Q4 2013 2014 2013
Sales 269.3 244.8 1,126.0 1,037.6
2014 change vs. 2013 10.0% 8.5%
Price effect 4.3% -2.2%
Volume effect 2.9% 7.0%
Scope effect 2.8% 3.7%
Gross margin The 2014 gross margin amounted to €283.5 million compared with €242.6 million in 2013. This €40.8 million increase was primarily due to:
- an improvement of gross margin rate from 23.4% in 2013 to 25.2% in 2014: + €20.3 million ; - volume increases amounting to €25.5 million ; - a decrease in average sales prices amounting to €5.0 million.
Excluding the impact of inventory provisions, the gross margin rate was 25.6% in 2014 compared to 23.3% in 2013.
>
2014 FINANCIAL REPORT MANAGEMENT REPORT – INFORMATION ON THE GROUP
22
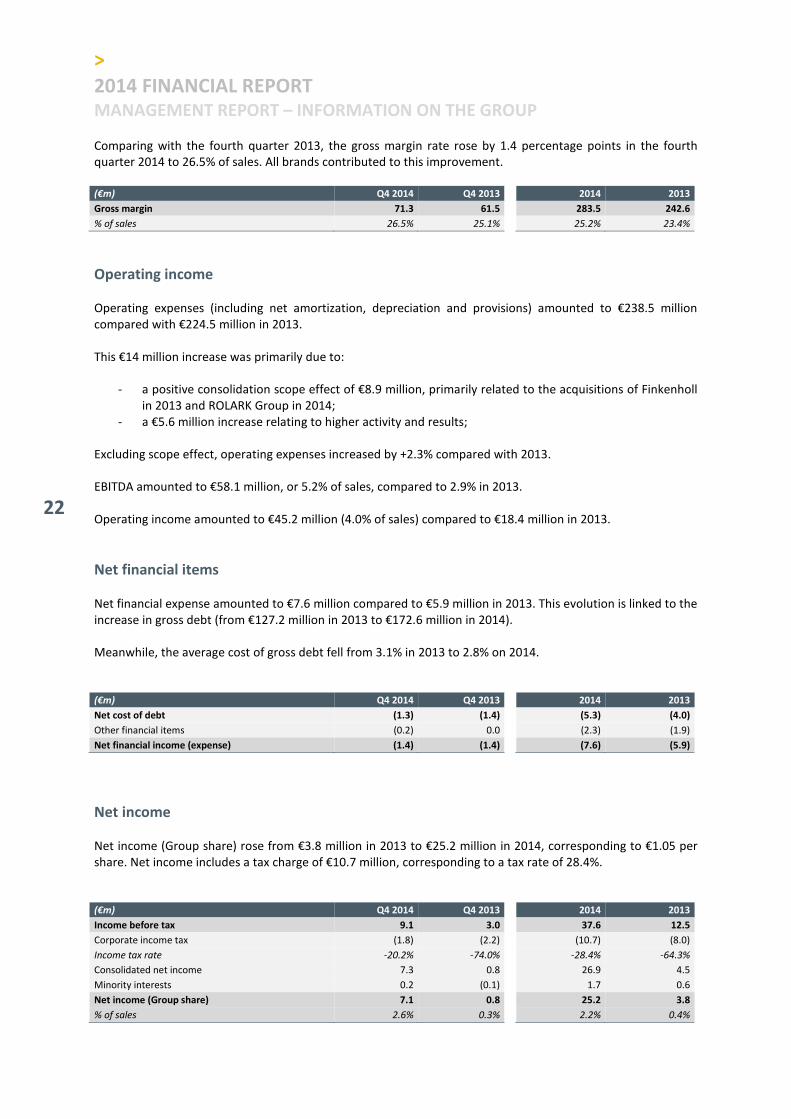
Comparing with the fourth quarter 2013, the gross margin rate rose by 1.4 percentage points in the fourth quarter 2014 to 26.5% of sales. All brands contributed to this improvement. (€m) Q4 2014 Q4 2013 2014 2013
Gross margin 71.3 61.5 283.5 242.6
% of sales 26.5% 25.1% 25.2% 23.4%
Operating income Operating expenses (including net amortization, depreciation and provisions) amounted to €238.5 million compared with €224.5 million in 2013. This €14 million increase was primarily due to:
- a positive consolidation scope effect of €8.9 million, primarily related to the acquisitions of Finkenholl in 2013 and ROLARK Group in 2014;
- a €5.6 million increase relating to higher activity and results;
Excluding scope effect, operating expenses increased by +2.3% compared with 2013. EBITDA amounted to €58.1 million, or 5.2% of sales, compared to 2.9% in 2013. Operating income amounted to €45.2 million (4.0% of sales) compared to €18.4 million in 2013.
Net financial items Net financial expense amounted to €7.6 million compared to €5.9 million in 2013. This evolution is linked to the increase in gross debt (from €127.2 million in 2013 to €172.6 million in 2014). Meanwhile, the average cost of gross debt fell from 3.1% in 2013 to 2.8% on 2014. (€m) Q4 2014 Q4 2013 2014 2013
Net cost of debt (1.3) (1.4) (5.3) (4.0)
Other financial items (0.2) 0.0 (2.3) (1.9)
Net financial income (expense) (1.4) (1.4) (7.6) (5.9)
Net income Net income (Group share) rose from €3.8 million in 2013 to €25.2 million in 2014, corresponding to €1.05 per share. Net income includes a tax charge of €10.7 million, corresponding to a tax rate of 28.4%. (€m) Q4 2014 Q4 2013 2014 2013
Income before tax 9.1 3.0 37.6 12.5
Corporate income tax (1.8) (2.2) (10.7) (8.0)
Income tax rate -20.2% -74.0% -28.4% -64.3%
Consolidated net income 7.3 0.8 26.9 4.5
Minority interests 0.2 (0.1) 1.7 0.6
Net income (Group share) 7.1 0.8 25.2 3.8
% of sales 2.6% 0.3% 2.2% 0.4%
23
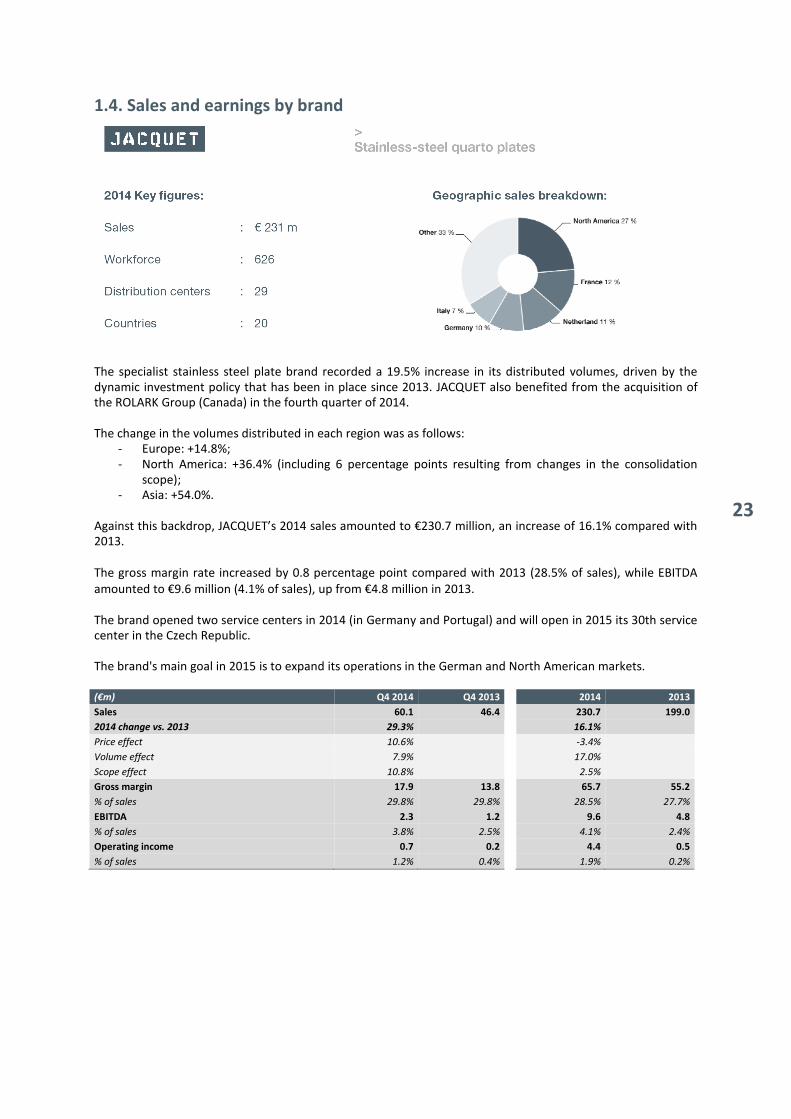
1.4. Sales and earnings by brand The specialist stainless steel plate brand recorded a 19.5% increase in its distributed volumes, driven by the dynamic investment policy that has been in place since 2013. JACQUET also benefited from the acquisition of the ROLARK Group (Canada) in the fourth quarter of 2014. The change in the volumes distributed in each region was as follows:
- Europe: +14.8%; - North America: +36.4% (including 6 percentage points resulting from changes in the consolidation
scope); - Asia: +54.0%.
Against this backdrop, JACQUET’s 2014 sales amounted to €230.7 million, an increase of 16.1% compared with 2013. The gross margin rate increased by 0.8 percentage point compared with 2013 (28.5% of sales), while EBITDA amounted to €9.6 million (4.1% of sales), up from €4.8 million in 2013. The brand opened two service centers in 2014 (in Germany and Portugal) and will open in 2015 its 30th service center in the Czech Republic. The brand's main goal in 2015 is to expand its operations in the German and North American markets. (€m) Q4 2014 Q4 2013 2014 2013
Sales 60.1 46.4
230.7 199.0
2014 change vs. 2013 29.3% 16.1%
Price effect 10.6% -3.4%
Volume effect 7.9% 17.0%
Scope effect 10.8% 2.5%
Gross margin 17.9 13.8 65.7 55.2
% of sales 29.8% 29.8% 28.5% 27.7%
EBITDA 2.3 1.2 9.6 4.8
% of sales 3.8% 2.5% 4.1% 2.4%
Operating income 0.7 0.2 4.4 0.5
% of sales 1.2% 0.4% 1.9% 0.2%

>
2014 FINANCIAL REPORT MANAGEMENT REPORT – INFORMATION ON THE GROUP
24
The specialist long stainless steel products brand recorded sales of €453 million, an increase of 1.5% compared with 2013 (volume effect +1.8%, price effect -0.3%). Although the volumes distributed in Germany and outside Europe (45% of total volumes) fell by 2.3% compared to 2013, volumes in the rest of Europe increased by 5.4%:
- South Eastern Europe (Austria, Czech Republic, Slovakia and Hungary): +3.8%. This region accounts for 26% of the brand’s sales.
- North Eastern Europe (Poland, Lithuania and Sweden): +5.3%. This region accounts for 14% of the brand’s sales.
- Western Europe (Austria, Czech Republic, Slovakia and Hungary): +8.4%. This region accounts for 15% of the brand’s sales.
With an increase of gross margin rate by 2.8 percentage points compared to 2013 (22% of sales), the EBITDA of the brand amounted to €26.5 million (5.9% of sales), compared to €13.8 million a year earlier. Stappert opened a service center in the United Kingdom in the second half of 2014 and will focus its 2015 development on Europe. The brand may also establish operations in North America in the medium-term. (€m) Q4 2014 Q4 2013 2014 2013
Sales 102.3 100.1
453.0 446.3
Change vs. 2013 2.3% 1.5%
Price effect 6.6% -0.3%
Volume effect -4.3% 1.8%
Gross margin 24.0 21.1 99.7 85.7
% of sales 23.4% 21.1% 22.0% 19.2%
EBITDA 5.8 2.9 26.5 13.8
% of sales 5.7% 2.9% 5.9% 3.1%
Operating income 5.1 2.9 23.4 11.0
% of sales 5.0% 2.9% 5.2% 2.5%

25
The brand, which operates in sectors (mining and quarries, the steel industry etc.) where market conditions are unfavorable, specializes in the sale of wear-resistant quarto plates. It recorded a 4.8% increase in volumes in 2014, generating sales of €65 million. The gross margin rate rose by 2.1 percentage points (32.1% of sales in 2014).
EBITDA amounted to €0.7 million, compared with €0.1 million in 2013.
In 2014, Abraservice strengthened its operations by launching new service centers in Portugal, and in Italy and
Great Britain with the coming of new managers (minority shareholders for the subsidiaries they manage).
The brand will focus on strengthening its positioning in the European market in 2015.
(€m) Q4 2014 Q4 2013 2014 2013
Sales 16.3 15.1
65.0 64.0
Change vs. 2013 8.5% 1.6%
Price effect -2.3% -3.2%
Volume effect 10.8% 4.8%
Gross margin 5.4 4.8 20.8 19.1
% of sales 33.0% 32.2% 32.1% 29.9%
EBITDA 0.1 0.3 0.7 0.1
% of sales 0.4% 2.2% 1.1% 0.1%
Operating income (0.0) 0.3 (0.1) (0.4)
% sales -0.1% 1.7% -0.1% -0.6%
>
2014 FINANCIAL REPORT MANAGEMENT REPORT – INFORMATION ON THE GROUP
26
The brand, which specializes in the sale of engineering steels, saw its sales volumes increase by 15.5% in 2014, including a 7.4% consolidation scope effect resulting from the acquisition of Finkenholl in Germany in 2013. Accordingly, the brand generated sales of €384 million, an increase of 12.1%. The gross margin rate rose by 1 percentage point from 2013 to 25% of sales. 2014 EBITDA amounted to €15.6 million, or 4.1% of sales, compared with €6.4 million in 2013. IMS group opened in 2014 a subsidiary in the Netherlands, IMS Nederland. The brand still generates over 75% of its sales in southern Europe. Its main goal is to expand its operations on Germany (the largest European market). (€m) Q4 2014 Q4 2013 2014 2013
Sales 91.8 85.5
383.8 342.3
Change vs. 2013 7.3% 12.1%
Price effect -0.2% -3.3%
Volume effect 7.5% 8.1%
Scope effect 0.0% 7.4%
Gross margin 23.7 21.5 96.1 82.3
% of sales 25.9% 25.1% 25.0% 24.0%
EBITDA 2.0 1.0 15.6 6.4
% of sales 2.2% 1.2% 4.1% 1.9%
Operating income 2.9 (0.2) 12.7 4.2
% of sales 3.2% -0.2% 3.3% 1.2%
27
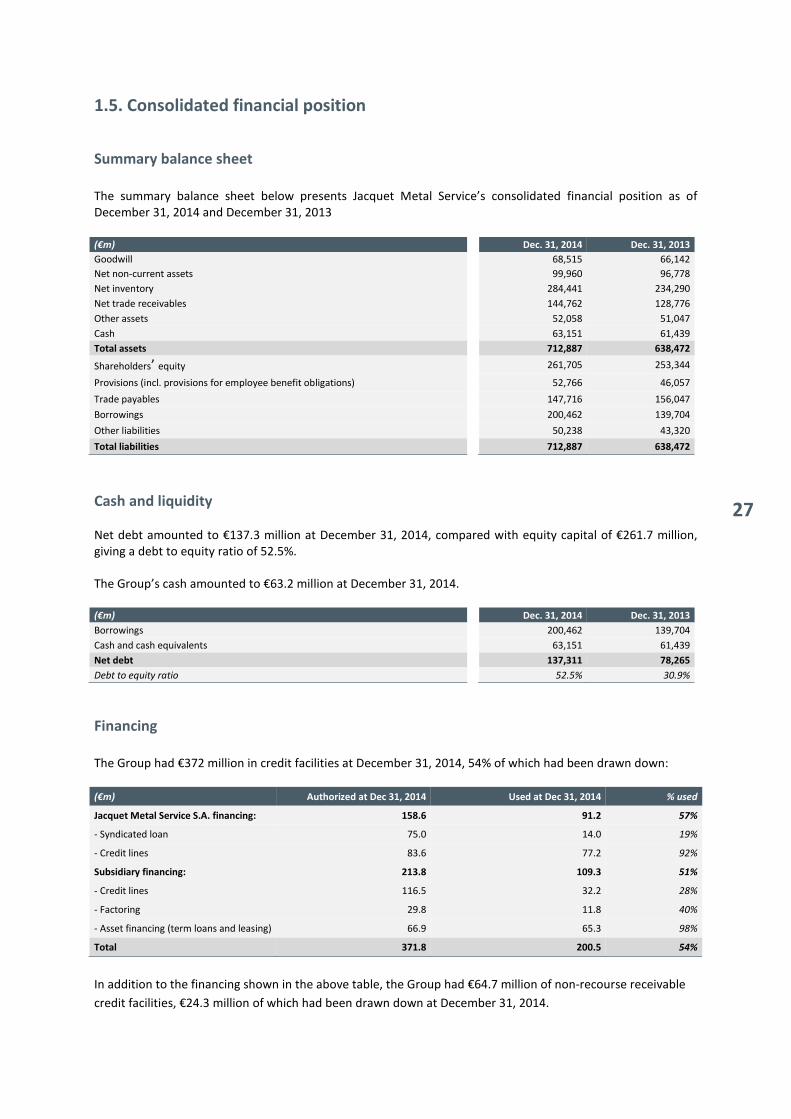
1.5. Consolidated financial position
Summary balance sheet
The summary balance sheet below presents Jacquet Metal Service’s consolidated financial position as of December 31, 2014 and December 31, 2013
(€m) Dec. 31, 2014 Dec. 31, 2013
Goodwill 68,515 66,142
Net non-current assets 99,960 96,778
Net inventory 284,441 234,290
Net trade receivables 144,762 128,776
Other assets 52,058 51,047
Cash 63,151 61,439
Total assets 712,887 638,472
Shareholders’ equity 261,705 253,344
Provisions (incl. provisions for employee benefit obligations) 52,766 46,057
Trade payables 147,716 156,047
Borrowings 200,462 139,704
Other liabilities 50,238 43,320
Total liabilities 712,887 638,472
Cash and liquidity Net debt amounted to €137.3 million at December 31, 2014, compared with equity capital of €261.7 million, giving a debt to equity ratio of 52.5%. The Group’s cash amounted to €63.2 million at December 31, 2014. (€m) Dec. 31, 2014 Dec. 31, 2013
Borrowings 200,462 139,704
Cash and cash equivalents 63,151 61,439
Net debt 137,311 78,265
Debt to equity ratio 52.5% 30.9%
Financing
The Group had €372 million in credit facilities at December 31, 2014, 54% of which had been drawn down:
(€m) Authorized at Dec 31, 2014 Used at Dec 31, 2014 % used
Jacquet Metal Service S.A. financing: 158.6 91.2 57%
- Syndicated loan 75.0 14.0 19%
- Credit lines 83.6 77.2 92%
Subsidiary financing: 213.8 109.3 51%
- Credit lines 116.5 32.2 28%
- Factoring 29.8 11.8 40%
- Asset financing (term loans and leasing) 66.9 65.3 98%
Total 371.8 200.5 54%
In addition to the financing shown in the above table, the Group had €64.7 million of non-recourse receivable
credit facilities, €24.3 million of which had been drawn down at December 31, 2014.
>
2014 FINANCIAL REPORT MANAGEMENT REPORT – INFORMATION ON THE GROUP
28
The key terms of the Jacquet Metal Service S.A. syndicated loan are as follows:
- Amount: €75 million - Form: revolving credit - Term: 3 years until July 2016 - Guarantee: none
€14 million of the syndicated loan had been drawn down at December 31, 2014.
The main covenants attached to financing arrangements (primarily the syndicated loan) correspond to
commitments that must be complied with at Group level:
� At December 31, 2014: net debt less than €200 million or leverage less than 2.0;
� Net debt of less than €225 million, or leverage of less than 2.0, at June 30, 2015, December 31, 2015
and June 30, 2016;
� Annual capital expenditure of less than €19 million;
� Debt to equity ratio less than 1;
� JSA must hold at least 40% of Jacquet Metal Service S.A.'s share capital and voting rights.
The Group was in compliance with all of its syndicated loan covenants at December 31, 2014:
� Net debt: €137.3 million and leverage: 2.36
� Capital expenditure: €14.2 million
� Debt to equity ratio: 52.5%
� JSA held 40.32% of the share capital and 48.96% of the voting rights in Jacquet Metal Service S.A.
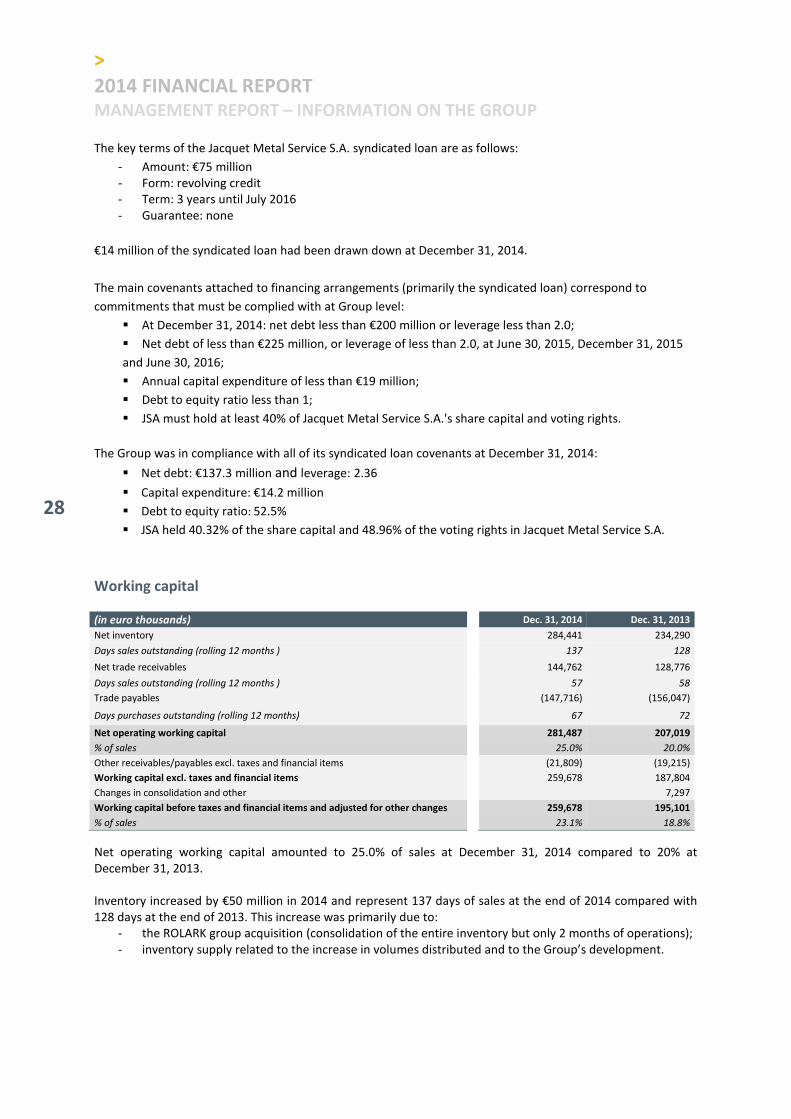
Working capital (in euro thousands) Dec. 31, 2014 Dec. 31, 2013
Net inventory 284,441 234,290
Days sales outstanding (rolling 12 months ) 137 128
Net trade receivables 144,762 128,776
Days sales outstanding (rolling 12 months ) 57 58
Trade payables (147,716) (156,047)
Days purchases outstanding (rolling 12 months) 67 72
Net operating working capital 281,487 207,019
% of sales 25.0% 20.0%
Other receivables/payables excl. taxes and financial items (21,809) (19,215)
Working capital excl. taxes and financial items 259,678 187,804
Changes in consolidation and other 7,297
Working capital before taxes and financial items and adjusted for other changes 259,678 195,101
% of sales 23.1% 18.8%
Net operating working capital amounted to 25.0% of sales at December 31, 2014 compared to 20% at December 31, 2013. Inventory increased by €50 million in 2014 and represent 137 days of sales at the end of 2014 compared with 128 days at the end of 2013. This increase was primarily due to:
- the ROLARK group acquisition (consolidation of the entire inventory but only 2 months of operations); - inventory supply related to the increase in volumes distributed and to the Group’s development.

29
Trade receivables amounted to €144.8 million at December 31, 2014, an increase of €16 million compared with 2013. This trend is linked to the increase in sales. The average trade receivable collection period was unchanged at 57 days’ sales. Trade payables decreased by €8.3 million to €147.7 million at December 31, 2014, down from €156 million for the previous year. The average trade payable settlement timeframe was 67 days, a decrease of 5 days compared with the end of 2013, which was primarily due to the increase in supplies from outside Europe.
Cash flow (in euro thousands) 2014 2013
Operating cash flow before change in WCR 52,688 25,097
Change in working capital (64,577) (4,296)
Cash flow from operating activities (11,889) 20,801
Capital expenditure (14,249) (14,845)
Asset disposals 533 819
Impact of acquisitions (9,212) (14,208)
Dividends paid to shareholders of Jacquet Metal Service S.A. (13,978) (13,947)
Interest paid (6,865) (5,563)
Other movements (3,386) (596)
Change in net debt (59,046) (27,539)
Net debt brought forward 78,265 50,726
Net debt carried forward 137,311 78,265
The Group’s net debt amounted to €137.3 million. The Group’s Operating cash flow before change in WCR amounted to €52.7 million in 2014, compared with €25.1 million in the previous year. Group capital expenditure amounted to €14.2 million in 2014, which primarily corresponded to new finishing and cutting capacity and the acquisition of ROLARK Group resulted in a €9.2 million increase in debt at December 31, 2014.
Development Brand development consists mainly in opening new service centers in order to cover new geographical regions. The average investment for a warehouse is around €3 million, two-thirds of which corresponds to inventories. Given the nature of its business, i.e. the distribution of specialty steels, capital expenditure primarily involves buildings and finishing capacity (cutting and folding machines, etc.). This development model requires relatively little capital outlay and is implemented at a rate adapted to the economic conditions encountered. It is also low-risk, since inventories and machineries can be rapidly used by other brand warehouses in the event that a service center has a low return on investment. Given the nature of its business, Jacquet Metal Service Group is not required to invest in research and development.
Subsequent events None.
>
2014 FINANCIAL REPORT MANAGEMENT REPORT – INFORMATION ON THE GROUP
30
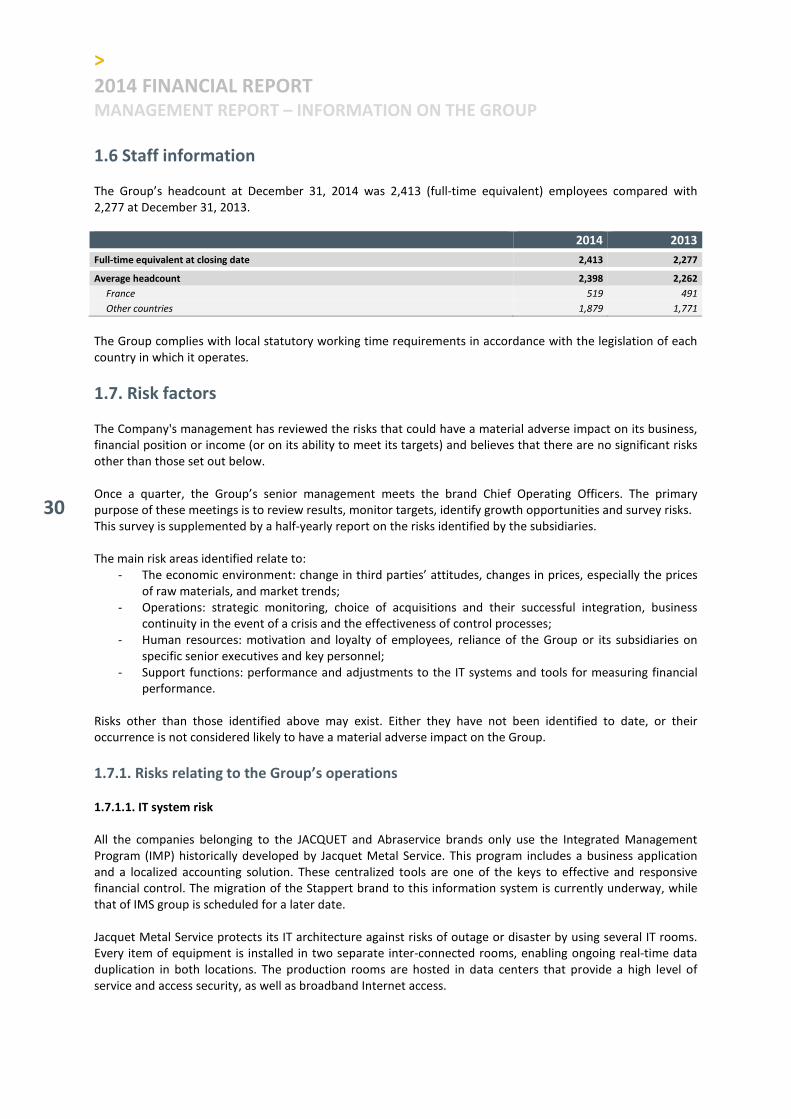
1.6 Staff information The Group’s headcount at December 31, 2014 was 2,413 (full-time equivalent) employees compared with 2,277 at December 31, 2013.
2014 2013
Full-time equivalent at closing date 2,413 2,277
Average headcount 2,398 2,262
France 519 491
Other countries 1,879 1,771
The Group complies with local statutory working time requirements in accordance with the legislation of each country in which it operates.
1.7. Risk factors The Company's management has reviewed the risks that could have a material adverse impact on its business, financial position or income (or on its ability to meet its targets) and believes that there are no significant risks other than those set out below. Once a quarter, the Group’s senior management meets the brand Chief Operating Officers. The primary purpose of these meetings is to review results, monitor targets, identify growth opportunities and survey risks. This survey is supplemented by a half-yearly report on the risks identified by the subsidiaries. The main risk areas identified relate to:
- The economic environment: change in third parties’ attitudes, changes in prices, especially the prices of raw materials, and market trends;
- Operations: strategic monitoring, choice of acquisitions and their successful integration, business continuity in the event of a crisis and the effectiveness of control processes;
- Human resources: motivation and loyalty of employees, reliance of the Group or its subsidiaries on specific senior executives and key personnel;
- Support functions: performance and adjustments to the IT systems and tools for measuring financial performance.
Risks other than those identified above may exist. Either they have not been identified to date, or their occurrence is not considered likely to have a material adverse impact on the Group.
1.7.1. Risks relating to the Group’s operations 1.7.1.1. IT system risk
All the companies belonging to the JACQUET and Abraservice brands only use the Integrated Management Program (IMP) historically developed by Jacquet Metal Service. This program includes a business application and a localized accounting solution. These centralized tools are one of the keys to effective and responsive financial control. The migration of the Stappert brand to this information system is currently underway, while that of IMS group is scheduled for a later date. Jacquet Metal Service protects its IT architecture against risks of outage or disaster by using several IT rooms. Every item of equipment is installed in two separate inter-connected rooms, enabling ongoing real-time data duplication in both locations. The production rooms are hosted in data centers that provide a high level of service and access security, as well as broadband Internet access.

31
1.7.1.2. Procurement risk
The nature of Jacquet Metal Service’s business guarantees the Company’s independence in terms of any specific supply contract. This strategy is reflected in a diversified procurement policy and a stringent supplier selection process specifically aimed at avoiding dependence on one or more suppliers. 1.7.1.3. Distribution risk
Jacquet Metal Service primarily distributes its products via intermediaries and second-tier distributors, which makes it impossible to monitor the final destination of the products. 1.7.1.4. Risk of industrial accidents
The Group considers that it complies with applicable safety rules and statutory provisions in each country. However, the measures adopted do not provide complete assurance that no industrial accident will occur.
1.7.2. Market risk 1.7.2.1. Country risk
The Group generates over 90% of its sales in Europe and primarily operates in countries that are members of the European Union or are considered to be politically stable. The country risk is therefore considered to be low. 1.7.2.2. Purchase price elasticity risk Purchase prices of stainless steels (JACQUET and Stappert) usually consist of two separate components:
- the base price, which is the outcome of negotiations at the time when the order is placed with each producer; and
- a more variable portion, which depends on the trend in raw material prices. This includes, for example, the scrap surcharge for engineering steels or the alloy surcharge for stainless steels. The alloy surcharge is usually determined at the time of delivery, in accordance with a calculation formula specific to each producer, which factors in the cost of nickel, chromium, titanium, molybdenum and scrap metal, the euro-US dollar exchange rate, etc.
Furthermore, delivery lead times are a major parameter for determining prices. In fact, they are usually not adhered to, and generally range between 1 and 12 months. Given the fluctuations in raw material prices that affect the value chain, purchase prices may be subject to adjustment clauses depending on compliance with delivery lead times. Some agreements may also provide for the final price to be adjusted depending on the actual delivery date, rather than on the theoretical date, while the base price may be revised retroactively by the producer, etc. Lastly, annual price reductions may be provided for in accordance with the volumes purchased and the producer’s overall performance. The Group's gross margin as a percentage of sales varies in accordance with the following factors:
- Changes in the business mix (relative contributions of brands to sales, in view of differences between individual brand margin rates);
- The price levels in absolute value terms; - The impact of price changes on inventory rundown.
Accordingly, Group policy and industry practice tend to pass on any purchase price increases that occur directly to customers, with immediate effect if possible. Conversely, if prices decrease, the Group’s competitive positioning requires it to pass on these price decreases within variable timeframes. The option whether to pass on price increases and decreases results in an inventory price effect and a gross margin effect.

>
2014 FINANCIAL REPORT MANAGEMENT REPORT – INFORMATION ON THE GROUP
32
Changes in base steel prices and in the prices of certain metals used in alloys (nickel, molybdenum, chromium etc.) also impact the gross margin as a percentage of revenues. 1.7.2.3. Risk of changes in metal prices
The Group does not use any financial instruments to hedge fluctuations in the price of the raw materials used as components in the steels that it markets. In the case of some of the metals used (especially molybdenum and chromium), this is due to the lack of a market allowing such a hedging process. In the case of nickel, the lack of hedging is a management decision, as the Group currently considers that such a policy would not necessarily be effective and could even be financially counter-productive, as the related costs may be higher than the profits likely to result. The advisability of implementing such a hedging policy is the subject of periodic reviews. To date, the policy has been to remain exposed to fluctuations in metal prices. The Group is not able to provide relevant and reliable quantified information regarding the elasticity and sensitivity of prices and margins, due to the large number of factors taken into account when setting raw material purchase prices and sale prices.
1.7.2.4. Currency risk
The subsidiaries' raw material purchases are mainly carried out in euros, given the Group’s geographical locations. Accordingly, the Group’s exposure to currency risk primarily concerns purchases in euros made by subsidiaries based outside the euro zone, while other cash flows are expressed in the functional currency of each subsidiary. Jacquet Metal Service S.A. is exposed to currency risk when it grants cash advances in local currencies to subsidiaries outside the euro zone. An assessment of currency risk is set out in Section 4.16.3 of the Notes to the 2014 consolidated financial statements. 1.7.2.5. Interest rate risk
Cash investments primarily consist of term deposits, where the interest-rate risk is limited. Exposure to interest-rate risk primarily relates to the floating-rate debt, which is partly hedged via hedging instruments. An assessment of these risks is set out in Section 4.16.3 of the Notes to the 2014 consolidated financial statements. 1.7.2.6. Liquidity risk
Some loans are subject to compliance with covenants. As explained in Section 5.4 of the Notes to the 2014 consolidated financial statements, such clauses were not applicable at December 31, 2014. The Group has carried out a specific review of its liquidity risk and considers that it is able to meet its future liabilities as they fall due. An assessment of liquidity risk is set out in Section 4.16.3 of the Notes to the 2014 consolidated financial statements. 1.7.2.7. Credit and counterparty risk
The Group's exposure to credit and counterparty risk primarily relates to uninsured trade receivables. The Group is not in a position of commercial dependence on its customers. Moreover, the Group is not dependent on a specific supplier and only uses sub-contractors on an occasional basis. An assessment of these risks is set out in Section 4.16.3 of the Notes to the 2014 consolidated financial statements.

33
1.7.2.8. Equity risk
Jacquet Metal Service S.A. does not hold a share portfolio, except for its treasury shares. The Group held 364,886 treasury shares at December 31, 2014, which represented 1.52% of the share capital and a net value of €5.1 million. A 10% fall in the Jacquet Metal Service share price would result in a €0.5 million decrease in Jacquet Metal Service S.A.’s net financial income. However, any change in Jacquet Metal Service’s share price would have no impact on the Group’s consolidated net income and consolidated shareholders’ equity, as the treasury shares are eliminated from the consolidated shareholders’ equity and any potential impact on net income is neutralized.
1.7.3. Legal risk There are no pending or imminent government, judicial or arbitration proceedings, including any proceedings of which the Company is aware, likely to have a material impact on the Company’s and/or Group's financial position or profitability. Neither have any such proceedings had such an impact over the past 12 months.
1.7.4. Patents The Company does not depend on patents to carry out its business activities.
1.7.5. Sub-contracting There is no dependence on sub-contractors.
1.7.6. Insurance and risk coverage In the case of operational risks, each Jacquet Metal Service Group subsidiary has a risk coverage suited to its operations, through insurance policies taken out locally or by the Group and covering all potential risks, such as:
- Property damage and consequential operating losses; - The liability of corporate officers and directors; - General third-party liability: the Group has taken out a master policy with AIG covering the
consequences of the Company’s and its subsidiaries’ liability for damage caused to third parties up to an amount of €25 million per claim for all types of damage combined, subject to the specific limits per type of risk provided for in the policy.
The Company believes that its insurance cover complies with French and European professional third-party liability insurance standards and is sufficiently broad to cover the standard risks inherent to its operations. However, it cannot guarantee that these policies will cover all the claims that the Group may face. No material potential risk where the consequences were not already included in the 2014 financial statements had been identified at December 31, 2014.
>
2014 FINANCIAL REPORT MANAGEMENT REPORT – INFORMATION ON THE GROUP
34
1.7.7. Environmental risk Given that its operations involve distribution and processing prior to delivery, Jacquet Metal Service does not incur any material environmental risk. In fact, Jacquet Metal Service does not use any particularly hazardous substances and its operations do not have a material impact on the environment. However, further tightening of environmental and safety requirements cannot be ruled out in the future. Furthermore, some of the facilities used by the Group companies have a long industrial history. Accordingly, the Group could be held liable for any pollution, including legacy pollution, identified at facilities currently or previously used by the Group. To date, Jacquet Metal Service has not been informed of any environmental constraints likely to affect the Group’s use of its property, plant and equipment.
35
2. MANAGEMENT REPORT - INFORMATION ON THE JACQUET
METAL SERVICE S.A. PARENT COMPANY Jacquet Metal Service S.A., hereinafter the “Company”, holds equity interests in the Group subsidiaries on a direct or indirect basis. Its main functions are as follows:
- Defining the Group’s strategy and coordinating its development; - Developing and maintaining the information systems; - Controlling, coordinating and negotiating purchasing terms and conditions; - Financial audits, financing management, financial communications and investor relations; - Corporate communications.
The Jacquet Metal Service S.A. financial statements for the year ended December 31, 2014 were prepared in accordance with French statutory requirements and in accordance with the same accounting principles and policies as those applied in the preparation of the previous year's financial statements, except where pension obligations are concerned: Pursuant to the initial application of ANC Recommendation 2013 R02 dated November 7, 2013, Jacquet Metal Service SA has chosen to record for all pensions plans, all aggregate actuarial differences and costs of past unamortized services directly under “retained earnings” as from the beginning of the financial year for all of its pension schemes. The impact is an k€866 increase in provisions, which is offset by a decrease in shareholders’ equity.
2.1. 2014 financial position and earnings
2.1.1. Income statement
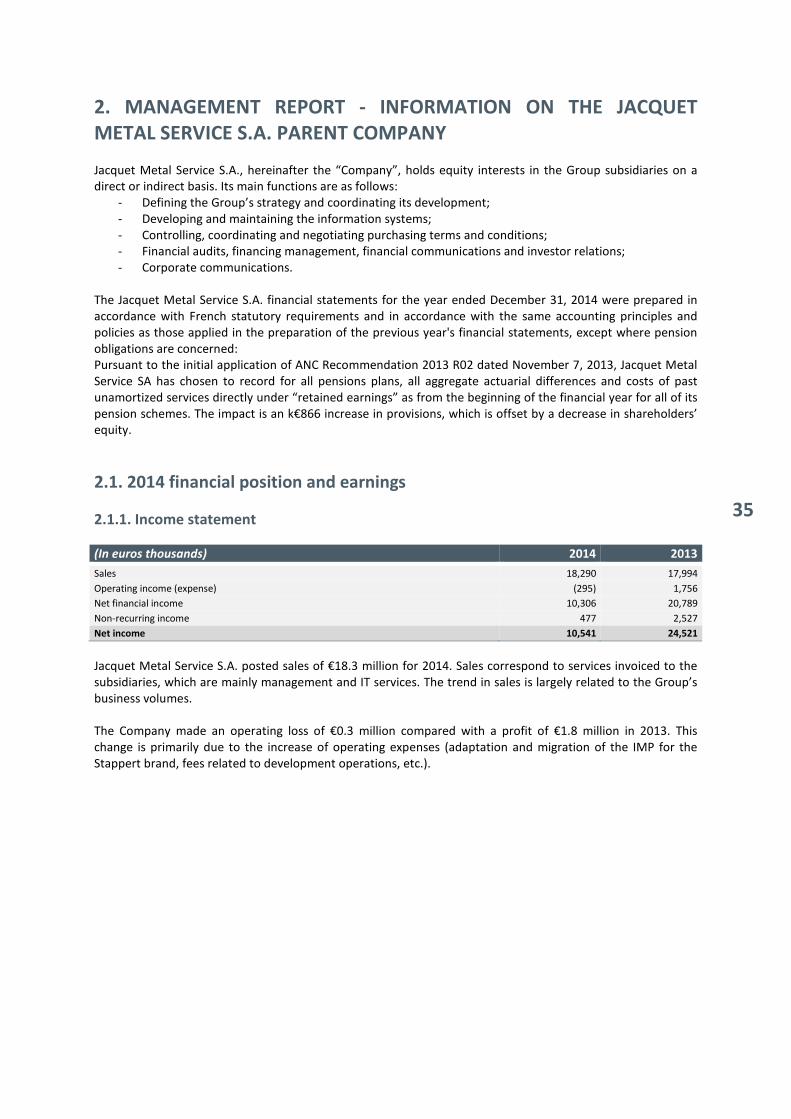
(In euros thousands) 2014 2013
Sales 18,290 17,994
Operating income (expense) (295) 1,756
Net financial income 10,306 20,789
Non-recurring income 477 2,527
Net income 10,541 24,521
Jacquet Metal Service S.A. posted sales of €18.3 million for 2014. Sales correspond to services invoiced to the subsidiaries, which are mainly management and IT services. The trend in sales is largely related to the Group’s business volumes. The Company made an operating loss of €0.3 million compared with a profit of €1.8 million in 2013. This change is primarily due to the increase of operating expenses (adaptation and migration of the IMP for the Stappert brand, fees related to development operations, etc.).

>
2014 FINANCIAL REPORT MANAGEMENT REPORT – INFORMATION ON THE PARENT COMPANY
JACQUET METAL SERVICE S.A.
36
Financial income amounted to €10.3 million, broken down as follows:
(In euros thousands) 2014 2013
Dividends from subsidiaries 7,438 15,889
Income from investments 982 876
Provision reversals (2) 402 1,261
Other 2,989 3,723
Financial income 11,811 21,749
Interest and related expenses (1) (1,424) (814)
Provision charges (2) - (37)
Other (81) (109)
Financial expenses (1,505) (961)
Net financial income 10,306 20,789 (1)
Including interest on interest-rate swaps
(2) See analysis of financial assets in paragraph 2.1.2.
Non-recurring income (+€477 thousands) primarily consisted of gains on the disposal of treasury shares as part of the liquidity contract and the reversal of accelerated amortization and depreciation.
2.1.2. Statement of financial position
(In euros thousands) Dec. 31, 2014 Dec. 31, 2013
Financial assets 207,705 204,397
Intangible assets and PP&E 2,431 2,143
Cash and cash equivalents 25,243 23,234
Other assets 115,643 80,685
Total assets 351,023 310,459
Shareholders’ equity 211,862 216,351
Debt 117,033 75,670
Other liabilities 22,128 18,438
Total equity and liabilities 351,023 310,459
Financial assets
Financial assets amounted to €207.7 million at December 31, 2014, broken down as follows:
(In euros thousands) Dec. 31, 2014 Dec. 31, 2013
Equity investments 157,817 161,114
Receivables on equity investments 44,394 38,447
Other long-term financial assets 5,494 4,836
Total net financial assets 207,705 204,397
Other financial assets primarily consist of treasury shares (€5.1 million). Jacquet Metal Service S.A. did not dispose of or purchase any treasury shares during 2014, excluding transactions relating to the liquidity contract. The annual change corresponds to transactions relating to the liquidity contract.

37
Net cash position
(In euros thousands) Dec. 31, 2014 Dec. 31, 2013
Cash and cash equivalents 25,243 23,234
Bank overdrafts (17,766) (10,605)
Net cash and cash equivalents 7,477 12,629
Borrowings
Jacquet Metal Service has set up in 2014 €42 million in loans. As of December 31, 2014, indebtedness is €117 million, broken down as follows:
- €91.5 million in loans and other borrowings from banks, including €14 million under the syndicated loan and €17.8 million in bank overdrafts;
- €25.6 million borrowed from the cash pool; - other financial liabilities amounting to €0.3 million.
Other assets and liabilities
Other assets amount to €115.6 million at December 31, 2014 and mainly consist of cash pooling accounts. Other liabilities amount to €22.1 million at December 31, 2014, including €17.1 million in operating liabilities and €5 million in provisions for employee benefit obligations valued by external actuaries. At the close of the 2014 financial year, due dates of trade receivables and payables may be broken down as follows: (In euros
thousands)
Balance sheet item Bal.
sheet total
O/w closing
entries (1)
Balance of receivables
and
payables
Un-
matured
Matured
Due date < 30 days
Due date
between 30
and 60 days
Due date
between 60
and 90 days
Due date > 90 days
Dec. 31, 2014 Trade receivables 11,663 105 11,558 7,099 238 (7) 40 4,188
Trade payables 7,409 2,339 5,070 4,622 1 198 56 193
Dec. 31, 2013 Trade receivables 9,912 9,912 6,928 168 9 434 2,374
Trade payables 6,173 1,728 4,444 4,040 251 31 8 115 (1)
Invoices to be issued and accrued expenses
Maturities higher than 90 days mainly correspond to receivables and debts contracted with subsidiaries.
2.2. Changes in equity investments The changes in equity investments mainly result from intra-Group re-assignment transactions.
>
2014 FINANCIAL REPORT MANAGEMENT REPORT – INFORMATION ON THE PARENT COMPANY
JACQUET METAL SERVICE S.A.
38
2.3. Share capital The share capital at December 31, 2014 was unchanged compared with the previous financial year. It consists of 24,028,438 shares with a total value of €36,631,126.16.
2.4. Progress and outlook The Company will continue to drive Group strategy and manage its direct and indirect equity investments in its various subsidiaries. The Group's progress and outlook are set out in paragraph 1.2 of the section "Management Report – Information on the Group".
2.5. Share buyback program and treasury stock (disclosures in compliance
with Article L. 225-211, para 2 of the French Commercial Code) In its 22nd resolution, the June 26, 2014 General Meeting authorized the Board of Directors to buy back the Company's shares in order to:
- Encourage transaction liquidity and regular listing of the Company's shares or avoid any share price discrepancies not justified by market trends, via a liquidity contract entered into with an investment service provider on an independent basis, under the conditions and in accordance with the procedures determined by regulations and recognized market practices, and in compliance with a code of conduct recognized by the French Financial Markets Authority;
- Award shares to officers or employees of the Company and/or the companies in its Group under the terms and conditions determined by the applicable legal and regulatory provisions in relation to (i) sharing the benefits of the Company's growth, (ii) the stock option scheme provided for by Articles L. 225-179 et seq. of the French Commercial Code, (iii) the bonus share scheme provided for by Articles L. 225-197-1 et seq. of the French Commercial Code, and (iv) a company savings plan, as well as to perform any hedging transactions relating to these operations, under the conditions determined by the market regulatory authorities and at such times as the Board of Directors or the person acting on its authority so decides;
- Deliver shares upon the exercise of rights attached to securities granting immediate or subsequent entitlement to the award of Company shares, via redemption, conversion, exchange, presentation of a warrant or any other means, as well as to perform any hedging transactions relating to the issuance of such securities, under the conditions established by the market regulatory authorities and at such times as the Board of Directors or the person acting on its authority so decides;
- Hold the shares and tender them at a later date in payment or exchange as part of potential acquisitions, mergers, demergers or contributions, in compliance with market practices approved by the French Financial Markets Authority;
- Cancel all or some of the shares by means of a capital reduction (primarily with a view to optimizing cash management, return on equity or earnings per share).
The terms and conditions of the share buyback program are as follows:
- The maximum price at which the Company may buy back its own shares is set at €50 per share, on the understanding that this price will be adjusted accordingly in the event of transactions affecting the share capital, in particular via capitalization of reserves, the award of bonus shares and/or stock splits or reverse stock splits;
- The maximum number of shares that may be bought back is set at 10% of the total number of shares comprising the share capital (this percentage shall apply at all times to the share capital as adjusted in accordance with transactions affecting it following the General Meeting of June 26, 2014), with a maximum value of €120,142,190, subject to statutory restrictions. The number of shares purchased by the Company during the term of the share buyback program may not exceed 10% of the shares comprising the Company's share capital (this percentage shall apply at all times to the share capital as adjusted in accordance with transactions affecting it following the General Meeting of June 26, 2014),
39
subject to compliance with the provisions of Article 5 paragraphs 2 and 3 of European Regulation No. 2273/2003/EC, on the understanding that (i) in the case of shares purchased under a liquidity contract, the number of shares taken into consideration for the calculation of the aforementioned cap of 10% of the share capital shall be equal to the number of shares purchased less the number of shares resold during the term of this authorization, and (ii) the number of shares purchased in order to be subsequently tendered as part of a merger, demerger or contribution may not exceed 5% of the Company's share capital at the time of purchase;
- The term of the authorization was set at eighteen months as from June 26, 2014. As of December 31, 2014, the Group held 364,886 treasury shares representing 1.52% of the share capital and having a net value of €5.1 million.
- 300,886 treasury shares were allocated as of December 31, 2014 with the purpose of being exchanged or used as payment in connection with potential acquisitions planned by the share buyback program authorized by the General Meeting of June 26, 2014 and were recognized under "Financial assets" at a net book value of €4.1 million;
- 64,000 treasury shares were held as part of the liquidity contract and were recognized under “Financial investments” at a net book value of €1 million.
The Company did not grant any stock options during the year.
2.6. Bonus share allocation (disclosures in compliance with Article L. 225-197-
4 of the French Commercial Code) The 33rd resolution of the June 26, 2014 combined ordinary and extraordinary General Meeting authorized the Board of Directors to allocate existing or future bonus shares to beneficiaries to be chosen from among the salaried employees and corporate executive officers of the Company or related entities within the meaning of Article L 225-197-2 of the French Commercial Code, subject to a cap of 3% of the Company's share capital as of the date of the Board's decision to allocate the bonus shares. The Board has not made use of this authorization to date.
2.7. Valuation of the bonus share allocation plan None.
2.8. Liquidity contract Jacquet Metal Service S.A. entrusted the implementation of a liquidity contract compliant with the AMAFI Code of Conduct to Oddo Corporate Finance on March 17, 2008. This contract, which initially expired on December 31, 2008, is renewed on an annual basis. An initial amount of €2,600,000 was made available to the liquidity provider in order to implement this contract. As of December 31, 2014, the liquidity contract covered an amount of €0.9 million in cash and 64,000 Jacquet Metal Service S.A. shares with a market value of €1 million.
2.9. Identity of shareholders exceeding the statutory thresholds
The Extraordinary General Meeting of June 30, 2010 granted double voting rights on registered shares held for more than two years. 4,860,927 Jacquet Metal Service shares enjoyed double voting rights at December 31, 2014.
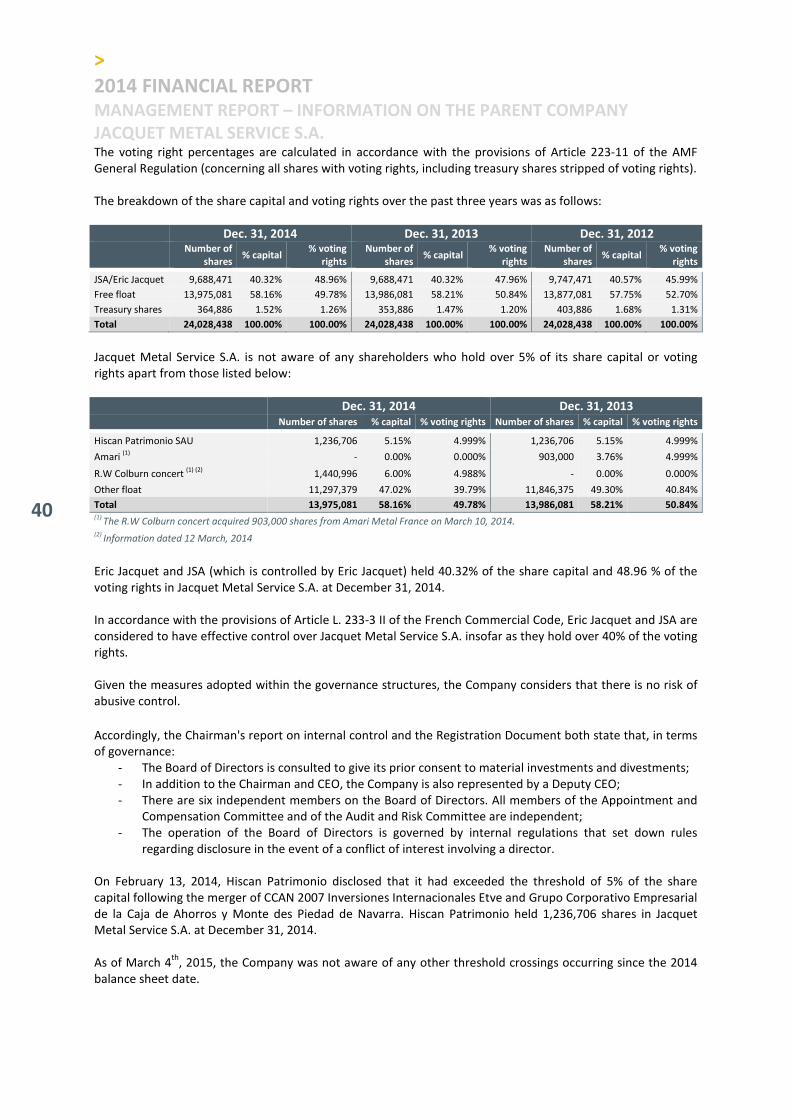
>
2014 FINANCIAL REPORT MANAGEMENT REPORT – INFORMATION ON THE PARENT COMPANY
JACQUET METAL SERVICE S.A.
40
The voting right percentages are calculated in accordance with the provisions of Article 223-11 of the AMF General Regulation (concerning all shares with voting rights, including treasury shares stripped of voting rights). The breakdown of the share capital and voting rights over the past three years was as follows:
Dec. 31, 2014 Dec. 31, 2013 Dec. 31, 2012
Number of
shares % capital
% voting
rights
Number of
shares % capital
% voting
rights
Number of
shares % capital
% voting
rights
JSA/Eric Jacquet 9,688,471 40.32% 48.96% 9,688,471 40.32% 47.96% 9,747,471 40.57% 45.99%
Free float 13,975,081 58.16% 49.78% 13,986,081 58.21% 50.84% 13,877,081 57.75% 52.70%
Treasury shares 364,886 1.52% 1.26% 353,886 1.47% 1.20% 403,886 1.68% 1.31%
Total 24,028,438 100.00% 100.00% 24,028,438 100.00% 100.00% 24,028,438 100.00% 100.00%
Jacquet Metal Service S.A. is not aware of any shareholders who hold over 5% of its share capital or voting rights apart from those listed below: Dec. 31, 2014 Dec. 31, 2013
Number of shares % capital % voting rights Number of shares % capital % voting rights
Hiscan Patrimonio SAU 1,236,706 5.15% 4.999% 1,236,706 5.15% 4.999%
Amari (1) - 0.00% 0.000% 903,000 3.76% 4.999%
R.W Colburn concert (1) (2) 1,440,996 6.00% 4.988% - 0.00% 0.000%
Other float 11,297,379 47.02% 39.79% 11,846,375 49.30% 40.84%
Total 13,975,081 58.16% 49.78% 13,986,081 58.21% 50.84% (1)
The R.W Colburn concert acquired 903,000 shares from Amari Metal France on March 10, 2014.
(2) Information dated 12 March, 2014
Eric Jacquet and JSA (which is controlled by Eric Jacquet) held 40.32% of the share capital and 48.96 % of the voting rights in Jacquet Metal Service S.A. at December 31, 2014. In accordance with the provisions of Article L. 233-3 II of the French Commercial Code, Eric Jacquet and JSA are considered to have effective control over Jacquet Metal Service S.A. insofar as they hold over 40% of the voting rights. Given the measures adopted within the governance structures, the Company considers that there is no risk of abusive control.
Accordingly, the Chairman's report on internal control and the Registration Document both state that, in terms of governance:
- The Board of Directors is consulted to give its prior consent to material investments and divestments; - In addition to the Chairman and CEO, the Company is also represented by a Deputy CEO; - There are six independent members on the Board of Directors. All members of the Appointment and
Compensation Committee and of the Audit and Risk Committee are independent; - The operation of the Board of Directors is governed by internal regulations that set down rules
regarding disclosure in the event of a conflict of interest involving a director. On February 13, 2014, Hiscan Patrimonio disclosed that it had exceeded the threshold of 5% of the share capital following the merger of CCAN 2007 Inversiones Internacionales Etve and Grupo Corporativo Empresarial de la Caja de Ahorros y Monte des Piedad de Navarra. Hiscan Patrimonio held 1,236,706 shares in Jacquet Metal Service S.A. at December 31, 2014. As of March 4
th, 2015, the Company was not aware of any other threshold crossings occurring since the 2014
balance sheet date.
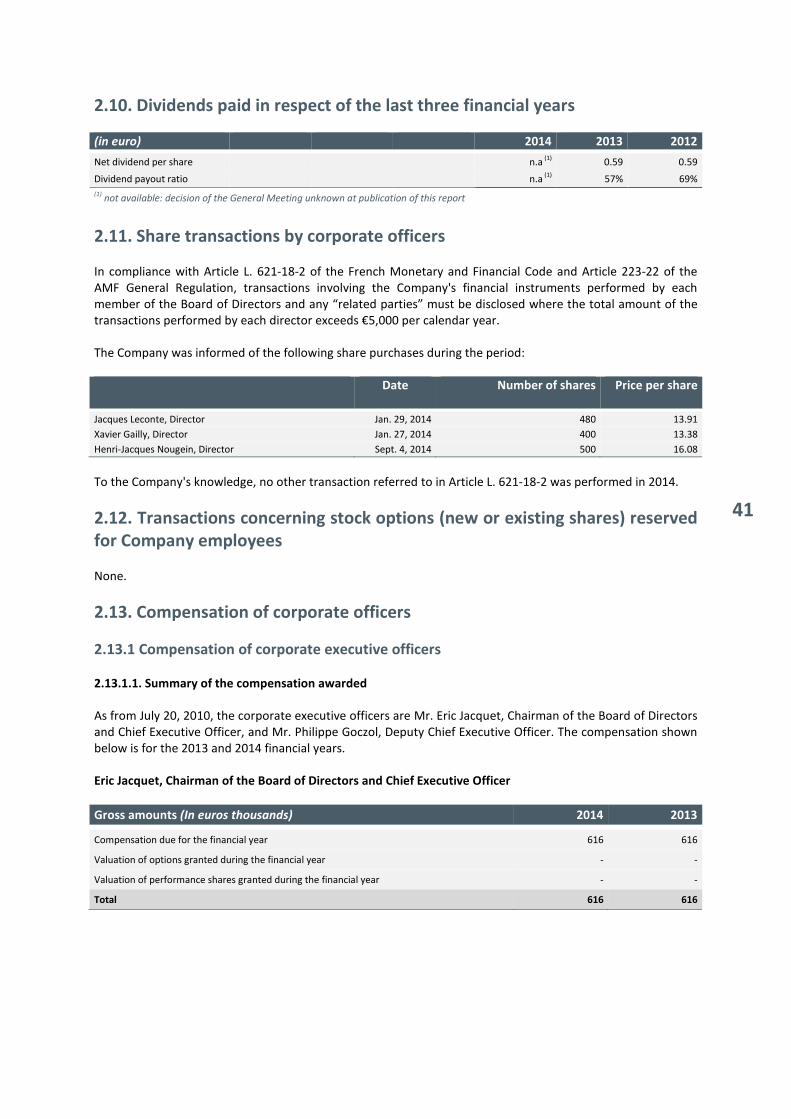
41
2.10. Dividends paid in respect of the last three financial years
(in euro) 2014 2013 2012
Net dividend per share n.a (1) 0.59 0.59
Dividend payout ratio n.a (1) 57% 69%
(1) not available: decision of the General Meeting unknown at publication of this report
2.11. Share transactions by corporate officers In compliance with Article L. 621-18-2 of the French Monetary and Financial Code and Article 223-22 of the AMF General Regulation, transactions involving the Company's financial instruments performed by each member of the Board of Directors and any “related parties” must be disclosed where the total amount of the transactions performed by each director exceeds €5,000 per calendar year. The Company was informed of the following share purchases during the period:
Date Number of shares Price per share
Jacques Leconte, Director Jan. 29, 2014 480 13.91
Xavier Gailly, Director Jan. 27, 2014 400 13.38
Henri-Jacques Nougein, Director Sept. 4, 2014 500 16.08
To the Company's knowledge, no other transaction referred to in Article L. 621-18-2 was performed in 2014.
2.12. Transactions concerning stock options (new or existing shares) reserved
for Company employees None.
2.13. Compensation of corporate officers
2.13.1 Compensation of corporate executive officers 2.13.1.1. Summary of the compensation awarded
As from July 20, 2010, the corporate executive officers are Mr. Eric Jacquet, Chairman of the Board of Directors and Chief Executive Officer, and Mr. Philippe Goczol, Deputy Chief Executive Officer. The compensation shown below is for the 2013 and 2014 financial years. Eric Jacquet, Chairman of the Board of Directors and Chief Executive Officer
Gross amounts (In euros thousands) 2014 2013
Compensation due for the financial year 616 616
Valuation of options granted during the financial year - -
Valuation of performance shares granted during the financial year - -
Total 616 616
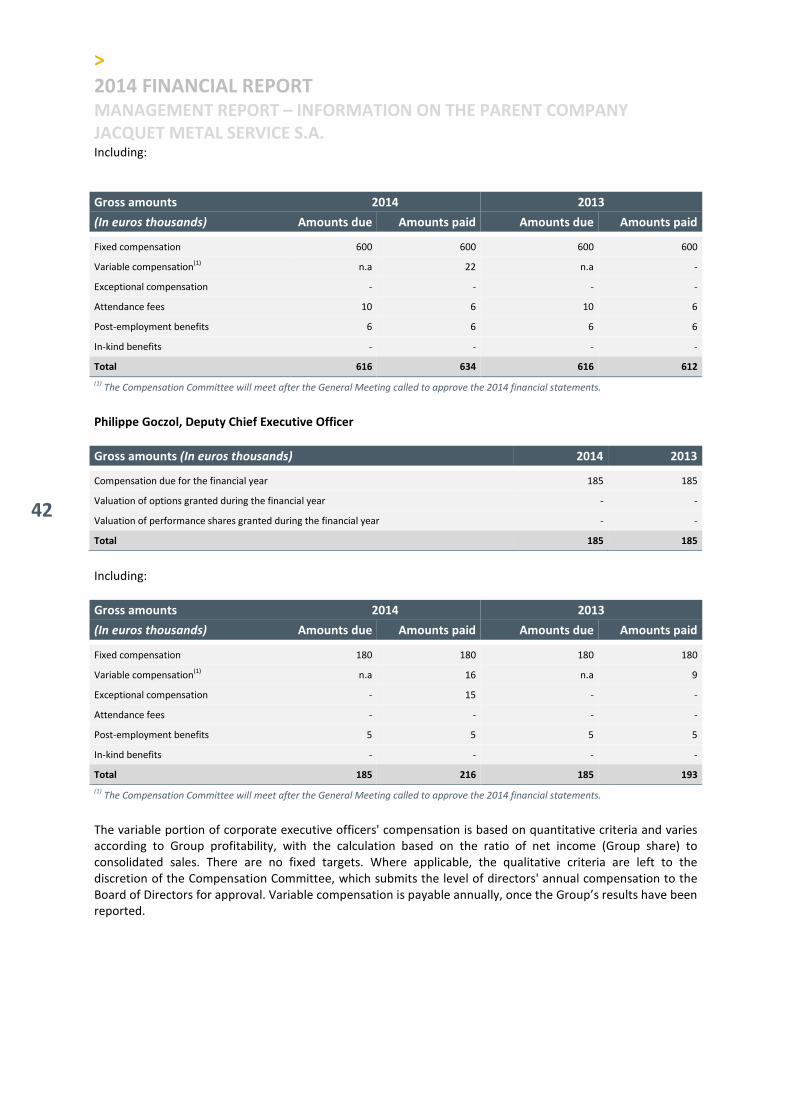
>
2014 FINANCIAL REPORT MANAGEMENT REPORT – INFORMATION ON THE PARENT COMPANY
JACQUET METAL SERVICE S.A.
42
Including:
Gross amounts 2014 2013
(In euros thousands) Amounts due Amounts paid Amounts due Amounts paid
Fixed compensation 600 600 600 600
Variable compensation(1) n.a 22 n.a -
Exceptional compensation - - - -
Attendance fees 10 6 10 6
Post-employment benefits 6 6 6 6
In-kind benefits - - - -
Total 616 634 616 612
(1) The Compensation Committee will meet after the General Meeting called to approve the 2014 financial statements.
Philippe Goczol, Deputy Chief Executive Officer
Gross amounts (In euros thousands) 2014 2013
Compensation due for the financial year 185 185
Valuation of options granted during the financial year - -
Valuation of performance shares granted during the financial year - -
Total 185 185
Including:
Gross amounts 2014 2013
(In euros thousands) Amounts due Amounts paid Amounts due Amounts paid
Fixed compensation 180 180 180 180
Variable compensation(1) n.a 16 n.a 9
Exceptional compensation - 15 - -
Attendance fees - - - -
Post-employment benefits 5 5 5 5
In-kind benefits - - - -
Total 185 216 185 193
(1) The Compensation Committee will meet after the General Meeting called to approve the 2014 financial statements.
The variable portion of corporate executive officers' compensation is based on quantitative criteria and varies according to Group profitability, with the calculation based on the ratio of net income (Group share) to consolidated sales. There are no fixed targets. Where applicable, the qualitative criteria are left to the discretion of the Compensation Committee, which submits the level of directors' annual compensation to the Board of Directors for approval. Variable compensation is payable annually, once the Group’s results have been reported.
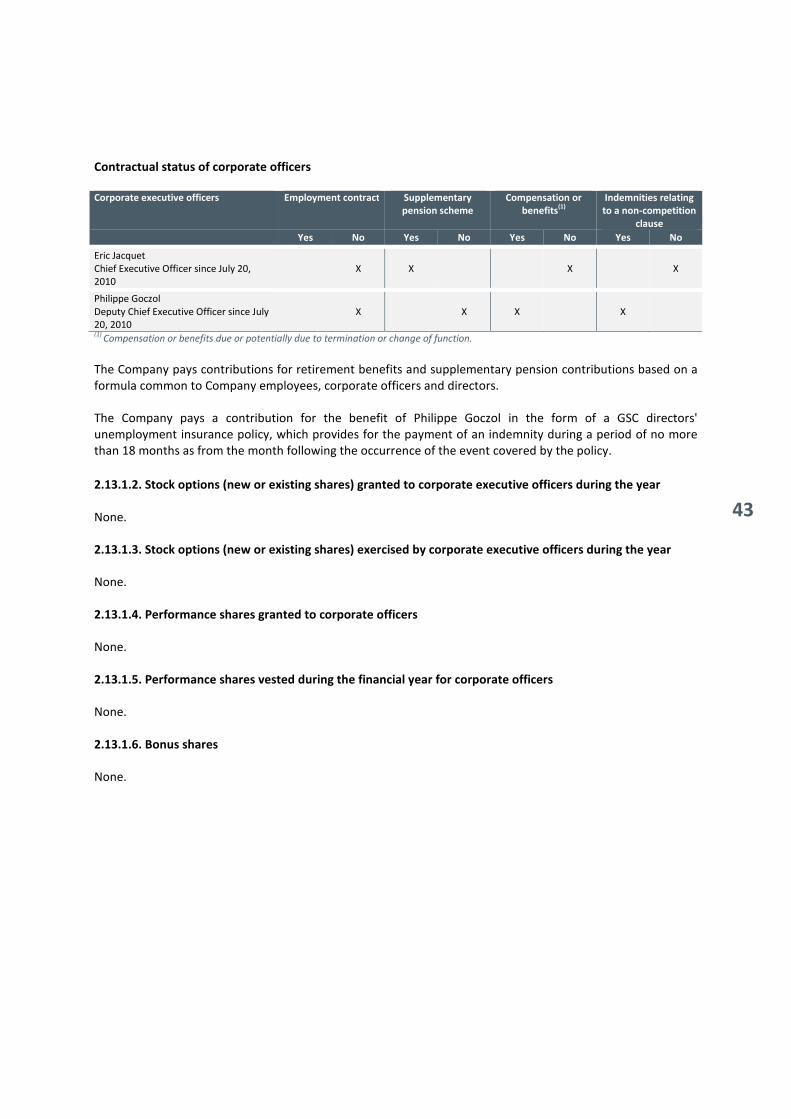
43
Contractual status of corporate officers
Corporate executive officers Employment contract Supplementary
pension scheme
Compensation or
benefits(1)
Indemnities relating
to a non-competition
clause
Yes No Yes No Yes No Yes No
Eric Jacquet Chief Executive Officer since July 20, 2010
X X X X
Philippe Goczol Deputy Chief Executive Officer since July 20, 2010
X X X X
(1) Compensation or benefits due or potentially due to termination or change of function.
The Company pays contributions for retirement benefits and supplementary pension contributions based on a formula common to Company employees, corporate officers and directors. The Company pays a contribution for the benefit of Philippe Goczol in the form of a GSC directors' unemployment insurance policy, which provides for the payment of an indemnity during a period of no more than 18 months as from the month following the occurrence of the event covered by the policy.
2.13.1.2. Stock options (new or existing shares) granted to corporate executive officers during the year
None. 2.13.1.3. Stock options (new or existing shares) exercised by corporate executive officers during the year
None. 2.13.1.4. Performance shares granted to corporate officers
None. 2.13.1.5. Performance shares vested during the financial year for corporate officers
None. 2.13.1.6. Bonus shares
None.

>
2014 FINANCIAL REPORT MANAGEMENT REPORT – INFORMATION ON THE PARENT COMPANY
JACQUET METAL SERVICE S.A.
44
2.13.1.7. Other information
The following facilities, which are directly or indirectly owned by Eric Jacquet are leased by Jacquet Metal Service S.A. as part of the Group's operations: Sites Rents 2014 (excl. VAT) Rents 2013 (excl. VAT) Tenants
Saint Priest - France (69) 424 423 Jacquet Metal Service S.A.
Villepinte - France (93) 118 118 Jacquet Metal Service S.A.
Lyon - France (69) 473 215 Jacquet Metal Service S.A.
Migennes - France (89) 210 210 Jacquet Metal Service S.A.
2.13.1.8. Indemnity for termination or non-renewal of Philippe Goczol's term of office On November 15, 2010 the Board of Directors decided to grant Philippe Goczol an indemnity for the termination or non-renewal of his duties as the Company's Deputy Chief Executive Officer. The conditions for the payment and amount of the indemnity are determined as follows: Conditions for granting the indemnity:
Philippe Goczol shall be granted a termination indemnity under the following circumstances, subject to the Board of Directors acknowledging that any performance conditions have been met:
- Decision by the Board of Directors to remove Mr. Philippe Goczol from the office of Deputy Chief Executive Officer;
- Decision by the Board of Directors not to renew Philippe Goczol's term of office as Deputy Chief Executive Officer, unless he is offered other salaried or non-salaried duties in the Company and/or related companies within the meaning of Article L 225-197-2 of the French Commercial Code, in return for annual compensation equal to 50% of the total gross compensation actually received by Philippe Goczol over the 24-month period prior to the month in which one of the aforementioned decisions is made. "Compensation received" includes fixed and variable compensation (PBMG Group manager profit bonus, attendance bonus and any other variable compensation that the Deputy Chief Executive Officer might receive during his term of office). Compensation does not include stock options or bonus share allocations. The gross salary as shown on Philippe Goczol's pay slip will be used to calculate the compensation received over the last 24 months.
In addition, the Board of Directors decided that no termination indemnity shall be payable to the Deputy Chief Executive Officer if the termination or non-renewal of his term of office occurs after the date on which he becomes eligible for retirement or has retired. Calculation of the indemnity on the basis of performance requirements
The amount of the indemnity shall be based on the change in the Company's theoretical enterprise value (TEV) between:
- 2010, when Philippe Goczol took office; - the average TEV for the benchmark period, including the year of departure year and the two previous
years. This indemnity shall amount to six months’ salary, if the TEV has increased by an average of 3% to 6% per year compared with 2010, and to 12 months’ salary, if the average increase is higher than 6% per year. No indemnity will be paid if the average increase in the TEV is less than 3% per year. The following definitions shall apply for the calculation of the indemnities referred to above:
- the benchmark salary used to calculate the indemnity is equal to the gross average fixed and variable compensation (PBMG, attendance bonus and any other variable compensation that the Deputy Chief
45
Executive Officer may receive during his term of office) payable for the last three financial years and available at the departure date (“Salary”). It is specified that compensation does not include stock options and/or the award of bonus shares in this case;
- The TEV shall be assessed every year using the following formula: TEV = average market capitalization + average Group debt, where: � The average market capitalization is equal to the number of shares (recorded at the end of the
benchmark period for the year of departure) multiplied by the average of the average daily volume-weighted share prices over the benchmark period;
� The average debt is calculated on the basis of the average net debt at the end of the two most recent benchmark periods;
� The benchmark period shall be determined on the basis of the departure date, as follows: � If the departure occurs before the date of the Board of Directors meeting called to review the
half-year financial statements of the departure year (Year N), and no later than September 1 of Year N, the benchmark period for the departure year shall be the most recent financial year ended (N-1). The two previous benchmark periods shall therefore be financial years N-2 and N-3;
� If the departure occurs after the date of the Board of Directors meeting called to review the first half-year financial statements of the departure year (Year N) but before the date on which the Board of Directors reviews the annual financial statements of the current financial year (which must be prior to March 1), the benchmark period for the departure year shall correspond to the 12 months preceding the first half closing date (N). The two previous benchmark periods shall be determined in the same way for the 12 months preceding the period end for half-years N-1 and N-2.
At its meetings on June 29, 2012 and June 26, 2014, the Board of Directors renewed its approval of this indemnity in accordance with payment terms and conditions identical to those approved at its November 15, 2010 meeting. 2.13.1.9. Non-compete clause
The Board of Directors has authorized the signing of a non-compete clause with Philippe Goczol, Deputy Chief Executive Officer, for a period of no more than one year following the termination of his duties as Deputy Chief Executive Officer. During the contractual non-compete period, the Company shall pay the Deputy Chief Executive Officer a monthly financial compensation amount equal to:
- The monthly compensation (hereinafter “MC”) x 0.5, in the event that the termination of his duties results from his resignation as Deputy Chief Executive Officer;
- The monthly compensation (hereinafter “MC”) x 0.6 in all other cases. MC equals the total gross compensation actually received by Philippe Goczol over the 12 months preceding the month in which his duties are terminated, divided by 12. “Compensation received” means fixed and variable compensation (PBMG Group manager profit bonus, attendance bonus and any other variable compensation that the Deputy Chief Executive Officer might receive during his term of office, where applicable). Compensation does not include stock options or bonus share allocations. The gross salary shown on Philippe Goczol's pay slip will be used to calculate the compensation received over the last 12 months. The Company shall reserve the right to waive the non-compete clause, and accordingly not to pay the financial compensation amount.
2.13.2. Remuneration of non-executive directors (Board members) Apart from the corporate executive officers, the June 26, 2014 combined ordinary and extraordinary General Meeting appointed the following individual as a director for a two-year term expiring at the close of the General Meeting called to approve the financial statements for the year ended December 31, 2015: Gwendoline Arnaud.

>
2014 FINANCIAL REPORT MANAGEMENT REPORT – INFORMATION ON THE PARENT COMPANY
JACQUET METAL SERVICE S.A.
46
Apart from the corporate executive officers, the June 26, 2014 combined ordinary and extraordinary General Meeting renewed the following directors' appointments for a two-year term expiring at the close of the General Meeting called to approve the financial statements for the year ended December 31, 2015:
- Jean Jacquet; - Henri-Jacques Nougein; - Françoise Papapietro; - Xavier Gailly; - Jacques Leconte; - JSA, a company governed by Belgian law; - Hiscan Patrimonio, a company governed by Spanish law.
The Jacquet Metal Service S.A. Board members are not bound by employment contracts within the Group. The only compensation that they receive for the performance of their duties takes the form of attendance fees. The compensation amounts set out below include the compensation paid to JSA as a Board member of the Company.
Net amounts 2014 2013
(In euros thousands) Amounts due Amounts paid Amounts due Amounts paid
Jean Jacquet 15.6 10.0 10.0 12.5
Jean-François Clément 4.3 6.7 6.7 8.1
Henri-Jacques Nougein 11.3 7.3 7.3 8.1
Xavier Gailly 12.7 10.1 10.1 14.0
Jacques Leconte 11.0 10.8 10.8 11.9
Françoise Papapietro 8.3 8.6 8.6 4.3
Gwendoline Arnaud 3.9 - - -
JSA 11.0 10.2 10.2 10.2
Hiscan Patrimonio 4.3 - - -
CCAN 2007 ETVE SL. - 7.1 7.1 8.5
Total 82.4 70.8 70.8 77.6
2.14. Staff information The Jacquet Metal Service S.A. staff consisted of 15 executives at December 31, 2014.

47
2.15. List of positions and functions held by corporate officers during the
financial year
1/2 Function Business
address
Appointment/renewal
date
End of
term
Number
of
shares
held
Other corporate offices,
excluding offices in JMS
subsidiaries
Eric Jacquet Chairman of the Board of Directors
c/ JMS 44 quai charles de Gaulle 69006 Lyon
June 30, 2010 June 29, 2012 June 26, 2014
General Meeting 2016
39,530 Managing Director of JSA Manager of SCI DU CANAL Manager of SCI LA FABRIQUE Manager of SCI ROGNA BOUE Manager of SCI QUEDE Manager of SCI DE MIGENNES Manager of JERIC S.A.R.L. Manager of SCI DE BOURGOGNE Manager of JACQUET Bâtiments E.U.R.L. Manager of SCI DES BROSSES Manager of SCI DE MANTENAY Manager of SCI CITE 44 Manager of SCI LE PETIT SAUZAYE
Jean Jacquet
Vice-Chairman of the Board of Directors
c/ JMS 44 quai charles de Gaulle 69006 Lyon
June 30, 2010 June 29, 2012 June 26, 2014
General Meeting 2016
3,000
Jean-François Clément *
Director c/ JMS 44 quai charles de Gaulle 69006 Lyon
June 30, 2010 June 29, 2012
Mar. 13, 2014*
900 Director of Cabinet d'Etudes Marc Merlin SA Member of the Supervisory Board of HCM SAS Chairman of Mutuelle Miltis Vice-Chairman of Alptis Association Member of the Supervisory Board of Alptis Assurances SAS Manager of SCI Créqui Tête d'or Manager of SCI La Mélisse Manager of SCI du 83 rue Pierre Corneille
Françoise Papapietro
Director c/ JMS 44 quai charles de Gaulle 69006 Lyon
June 29, 2012 June 26, 2014
General Meeting 2016
500
Gwendoline Arnaud
Director c/ JMS 44 quai charles de Gaulle 69006 Lyon
June 26, 2014 General Meeting 2016
0 Manager of Cabinet Gwendoline Arnaud et Associés SELARL Manager of SCI PNRAS Manager of SCI LCSG Manager of SCM 2G
* Jean-François Clément deceased on March 13, 2014

>
2014 FINANCIAL REPORT MANAGEMENT REPORT – INFORMATION ON THE PARENT COMPANY
JACQUET METAL SERVICE S.A.
48
2/2 Function Business
address
Appointment/renewal
date
End of
term
Number
of
shares
held
Other corporate
offices, excluding
offices in JMS
subsidiaries
Xavier Gailly Director 4 rue Clede 5521 Serville, Belgium
June 30, 2010 June 29, 2012 June 26, 2014
General Meeting 2016
500 Chairman of GAMI
Jacques Leconte
Director c/ JMS 44 quai charles de Gaulle 69006 Lyon
June 30, 2010 June 29, 2012 June 26, 2014
General Meeting 2016
500 Member of the Strategic Committee of Thermocross SA
Henri-Jacques Nougein
Director c/ JMS 44 quai charles de Gaulle 69006 Lyon
June 30, 2010 June 29, 2012 June 26, 2014
General Meeting 2016
510
JSA Company represented by Philippe Goczol
85 rue de
l’Abbaye, 4040
Hertsal, Belgium
June 30, 2010 June 29, 2012 June 26, 2014
General Meeting 2016
9,688,471 Office held by Mr. Goczol in a personal capacity: Co-manager of SCI de Acquits
CCAN 2007 then Hiscan Patrimonio**
Company represented by Jorge Galera
Avenida Diagonal, 611 Pl.2 0828 Barcelona, Spain
June 30, 2010 June 29, 2012 Date of appointment of Hiscan Patrimonio: Jan. 22, 2014 Appointment: June 26, 2014
Jan. 22, 2014 Oct. 10, 2014***
1,236,706 Offices held by Mr. Galera as representative of CCAN 2007: Chairman of the Board of Directors of Entradas-See-Tickets Chairman of the Board of Directors of Grupo Amma Vice-Chairman of the Board of Directors of Bodesa Member of the Board of Directors of Oesia Offices held by Mr. Galera in a personal capacity: Vice-Chairman of the Board of Directors and member of the Strategic Committee of Bruzon & Muller Member of the Board of Directors and Strategic Committee of Arenas Entertainement
**As part of an internal merger operation at Caixabank, CCAN 2007 was absorbed by Hiscan Patrimonio on January 30, 2014.
*** Hiscan Patrimonio resigned as director on October 10, 2014.
49
2.16. Governance Board of Directors
The Board of Directors' operating procedures are described in the internal regulations adopted by the Board on July 20, 2010 and amended by at the Board meeting of January 22, 2014 following the revision of the AFEP- MEDEF Corporate Governance Code dated June 16, 2013. The General Meeting on June 26, 2014 appointed the following individuals as directors for a two-year term of office expiring at the close of the ordinary General Meeting called in 2016 to approve the financial statements for the year ended December 31, 2015:
- Eric Jacquet; - Jean Jacquet; - Françoise Papapietro; - Gwendoline Arnaud; - Xavier Gailly; - Jacques Leconte; - Henri-Jacques Nougein; - JSA; - Hiscan Patrimonio, which resigned on October 10, 2014.
On June 26, 2014 the Board of Directors drew up the following list of directors considered to be independent:
- Jean Jacquet (not related to Eric Jacquet); - Françoise Papapietro; - Gwendoline Arnaud; - Xavier Gailly; - Jacques Leconte; - Henri-Jacques Nougein; - Hiscan Patrimonio.
The Board of Directors made the following appointments at its June 26, 2014 meeting:
- As Chairman of the Board of Directors and Chief Executive Officer: Eric Jacquet, for the term of his office as director;
- As Vice-Chairman: Jean Jacquet, for the term of his office as director; - As Deputy Chief Executive Officer: Philippe Goczol, for the period during which Eric Jacquet will
perform his duties as Chief Executive Officer. Appointment and Compensation Committee
At its June 26, 2014 meeting the Board of Directors appointed the following individuals as members of the Appointment and Compensation Committee for term of their office as directors:
- Henri-Jacques Nougein, Chairman; - Jean Jacquet; - Jacques Leconte.
Audit and Risk Committee
At its June 26, 2014 meeting the Board of Directors appointed the following individuals as members of the Audit and Risk Committee for the term of their office as directors:
- Jean Jacquet, Chairman; - Françoise Papapietro; - Xavier Gailly.
>
2014 FINANCIAL REPORT MANAGEMENT REPORT – INFORMATION ON THE PARENT COMPANY
JACQUET METAL SERVICE S.A.
50
2.17. Appropriation of 2014 earnings The General Meeting's decision was not known at the time when this document was prepared.
2.18. Non-deductible expenses referred to in Articles 39-4 and 223 of the
French General Tax Code These expenses amounted to €7,909 for the 2014 financial year. The corresponding tax amounted to €2,636.
2.19. Significant events occurring between the balance sheet date and the
report drafting date None.
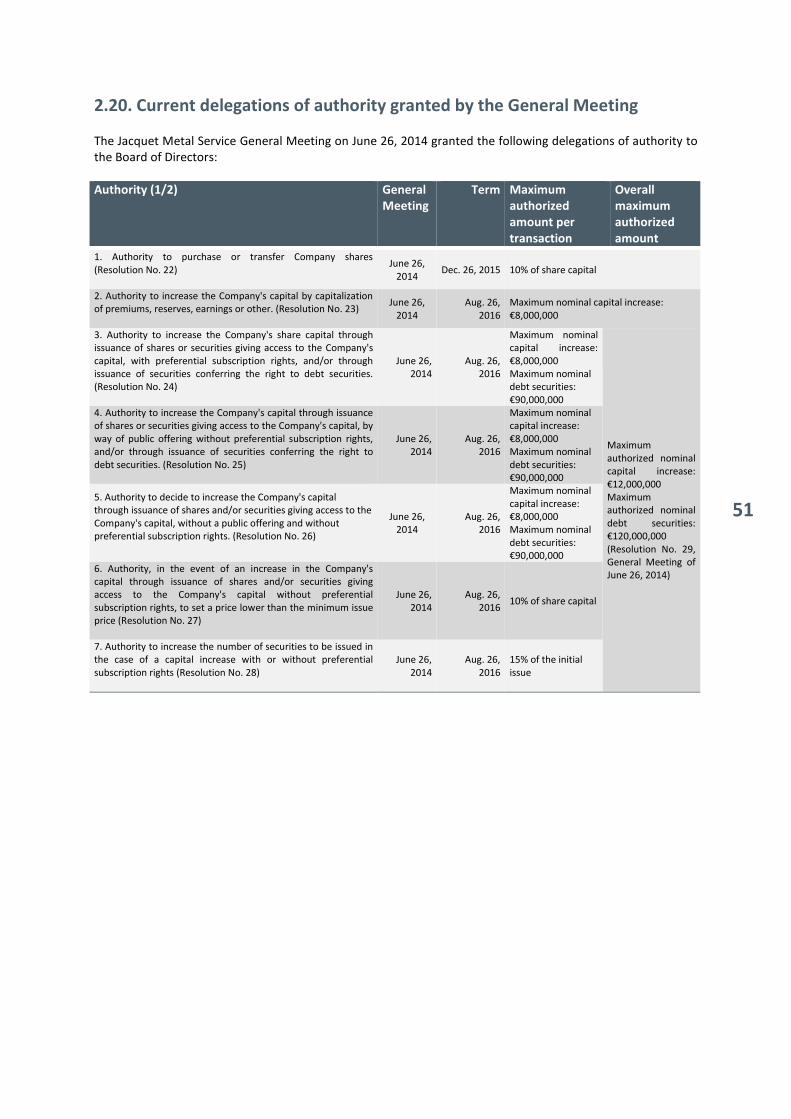
51
2.20. Current delegations of authority granted by the General Meeting
The Jacquet Metal Service General Meeting on June 26, 2014 granted the following delegations of authority to the Board of Directors: Authority (1/2) General
Meeting
Term Maximum
authorized
amount per
transaction
Overall
maximum
authorized
amount
1. Authority to purchase or transfer Company shares (Resolution No. 22)
June 26, 2014
Dec. 26, 2015 10% of share capital
2. Authority to increase the Company's capital by capitalization of premiums, reserves, earnings or other. (Resolution No. 23)
June 26, 2014
Aug. 26, 2016
Maximum nominal capital increase: €8,000,000
3. Authority to increase the Company's share capital through issuance of shares or securities giving access to the Company's capital, with preferential subscription rights, and/or through issuance of securities conferring the right to debt securities. (Resolution No. 24)
June 26, 2014
Aug. 26, 2016
Maximum nominal capital increase: €8,000,000
Maximum authorized nominal capital increase: €12,000,000 Maximum authorized nominal debt securities: €120,000,000 (Resolution No. 29, General Meeting of June 26, 2014)
Maximum nominal debt securities: €90,000,000
4. Authority to increase the Company's capital through issuance of shares or securities giving access to the Company's capital, by way of public offering without preferential subscription rights, and/or through issuance of securities conferring the right to debt securities. (Resolution No. 25)
June 26, 2014
Aug. 26, 2016
Maximum nominal capital increase: €8,000,000 Maximum nominal debt securities: €90,000,000
5. Authority to decide to increase the Company's capital through issuance of shares and/or securities giving access to the Company's capital, without a public offering and without preferential subscription rights. (Resolution No. 26)
June 26, 2014
Aug. 26, 2016
Maximum nominal capital increase: €8,000,000 Maximum nominal debt securities: €90,000,000
6. Authority, in the event of an increase in the Company's capital through issuance of shares and/or securities giving access to the Company's capital without preferential subscription rights, to set a price lower than the minimum issue price (Resolution No. 27)
June 26, 2014
Aug. 26, 2016
10% of share capital
7. Authority to increase the number of securities to be issued in the case of a capital increase with or without preferential subscription rights (Resolution No. 28)
June 26, 2014
Aug. 26, 2016
15% of the initial issue
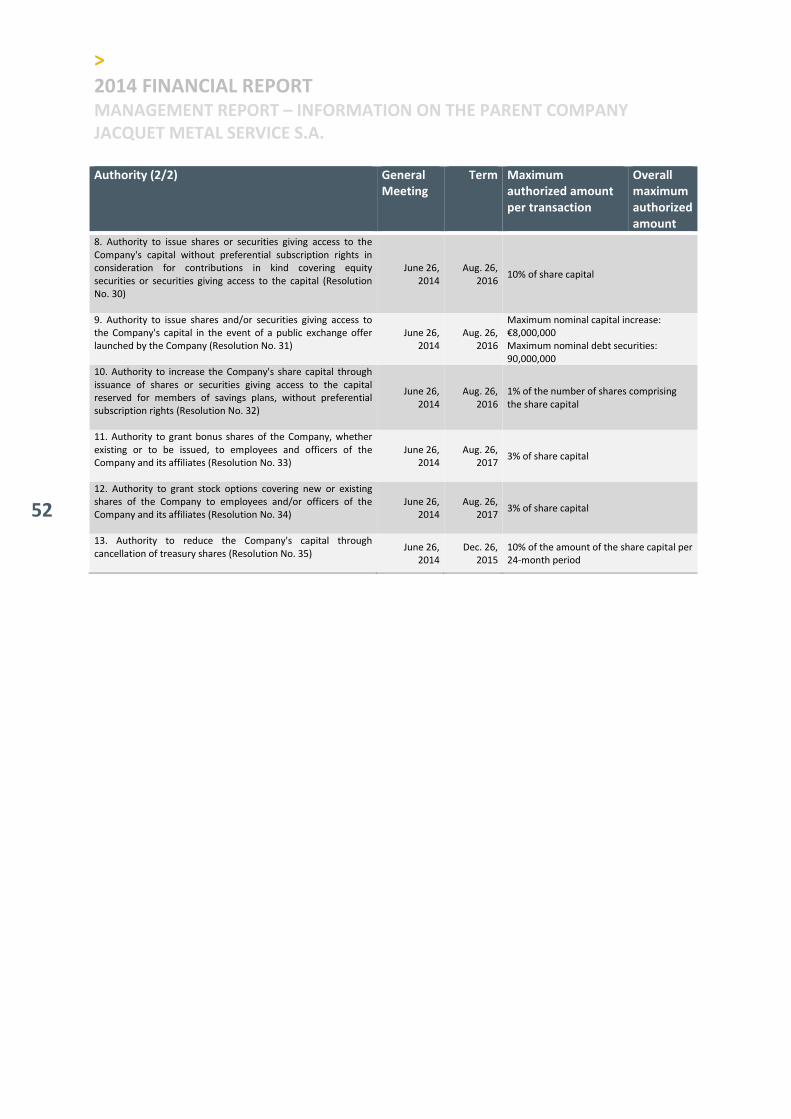
>
2014 FINANCIAL REPORT MANAGEMENT REPORT – INFORMATION ON THE PARENT COMPANY
JACQUET METAL SERVICE S.A.
52
Authority (2/2) General
Meeting
Term Maximum
authorized amount
per transaction
Overall
maximum
authorized
amount
8. Authority to issue shares or securities giving access to the Company's capital without preferential subscription rights in consideration for contributions in kind covering equity securities or securities giving access to the capital (Resolution No. 30)
June 26, 2014
Aug. 26, 2016
10% of share capital
9. Authority to issue shares and/or securities giving access to the Company's capital in the event of a public exchange offer launched by the Company (Resolution No. 31)
June 26, 2014
Aug. 26, 2016
Maximum nominal capital increase: €8,000,000 Maximum nominal debt securities: 90,000,000
10. Authority to increase the Company's share capital through issuance of shares or securities giving access to the capital reserved for members of savings plans, without preferential subscription rights (Resolution No. 32)
June 26, 2014
Aug. 26, 2016
1% of the number of shares comprising the share capital
11. Authority to grant bonus shares of the Company, whether existing or to be issued, to employees and officers of the Company and its affiliates (Resolution No. 33)
June 26, 2014
Aug. 26, 2017
3% of share capital
12. Authority to grant stock options covering new or existing shares of the Company to employees and/or officers of the Company and its affiliates (Resolution No. 34)
June 26, 2014
Aug. 26, 2017
3% of share capital
13. Authority to reduce the Company's capital through cancellation of treasury shares (Resolution No. 35)
June 26, 2014
Dec. 26, 2015
10% of the amount of the share capital per 24-month period
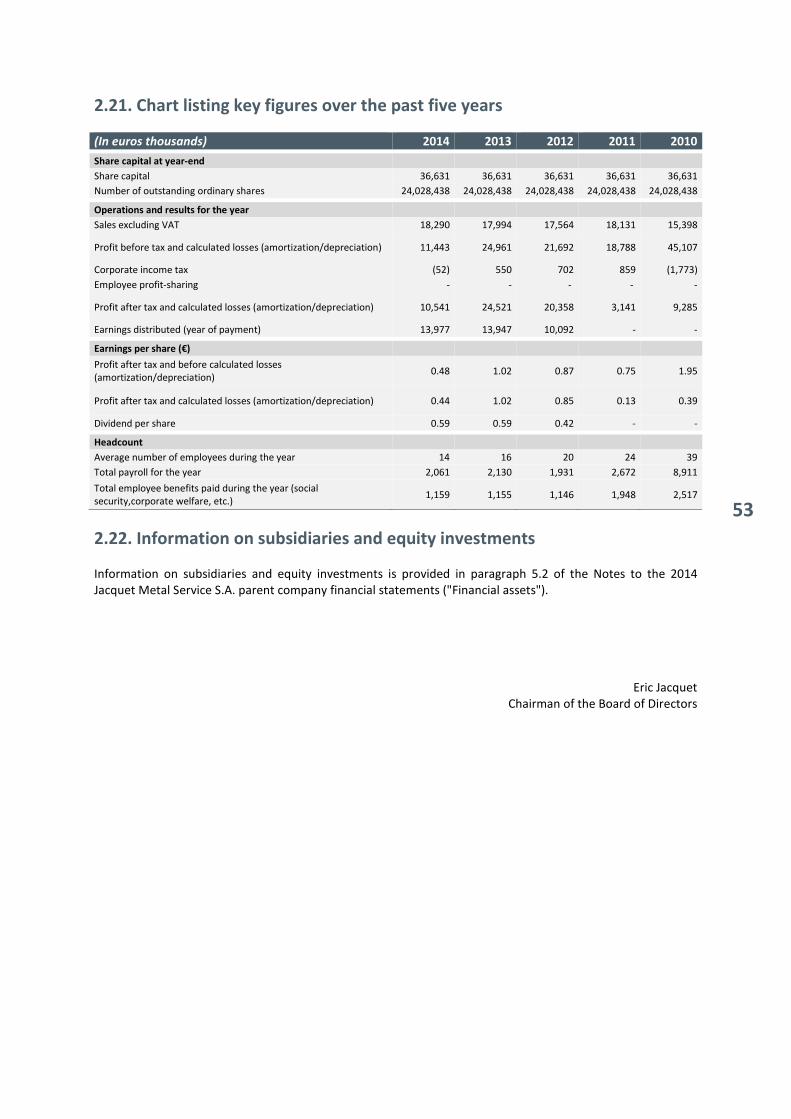
53
2.21. Chart listing key figures over the past five years
(In euros thousands) 2014 2013 2012 2011 2010
Share capital at year-end
Share capital 36,631 36,631 36,631 36,631 36,631
Number of outstanding ordinary shares 24,028,438 24,028,438 24,028,438 24,028,438 24,028,438
Operations and results for the year
Sales excluding VAT 18,290 17,994 17,564 18,131 15,398
Profit before tax and calculated losses (amortization/depreciation) 11,443 24,961 21,692 18,788 45,107
Corporate income tax (52) 550 702 859 (1,773)
Employee profit-sharing - - - - -
Profit after tax and calculated losses (amortization/depreciation) 10,541 24,521 20,358 3,141 9,285
Earnings distributed (year of payment) 13,977 13,947 10,092 - -
Earnings per share (€)
Profit after tax and before calculated losses (amortization/depreciation)
0.48 1.02 0.87 0.75 1.95
Profit after tax and calculated losses (amortization/depreciation) 0.44 1.02 0.85 0.13 0.39
Dividend per share 0.59 0.59 0.42 - -
Headcount
Average number of employees during the year 14 16 20 24 39
Total payroll for the year 2,061 2,130 1,931 2,672 8,911
Total employee benefits paid during the year (social security,corporate welfare, etc.)
1,159 1,155 1,146 1,948 2,517
2.22. Information on subsidiaries and equity investments Information on subsidiaries and equity investments is provided in paragraph 5.2 of the Notes to the 2014 Jacquet Metal Service S.A. parent company financial statements ("Financial assets").
Eric Jacquet Chairman of the Board of Directors
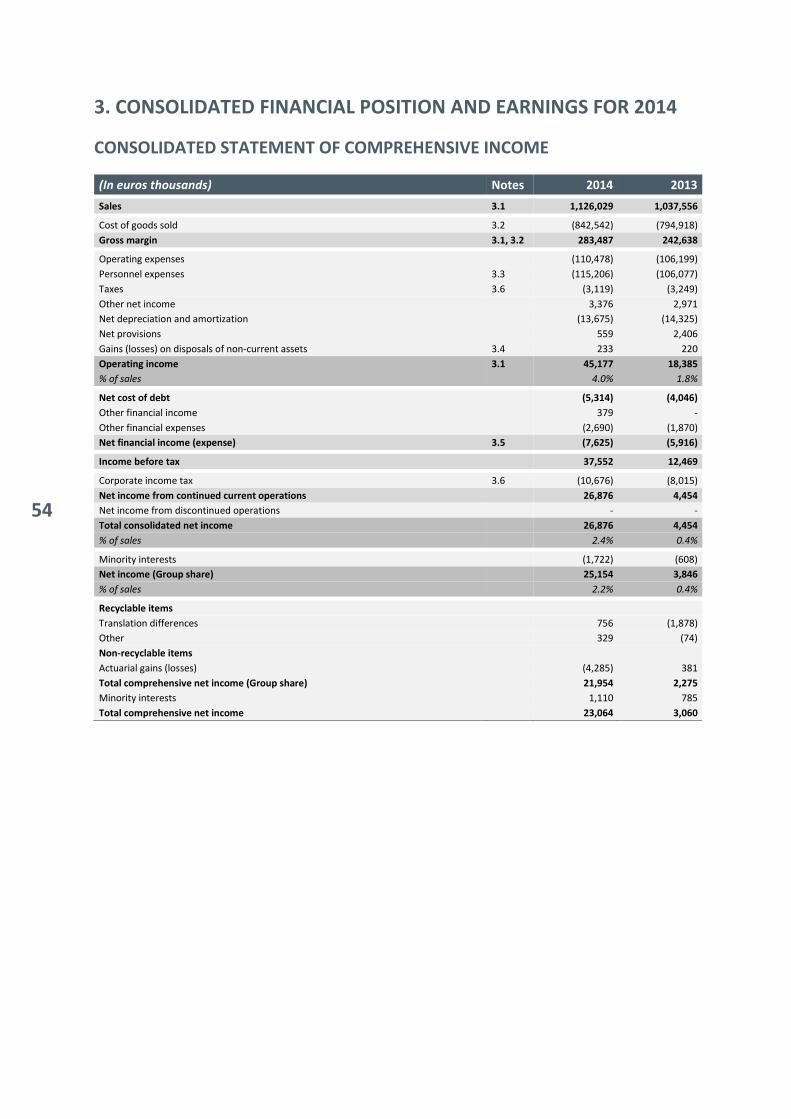
54
3. CONSOLIDATED FINANCIAL POSITION AND EARNINGS FOR 2014
CONSOLIDATED STATEMENT OF COMPREHENSIVE INCOME
(In euros thousands) Notes 2014 2013
Sales 3.1 1,126,029 1,037,556
Cost of goods sold 3.2 (842,542) (794,918)
Gross margin 3.1, 3.2 283,487 242,638
Operating expenses (110,478) (106,199)
Personnel expenses 3.3 (115,206) (106,077)
Taxes 3.6 (3,119) (3,249)
Other net income 3,376 2,971
Net depreciation and amortization (13,675) (14,325)
Net provisions 559 2,406
Gains (losses) on disposals of non-current assets 3.4 233 220
Operating income 3.1 45,177 18,385
% of sales 4.0% 1.8%
Net cost of debt (5,314) (4,046)
Other financial income 379 -
Other financial expenses (2,690) (1,870)
Net financial income (expense) 3.5 (7,625) (5,916)
Income before tax 37,552 12,469
Corporate income tax 3.6 (10,676) (8,015)
Net income from continued current operations 26,876 4,454
Net income from discontinued operations - -
Total consolidated net income 26,876 4,454
% of sales 2.4% 0.4%
Minority interests (1,722) (608)
Net income (Group share) 25,154 3,846
% of sales 2.2% 0.4%
Recyclable items
Translation differences 756 (1,878)
Other 329 (74)
Non-recyclable items
Actuarial gains (losses) (4,285) 381
Total comprehensive net income (Group share) 21,954 2,275
Minority interests 1,110 785
Total comprehensive net income 23,064 3,060

55
STATEMENT OF FINANCIAL POSITION AS OF DECEMBER 31
(In euros thousands) Notes Dec. 31, 2014 Dec. 31, 2013
Gross Dep. amort. prov. Net Net
ASSETS
Goodwill 4.1 68,515 68,515 66,142
Intangible assets 4.2 20,359 17,366 2,993 2,424
Property, plant and equipment 4.3 286,910 189,943 96,967 94,354
Other financial assets 4.4, 4.16 4,072 458 3,614 3,686
Deferred tax 4.13 31,506 31,506 31,074
Non-current assets 411,362 207,767 203,595 197,680
Inventory and work-in-progress 4.5 313,211 28,770 284,441 234,290
Trade receivables 4.6, 4.16 159,837 15,075 144,762 128,776
Tax assets receivable 4.7, 4.16 2,924 2,924 3,102
Other assets 4.8, 4.16 13,537 13,537 13,116
Derivatives 4.16 477 477 69
Cash and cash equivalents 4.9,4.14,4.16 63,151 63,151 61,439
Current assets 553,137 43,845 509,292 440,792
Assets held for sale - -
Total assets 964,499 251,612 712,887 638,472
EQUITY AND LIABILITIES
Share capital 36,631 36,631
Consolidated reserves 220,519 212,607
Shareholders' equity (Group share) 257,150 249,238
Minority interests 4,555 4,106
Total shareholders’ equity 4.10 261,705 253,344
Deferred tax 4.13 7,353 7,825
Non-current provisions 4.11 3,340 2,514
Provisions for employee benefit obligations 4.12 43,136 37,719
Other non-current liabilities 4.15, 4.16 2,131 990
Long-term borrowings 4.14, 4.16 55,804 35,673
Total non-current liabilities 111,764 84,721
Short-term borrowings 4.14, 4.16 144,658 104,031
Trade payables 4.15, 4.16 147,716 156,047
Tax liabilities payable 4.15 5,408 2,003
Current provisions 4.11 6,290 5,824
Derivatives 4.16 - 171
Other liabilities 4.15, 4.16 35,346 32,331
Total current liabilities 339,418 300,407
Liabilities held for transfer -
Total equity and liabilities 712,887 638,472

>
2014 FINANCIAL REPORT CONSOLIDATED 2014 FINANCIAL POSITION AND RESULTS
56
CASH FLOW STATEMENT
(In euros thousands) Notes 2014 2013
Cash and cash equivalents 4.9, 4.14 61,439 71,453
Bank overdrafts, factoring, discounting 4.14 (48,146) (41,613)
Cash and cash equivalents at beginning of period 13,293 29,840
Operating activities
Net income 26,876 4,454
Depreciation, amortization and provisions 14,960 13,068
Capital gains on asset disposals 3.4 (233) (220)
Change in deferred taxes 4.13 456 (87)
Other -
Free cash flow after tax and cost of borrowings 42,059 17,215
Cost of borrowings 3.5 7,218 5,587
Current income tax 3.6 11,690 7,575
Taxes paid (8,279) (5,280)
Free cash flow 52,688 25,097
Change in inventory and work-in-progress (45,212) (2,179)
Change in trade receivables (11,340) (184)
Change in trade payables (10,388) (386)
Other changes 2,363 (1,547)
Total change in working capital (64,577) (4,296)
Cash flow from operating activities 7 (11,889) 20,801
Investing activities
Acquisitions of fixed assets 4.2, 4.3 (14,249) (14,845)
Disposal of assets 4.2, 4.3 533 819
Acquisitions of subsidiaries (7,068) (912)
Changes in consolidation and other (2,603) (12,883)
Cash flow from investing activities 7 (23,387) (27,821)
Financing activities
Dividends paid to parent company shareholders (13,978) (13,947)
Dividends paid to minority shareholders of consolidated companies (1,234) (1,561)
New borrowings 4.14 38,202 30,933
Change in borrowings 4.14 7,840 (21,463)
Interest paid (6,865) (5,563)
Other changes 1,433 1,220
Cash flow from financing activities 7 25,398 (10,381)
Change in cash and cash equivalents (9,878) (17,401)
Translation differences (1,685) 854
Net cash at end of period 1,730 13,293
Cash and cash equivalents 4.9, 4.14 63,151 61,439
Bank overdrafts, factoring, discounting 4.14 (61,421) (48,146)
Total 1,730 13,293
Changes in working capital are shown at net book value.
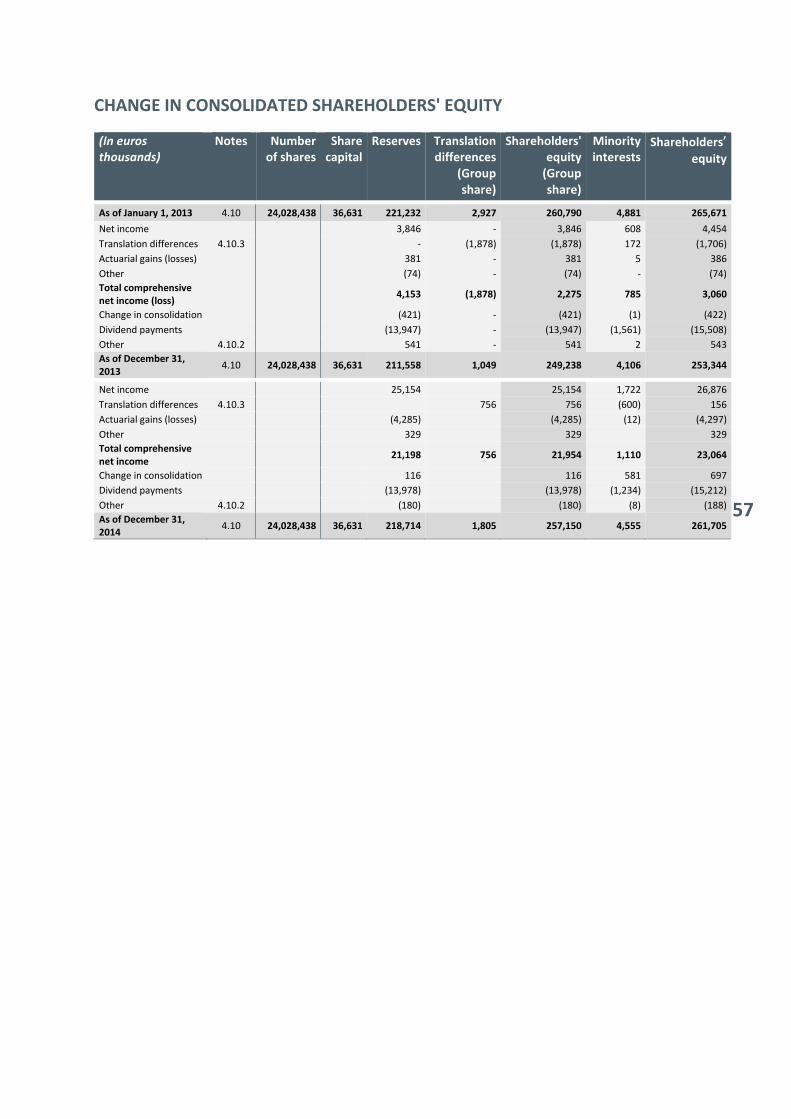
57
CHANGE IN CONSOLIDATED SHAREHOLDERS' EQUITY (In euros
thousands)
Notes Number
of shares
Share
capital
Reserves Translation
differences
(Group
share)
Shareholders'
equity
(Group
share)
Minority
interests
Shareholders’ equity
As of January 1, 2013 4.10 24,028,438 36,631 221,232 2,927 260,790 4,881 265,671
Net income 3,846 - 3,846 608 4,454
Translation differences 4.10.3 - (1,878) (1,878) 172 (1,706)
Actuarial gains (losses) 381 - 381 5 386
Other (74) - (74) - (74)
Total comprehensive
net income (loss) 4,153 (1,878) 2,275 785 3,060
Change in consolidation (421) - (421) (1) (422)
Dividend payments (13,947) - (13,947) (1,561) (15,508)
Other 4.10.2 541 - 541 2 543
As of December 31,
2013 4.10 24,028,438 36,631 211,558 1,049 249,238 4,106 253,344
Net income 25,154 25,154 1,722 26,876
Translation differences 4.10.3 756 756 (600) 156
Actuarial gains (losses) (4,285) (4,285) (12) (4,297)
Other 329 329 329
Total comprehensive
net income 21,198 756 21,954 1,110 23,064
Change in consolidation 116 116 581 697
Dividend payments (13,978) (13,978) (1,234) (15,212)
Other 4.10.2 (180) (180) (8) (188)
As of December 31,
2014 4.10 24,028,438 36,631 218,714 1,805 257,150 4,555 261,705
>
2014 FINANCIAL REPORT CONSOLIDATED 2014 FINANCIAL POSITION AND RESULTS
58
NOTES TO THE CONSOLIDATED FINANCIAL STATEMENTS The Jacquet Metal Service Group’s consolidated financial statements for the year ended December 31, 2014 were approved by the Board of Directors on March 4, 2015 and will be submitted for approval by the Ordinary General Meeting to be held no later than June 30, 2015. All figures are shown in thousands or millions of euros unless otherwise stated. Some totals may display rounding errors.
1. Consolidation principles and policies Pursuant to European Regulation 1606/2002 dated July 19, 2002 on international financial reporting standards, the Jacquet Metal Service Group’s consolidated financial statements published in respect of the 2014 financial year and the comparative 2013 financial statements have been prepared in accordance with the International Financial Reporting Standards (IFRS) in force at December 31, 2014, as approved by the European Union. The standards and interpretations applied are those published in the Official Journal of the European Union (OJEU) before December 31, 2014 for mandatory application as from this date. These guidelines cover all the standards approved by the International Accounting Standards Board (“IASB”) and adopted by the EU, i.e. IFRS, International Accounting Standards (“IAS”) and interpretations issued by the International Financial Reporting Interpretations Committee (“IFRIC”) or the former Standing Interpretations Committee ("SIC"). These guidelines can be consulted on the European Commission website at:
http://ec.europa.eu/internal_market/accounting/ias/index_fr.htm. New standards or amendments adopted by the European Union for mandatory application as from January 1, 2014 have been applied in the consolidated financial statements for the year months ended December 31, 2014. These standards and interpretations have no material impact on the 2014 consolidated financial statements or the presentation thereof. They include the following standards:
- IFRS 10 – Consolidated Financial Statements; - IFRS 11 – Joint Arrangements; - IFRS 12 – Disclosure of Interests in Other Entities; - IAS 32 amended – Offsetting Financial Assets and Financial Liabilities; - IAS 36 amended –Disclosures on the recoverable value of non-financial assets; - IAS 39 amended – Novation of derivatives and continuation of hedge accounting.
The Group has chosen not to apply in advance standards and interpretations adopted by the European Union before the balance sheet date but applicable after that date:
- IFRIC 21 – Recognition of levies. The Group has not applied any accounting principles for mandatory or optional application in 2014 that have
not yet been adopted by the European Union. Group management do not expect the standards and
interpretations issued by the IASB but not yet adopted by the European Union to have a material impact on the
Group financial statements.
Use of estimates
The preparation of IFRS-compliant consolidated financial statements requires management to take into account assumptions and estimates that have an impact on the assets and liabilities shown in the statement of financial position, and mentioned in the notes to the financial statements, as well as on the income and expenses recorded in the consolidated statement of comprehensive income. The estimates may be revised in
59
accordance with changes in the circumstances on which they were based or in light of new information. The actual results may differ from these estimates. In accordance with IAS 10, management's estimates are based on the information available at the balance sheet date, taking post-balance sheet events into account. The main estimates at December 31, 2014 involved:
- The assessment of the recoverability of deferred tax assets: the method followed is based on internal business plans with a maximum timeframe of five years, and takes into account the timeframes over which these taxes may be recovered, depending on the local legislation in effect at the balance sheet date;
- The value of goodwill is tested for impairment at least once a year in preparation for the year-end, and whenever an indication of impairment arises;
- Valuations of impairment of inventory: the method followed to determine the net realizable value of inventory is based on the best estimate, as of the date of the preparation of the financial statements, of the future sale price in the normal course of business less any estimated selling costs;
- The impairment of trade receivables is reviewed in order to take account of the specific situation of some customers;
- Employee benefit liabilities are measured based on actuarial assumptions; - Current and non-current provisions are valued so as to reflect the best estimate of the risks at the
balance sheet date.
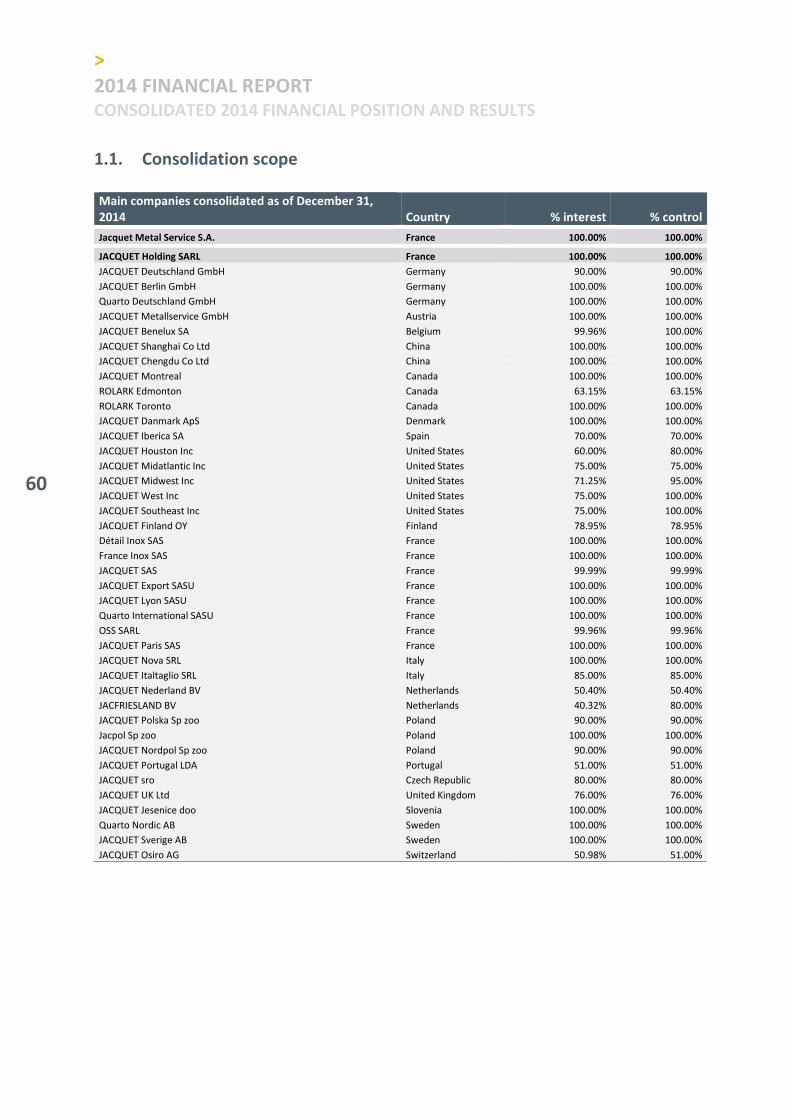
>
2014 FINANCIAL REPORT CONSOLIDATED 2014 FINANCIAL POSITION AND RESULTS
60
1.1. Consolidation scope
Main companies consolidated as of December 31,
2014 Country % interest % control
Jacquet Metal Service S.A. France 100.00% 100.00%
JACQUET Holding SARL France 100.00% 100.00%
JACQUET Deutschland GmbH Germany 90.00% 90.00%
JACQUET Berlin GmbH Germany 100.00% 100.00%
Quarto Deutschland GmbH Germany 100.00% 100.00%
JACQUET Metallservice GmbH Austria 100.00% 100.00%
JACQUET Benelux SA Belgium 99.96% 100.00%
JACQUET Shanghai Co Ltd China 100.00% 100.00%
JACQUET Chengdu Co Ltd China 100.00% 100.00%
JACQUET Montreal Canada 100.00% 100.00%
ROLARK Edmonton Canada 63.15% 63.15%
ROLARK Toronto Canada 100.00% 100.00%
JACQUET Danmark ApS Denmark 100.00% 100.00%
JACQUET Iberica SA Spain 70.00% 70.00%
JACQUET Houston Inc United States 60.00% 80.00%
JACQUET Midatlantic Inc United States 75.00% 75.00%
JACQUET Midwest Inc United States 71.25% 95.00%
JACQUET West Inc United States 75.00% 100.00%
JACQUET Southeast Inc United States 75.00% 100.00%
JACQUET Finland OY Finland 78.95% 78.95%
Détail Inox SAS France 100.00% 100.00%
France Inox SAS France 100.00% 100.00%
JACQUET SAS France 99.99% 99.99%
JACQUET Export SASU France 100.00% 100.00%
JACQUET Lyon SASU France 100.00% 100.00%
Quarto International SASU France 100.00% 100.00%
OSS SARL France 99.96% 99.96%
JACQUET Paris SAS France 100.00% 100.00%
JACQUET Nova SRL Italy 100.00% 100.00%
JACQUET Italtaglio SRL Italy 85.00% 85.00%
JACQUET Nederland BV Netherlands 50.40% 50.40%
JACFRIESLAND BV Netherlands 40.32% 80.00%
JACQUET Polska Sp zoo Poland 90.00% 90.00%
Jacpol Sp zoo Poland 100.00% 100.00%
JACQUET Nordpol Sp zoo Poland 90.00% 90.00%
JACQUET Portugal LDA Portugal 51.00% 51.00%
JACQUET sro Czech Republic 80.00% 80.00%
JACQUET UK Ltd United Kingdom 76.00% 76.00%
JACQUET Jesenice doo Slovenia 100.00% 100.00%
Quarto Nordic AB Sweden 100.00% 100.00%
JACQUET Sverige AB Sweden 100.00% 100.00%
JACQUET Osiro AG Switzerland 50.98% 51.00%

61
Main companies consolidated as of December 31,
2014 Country % interest % control
Abraservice Holding SAS France 100.00% 100.00%
Abraservice Deutschland GmbH Germany 100.00% 100.00%
Abraservice Belgium SA Belgium 99.99% 99.99%
Abraservice Iberica INT SL Spain 100.00% 100.00%
Abraservice France SAS France 100.00% 100.00%
Abraservice Lyon SAS France 100.00% 100.00%
Abraservice Italia SpA Italy 62.95% 62.95%
Abraservice Nederland BV Netherlands 99.99% 100.00%
Abraservice Polska Sp zoo Poland 100.00% 100.00%
Abraservice Portugal Portugal 51.00% 51.00%
Abraservice CZ sro Czech Republic 100.00% 100.00%
Abraservice UK Ltd United Kingdom 76.00% 76.00%
Abraservice Özel Ҫelik Ltd Şi Turkey 99.99% 99.99%
Stappert Deutschland GmbH Germany 100.00% 100.00%
Stappert Fleischmann GmbH Austria 100.00% 100.00%
Stappert Intramet SA Belgium 100.00% 100.00%
Stappert France SAS France 100.00% 100.00%
Stappert Magyarország Kft Hungary 100.00% 100.00%
UAB Stappert Lietuva Lithuania 75.00% 75.00%
Stappert Nederland BV Netherlands 100.00% 100.00%
Noxon Stainless BV Netherlands 100.00% 100.00%
Stappert Polska Sp zoo Poland 100.00% 100.00%
Stappert Česká Republika spol sro Czech Republic 100.00% 100.00%
Stappert UK United Kingdom 76.00% 76.00%
Stappert Slovensko AS Slovakia 100.00% 100.00%
Stappert Sverige AB Sweden 100.00% 100.00%
Trinox SA Switzerland 100.00% 100.00%
IMS Group Holding SAS France 100.00% 100.00%
Höselmann Stahl GmbH Germany 100.00% 100.00%
Finkenholl Stahl Service Center GmbH Germany 97.50% 97.50%
IMS Aceros INT SAU Spain 100.00% 100.00%
IMS France SAS France 100.00% 100.00%
Calibracier SAS France 100.00% 100.00%
IMS SpA Italy 100.00% 100.00%
IMS Nederland Netherlands 90.00% 90.00%
IMS Portugal SA Portugal 100.00% 100.00%
IMS Özel Ҫelik Ltd Şi Turkey 100.00% 100.00%
>
2014 FINANCIAL REPORT CONSOLIDATED 2014 FINANCIAL POSITION AND RESULTS
62
1.2. Changes in consolidation scope The main change in consolidation scope in 2014 is related to the acquisition of the ROLARK Group in October 2014. ROLARK is a Canadian group that consists of three companies based in Toronto, Edmonton and Montreal. Following the acquisition transactions, the Group holds a 100% interest in ROLARK Toronto and Jacquet Montreal and a 63.15% interest in ROLARK Edmonton. The ROLARK Group has 65 employees and generates annual sales of CAD 34 million (€25 million) in the stainless steel distribution market in 2014. This acquisition rounds out the Jacquet brand’s North American operations and increases the brand’s full-year pro forma sales to €250 million. The Group’s consolidated statement of comprehensive income includes the Canadians subsidiaries’ financial statements as from their acquisition date (i.e. two-and-a-half months of operations). The ROLARK Group’s contribution to the 2014 financial statements amounted to €5 million in sales and €13 million of total assets amounting. The acquisition generated goodwill of €2.4 million. Furthermore, four new companies were founded and included in the scope of consolidation in 2014:
- IMS Nederland (IMS brand) ; - Abraservice Portugal (Abraservice brand) ; - Quarto Deutschland (JACQUET brand) ; - Stappert UK (Stappert brand).
1.3. Consolidation method
All companies that are wholly controlled via the direct or indirect ownership of voting rights are fully consolidated. Any transactions between consolidated companies are canceled, in the same way as for internal Group income (dividends, capital gains, inventory margins, etc.). The restatements required to harmonize the consolidated companies' valuation methods have been performed. The impact of internal Group transactions on the statement of financial position and consolidated earnings has been eliminated.
1.4. Closing date The balance sheet date for all consolidated subsidiaries is December 31, 2014.
1.5. Translation of foreign companies’ financial statements Foreign companies’ financial statements, where the local currency is the functional currency, are translated into euros at the balance sheet date in accordance with the following principles:
- The items in the statement of financial position are translated at the exchange rate in effect at the balance sheet date;
- The items in the consolidated statement of comprehensive income are translated at the average rate for the year;
- The differences arising from these translation methods are recognized in shareholders’ equity.

63
Table showing the euro exchange rates used for consolidation purposes
Country Currency 2014 average rate 2014 closing rate
Canada Canadian Dollar CAD 1.4203 1.4063
Switzerland Swiss Franc CHF 1.2146 1.2024
China Yuan CNY 8.2506 7.4556
Czech Republic Czech Koruna CZK 27.5359 27.735
Denmark Danish Krone DKK 7.4549 7.4453
United Kingdom Pound Sterling GBP 0.8064 0.7789
Hungary Forint HUF 308.7048 315.54
Lithuania Lithuanian Litas LTL 3.4528 3.4528
Poland Zloty PLN 4.1846 4.2732
Sweden Swedish Krona SEK 9.0968 9.393
Turkey Turkish Lira TRY 2.9071 2.8207
United States US Dollar USD 1.3288 1.2141
2. Valuation methods
2.1. Sales Sales consist of the value of the goods and services, excluding tax, sold by the consolidated companies during their normal course of business, after the elimination of intra-group sales. In accordance with IAS 18 – Revenue, sales are recognized on the date when most of the risks and benefits inherent to ownership are transferred (usually on the date when ownership of the assets is transferred). Sales are valued at the fair value of the consideration received or due, i.e. after deducting any trade rebates or discounts and any financial discounts granted. Incoterms (International Commercial Terms) do not have a material impact on the procedures for recording sales.
2.2. Cost of goods sold The cost of goods sold primarily corresponds to purchases consumed and the net impact of the inventory impairment charges recognized over the financial year. Rebates, reductions and any financial discounts obtained are deducted from purchases.
2.3. Personnel expenses Personnel expenses include restructuring costs, the cost of bonus share plans and the French Employment and Competitiveness Tax Credit (CICE).
2.4. Subsidies In accordance with IAS 20 – Accounting for Government Grants and Disclosure of Government Assistance, any investment subsidies received are deferred and then progressively recognized under income from current operations in proportion to the depreciation and amortization of the corresponding assets purchased.

>
2014 FINANCIAL REPORT CONSOLIDATED 2014 FINANCIAL POSITION AND RESULTS
64
2.5. Net financial income Net financial income consists of the following items:
- Interest income and expense on consolidated net debt, which consists of borrowings, cash and other financial liabilities (including finance lease liabilities);
- Banking services; - Foreign exchange gains and losses.
Interest is recognized in the amount of the interest accrued, using the effective interest rate method.
2.6. Income tax The income tax charge includes current corporate income tax and deferred tax. The tax charge payable is equal to the income tax payable to the tax authorities for the financial year, depending on the rules and tax rates in effect in each country. In accordance with the provisions of IAS 12 – Income Taxes, deferred tax is valued using the balance sheet approach and the liability method for all temporary differences arising from the difference between the tax base and the accounting base for assets and liabilities, as well as for tax-loss carryforwards. However, deferred tax arising from tax-loss carryforwards is only recognized once its recoverability has been assessed. The French corporate value-added charge (CVAE), which is based on the value-added resulting from the individual financial statements of the French subsidiaries, is classified under “income tax” in the consolidated statement of comprehensive income.
2.7. Earnings per share Basic earnings per share is calculated by dividing net income, Group share for the period by the average weighted number of shares outstanding during the period, excluding treasury shares. The average weighted number of shares outstanding corresponds to the number of ordinary shares outstanding at the beginning of the period, adjusted for the number of ordinary shares bought back or issued during the period. Diluted earnings per share is calculated by dividing net income, Group share by the weighted average number of ordinary shares outstanding, plus any potentially dilutive ordinary shares (stock options and warrants, etc.), restated for treasury shares.
2.8. Operating segments
Pursuant to IFRS 8 – Operating Segments, the information provided is based on the internal reporting process used by management in order to assess the performance of each operating segment. In accordance with the Group’s operational organizational structure, performance is assessed at the subsidiary level for each brand. The brands correspond to the four markets in which the Group operates:
- JACQUET: distribution of stainless steel quarto plates; - Stappert: distribution of long stainless steel products; - Abraservice: distribution of wear-resistant quarto plates; - IMS group: distribution of engineering steels.

65
The sector-based benchmark indicators reviewed by the main decision-makers are: sales, gross margin, operating income, operating working capital and the operating working capital to sales ratio.
2.9. Goodwill – Business combinations
Business combinations that took place prior to January 1, 2010 have been recognized in accordance with the acquisition method, as set out in IFRS 3. The Group has applied IFRS 3 revised since January 1, 2010. In accordance with IAS 27 amended, any acquisition or disposal of an interest that does not alter control and is performed after the business combination must be directly recognized in shareholders’ equity. Goodwill arising on the acquisition of foreign companies outside the euro zone is treated in the same way as the assets and liabilities of the foreign business activity, and is therefore translated at the closing exchange rate, in accordance with IAS 21. In accordance with the provisions of IAS 36 – Impairment of Assets, the value of goodwill is tested for impairment at least once a year, at the balance sheet date, and whenever an indication of impairment arises. This test is performed at the level of the Cash Generating Units (CGUs) to which the goodwill has been allocated. In the event of material adverse factors, the Group re-assesses the recoverable value of the assets and may be required to impair some of those assets. The recoverable value of the CGU is the higher of fair value and value-in-use. The CGU’s value-in-use is determined on the basis of discounted future operating cash flow forecasts, drawn from the 5-year business plans, and of a terminal value estimated by capitalizing cash flows to infinity. Where the recoverable value of the CGU is lower than its net book value, an impairment charge is recorded under operating income. The discount rate used is assessed on an individual basis at the level of each CGU, and is determined on the basis of the average weighted cost of capital determined for the Group, to which a country risk premium is applied for subsidiaries located outside the euro zone, together with a premium relating to company size for the smaller subsidiaries.
The discounted future cash flow method used to assess the recoverable value of goodwill is by nature uncertain. Its structure implies that the values obtained are sensitive to changes in the assumptions and parameters selected, such as:
- Changes in the economic environment and market conditions; - Changes in sale prices and gross margins; - Fluctuations in raw material prices and foreign exchange rates; - The choice of discount rate and perpetual growth rate at the end of the forecast period.
Depending on the assumptions used to draw up the business plans and the interest rate parameters applied, the method results in a level of uncertainty that may affect the value of goodwill. Goodwill impairment charges are definitively applied to the gross value of the goodwill.
>
2014 FINANCIAL REPORT CONSOLIDATED 2014 FINANCIAL POSITION AND RESULTS
66
2.10. Research and development costs The Group has no research and development activities.
2.11. Intangible assets Intangible assets primarily include amortizable items such as software. The useful life of intangible assets is assessed as finite or indefinite for each asset. Where an intangible asset has a finite useful life, it is amortized over that period. The amortization periods and methods for intangible assets with a finite useful life are reviewed at least at every balance sheet date, and whenever there is evidence of impairment.
2.12. Tangible fixed assets Gross value
In accordance with IAS 16 – Property, Plant and Equipment, assets are broken down if their components have different useful lives or if they provide benefits to the company at different rates that require the use of separate depreciation rates and methods. Property, plant and equipment are recorded on the balance sheet at their historic cost, which consists of:
- The purchase price, including customs duties and other non-recoverable levies; - Any directly related expenses incurred to put the asset in working order for the purpose of its planned
use; - Any trade rebates and discounts deducted when calculating the purchase cost; - Plus any valuation differences arising from first-time consolidation differences.
Depreciation and impairment
The depreciation methods and periods (which correspond to the useful life) applied by the Group are as follows:
- Buildings and their fixtures and fittings are depreciated on a straight-line basis over their estimated useful life, which ranges between 5 and 30 years;
- Industrial equipment is depreciated on a straight-line basis over its estimated useful life, which ranges between 5 and 15 years;
- Other categories of property, plant and equipment, such as vehicles and computer hardware, are depreciated on a straight-line basis based on useful lives that usually range between 3 and 10 years.
The Group uses its assets for as long as possible, and sales of property, plant and equipment take place only very occasionally. This means that the Group uses its assets over their useful life, without taking their residual value into account. Property, plant and equipment are tested for impairment where events or changes indicate that their book value may no longer be recoverable. If there is any evidence of this kind, or if their book value exceeds their estimated recoverable value, the assets are written down to their recoverable value, which is determined on the basis of their market value or their value based on discounted future cash flows, if higher.
67
2.13. Leases Finance leases
Where an agreement is classified as a finance lease within the meaning of IAS 17, the asset is recorded as a fixed asset, in an amount equal to the fair value of the leased asset or at the value of the discounted minimum lease payments, if lower, and offset against “financial liabilities”. The amount of the liability is gradually reduced by the portion of the financial amortization included in the lease payments. Assets covered by finance leases are depreciated over the shorter of the lease term and the useful life of the asset. Where transfer of ownership at the end of the agreement is reasonably certain, the useful life is used. Operating leases
Lease payments under operating leases are expensed on a straight-line basis throughout the term of the agreement.
2.14. Financial instruments
2.14.1. Financial assets
- Financial assets recorded at amortized cost: this heading includes non-current financial assets, such as loans, deposits and guarantees, and current assets (trade receivables and other assets excluding prepaid expenses);
- Financial assets designated at “fair value through comprehensive income”: this heading includes cash and cash equivalents, as well as financial derivatives;
- Available-for-sale financial assets: available-for-sale securities are measured at fair value or at the balance sheet date, and consist of financial assets that the company intends to retain for an indefinite period. Changes in fair value are recognized in shareholders’ equity. In the event of disposal or impairment, the aggregate changes in fair value recorded in shareholders’ equity are transferred to the consolidated statement of comprehensive income.
2.14.2. Financial liabilities
- Financial liabilities recorded at amortized cost: this heading includes non-current and current financial liabilities (banks and finance lease firms, other financing and bank overdrafts), and current and non-current liabilities (trade payables and other liabilities excluding deferred income);
- In accordance with IAS 39 – Financial Instruments, borrowings and bank overdrafts are recognized at their amortized cost, calculated on the basis of the effective interest rate. The portion maturing in less than one year is classified under “short-term borrowings”, while the portion maturing in over one year is classified under “long-term borrowings”;
- Financial liabilities designated at “fair value through comprehensive income”: this heading includes financial derivatives.
>
2014 FINANCIAL REPORT CONSOLIDATED 2014 FINANCIAL POSITION AND RESULTS
68
2.14.3. Derivatives Derivatives primarily include interest rate and exchange rate hedging instruments. Derivatives are valued at their fair value at the balance sheet date. Where the Group can prove the effectiveness of the hedges, the changes in fair value are recorded under other comprehensive income; where the Group does not use hedge accounting, changes in fair value are recognized in profit or loss.
2.15. Inventory and work-in-progress Gross value
Inventory is valued at the weighted average cost. Net realizable value
Where applicable, inventory is subject to impairment in order to reduce it to its net realizable value. The net realizable value corresponds to the estimated sale price during the normal course of business less any costs necessary for completing the sale. This means that the impairment charge is calculated on the basis of an estimated net realizable value, which is discounted in accordance with the estimated resale date.
2.16. Trade receivables
Trade receivables are valued at their nominal value. Given the short payment timeframes, their fair value is identical to their nominal value. Discounted notes not yet matured, securitized receivables or receivables assigned under the Dailly Act are added back to trade receivables. Receivables assigned on a non-recourse basis in accordance with IAS 39 - Financial Instruments are removed from the accounts. Where applicable, trade receivables may be subject to impairment where there is a risk that they will not be recovered. The book value of each receivable is assessed in accordance with this risk. Where the receivable is covered by a credit insurance policy, only the non-insured portion is subject to impairment. Irrecoverable receivables are removed from the balance sheet and recognized as losses.
2.17. Cash and cash equivalents This item consists of cash held at banks, cash on hand, accounts and term deposits and equity investments, which are usually money-market investment funds or Negotiable Certificates of Deposit that are immediately convertible and subject to a negligible risk of change in value. Investment securities are measured at fair value and unrealized gains and losses are recognized under net financial items. These investments are held with a view to their short-term sale.
2.18. Assets and liabilities held for sale Assets or groups of assets held for sale, as defined by IFRS 5, are shown on a separate line under assets. The liabilities attached to groups of assets held for sale are shown on a separate line under liabilities. Assets are no longer depreciated or amortized once they fulfill the conditions for classifying them as assets held for sale, i.e. as soon as they are available for immediate disposal and their disposal is likely.

69
Their book value is compared with their fair value, net of disposal costs, at each year-end, and an impairment charge is recognized, where applicable. Where a group of assets disposed of, held for sale or discontinued is a component of the entity, the related income and expenses are shown on a separate line in the consolidated statement of comprehensive income (net income from discontinued operations).
2.19. Shareholders’ equity, treasury shares and bonus share plans Share-based payments
In accordance with IFRS 2 – Share-Based Payments, bonus shares awarded to Group employees are measured at the fair value of the benefit granted on the award date. Changes in their value following the award date have no impact on this valuation. The expense calculated in this way is recognized under personnel expenses, and offset in shareholders’ equity over the vesting period for the rights on a straight-line basis.
Treasury shares
The treasury shares held by the Group are charged against shareholders’ equity at their purchase cost. Any gains or losses relating to the purchase, sale, issuance or cancellation of these shares are recognized directly in shareholders’ equity, with no impact on income.
2.20. Current and non-current provisions In accordance with IAS 37, provisions are recognized where:
- There is a legal or implicit obligation arising from past events; - It is likely that an outflow of resources will be required to extinguish the obligation; - And the amount of the obligation can be reliably estimated.
Depending on their expiry date, provisions are considered as “current” (expiring in less than one year) or “non-current” (expiring in more than one year). Contingent assets are mentioned in the notes to the financial statements where their realization is likely and their amount is material. Contingent liabilities are mentioned in the notes to the financial statements where their amount is material.
2.21. Provisions for employee benefit obligations In addition to the pension benefits required by the applicable local legislation of the countries where the companies are located, some Group employees receive retirement benefits (or termination allowances) and supplemental pensions. There are also long-term service awards. The Group offers these benefits in some countries through defined-contribution schemes or defined-benefit schemes. In the case of defined-contribution schemes, the Group has no other obligation than to pay the premiums, while the related expense is recognized directly in income for the financial year. In the case of defined-benefit schemes, pension obligations are valued in accordance with IAS 19, using the actuarial projected unit credit method. The Group has applied IAS 19 revised since 2012, and recognizes the change in actuarial differences under items of other comprehensive income. The provision is assessed by actuaries who are independent of the Group.

>
2014 FINANCIAL REPORT CONSOLIDATED 2014 FINANCIAL POSITION AND RESULTS
70
2.22. Deferred tax Deferred tax is recognized according to the balance sheet liability method for any temporary differences that exist between the tax base for assets and liabilities and their net book value at the balance sheet date. Deferred tax assets are only recorded under assets if the Group expects to make sufficient taxable profits to absorb them, based on a business plan drawn up in accordance with the most likely scenario. The method followed is based on Group business plans, given that the Group operates in a cyclical market where cycles usually last five years, and takes into account the maximum periods during which these taxes can be recovered pursuant to the legislation in effect at the balance sheet date. The book value of deferred tax assets is reviewed at least once a year during the annual closing process. Tax assets and liabilities are valued on the basis of the tax rates adopted, or to be adopted shortly, at the balance sheet date. Under the liability method, the impact of potential changes in tax rates on deferred tax recorded in prior periods is recorded in income during the financial year when these tax rate changes have become certain.
2.23. Deferred tax liabilities All tax liabilities are recorded in accordance with IAS 12.
2.24. Receivables and payables denominated in foreign currencies
Transactions denominated in foreign currencies are recognized at their equivalent value in euros at the transaction date. At the balance sheet date, financial assets and monetary liabilities denominated in foreign currencies are converted into euros at the closing exchange rate. The resulting foreign exchange gains and losses are recognized under “currency gains/losses” and are shown under other financial income and expense in the consolidated statement of comprehensive income. Foreign exchange differences relating to monetary items that are part of the Group’s net investment in a foreign subsidiary are treated in the same manner as an investment in the subsidiary’s share capital, i.e. they are recognized in shareholders’ equity in accordance with IAS 21 – Effects of Changes in Foreign Exchange Rates. When the net investment is sold, these exchange rate differences are reclassified from shareholders’ equity to income.

71
3. Notes to the Consolidated Statement of Comprehensive Income
3.1. Operating segments The key indicators for each operating segment at December 31, 2014 were as follows:
2014 (€m)
Sales Gross
margin
Operating
income
Net operating working
capital
Operating working
capital as a % of sales
Inventories and WIP provision %
JACQUET 230.7 65.7 4.4 72.9 31.6% 6.8%
Stappert 453.0 99.7 23.4 90.5 20.0% 8.0%
Abraservice 65.0 20.8 (0.1) 16.9 26.0% 8.1%
IMS group 383.8 96.1 12.7 93.1 24.3% 12.1%
Others (1) 9.0 1.1 4.7 8.1 n/a n/a
Inter-brand eliminations (15.4) (0.0) (0.0) (0.0) n/a n/a
Total 1,126.0 283.5 45.2 281.5 25.0% 9.2% (1)
Non-brand activities (including Jacquet Metal Service S.A.)
n/a: not applicable
The key indicators for each operating segment at December 31, 2013 were as follows:
2013 (€m)
Sales Gross
margin
Operating
income
Net operating working
capital
Operating working
capital as a % of sales
Inventories and WIP provision %
JACQUET 199.0 55.2 0.5 33.6 16.9% 5.2%
Stappert 446.3 85.7 11.0 77.1 17.3% 6.5%
Abraservice 64.0 19.1 (0.4) 15.1 0.2 11.0%
IMS group 343.5 82.6 2.6 79.8 23.2% 13.8%
Others (1) - - 4.6 4.2 n/a n/a
Inter-brand eliminations (15.2) (0.0) (0.0) (2.8) n/a n/a
Total 1,037.6 242.6 18.4 207.0 20.0% 9.3%
The breakdown of sales by geographical region was as follows: 2014 (€m)
Sales %
Germany 277.3 24.6%
France 147.8 13.1%
Italy 128.7 11.4%
Spain 103.1 9.2%
North America 64.6 5.7%
Netherlands 56.0 5.0%
Other Europe 314.6 27.9%
Rest of the World 33.9 3.0%
Total 1,126.0 100.0%

>
2014 FINANCIAL REPORT CONSOLIDATED 2014 FINANCIAL POSITION AND RESULTS
72
2013 (€m)
Sales %
Germany 253.1 24.4%
France 151.2 14.6%
Italy 109.1 10.5%
Spain 101.9 9.8%
Netherlands 51.9 5.0%
North America 41.9 4.0%
Other Europe 293.7 28.3%
Rest of the World 34.7 3.3%
Total 1,037.6 100.0%
3.2. Cost of goods sold
(€m) 2014 2013
Sales 1,126.0 1,037.6
Cost of goods sold (842.5) (795.0)
Purchases consumed (838.2) (795.9)
Inventory impairment (4.3) 0.9
Gross margin 283.5 242.6
Margin rate 25.2% 23.4%
Margin rate excluding inventory impairment 25.6% 23.3%
A breakdown of gross margin is provided in Section 1.3 of the Management Report – Information on the Group.
3.3. Payroll expenses and headcount
(€m) 2014 2013
Wages and salaries 89.2 80.5
Payroll taxes 24.1 22.8
Other personnel expenses 1.9 2.8
Personnel expenses 115.2 106.1
Payroll tax rate 27.0% 28.3%
The personnel expenses increase is especially linked to the change in scope (acquisitions of Finkenholl in 2013 and ROLARK Group in 2014) and increase of variable remunerations (Net income Group share : €25.2 million in 2014 compared to €3.8 million in 2013). Headcount
The Group’s headcount at December 31, 2014 was 2,413 (full-time equivalent) employees compared with 2,277 at December 31, 2013.
2014 2013
Full-time equivalents at closing 2,413 2,277
Average headcount 2,398 2,262
of which France 519 491
of which foreign 1,879 1,771
73
The headcount increase is especially linked to the change in scope (acquisitions of Finkenholl in 2013 and ROLARK Group in 2014).
Compensation paid to corporate officers
The Company has two executive corporate officers, to whom the compensation and direct and indirect benefits of all kinds paid in 2014 amounted to €850,000, compared with €806,000 in 2013. Attendance fees, which are the only compensation paid to the Jacquet Metal Service S.A.’s non-executive directors, amounted to €71,000 in 2014 compared with €77,000 in 2013.
3.4. Gains and losses on disposals of fixed assets The gains and losses on disposals of fixed assets primarily resulted from disposals of property, plant and equipment, none of which was material on an individual basis.
3.5. Net financial income
(€m) 2014 2013
Interest on long-term borrowings (2.5) (1.6)
Interest on finance leases (0.4) (0.6)
Interest on short-term borrowings (3.3) (2.8)
Interest income 0.9 0.9
Cost of debt (5.3) (4.0)
Income from investments - -
Net cost of debt (5.3) (4.0)
Other financial income 0.4 -
Other financial expenses (2.7) (1.9)
Other financial income and expenses (2.3) (1.9)
Net financial expense (7.6) (5.9)
The cost of net debt was €5.3 million, 31% more than the 2013 figure. This increase corresponds to the increase in net debt, which rose from €78 million at the end of 2013 to €137 million at the end of 2014. Other financial items amounted to a €2.3 million expense, which primarily consisted in bank charges and foreign exchange gains and losses. An assessment of the interest rate and currency risk management process is set out in Notes 4.16.3.2 and 4.16.3.3.
3.6. Corporate income tax
(€m) 2014 2013
Taxes due (11.7) (7.6)
Deferred tax 1.0 (0.4)
Total taxes (10.7) (8.0)
The reconciliation between theoretical income tax, as calculated by applying the tax rate in effect in France (33.33% in 2014) to pre-tax income, and the actual tax charge is as follows:
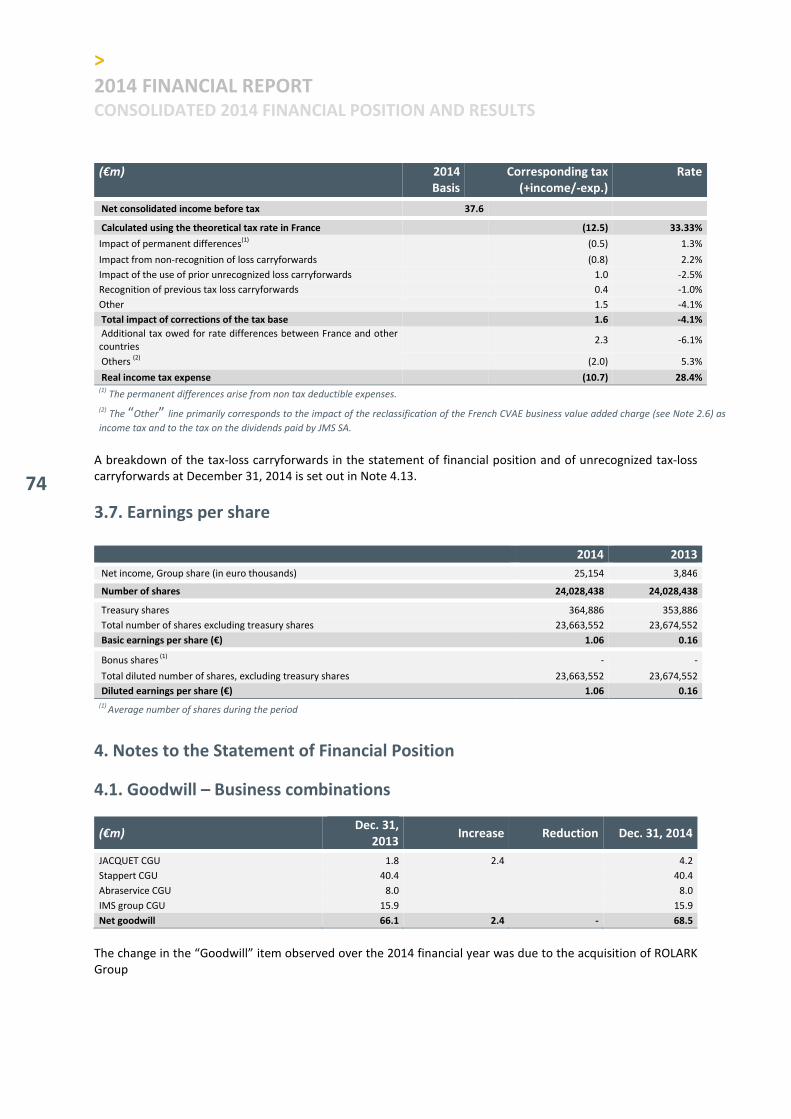
>
2014 FINANCIAL REPORT CONSOLIDATED 2014 FINANCIAL POSITION AND RESULTS
74
(€m) 2014
Basis
Corresponding tax
(+income/-exp.)
Rate
Net consolidated income before tax 37.6
Calculated using the theoretical tax rate in France (12.5) 33.33%
Impact of permanent differences(1) (0.5) 1.3%
Impact from non-recognition of loss carryforwards (0.8) 2.2%
Impact of the use of prior unrecognized loss carryforwards 1.0 -2.5%
Recognition of previous tax loss carryforwards 0.4 -1.0%
Other 1.5 -4.1%
Total impact of corrections of the tax base 1.6 -4.1%
Additional tax owed for rate differences between France and other countries
2.3 -6.1%
Others (2) (2.0) 5.3%
Real income tax expense (10.7) 28.4% (1)
The permanent differences arise from non tax deductible expenses.
(2) The “Other” line primarily corresponds to the impact of the reclassification of the French CVAE business value added charge (see Note 2.6) as
income tax and to the tax on the dividends paid by JMS SA.
A breakdown of the tax-loss carryforwards in the statement of financial position and of unrecognized tax-loss carryforwards at December 31, 2014 is set out in Note 4.13.
3.7. Earnings per share
2014 2013
Net income, Group share (in euro thousands) 25,154 3,846
Number of shares 24,028,438 24,028,438
Treasury shares 364,886 353,886
Total number of shares excluding treasury shares 23,663,552 23,674,552
Basic earnings per share (€) 1.06 0.16
Bonus shares (1) - -
Total diluted number of shares, excluding treasury shares 23,663,552 23,674,552
Diluted earnings per share (€) 1.06 0.16
(1) Average number of shares during the period
4. Notes to the Statement of Financial Position
4.1. Goodwill – Business combinations
(€m) Dec. 31,
2013 Increase Reduction Dec. 31, 2014
JACQUET CGU 1.8 2.4 4.2
Stappert CGU 40.4 40.4
Abraservice CGU 8.0 8.0
IMS group CGU 15.9 15.9
Net goodwill 66.1 2.4 - 68.5
The change in the “Goodwill” item observed over the 2014 financial year was due to the acquisition of ROLARK Group
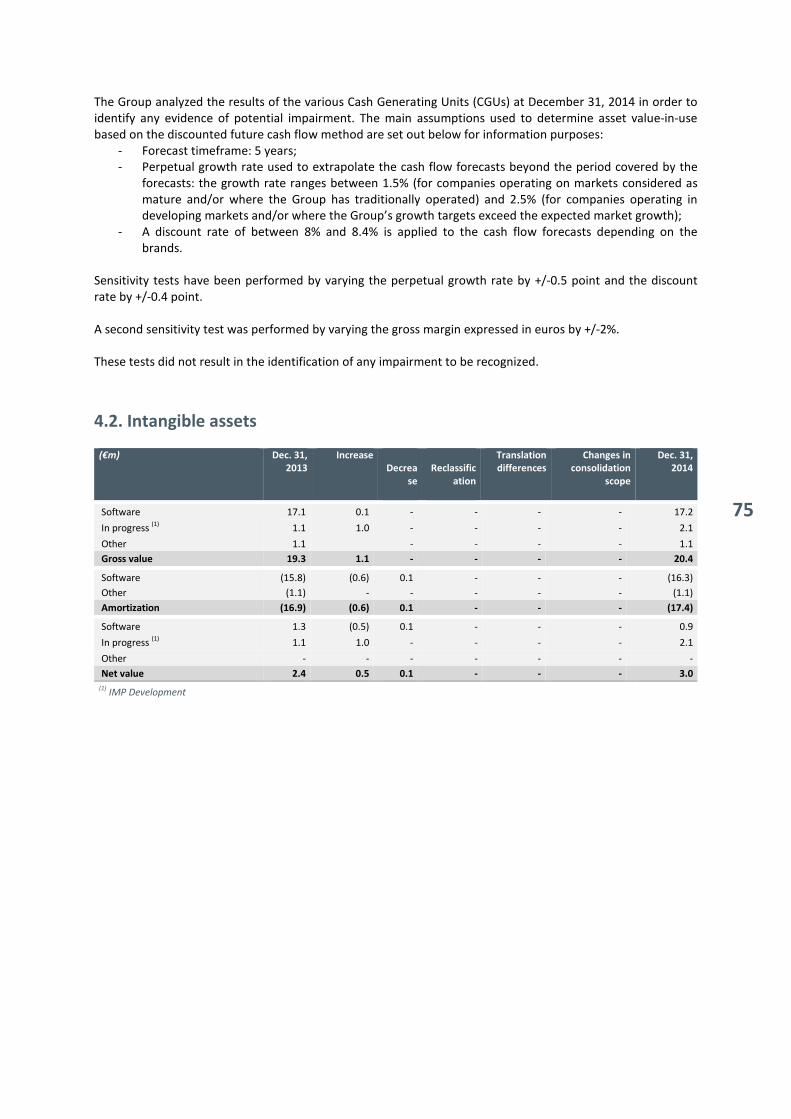
75
The Group analyzed the results of the various Cash Generating Units (CGUs) at December 31, 2014 in order to identify any evidence of potential impairment. The main assumptions used to determine asset value-in-use based on the discounted future cash flow method are set out below for information purposes:
- Forecast timeframe: 5 years; - Perpetual growth rate used to extrapolate the cash flow forecasts beyond the period covered by the
forecasts: the growth rate ranges between 1.5% (for companies operating on markets considered as mature and/or where the Group has traditionally operated) and 2.5% (for companies operating in developing markets and/or where the Group’s growth targets exceed the expected market growth);
- A discount rate of between 8% and 8.4% is applied to the cash flow forecasts depending on the brands.
Sensitivity tests have been performed by varying the perpetual growth rate by +/-0.5 point and the discount rate by +/-0.4 point. A second sensitivity test was performed by varying the gross margin expressed in euros by +/-2%. These tests did not result in the identification of any impairment to be recognized.
4.2. Intangible assets
(€m) Dec. 31, 2013
Increase
Decrea
se
Reclassific
ation
Translation
differences
Changes in
consolidation
scope
Dec. 31, 2014
Software 17.1 0.1 - - - - 17.2
In progress (1) 1.1 1.0 - - - - 2.1
Other 1.1 - - - - 1.1
Gross value 19.3 1.1 - - - - 20.4
Software (15.8) (0.6) 0.1 - - - (16.3)
Other (1.1) - - - - - (1.1)
Amortization (16.9) (0.6) 0.1 - - - (17.4)
Software 1.3 (0.5) 0.1 - - - 0.9
In progress (1) 1.1 1.0 - - - - 2.1
Other - - - - - - -
Net value 2.4 0.5 0.1 - - - 3.0
(1) IMP Development

>
2014 FINANCIAL REPORT CONSOLIDATED 2014 FINANCIAL POSITION AND RESULTS
76
4.3. Tangible fixed assets
(€m) Dec. 31,
2013
Increase
Decrea
se
Reclassif
ication
Translation
differences
Changes in
consolidation
scope
Dec. 31, 2014
Land 12.2 - - - - - 12.2
Leased land 2.1 - - - - - 2.1
Buildings 71.9 0.9 (0.0) 6.4 0.1 0.3 79.6
Leased buildings 14.9 - - (6.1) - - 8.8
Equipment, tools & technical installations
116.7 8.1 (2.0) 0.1 1.1 2.8 126.8
Leased equipment, tools & technical installations
18.8 0.5 (0.4) 0.1 0.0 - 19.1
Transport equipment 6.1 1.0 (0.7) 0.1 0.1 0.5 7.0
Leased transport equipment 0.8 0.0 (0.2) - 0.0 - 0.7
Computer equipment 6.8 0.2 (0.5) 0.5 (0.0) 0.1 7.1
Leased computer equipment - - - - (0.0) - (0.0)
Other property, plant and equipment 20.2 1.6 (0.6) (0.2) (0.0) - 21.0
Other leased PP&E 0.7 - (0.0) (0.0) - - 0.7
PP&E in progress 1.4 1.0 - (0.8) 0.0 - 1.6
Advance payments 0.1 0.3 (0.1) - - - 0.3
Total gross value 272.7 13.7 (4.4) 0.0 1.3 3.6 286.9
Buildings (35.8) (2.8) 0.0 (2.7) (0.1) (0.2) (41.6)
Leased buildings (5.9) (0.3) 0.0 2.7 - - (3.5)
Equipment, tools & technical installations
(89.7) (6.7) 1.9 (0.0) (0.6) (1.4) (96.4)
Leased equipment, tools & technicalinstallations
(14.8) (1.2) 0.4 (0.0) 0.0 - (15.6)
Transport equipment (3.7) (0.8) 0.6 (0.1) (0.1) (0.3) (4.4) Leased transport equipment (0.7) (0.0) 0.1 (0.0) 0.0 - (0.6)
Computer equipment (6.4) (0.3) 0.5 (0.1) (0.0) (0.1) (6.3)
Leased computer equipment - - - - 0.0 - 0.0
Other property, plant and equipment (17.1) (0.9) 0.6 0.2 (0.1) - (17.3)
Other leased PP&E (0.5) (0.0) 0.0 (0.0) 0.0 - (0.5)
Total depreciation (174.7) (13.1) 4.2 (0.0) (0.8) (1.9) (186.3)
Land (1.0) (0.4) - - 0.0 (1.4)
Buildings (0.5) - - - - - (0.5)
Equipment and technical installations (2.1) 0.4 - 0.0 - (1.7)
Total provisions (3.6) (0.4) 0.4 - 0.0 - (3.6)
Net book value 94.4 0.2 0.1 0.0 0.5 1.7 97.0
Capital expenditure (including finance leases) amounted to €13.7 million in 2014. The “decreases” primarily correspond to disposals of equipment and tools. “Changes in consolidation scope” correspond to the assets acquired as a result of the acquisition of the ROLARK Group companies.
4.4. Other financial assets This item primarily corresponds to deposits and guarantees and receivables maturing in more than one year.
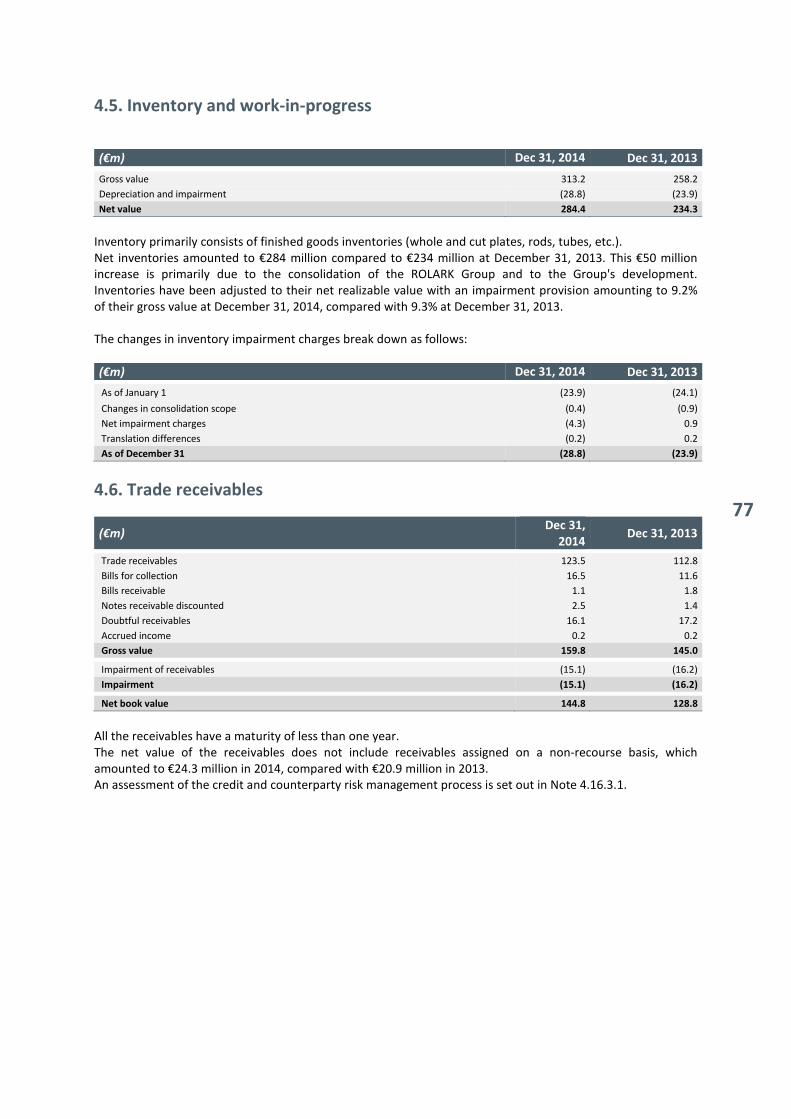
77
4.5. Inventory and work-in-progress
(€m) Dec 31, 2014 Dec 31, 2013
Gross value 313.2 258.2
Depreciation and impairment (28.8) (23.9)
Net value 284.4 234.3
Inventory primarily consists of finished goods inventories (whole and cut plates, rods, tubes, etc.). Net inventories amounted to €284 million compared to €234 million at December 31, 2013. This €50 million increase is primarily due to the consolidation of the ROLARK Group and to the Group's development. Inventories have been adjusted to their net realizable value with an impairment provision amounting to 9.2% of their gross value at December 31, 2014, compared with 9.3% at December 31, 2013. The changes in inventory impairment charges break down as follows:
(€m) Dec 31, 2014 Dec 31, 2013
As of January 1 (23.9) (24.1)
Changes in consolidation scope (0.4) (0.9)
Net impairment charges (4.3) 0.9
Translation differences (0.2) 0.2
As of December 31 (28.8) (23.9)
4.6. Trade receivables
(€m) Dec 31,
2014 Dec 31, 2013
Trade receivables 123.5 112.8
Bills for collection 16.5 11.6
Bills receivable 1.1 1.8
Notes receivable discounted 2.5 1.4
Doubtful receivables 16.1 17.2
Accrued income 0.2 0.2
Gross value 159.8 145.0
Impairment of receivables (15.1) (16.2)
Impairment (15.1) (16.2)
Net book value 144.8 128.8
All the receivables have a maturity of less than one year. The net value of the receivables does not include receivables assigned on a non-recourse basis, which amounted to €24.3 million in 2014, compared with €20.9 million in 2013. An assessment of the credit and counterparty risk management process is set out in Note 4.16.3.1.

>
2014 FINANCIAL REPORT CONSOLIDATED 2014 FINANCIAL POSITION AND RESULTS
78
Changes in the impairment of trade receivables broke down as follows:
(€m) Dec 31,
2014 Dec 31, 2013
As of January 1 (16.2) (17.4)
Changes in consolidation scope (0.1) (0.3)
Charges (1.1) (1.8)
Reversals 2.3 3.0
Other 0.3
As of December 31 (15.1) (16.2)
4.7. Current tax assets Current tax assets amounted to €3 million at December 31, 2014. The balance of the existing carry-back receivable for the consolidated French companies, i.e. €0.9 million, was used in 2014. The balance of the item corresponds to amounts that are non-material on an individual basis.
4.8. Other assets
(€m) Dec 31,
2014 Dec 31, 2013
Advances and down payments on orders 2.2 1.9
Tax receivables 3.3 4.8
Other assets 4.8 3.2
Prepaid expenses 3.2 3.2
Gross value 13.5 13.1
“Tax receivables” correspond to receivables other than corporate income tax (primarily VAT). All of the receivables have a maturity of less than one year.
4.9. Cash and cash equivalents
(€m) Dec 31, 2014 Dec 31, 2013
Cash 43.7 41.7
Cash equivalents 19.5 19.7
Cash and cash equivalents 63.2 61.4
“Cash equivalents” primarily consist of term deposits. An assessment of the interest-rate risk management process for balance sheet assets is set out in Note 4.16.3.2.
4.10. Shareholders' equity
The statement of changes in shareholders’ equity is set out in the section on “Changes in consolidated shareholders’ equity”.
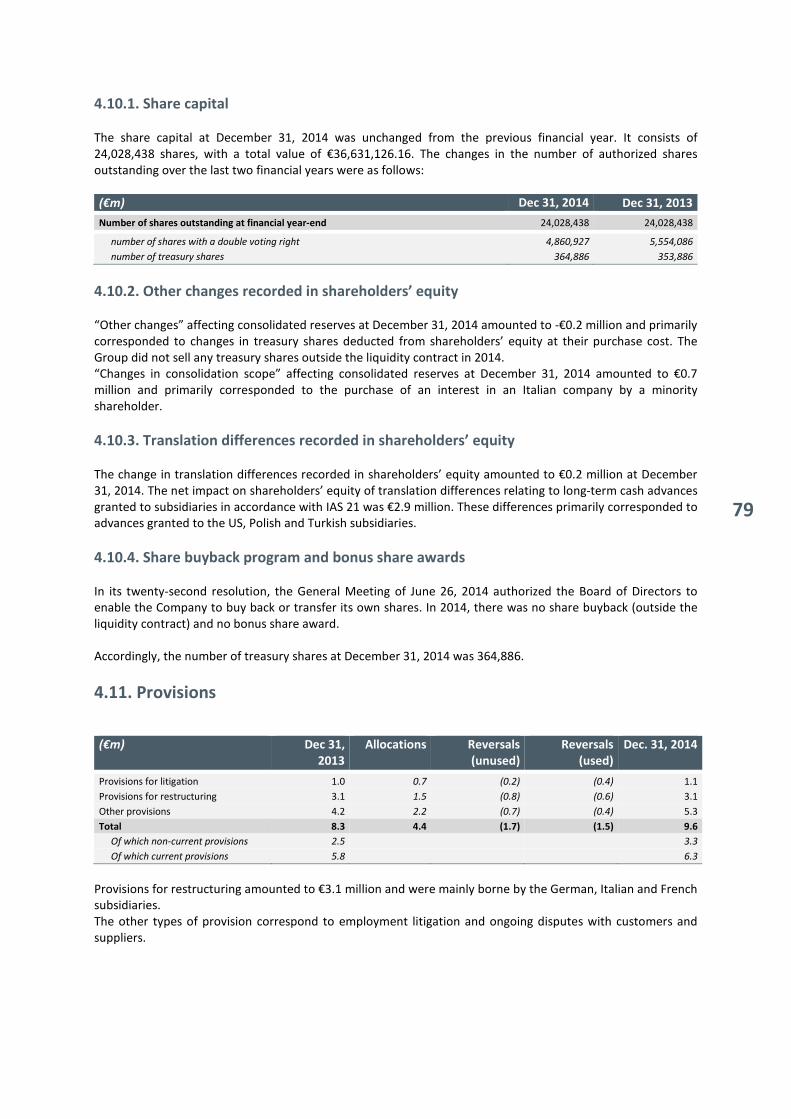
79
4.10.1. Share capital The share capital at December 31, 2014 was unchanged from the previous financial year. It consists of 24,028,438 shares, with a total value of €36,631,126.16. The changes in the number of authorized shares outstanding over the last two financial years were as follows:
(€m) Dec 31, 2014 Dec 31, 2013
Number of shares outstanding at financial year-end 24,028,438 24,028,438
number of shares with a double voting right 4,860,927 5,554,086
number of treasury shares 364,886 353,886
4.10.2. Other changes recorded in shareholders’ equity “Other changes” affecting consolidated reserves at December 31, 2014 amounted to -€0.2 million and primarily corresponded to changes in treasury shares deducted from shareholders’ equity at their purchase cost. The Group did not sell any treasury shares outside the liquidity contract in 2014. “Changes in consolidation scope” affecting consolidated reserves at December 31, 2014 amounted to €0.7 million and primarily corresponded to the purchase of an interest in an Italian company by a minority shareholder.
4.10.3. Translation differences recorded in shareholders’ equity The change in translation differences recorded in shareholders’ equity amounted to €0.2 million at December 31, 2014. The net impact on shareholders’ equity of translation differences relating to long-term cash advances granted to subsidiaries in accordance with IAS 21 was €2.9 million. These differences primarily corresponded to advances granted to the US, Polish and Turkish subsidiaries.
4.10.4. Share buyback program and bonus share awards In its twenty-second resolution, the General Meeting of June 26, 2014 authorized the Board of Directors to enable the Company to buy back or transfer its own shares. In 2014, there was no share buyback (outside the liquidity contract) and no bonus share award. Accordingly, the number of treasury shares at December 31, 2014 was 364,886.
4.11. Provisions
(€m) Dec 31,
2013
Allocations Reversals
(unused)
Reversals
(used)
Dec. 31, 2014
Provisions for litigation 1.0 0.7 (0.2) (0.4) 1.1
Provisions for restructuring 3.1 1.5 (0.8) (0.6) 3.1
Other provisions 4.2 2.2 (0.7) (0.4) 5.3
Total 8.3 4.4 (1.7) (1.5) 9.6
Of which non-current provisions 2.5 3.3
Of which current provisions 5.8 6.3
Provisions for restructuring amounted to €3.1 million and were mainly borne by the German, Italian and French subsidiaries. The other types of provision correspond to employment litigation and ongoing disputes with customers and suppliers.
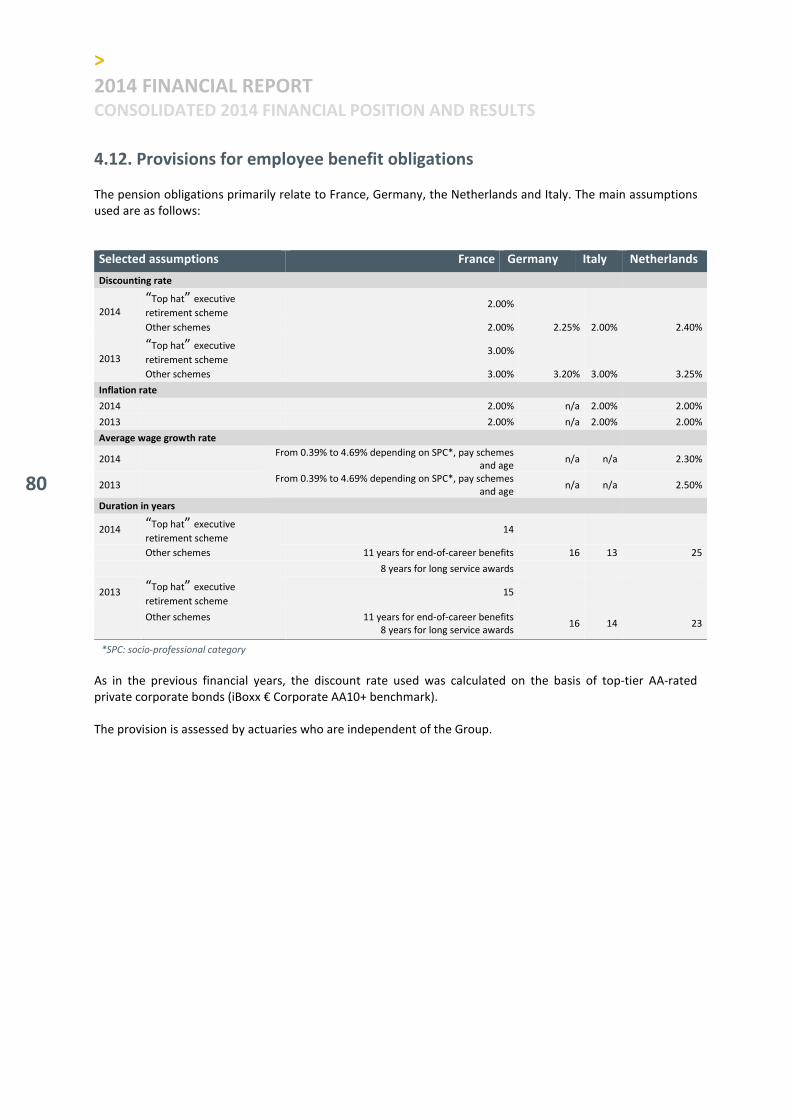
>
2014 FINANCIAL REPORT CONSOLIDATED 2014 FINANCIAL POSITION AND RESULTS
80
4.12. Provisions for employee benefit obligations The pension obligations primarily relate to France, Germany, the Netherlands and Italy. The main assumptions used are as follows:
Selected assumptions France Germany Italy Netherlands
Discounting rate
2014 “Top hat” executive
retirement scheme 2.00%
Other schemes 2.00% 2.25% 2.00% 2.40%
2013 “Top hat” executive
retirement scheme 3.00%
Other schemes 3.00% 3.20% 3.00% 3.25%
Inflation rate
2014 2.00% n/a 2.00% 2.00%
2013 2.00% n/a 2.00% 2.00%
Average wage growth rate
2014 From 0.39% to 4.69% depending on SPC*, pay schemes
and age n/a n/a 2.30%
2013 From 0.39% to 4.69% depending on SPC*, pay schemes
and age n/a n/a 2.50%
Duration in years
2014 “Top hat” executive
retirement scheme 14
Other schemes 11 years for end-of-career benefits 16 13 25
8 years for long service awards
2013 “Top hat” executive
retirement scheme 15
Other schemes
11 years for end-of-career benefits 8 years for long service awards
16 14 23
*SPC: socio-professional category
As in the previous financial years, the discount rate used was calculated on the basis of top-tier AA-rated private corporate bonds (iBoxx € Corporate AA10+ benchmark). The provision is assessed by actuaries who are independent of the Group.

81
(€m) Dec. 31, 2014
Dec.
31,
2013
France Germany
Italy Other countries
Total Total
Opening reconciliation of financial position
1 Opening actuarial debt (DBO) (20.1) (16.4) (1.3) (7.9) (45.7) (41.9)
2 Opening fair value of insurance fund assets 0.4 1.8 - 5.8 8.0 8.4
3 Opening financial position (1)+(2) (19.7) (14.6) (1.3) (2.1) (37.7) (33.5)
4 Unfunded cost of past services
5 Unfunded actuarial (gains)/losses
6 (Restated provision)/Prepaid amount at opening (3)+(4)+(5) (19.7) (14.6) (1.3) (2.1) (37.7) (33.5)
Expenses for the financial year
1 Cost of services 0.3 0.2 0.1 0.7 1.3 1.1
2 Cost of interest 0.6 0.5 - 0.2 1.3 1.3
3 Anticipated return of insurance funds (0.0) (0.1) - (0.2) (0.3) (0.3)
4 Expense for the financial year = aggregate of (1) to (3) 0.9 0.7 0.1 0.7 2.3 2.1
(Provision) / Prepaid amount at the closing date
1 (Restated provision)/Prepaid amount at opening (19.7) (14.6) (1.3) (2.1) (37.7) (33.5)
2 Expenses for the financial year (0.9) (0.7) (0.1) (0.7) (2.3) (2.1)
3 Benefits paid by the employer 0.8 1.0 0.2 0.1 1.9 2.1
4 Employer contributions - 0.4 - 0.3 0.6 (0.1)
5 Employee contributions - 0.0 - - 0.0 0.1
6 Additions to scope/Liquidation of schemes - - - - - 4.8
7 Other - - - 0.3 0.3 -
8 Actuarial differences generated over the financial year (3.5) (2.1) (0.1) (0.3) (5.9) 0.6
9 (Provision)/Prepaid amount at closing = aggregate of (1) to (8) (23.3) (16.0) (1.4) (2.4) (43.1) (37.7)
Closing reconciliation of financial position
1 Closing actuarial debt (DBO) (23.7) (18.3) (1.4) (10.4) (53.7) (45.7)
2 Closing fair value of insurance fund assets 0.4 2.3 - 8.0 10.6 8.0
3 Financial position (1)+(2) (23.3) (16.0) (1.4) (2.4) (43.1) (37.7)
4 Unfunded cost of past services - - - - -
5 Unfunded actuarial (gains)/losses - - - - -
6 (Provision)/Prepaid amount at closing (3)+(4)+(5) (23.3) (16.0) (1.4) (2.4) (43.1) (37.7)
Change in actuarial debt (DBO)
1 Opening actuarial debt (DBO) (20.1) (16.4) (1.3) (7.9) (45.7) (41.9)
2 Cost of services (0.3) (0.2) (0.1) (0.7) (1.3) (1.1)
3 Cost of interest (0.6) (0.5) - (0.2) (1.3) (1.3)
4 Benefits paid by the employer 0.8 1.0 0.2 0.1 2.0 1.9
5 Employee contributions - - - (0.1) (0.1) (0.1)
6 Additions to scope/Liquidation of schemes - - - - - (4.8)
7 Other - (0.1) - - (0.1)
8 (Gains)/Losses generated during the year (3.4) (2.0) (0.1) (1.5) (7.1) 1.7
9 Actuarial debt (DBO) at closing date = aggregate of (1) to (7) (23.7) (18.3) (1.4) (10.4) (53.7) (45.7)
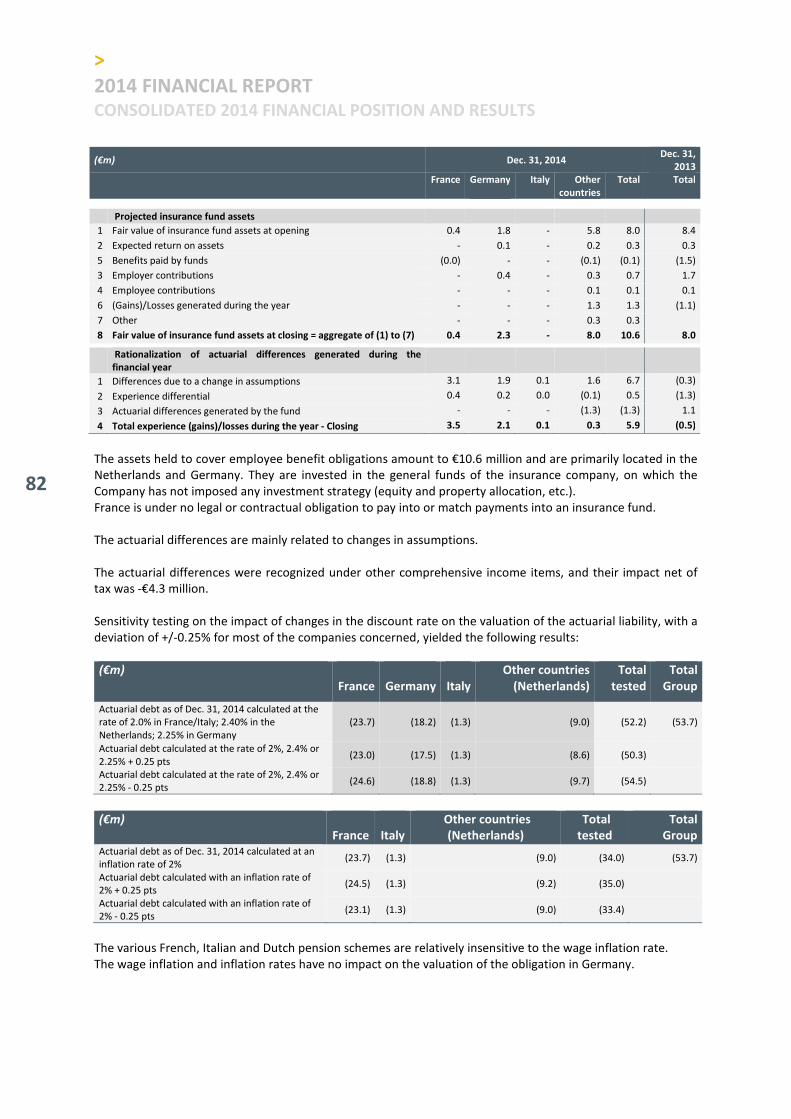
>
2014 FINANCIAL REPORT CONSOLIDATED 2014 FINANCIAL POSITION AND RESULTS
82
(€m) Dec. 31, 2014 Dec. 31,
2013
France Germany
Italy Other countries
Total Total
Projected insurance fund assets
1 Fair value of insurance fund assets at opening 0.4 1.8 - 5.8 8.0 8.4
2 Expected return on assets - 0.1 - 0.2 0.3 0.3
5 Benefits paid by funds (0.0) - - (0.1) (0.1) (1.5)
3 Employer contributions - 0.4 - 0.3 0.7 1.7
4 Employee contributions - - - 0.1 0.1 0.1
6 (Gains)/Losses generated during the year - - - 1.3 1.3 (1.1)
7 Other - - - 0.3 0.3
8 Fair value of insurance fund assets at closing = aggregate of (1) to (7) 0.4 2.3 - 8.0 10.6 8.0
Rationalization of actuarial differences generated during the
financial year
1 Differences due to a change in assumptions 3.1 1.9 0.1 1.6 6.7 (0.3)
2 Experience differential 0.4 0.2 0.0 (0.1) 0.5 (1.3)
3 Actuarial differences generated by the fund - - - (1.3) (1.3) 1.1
4 Total experience (gains)/losses during the year - Closing 3.5 2.1 0.1 0.3 5.9 (0.5)
The assets held to cover employee benefit obligations amount to €10.6 million and are primarily located in the Netherlands and Germany. They are invested in the general funds of the insurance company, on which the Company has not imposed any investment strategy (equity and property allocation, etc.). France is under no legal or contractual obligation to pay into or match payments into an insurance fund. The actuarial differences are mainly related to changes in assumptions. The actuarial differences were recognized under other comprehensive income items, and their impact net of tax was -€4.3 million. Sensitivity testing on the impact of changes in the discount rate on the valuation of the actuarial liability, with a deviation of +/-0.25% for most of the companies concerned, yielded the following results: (€m)
France
Germany
Italy
Other countries
(Netherlands)
Total
tested
Total
Group
Actuarial debt as of Dec. 31, 2014 calculated at the rate of 2.0% in France/Italy; 2.40% in the Netherlands; 2.25% in Germany
(23.7) (18.2) (1.3) (9.0) (52.2) (53.7)
Actuarial debt calculated at the rate of 2%, 2.4% or 2.25% + 0.25 pts
(23.0) (17.5) (1.3) (8.6) (50.3)
Actuarial debt calculated at the rate of 2%, 2.4% or 2.25% - 0.25 pts
(24.6) (18.8) (1.3) (9.7) (54.5)
(€m)
France
Italy
Other countries
(Netherlands)
Total
tested
Total
Group
Actuarial debt as of Dec. 31, 2014 calculated at an inflation rate of 2%
(23.7) (1.3) (9.0) (34.0) (53.7)
Actuarial debt calculated with an inflation rate of 2% + 0.25 pts
(24.5) (1.3) (9.2) (35.0)
Actuarial debt calculated with an inflation rate of 2% - 0.25 pts
(23.1) (1.3) (9.0) (33.4)
The various French, Italian and Dutch pension schemes are relatively insensitive to the wage inflation rate. The wage inflation and inflation rates have no impact on the valuation of the obligation in Germany.

83
The estimated benefit payment schedule over the next three years provides for the following expenses: €1 million in France, €0.1 million in the Netherlands, €0.4 million for the most important subsidiary in Germany and €0.1 million in Italy.
4.13. Deferred tax The origin of deferred tax is as follows: (€m) Dec. 31,
2014
Dec. 31, 2013
Temporary differences 16.6 13.9
Tax losses carried forward 13.3 15.6
Other IFRS restatements 1.6 1.6
Deferred tax assets 31.5 31.1
Temporary differences (2.5) (2.6)
Other IFRS restatements (4.9) (5.2)
Deferred tax liabilities (7.4) (7.8)
The change in deferred tax on tax-loss carryforwards broke down as follows: (€m) Dec. 31,
2014
Dec. 31, 2013
As of January 1 15.6 18.6
Recognition - 0.7
Utilized amounts (3.0) (2.6)
Derecognition (0.1) (1.2)
Translation differences 0.1 -
Reclassification/Others 0.6 0.1
Change in consolidation 0.1 -
As of December 31 13.3 15.6
Unused deferred tax on tax-loss carryforwards amounted to €26.2 million (mainly for subsidiaries in Italy, US and China).

>
2014 FINANCIAL REPORT CONSOLIDATED 2014 FINANCIAL POSITION AND RESULTS
84
4.14. Financial debt
(€m) Dec. 31,
2014 < 1 year
from 1 to 5
years > 5 years
Dec. 31,
2013
Financial leasing liabilities > 1 year 11.6 4.0 7.5 11.9
Long-term borrowings > 1 year 44.2 38.0 6.2 23.8
Long-term borrowings 55.8 - 42.0 13.8 35.7
Financial leasing liabilities < 1 year 1.3 1.3 1.7
Long-term borrowings < 1 year 81.5 81.5 54.1
Bank overdrafts, factoring, discounting 61.4 61.4 48.1
Accrued interest 0.5 0.5 0.1
Short-term borrowings 144.7 144.7 - - 104.0
Liabilities held for transfer -
Total borrowings 200.5 144.7 42.0 13.8 139.7
An assessment of interest rate and liquidity risk is set out in Note 4.16.3.2. Short-term debt repayment schedule
(€m) Dec. 31, 2014
Less than one month 117.0
From 1 to 3 months 1.8
From 3 to 12 months 25.9
Total 144.7
Change in borrowings
(€m)
As of December 31, 2013 139.7
New borrowings (including finance leases) 38.8
Repayment of long-term borrowings and finance leases (14.2)
Change in bank overdrafts, discounts and credit facilities 30.6
Change in consolidation 4.1
Translation differences and other items 1.5
As of December 31, 2014 200.5
€14 million of the syndicated loan facility had been drawn down at December 31, 2014. Since this facility is a revolving loan, it is classified under short-term borrowings. Other new borrowings amounted to €39 million and corresponded to new financing arranged for the subsidiaries, primarily in France, Germany, and Belgium.
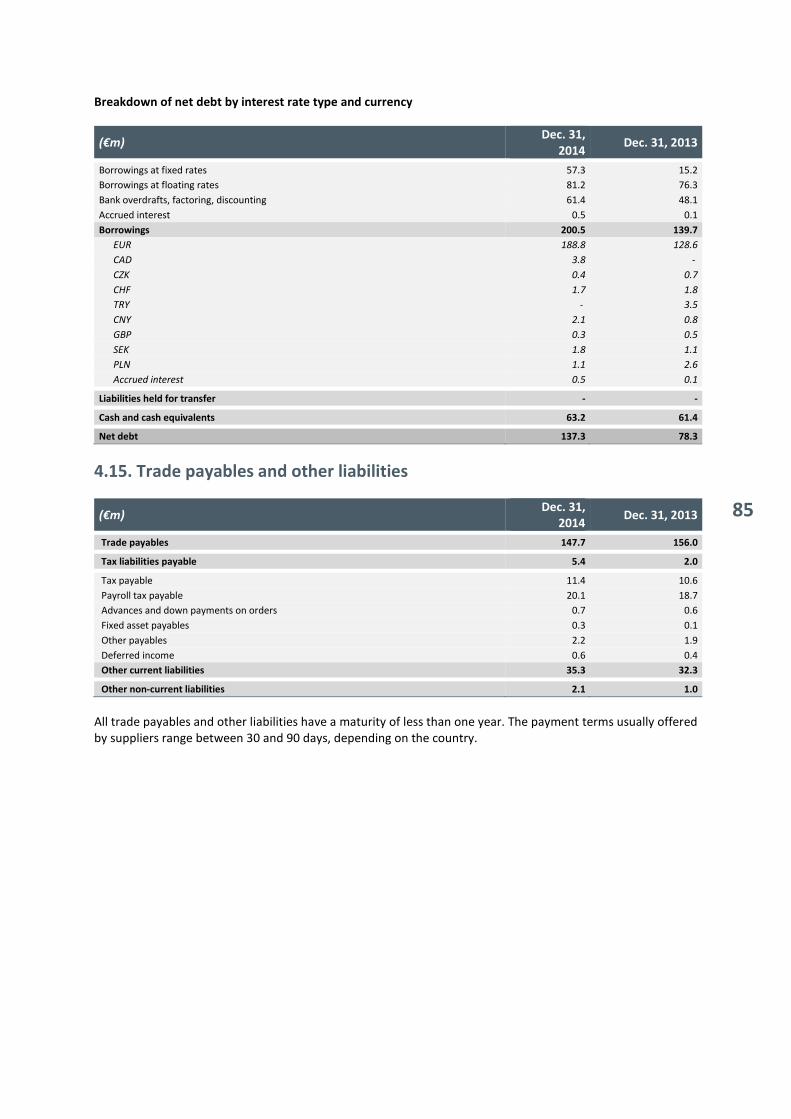
85
Breakdown of net debt by interest rate type and currency
(€m) Dec. 31,
2014 Dec. 31, 2013
Borrowings at fixed rates 57.3 15.2
Borrowings at floating rates 81.2 76.3
Bank overdrafts, factoring, discounting 61.4 48.1
Accrued interest 0.5 0.1
Borrowings 200.5 139.7
EUR 188.8 128.6
CAD 3.8 -
CZK 0.4 0.7
CHF 1.7 1.8
TRY - 3.5
CNY 2.1 0.8
GBP 0.3 0.5
SEK 1.8 1.1
PLN 1.1 2.6
Accrued interest 0.5 0.1
Liabilities held for transfer - -
Cash and cash equivalents 63.2 61.4
Net debt 137.3 78.3
4.15. Trade payables and other liabilities
(€m) Dec. 31,
2014 Dec. 31, 2013
Trade payables 147.7 156.0
Tax liabilities payable 5.4 2.0
Tax payable 11.4 10.6
Payroll tax payable 20.1 18.7
Advances and down payments on orders 0.7 0.6
Fixed asset payables 0.3 0.1
Other payables 2.2 1.9
Deferred income 0.6 0.4
Other current liabilities 35.3 32.3
Other non-current liabilities 2.1 1.0
All trade payables and other liabilities have a maturity of less than one year. The payment terms usually offered by suppliers range between 30 and 90 days, depending on the country.

>
2014 FINANCIAL REPORT CONSOLIDATED 2014 FINANCIAL POSITION AND RESULTS
86
4.16. Financial instruments
4.16.1. Financial assets Dec. 31, 2014 Statement
of financial
position
total
Current Non-
current
Breakdown per category of instruments
(€m)
Fair
value
through
income
Derivative
instruments at fair value
through
income
Derivative
instruments at
fair value in items of other
comprehensive
income
Securities
available for
sale
Loans and
receivable
s at
amortized
cost
Non-current financial assets 3.6 - 3.6 - - - 3.6
Trade receivables 144.8 144.8 - - - - 144.8
Other assets 13.5 13.5 - - - - 13.5
Derivatives 0.5 0.5 - - 0.1 0.4 - -
Cash and cash equivalents 63.2 63.2 - 63.2 - - -
Total financial assets 225.6 222.0 3.6 63.2 0.1 0.4 - 161.9
Dec. 31, 2013 Statement
of financial
position
total
Current Non-
current
Breakdown per category of instruments
(€m)
Fair
value
through
income
Derivative
instruments at their fair
value through
income
Derivative
instruments at
their fair value by
other items from
comprehensive
income
Securities
available for
sale
Loans and
receivable
s at
amortized
cost
Non-current financial assets 3.7 - 3.7 - - - 3.7
Trade receivables 128.8 128.8 - - - - 128.8
Other assets 13.1 13.1 - - - - 13.1
Derivatives 0.1 0.1 - - 0.1 - -
Cash and cash equivalents 61.4 61.4 - 61.4 - - -
Total financial assets 207.1 203.4 3.7 61.4 0.1 - - 145.6
4.16.1.1. Loans and receivables at amortized cost
(€m) 2014 2013
Gross
Impairment
Net Gross
Impairment
Net
Other non-current financial assets 4.1 0.5 3.6 3.9 0.2 3.7
Trade receivables 159.8 15.1 144.7 145.0 16.2 128.8
Other assets 13.5 13.5 13.1 - 13.1
Total 177.4 15.6 161.8 162.0 16.4 145.6
4.16.1.2. Financial assets at fair value through income
(€m) 2014 2013
Current Non-current Current Non-current
Derivatives 0.5 - 0.1 -
Cash and cash equivalents 63.2 - 61.4 -
Total 63.7 - 61.5 -

87
Financial derivatives classified as liabilities at December 31, 2014 are shown in Note 4.16.4. The Group uses hedge accounting when the effectiveness of a hedge can be demonstrated. Where this is not the case, the Group recognizes all changes in the fair value of hedging instruments through income. In 2014 this amounted to a €0.1 million gain. 4.16.1.3. Fair value of financial assets
Dec. 31, 2014 (€m)
Quoted
price
Model with
observable
data
Model with
non-
observable
data
Fair value Statement
of financial
position
Non-current financial assets - - 3.6 3.6 3.6
Trade receivables - 144.8 - 144.8 144.8
Other assets - 13.5 - 13.5 13.5
Derivatives 0.5 - - 0.5 0.5
Cash and cash equivalents 63.2 - - 63.2 63.2
Total financial assets 63.7 158.3 3.6 225.6 225.6
Dec. 31, 2013 (€m)
Quoted
price
Model with
observable
data
Model with
non-
observable
data
Fair value Statement
of financial
position
Non-current financial assets - - 3.7 3.7 3.7
Trade receivables - 128.8 - 128.8 128.8
Other assets - 13.1 - 13.1 13.1
Derivatives 0.1 - - 0.1 0.1
Cash and cash equivalents 61.4 - - 61.4 61.4
Total financial assets 61.5 141.9 3.7 207.1 207.1
4.16.1.4. Changes in impairment of financial assets
(€m) Dec. 31,
2013
Change in
scope
Impairment
losses
Foreign
exchange
differences
Reclassif
ications
Net
amortization
expenses
Dec. 31,
2014
Impairment of non-current
financial assets 0.2 - - - - 0.2 0.4
Impairment of trade
receivables 16.2 0.1 - - (1.2) 15.1
Total 16.4 0.1 - - - (1.0) 15.5
(€m) Dec 31,
2012
Change in
scope
Impairment
losses
Foreign
exchange
differences
Reclassif
ications
Net
amortization
expenses
Dec. 31,
2013
Impairment of non-current
financial assets 0.2 - - - - - 0.2
Impairment of trade
receivables 17.4 0.3 - (0.3) - (1.2) 16.2
Total 17.6 0.3 - (0.3) - (1.2) 16.4

>
2014 FINANCIAL REPORT CONSOLIDATED 2014 FINANCIAL POSITION AND RESULTS
88
4.16.2. Financial liabilities
Dec. 31, 2014 Statement of
financial
position total
Current
Non-
current
Breakdown per category of instruments
(€m)
Fair value
through
income
Derivative
instruments at fair value
through
income
Derivative
instruments at fair value
in items of other
comprehensive
income
Loans and
receivables at
amortized cost
Other non-current liabilities
2.1 - 2.1 - - - 2.1
Borrowings 200.5 144.7 55.8 - - - 200.5
Trade payables 147.7 147.7 - - - - 147.7
Derivatives - - - - - - -
Other liabilities 35.3 35.3 - - - - 35.3
Total financial
liabilities 385.6 327.7 57.9 - - - 385.6
Dec. 31, 2013 Statement of
financial
position total
Current
Non-
current
Breakdown per category of instruments
(€m)
Fair value
through
income
Derivative
instruments at fair value
through
income
Derivative
instruments at fair value
in items of other
comprehensive
income
Loans and
receivables at
amortized cost
Other non-current liabilities
1.0 - 1.0 - - - 1.0
Borrowings 139.7 104.0 35.7 - - - 139.7
Trade payables 156.0 156.0 - - - - 156.0
Derivatives 0.2 0.2 - - 0.1 0.1 -
Other liabilities 32.3 32.3 - - - - 32.3
Total financial
liabilities 329.2 292.5 36.7 - 0.1 329.0
All the Group’s liabilities were valued at amortized cost at December 31, 2014.
4.16.2.1. Financial debt
The components of borrowings are set out in Note 4.14. An assessment of the liquidity risk management process is set out in Note 4.16.3.2.
4.16.2.2. Derivatives
(€m) 2014 2013
Current Non-current Current Non-current
Derivatives - - 0.2 -
Total - - 0.2 -
Financial derivatives classified as liabilities at December 31, 2014 are shown in Note 4.16.4. The Group uses hedge accounting when the effectiveness of a hedge can be demonstrated. In this case, financial derivatives are recognized under other comprehensive income items, which resulted in a change of €0.3 million at December 31, 2014. Where the effectiveness of the hedge cannot be demonstrated, the Group records all changes in the fair value of hedging instruments through income, which generated a gain of €0.1 million in the income reported for the 2014 financial year.

89
An assessment of the interest rate and currency risk management process is set out in Notes 4.16.3.2, 4.16.3.3 and 4.16.4, together with the characteristic features of the hedging agreements.
4.16.2.3. Trade payables and other liabilities
The components of trade payables and other liabilities are set out in Note 4.15. 4.16.2.4. Fair value of financial liabilities
Dec. 31, 2014 (€m)
Quoted
price
Model with
observable
data
Model with
non-
observable
data
Fair value Statement of
financial
position
Other non-current liabilities - 2.1 - 2.1 2.1
Borrowings 200.5 - - 200.5 200.5
Trade payables - 147.7 - 147.7 147.7
Derivatives - - - - -
Other liabilities - 35.3 - 35.3 35.3
Fair value of financial liabilities 200.5 185.1 - 385.6 385.6
Dec. 31, 2013 (€m)
Quoted
price
Model with
observable
data
Model with
non-
observable
data
Fair value Statement of
financial
position
Other non-current liabilities - 1.0 - 1.0 1.0
Borrowings 139.7 - - 139.7 139.7
Trade payables - 156.0 - 156.0 156.0
Derivatives 0.2 - - 0.2 0.2
Other liabilities - 32.3 - 32.3 32.3
Fair value of financial liabilities 139.9 189.3 - 329.2 329.2
4.16.3. Management of risks relating to financial instruments 4.16.3.1. Credit and counterparty ris The Group's exposure to credit and counterparty risk primarily relates to uninsured trade receivables. 87% of trade receivables were insured at December 31, 2014. The Group is not in a position of commercial dependence on its customers. Moreover, the Group is not dependent on a specific supplier and only uses sub-contractors on an occasional basis. All of the receivables have a maturity of less than one year. The payment terms usually offered to customers range between 30 and 90 days, depending on the geographical region.
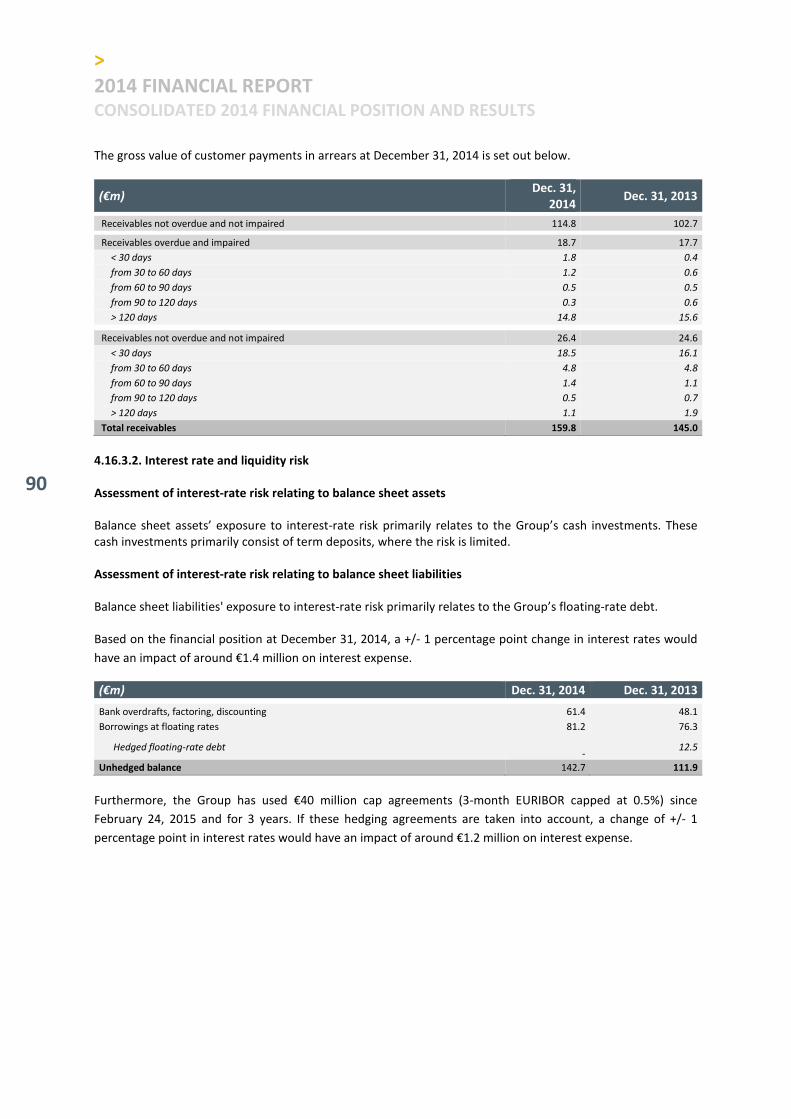
>
2014 FINANCIAL REPORT CONSOLIDATED 2014 FINANCIAL POSITION AND RESULTS
90
The gross value of customer payments in arrears at December 31, 2014 is set out below.
(€m) Dec. 31,
2014 Dec. 31, 2013
Receivables not overdue and not impaired 114.8 102.7
Receivables overdue and impaired 18.7 17.7
< 30 days 1.8 0.4
from 30 to 60 days 1.2 0.6
from 60 to 90 days 0.5 0.5
from 90 to 120 days 0.3 0.6
> 120 days 14.8 15.6
Receivables not overdue and not impaired 26.4 24.6
< 30 days 18.5 16.1
from 30 to 60 days 4.8 4.8
from 60 to 90 days 1.4 1.1
from 90 to 120 days 0.5 0.7
> 120 days 1.1 1.9
Total receivables 159.8 145.0
4.16.3.2. Interest rate and liquidity risk
Assessment of interest-rate risk relating to balance sheet assets
Balance sheet assets’ exposure to interest-rate risk primarily relates to the Group’s cash investments. These cash investments primarily consist of term deposits, where the risk is limited. Assessment of interest-rate risk relating to balance sheet liabilities
Balance sheet liabilities' exposure to interest-rate risk primarily relates to the Group’s floating-rate debt. Based on the financial position at December 31, 2014, a +/- 1 percentage point change in interest rates would
have an impact of around €1.4 million on interest expense.
(€m) Dec. 31, 2014 Dec. 31, 2013
Bank overdrafts, factoring, discounting 61.4 48.1
Borrowings at floating rates 81.2 76.3
Hedged floating-rate debt
- 12.5
Unhedged balance 142.7 111.9
Furthermore, the Group has used €40 million cap agreements (3-month EURIBOR capped at 0.5%) since
February 24, 2015 and for 3 years. If these hedging agreements are taken into account, a change of +/- 1
percentage point in interest rates would have an impact of around €1.2 million on interest expense.
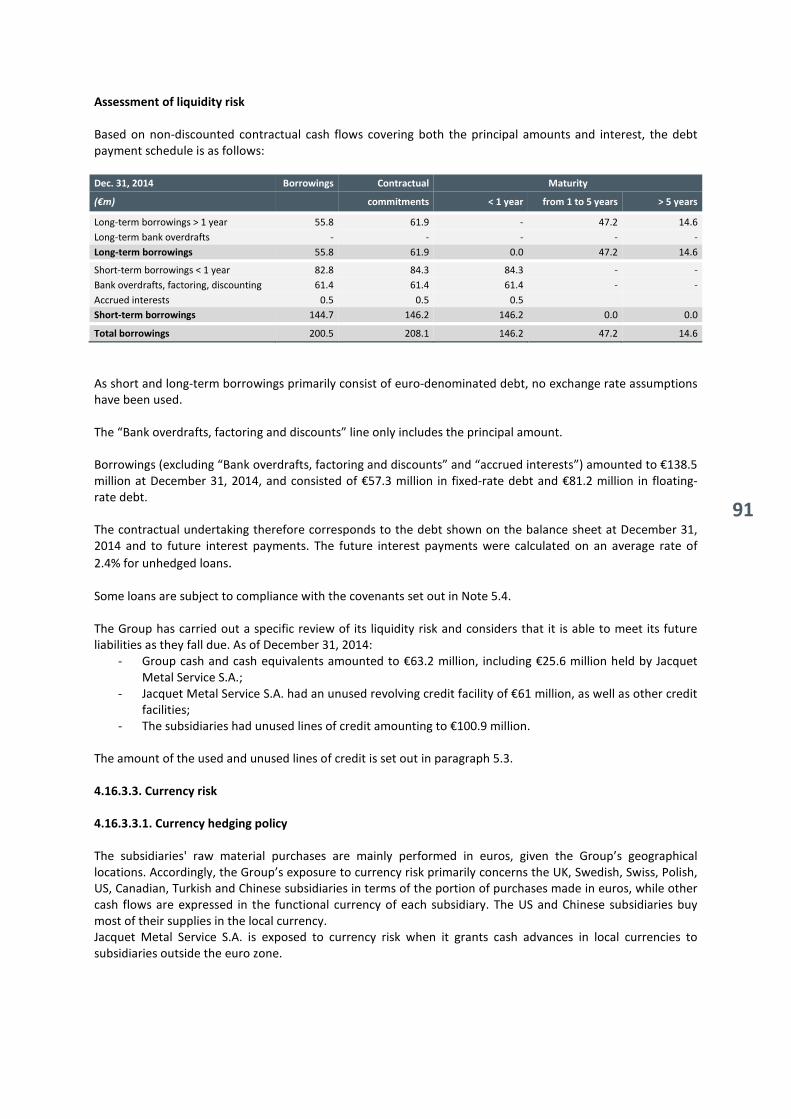
91
Assessment of liquidity risk
Based on non-discounted contractual cash flows covering both the principal amounts and interest, the debt payment schedule is as follows: Dec. 31, 2014 Borrowings Contractual Maturity
(€m) commitments < 1 year from 1 to 5 years > 5 years
Long-term borrowings > 1 year 55.8 61.9 - 47.2 14.6
Long-term bank overdrafts - - - - -
Long-term borrowings 55.8 61.9 0.0 47.2 14.6
Short-term borrowings < 1 year 82.8 84.3 84.3 - -
Bank overdrafts, factoring, discounting 61.4 61.4 61.4 - -
Accrued interests 0.5 0.5 0.5
Short-term borrowings 144.7 146.2 146.2 0.0 0.0
Total borrowings 200.5 208.1 146.2 47.2 14.6
As short and long-term borrowings primarily consist of euro-denominated debt, no exchange rate assumptions have been used. The “Bank overdrafts, factoring and discounts” line only includes the principal amount. Borrowings (excluding “Bank overdrafts, factoring and discounts” and “accrued interests”) amounted to €138.5 million at December 31, 2014, and consisted of €57.3 million in fixed-rate debt and €81.2 million in floating-rate debt. The contractual undertaking therefore corresponds to the debt shown on the balance sheet at December 31, 2014 and to future interest payments. The future interest payments were calculated on an average rate of
2.4% for unhedged loans. Some loans are subject to compliance with the covenants set out in Note 5.4. The Group has carried out a specific review of its liquidity risk and considers that it is able to meet its future liabilities as they fall due. As of December 31, 2014:
- Group cash and cash equivalents amounted to €63.2 million, including €25.6 million held by Jacquet Metal Service S.A.;
- Jacquet Metal Service S.A. had an unused revolving credit facility of €61 million, as well as other credit facilities;
- The subsidiaries had unused lines of credit amounting to €100.9 million. The amount of the used and unused lines of credit is set out in paragraph 5.3.
4.16.3.3. Currency risk
4.16.3.3.1. Currency hedging policy
The subsidiaries' raw material purchases are mainly performed in euros, given the Group’s geographical locations. Accordingly, the Group’s exposure to currency risk primarily concerns the UK, Swedish, Swiss, Polish, US, Canadian, Turkish and Chinese subsidiaries in terms of the portion of purchases made in euros, while other cash flows are expressed in the functional currency of each subsidiary. The US and Chinese subsidiaries buy most of their supplies in the local currency. Jacquet Metal Service S.A. is exposed to currency risk when it grants cash advances in local currencies to subsidiaries outside the euro zone.
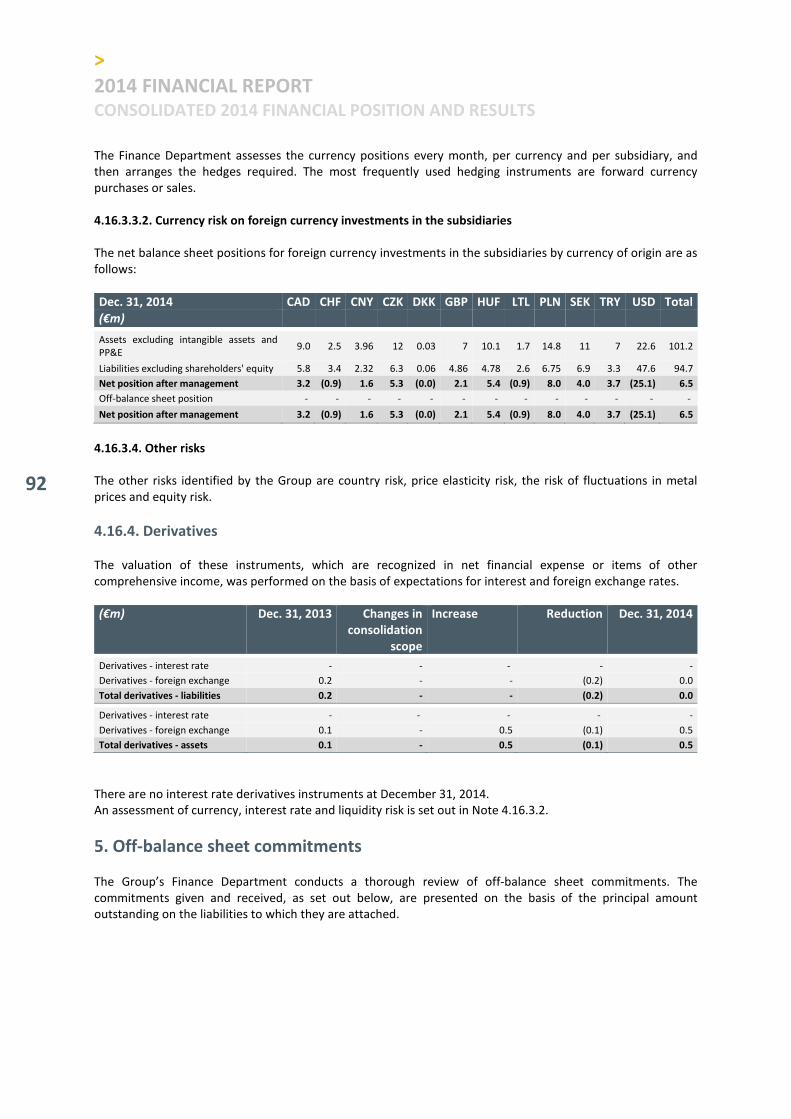
>
2014 FINANCIAL REPORT CONSOLIDATED 2014 FINANCIAL POSITION AND RESULTS
92
The Finance Department assesses the currency positions every month, per currency and per subsidiary, and then arranges the hedges required. The most frequently used hedging instruments are forward currency purchases or sales.
4.16.3.3.2. Currency risk on foreign currency investments in the subsidiaries The net balance sheet positions for foreign currency investments in the subsidiaries by currency of origin are as follows:
Dec. 31, 2014 CAD CHF CNY CZK DKK GBP HUF LTL PLN SEK TRY USD Total
(€m)
Assets excluding intangible assets and PP&E
9.0 2.5 3.96 12 0.03 7 10.1 1.7 14.8 11 7 22.6 101.2
Liabilities excluding shareholders' equity 5.8 3.4 2.32 6.3 0.06 4.86 4.78 2.6 6.75 6.9 3.3 47.6 94.7
Net position after management 3.2 (0.9) 1.6 5.3 (0.0) 2.1 5.4 (0.9) 8.0 4.0 3.7 (25.1) 6.5
Off-balance sheet position - - - - - - - - - - - - -
Net position after management 3.2 (0.9) 1.6 5.3 (0.0) 2.1 5.4 (0.9) 8.0 4.0 3.7 (25.1) 6.5
4.16.3.4. Other risks
The other risks identified by the Group are country risk, price elasticity risk, the risk of fluctuations in metal prices and equity risk.
4.16.4. Derivatives The valuation of these instruments, which are recognized in net financial expense or items of other comprehensive income, was performed on the basis of expectations for interest and foreign exchange rates. (€m) Dec. 31, 2013 Changes in
consolidation
scope
Increase Reduction Dec. 31, 2014
Derivatives - interest rate - - - - -
Derivatives - foreign exchange 0.2 - - (0.2) 0.0
Total derivatives - liabilities 0.2 - - (0.2) 0.0
Derivatives - interest rate - - - - -
Derivatives - foreign exchange 0.1 - 0.5 (0.1) 0.5
Total derivatives - assets 0.1 - 0.5 (0.1) 0.5
There are no interest rate derivatives instruments at December 31, 2014. An assessment of currency, interest rate and liquidity risk is set out in Note 4.16.3.2.
5. Off-balance sheet commitments The Group’s Finance Department conducts a thorough review of off-balance sheet commitments. The commitments given and received, as set out below, are presented on the basis of the principal amount outstanding on the liabilities to which they are attached.

93
5.1. Summary of commitments given and/or received Off-balance sheet commitments break down as follows:
(€m) Dec. 31,
2014
Dec. 31,
2013
Maturity
< 1 year from 1 to 5
years > 5 years
Commitments received for financing transactions
(guarantees) 0.3 6.1 0.3 0.0 0.0
Commitments given 103.7 86.2 78.4 17.3 8.0
Supplier guarantees 7.1 10.5 7.1 0.0 0.0
Bank guarantees 6.0 5.7 4.8 1.2 0.1
Documentary credit / letter of credit / SBLC 15.9 15.7 15.9 0.0 0.0
Comfort letter 15.3 6.9 9.5 1.3 4.5
Mortgages 12.2 3.2 8.4 0.5 3.4
Pledges 2.6 4.7 2.6 0.0 0.0
Security interests on working capital 23.4 21.9 23.4 0.0 0.0
Guarantees 21.1 17.6 6.7 14.4 0.0
The main pledges and mortgages granted are as follows:
Dec. 31, 2014
Collateralized
assets
Starting
date Maturity
Total
statement of
financial
position
Collateralized
assets as % of
statement of
financial position
item
(€m)
Mortgages on land or buildings
Jacquet Osiro 1.7
June 1, 2011 March 30, 2017 4.5
38%
Jacquet Osiro March 1, 2011 March 30, 2021
Foncière Bochum Sprl 6.2 January 20, 2014 January 20, 2024 6.2 (1) 100%
Stappert Ceska Republika 2.1 September 1, 2014 July 1, 2022 5.6 (1)
38%
Stappert Ceska Republika 0.9 September 1, 2014 August 1, 2015 0.9 100%
Other collateralized assets
JMS SA asset/liability guarantee 1.3 January 1, 2012 December 31, 2015 - n/a
SICAV JMS SA guarantees 2.6 June 29, 2012 December 30, 2015 2.6 (1) 100%
Total 14.8
(1) Total based on the gross value of the balance sheet item in the consolidated financial statements

>
2014 FINANCIAL REPORT CONSOLIDATED 2014 FINANCIAL POSITION AND RESULTS
94
5.2. Contractual obligations
(€m) Total Payments due over the period
2014 < 1 year from 1 to 5 years > 5 years
Obligations involving financial leases (1) 12.4 2.1 6.4 3.9
Discounted value of obligations involving financial leases (2) 10.5 2.0 5.6 2.9
Operating lease contracts (3) 55.2 14.7 29.7 10.8
Irrevocable purchase obligations -
(€m) Total Payments due over the period
2013 < 1 year from 1 to 5 years > 5 years
Obligations involving financial leases (1) 13.3 2.3 6.4 4.6
Discounted value of obligations involving financial leases (2) 10.9 2.2 5.4 3.3
Operating lease contracts (3) 46.9 13.3 28.2 5.4
Irrevocable purchase obligations 4.3 4.3 - - (1)
These are the total future minimum payments under the finance lease agreements. There were no sub-leasing agreements relating to
finance lease agreements as of December 31. (2)
The commitment corresponds to the discounted value of the future minimum payments under the finance lease agreements. (3)
The commitment corresponds to the total minimum future payments under non-cancellable operating leases.
5.3. Credit lines Credit lines break down as follows: (€m) 2014 2013
Amounts Amounts Amounts Amounts Amounts Amounts
granted used available granted used available
Jacquet Metal Service S.A. financing: 158.6 91.2 67.4 125.6 49.3 76.3
Syndicated term loan - - - -
Syndicated revolving credit 75.0 14.0 61.0 75.0 14.0 61.0
Lines of credit / facilities 83.6 77.2 6.4 50.6 35.3 15.3
Subsidiary financing 210.2 109.3 100.9 193.0 90.4 102.6
Liabilities held for transfer - - - - - -
Total 368.8 200.5 168.3 318.6 139.7 178.9
5.4. Bank covenants
The undertakings relating to financing primarily concern the syndicated revolving credit facility, €14 million of which had been drawn down at December 31, 2014. These undertakings are as follows and correspond to commitments to be honored at Group level:
- Net debt of less than €200 million or leverage of less than 2.0 at December 31, 2014; - Net debt of less than €225 million or leverage of less than 2.0 at June 30, 2015, December 31, 2015
and June 30, 2016; - Annual capital expenditure of less than €19 million; - Debt to equity ratio less than 1; - JSA must hold at least 40% of Jacquet Metal Service S.A.'s share capital and voting rights.
The undertakings relating to financing were in compliance at December 31, 2014:
- Net debt: €137.3 million and leverage: 2.36 - Capital expenditure: €14.2 million - Debt to equity ratio: 52.5% - JSA held 40.32% of the share capital and 48.96% of the voting rights in Jacquet Metal Service S.A.

95
5.5. Individual training entitlement (DIF)
The French subsidiaries’ aggregate individual training entitlement amounted to 46,105 hours. Since the Group does not have the necessary statistical information, it cannot reliably estimate the future use that employees will make of this entitlement. As a result, no expense relating to this commitment was recognized in the financial statements.
6. Information on related parties Related parties have been defined as the corporate officers of Jacquet Metal Service S.A., the parent company. The subsidiaries' managing directors were not considered as related parties inasmuch as their responsibility is limited to a fraction of the Group's sales or assets. Assets owned directly or indirectly by Eric Jacquet that are used as part of the Group’s operations.
Sites Rents 2014 (excl.
VAT)
Rents 2013 (excl.
VAT) Tenants
Saint Priest - France (69) 424 423 Jacquet Metal Service S.A.
Villepinte - France (93) 118 118 Jacquet Metal Service S.A.
Lyon - France (69) 473 215 Jacquet Metal Service S.A.
Migennes - France (89) 210 210 Jacquet Metal Service S.A.
Grésy sur Aix - France (73) 126 124 Détail Inox
Dusseldörf - Germany 366 91.5 Abraservice Deutschland
Related-party transactions are performed under normal arm's length market conditions.
7. Changes in the consolidated cash position
The statement of changes in the consolidated cash position is shown on a net basis, after offsetting translation differences and changes in the consolidation scope. Timing differences between financial expenses recognized for the period and expenses paid are taken into account in the cash position statement, but remain non-material. Breakdown of operating cash flows
(€m) Dec. 31,
2013
Changes in
consolidation
scope
Change
in
working
capital
Other
Translation
differences
Dec. 31,
2014
Inventory and work-in-progress 234.3 3.7 45.2 1.2 284.4
Trade receivables 128.8 4.0 11.3 0.7 144.8
Trade payables (156.0) (1.5) 10.4 (0.2) (0.4) (147.7)
Net operating working capital 207.1 6.2 66.9 (0.2) 1.5 281.5
Other assets 13.1 0.3 0.1 0.1 13.6
Other liabilities (32.3) (0.5) (2.4) 0.1 (0.3) (35.4)
Working capital before taxes and
financial items 187.9 6.0 64.6 (0.1) 1.3 259.7
“Changes in consolidation scope” were due to the acquisition of the ROLARK Group in Canada.

>
2014 FINANCIAL REPORT CONSOLIDATED 2014 FINANCIAL POSITION AND RESULTS
96
Further information on investing activities Investments are set out in Notes 4.2 and 4.3 to the financial statements. Further information on financing activities
Jacquet Metal Service S.A. paid a dividend of €0.59 per share in 2014, which amounted to €14.0 million in total. Moreover, €1.2 million was paid to minority shareholders in the subsidiaries. New loans and loan redemptions correspond to the movements identified in Note 4.14 on borrowings.
8. Statutory auditors’ fees
Statutory auditors’ fees amounted to €1,348 thousands in 2014, broken down as follows:
(in euro thousands)
Ernst &
Young
Grant
Thornton
Bellot
Mullenbach Other Total
2014 2013 2014 2013 2014 2013 2014 2013
Audit
Statutory Auditors, certification and audit of individual and consolidated statements
- Issuer 179 179 121 159 - - 300 338
- Fully consolidated subsidiaries 530 542 164 58 146 228 840 828
Other verifications and services directly linked to the engagement
- Issuer 10 - 198 - - - 208 -
- Fully consolidated subsidiaries - - - - - - - -
Sub-total 719 721 483 217 146 228 1,348 1,166
100% 93% 100% 100% 100% 100% 100% 95%
Other services provided by the
networks to fully consolidated
subsidiaries
- Legal, fiscal and corporate - 58 - - - - - 58
- Others - - - - - - - -
Sub-total - 58 - - - - - 58
-% 7% -% -% -% -% -% 5%
Total 719 779 483 217 146 228 1,348 1,224
Grant Thornton was named Statutory Auditor of JMS SA at the June 26, 2014 General Meeting.
9. Post-balance sheet events None.

97
4. STATUTORY AUDITOR’S REPORT ON CONSOLIDATED FINANCIAL
STATEMENTS (Free translation of French-language original)
To the Shareholders, In compliance with the assignment entrusted to us by your annual general meetings of shareholders, we hereby report to you, for the year ended 31 December 2014, on:
- the audit of the accompanying consolidated financial statements of JACQUET METAL SERVICE; - the justification of our assessments; - the specific verification required by law.
These consolidated financial statements have been approved by the Board of Directors. Our role is to express an opinion on these consolidated financial statements based on our audit. I. Opinion on the consolidated financial statements
We conducted our audit in accordance with professional standards applicable in France; those standards require that we plan and perform the audit to obtain reasonable assurance about whether the consolidated financial statements are free of material misstatement. An audit involves performing procedures, using sampling techniques or other methods of selection, to obtain audit evidence about the amounts and disclosures in the consolidated financial statements. An audit also includes evaluating the appropriateness of accounting policies used and the reasonableness of accounting estimates made, as well as the overall presentation of the consolidated financial statements. We believe that the audit evidence we have obtained is sufficient and appropriate to provide a basis for our audit opinion. In our opinion, the consolidated financial statements give a true and fair view of the assets and liabilities and of the financial position of the Group as at 31 December 2014 and of the results of its operations for the year then ended in accordance with International Financial Reporting Standards as adopted by the European Union. II. Justification of our assessments
In accordance with the requirements of article L. 823-9 of the French Commercial Code (Code de commerce) relating to the justification of our assessments, we bring to your attention the following matters: In drawing up its annual accounts, your Group is required to make estimates and assumptions, notably concerning the value of certain assets, liabilities, income and expenses. The following items in the financial statements have therefore been measured based on these estimates and assumptions:
- Goodwill (notes 2.9 and 4.1); - Inventories and work-in-progress (notes 2.15 and 4.5); - Deferred tax assets (notes 2.22 and 4.13).
For all of the above-mentioned items, we verified the appropriateness of the accounting rules and methods applied and the disclosures in the notes to the consolidated financial statements. We reviewed the consistency of the assumptions used, the translation of these assumptions into figures and the documentation available, and on this basis we assessed the reasonableness of the estimates made. These assessments were made as part of our audit of the consolidated financial statements taken as a whole, and therefore contributed to the opinion we formed which is expressed in the first part of this report.
98
III. Specific verification
As required by law we have also verified in accordance with professional standards applicable in France the information related to the Group, presented in the management report. We have no matters to report as to its fair presentation and its consistency with the consolidated financial statements. Lyon, 10
th March 2015
The Statutory Auditors French original signed by:
Grant Thornton
French member of Grant Thornton
International
ERNST & YOUNG et Autres
Françoise Mechin
Partner
Lionel Denjean
Partner

99
5. 2014 ANNUAL FINANCIAL STATEMENTS – JACQUET METAL
SERVICE S.A.
INCOME STATEMENT
(in euro thousands) Notes 2014 2013
Services 4.1 18,290 17,994
Sales 4.1 18,290 17,994
Reversal of depreciation and provisions 4.3 617 289
Other net income 4.2 2,711 1,855
Transfer of charges 370 1,599
Other operating income 21,987 21,737
Purchases and external expenses 4.4 (16,024) (14,162)
Miscellaneous taxes 4.4 (564) (431)
Personnel expenses 4.4 (2,061) (2,130)
Payroll taxes 4.4 (1,159) (1,155)
Depreciation, amortization and provisions 4.4 (2,243) (1,811)
Other charges 4.4 (231) (293)
Operating expenses (22,282) (19,981)
Operating income (expense) (295) 1,756
Income from equity investments 7,438 15,889
Other interest and related income 3,644 2,915
Provision reversals and transfer of financial expenses 402 1,261
Foreign exchange gains 325 1,684
Net gains on sale of short-term investment securities 2 1
Financial income 4.5 11,811 21,749
Depreciation, amortization and provisions - (37)
Interest and related expenses (1,424) (814)
Foreign exchange losses (81) (109)
Financial expenses 4.5 (1,505) (961)
Net financial income 10,306 20,789
Income before tax 10,011 22,544
Non-recurring income from operating transactions - -
Non-recurring income from capital transactions 3,606 3,227
Provision reversals and expense transfers 270 378
Non-recurring income 4.6 3,876 3,605
Non-recurring expenses related to operating transactions (0) (2)
Non-recurring expenses related to capital transactions (3,399) (1,070)
Depreciation, amortization and provisions (6)
Non-recurring expenses 4.6 (3,399) (1,078)
Net non-recurring income (expense) 477 2,527
Employee profit-sharing - -
Corporate income tax 4.7, 4.8, 4.9 52 (550)
Net income 10,541 24,521
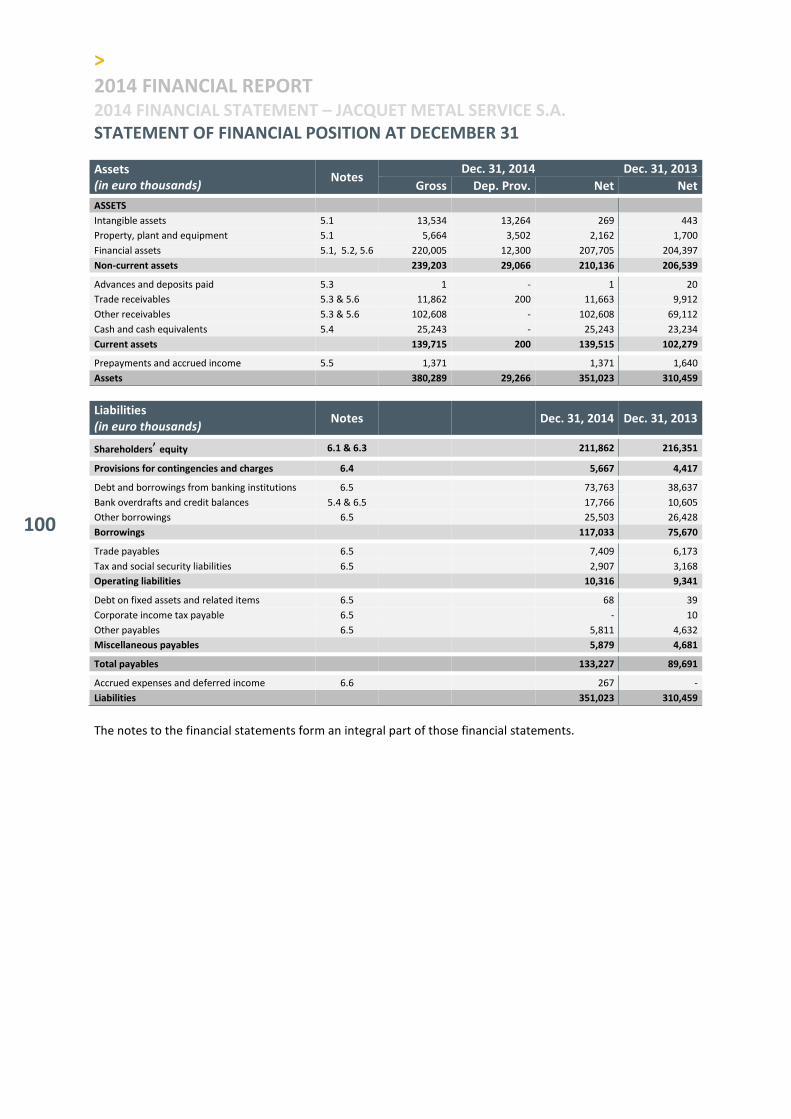
>
2014 FINANCIAL REPORT 2014 FINANCIAL STATEMENT – JACQUET METAL SERVICE S.A.
100
STATEMENT OF FINANCIAL POSITION AT DECEMBER 31
Assets (in euro thousands)
Notes Dec. 31, 2014 Dec. 31, 2013
Gross Dep. Prov. Net Net
ASSETS
Intangible assets 5.1 13,534 13,264 269 443
Property, plant and equipment 5.1 5,664 3,502 2,162 1,700
Financial assets 5.1, 5.2, 5.6 220,005 12,300 207,705 204,397
Non-current assets 239,203 29,066 210,136 206,539
Advances and deposits paid 5.3 1 - 1 20
Trade receivables 5.3 & 5.6 11,862 200 11,663 9,912
Other receivables 5.3 & 5.6 102,608 - 102,608 69,112
Cash and cash equivalents 5.4 25,243 - 25,243 23,234
Current assets 139,715 200 139,515 102,279
Prepayments and accrued income 5.5 1,371 1,371 1,640
Assets 380,289 29,266 351,023 310,459
Liabilities (in euro thousands)
Notes Dec. 31, 2014 Dec. 31, 2013
Shareholders’ equity 6.1 & 6.3 211,862 216,351
Provisions for contingencies and charges 6.4 5,667 4,417
Debt and borrowings from banking institutions 6.5 73,763 38,637
Bank overdrafts and credit balances 5.4 & 6.5 17,766 10,605
Other borrowings 6.5 25,503 26,428
Borrowings 117,033 75,670
Trade payables 6.5 7,409 6,173
Tax and social security liabilities 6.5 2,907 3,168
Operating liabilities 10,316 9,341
Debt on fixed assets and related items 6.5 68 39
Corporate income tax payable 6.5 - 10
Other payables 6.5 5,811 4,632
Miscellaneous payables 5,879 4,681
Total payables 133,227 89,691
Accrued expenses and deferred income 6.6 267 -
Liabilities 351,023 310,459
The notes to the financial statements form an integral part of those financial statements.
101
NOTES TO THE PARENT COMPANY FINANCIAL STATEMENTS
1. Highlights None.
2. Accounting rules and policies General principles applied
The Company’s summary financial statements were prepared in accordance with the standards, principles and policies set out in the French Commercial Code, the French General Accounting Charter and Decree No. 83-1020 of November 29, 1983. The basic method used to value items recorded in the accounts is the historical cost method. The notes and tables provided in addition to the income statement and statement of financial position comprise the notes to the parent company financial statements and are therefore an integral part thereof. The financial year ended December 31, 2014 covered a period of 12 months. Estimates
The preparation of financial statements requires management to take into account assumptions and estimates that have an impact on the amounts of the assets and liabilities shown in the statement of financial position, as well as on the amounts shown as income and expense for the financial year. Management review their estimates and assessments on an ongoing basis, based on their past experience, as well as on various other factors which are considered as reasonable and which form the basis of their assessment of the book value of assets and liabilities. The actual results could be materially different from these estimates, as a result of different assumptions or circumstances. The main estimates made by management when preparing the financial statements primarily involve:
- The impairment tests on equity investments. The method followed is based on discounting the forecast future cash flows based on the five-year business plans;
- Employee benefit liabilities are measured based on actuarial assumptions; - Provisions for contingencies and charges are assessed so as to reflect the best estimate of the risks at
the balance sheet date.
>
2014 FINANCIAL REPORT 2014 FINANCIAL STATEMENT – JACQUET METAL SERVICE S.A.
102
Intangible assets and property, plant and equipment Intangible assets and property, plant and equipment are valued at their historical purchase cost, which consists of:
- The purchase price, including customs duties and other non-recoverable levies; - Any directly related expenses incurred to put the asset in working order for the purpose of its planned
use; - Any trade rebates and discounts deducted when calculating the purchase cost.
Depreciation is calculated according to the straight-line method, based on the likely useful life. The main depreciation methods and periods are as follows:
- Software Straight-line – 1 to 10 years - Fixtures and fittings Straight-line – 3 to 10 years - Vehicles, office and IT equipment, and furniture Straight-line – 1 to 10 years
The Company uses its assets for as long as possible, and sales of property, plant and equipment take place only very occasionally. Furthermore, the Company has chosen to use an accelerated depreciation method where possible. This tax arrangement, which is reserved for certain categories of assets, enables a significant increase in the amount of tax deductions made during the initial years of an asset’s use. From an accounting standpoint, the portion of the depreciation charges that exceeds the straight-line depreciation is recorded in an accelerated depreciation provision account in shareholders’ equity under “regulated provisions”. Impairment testing on depreciable and/or amortizable assets
Where events or new circumstances indicate that the book value of specific property, plant and equipment or intangible assets is not likely to be recoverable, this value is compared with the estimated recoverable value based on the value-in-use. If the recoverable value of these assets is lower than their net book value, that value is written down to the recoverable value. Financial assets
The gross value of equity investments corresponds to the historical purchase cost of the securities plus purchase expenses, i.e. all the costs that are directly attributable to the purchase of the securities except for borrowing costs. The fair value of the equity investments held in unlisted companies is assessed on the basis of the expected discounted future cash flows plus the residual value of the company. Future cash flows are determined on the basis of forecasts drawn up by Group management, based on an assessment of all the economic conditions that will apply during the assets' useful life. The methodology is based on five-year business plans. An impairment test on the value of the equity investments is performed annually at the balance sheet date, in order to ensure that the recoverable value of the securities is not lower than their book value. If the book value of the securities exceeds the higher of their value-in-use and their expected net sale price, an impairment charge amounting to the difference is then recorded.
103
Other financial investments
Other financial investments primarily correspond to unallocated treasury shares and guarantee deposits paid. A provision is recorded for these investments if the debtor's financial position indicates that reimbursement is highly unlikely. Treasury shares are recognized at their purchase cost. An impairment charge is recorded when the inventory value, as determined by the average stock market price during the last month before the balance sheet date, is lower than the book value. Disposals are valued at the weighted average unit cost. Receivables and payables
Trade receivables are valued at their nominal value. Trade receivables may be impaired, where applicable. An impairment charge is recognized as soon as there is a risk of non-recovery. The book value of each receivable is assessed in accordance with this risk. Marketable investment securities
Marketable investment securities are recognized at their purchase cost, and a provision for impairment is recorded if their market value is lower than their book value. Foreign currency transactions
Foreign currency transactions during the financial year are recorded at their equivalent value in euros at the transaction date. Foreign currency payables, receivables and cash and cash equivalents outside the euro zone are translated on the balance sheet at the closing exchange rate. Differences arising from the adjustment of payable and receivables outside the euro zone in accordance with the closing rate are shown under “translation differences”. A provision for contingencies is charged on the full amount of unrealized foreign exchange losses. Provision for employee benefit obligations
The Company records a provision for end-of-career benefits, employees' supplemental pensions and long-service awards. Provision charges and reversals are recognized in operating income. The provision is assessed by independent actuaries. Retirement benefit entitlements are defined by the collective bargaining agreement applicable to the French metal industry. In 2014, pursuant to the initial application of ANC Recommendation 2013 R02 dated November 7, 2013,
Jacquet Metal Service S.A. chose to record all the aggregate actuarial differences and costs of past unamortized
services at the beginning of the financial year directly under “retained earnings” for all its pension schemes.
The impact is an €866,000 increase in provisions, which is offset by a decrease in shareholders’ equity.

>
2014 FINANCIAL REPORT 2014 FINANCIAL STATEMENT – JACQUET METAL SERVICE S.A.
104
Employee benefit obligations are valued on an annual basis using specific Company and external trend indicators, as shown in the following table:
2014 2013
Demographic assumptions
Mortality table INSEE TV/TD 2007-2009 INSEE TV/TD 2007-2009
Minimum age at beginning of career 22 for managers and 20 for non-managers 22 for managers and 20 for non-managers
Retirement age 62 62
Retirement procedures Voluntary retirement at employee’s
initiative
Voluntary retirement at employee’s
initiative Underlying financial assumptions
Discounting rate
Top-hat pension scheme 2.00% 3.00%
Other schemes 2.00% 3.00%
Inflation rate 2.00% 2.00%
Wage-increase rates From 0.39% to 4.69% depending on SPC, pay schemes and age
From 0.39% to 4.69% depending on SPC, pay schemes and age
Social charges rate 50% 50%
Return on financial assets 2.00% 3.00%
Derivatives
The Company manages certain financial risks via the use of derivative hedging instruments. The Company primarily uses cap agreements to manage interest-rate risk relating to its financing requirements. The nominal amounts of the financial derivatives are not recognized, in accordance with French accounting principles. The impact of financial hedging instruments is assessed on a symmetrical basis through the income statement according to the cash flows from the underlying hedged asset.
3. Post-balance sheet events None.
4. Notes to the Income Statement
4.1. Breakdown of sales
(in euro thousands) 2014 2013
France 3,278 18% 3,399 19%
Export 15,012 82% 14,594 81%
Total 18,290 100% 17,994 100%
Sales correspond to services invoiced to the subsidiaries, which are mainly management and IT services. The trend in sales is mainly linked to developments in the Group's business activities.
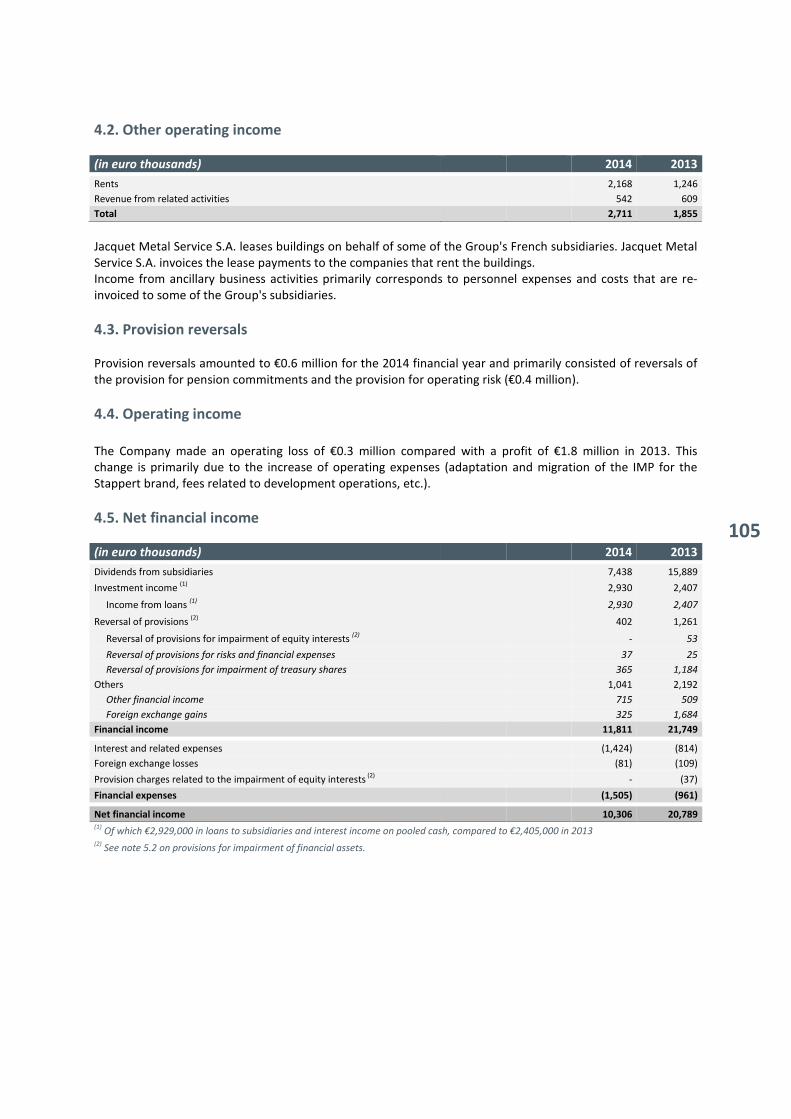
105
4.2. Other operating income
(in euro thousands) 2014 2013
Rents 2,168 1,246
Revenue from related activities 542 609
Total 2,711 1,855
Jacquet Metal Service S.A. leases buildings on behalf of some of the Group's French subsidiaries. Jacquet Metal Service S.A. invoices the lease payments to the companies that rent the buildings. Income from ancillary business activities primarily corresponds to personnel expenses and costs that are re-invoiced to some of the Group's subsidiaries.
4.3. Provision reversals Provision reversals amounted to €0.6 million for the 2014 financial year and primarily consisted of reversals of the provision for pension commitments and the provision for operating risk (€0.4 million).
4.4. Operating income
The Company made an operating loss of €0.3 million compared with a profit of €1.8 million in 2013. This change is primarily due to the increase of operating expenses (adaptation and migration of the IMP for the Stappert brand, fees related to development operations, etc.).
4.5. Net financial income
(in euro thousands) 2014 2013
Dividends from subsidiaries 7,438 15,889
Investment income (1) 2,930 2,407
Income from loans (1)
2,930 2,407
Reversal of provisions (2) 402 1,261
Reversal of provisions for impairment of equity interests (2)
- 53
Reversal of provisions for risks and financial expenses 37 25
Reversal of provisions for impairment of treasury shares 365 1,184
Others 1,041 2,192
Other financial income 715 509
Foreign exchange gains 325 1,684
Financial income 11,811 21,749
Interest and related expenses (1,424) (814)
Foreign exchange losses (81) (109)
Provision charges related to the impairment of equity interests (2) - (37)
Financial expenses (1,505) (961)
Net financial income 10,306 20,789 (1)
Of which €2,929,000 in loans to subsidiaries and interest income on pooled cash, compared to €2,405,000 in 2013 (2)
See note 5.2 on provisions for impairment of financial assets.

>
2014 FINANCIAL REPORT 2014 FINANCIAL STATEMENT – JACQUET METAL SERVICE S.A.
106
4.6. Non-recurring income
(in euro thousands) 2014 2013
Gain on asset disposals 24 -
Sale of securities 3,300 2,885
Other non-recurring income 552 720
Non-recurring income 3,876 3,605
Net book value of assets sold (14) -
Net book value of securities sold (3,297) (1,063)
Other non-recurring expenses (88) (15)
Non-recurring expenses (3,399) (1,078)
Net non-recurring income 477 2,527
The non-recurring income of €0.5 million primarily consisted of gains on the disposal of treasury shares under the liquidity contract and the reversal of the provision for accelerated amortization and depreciation.
4.7. Corporate income tax The Company has opted for the consolidated tax regime, where it acts as the Group umbrella company. As of December 31, 2014 this tax group included all the Group’s French companies. The tax consolidation regime was extended for a period of five years as from the 2010 financial year. Jacquet Metal Service S.A, the Group’s parent company, is the only company liable for the corporate income tax payable by all the French companies to the French tax authorities. The main provisions set out below have been adopted for the accounting treatment of taxes that fall under this specific regime.
- Even though it is not required to pay tax to the French Treasury, every consolidated subsidiary nonetheless recognizes the tax that it would owe under the common law tax regime as an expense, and pays the amount to Jacquet Metal Service S.A.;
- Any potential tax credits recorded at the level of the Group tax return, and resulting from deducting the losses of a loss-making subsidiary, represent a profit that belongs to the subsidiary, to which the amount accrues;
- Any tax savings made by the Group that do not relate to losses (corrections and tax assets of loss-making companies) are retained by the parent company, and recorded as income or expense.
In the event that the consolidated subsidiary is deconsolidated from the tax group, the consolidating company may be required to pay the consolidated company compensation for the loss of certain tax benefits conferred by its membership of the tax consolidation group, such as, for example, the option to carry its losses forward during its membership of the tax consolidation group, after taking into account the subsidiary’s tax position, potential changes to that position and the nature of the event that triggered its deconsolidation. The determination of the actual extent of this potential compensation for the consolidated subsidiary, as well as the practical procedures for such compensation, will be the subject of a specific agreement once it is deconsolidated. Tax loss carry-backs
In accordance with the option available to it under Article 220-5 of the French General Tax Code, the Company has opted to carry back a portion of the tax group's loss for the 2009 financial year, which has given rise to an aggregate receivable of €3.3 million against the French Treasury.
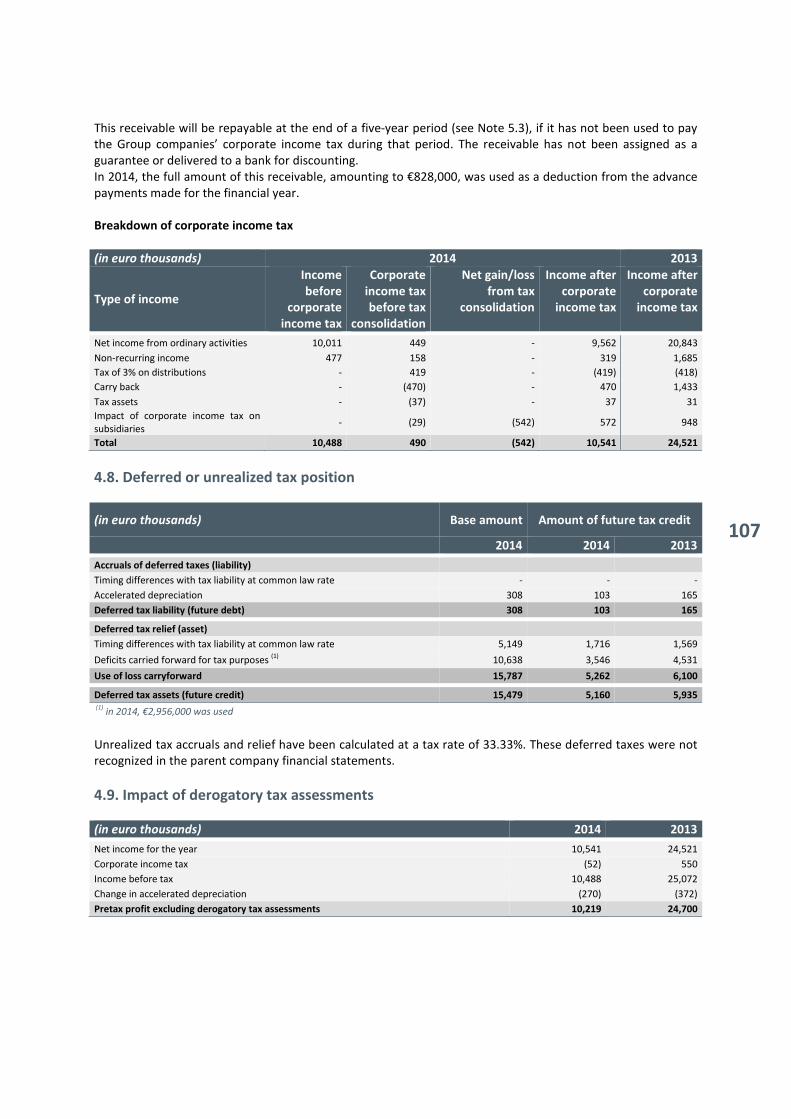
107
This receivable will be repayable at the end of a five-year period (see Note 5.3), if it has not been used to pay the Group companies’ corporate income tax during that period. The receivable has not been assigned as a guarantee or delivered to a bank for discounting. In 2014, the full amount of this receivable, amounting to €828,000, was used as a deduction from the advance payments made for the financial year. Breakdown of corporate income tax
(in euro thousands) 2014 2013
Type of income
Income
before corporate
income tax
Corporate
income tax before tax
consolidation
Net gain/loss from tax
consolidation
Income after corporate
income tax
Income after corporate
income tax
Net income from ordinary activities 10,011 449 - 9,562 20,843
Non-recurring income 477 158 - 319 1,685
Tax of 3% on distributions - 419 - (419) (418)
Carry back - (470) - 470 1,433
Tax assets - (37) - 37 31
Impact of corporate income tax on subsidiaries
- (29) (542) 572 948
Total 10,488 490 (542) 10,541 24,521
4.8. Deferred or unrealized tax position
(in euro thousands) Base amount Amount of future tax credit
2014 2014 2013
Accruals of deferred taxes (liability)
Timing differences with tax liability at common law rate - - -
Accelerated depreciation 308 103 165
Deferred tax liability (future debt) 308 103 165
Deferred tax relief (asset)
Timing differences with tax liability at common law rate 5,149 1,716 1,569
Deficits carried forward for tax purposes (1) 10,638 3,546 4,531
Use of loss carryforward 15,787 5,262 6,100
Deferred tax assets (future credit) 15,479 5,160 5,935 (1)
in 2014, €2,956,000 was used
Unrealized tax accruals and relief have been calculated at a tax rate of 33.33%. These deferred taxes were not recognized in the parent company financial statements.
4.9. Impact of derogatory tax assessments
(in euro thousands) 2014 2013
Net income for the year 10,541 24,521
Corporate income tax (52) 550
Income before tax 10,488 25,072
Change in accelerated depreciation (270) (372)
Pretax profit excluding derogatory tax assessments 10,219 24,700
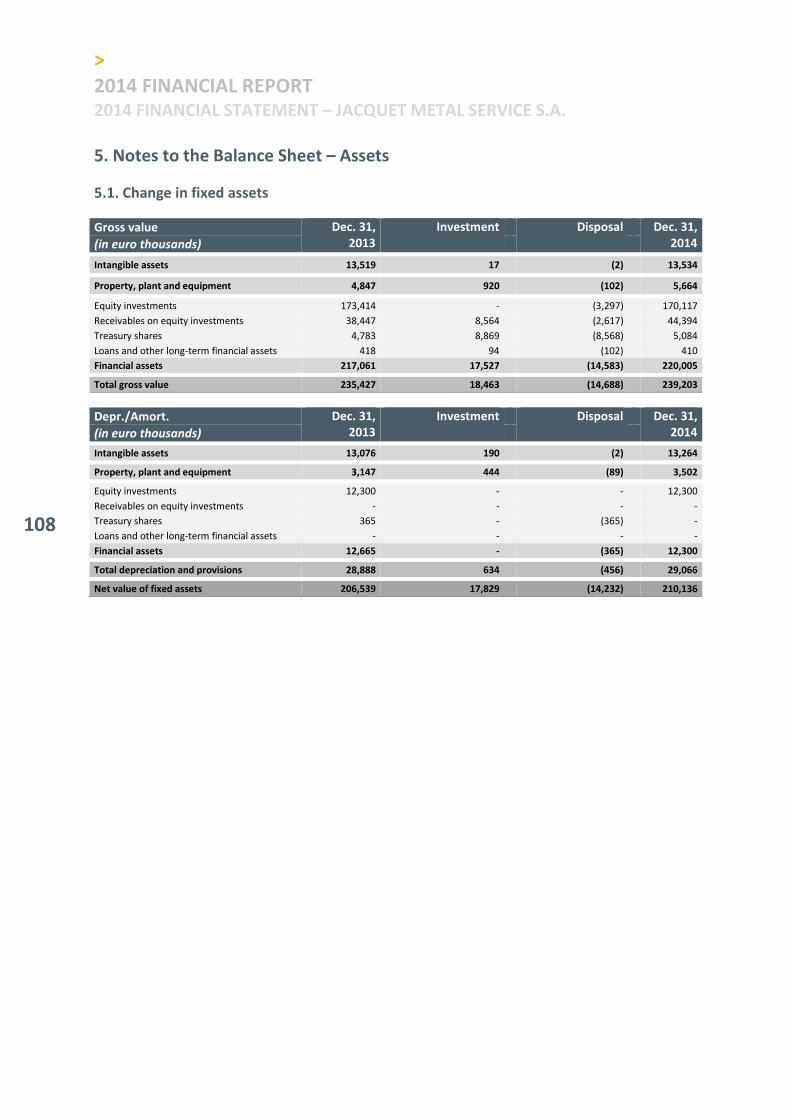
>
2014 FINANCIAL REPORT 2014 FINANCIAL STATEMENT – JACQUET METAL SERVICE S.A.
108
5. Notes to the Balance Sheet – Assets
5.1. Change in fixed assets
Gross value Dec. 31,
2013
Investment Disposal Dec. 31,
2014 (in euro thousands)
Intangible assets 13,519 17 (2) 13,534
Property, plant and equipment 4,847 920 (102) 5,664
Equity investments 173,414 - (3,297) 170,117
Receivables on equity investments 38,447 8,564 (2,617) 44,394
Treasury shares 4,783 8,869 (8,568) 5,084
Loans and other long-term financial assets 418 94 (102) 410
Financial assets 217,061 17,527 (14,583) 220,005
Total gross value 235,427 18,463 (14,688) 239,203
Depr./Amort. Dec. 31,
2013
Investment Disposal Dec. 31,
2014 (in euro thousands)
Intangible assets 13,076 190 (2) 13,264
Property, plant and equipment 3,147 444 (89) 3,502
Equity investments 12,300 - - 12,300
Receivables on equity investments - - - -
Treasury shares 365 - (365) -
Loans and other long-term financial assets - - - -
Financial assets 12,665 - (365) 12,300
Total depreciation and provisions 28,888 634 (456) 29,066
Net value of fixed assets 206,539 17,829 (14,232) 210,136

109
5.2. Financial assets Equity investments
The gross value of equity investments was €170.1 million at December 31, 2014, compared with €173.4 million at December 31, 2013. This change was primarily due to intra-Group equity investment re-assignment transactions. Information on the main subsidiaries and investments held directly is set out below. (in euro thousands) Country Share
capital
Equity
other
than
share
capital
Share of
capital
held (%)
Net
Book
Value
of
shares
held
Loans
and
advances
granted
by the
company
Net Book
Value of
shareholder
loans
granted to
subsidiaries
(1)
Guarantees
and
endorsements
granted
Dividends
paid to
the
company
in the
financial
year
Sales
(exclusive
of VAT) of
the
previous
financial
year
Profit or
loss
from the
previous
financial
year
JACQUET Holding SARL France 14,337 14,987 100.00% 19,695 37,192 28,279 - 1,500 - 7,848
STAPPERT Deutschland Germany 8,871 79,383 100.00% 6,517 - 1 - 5,700 246,538 12,275
ABRASERVICE Holding
SAS France 1,819 16,698 100.00% 18,233 - 8,390 - - - 428
IMS group Holding SAS France 10,854 63,311 100.00% 108,581 6,700 35,337 - - - 470
Others France 2,992 1,234 4,670 - 537 - 92 5,693 241
JACQUET Finland OY Finland 104 3,506 78.95% 82 - - - 118 7,499 399
JACQUET s.r.o Czech Republic
55 184 80.00% 38 - - - 28 4,208 29
Total 157,816 43,892 72,544 - 7,438
(1) debtors (+) / creditors (-) including cash pooling
The shareholders’ equity and results shown in this table are statutory company figures and do not include accounting restatements performed at the Group level for consolidated accounts. Receivables relating to equity investments
Receivables relating to equity investments amounted to €43.9 million and correspond to advances with a term of over one year granted to subsidiaries owned directly or indirectly by Jacquet Metal Service S.A. Treasury shares
The annual change corresponds to transactions relating to the liquidity contract.

>
2014 FINANCIAL REPORT 2014 FINANCIAL STATEMENT – JACQUET METAL SERVICE S.A.
110
5.3. Receivables payment schedule (in euro thousands) Gross amount
as of Dec. 31,
2014
Net amount as of Dec. 31,
2014
Maturity
< 1 year from 1 to 5
years > 5 years
Fixed assets
Receivables on equity investments 44,394 44,394 502 43,892 -
Loans 36 36 - 36 -
Other financial assets 374 374 - - 374
Current assets
Advances and deposits paid 1 1 1 - -
Trade receivables 11,862 11,663 11,663 - -
Other receivables 102,608 102,608 67,263 35,337 9
Prepaid expenses 833 833 833 - -
Total 160,108 159,908 80,261 79,265 382
The portion of receivables relating to equity investments due in less than one year primarily corresponds to the interest invoiced to subsidiaries. Other receivables primarily include the cash pooling accounts, which amounted to €98.4 million, including €35.3 million maturing in over one year.
5.4. Cash and cash equivalents Cash pooling agreements have been implemented between Jacquet Metal Service S.A. and certain subsidiaries. The (debtor and creditor) balancing process takes place in pivot accounts held by Jacquet Metal Service S.A. and enables Group cash management to be optimized accordingly. Cash and cash equivalents were broken down as follows at December 31, 2014:
(in euro thousands) Gross value as of
Dec. 31, 2014
Net value as of
Dec. 31, 2014
Net value as of
Dec. 31, 2013
Investment securities 3,165 3,165 3,300
Money market funds 3,165 3,165 3,300
Cash 22,079 22,079 19,935
Cash and cash equivalents 25,243 25,243 23,234
5.5. Prepayments and accrued income
(in euro thousands) Dec. 31, 2014 Dec. 31, 2013
Prepaid expenses 833 527
Deferred charges 538 1,077
Foreign exchange differences - assets - 37
Prepayments and accrued income 1,371 1,640
Prepaid expenses primarily consisted of operating expenses.

111
Translation differences break down as follows:
(in euro thousands) Dec. 31, 2014 Dec. 31, 2013
Receivables - 37
Debts - -
Total - 37
Provision for exchange loss - 37
Unprovisioned exchange losses - -
6. Notes to the Balance Sheet – Liabilities
6.1. Information on shareholders’ equity Share capital
The share capital at December 31, 2014 was unchanged from the previous financial year. It consists of 24,028,438 shares with a total value of €36,631,126.16. Detailed information on changes in the share capital is provided in paragraph 5 of the “Other information” section in the Registration Document. Changes in shareholders’ equity
(in euro
thousands)
Number of
shares
outstanding
Share
capital
Additional
paid-in
capital and
merger
premium
Legal
reserve
Other
reserves and
unallocated
retained
earnings
Net
income
(expense)
Regulatory provisions
Shareholders’ equity
Dec 31, 2013 24,028,438 36,631 58,142 3,663 92,899 24,521 495 216,351
Appropriation of earnings
- - - 10,545 (10,545) - -
Distributions - - - - (13,977) - (13,977)
Change in provisions
- - - (867) - (187) (1,053)
2014 net income
- - - - 10,541 - 10,541
Dec 31, 2014 24,028,438 36,631 58,142 3,663 102,577 10,541 309 211,862
Other reserves and retained earnings
The “Other reserves and retained earnings” item includes €6.2 million in unavailable reserves allocated in consideration for treasury shares and -€0.9 million relating to the application of ANC Recommendation 2013-R02 on employee benefit obligations. Regulated provisions
Regulated provisions are recorded in accordance with the legislation in effect and include accelerated depreciation. The movements over the period are set out in paragraph 6.3.
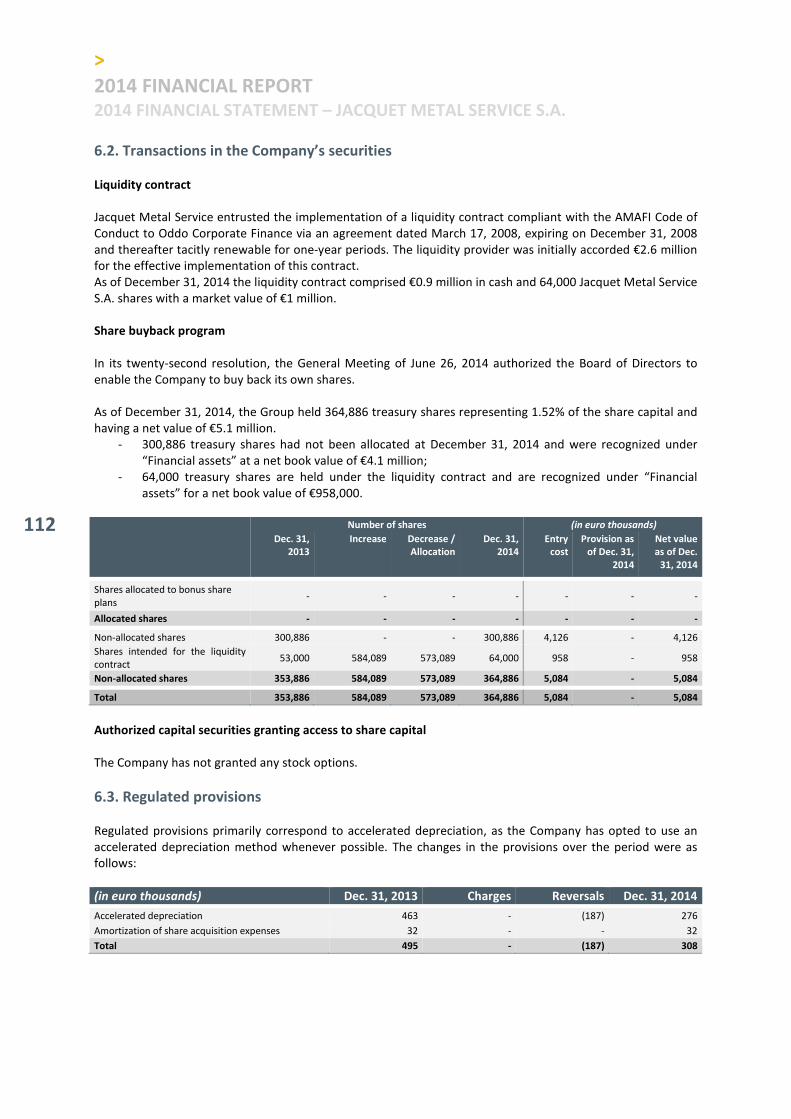
>
2014 FINANCIAL REPORT 2014 FINANCIAL STATEMENT – JACQUET METAL SERVICE S.A.
112
6.2. Transactions in the Company’s securities Liquidity contract
Jacquet Metal Service entrusted the implementation of a liquidity contract compliant with the AMAFI Code of Conduct to Oddo Corporate Finance via an agreement dated March 17, 2008, expiring on December 31, 2008 and thereafter tacitly renewable for one-year periods. The liquidity provider was initially accorded €2.6 million for the effective implementation of this contract. As of December 31, 2014 the liquidity contract comprised €0.9 million in cash and 64,000 Jacquet Metal Service S.A. shares with a market value of €1 million. Share buyback program
In its twenty-second resolution, the General Meeting of June 26, 2014 authorized the Board of Directors to enable the Company to buy back its own shares. As of December 31, 2014, the Group held 364,886 treasury shares representing 1.52% of the share capital and having a net value of €5.1 million.
- 300,886 treasury shares had not been allocated at December 31, 2014 and were recognized under “Financial assets” at a net book value of €4.1 million;
- 64,000 treasury shares are held under the liquidity contract and are recognized under “Financial assets” for a net book value of €958,000.
Number of shares (in euro thousands)
Dec. 31,
2013
Increase Decrease /
Allocation
Dec. 31,
2014
Entry
cost
Provision as
of Dec. 31,
2014
Net value
as of Dec.
31, 2014
Shares allocated to bonus share plans
- - - - - - -
Allocated shares - - - - - - -
Non-allocated shares 300,886 - - 300,886 4,126 - 4,126
Shares intended for the liquidity contract
53,000 584,089 573,089 64,000 958 - 958
Non-allocated shares 353,886 584,089 573,089 364,886 5,084 - 5,084
Total 353,886 584,089 573,089 364,886 5,084 - 5,084
Authorized capital securities granting access to share capital
The Company has not granted any stock options.
6.3. Regulated provisions Regulated provisions primarily correspond to accelerated depreciation, as the Company has opted to use an accelerated depreciation method whenever possible. The changes in the provisions over the period were as follows:
(in euro thousands) Dec. 31, 2013 Charges Reversals Dec. 31, 2014
Accelerated depreciation 463 - (187) 276
Amortization of share acquisition expenses 32 - - 32
Total 495 - (187) 308
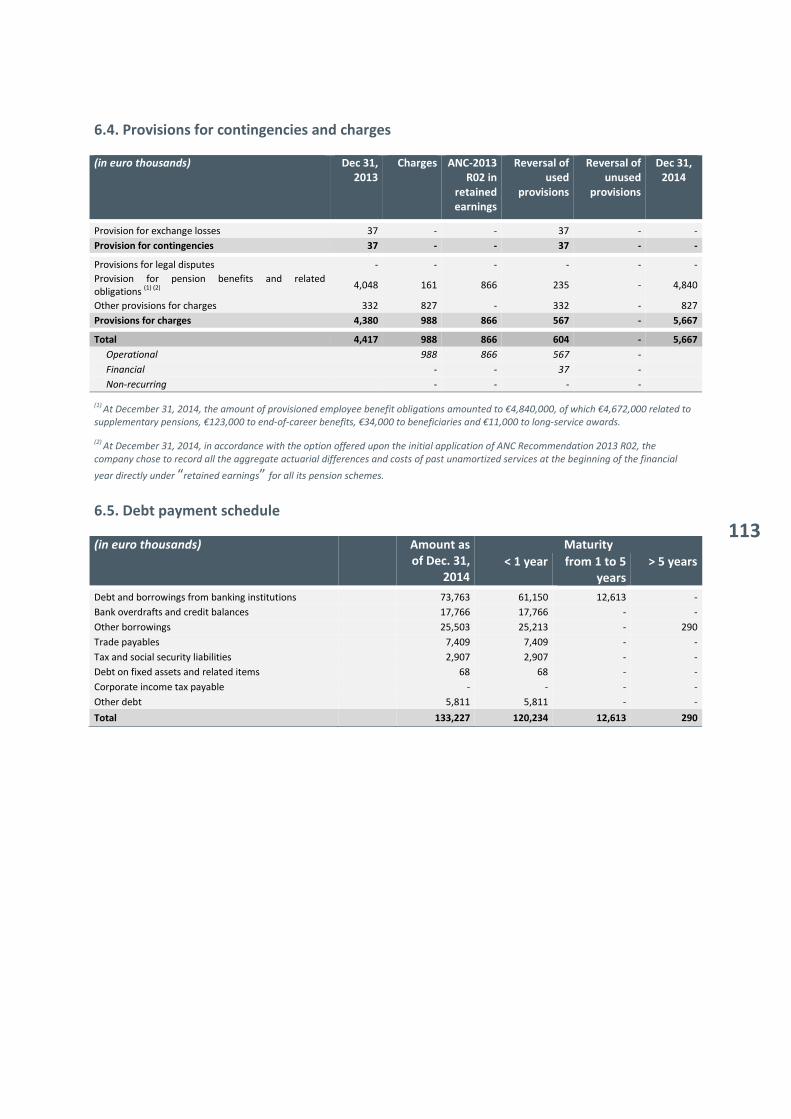
113
6.4. Provisions for contingencies and charges (in euro thousands) Dec 31,
2013
Charges ANC-2013
R02 in
retained
earnings
Reversal of
used
provisions
Reversal of
unused
provisions
Dec 31,
2014
Provision for exchange losses 37 - - 37 - -
Provision for contingencies 37 - - 37 - -
Provisions for legal disputes - - - - - -
Provision for pension benefits and related obligations (1) (2)
4,048 161 866 235 - 4,840
Other provisions for charges 332 827 - 332 - 827
Provisions for charges 4,380 988 866 567 - 5,667
Total 4,417 988 866 604 - 5,667
Operational 988 866 567 -
Financial - - 37 -
Non-recurring - - - -
(1) At December 31, 2014, the amount of provisioned employee benefit obligations amounted to €4,840,000, of which €4,672,000 related to
supplementary pensions, €123,000 to end-of-career benefits, €34,000 to beneficiaries and €11,000 to long-service awards.
(2) At December 31, 2014, in accordance with the option offered upon the initial application of ANC Recommendation 2013 R02, the
company chose to record all the aggregate actuarial differences and costs of past unamortized services at the beginning of the financial
year directly under “retained earnings” for all its pension schemes.
6.5. Debt payment schedule (in euro thousands) Amount as
of Dec. 31,
2014
Maturity
< 1 year from 1 to 5
years
> 5 years
Debt and borrowings from banking institutions 73,763 61,150 12,613 -
Bank overdrafts and credit balances 17,766 17,766 - -
Other borrowings 25,503 25,213 - 290
Trade payables 7,409 7,409 - -
Tax and social security liabilities 2,907 2,907 - -
Debt on fixed assets and related items 68 68 - -
Corporate income tax payable - - - -
Other debt 5,811 5,811 - -
Total 133,227 120,234 12,613 290

>
2014 FINANCIAL REPORT 2014 FINANCIAL STATEMENT – JACQUET METAL SERVICE S.A.
114
6.6. Foreign exchange liabilities (in euro thousands) Dec. 31, 2014 Dec. 31, 2013
Receivables 55 -
Payables - -
Total 55 -
7. Other information
7.1. Year-end headcount
Dec. 31, 2014 Dec. 31, 2013
Executive staff 15 15
Technical staff - -
Clerical staff - -
Total 15 15
7.2. Individual training entitlement (DIF) The aggregate training hours earned by employees under the DIF program that have not yet been used by the employees amounted to 1,714 hours at December 31, 2014.
7.3. Compensation paid to corporate officers
The Company has two executive corporate officers, to whom the compensation and direct and indirect benefits of all kinds paid in 2014 amounted to €850,000, compared with €806,000 in 2013. Attendance fees, which are the only compensation paid to Jacquet Metal Service S.A.’s non-executive directors, amounted to €71,000 in 2014 compared with €77,000 in 2013. Transactions between Jacquet Metal Service S.A. and its executive officers
(in euro
thousands)
Sites Rents 2014 (excl.
VAT)
Rents 2013 (excl.
VAT)
Tenants
Saint Priest - France (69)
424 423 Jacquet Metal Service S.A.
Villepinte - France (93) 118 118 Jacquet Metal Service S.A.
Lyon - France (69) 473 215 Jacquet Metal Service S.A.
Migennes - France (89) 210 210 Jacquet Metal Service S.A.
Loans and guarantees granted to executive officers
None.
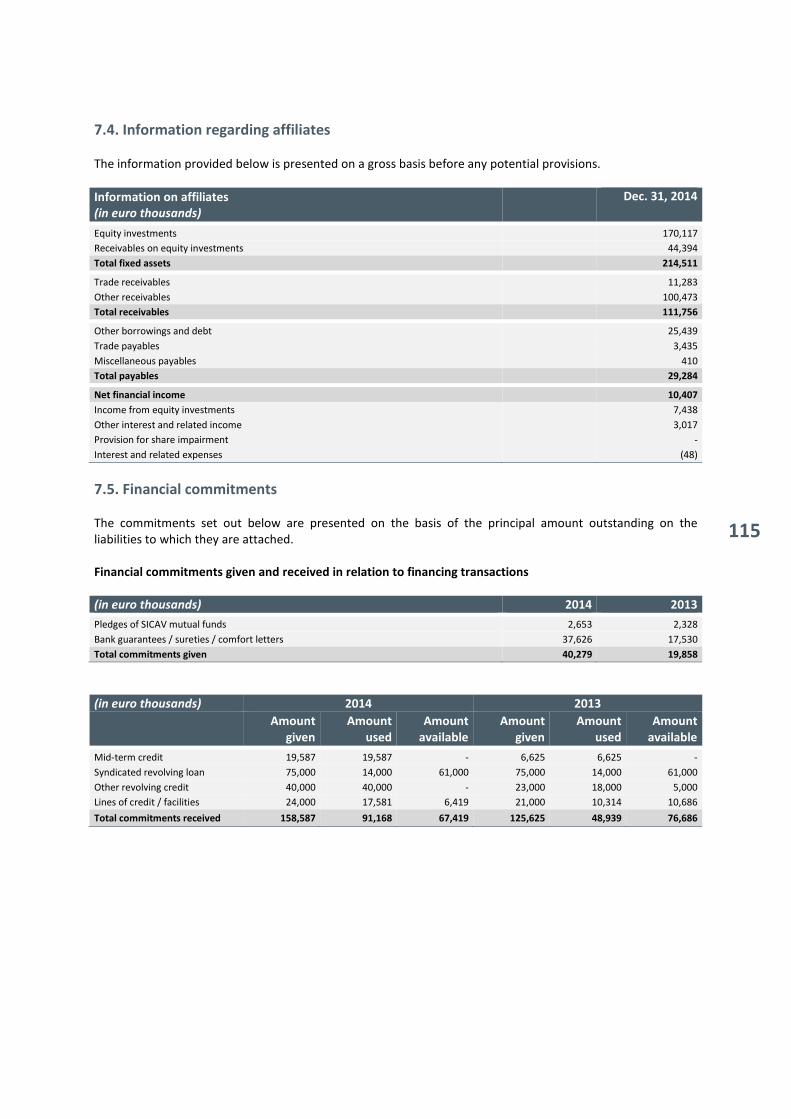
115
7.4. Information regarding affiliates The information provided below is presented on a gross basis before any potential provisions.
Information on affiliates (in euro thousands)
Dec. 31, 2014
Equity investments 170,117
Receivables on equity investments 44,394
Total fixed assets 214,511
Trade receivables 11,283
Other receivables 100,473
Total receivables 111,756
Other borrowings and debt 25,439
Trade payables 3,435
Miscellaneous payables 410
Total payables 29,284
Net financial income 10,407
Income from equity investments 7,438
Other interest and related income 3,017
Provision for share impairment -
Interest and related expenses (48)
7.5. Financial commitments The commitments set out below are presented on the basis of the principal amount outstanding on the liabilities to which they are attached. Financial commitments given and received in relation to financing transactions
(in euro thousands) 2014 2013
Pledges of SICAV mutual funds 2,653 2,328
Bank guarantees / sureties / comfort letters 37,626 17,530
Total commitments given 40,279 19,858
(in euro thousands) 2014 2013
Amount
given
Amount
used
Amount
available
Amount
given
Amount
used
Amount
available
Mid-term credit 19,587 19,587 - 6,625 6,625 -
Syndicated revolving loan 75,000 14,000 61,000 75,000 14,000 61,000
Other revolving credit 40,000 40,000 - 23,000 18,000 5,000
Lines of credit / facilities 24,000 17,581 6,419 21,000 10,314 10,686
Total commitments received 158,587 91,168 67,419 125,625 48,939 76,686
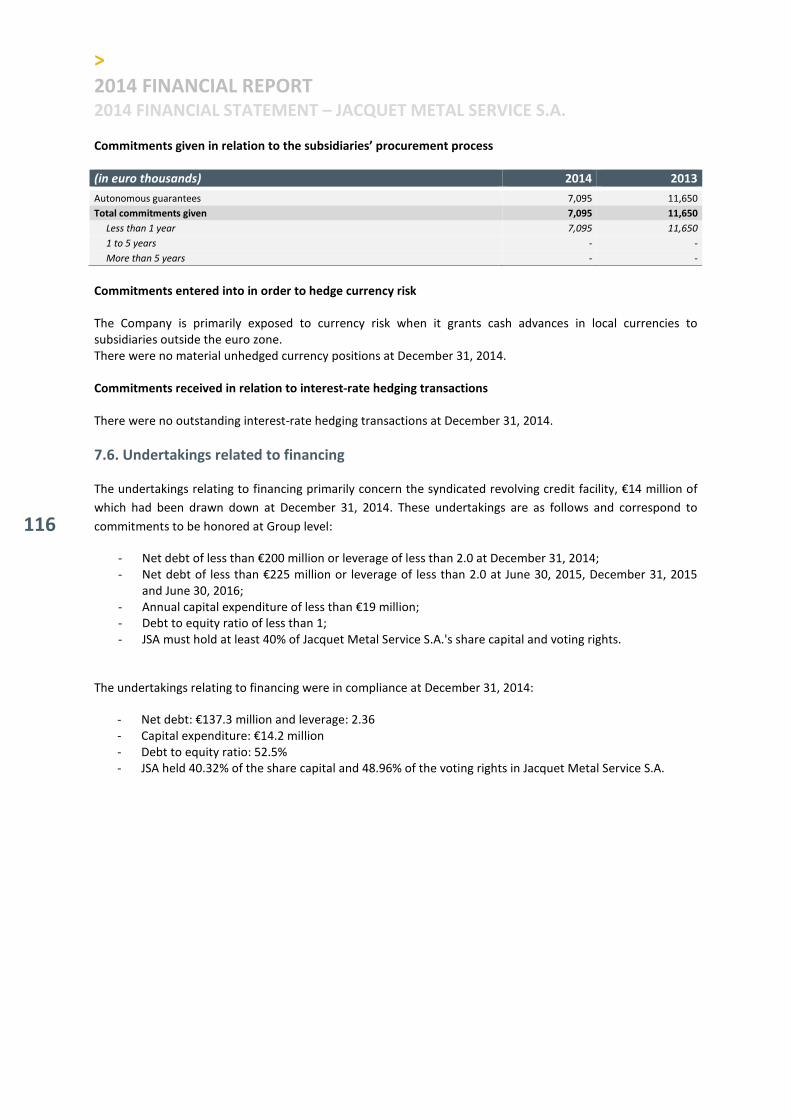
>
2014 FINANCIAL REPORT 2014 FINANCIAL STATEMENT – JACQUET METAL SERVICE S.A.
116
Commitments given in relation to the subsidiaries’ procurement process
(in euro thousands) 2014 2013
Autonomous guarantees 7,095 11,650
Total commitments given 7,095 11,650
Less than 1 year 7,095 11,650
1 to 5 years - -
More than 5 years - -
Commitments entered into in order to hedge currency risk
The Company is primarily exposed to currency risk when it grants cash advances in local currencies to subsidiaries outside the euro zone. There were no material unhedged currency positions at December 31, 2014. Commitments received in relation to interest-rate hedging transactions
There were no outstanding interest-rate hedging transactions at December 31, 2014.
7.6. Undertakings related to financing The undertakings relating to financing primarily concern the syndicated revolving credit facility, €14 million of
which had been drawn down at December 31, 2014. These undertakings are as follows and correspond to
commitments to be honored at Group level:
- Net debt of less than €200 million or leverage of less than 2.0 at December 31, 2014; - Net debt of less than €225 million or leverage of less than 2.0 at June 30, 2015, December 31, 2015
and June 30, 2016; - Annual capital expenditure of less than €19 million; - Debt to equity ratio of less than 1; - JSA must hold at least 40% of Jacquet Metal Service S.A.'s share capital and voting rights.
The undertakings relating to financing were in compliance at December 31, 2014:
- Net debt: €137.3 million and leverage: 2.36 - Capital expenditure: €14.2 million - Debt to equity ratio: 52.5% - JSA held 40.32% of the share capital and 48.96% of the voting rights in Jacquet Metal Service S.A.

117
6. STATUTORY AUDITORS' REPORT ON THE COMPANY FINANCIAL
STATEMENTS (Free translation of French-language original)
To the Shareholders, In compliance with the assignment entrusted to us by your annual general meetings, we hereby report to you, for the year ended 31 December 2014 on:
- the audit of the accompanying financial statements of JACQUET METAL SERVICE SA ; - the justification of our assessments ; - the specific verifications and information required by law .
The financial statements have been approved by the Board of Directors. Our role is to express an opinion on these financial statements based on our audit. I. Opinion on the financial statements
We conducted our audit in accordance with professional standards applicable in France; those standards require that we plan and perform the audit to obtain reasonable assurance about whether the financial statements are free of material misstatement. An audit involves performing procedures, using sampling techniques or other methods of selection, to obtain audit evidence about the amounts and disclosures in the financial statements. An audit also includes evaluating the appropriateness of accounting policies used and the reasonableness of accounting estimates made, as well as the overall presentation of the financial statements. We believe that the audit evidence we have obtained is sufficient and appropriate to provide a basis for our audit opinion. In our opinion, the financial statements give a true and fair view of the assets and liabilities and of the financial position of the company as at 31 December 2014 and of the results of its operations for the year then ended in accordance with French accounting principles. Without qualifying our opinion, we draw your attention to the paragraph "Provision for employee benefit obligations" under Note 2 to the financial statements relating to the first-time application of ANC Recommendation 2013-02. II. Justification of our assessments
In accordance with the requirements of article L. 823-9 of the French Commercial Code (Code de commerce)
relating to the justification of our assessments, we bring to your attention the following matter:
The equity securities, recorded in the balance sheet as at 31 December 2014 for the net amount of €157.8m,
are measured at their acquisition cost and depreciated on the basis of their recoverable amount according to
the conditions described in the paragraph “Financial Assets” of Note 2 to the financial statements..
On the basis of the information provided to us, our work consisted in assessing the data on which these
recoverable values were based, in particular reviewing the updated prospects of profitability for the activities
concerned and of the achievement of their goals, and verifying the consistency of the assumptions adopted
with the forecasts based on the strategic plans drawn up by each of the entities under the control of the
general management.
Within the context of our assessments, we verified the reasonableness of these estimates.

118
These assessments were made as part of our audit of the financial statements taken as a whole, and therefore
contributed to the opinion we formed which is expressed in the first part of this report.
III. Specific verifications and information
We have also performed, in accordance with professional standards applicable in France, the specific verifications required by French law. We have no matters to report as to the fair presentation and the consistency with the financial statements of the information given in the management report of the Board of Directors and in the documents addressed to shareholders with respect to the financial position and the financial statements. Concerning the information given in accordance with the requirements of article L. 225-102-1 of the French Commercial Code (Code de commerce) relating to remunerations and benefits received by the directors and any other commitments made in their favour, we have verified its consistency with the financial statements, or with the underlying information used to prepare these financial statements and, where applicable, with the information obtained by your company from companies controlling your company or controlled by it. Based on this work, we attest the accuracy and fair presentation of this information. In accordance with French law, we have verified that the required information concerning the identity of the shareholders and holders of the voting rights has been properly disclosed in the management report. Lyon, March 10th, 2015
The Statutory Auditors
French original signed by:
Grant Thornton
French member of Grant Thornton
International
ERNST & YOUNG et Autres
Françoise Mechin
Partner
Lionel Denjean
Partner
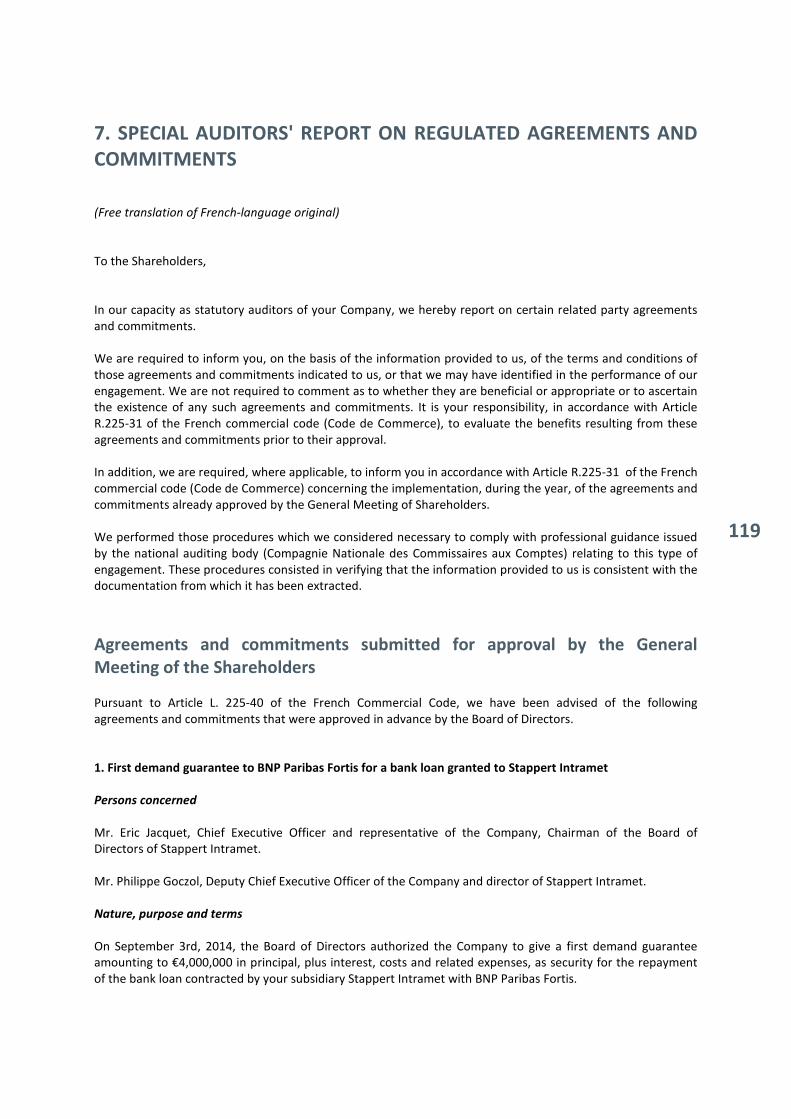
119
7. SPECIAL AUDITORS' REPORT ON REGULATED AGREEMENTS AND
COMMITMENTS (Free translation of French-language original)
To the Shareholders, In our capacity as statutory auditors of your Company, we hereby report on certain related party agreements and commitments. We are required to inform you, on the basis of the information provided to us, of the terms and conditions of those agreements and commitments indicated to us, or that we may have identified in the performance of our engagement. We are not required to comment as to whether they are beneficial or appropriate or to ascertain the existence of any such agreements and commitments. It is your responsibility, in accordance with Article R.225-31 of the French commercial code (Code de Commerce), to evaluate the benefits resulting from these agreements and commitments prior to their approval. In addition, we are required, where applicable, to inform you in accordance with Article R.225-31 of the French commercial code (Code de Commerce) concerning the implementation, during the year, of the agreements and commitments already approved by the General Meeting of Shareholders. We performed those procedures which we considered necessary to comply with professional guidance issued by the national auditing body (Compagnie Nationale des Commissaires aux Comptes) relating to this type of engagement. These procedures consisted in verifying that the information provided to us is consistent with the documentation from which it has been extracted.
Agreements and commitments submitted for approval by the General
Meeting of the Shareholders
Pursuant to Article L. 225-40 of the French Commercial Code, we have been advised of the following agreements and commitments that were approved in advance by the Board of Directors. 1. First demand guarantee to BNP Paribas Fortis for a bank loan granted to Stappert Intramet
Persons concerned
Mr. Eric Jacquet, Chief Executive Officer and representative of the Company, Chairman of the Board of Directors of Stappert Intramet. Mr. Philippe Goczol, Deputy Chief Executive Officer of the Company and director of Stappert Intramet.
Nature, purpose and terms
On September 3rd, 2014, the Board of Directors authorized the Company to give a first demand guarantee amounting to €4,000,000 in principal, plus interest, costs and related expenses, as security for the repayment of the bank loan contracted by your subsidiary Stappert Intramet with BNP Paribas Fortis.
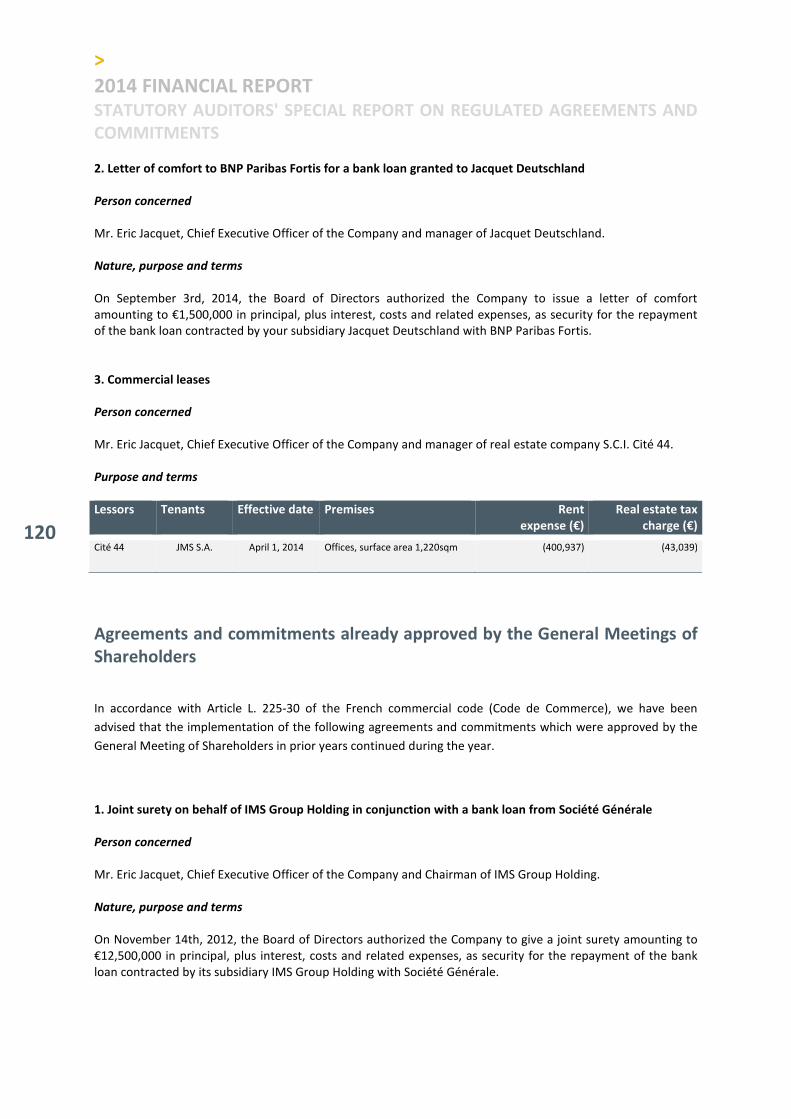
>
2014 FINANCIAL REPORT STATUTORY AUDITORS' SPECIAL REPORT ON REGULATED AGREEMENTS AND
COMMITMENTS
120
2. Letter of comfort to BNP Paribas Fortis for a bank loan granted to Jacquet Deutschland
Person concerned
Mr. Eric Jacquet, Chief Executive Officer of the Company and manager of Jacquet Deutschland. Nature, purpose and terms
On September 3rd, 2014, the Board of Directors authorized the Company to issue a letter of comfort amounting to €1,500,000 in principal, plus interest, costs and related expenses, as security for the repayment of the bank loan contracted by your subsidiary Jacquet Deutschland with BNP Paribas Fortis.
3. Commercial leases
Person concerned
Mr. Eric Jacquet, Chief Executive Officer of the Company and manager of real estate company S.C.I. Cité 44. Purpose and terms
Lessors Tenants Effective date Premises Rent
expense (€)
Real estate tax charge (€)
Cité 44 JMS S.A. April 1, 2014 Offices, surface area 1,220sqm (400,937) (43,039)
Agreements and commitments already approved by the General Meetings of
Shareholders In accordance with Article L. 225-30 of the French commercial code (Code de Commerce), we have been
advised that the implementation of the following agreements and commitments which were approved by the
General Meeting of Shareholders in prior years continued during the year.
1. Joint surety on behalf of IMS Group Holding in conjunction with a bank loan from Société Générale
Person concerned
Mr. Eric Jacquet, Chief Executive Officer of the Company and Chairman of IMS Group Holding. Nature, purpose and terms
On November 14th, 2012, the Board of Directors authorized the Company to give a joint surety amounting to €12,500,000 in principal, plus interest, costs and related expenses, as security for the repayment of the bank loan contracted by its subsidiary IMS Group Holding with Société Générale.

121
2. Non-compete commitment of Mr. Philippe Goczol Nature and purpose
On November 15
th, 2010 the Board of Directors authorized the signing of a non-compete agreement with
Philippe Goczol, Deputy Chief Executive Officer, for a period of no more than one year following the termination of his duties as Deputy Chief Executive Officer. During the contractual non-compete period, the Company shall pay the Deputy Chief Executive Officer monthly financial compensation. Terms
This agreement did not apply during 2014.
3. Indemnity for termination or non-renewal of Philippe Goczol's term of office Nature and purpose
On November 15
th, 2010 the Board of Directors decided to grant Philippe Goczol an indemnity for the
termination or non-renewal of his duties as the Company's Deputy Chief Executive Officer and determined the conditions for the payment and amount of said indemnity. Terms
This agreement did not apply during 2014.
4. Commercial leases
Person concerned
Mr. Eric Jacquet, Chief Executive Officer of the Company and manager of Jeric, S.C.I. Migennes and S.C.I. Cité 44.

>
2014 FINANCIAL REPORT STATUTORY AUDITORS' SPECIAL REPORT ON REGULATED AGREEMENTS AND
COMMITMENTS
122
Purpose and terms
Lessors Tenants Effective date Premises Rent
expense (€)
Real
estate
tax
charge (€)
Jeric JMS S.A. September 1, 2002 2,442sqm of land in Saint-Priest (69) (5,912) -
Jeric JMS S.A. January 1, 2003 Land for storage purposes in Saint-Priest (69) (45,971) -
Jeric JMS S.A. January 1, 2003 Property located in Rue Michel Jacquet, Saint-Priest (69)
(353,693) (39,106)
Jeric JMS S.A. January 1, 2003 Industrial property located in Villepinte (93) (118,102) (44,952)
Real estate companies Migennes JMS S.A. January 1, 2003 Industrial property located in Migennes (89) (209,883) (36,299)
Jeric JMS S.A. January 1, 2004 Apartment named "Flexovit" located in Rue du Mâconnais, Saint-Priest (69)
(5,931) -
Jeric JMS S.A. January 1, 2004 Archive premises of 95sqm located in Rue du Mâconnais, Saint-Priest (69)
(832) -
Jeric JMS S.A. March 23, 2004 House named "Torres" located in Rue du Lyonnais
(5,862) -
Jeric JMS S.A. January 1, 2005 House named "Garcia" located in Rue du Lyonnais, Saint-Priest (69)
(5,426) -
Cité 44. JMS S.A. April 1, 2013 Rented offices with 1,010sqm surface area (71,653) -
Total (823,265) (120,357)
Lyon, March 10th, 2015
The Statutory Auditors
French original signed by:
Grant Thornton
French member of Grant Thornton
International
ERNST & YOUNG et Autres
Françoise Mechin
Lionel Denjean

123
8. REPORT OF THE CHAIRMAN OF THE BOARD OF DIRECTORS ON
THE CONDITIONS FOR PREPARING AND ORGANIZING THE BOARD'S
WORK AND ON INTERNAL CONTROL PROCEDURES In accordance with Article L. 225-37 of the French Commercial Code, this report of the Chairman of the Board of Directors is intended to inform the shareholders of the conditions for preparing and organizing the work of the Board of Directors and the internal control procedures implemented by the Company. This report was prepared by the Chairman with the assistance of the internal audit department. It was reviewed by the Audit and Risk Committee on March 3, 2015 and approved by the Board of Directors on March 4, 2015.
CONDITIONS FOR PREPARING AND ORGANIZING THE BOARD'S WORK AND
CORPORATE GOVERNANCE The work of the Board of Directors is prepared and organized in accordance with the statutory and regulatory provisions applicable to French corporations ("sociétés anonymes") with a Board of Directors, the Company's bylaws and the Board's internal regulations.
1. Corporate governance The Company follows the AFEP-MEDEF corporate governance code for listed companies, revised in June 2013 and available for consultation on the MEDEF website, hereinafter referred to as the "Reference Code". The Company declares that it applies the recommendations of the Reference Code, except with regard to the staggered renewal of directors' appointments (Recommendation 14) in view of the short duration of Company directors' terms of office (two years).
2. Board of Directors Independence criteria for Board members
In accordance with the provisions of its internal regulations, the Board ensures that at least half of its members are independent according to the current criteria pertaining to "corporate governance". The independence of Board members is tested against the following criteria:
- Not being and not having been, over the past five years, an employee or corporate officer of the Company or of a Group company;
- Not being a corporate officer of a company in which the Company directly or indirectly holds office as a director or member of the Supervisory Board;
- Not being a corporate officer of a company in which an employee designated as such or a corporate officer of the Company (currently or during the past five years) holds office as a director or member of the Supervisory Board;
- Not being a major customer, supplier, corporate banker or investment banker of the Company or Group or one for whom the Company or Group accounts for a material part of its business;
- Not having close family ties with a corporate executive officer of the Company or of a Group company; - Not having been a statutory auditor of the Company over the past five years; - Not being a Supervisory Board member or director for more than twelve years, on the understanding
that the status of independent director will not be forfeited until the end of the term of office during which the twelve-year period expires;
- Not being the principal shareholder of the Company or, where applicable, of the parent company that controls the Company within the meaning of Article L. 233-3 of the French Commercial Code.

>
2014 FINANCIAL REPORT BOARD OF DIRECTORS’ CHAIRMAN’S REPORT
124
Even if a director complies with all of the foregoing criteria, the Board of Directors may nonetheless decide not to qualify them as independent in view of their particular situation. The independent member qualification is discussed each year by the Appointment and Compensation Committee and reviewed on a case-by-case basis each year by the Board of Directors, with reference to the foregoing criteria, prior to the publication of the annual report. Membership of the Board of Directors
The membership of the Board of Directors is outlined in Section 4.1 of the Group presentation. Organization of the Board of Directors as defined by internal regulations
On July 20, 2010 the Board of Directors adopted its internal regulations and updated them on January 22, 2014 so as to take account of the June 2013 revisions to the Reference Code. The Board of Directors' internal regulations include and detail the operational and organizational rules applicable to it under law and the Company's bylaws as well as the operational rules of the standing committees that have been set up. The internal regulations set forth:
- The competences and powers of the Board of Directors; - The duties and obligations of its members with regard to the principles of confidentiality applicable to
privileged information and the rules of independence and fairness; - Each member's duty to notify the Board of any actual or potential conflict of interests in which they
may be directly or indirectly involved; in such a case, the director shall refrain from participating in discussions and decisions on the issues concerned;
- The rules applying to transactions involving the Company's shares as set out in Article L. 621-18-2 of the French Monetary and Financial Code and Articles 222-14 and 222-15 of the General Regulation of the Autorité des marchés financiers (French market regulator or AMF).
The rules specify that the Board of Directors should meet at least once a quarter and provide for the option of participating in meetings by means of videoconference or telecommunications technology, except for meetings called to approve the annual financial statements or to vote on the dismissal of the Board Chairman or Vice-chairman. The internal regulations also lay down the operational rules for the Board's two committees, the Audit and Risk Committee and the Appointment and Compensation Committee; The internal regulations also provide that, at least once a year, the Board of Directors shall be convened by its Chairman to review and assess the Board's work. Tasks and proceedings of the Board of Directors
The Board of Directors determines the Group's business strategy and sees to its implementation. It addresses all matters concerning the efficient running of the Company and, through its deliberations, settles issues over which it has authority. In this context, the Board notably:
- deliberates on Group strategy and the operations ensuing from it and, more generally, on all material transactions, particularly those involving investments or divestments;
- appoints the Company's senior management and oversees its management; - monitors the quality of information provided to the shareholders and to the stock market, especially
the information provided via the financial statements and annual report or when material transactions are concluded.

125
Conclusion of the following transactions requires the prior authorization of the Board of Directors:
- All acquisitions or divestments of equity interests or acquisitions or divestments of business undertakings for an enterprise value of more than €5 million per transaction;
- All material transactions falling outside the scope of the Company's published strategy; - Endorsements, sureties and guarantees, subject to the conditions provided for by applicable
legislation. The Chairman or, where applicable, the Vice-chairman organizes and directs the work of the Board of Directors and reports to the General Meeting on the Board's work. The Chairman oversees the operation of the Company's bodies, in particular that of the Board's committees. The Chairman ensures that Board members are able to perform their duties and that the Board spends sufficient time on issues impacting the Group's future. Given that the positions of Chairman and CEO are combined in a single person, the Chairman of the Board of Directors is the sole person empowered to make statements on the Board's behalf. Activity of the Board of Directors
In 2014, the Board of Directors of Jacquet Metal Service met nine times. Every director receives invitations to Board meetings together with the agenda and technical documentation for the issues discussed, generally one week before the meeting: In particular, the Board of Directors:
- reviewed the 2014 budget; - authorized the Chairman to grant guarantees on behalf of the Company; - allocated the attendance fees for 2013; - carried out the three-year review of its operations; - amended the internal regulations following the June 2013 revision of the AFEP MEDEF corporate
governance code; - temporarily appointed HISCAN PATRIMONIO as director replacing CCAN 2007; - reviewed the quarterly, half-year and annual consolidated and parent company financial statements; - approved the report of the Chairman of the Board of Directors on the conditions for preparing and
organizing the work of the Board of Directors and on the internal control procedures implemented by the Company;
- approved the reports and draft resolutions submitted by the Board of Directors to the June 26, 2014 General Meeting;
- renewed and defined the terms of office, powers and compensation of the Chairman and CEO and the Deputy Chief Executive Officer;
- appointed the standing committee members; - exercised the authority granted to the Board of Directors by the June 26, 2014 General Meeting to
purchase or transfer the Company's shares; - approved the acquisition of ROLARK (Canada); - authorized the re-assignment of various equity investments within the Group; - reviewed all minutes of proceedings of the Audit and Risk Committee and the Appointment and
Compensation Committee; - in relation to issues currently affecting the Group, noted the progress made on current projects as well
as events and transactions of significant importance for the Company. The meetings of the Board of Directors lasted for two hours on average. The average attendance rate was 93.83%. The statutory auditors were invited to all Board meetings.
>
2014 FINANCIAL REPORT BOARD OF DIRECTORS’ CHAIRMAN’S REPORT
126
Assessment of the Board's work
In accordance with the recommendations of the Reference Code, the Board carries out an assessment of its own work every year and conducts a more in-depth review every three years. Accordingly, once a year the Board assigns one item on its agenda to this assessment and holds a discussion on its work with a view to improving its efficiency, ensuring that important issues are adequately prepared and discussed by the Board and measuring each member's actual contribution to its work. The three-year assessment was carried out by means of a questionnaire given to directors at the November 7, 2013 meeting and the Board reviewed the responses during its January 22, 2014 meeting. The responses showed that most directors consider that the Company applies proper corporate governance rules. The Board of Directors concluded that the frequency and length of its meetings and the information provided in advance enabled it to duly perform its duties.
3. Standing committees
3.1. Audit and Risk Committee The Audit and Risk Committee comprises three members deemed to be independent and competent, in accordance with the Reference Code's recommendations. At its June 29, 2012 meeting the Board of Directors appointed Jean Jacquet (Chairman), Xavier Gailly and Jacques Leconte as members of the Audit and Risk Committee for their term of office as directors. At its June 26, 2014 meeting the Board of Directors replaced Jacques Leconte with Françoise Papapietro and reappointed Jean Jacquet (Chairman) and Xavier Gailly as committee members. The Audit and Risk Committee's tasks are to:
- verify the appropriateness of the accounting methods applied in the preparation of the parent company and consolidated financial statements;
- investigate any problems encountered in the application of the accounting methods; - before presentation to the Board of Directors, review the parent company and consolidated financial
statements, budgets and forecasts and, to this end, review the annual, half-year and, where applicable, quarterly financial statements, the accounting principles and methods, the Company's audit and internal control principles and methods, and the analyses and reports concerning financial reporting, accounting policy and communications between the Chairman and CEO and the Company's statutory auditors;
- monitor the quality of, and compliance with, the internal control procedures and assess the information received from the Board of Directors, the Company's internal committees and the internal and external auditors;
- review and verify the rules and procedures applicable to conflicts of interest and to the identification and measurement of the main financial risks, verify the application of these rules and submit an annual assessment thereof to the Board of Directors;
- oversee the selection, appointment and re-appointment of the statutory auditors, provide an opinion on the amount of professional fees requested by the auditors, verify their independence and impartiality in the case of statutory auditors belonging to a network that provides both auditing and advisory services and submit the results of its work to the Board of Directors;
- review the schedule for the statutory auditors' inspections, the results of their audits, their recommendations and follow-up thereof;
- determine the rules concerning the engagement of the statutory auditors on assignments other than those related to the audit of the financial statements and entrust additional audit assignments to external auditors;
127
- guarantee the independence of the statutory auditors and, in particular, ensure that their professional fees and additional services have no impact on such independence;
- more generally, review, control and evaluate anything that might affect the truth and accuracy of the financial statements.
To fulfill its duties, the Audit and Risk Committee has access to all accounting and financial documentation. It conducts interviews with the persons responsible for preparing the financial statements, the internal audit manager and the statutory auditors in order to obtain assurance that the auditors have had access to all the information required for their work, in particular with regard to the consolidated subsidiaries, and that they have made sufficient progress by the time the financial statements are due for approval so as to be able to communicate all material observations. The rules governing the organization, operation, assignments and characteristics of the Audit and Risk Committee are specified in the internal regulations of the Board of Directors. The Audit and Risk Committee meets at three times per year, prior to Board meetings whose agenda includes the following points:
- Review of the half-year and full-year Company and consolidated financial statements including related audit reports;
- Review of the budget; - The committee also monitors potential risks incurred by the Group. It reports to the Board of Directors
on its work. Activity of the Audit and Risk Committee
The Audit and Risk Committee met four times in 2014 and had an attendance rate of 91.67%. On average, its meetings lasted two hours. The committee's work primarily consisted of reviewing the Group and Company annual and half-year financial statements and verifying the proper application of the accounting principles, the accounts closing procedure and the statutory auditors' conclusions following completion of their audits. The Audit and Risk Committee also issued a recommendation for the appointment of the statutory auditors to be submitted to the General Meeting on the basis of a limited tender procedure. Lastly, the Audit and Risk Committee reviewed the work of the internal audit department, particularly with regard to the follow-up of the statutory auditors' recommendations, as well as the department's conclusions on specific audit assignments and the proposed approach to the organization of internal control and the identification and monitoring of risks. The Audit and Risk Committee reported to the Board of Directors on its work. Assessment of the work of the Audit and Risk Committee
At their March 3, 2015 meeting, the members of the Audit and Risk Committee reviewed and assessed the work of the committee. This assessment was performed by committee members and primarily covered committee membership, frequency and length of meetings, the quality of the discussions, the work of the committee, communication of information to committee members, committee members' compensation and access to Group management.
>
2014 FINANCIAL REPORT BOARD OF DIRECTORS’ CHAIRMAN’S REPORT
128
The Audit and Risk Committee concluded that the frequency and length of its meetings and the information provided in advance to the committee and its members enabled it to duly perform its duties.
3.2. Appointment and Compensation Committee
The Appointment and Compensation Committee comprises three members deemed to be independent and competent, in accordance with the Reference Code's recommendations. At its June 29, 2012 meeting the Board of Directors appointed Jean-François Clément (Chairman), Henri-Jacques Nougein and Jean Jacquet as members for their term of office as directors. Following the death of Jean-François Clément on March 13, 2014, on April 23, 2014 the Board appointed Jacques Leconte as member and Henri-Jacques Nougein as chairman of the Appointment and Compensation Committee. During the June 26, 2014 Board meeting, all Committee members were reappointed.
The Appointment and Compensation Committee's tasks are to: - communicate to the Board of Directors all proposals regarding all compensation and benefits offered
to corporate executive officers, including all components thereof; - issue an opinion on the hiring of new directors or CEO(s) and on the determination of and changes to
all components of their compensation; - prepare a succession plan for corporate executive officers in order to propose solutions, particularly in
the event of unforeseen vacancies; - contribute towards the preparation of the annual report with regard to information for the
shareholders on the compensation paid to corporate officers; and - notify the Board of Directors of any recommendations it may have concerning all Company staff
compensation and profit-sharing systems, by any means, including employee savings plans, reserved issues of convertible securities and stock option allocations.
To this end, the Appointment and Compensation Committee sees that all requisite and useful information is communicated to it sufficiently in advance of the relevant committee meeting so that the members have sufficient time to review such information before the meeting. The committee conducts any interviews, with any persons, that may be necessary or useful with regard to the fulfillment of its duties. Activity of the Appointment and Compensation Committee
The Appointment and Compensation Committee met four times in 2014 and had an attendance rate of 100%. On average, its meetings lasted two hours. The Appointment and Compensation Committee reported to the Board of Directors on its work, which primarily consisted of a review of: - Directors' compensation in respect of 2013 in view of the Committee's recommendation regarding
compensation; - The expiry of directors' terms of office and legal issues related to reappointing them, including in relation
to the ratio of female directors on the Board; - Applications to become a director; - Assessment of the Appointment and Compensation Committee's operating procedures; - Reporting details of directors' compensation to shareholders; - Procedures for senior management (i.e. whether or not to separate the positions of Chairman and Chief
Executive Officer)
129
- Proposed directors' reappointment and compensation in respect of the Chairman and CEO and the Deputy
Chief Executive Officer.
Assessment of the work of the Appointment and Compensation Committee
During its March 4, 2015 meeting, the Committee assessed its operating procedures. This assessment was performed by committee members largely based on a questionnaire given to all members primarily covering committee membership, frequency and length of meetings, the quality of the discussions, the work of the committee, communication of information to committee members, committee members' compensation and access to Group management. The Appointment and Compensation Committee concluded that the frequency of its meetings, which varies from year to year depending on the number of issues to be discussed, the length of meetings and the information provided in advance to each committee member enabled it to duly perform its duties.
4. Principles and rules for setting corporate officers' compensation Compensation of members of the Board of Directors
Rules of Board member compensation
The compensation paid to Board members is set by the General Meeting of the Company's shareholders, in accordance with the bylaws and with the allocation determined by the Board of Directors, taking into account (i) each member's physical attendance of Board meetings and, where applicable, committee meetings, and (ii) any specific assignments entrusted to individual Board members. Compensation paid to Eric Jacquet as Chairman and CEO and to Philippe Goczol as Deputy CEO
Compensation
In their capacity as corporate executive officers, Eric Jacquet and Philippe Goczol are not bound by an employment contract. On the recommendation of the Appointment and Compensation Committee, the Board of Directors approved the fixed and variable compensation of the Chairman and CEO and Deputy CEO, in addition to any commitments undertaken by the Company. Within the scope of its work, the Appointment and Compensation Committee paid particular attention to the surveys carried out by the French ATH association's "financial reporting observatory" on the 2008 compensation of 400 directors of non-CAC 40 companies, banks and financial services companies, and to the relevant recommendations of the Reference Code. Variable compensation is mainly determined on the basis of net profit criteria. The calculation is based on the value of net income (Group share) as a percentage of Group sales. Variable compensation is payable annually, after Group results have been reported. Attendance fees
Mr. Eric Jacquet is entitled to receive a portion of the attendance fees set by the General Meeting of shareholders and allocated by the Board of Directors. As Philippe Goczol is not a director of Jacquet Metal Service, he receives no attendance fees.
>
2014 FINANCIAL REPORT BOARD OF DIRECTORS’ CHAIRMAN’S REPORT
130
Bonus shares
There is no bonus share plan in operation.
Pension schemes
The Company pays contributions for retirement benefits and supplementary pension contributions based on a formula common to Company employees, corporate officers and directors.
Unemployment insurance
The Company pays a contribution to Mr. Philippe Goczol in the form of a GSC-type directors' unemployment insurance policy, which provides for payment of an indemnity during a period of no more than 18 months as from the month following the occurrence of the event covered by the policy.
Non-compete indemnity payable to Mr. Philippe Goczol
On November 15, 2010, on the recommendation of the Appointment and Compensation Committee, the Board of Directors approved a non-compete agreement with Philippe Goczol to apply after he leaves the Company. The Board of Directors renewed its approval during the June 29, 2012 and June 26, 2014 meetings.
Under this agreement, Mr. Goczol is prohibited, for a period of one year, from directly or indirectly competing with the Company's or Group companies' business activities in the Benelux countries, mainland France and adjacent countries, in any manner whatsoever, including by means of e-commerce. It is specified that the Company shall be entitled to waive the non-compete agreement and therefore not be required to pay the corresponding financial compensation.
Termination indemnity payable to Mr. Philippe Goczol in the event of contract termination or change of
position
On November 15, 2010, on the recommendation of the Appointment and Compensation Committee, the Board of Directors approved the terms and conditions for the payment of termination indemnities in the event of termination of office. The Board of Directors renewed its approval during the June 29, 2012 and June 26, 2014 meetings.
The amount of the indemnity is based on the change in the Company's theoretical enterprise value (TEV) between:
- 2010, when Mr. Philippe Goczol took office; and - the average TEV for the benchmark period, including the year of departure and the two previous
years.
This indemnity shall amount to 6 months’ salary, if the TEV has increased by an average of 3% to 6% per year
compared with 2010, and to 12 months’ salary, if the average increase is higher than 6% per year. No
indemnity will be paid if the average increase in the TEV is less than 3% per year. The following definitions shall apply for the calculation of the indemnities referred to above:
- the reference salary used to calculate the indemnity equals the gross average fixed and variable compensation payable for the last three financial years for which the relevant information is available as of the departure date ("Salary").
- the TEV shall be assessed each year using the following formula: TEV = average market capitalization + average Group debt, where: � The average market capitalization is equal to the number of shares (recorded at the end of
the benchmark period for the year of departure) multiplied by the average of the average daily volume-weighted share prices over the benchmark period;
� the average debt is calculated on the basis of the average net debt at the end of the last two benchmark periods;

131
- the benchmark period is determined on the basis of the departure date, as follows: � If the departure occurs before the date of the Board of Directors meeting to review the half-
year financial statements of the departure year (year N), and no later than September 1 of year N, the benchmark period for the departure year shall be the most recent financial year ended (N-1). The two previous benchmark periods are therefore financial years N-2 and N-3;
� If the departure occurs after the date of the Board of Directors meeting called to review the half-year financial statements of the departure year (year N) but before the date on which the Board of Directors reviews the annual financial statements of the current financial year (which must be prior to March 1), the benchmark period for the departure year corresponds to the 12 months preceding the half-year closing date (N). The two previous benchmark periods are determined in the same way for the 12 months preceding the closing dates of the two prior first half-years.
5. Shareholders' participation in the General Meeting The terms and conditions governing shareholder participation in General Meetings are set out in Articles 23 to 28 of the Company bylaws.
6. Elements liable to impact a takeover bid To the Company's knowledge, there are no mechanisms designed to delay, defer or prevent a change of control.
INTERNAL CONTROL PROCEDURES IMPLEMENTED BY THE COMPANY
This report on the internal control procedures implemented by the Company is also based on the AMF guide to the implementation of an internal control reference framework by small and mid caps, published on January 9, 2008. It covers all Group subsidiaries included in the Group consolidation scope.
1. Definition and objectives of internal control Internal control is a Company system which aims to ensure:
- compliance with applicable laws and regulations; - implementation of instructions and guidelines issued by senior management; - the proper functioning of the Company's internal procedures, in particular those that contribute to
safeguarding its assets; and - the reliability of financial and accounting information.
In addition, internal control contributes in general to the Group's control over its activities, the efficiency of its operations and the efficient use of its resources. By contributing to the prevention and control of risks that could prevent the Company from achieving its defined objectives, the internal control system plays a key role in the management and execution of its various operations. Nevertheless, internal control cannot provide an absolute guarantee that the Company's objectives will be achieved. Currently applicable internal controls are designed to optimize Jacquet Metal Service's control over its subsidiaries in a decentralized framework for responsibilities and operations. The key control objectives are as follows:
- Ensure that management actions are in line with the strategic guidelines approved by senior management, comply with the Group's internal rules and are in line with annual targets;
>
2014 FINANCIAL REPORT BOARD OF DIRECTORS’ CHAIRMAN’S REPORT
132
- Verify that the accounting, financial and management information communicated to the Board of Directors and the shareholders gives a fair and accurate picture of the Group's operations and position;
- Ensure control of risks liable to have a material impact on the Group's assets and liabilities or the achievement of its objectives.
However, as with all control systems, it cannot provide an absolute guarantee that these risks have been completely eliminated.
2. Control environment ISO procedure manuals
ISO certification for the main subsidiaries requires an annual external review by an independent assessor to verify that procedures are being applied correctly. This review is the basis of a formal report including recommendations. The report is circulated directly to the managers of the relevant subsidiaries. Group general regulations
The current regulations confirm the duties and obligations of Group managers, particularly with regard to:
- commitments related to raw material purchases, overheads or financing; - execution of sales contracts (credit insurance, long-term contracts, specific customer or consignment
inventories etc.); - staff changes; - investments and divestments.
3. Contributors to internal control Internal control is everyone's concern, from senior executives through to each individual staff member. Board of Directors
Senior management is required to report to the Board of Directors and the Audit and Risk Committee on the essential features of the internal control system, its Group-wide implementation and the measures adopted in order to improve the system. As required, the Board of Directors may exercise its general powers in order to implement checks and verifications it considers necessary or to adopt any other initiative it considers appropriate in this respect. The Board of Directors determines the Company's business strategy and sees to its implementation. It addresses all matters concerning the efficient running of the Company and, through its deliberations, settles issues over which it has authority.
Audit and Risk Committee
The Audit and Risk Committee is responsible for reviewing the parent company and consolidated financial statements and the related reports prior to their review by the Board of Directors, and for verifying that these financial statements are consistent with other information of which it is aware. It is also responsible for monitoring the efficiency of the internal control and risk management systems. The statutory auditors attend the meetings of the Audit and Risk Committee and keep themselves informed of the assignments carried out by the internal audit department.

133
Group Finance Department
The Chief Financial Officer is responsible for the core competences of (i) finance and treasury, (ii) consolidation and financial control, (iii) legal matters and insurance, (iv) audit and internal control, (v) taxation and (vi) investor relations. These responsibilities are exercised or delegated as follows:
- Finance Department: consisting of a central department and individual departments in the main countries, the Finance Department's principal remit is to: � monitor the performance of the subsidiaries, the brands and the Group; � monitor the achievement of targets set by senior management; � define, implement and verify the reliability of reporting and procedures; � verify that the accounting, financial and management information gives a fair and accurate
picture of the operations and position of the subsidiaries, the brands and the Group. � ensure that tax rules are properly adhered to.
- Finance and Treasury department: the main remit of this department is to optimize cash
management and set up financing arrangements across the Group. It also ensures that the commitments made by the Company and its subsidiaries correspond to the requirements of the financing arrangements.
- Internal Audit department: this department is responsible for the supervision and organization of the
internal control system, assists in defining and circulating the internal control guidelines and monitors the application of the principles established by the Group. It exercises cross-level control over all Group operations and flows. Its work may involve assignments such as the financial audit (review of the financial statements, review of systems and regulations established in order to verify the reliability of financial reporting), the operational audit (review of the main business cycles, analysis of the current organizational arrangements to ensure that they allow risks to be controlled and the set targets achieved) or ad hoc tasks such as support for operations, diagnostic or organizational studies.
4. Summary of internal control procedures Information and reporting
Procedures specific to the preparation of financial and accounting information include:
- preparation of the quarterly financial statements for consolidation and publication; - monthly monitoring of results; - monthly cash flow forecasts.
Identification and assessment of risks
The Group’s senior management meets the brand directors at least once a quarter. The primary purpose of
these meetings is to review results, monitor targets, identify growth opportunities and survey risks. This survey is supplemented by a half-yearly report on the risks identified by the subsidiaries.
>
2014 FINANCIAL REPORT BOARD OF DIRECTORS’ CHAIRMAN’S REPORT
134
Internal control management
An internal audit plan is prepared each year and submitted to the Audit and Risk Committee. The aim is to improve internal control by organizing ad hoc reviews of the procedures implemented by the subsidiaries and assessing each subsidiary's internal control system.
5. Internal control procedures regarding the preparation and processing of accounting and
financial information Reporting planning, management and processes
The procedures for preparing budgets and monitoring performance are as follows:
- On the basis of the strategic guidelines approved by Group senior management, brand operating directors and subsidiary general managers draw up an annual budget to be discussed and approved by Group senior management;
- At least once a quarter, Group senior management holds a meeting with the brand operating directors in order to review operating results, strategic guidelines and objectives.
Accounts closing procedures
The Group produces a monthly consolidated statement of specific KPIs and prepares consolidated financial statements on a quarterly basis. The Finance Department organizes and plans all accounting operations so as to ensure reliable and consistent consolidation of data. This procedure covers all of the Group's consolidated subsidiaries. Accounting principles are reviewed on a quarterly basis in light of recent changes in regulations. The means employed to guarantee the consistency and reliability of the data used for the purposes of internal management and external communication include the use of a single reporting and consolidation software tool that incorporates, on a monthly basis, the management and accounting information required for consolidation and operational management. This single consolidation application is used to prepare monthly reports and external financial communications at each phase of consolidation (budget, forecasts, reporting). Using a single system ensures that accounting and financial information is reliable, available and relevant with regard to the specific data used for internal management and external communication purposes. The subsidiaries' data is communicated via a standard format that is mandatory for all Group subsidiaries. The reported data is in local currency and complies with IAS/IFRS principles based on a standard "Group Policies" chart of accounts. The subsidiaries are responsible for ensuring that this information complies with Group instructions (chart of accounts, instructions for closing) and that the detailed instructions sent by Group Finance Department are followed (reporting timetable and data reliability). The adjustments required between individual and consolidated financial statements are specified and recorded by each subsidiary and reviewed by the Group's financial controllers. The reporting formats also include detailed analyses allowing results to be compared according to the same parameters, for example by isolating non-recurring transactions such as changes in the consolidation scope.
135
Each subsidiary manages its specific local characteristics, carries out accounting checks and ensures compliance with local regulations concerning the storage of information and data used in preparing accounting and financial records. Control activities
The Finance Department verifies the consistency of information reported by the subsidiaries before consolidating the results and recording consolidation entries and adjustments. The subsidiaries' recorded transactions are also controlled automatically by the consolidation and reporting software. Identification and listing of adjustments is carried out at an early stage by the local finance departments together with Group controllers. These items are also reviewed by the statutory auditors within the scope of their audits. Moreover, the Group Finance Department may be required to carry out specific checks concerning sensitive accounting issues which could have a material impact on the presentation of the financial statements. These issues are also reviewed by the statutory auditors within the scope of their audits. As part of their control work, controllers in charge of the subsidiaries have access to all information. Their main contacts are the managers and financial directors of the relevant subsidiaries. Accounting and financial reporting
Every year, a timetable is drawn up showing all Group deadlines for financial and accounting reporting to the stock market and the Company's regulatory bodies. The timetable is circulated internally to those staff working specifically on financial reporting. In addition, the Group's Finance Department staff follow a formal accounting and financial timetable drawn up in advance to ensure that the set deadlines are met. Control procedures for accounting and financial information are based on:
- monthly checks of all accounting and financial information by financial controllers and treasury departments;
- a review of the financial statements by the Group internal audit department.
Eric Jacquet Chairman of the Board of Directors
>
2014 FINANCIAL REPORT
136
9. STATUTORY AUDITORS' REPORT, DRAWN UP PURSUANT TO
ARTICLE L.225-235 OF THE FRENCH COMMERCIAL CODE, ON THE
REPORT OF THE CHAIRMAN OF THE BOARD OF DIRECTORS OF
JACQUET METAL SERVICE (Free translation of French-language original)
To the Shareholders, In our capacity as statutory auditors of Jacquet Metal Service, and in accordance with Article L. 225-235 of the French Commercial Code, French Commercial Code (code de commerce), we hereby report on the report prepared by the Chairman of your company in accordance with article L. 225-37 of the French Commercial Code, for the year ended December 31, 2014. It is the Chairman's responsibility to prepare and submit for the approval of the Board of Directors a report on internal control and risk management procedures implemented by the company and to provide the other information required by article L. 225-37 of the French Commercial Code relating to matters such as corporate governance. It is our responsibility to:
- report on any matters as to the information contained in the Chairman's report in respect of the internal control and risk management procedures relating to the preparation and processing of the accounting and financial information,
- confirm that the report also includes the other information required by article L. 225-37 of the French Commercial Code. It should be noted that our role is not to verify the fairness of this other information.
We conducted our work in accordance with professional standards applicable in France. Information on internal control and risk management procedures relating to the preparation and processing
of accounting and financial information
The professional standards require that we perform the necessary procedures to assess the fairness of the information provided in the Chairman's report in respect of the internal control and risk management procedures relating to the preparation and processing of the accounting and financial information. These procedures consist mainly in:
- obtaining an understanding of the internal control and risk management procedures relating to the preparation and processing of the accounting and financial information on which the information presented in the Chairman's report is based and of the existing documentation;
- obtaining an understanding of the work involved in the preparation of this information and of the existing documentation;
- determining if any material weaknesses in the internal control procedures relating to the preparation and processing of the accounting and financial information that we would have noted in the course of our work are properly disclosed in the Chairman's report.
137
On the basis of our work, we have no matters to report on the information relating to the company's internal control and risk management procedures relating to the preparation and processing of the accounting and financial information contained in the report prepared by the Chairman of the Board of Directors in accordance with article L. 225-37 of the French Commercial Code (code de commerce). Lyon, March 10
th, 2015
The Statutory Auditors
French original signed by:
GRANT THORNTON ERNST & YOUNG et Autres French member of Grant Thornton International
Françoise Mechin Lionel Denjean

>
OTHER INFORMATION
138
OTHER
INFORMATION
1. PERSON RESPONSIBLE FOR THE REGISTRATION DOCUMENT AND
ANNUAL FINANCIAL REPORT I hereby certify, having taken all reasonable care that such is the case, that the information contained in this Registration Document, to the best of my knowledge, truly reflects the existing situation and contains no omissions which could impair its full meaning. I hereby certify that, to the best of my knowledge, the financial statements have been prepared in accordance with applicable accounting standards and give a true and fair picture of the assets and liabilities, financial position and earnings of the Company and all of the companies included in the consolidation scope, and that the Management Report presented on pages 20 to 34 gives a fair view of the course of business, performance and financial position of the Company and all of the companies included in the consolidation scope and includes an account of the main risks and uncertainties with which they are faced. I have received from the statutory auditors an audit completion letter in which they state that they have verified the information relating to the financial position and financial statements provided in this document and that they have read the whole document. The statutory auditors have issued reports on the financial information for the year ended December 31, 2014. These reports are presented on pages 97 and 117 of the 2014 Registration Document. The statutory auditors issued reports on the financial information for the year ended December 31, 2013 included herein by way of reference. Said reports are presented on pages 96 and 116 of the 2013 Registration Document no. D.14-0212 filed with the AMF on March 26, 2014. The statutory auditors issued reports, including an observation, on the financial information for the year ended December 31, 2012 included herein by way of reference. The said reports are presented on pages 98 and 119 of the 2012 Registration Document no. D.13-0228 filed with the AMF on March 28, 2013.
Eric Jacquet Chairman and CEO

139
2. PERSON RESPONSIBLE FOR THE FINANCIAL STATEMENTS AUDIT
Regular statutory auditors
- Ernst & Young et autres, represented by Lionel Denjean – 41 Rue Ybry – 92200 Neuilly sur Seine
Date of first appointment: June 30, 2011 Term: 6 years. Term expires at the close of the General Meeting called to approve the financial statements for the year ended December 31, 2016;
- GRANT THORNTON, represented by Françoise Mechin - Cité Internationale 44 Quai Charles de Gaulle 69463 Lyon cedex 06 Date of first appointment: June 26, 2014 Term: 6 years. Term expires at the close of the General Meeting called to approve the financial statements for the year ended December 31, 2019.
Alternate statutory auditors
- Auditex, Tour Ernst & Young - Faubourg de l’Arche – 92037 Paris La Défense
Date of first appointment: June 30, 2011 Term: 6 years. Term expires at the close of the General Meeting called to approve the financial statements for the year ended December 31, 2016;
- IEGC – 3 Rue de Léon Jost – 75017 Paris
Date of first appointment: June 26, 2014 Term: 6 years. Term expires at the close of the General Meeting called to approve the financial statements for the year ended December 31, 2019.
3. PERSON RESPONSIBLE FOR FINANCIAL REPORTING AND
INVESTOR RELATIONS Thierry Philippe
CFO
Tel. +33 (0)4 72 23 23 50 – [email protected]

>
OTHER INFORMATION
140
4. INFORMATION ABOUT THE SHARE ISSUER
Company name (Article 3 of the bylaws) The name of the Company is Jacquet Metal Service. No trade name has been filed.
Registered office (Article 4 of the bylaws) The Company's registered office is located at Saint-Priest (69800), 7 Rue Michel Jacquet.
Date and term of incorporation (Article 5 of the bylaws) The Company was incorporated on September 23, 1977. The term of the Company is 99 years except in the event of early dissolution or extension as decided by the Extraordinary General Meeting. The term of the Company is due to expire on December 31, 2075.
Registration The Company is registered in the Lyon Trade and Companies Register under number 311 361 489. The Company's APE code is 7010Z.
Legal form - Governing law Jacquet Metal Service is a French corporation ("société anonyme") with a Board of Directors subject to all the legislation and regulations governing business companies in France, in particular Articles L.224-1 et seq. of the French Commercial Code.
Corporate purpose (Article 2 of the bylaws)
In all countries, the Company's purpose is to:
- purchase and sell all metal products, all industrial products and goods and any other substitute products;
- represent, broker and distribute such products, either on its own behalf or on behalf of third parties; - undertake all operations to process and present such products; - obtain, acquire, sell and use all processes, intellectual property rights and know-how, and obtain or
grant all licenses; - acquire equity interests in all companies directly or indirectly associated with the corporate purpose
and the aforementioned activities. In general, undertake any industrial, commercial, civil or financial transactions and any movable or real property transactions directly or indirectly related to the aforementioned purposes and activities. All of the aforementioned activities may be carried out directly or indirectly through the foundation of new companies and groups, by contribution, subscription or purchase of securities and equity rights, through mergers, alliances, joint ventures or the leasing of all goods and other rights. And, in general, undertake all business, industrial, financial and movable or real property transactions that may be necessary or useful for carrying out and developing the Company's business.
141
Financial year (Article 32 of the bylaws) Each financial year begins on January 1 and ends on December 31.
General Meetings (Articles 23 to 30 of the bylaws) Notice (Article 24)
General Meetings of shareholders are convened and deliberate in accordance with the conditions provided for by law. Meetings are held either at the registered office or at another location, as specified in the notice. If specified in the notice of the General Meeting, any shareholder may participate in this meeting by means of videoconference, electronic telecommunication or data transmission technology, subject to applicable statutory or regulatory conditions. Shareholders participating in meetings by such means shall be deemed present for the purpose of calculating quorum and majority. Admission (Article 26)
All shareholders, subject to statutory and regulatory conditions, are entitled to attend General Meetings and take part in the discussions in person or by proxy, irrespective of the number of shares they hold. All shareholders may procure representation subject to the conditions provided for by law. All shareholders may vote remotely by means of a form drawn up and sent to the Company in accordance with statutory and regulatory conditions.
Location where documents and information concerning the Company may be
consulted The bylaws, the financial statements including reports and the minutes of General Meetings which, in application of the legislation regarding business companies, are made available to shareholders and the general public may be consulted at the Company's registered office.
Service agreements providing for the award of benefits on expiry
Apart from the compensation and provisions set out in Section 2.13 of the Management Report – Information
on the parent company Jacquet Metal Service S.A, there are no service agreements between corporate officers and the issuer or any of the subsidiaries that provide for the award of benefits on expiry of the agreement.
Determination and appropriation of earnings (Article 34) The income statement that presents the income and expenses for the financial year indicates, as a separate item, the profit for the year after deduction of depreciation, amortization and provisions. A deduction of at least 5% is made from the profit for the year, less any retained losses brought forward, in order to establish the statutory reserve. This deduction shall no longer be mandatory when the amount of the reserve equals at least one tenth of the share capital. Distributable profit equals the profit for the year plus retained earnings brought forward, less retained losses brought forward and amounts transferred to reserves, in application of the law and the Company's bylaws. This profit is distributed to the shareholders in proportion to the number of shares held by each one. The General Meeting may decide to distribute amounts deducted from available reserves, provided that it expressly specifies the reserves from which such amounts are taken.
>
OTHER INFORMATION
142
However, as a matter of priority, dividends are deducted from the profit for the year. Except in the case of a capital reduction, no distribution may be made to the shareholders where the amount of shareholders' equity is, or would be following such distribution, less than the amount of share capital plus reserves which the law or the Company's bylaws prohibit from being distributed. Distribution of the revaluation surplus is prohibited. All or part of the revaluation surplus may be incorporated into the share capital. However, after deducting the amounts transferred to reserves, in accordance with the law, the General Meeting may then deduct any amounts it considers appropriate and allocate them to any optional, ordinary or extraordinary reserves or to retained earnings carried forward.
Payment of final and interim dividends (Article 35)
- The General Meeting may grant shareholders the option of receiving all or part of the dividend distributed either in the form of shares, subject to statutory conditions, or in cash.
- The terms and conditions regarding the payment of dividends in cash are defined by the General Meeting, or otherwise by the Board of Directors.
Cash dividends shall be paid out within a maximum period of nine months following the balance sheet date, unless this period is extended by court authorization. Notwithstanding, if financial statements drawn up during the course of or at the end of a financial year and certified by a statutory auditor indicate that, after allocating the required amounts to depreciation, amortization and provisions and after deducting any amounts to be transferred to the reserves, the Company has made a profit since the end of the previous financial year, interim dividends may be distributed before the full-year financial statements have been approved. The amount of such interim dividends shall not exceed the amount of the profit as defined above. No reimbursement of dividends may be required of the shareholders, unless the distribution was made in breach of statutory provisions and the Company is able to prove that the beneficiaries were aware or, given the circumstances, could not be unaware of the unlawfulness of the distribution at the time it was made. Any claim for reimbursement of dividends shall be barred by the statute of limitations three years after the payment of the dividends in question. Dividends not claimed within five years of their payment date shall lapse.
Rights and obligations attached to shares (Article 11)
- Each share carries entitlement, in proportion to the percentage of the share capital that it represents, to a share of the profits distributed and a share in the ownership of the corporate assets or liquidation surplus. Each share carries entitlement to be represented and to vote in General Meetings, without restriction, subject to statutory and regulatory conditions. Nevertheless, a double voting right, compared to the voting right conferred on other shares in light of the proportion of the share capital they represent, is assigned to all fully paid up shares held in registered form by the same shareholder and registered with the issuer or its representative for at least two years. In the event of a capital increase by capitalization of reserves, profits or issue premiums, the double voting right may be conferred, as of issuance, on registered bonus shares allocated to a shareholder by virtue of their existing double voting shares. If the Company undergoes a merger or demerger, this shall not affect double voting rights, which may be exercised within the beneficiary company if permitted by such company's bylaws. Double voting rights shall automatically lapse in the event of conversion to bearer form or transfer of ownership. Nevertheless, the period defined above shall not be suspended and the acquired right shall be preserved in the event of a transfer resulting from a succession, the sharing out of matrimonial

143
property or an inter vivos gift to a spouse or a relative close enough to inherit an estate. The same shall apply in the event of a transfer following the merger or demerger of a shareholder company. All shareholders are entitled to be informed about the Company's market and to receive specific corporate documents at the times and under the conditions provided for by law and by the Company's bylaws.
- Shareholders' liability for the Company's debts is limited to the par value of the shares they hold. The right and obligations attached to a share shall be transferred upon transfer of ownership. Ownership of a share automatically entails adherence to the Company's bylaws and the resolutions of the General Meeting.
- The heirs, creditors, assigns, trustees or other representatives of a shareholder may under no circumstances cause the Company's assets and securities to be placed under seal, request the distribution or sale by auction thereof or interfere in any way whatsoever in the Company's administration; in order to exercise their rights, they shall rely on the Company's balance sheet and on the decisions of the General Meeting.
- Whenever ownership of a specific number of shares is required in order to exercise a right, it is up to the shareholders who do not meet this requirement to arrange for the grouping of the required number of shares.
Share transfer and transmission (Article 10) In addition to the mandatory disclosures required by the applicable statutory and regulatory provisions, all individuals or legal entities, acting alone or in concert, whose shareholding exceeds or falls below 1% of the share capital or voting rights, or any multiple of this percentage up to one third of the share capital, are required to notify the Company thereof, within five (5) trading days following the crossing of the shareholding threshold, by registered letter with acknowledgment of receipt sent to the Company's registered office, specifying the number of shares and voting rights held. If a shareholder fails to disclose the crossing of a threshold subject to the foregoing conditions, the shares exceeding the fraction that should have been disclosed shall be stripped of voting rights, subject to statutory conditions, for all shareholders' meetings until the expiry of a period of two (2) years following the rectification of the situation. Except in the case of the thresholds provided for by Article L.233-7 of the French Commercial Code, shares will be stripped of their voting rights only following a request to that effect, recorded in the minutes of the General Meeting, on the part of one or more shareholders holding 2.5% of the Company's share capital or voting rights.
>
OTHER INFORMATION
144
5. INFORMATION ON THE SHARE CAPITAL
Share capital Share capital amounts to €36,631,126 divided into 24,028,438 fully paid-up shares.
Form of shares (Article 9) Fully paid up Company shares may, at the shareholder's discretion, be in either registered or identifiable bearer form, pursuant to the applicable statutory and regulatory provisions, in particular Article L.228-2 of the French Commercial Code. In order to identify the owners of bearer shares, the Company may at any time request from the central securities depository, the name or corporate name, nationality, date of birth or incorporation and the address of the holders of securities carrying immediate or subsequent entitlement to vote in its shareholders' meetings, as well as the number of securities held by each one and any restrictions that may apply to them. The Company is also entitled to request any information stipulated under Articles L.228-2 et seq. of the French Commercial Code. The conditions for using such information are governed by the provisions of the aforementioned Article L.228-2 of the French Commercial Code.
Share trading – Stock exchange All shares may be freely sold or transferred. The shares are listed on NYSE Euronext - Compartment B.
Breakdown of share capital and voting rights
A detailed presentation of the shareholder structure and the identity of shareholders exceeding the statutory
thresholds is provided in Section 2.9 of the Management Report – Information on the parent company.
Share buyback program
This information may be found in Section 2.5 of the Management Report – Information on the parent
company.
Convertible, exchangeable or equity-warrant bonds None.
Securities not representing capital None.
145
Shareholders' agreements and declared concert To the Company's knowledge:
- There are no shareholders' agreements. - In a letter dated March 12, 2014 sent to the Company, Mr. Richard W. Colburn and Metal
Companies Multi Employer Pension Plan declared they act in concert.
Liquidity contract
This information may be found in Section 2.8 of the Management Report – Information on the parent
company.

>
OTHER INFORMATION
146
6. PARENT COMPANY/ SUBSIDIARY RELATIONS
Jacquet Metal Service S.A and its subsidiaries maintain contractual relations in respect of the Group's organization and functioning. The parent company, Jacquet Metal Service S.A., invoices its subsidiaries primarily for services provided. The basis for invoicing is usually the subsidiary's sales figure. Invoicing rules are identical for all subsidiaries and are subject to agreements. Invoicing between subsidiaries mainly concerns intra-Group supplies. Jacquet Metal Service S.A. is not merely a holding company, but also supplies services to its subsidiaries with a view to minimizing costs by providing them with economic advantages. Thus Jacquet Metal Service S.A.'s sales consist primarily of management fees and fees for IT services invoiced directly or indirectly to all Group subsidiaries according to the same criteria. The Jacquet Metal Service Group comprises a large number of subsidiaries, all majority-owned, located in 23 countries. The percentages of interest and control held by Jacquet Metal Service in each subsidiary and their country of location are listed in Section 1.1. "Consolidation scope" of the notes to the consolidated financial statements. The results of these subsidiaries and important notes on their business activity are set out in Section 1.4 of the Management Report - Information on the Group. Jacquet Metal Service S.A. senior management are also directors and officers of the Group's main subsidiaries. The Group controls the following subsidiaries with minority interests: JACQUET Finland (FI), JACQUET Osiro (CH), JACQUET Nederland (NL), JACFRIESLAND (NL), JACQUET s.r.o. (CZ), JACQUET Iberica (ES), JACQUET Nordpol (PL), JACQUET Polska (PL), JACQUET Portugal (PT), JACQUET Italtaglio (IT), JACQUET UK (GB), JACQUET Mid Atlantic (USA), JACQUET Houston (USA), JACQUET Midwest (USA), Finkenholl (DE), Betonstahl Bochum (DE), Abraservice Italia Spa (IT), Abraservice Portugal LDA (PT), IMS Nederland BV (NL), Abraservice UK Ltd (GB), JACQUET Deutschland GmbH (DE), Rolark Edmonton Inc (CAN), UAB Stappert Lietuvia (LT) and Stappert UK Ltd (GB). Except for JACQUET Osiro and Betonstahl Bochum, minority shareholders comprise the management of the subsidiaries. Except for JACFRIESLAND, Finkenholl and Betonstahl Bochum, shareholder agreements have been signed between Jacquet Metal Service and the minority shareholders. These agreements are designed to arbitrate between the parties' interests in the event of a planned divestment or conflict. Only the JACQUET Finland (FI) and JACQUET Polska (PL) agreements are liable to have an impact, albeit immaterial, on Jacquet Metal Service. These agreements in no way affect the terms and conditions governing the sale or purchase of Jacquet Metal Service shares.
147
7. JACQUET METAL SERVICE - SOCIAL AND ENVIRONMENTAL
INFORMATION
DECREE NO. 2012-557 OF APRIL 24, 2012 ON CORPORATE
TRANSPARENCY REQUIREMENTS REGARDING SOCIAL AND
ENVIRONMENTAL ISSUES
Introduction The principal business of the Jacquet Metal Service Group comprises the purchase, storage and delivery of
various categories of specialty steel products and the carrying out of various primary processing operations
customized to meet end user requirements. The customer base of the Group companies is mainly local,
consisting of small and medium-sized industries (SMIs).
The Group has operations in 23 countries and over 90 subsidiaries, some of which comprise several
establishments. The subsidiaries have a large degree of independence, especially in terms of managing human
resources and local environmental regulations.
The subsidiaries' managers are supervised by the brand operating managers. Quarterly brand meetings provide
Group management with regular feedback based on monitored KPIs.
The Group's structure makes it difficult and expensive to collect the extensive quantitative information
required under Decree No. 2012-557 of April 24, 2012 on corporate transparency requirements regarding
social and environmental issues. Only quantitative data considered by Group management to be relevant has
been included in this report (1)
.
1. Staff and social information The subsidiaries or their establishments carry out their activities in geographical areas close to their location. In view of their size, the territorial, economic and social impact of their activities remains limited in terms of employment and regional development. The subsidiaries may use subcontractors for parts processing, but such use is limited and mainly involves local partners. The Group had 2,413 full-time equivalent employees as of December 31, 2014. During the year, 320 people left the Group and 467 new permanent or temporary employees were hired, including 53 people who joined the Group following the Rolark acquisition. The Group headcount comprises 27% women and 73% men. The average age of Group employees is 41.5.
(1)
The following information is not available or is deemed not applicable: absenteeism, equality of treatment, relations with people or
organizations with an interest in the Company's business, general policy concerning the environment and use of land.
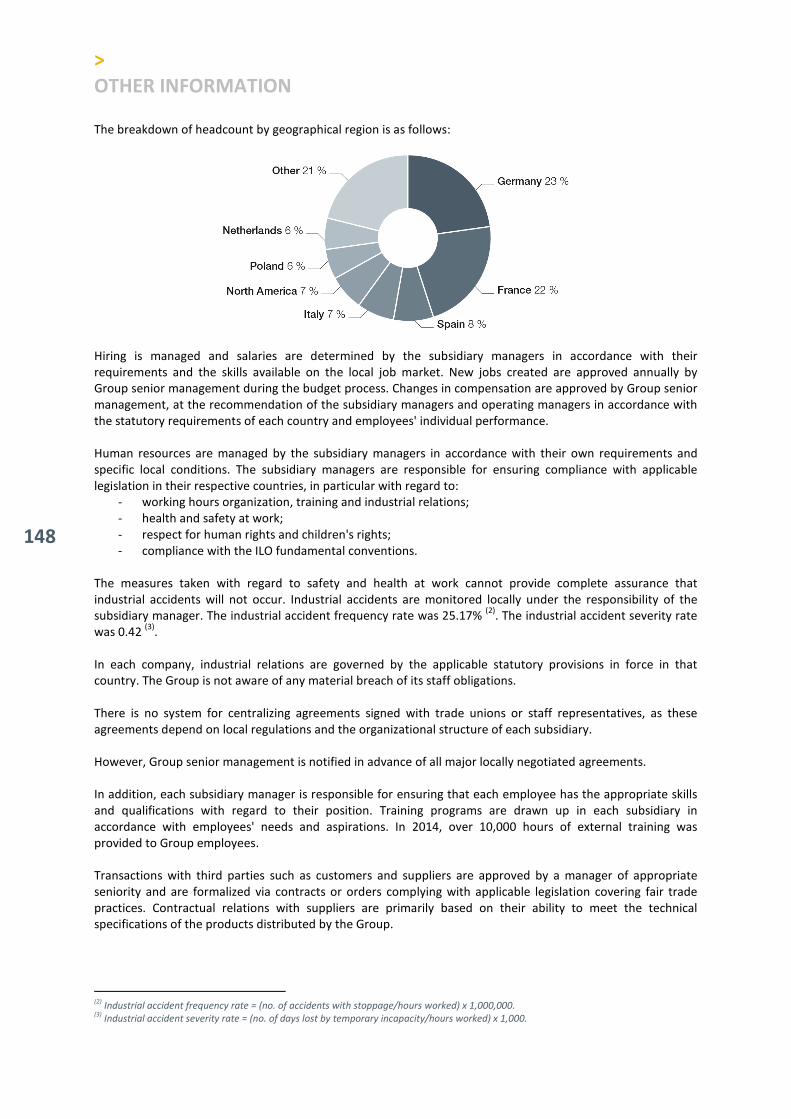
>
OTHER INFORMATION
148
The breakdown of headcount by geographical region is as follows:
Hiring is managed and salaries are determined by the subsidiary managers in accordance with their requirements and the skills available on the local job market. New jobs created are approved annually by Group senior management during the budget process. Changes in compensation are approved by Group senior management, at the recommendation of the subsidiary managers and operating managers in accordance with the statutory requirements of each country and employees' individual performance. Human resources are managed by the subsidiary managers in accordance with their own requirements and specific local conditions. The subsidiary managers are responsible for ensuring compliance with applicable legislation in their respective countries, in particular with regard to:
- working hours organization, training and industrial relations; - health and safety at work; - respect for human rights and children's rights; - compliance with the ILO fundamental conventions.
The measures taken with regard to safety and health at work cannot provide complete assurance that industrial accidents will not occur. Industrial accidents are monitored locally under the responsibility of the subsidiary manager. The industrial accident frequency rate was 25.17%
(2). The industrial accident severity rate
was 0.42 (3)
. In each company, industrial relations are governed by the applicable statutory provisions in force in that country. The Group is not aware of any material breach of its staff obligations. There is no system for centralizing agreements signed with trade unions or staff representatives, as these agreements depend on local regulations and the organizational structure of each subsidiary. However, Group senior management is notified in advance of all major locally negotiated agreements. In addition, each subsidiary manager is responsible for ensuring that each employee has the appropriate skills and qualifications with regard to their position. Training programs are drawn up in each subsidiary in accordance with employees' needs and aspirations. In 2014, over 10,000 hours of external training was provided to Group employees. Transactions with third parties such as customers and suppliers are approved by a manager of appropriate seniority and are formalized via contracts or orders complying with applicable legislation covering fair trade practices. Contractual relations with suppliers are primarily based on their ability to meet the technical specifications of the products distributed by the Group.
(2)
Industrial accident frequency rate = (no. of accidents with stoppage/hours worked) x 1,000,000. (3)
Industrial accident severity rate = (no. of days lost by temporary incapacity/hours worked) x 1,000.

149
2. Environmental information The Group's business activity, which mainly involves the distribution of specialty steels and the performance of customized cutting operations, does not generate operations that could have a significant impact on the environment. Therefore, the Group has not taken steps to obtain specific environmental certification (ISO 14001, etc.). Managing the materials purchased and distributed is an integral part of the Jacquet Metal Service Group's know-how. Waste metal resulting from cutting operations is sold off to scrap merchants or recycling companies. This procedure allows waste to be recycled and limits the impact of the Group's operations on the environment and biodiversity. In France, five facilities are classified with regard to environmental protection under the French ICPE system
("Installation Classée pour la Protection de l’Environnement") in view of the power requirements of certain
cutting machines. The products purchased and distributed do not have a direct impact on consumers' health. The Group's operations do not generate a significant amount of greenhouse gas emissions. The transportation of products purchased and sold is mainly outsourced. The Group's operations have a limited impact on the local community, particularly in terms of noise, and on biodiversity, as its facilities are mainly located in industrial estates. The Group's operations do not consume large quantities of water or electricity. Therefore, utilities consumption is not included in the KPIs monitored by the Group. The cutting machines generate limited quantities of oils and waste water, which the subsidiaries take steps to prevent, recycle and eliminate, under the responsibility of the subsidiary manager. Such measures help to mitigate the risk of direct impact on the environment. To date, Group senior management has not been notified of any material clean-up operations to be implemented in connection with the subsidiaries' operations. The Group's facilities do not require specific oversight with regard to adaptation to climate change.

>
OTHER INFORMATION
150
8. REPORT OF AN INDEPENDENT THIRD PARTY ON
CONSOLIDATEDSOCIAL, ENVIRONMENTAL AND SOCIETAL
INFORMATION IN THE MANAGEMENT REPORT To the Shareholders, In our capacity as an independent third party accredited by COFRAC
(1). under number 3-1050 and member firm
of the network of one of Jacquet Metal Service's statutory auditors, we hereby report on consolidatedsocial, environmental and societal information in the Management Report for the year ended December 31, 2014, hereinafter referred to as "CSR Information", pursuant to the provisions of Article L. 225-102-1 of the French Commercial Code. The Company's responsibility
It is the Board of Director's responsibility to prepare a management report including CSR Information as stipulated under Article R. 225-105 of the French Commercial Code, in accordance with the Company's policies as set forth in the Social, Environmental and Societal Report Manual, version dated December 11, 2014 (hereinafter the "Manual"), which is available on request at the Company's registered office. Independence and quality control
Our independence is defined in regulations, the profession's code of ethics and the provisions of Article L. 822-11 of the French Commercial Code. In addition, we have implemented a quality control system that includes documented policies and procedures to ensure compliance with ethical standards, professional standards and applicable laws and regulations. Responsibility of the independent third party
It is our responsibility, based on our review, to: - Certify that the required CSR Information are given in the Management Report or, if omitted, that an appropriated explanation has been provided pursuant to the third paragraph of Article R. 225-105 of the French Commercial Code (certificate of inclusion of CSR Information); - Provide a limited assurance opinion that the CSR Information, overall, is fairly presented in all material aspects, in accordance with the Manual (limited assurance on CSR Information); Our review was conducted by a team of four persons between December 2014 and February 2015 during a period of approximately four weeks. We performed the work described below in accordance with applicable French professional standards and the May 13, 2013 Order on the terms and procedures applicable to independent third parties conducting CSR engagements and on the opinion on fairness pursuant to international standard ISAE 3000.
1. Certificate of inclusion of CSR disclosures Based on interviews with the heads of departments concerned, we obtained an understanding of the company’s CSR issues, the sustainable development guidelines in respect of the social and environmental consequences of the Company's activities, its social commitments and any actions or programs arising therefrom. We compared the CSR Information in the Management Report with the list stipulated under Article R. 225-105-1 of the French Commercial Code.
(1)
Scope available at www.cofrac.com
151
Whenever specific consolidated information was omitted, we verified that explanations were provided pursuant to Article R. 225-105 paragraph 3 of the French Commercial Code. We verified that the CSR disclosures covered all consolidated companies, i.e. the parent company and its subsidiaries as defined under Article L. 233-1 of the French Commercial Code and the companies it controls as defined under Article L. 233-3 of said Code. Based on our review, we hereby certify that the required CSR Information is provided in the management report.
2. Limited assurance on CSR Information
Nature and scope of the work
We conducted three interviews with the members of the financial department responsible for preparing CSR Information and the procedure for receiving the underlying data, and, where applicable, for internal control and risk management procedures, in order to: - assess whether the Manual was appropriate in terms of relevance, completeness, reliability, neutrality and understandability, taking into account applicable industry standards, - verify the implementation of a procedure for collecting, compiling, processing and controling CSR Information designed to ensure the completeness and consistency thereof, and identifiy the procedures for internal control and risk management regarding the preparation of CSR Information. We decided on the type and extent of our testing based on the type and importance of the CSR Information with regard to the characteristics of the Company, the social and environmental issues arising from its business activities, its sustainable development strategies and industry best practices. For the CSR Information we considered the most important
(2):
- at the level of JMS SA, the consolidating company, and some subsidiaries, we reviewed underlying documents and conducted interviews to corroborate qualitative information about the organisation, policies and actions, etc ; we performed analytical procedures on quantitative data and, on a test basing, verified data calculation and compilation and the consistency thereof with the other information in the Management Report; - For a representative sample of companies that we selected based on their activity, their contribution to the consolidated indicators, their location and our analysis of the risk, we ubndertook interviews to verify that procedures had been properly performed, and carried out detailed sample testing to check the calculations and reconcile the data with the underlying documents. The sample selected represents on average 19% of revenues of the companies included in the review and 16% of their headcount. We verified the consistency of the other consolidated CSR Information based on our knowledge of the company. Lastly, we assessed the relevance of the explanations given for any total or partial absence of certain information. In our opinion, the sampling methods and sample sizes that we applied based on our professional judgment represent sufficient evidence for us to express a limited assurance opinion ; a higher level of assurance would have required a more extensive review. Due to the necessary use of sampling methods and the other limits inherent to the operation of any reporting and internal control system, the risk of failure to detect significant misstatements in the CSR Information cannot be totally ruled out.
(2)
Social information: employment (total headcount and breakdown), health and safety conditions at work, work accidents, notably their
frequency and their severity.
>
OTHER INFORMATION
152
Conclusion
Based on our work, we did not find any significant misstatement that would be liable to call into question the fact that the CSR Information, taken as a whole, are reported fairly in accordance with the Manual. Paris-La Défense, March 10
th, 2015
Independent third party Ernst & Young et Associés
Christophe Schmeitzky Bruno Perrin Sustainable Development Partner Partner

153
9. INFRASTRUCTURE
Group assets
Group assets largely consist of buildings and plant (e.g. cutting and folding machines etc.) Real property as of December 31, 2014
sqm Fully-owned property Rented property Leased property Country Building
surface
area
Land
surface
area
No. of
warehouses
Building
surface
area
Land
surface
area
No. of
warehouses
Building
surface
area
Land
surface
area
No. of
warehouses
Germany 39,766 75,015 6 14,899 24,011 3 8,808 21,110 1
Austria 1,363 2,811 1 212 - - 5,000 17,200 1
Belgium 17,946 33,133 2 469 - - - - -
Canada - - - 6,234 1,872 4 - - -
China 5,439 20,118 1 2,003 - 1 - - -
Spain 1,284 10,295 1 58,692 38,954 10 - - -
United States - - - 22,635 14,072 5 - - -
Finland 2,333 23,064 1 39 - - - - -
France 55,200 234,882 7 86,116 204,070 11 4,150 18,850 1
Hungary 4,080 22,602 1 19 - - - - -
Italy 1,950 2,500 1 63,315 72,278 8 - - -
Lithuania - - - 1,873 470 3 - - -
Netherlands 5,325 13,000 1 16,423 11,470 1 - - -
Poland 8,633 62,693 2 6,305 - 3 - - -
Portugal 130 - - 7,114 13,625 2 - - -
Czech Republic 4,799 40,249 1 2,150 974 2 - - -
United Kingdom 2,500 17,000 1 5,461 6,600 1 - - -
Slovakia 2,948 20,974 1 - - - - - -
Slovenia 247 5,663 - - - - - - -
Sweden 4,169 27,927 2 512 - 1 - - -
Switzerland 2,567 5,851 2 - - - - - -
Turkey 200 - - 3,200 6,514 1 - - -
Total 160,879 617,777 31 297,671 394,910 56 17,958 57,160 3
There are no environmental constraints that could impact the issuer's use of its property, plant and equipment. Disclosures concerning assets belonging directly or indirectly to corporate executive officers and used by the Group in the course of its business activities are given under Section 2.13 of the parent company information in the Management Report.

>
OTHER INFORMATION
154
10. ANNUAL REPORTING DOCUMENT
In application of Article L 451-1-1 of the French Monetary and Financial Code and Article 222-7 of the AMF General Regulation, this document lists all of the information published or made public by Jacquet Metal Service from January 1, 2014 to March 5, 2015 in order to comply with applicable statutory and regulatory requirements.
10.1. Publication in the French BALO journal of mandatory legal notices Information published in the Bulletin des Annonces Légales Obligatoires (BALO) and available for consultation
on the Official Journal website www.journal-officiel.gouv.fr
Invitation notice: June 26, 2014 ordinary and extraordinary General Meeting
June 6, 2014 Ref. no. 1402799
Invitation notice: June 26, 2014 ordinary and extraordinary General Meeting
May 21, 2014 Ref. no. 1402162
10.2. Notices published at the Commercial Court Registry Filing number 028688 dated August 21, 2014: filing of parent company financial statements Filing number 028689 dated August 21, 2014: filing of consolidated financial statements Filing number 28528 dated November 20, 2014: resignation of a director Filing number 17124 dated July 10, 2014: appointment/reappointment to the Board of Directors Filing number 9338 dated April 4, 2014: resignation of a director
10.3. AMF publications
Directors' declaration Sept. 20, 2014 2014DD327566
Registration Document Mar. 26, 2014 D.14-0212
Directors' declaration Mar. 1, 2014 2014DD291606
Directors' declaration Feb. 28, 2014 2014DD291151
Threshold crossing Feb. 13, 2014 214C0235
10.4. Financial reporting
Results
Q3 2014 results Nov. 12, 2014
Q2 2014 results Sept. 3, 2014
Q1 2014 results May 13, 2014
2013 results Mar. 6, 2014
155
Reports
Financial report for the nine months ended September 30, 2014 Nov. 12, 2014
2014 half-year financial report Sept. 3, 2014
Financial report for the three months ended March 31, 2014 May 13, 2014
2013 Registration Document Apr. 28, 2014
Monthly declaration of voting rights
Monthly declaration as of December 31, 2014 Jan. 14, 2015
Half-yearly liquidity contract reports
Half-yearly liquidity contract report at December 31, 2014 Jan. 14, 2015
Half-yearly liquidity contract report at June 30, 2014 July 4, 2014
Weekly share buyback declarations
Description of the 2014 share buyback program June 30, 2014
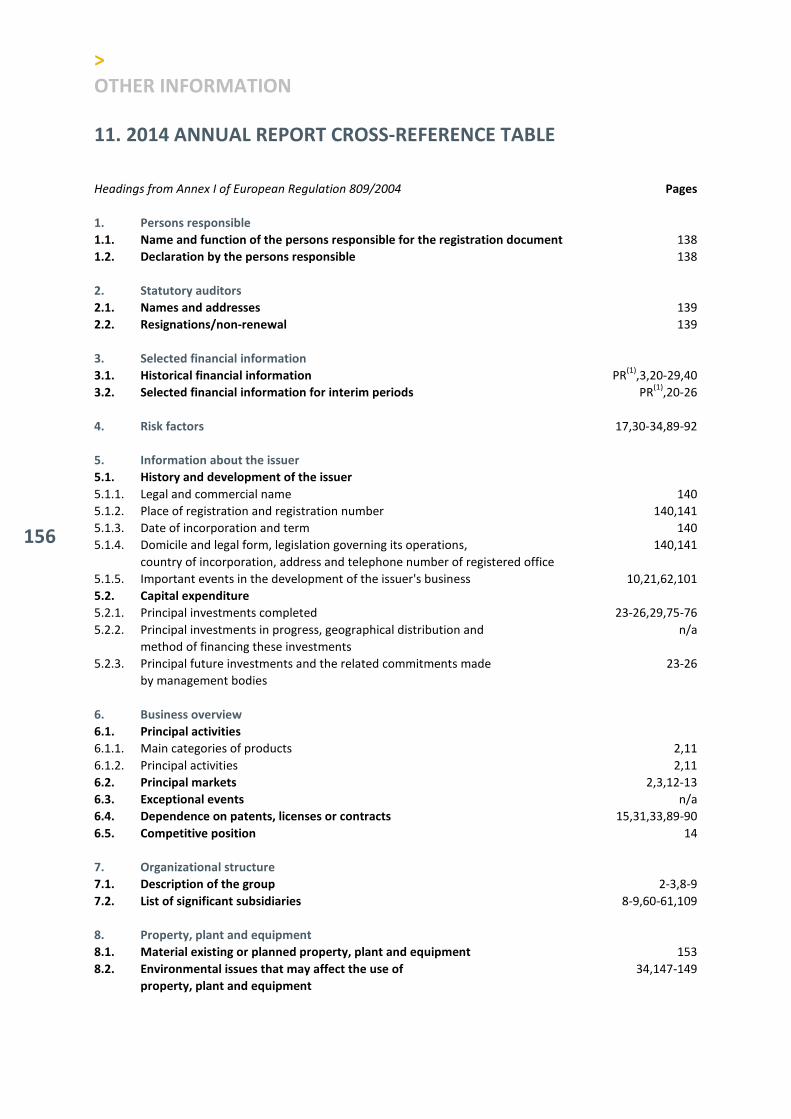
>
OTHER INFORMATION
156
11. 2014 ANNUAL REPORT CROSS-REFERENCE TABLE
Headings from Annex I of European Regulation 809/2004 Pages
1. Persons responsible
1.1. Name and function of the persons responsible for the registration document 138
1.2. Declaration by the persons responsible 138
2. Statutory auditors
2.1. Names and addresses 139
2.2. Resignations/non-renewal 139
3. Selected financial information
3.1. Historical financial information PR(1)
,3,20-29,40
3.2. Selected financial information for interim periods PR(1)
,20-26
4. Risk factors 17,30-34,89-92
5. Information about the issuer
5.1. History and development of the issuer
5.1.1. Legal and commercial name 140
5.1.2. Place of registration and registration number 140,141
5.1.3. Date of incorporation and term 140
5.1.4. Domicile and legal form, legislation governing its operations, 140,141
country of incorporation, address and telephone number of registered office
5.1.5. Important events in the development of the issuer's business 10,21,62,101
5.2. Capital expenditure
5.2.1. Principal investments completed 23-26,29,75-76
5.2.2. Principal investments in progress, geographical distribution and n/a
method of financing these investments
5.2.3. Principal future investments and the related commitments made 23-26
by management bodies
6. Business overview
6.1. Principal activities
6.1.1. Main categories of products 2,11
6.1.2. Principal activities 2,11
6.2. Principal markets 2,3,12-13
6.3. Exceptional events n/a
6.4. Dependence on patents, licenses or contracts 15,31,33,89-90
6.5. Competitive position 14
7. Organizational structure
7.1. Description of the group 2-3,8-9
7.2. List of significant subsidiaries 8-9,60-61,109
8. Property, plant and equipment
8.1. Material existing or planned property, plant and equipment 153
8.2. Environmental issues that may affect the use of 34,147-149
property, plant and equipment

(1)
Press release dated March 5th
, 2015
157
9. Operating and financial review
9.1. Financial condition 20-22,27-29,35-37
9.2. Operating results
9.2.1. Significant factors materially affecting income 20-26
from operations
9.2.2. Reasons for material changes in net sales or 20-26
revenues
9.2.3. Policies or other factors that have materially affected, or could 17,30-34,89-92
materially affect, the issuer's operations
10. Capital resources
10.1. Issuer's capital resources 78-79,112,144
10.2. Source and amounts of cash flows 29,56,95-96
10.3. Borrowing requirements and funding structure 27-28,84-85,113,115-116
10.4. Restrictions on the use of capital resources that have materially affected, or 94,116
could materially affect, the issuer's operations
10.5. Sources of funds needed to fulfill commitments n/a
related to investment decisions
11. Research and development, patents and licenses 29,33,66
12. Trend information
12.1. Significant trends PR(1)
,23-26, 38,96,104
12.2. Events liable to influence trends n/a
13. Profit forecasts or estimates
13.1. Principal assumptions n/a
13.2. Auditor's report on these estimates n/a
13.3. Forecast comparable with historical information n/a
13.4. Validity of forecasts n/a
14. Administrative, management and supervisory bodies and senior management
14.1. Information about the members of the administrative, management or
supervisory
4-7,41-49,123-126
bodies
14.2. Administrative, management and supervisory bodies' and senior management 6,123-124
conflicts of interests
15. Remuneration and benefits
15.1. Amount of remuneration paid and benefits in kind 41-43,73,114
15.2. Total amounts set aside or accrued to provide 41-43,73,114
pension, retirement or similar benefits
16. Board practices
16.1. Date of expiration of the current term of office 47-48
16.2. Members of the administrative, management or supervisory bodies' service
contracts
141
16.3. Information about the audit committee and remuneration committee 7,49,126-128
16.4. Statement of compliance with corporate governance regime 123

>
OTHER INFORMATION
158
17. Employees
17.1. Number of employees at end of period, average number 30,72,114
17.2. Shareholdings and stock options 37-39,79,112
17.3. Arrangements for involving employees in the capital 41
18. Major shareholders
18.1. Threshold crossing 39-40
18.2. Existence of different voting rights 39-40
18.3. Control over the issuer 39-40
18.4. Arrangements the operation of which may result in a change of 39-40,131
control
19. Related party transactions 95,115,146
20. Financial information concerning the issuer's assets and liabilities, financial position and profits and losses
20.1. Historical financial information 54-57,99-100
20.2. Pro forma financial information n/a
20.3. Financial statements 54-96,99-116
20.4. Auditing of historical annual financial information
20.4.1. Statement that the historical financial information has been audited 97-98,117-118
20.4.2. Other information audited by the statutory auditors 119-122,136-137,150-152
20.4.3. Unaudited financial information n/a
20.5. Age of latest financial information
20.5.1. Last year of audited financial information 154-155
20.6. Interim and other financial information
20.6.1. Audited quarterly or half yearly financial information 154-155
20.6.2. Unaudited interim financial information 154-155
20.7. Dividend policy
20.7.1. Dividend amount per share 41,53
20.8. Legal and arbitration proceedings 33
20.9. Significant change in financial or trading position 21-29,62,96
21. Additional information
21.1. Share capital
21.1.1. Amount of issued capital, number of shares 40,79,144
21.1.2. Shares not representing capital 144
21.1.3. Treasury shares 40,79,109,112
21.1.4. Convertible securities, exchangeable securities or securities with 144
warrants
21.1.5. Terms of any acquisition rights and/or obligations n/a
over authorized but unissued capital
21.1.6. Information about the capital of any member of the group which is under n/a
option or agreed to be put under option
21.1.7. History of changes in the share capital 143
(1)
Press release dated March 5th
, 2015
159
21.2. Memorandum and Articles of Association
21.2.1. Corporate purpose 140
21.2.2. Members of the administrative, management and supervisory bodies 4-7,47-49,123
21.2.3. Rights, preferences and restrictions attaching to shares 142-143
21.2.4. Action necessary to change the rights of shareholders n/a
21.2.5. Conditions governing the manner in which annual and extraordinary general meetings
141
are called
21.2.6. Change in control 40,131,144
21.2.7. Share ownership threshold 39-40
21.2.8. Conditions governing changes in the capital 143-145
22. Material contracts 15,30-34
23. Third party information, statements by experts and declarations of interest
23.1. Expert's statement or report, information about the expert and n/a
statement of consent
23.2. Confirmation of accurate reproduction of information sourced from a n/a
third party
24. Documents on display 154-155
25. Information on holdings 8-9,60-62,109
12. 2014 ANNUAL FINANCIAL REPORT CROSS-REFERENCE TABLE Information Pages
1. Annual consolidated financial statements 54
2. Statutory auditors' report on the consolidated financial statements 97
3. Annual parent company financial statements 99
4. Statutory auditors' general and special report on the parent company financial
statements
117
5. Management Report 20
6. Persons responsible 6.1. Name and function of the person responsible for the annual financial report 138
6.2. Declaration by the persons responsible 138

This Registration Document was filed with the Autorité des Marchés Financiers (AMF - French market regulator) on March 17, 2015, pursuant to Article 212-13 of its General Regulation. It may be relied upon within the scope of a financial transaction if supplemented by a securities note approved by the AMF. This document was drawn up by the issuer and its signatories are liable for its content.
Pursuant to Article 28 of European Regulation No. 809/2004 of April 29, 2004, the reader is invited to consult previous registration documents with regard to specific information: The following information is included herein by reference: 1. The Management Report, the consolidated and parent company financial statements, the statutory auditors' reports on the consolidated and parent company financial statements for the year ended December 31, 2013 and the special report on regulated agreements pertaining to the same year, included in the Registration Document filed with the AMF on March 26, 2014 under number D.14-0212. 2. The Management Report, the consolidated and parent company financial statements, the statutory auditors' reports on the consolidated and parent company financial statements for the year ended December 31, 2012 and the special report on regulated agreements pertaining to the same year, included in the Registration Document filed with the AMF on March 28, 2013 under number D.13-0228.

(1)
Press release dated March 5th
, 2015
161