Embed Size (px)
Citation preview

2015 Final Report 3/17/2015
2014 ‐ 2015 WYOMING 4A BOYS BASKETBALL STATISTICS
State Tournament ‐ Casper State Championship History3W Kelly Walsh 58, 2E Sheridan 41 2014 ‐ Gillette 56, Kelly Walsh 51 4A West Overall 4A East Overall
1W Natrona 46, 4E Central 43 2013 ‐ Evanston 54, Riverton 50 Kelly Walsh 8 ‐ 2 18 ‐ 6 Sheridan 7 ‐ 3 14 ‐ 10
2W Riverton 54, 3E East 47 2012 ‐ Evanston 52, Gillette 51 2OT Natrona 7 ‐ 3 16 ‐ 9 Gillette 6 ‐ 4 15 ‐ 11
1E Gillette 58, 4W Evanston 35 2011 ‐ Gillette 60, Laramie 33 Evanston 6 ‐ 4 15 ‐ 12 East 5 ‐ 5 15 ‐ 10
Natrona 46, Kelly Walsh 39 2010 ‐ Natrona 55, Gillette 47 Riverton 6 ‐ 4 14 ‐ 13 Laramie 5 ‐ 5 12 ‐ 9
Gillette 58, Riverton 56 2009 ‐ Natrona 62, Kelly Walsh 43 Rock Springs 3 ‐ 7 5 ‐ 17 Central 5 ‐ 5 13 ‐ 14Natrona 46, Gillette 43 2008 ‐ Gillette 68, Rock Springs 53 Green River 0 ‐ 10 0 ‐ 21 South 2 ‐ 8 9 ‐ 13
Kelly Walsh 73, Riverton 68 OT 2007 ‐ Natrona 63, Laramie 54 1997 ‐ Gillette 56, Evanston 54 1987 ‐ Green River d. Central
Central 51, Sheridan 50 2006 ‐ East 62, Central 49 1996 ‐ Gillette d. Cody 1986 ‐ Natrona d. Rock Springs
Evanston 56, East 46 2005 ‐ Natrona 47, Rock Springs 38 1995 ‐ Gillette d. Natrona 1985 ‐ Laramie d. Sheridan
Central 44, Evanston 31 2004 ‐ Evanston 58, Natrona 48 1994 ‐ Gillette d. Sheridan 1984 ‐ Central d. Kelly Walsh
2003 ‐ Sheridan 62, Gillette 61 1993 ‐ Gillette d. East 1983 ‐ Class AA ‐ Central d. Riverton
Champion ‐ Natrona 2002 ‐ Gillette 76, Sheridan 49 1992 ‐ Gillette d. East 1982 ‐ Rawlins d. Rock Springs
2nd ‐ Gillette 2001 ‐ Natrona 60, Evanston 50 1991 ‐ Central d. Gillette 1981 ‐ Kelly Walsh d. Natrona
3rd ‐ Kelly Walsh 2000 ‐ Gillette 76, Kelly Walsh 51 1990 ‐ Gillette d. East 1980 ‐ Kelly Walsh d. Central
4th ‐ Central 1999 ‐ Gillette 63, Laramie 53 1989 ‐ Natrona d. East 1979 ‐ Central d. East
1998 ‐ Central 58, Rock Springs 50 1988 ‐ East d. Central 1978 ‐ Central d. Sheridan
Points 34
Lowest Opp Points
FG% 92%
FT% 100%
Rebounds 17
Assists 10
Steals 6
Blocked Shots 5
Most Opp TO's
* = At least 8 attempts
Per Game Averages
Team Scoring
Team Scoring PTS OPP PTS
SCORE
MARGIN ASSIST OPP ASSIST
1 Gillette 67.0 58.1 8.8 14.0 8.6
2 Riverton 58.6 53.1 5.4 15.8 10.2
3 Kelly Walsh 56.0 43.4 12.6 12.1 7.3
4 East 55.7 53.3 2.4 11.8 11.0
5 Sheridan 55.6 53.2 2.4 9.5 9.9
6 Laramie 54.3 50.0 4.3 7.9 10.2
7 South 53.5 56.5 ‐3.0 8.9 12.2
8 Natrona 52.3 49.2 3.1 11.6 10.8
9 Evanston 49.8 50.5 ‐0.7 12.1 8.4
10 Central 48.6 48.3 0.3 7.9 6.2
11 Rock Springs 48.2 60.3 ‐12.1 8.1 13.4
12 Green River 41.2 64.8 ‐23.5 7.3 14.6
10 Riverton P Bergman, 55: K Morehead, 34 Natrona: Gillette
30 Natrona
16 Riverton
Peak Single Game Performances
99 Gillette R Blackwell, 30 South
67% Riverton B Fullerton, 10 Riverton
90% SouthT Trumble, 11: K Goglio, 1: G Storebo, 33: T
Larson, 2: B Godwin, 31: A Barker, 24: R
Blackwell, 30
Green River: Central:
Gillette: Sheridan: South
25 RivertonA Johnson, 4: G Whittaker, 35: B Fullerton,
10: C Quayle, 13: T Peeples, 10: D Daniels,
13: B Nelson, 13: M Debruyn, 2
Evanston: Riverton: East:
Sheridan: South
52 Kelly Walsh K Clark, 4 Sheridan
33 Riverton C Quayle, 13 Riverton
*
*
www.wyopreps.com
Home for High School Stats

2015 Final Report 3/17/2015
Team Scoring
Team Shooting FG % 3FGM 3FGA 3FG % 2FGM 2FGA 2FG % FTM FTA FT %
1 Riverton 47% 5.3 15.3 35% 16.5 31.1 53% 9.7 14.5 67%
2 Gillette 46% 8.3 23.3 36% 15.0 27.6 54% 11.9 17.2 69%
3 Laramie 44% 4.2 14.2 30% 14.9 29.3 51% 12.0 18.1 66%
4 Central 43% 4.6 13.9 33% 12.3 25.3 49% 10.3 15.6 66%
5 Kelly Walsh 43% 5.3 17.0 31% 14.5 29.4 49% 11.1 18.1 61%
6 South 42% 4.4 13.0 34% 13.3 29.1 46% 13.6 20.0 68%
7 Natrona 40% 3.9 15.0 26% 14.7 31.2 47% 11.2 18.1 62%
8 Evanston 40% 3.9 13.7 28% 13.1 28.8 46% 11.9 17.6 68%
9 East 39% 3.6 12.7 28% 15.6 36.2 43% 13.8 20.0 69%
10 Rock Springs 39% 4.1 16.2 25% 12.7 27.1 47% 11.2 19.5 57%
11 Sheridan 36% 7.1 22.2 32% 11.2 28.0 40% 12.0 17.8 67%
12 Green River 35% 3.8 14.1 27% 8.7 21.9 40% 12.5 19.3 65%
Team Scoring
Team Rebounding REB OFF REB DEF REB OPP REB OPP OFF REB
OPP DEF
REB
REB
MRGN
1 Kelly Walsh 31.7 10.4 21.3 22.6 6.8 15.8 9.2
2 Sheridan 30.5 12.0 18.5 27.8 8.0 19.8 2.6
3 Natrona 28.0 10.5 17.5 25.4 6.6 18.8 2.6
4 Gillette 27.1 9.8 17.3 27.3 9.5 17.7 ‐0.2
5 Laramie 26.8 9.6 17.2 23.4 6.0 17.4 3.4
6 East 26.5 8.6 18.0 25.9 7.6 18.2 0.7
7 Riverton 24.9 6.1 18.7 28.4 9.4 19.0 ‐3.5
8 Evanston 24.6 7.6 17.0 24.6 7.8 16.8 0.0
9 Central 23.6 6.6 17.0 24.9 8.4 16.5 ‐1.3
10 South 23.5 6.7 16.8 26.5 9.5 17.0 ‐2.9
11 Rock Springs 23.3 6.6 16.6 32.0 11.7 20.3 ‐8.7
12 Green River 22.2 5.8 16.5 29.6 10.3 19.3 ‐7.4
Team Scoring
Team Defense PTS / GM OPP FGA OPP FG % OPP 3FGA OPP 3FG % OPP FTA OPP FT % STL / GM BLK / GM
OPP TO /
GM
1 Kelly Walsh 43.4 40.5 33.5% 13.6 24% 18.3 68% 6.6 2.5 11.9
2 Central 48.3 41.6 37.0% 17.7 33% 17.0 68% 6.4 2.7 12.4
3 Natrona 49.2 39.6 40.8% 15.4 36% 17.8 64% 8.1 2.6 15.2
4 Laramie 50.0 39.1 40.9% 14.7 31% 20.0 66% 8.0 0.3 13.2
5 Evanston 50.5 41.8 42.7% 15.2 29% 16.1 62% 6.2 1.4 11.5
6 Riverton 53.1 47.9 40.1% 15.5 30% 17.0 66% 9.2 2.4 13.6
7 Sheridan 53.2 42.0 41.6% 13.1 30% 21.6 64% 7.9 1.5 13.1
8 East 53.3 43.5 42.7% 14.4 30% 17.1 61% 9.8 1.9 14.4
9 South 56.5 44.7 43.8% 17.2 33% 17.6 71% 9.4 1.3 13.1
10 Gillette 58.1 44.9 41.8% 13.5 32% 17.9 68% 8.8 2.0 16.7
11 Rock Springs 60.3 49.9 41.1% 15.6 33% 19.4 67% 6.6 3.1 12.0
12 Green River 64.8 52.6 46.1% 16.7 31% 18.0 63% 5.7 1.0 10.2
www.wyopreps.com
Home for High School Stats

2015 Final Report 3/17/2015
Conference Top 10 Per Game Averages * To be eligible for Top 10, player must participate in 1/2 of team's games
SCORING West Conference East Conference
Player, # PTS FG % FT % SCHOOL Player, # PTS FG % FT % SCHOOL
1 Brandon Fullerton, 10 16.5 49% 77% Riverton Elijah Oliver, 30 19.4 43% 75% East
2 Alek Johnson, 4 15.7 41% 73% Evanston Zach Mccord, 2 17.3 40% 73% East
3 Chris Quayle, 13 12.9 46% 71% Riverton Richard Blackwell, 30 16.0 54% 73% South
4 Brock Ehlers, 30 12.3 39% 68% Evanston Jake Aadland, 2 15.9 48% 84% Laramie
5 Demetrius Davenport, 0 11.9 39% 71% Rock Springs Dylan Daniels, 13 14.9 35% 71% Sheridan
6 Peter Bergman, 55 11.7 58% 63% Natrona Michael Debruyn, 2 13.6 42% 71% South
7 Marcus Nolan, 4 10.3 45% 58% Kelly Walsh Blake Godwin, 31 12.9 34% 82% Sheridan
8 Parker Browning, 3 10.2 34% 74% Natrona Eli Voigt, 33 11.3 45% 79% Gillette
9 Tanner Trumble, 11 10.1 47% 75% Green River Nicholas Fraley, 2 11.0 42% 72% Central
10 Drew Petrie, 3 10.0 40% 70% Kelly Walsh Cale Miessler, 24 10.8 38% 84% Gillette
REBOUNDING
PLAYER,# REB OFF REB DEF RB SCHOOL PLAYER,# REB OFF REB DEF RB SCHOOL
1 Peter Bergman, 55 9.2 3.9 5.3 Natrona Kris Clark, 4 10.0 5.3 4.8 Sheridan
2 Ethan Applegate, 15 7.6 3.1 4.5 Kelly Walsh Brandon Koch, 43 7.0 3.0 4.0 Gillette
3 Brock Ehlers, 30 6.9 1.7 5.3 Evanston Elijah Oliver, 30 6.7 1.0 5.7 East
4 Chris Quayle, 13 6.1 1.3 4.9 Riverton Tristan Eickbush, 33 6.4 2.6 3.8 Laramie
5 Brandon Fullerton, 10 6.1 1.5 4.6 Riverton Richard Blackwell, 30 5.5 2.1 3.4 South
6 Demetrius Davenport, 0 6.0 1.2 4.8 Rock Springs Blake Baker, 34 4.7 2.5 2.3 Sheridan
7 Hayden Love, 0 5.7 1.4 4.3 Green River Brock Anderson, 22 4.7 1.1 3.6 Central
8 Marcus Nolan, 4 5.6 1.5 4.1 Kelly Walsh Nicholas Fraley, 2 4.3 1.1 3.2 Central
9 Alek Johnson, 4 5.5 1.7 3.7 Evanston Andy Pearson, 1 3.8 1.7 2.1 Laramie
10 Tanner Trumble, 11 5.3 1.7 3.6 Green River Tyler Peeples, 10 3.6 1.3 2.3 East
ASSISTS
PLAYER,# AST TO SCHOOL PLAYER,# AST TO SCHOOL
1 Chris Quayle, 13 5.1 2.0 Riverton Cale Miessler, 24 3.8 1.7 Gillette
2 Alek Johnson, 4 3.4 2.7 Evanston Zach Mccord, 2 3.1 1.9 East
3 Brady Fullerton, 23 3.3 1.5 Riverton Dylan Daniels, 13 3.0 1.9 Sheridan
4 Drew Petrie, 3 3.1 1.5 Kelly Walsh Marquez Jefferson, 3 2.5 2.6 South
5 Brandon Fullerton, 10 3.1 1.8 Riverton Tyler Peeples, 10 2.2 1.3 East
6 Marcus Nolan, 4 2.4 1.5 Kelly Walsh Robert Munoz, 15 2.1 1.2 East
7 Stevann Brown, 22 2.2 2.2 Natrona Andrew Hays, 12 2.0 1.8 Gillette
8 Miles Piper, 15 2.2 2.2 Evanston Tye Brown, 22 1.9 2.9 Laramie
9 Demetrius Davenport, 0 2.1 2.9 Rock Springs Blake Godwin, 31 1.8 1.8 Sheridan
10 Chase Cook, 5 2.0 1.4 Evanston Michael Debruyn, 2 1.7 2.6 South
STEALS
PLAYER,# STL FOUL SCHOOL PLAYER,# STL FOUL SCHOOL
1 Brandon Fullerton, 10 2.7 1.7 Riverton Michael Debruyn, 2 2.5 3.2 South
2 Chris Quayle, 13 2.7 2.4 Riverton Tyler Peeples, 10 2.0 2.8 East
3 Alek Johnson, 4 2.0 2.7 Evanston Marquez Jefferson, 3 2.0 2.5 South
4 Logan Wilson, 5 1.8 2.3 Natrona Elijah Oliver, 30 1.8 2.2 East
5 Jared Rodriguez, 23 1.4 3.2 Rock Springs Zach Mccord, 2 1.8 1.8 East
6 Stevann Brown, 22 1.4 1.7 Natrona Dylan Daniels, 13 1.7 2.3 Sheridan
7 Chase Erickson, 10 1.4 1.8 Green River Cale Miessler, 24 1.6 2.0 Gillette
8 Tanner Trumble, 11 1.4 2.5 Green River Robert Munoz, 15 1.5 2.2 East
9 Carter Rosette, 22 1.4 3.5 Rock Springs Andrew Hays, 12 1.3 2.5 Gillette
10 Brady Fullerton, 23 1.3 1.6 Riverton Dontel Ybarra, 1 1.3 2.3 Central
www.wyopreps.com
Home for High School Stats

2015 Final Report 3/17/2015
BLOCKED SHOTS
PLAYER,# BLK FOUL SCHOOL PLAYER,# BLK FOUL SCHOOL
1 Peter Bergman, 55 1.3 3.1 Natrona Kain Morehead, 34 1.0 1.2 Gillette
2 Marcus Hoversland, 23 1.1 1.8 Kelly Walsh Jacob Ross, 31 0.9 1.2 East
3 Kelby Kramer, 44 1.0 0.9 Rock Springs Rhett Sanders, 45 0.6 1.8 East
4 Demetrius Davenport, 0 0.9 1.8 Rock Springs Isaiah Dicks, 41 0.6 0.9 South
5 Jordan Yowell, 34 0.9 2.8 Riverton Bryce Francois, 4 0.6 2.1 Central
6 Brandon Fullerton, 10 0.6 1.7 Riverton Blake Baker, 34 0.5 2.6 Sheridan
7 Marcus Nolan, 4 0.6 2.8 Kelly Walsh Grant Storebo, 33 0.4 1.8 Central
8 Chris Quayle, 13 0.6 2.4 Riverton Nicholas Fraley, 2 0.4 1.6 Central
9 Alek Johnson, 4 0.5 2.7 Evanston Trey Larson, 2 0.3 3.0 Gillette
10 Brock Ehlers, 30 0.5 2.7 Evanston Brandon Koch, 43 0.3 3.5 Gillette
3 POINT % (At least 10 3FGA)
PLAYER,# 3FG % 3FGM 3FGA SCHOOL PLAYER,# 3FG % 3FGM 3FGA SCHOOL
1 Chase Cook, 5 50% 0.9 1.7 Evanston Marquez Jefferson, 3 48% 1.5 3.0 South
2 Easton Paxton, 12 44% 1.7 3.9 Riverton Eli Voigt, 33 46% 2.2 4.8 Gillette
3 Stevann Brown, 22 43% 0.9 2.0 Natrona Tristan Eickbush, 33 44% 0.3 0.8 Laramie
4 Koleton Lone Bear, 33 37% 0.5 1.3 Riverton Grant Storebo, 33 41% 1.1 2.7 Central
5 Jaxon Hiatt, 11 36% 0.6 1.6 Kelly Walsh D'Antae Mccray, 14 40% 0.4 0.9 South
6 Tanner Hilderbrand, 13 36% 1.5 4.2 Kelly Walsh Dontel Ybarra, 1 40% 0.8 2.0 Central
7 Drew Petrie, 3 34% 1.4 4.2 Kelly Walsh Andy Pearson, 1 39% 0.7 1.7 Laramie
8 Brady Fullerton, 23 33% 0.8 2.3 Riverton Ian Durgin, 31 39% 0.5 1.2 Gillette
9 Brock Ehlers, 30 33% 1.0 3.1 Evanston Cale Miessler, 24 37% 2.4 6.5 Gillette
10 Grant Murphy, 12 33% 0.8 2.4 Kelly Walsh Austin Barker, 24 37% 0.9 2.4 South
FIELD GOAL % (At least 10 FGA) (Includes 2FGA and 3FGA)
PLAYER,# FG % FGM FGA SCHOOL PLAYER,# FG % FGM FGA SCHOOL
1 Braxton Lajeunesse, 3 60% 0.6 1.0 Riverton Talon Nelson, 5 58% 2.4 4.1 Gillette
2 Logan Wilson, 5 59% 1.8 3.0 Natrona T.J. Olsen, 14 56% 1.0 1.7 East
3 Peter Bergman, 55 58% 4.7 8.0 Natrona Richard Blackwell, 30 54% 5.4 10.0 South
4 Cam Mcdaniel, 24 52% 2.0 3.9 Kelly Walsh Tristan Eickbush, 33 51% 4.0 7.8 Laramie
5 Caleb Richmond, 41 51% 1.4 2.8 Riverton Brandon Koch, 43 51% 3.7 7.2 Gillette
6 Jordan Yowell, 34 50% 3.1 6.2 Riverton Gabe Mcdonald, 34 50% 0.5 1.1 South
7 Austyn Sellers, 20 50% 0.4 0.7 Riverton Andrew Hays, 12 49% 3.0 6.0 Gillette
8 Brandon Fullerton, 10 49% 6.1 12.5 Riverton Kain Morehead, 34 49% 1.4 2.9 Gillette
9 Parker Franzen, 14 48% 0.8 1.6 Natrona Grant Storebo, 33 48% 2.2 4.5 Central
10 Marcus Hoversland, 23 48% 1.9 4.0 Kelly Walsh Jake Aadland, 2 48% 5.7 11.9 Laramie
FREE THROW % (At least 10 FTA)
PLAYER,# FT % FTM FTA SCHOOL PLAYER,# FT % FTM FTA SCHOOL
1 Chase Cook, 5 79% 1.0 1.2 Evanston Jake Aadland, 2 84% 2.5 2.9 Laramie
2 Brandon Fullerton, 10 77% 3.2 4.2 Riverton Cale Miessler, 24 84% 2.0 2.3 Gillette
3 Tanner Trumble, 11 75% 5.0 6.6 Green River Blake Godwin, 31 82% 2.2 2.7 Sheridan
4 Parker Browning, 3 74% 2.4 3.2 Natrona Grant Storebo, 33 79% 2.1 2.7 Central
5 Manny N'Tula, 5 74% 0.6 0.9 Kelly Walsh Eli Voigt, 33 79% 1.0 1.3 Gillette
6 Alek Johnson, 4 73% 3.9 5.3 Evanston Andrew Garcia, 3 76% 0.6 0.8 Laramie
7 Luke Ferrell, 35 72% 0.6 0.9 Green River Jacob Ross, 31 76% 0.8 1.0 East
8 Austin Luers, 32 72% 1.5 2.1 Natrona Elijah Oliver, 30 75% 4.4 5.8 East
9 Demetrius Davenport, 0 71% 3.4 4.7 Rock Springs Marquez Jefferson, 3 74% 2.0 2.6 South
10 Chris Quayle, 13 71% 3.1 4.4 Riverton Trey Larson, 2 73% 2.2 3.0 Gillette
www.wyopreps.com
Home for High School Stats

2015 Final Report 3/17/2015
All Class Top 10 Per Game Averages * To be eligible for Top 10, player must participate in 1/2 of team's games
SCORING REBOUNDING
Player, # PTS FG % FT % SCHOOL Player, # REB OFF/DEF REB SCHOOL
1 Elijah Oliver, 30 19.4 43% 75% East Kris Clark, 4 10.0 5.3 4.8 Sheridan
2 Zach Mccord, 2 17.3 40% 73% East Peter Bergman, 55 9.2 3.9 5.3 Natrona
3 Brandon Fullerton, 10 16.5 49% 77% Riverton Ethan Applegate, 15 7.6 3.1 4.5 Kelly Walsh
4 Richard Blackwell, 30 16.0 54% 73% South Brandon Koch, 43 7.0 3.0 4.0 Gillette
5 Jake Aadland, 2 15.9 48% 84% Laramie Brock Ehlers, 30 6.9 1.7 5.3 Evanston
6 Alek Johnson, 4 15.7 41% 73% Evanston Elijah Oliver, 30 6.7 1.0 5.7 East
7 Dylan Daniels, 13 14.9 35% 71% Sheridan Tristan Eickbush, 33 6.4 2.6 3.8 Laramie
8 Michael Debruyn, 2 13.6 42% 71% South Chris Quayle, 13 6.1 1.3 4.9 Riverton
9 Chris Quayle, 13 12.9 46% 71% Riverton Brandon Fullerton, 10 6.1 1.5 4.6 Riverton
10 Blake Godwin, 31 12.9 34% 82% Sheridan Demetrius Davenport, 0 6.0 1.2 4.8 Rock Springs
ASSISTS STEALS
PLAYER,# AST TO SCHOOL PLAYER,# STL FOUL SCHOOL
1 Chris Quayle, 13 5.1 2.0 Riverton Brandon Fullerton, 10 2.7 1.7 Riverton
2 Cale Miessler, 24 3.8 1.7 Gillette Chris Quayle, 13 2.7 2.4 Riverton
3 Alek Johnson, 4 3.4 2.7 Evanston Michael Debruyn, 2 2.5 3.2 South
4 Brady Fullerton, 23 3.3 1.5 Riverton Alek Johnson, 4 2.0 2.7 Evanston
5 Zach Mccord, 2 3.1 1.9 East Tyler Peeples, 10 2.0 2.8 East
6 Drew Petrie, 3 3.1 1.5 Kelly Walsh Marquez Jefferson, 3 2.0 2.5 South
7 Brandon Fullerton, 10 3.1 1.8 Riverton Elijah Oliver, 30 1.8 2.2 East
8 Dylan Daniels, 13 3.0 1.9 Sheridan Logan Wilson, 5 1.8 2.3 Natrona
9 Marquez Jefferson, 3 2.5 2.6 South Zach Mccord, 2 1.8 1.8 East
10 Marcus Nolan, 4 2.4 1.5 Kelly Walsh Dylan Daniels, 13 1.7 2.3 Sheridan
BLOCKED SHOTS 3 POINT % (At least 10 3FGA)
PLAYER,# BLK FOUL SCHOOL PLAYER,# 3FG % 3FGM 3FGA SCHOOL
1 Peter Bergman, 55 1.3 3.1 Natrona Chase Cook, 5 50% 0.9 1.7 Evanston
2 Marcus Hoversland, 23 1.1 1.8 Kelly Walsh Marquez Jefferson, 3 48% 1.5 3.0 South
3 Kelby Kramer, 44 1.0 0.9 Rock Springs Eli Voigt, 33 46% 2.2 4.8 Gillette
4 Kain Morehead, 34 1.0 1.2 Gillette Easton Paxton, 12 44% 1.7 3.9 Riverton
5 Demetrius Davenport, 0 0.9 1.8 Rock Springs Tristan Eickbush, 33 44% 0.3 0.8 Laramie
6 Jordan Yowell, 34 0.9 2.8 Riverton Stevann Brown, 22 43% 0.9 2.0 Natrona
7 Jacob Ross, 31 0.9 1.2 East Grant Storebo, 33 41% 1.1 2.7 Central
8 Brandon Fullerton, 10 0.6 1.7 Riverton D'Antae Mccray, 14 40% 0.4 0.9 South
9 Marcus Nolan, 4 0.6 2.8 Kelly Walsh Dontel Ybarra, 1 40% 0.8 2.0 Central
10 Rhett Sanders, 45 0.6 1.8 East Andy Pearson, 1 39% 0.7 1.7 Laramie
FIELD GOAL % (At least 10 FGA) (Includes 2FGA and 3FGA) FREE THROW % (At least 10 FTA)
PLAYER,# FG % FGM FGA SCHOOL PLAYER,# FT % FTM FTA SCHOOL
1 Braxton Lajeunesse, 3 60% 0.6 1.0 Riverton Jake Aadland, 2 84% 2.5 2.9 Laramie
2 Logan Wilson, 5 59% 1.8 3.0 Natrona Cale Miessler, 24 84% 2.0 2.3 Gillette
3 Peter Bergman, 55 58% 4.7 8.0 Natrona Blake Godwin, 31 82% 2.2 2.7 Sheridan
4 Talon Nelson, 5 58% 2.4 4.1 Gillette Grant Storebo, 33 79% 2.1 2.7 Central
5 T.J. Olsen, 14 56% 1.0 1.7 East Chase Cook, 5 79% 1.0 1.2 Evanston
6 Richard Blackwell, 30 54% 5.4 10.0 South Eli Voigt, 33 79% 1.0 1.3 Gillette
7 Cam Mcdaniel, 24 52% 2.0 3.9 Kelly Walsh Brandon Fullerton, 10 77% 3.2 4.2 Riverton
8 Caleb Richmond, 41 51% 1.4 2.8 Riverton Andrew Garcia, 3 76% 0.6 0.8 Laramie
9 Tristan Eickbush, 33 51% 4.0 7.8 Laramie Jacob Ross, 31 76% 0.8 1.0 East
10 Brandon Koch, 43 51% 3.7 7.2 Gillette Elijah Oliver, 30 75% 4.4 5.8 East
www.wyopreps.com
Home for High School Stats

West Regional 4th Place 4A BB West27 15 12 6 4
PLAYER,# GP 3FGM 3FGA 3FG % 2FGM 2FGA 2FG % FTM FTA FT % PTSOFF
REB
DEF
REBREB AST STL BLK TO'S FOUL
PTS /
GM
O REB
/GM
D REB
/GM
REB /
GM
AST /
GM
STL /
GM
BLK /
GM
TO'S /
GM
FOUL
/ GM
Alek Johnson, 4 27 18 93 19% 133 273 49% 105 143 73% 425 47 101 148 93 54 14 72 74 15.7 1.7 3.7 5.5 3.4 2.0 0.5 2.7 2.7
Chase Cook, 5 27 23 46 50% 4 19 21% 26 33 79% 103 23 22 45 55 30 39 61 3.8 0.9 0.8 1.7 2.0 1.1 1.4 2.3
Braeden Macdonald, 13 9 1 1 2 2 2 1 1 4 0.2 0.2 0.2 0.1 0.1 0.4
Alex Richins, 14 24 1 8 13% 4 7 57% 7 4 4 7 1 8 9 0.3 0.2 0.2 0.3 0.0 0.3 0.4
Miles Piper, 15 27 22 75 29% 4 13 31% 17 25 68% 91 2 21 23 59 15 59 58 3.4 0.1 0.8 0.9 2.2 0.6 2.2 2.1
Spencer Burleigh, 21 26 7 4 9 44% 3 6 50% 11 4 6 10 2 4 7 41 0.4 0.2 0.2 0.4 0.1 0.2 0.3 1.6
Dylan Mathson, 23 27 11 36 31% 6 13 46% 12 17 71% 57 10 25 35 14 8 2 20 37 2.1 0.4 0.9 1.3 0.5 0.3 0.1 0.7 1.4
Brock Ehlers, 30 27 28 85 33% 87 207 42% 75 111 68% 333 45 142 187 40 32 13 43 72 12.3 1.7 5.3 6.9 1.5 1.2 0.5 1.6 2.7
Jesse Barker, 31 27 1 9 11% 10 23 43% 6 12 50% 29 22 30 52 21 6 13 38 1.1 0.8 1.1 1.9 0.8 0.2 0.5 1.4
Ian Fisher, 33 9 2 1 3 33% 1 4 25% 3 1 2 3 1 0.3 0.1 0.2 0.3 0.1
Gavin Whittaker, 35 27 1 7 14% 82 168 49% 52 85 61% 219 43 76 119 23 17 3 43 55 8.1 1.6 2.8 4.4 0.9 0.6 0.1 1.6 2.0
Josh Rutter, 41 26 1 23 49 47% 21 31 68% 67 8 28 36 10 1 5 11 19 2.6 0.3 1.1 1.4 0.4 0.0 0.2 0.4 0.7
1
Team Totals 27 105 370 28% 354 778 46% 322 474 68% 1345 205 459 664 327 168 38 316 469 49.8 7.6 17.0 24.6 12.1 6.2 1.4 11.7 17.4
Opponent Totals 25 109 379 29% 337 665 51% 251 402 62% 1364 195 420 615 210 168 42 287 436 50.5 7.8 16.8 24.6 8.4 6.7 1.7 11.5 17.4
Peak Performances
Points
Lowest Opp Points
FG%
FT%
Rebounds
Assists
Steals
Blocked Shots
Most Opp TO's
Season Recap ** Indicates Conference Game
Opponent: Score 3FG 3FGA 3FG % 2FG 2FGA 2FG % FT FTA FT % FG % O REB D REB REB AST STL BLK TO'S FOUL
Laramie: 12/11/14 6 16 38% 12 23 52% 7 10 70% 46% 7 16 23 16 11 2 12 12
49 ‐ 30 2 12 17% 10 25 40% 4 5 80% 32% 10 10 20 3 11 15 12
South: 12/12/14 3 20 15% 13 29 45% 12 20 60% 33% 8 15 23 13 4 11 30
47 ‐ 65 2 11 18% 16 27 59% 27 35 77% 47% 5 28 33 7 12 1 18 20
Sheridan: 12/13/14 4 11 36% 11 30 37% 22 29 76% 37% 13 24 37 11 5 3 15 15
56 ‐ 47 4 19 21% 15 24 63% 5 14 36% 44% 3 11 14 7 10 3 8 23
East: 12/18/14 15 11 25 44% 9 10 90% 28% 7 16 23 9 6 1 13 19
31 ‐ 56 3 10 30% 19 35 54% 9 13 69% 49% 9 18 27 10 11 1 5 10
Mountain View: 12/19/14 6 21 29% 17 25 68% 6 8 75% 50% 7 18 25 15 6 5 8 16
58 ‐ 45 3 12 25% 13 34 38% 10 20 50% 35% 15 18 33 7 3 1 6 14
Evanston Red Devils Overall Record 15 ‐ 12 Conference Record 6 ‐ 4
Team Best Opponent Individual Best Player, # Opponent
75 Green River 31 A Johnson, 4 Gillette
30 Laramie
62% East 73% A Johnson, 4 Gillette
90% East 90% A Johnson, 4 Natrona
37 Sheridan 15 B Ehlers, 30 Rock Springs
23 Green River 8 A Johnson, 4 Gillette
18 Jackson 6 A Johnson, 4: G Whittaker, 35 Jackson
5 Mountain View 3 A Johnson, 4: B Ehlers, 30 Sheridan: Mountain View
POINTS REB AST
20 ‐‐ A Johnson, 4 7 ‐‐ A Johnson, 4 6 ‐‐ A Johnson, 4
27 Jackson
Defensive Stats PEAK PERFORMERS
10 ‐‐ J Rutter, 41 6 ‐‐ G Whittaker, 35: J
Rutter, 41
3 ‐‐ A Johnson, 4
13 ‐‐ D Mathson, 23 11 ‐‐ B Ehlers, 30 6 ‐‐ A Johnson, 4
22 ‐‐ B Ehlers, 30 7 ‐‐ B Ehlers, 30 6 ‐‐ A Johnson, 4
17 ‐‐ A Johnson, 4 13 ‐‐ A Johnson, 4 6 ‐‐ B Ehlers, 30
www.wyopreps.com
Home for High School StatsWyoming High School Basketball ‐ 4A BB2014 ‐ 2015 Season

Gillette: 12/20/14 6 11 55% 16 29 55% 22 28 79% 55% 5 19 24 15 3 4 13 19
72 ‐ 63 8 31 26% 15 26 58% 9 18 50% 40% 10 15 25 6 4 8 27
Star Valley: 1/3/15 3 17 18% 12 21 57% 7 13 54% 39% 7 15 22 12 4 2 8 17
40 ‐ 43 3 12 25% 12 23 52% 10 17 59% 43% 7 13 20 13 2 7 17
Central: 1/9/15 5 10 50% 9 27 33% 15 19 79% 38% 4 22 26 12 6 1 12 13
47 ‐ 41 3 20 15% 13 25 52% 6 8 75% 36% 5 15 20 4 8 2 11 19
Windsor Co: 1/8/15 6 18 33% 15 31 48% 11 13 85% 43% 6 18 24 13 2 2 15 22
59 ‐ 68
Laramie: 1/10/15 6 13 46% 10 25 40% 14 19 74% 42% 10 17 27 11 2 2 11 11
52 ‐ 49 7 18 39% 11 24 46% 6 8 75% 43% 7 15 22 5 10 10 17
Jackson: 1/16/15 2 17 12% 11 40 28% 25 31 81% 23% 14 17 31 12 18 2 13 20
53 ‐ 51 OT 2 6 33% 19 34 56% 7 16 44% 53% 7 29 36 7 7 3 27 22
Green River: 1/22/15 ** 4 15 27% 26 39 67% 11 17 65% 56% 9 20 29 23 5 10 22
75 ‐ 48 5 12 42% 8 21 38% 17 25 68% 39% 3 12 15 8 7 14 15
Rock Springs: 1/24/15 ** 2 5 40% 17 33 52% 11 16 69% 50% 7 20 27 16 7 1 6 12
51 ‐ 38 6 18 33% 6 17 35% 8 11 73% 34% 3 12 15 10 2 2 7 16
Kelly Walsh: 1/31/15 ** 4 12 33% 12 27 44% 16 18 89% 41% 4 14 18 9 3 1 8 19
52 ‐ 48 4 13 31% 10 23 43% 16 25 64% 39% 9 16 25 7 6 2 9 19
Natrona: 1/30/15 ** 6 14 43% 10 18 56% 10 12 83% 50% 2 13 15 15 5 2 21 13
48 ‐ 66 5 18 28% 20 32 63% 11 13 85% 50% 12 10 22 15 8 2 10 10
Riverton: 2/5/15 ** 3 16 19% 13 33 39% 9 12 75% 33% 8 14 22 9 10 13 15
44 ‐ 62 7 13 54% 17 30 57% 7 11 64% 56% 6 24 30 18 8 2 12 20
Rock Springs: 2/13/15 ** 3 12 25% 14 30 47% 9 25 36% 40% 11 25 36 9 5 2 10 18
46 ‐ 49 4 19 21% 14 24 58% 9 20 45% 42% 10 21 31 9 6 2 10 18
Green River: 2/12/15 ** 7 16 44% 10 36 28% 10 20 50% 33% 13 17 30 11 9 2 11 17
51 ‐ 44
Kelly Walsh: 2/20/15 ** 11 10 28 36% 10 16 63% 26% 5 16 21 1 5 13 13
30 ‐ 52 5 19 26% 16 29 55% 5 12 42% 44% 10 20 30 11 7 1 9 15
Natrona: 2/21/15 ** 5 11 45% 12 22 55% 16 25 64% 52% 4 20 24 12 3 1 10 18
55 ‐ 47 5 16 31% 12 30 40% 8 17 47% 37% 8 15 23 11 7 5 6 24
Riverton: 2/26/15 ** 5 10 50% 14 29 48% 13 16 81% 49% 6 20 26 17 7 1 16 16
56 ‐ 41 4 12 33% 12 27 44% 5 12 42% 41% 5 13 18 11 1 4 10 15
Green River: 3/5/15 4 15 27% 22 37 59% 13 18 72% 50% 10 14 24 21 10 1 7 17
69 ‐ 45 5 16 31% 11 17 65% 8 13 62% 48% 3 15 18 7 7 1 20 12
Natrona: 3/6/15 3 11 27% 11 34 32% 11 21 52% 31% 9 14 23 3 8 12 23
42 ‐ 56 2 6 33% 17 28 61% 16 26 62% 56% 7 25 32 10 6 2 15 20
Kelly Walsh: 3/7/15 4 15 27% 6 25 24% 15 25 60% 25% 6 11 17 9 6 1 5 19
39 ‐ 62 5 20 25% 16 29 55% 15 19 79% 43% 16 26 42 10 4 1 9 23
Gillette: 3/12/15 2 11 18% 13 32 41% 3 11 27% 35% 7 12 19 12 7 12 18
35 ‐ 58 7 19 37% 13 25 52% 11 15 73% 45% 10 19 29 6 6 11 16
East: 3/13/15 4 9 44% 17 25 68% 10 16 63% 62% 7 20 27 15 4 1 20 19
56 ‐ 46 2 14 14% 15 35 43% 10 15 67% 35% 7 4 11 5 10 14 19
Central: 3/14/15 2 18 11% 10 25 40% 5 6 83% 28% 9 12 21 6 7 1 11 16
31 ‐ 44 6 13 46% 7 21 33% 12 14 86% 38% 8 16 24 3 5 7 16 13
16 ‐‐ A Johnson, 4 11 ‐‐ B Ehlers, 30 4 ‐‐ B Ehlers, 30
18 ‐‐ A Johnson, 4 9 ‐‐ B Ehlers, 30 4 ‐‐ C Cook, 5
31 ‐‐ A Johnson, 4 9 ‐‐ B Ehlers, 30 8 ‐‐ A Johnson, 4
15 ‐‐ A Johnson, 4 10 ‐‐ A Johnson, 4 4 ‐‐ A Johnson, 4
21 ‐‐ A Johnson, 4 8 ‐‐ G Whittaker, 35 5 ‐‐ C Cook, 5
20 ‐‐ G Whittaker, 35 6 ‐‐ D Mathson, 23 5 ‐‐ M Piper, 15
15 ‐‐ A Johnson, 4: C
Cook, 5
11 ‐‐ A Johnson, 4 5 ‐‐ M Piper, 15
23 ‐‐ A Johnson, 4 7 ‐‐ G Whittaker, 35 2 ‐‐ A Johnson, 4: C Cook, 5: M
Piper, 15: J Barker, 31: G
16 ‐‐ A Johnson, 4 8 ‐‐ J Barker, 31 4 ‐‐ A Johnson, 4
19 ‐‐ A Johnson, 4 15 ‐‐ B Ehlers, 30 3 ‐‐ A Johnson, 4: M Piper, 15
20 ‐‐ A Johnson, 4: B
Ehlers, 30
9 ‐‐ B Ehlers, 30 2 ‐‐ A Johnson, 4: C Cook, 5: M
Piper, 15: B Ehlers, 30
14 ‐‐ B Ehlers, 30 5 ‐‐ G Whittaker, 35 4 ‐‐ A Johnson, 4: J Barker, 31
19 ‐‐ A Johnson, 4 8 ‐‐ B Ehlers, 30 5 ‐‐ A Johnson, 4
26 ‐‐ A Johnson, 4 11 ‐‐ B Ehlers, 30 5 ‐‐ M Piper, 15
20 ‐‐ A Johnson, 4 14 ‐‐ B Ehlers, 30 4 ‐‐ A Johnson, 4
14 ‐‐ A Johnson, 4 4 ‐‐ J Barker, 31 1 ‐‐ C Cook, 5
13 ‐‐ M Piper, 15 5 ‐‐ A Johnson, 4 3 ‐‐ C Cook, 5
13 ‐‐ G Whittaker, 35 6 ‐‐ B Ehlers, 30 3 ‐‐ A Johnson, 4
18 ‐‐ B Ehlers, 30 6 ‐‐ A Johnson, 4 7 ‐‐ A Johnson, 4
15 ‐‐ A Johnson, 4 6 ‐‐ A Johnson, 4: B
Ehlers, 30
1 ‐‐ A Johnson, 4: C Cook, 5: D
Mathson, 23
18 ‐‐ A Johnson, 4 8 ‐‐ G Whittaker, 35 4 ‐‐ G Whittaker, 35
13 ‐‐ B Ehlers, 30 4 ‐‐ A Johnson, 4: J
Barker, 31: G
2 ‐‐ A Johnson, 4
www.wyopreps.com
Home for High School StatsWyoming High School Basketball ‐ 4A BB2014 ‐ 2015 Season

4A BB West21 21 10
PLAYER,# GP 3FGM 3FGA 3FG % 2FGM 2FGA 2FG % FTM FTA FT % PTSOFF
REB
DEF
REBREB AST STL BLK TO'S FOUL
PTS /
GM
O REB
/GM
D REB
/GM
REB /
GM
AST /
GM
STL /
GM
BLK /
GM
TO'S /
GM
FOUL
/ GM
Kyle Goglio, 1 21 32 102 31% 25 69 36% 46 66 70% 192 12 40 52 22 14 2 87 66 9.1 0.6 1.9 2.5 1.0 0.7 0.1 4.1 3.1
Chase Erickson, 10 20 12 57 21% 22 64 34% 26 45 58% 106 10 52 62 32 28 80 35 5.3 0.5 2.6 3.1 1.6 1.4 4.0 1.8
Tanner Trumble, 11 21 4 16 25% 48 95 51% 104 139 75% 212 36 76 112 42 29 58 52 10.1 1.7 3.6 5.3 2.0 1.4 2.8 2.5
Alec Heitzman, 13 3 2 1 1 1 1 0.3 0.3 0.3
Trevor Zumwalt, 14 15 2 2 13 15% 1 2 50% 5 2 1 3 3 2 12 2 0.3 0.1 0.1 0.2 0.2 0.1 0.8 0.1
Kamden Carroll, 20 21 28 103 27% 16 62 26% 31 49 63% 147 11 44 55 20 18 5 91 63 7.0 0.5 2.1 2.6 1.0 0.9 0.2 4.3 3.0
Jayrn Johnson, 21 11 1 3 1 1 3 0.1 0.1 0.3
Andrew Munoz, 23 5 1 2 50% 3 0.6
Guillermo Chavez, 24 3 1 2 50% 1 0.3
Luke Ferrell, 35 21 12 27 44% 13 18 72% 37 18 34 52 10 4 3 30 38 1.8 0.9 1.6 2.5 0.5 0.2 0.1 1.4 1.8
Kody Leonard, 45 20 4 10 40% 9 13 69% 17 5 11 16 7 5 2 6 20 0.9 0.3 0.6 0.8 0.4 0.3 0.1 0.3 1.0
Hayden Love, 0 20 3 14 21% 53 114 46% 31 70 44% 146 27 86 113 17 20 9 39 66 7.3 1.4 4.3 5.7 0.9 1.0 0.5 2.0 3.3
Team Totals 21 80 297 27% 182 459 40% 262 405 65% 866 121 346 467 153 120 21 406 343 41.2 5.8 16.5 22.2 7.3 5.7 1.0 19.3 16.3
Opponent Totals 20 105 334 31% 379 717 53% 227 359 63% 1360 206 386 592 291 232 53 203 350 64.8 10.3 19.3 29.6 14.6 11.6 2.7 10.2 17.5
Peak Performances
Points
Lowest Opp Points
FG%
FT%
Rebounds
Assists
Steals
Blocked Shots
Most Opp TO's
Season Recap ** Indicates Conference Game
Opponent: Score 3FG 3FGA 3FG % 2FG 2FGA 2FG % FT FTA FT % FG % O REB D REB REB AST STL BLK TO'S FOUL
Star Valley: 12/12/14 5 20 25% 10 20 50% 7 10 70% 38% 7 14 21 9 4 1 24 20
42 ‐ 57 3 14 21% 17 33 52% 14 15 93% 43% 5 15 20 12 12 1 11 15
East: 12/20/14 1 11 9% 11 19 58% 21 26 81% 40% 4 21 25 13 5 1 17 21
46 ‐ 66 1 10 10% 22 43 51% 19 25 76% 43% 10 17 27 19 14 1 7 15
Gillette: 12/18/14 5 18 28% 15 42 36% 16 28 57% 33% 17 18 35 11 6 1 23 24
61 ‐ 99 12 29 41% 19 33 58% 25 29 86% 50% 10 18 28 15 11 3 13 22
North Summit UT: 12/19/14 3 17 18% 11 17 65% 5 15 33% 41% 6 15 21 14 2 1 16 17
36 ‐ 60
Star Valley: 1/2/15 6 15 40% 9 25 36% 4 10 40% 38% 5 17 22 9 3 16 11
40 ‐ 58 5 20 25% 19 37 51% 5 10 50% 42% 9 20 29 19 8 5 15
Green River Wolves Overall Record 0 ‐ 21 Conference Record 0 ‐ 10
Team Best Opponent Individual Best Player, # Opponent
61 Gillette 19 H Love, 0: K Goglio, 1 East: Gillette
51 Evanston
48% Evanston 78% H Love, 0 East
81% East 100% T Trumble, 11: K Goglio, 1 East: Rock Springs
35 Gillette 13 H Love, 0 Gillette
14 North Summit UT 7 C Erickson, 10 North Summit UT
11 Rock Springs 5 C Erickson, 10: T Trumble, 11 Rock Springs: Natrona
3 Riverton 2 K Carroll, 20: H Love, 0: K Goglio, 1: H Love, 0 South: Sheridan: Riverton: Riverton
POINTS REB AST
14 ‐‐ K Goglio, 1 8 ‐‐ C Erickson, 10 3 ‐‐ T Trumble, 11
17 Central
Defensive Stats PEAK PERFORMERS
11 ‐‐ K Goglio, 1: H
Love, 0
8 ‐‐ H Love, 0 7 ‐‐ C Erickson, 10
13 ‐‐ K Goglio, 1 6 ‐‐ C Erickson, 10: H
Love, 0
3 ‐‐ C Erickson, 10
19 ‐‐ H Love, 0 8 ‐‐ T Trumble, 11 5 ‐‐ C Erickson, 10
19 ‐‐ K Goglio, 1 13 ‐‐ H Love, 0 3 ‐‐ T Trumble, 11: H Love, 0
www.wyopreps.com
Home for High School StatsWyoming High School Basketball ‐ 4A BB2014 ‐ 2015 Season

South: 1/9/15 3 18 17% 9 20 45% 1 7 14% 32% 8 7 15 9 8 2 19 17
28 ‐ 67 6 15 40% 16 26 62% 17 22 77% 54% 6 22 28 9 13 1 16 11
Sheridan: 1/8/15 1 9 11% 7 16 44% 12 19 63% 32% 2 15 17 5 5 2 24 16
29 ‐ 63 8 25 32% 14 29 48% 11 21 52% 41% 16 19 35 17 15 1 10 20
Central: 1/10/15 4 13 31% 7 14 50% 20 27 74% 41% 5 14 19 6 8 1 17 21
46 ‐ 57 6 20 30% 13 21 62% 13 22 59% 46% 10 13 23 6 10 6 17 23
Laramie: 1/17/15 4 10 40% 7 19 37% 12 22 55% 38% 3 14 17 5 6 22 16
38 ‐ 74 6 18 33% 23 32 72% 10 16 63% 58% 13 20 33 10 14 10 16
South: 1/16/15 8 14 57% 7 19 37% 13 18 72% 45% 7 16 23 9 5 1 22 16
51 ‐ 67 7 16 44% 18 42 43% 10 15 67% 43% 16 14 30 11 18 1 8 16
Riverton: 1/24/15 ** 5 18 28% 8 28 29% 9 12 75% 28% 3 19 22 5 7 3 17 6
40 ‐ 68 7 15 47% 23 44 52% 1 6 17% 51% 6 28 34 20 16 8 10 11
Evanston: 1/22/15 ** 5 12 42% 8 21 38% 17 25 68% 39% 3 12 15 8 7 14 15
48 ‐ 75 4 15 27% 26 39 67% 11 17 65% 56% 9 20 29 23 5 10 22
Rock Springs: 1/29/15 ** 7 23 30% 3 26 12% 19 26 73% 20% 13 17 30 8 9 7 17
46 ‐ 56 4 16 25% 17 32 53% 10 18 56% 44% 9 22 31 7 3 5 9 21
Kelly Walsh: 2/7/15 ** 10 5 22 23% 10 19 53% 16% 9 15 24 2 1 19 13
20 ‐ 69 7 16 44% 18 39 46% 12 16 75% 45% 13 20 33 17 11 2 4 15
Natrona: 2/6/15 ** 4 11 36% 5 13 38% 14 20 70% 38% 1 26 27 5 2 1 29 19
36 ‐ 63 1 14 7% 25 50 50% 10 22 45% 41% 16 16 32 15 18 2 7 20
Riverton: 2/13/15 ** 2 10 20% 8 20 40% 13 18 72% 33% 3 15 18 3 7 2 21 8
35 ‐ 62 4 11 36% 21 41 51% 8 14 57% 48% 5 28 33 18 11 10 15 17
Evanston: 2/12/15 ** 2 11 18% 14 26 54% 10 14 71% 43% 3 22 25 9 5 1 23 23
44 ‐ 51 7 16 44% 10 36 28% 10 20 50% 33% 13 17 30 11 9 2 11 17
Rock Springs: 2/19/15 ** 4 17 24% 11 34 32% 19 27 70% 29% 14 17 31 8 11 1 14 17
53 ‐ 56 4 15 27% 19 35 54% 6 15 40% 46% 12 19 31 15 9 5 16 18
Kelly Walsh: 2/28/15 ** 3 12 25% 9 23 39% 17 22 77% 34% 3 16 19 4 4 18 16
44 ‐ 71 7 20 35% 19 33 58% 12 22 55% 49% 10 24 34 12 12 1 3 20
Natrona: 2/27/15 ** 3 12 25% 7 18 39% 15 27 56% 33% 2 21 23 4 8 2 24 18
38 ‐ 52 2 14 14% 18 35 51% 10 16 63% 41% 8 20 28 14 13 3 14 19
Evanston: 3/5/15 5 16 31% 11 17 65% 8 13 62% 48% 3 15 18 7 7 1 20 12
45 ‐ 69 4 15 27% 22 37 59% 13 18 72% 50% 10 14 24 21 10 1 7 17
15 ‐‐ K Goglio, 1: T
Trumble, 11
10 ‐‐ T Trumble, 11 2 ‐‐ C Erickson, 10: K Carroll,
20
16 ‐‐ K Goglio, 1 4 ‐‐ T Trumble, 11: H
Love, 0
2 ‐‐ C Erickson, 10
10 ‐‐ C Erickson, 10 8 ‐‐ T Trumble, 11 4 ‐‐ T Trumble, 11
9 ‐‐ K Carroll, 20 6 ‐‐ T Trumble, 11 2 ‐‐ C Erickson, 10
10 ‐‐ H Love, 0 5 ‐‐ T Trumble, 11 3 ‐‐ H Love, 0
15 ‐‐ T Trumble, 11 9 ‐‐ H Love, 0 2 ‐‐ K Goglio, 1: T Trumble, 11
13 ‐‐ K Goglio, 1: C
Erickson, 10
10 ‐‐ H Love, 0 3 ‐‐ T Trumble, 11
13 ‐‐ K Goglio, 1: K
Carroll, 20
8 ‐‐ H Love, 0 2 ‐‐ K Carroll, 20
12 ‐‐ T Trumble, 11 8 ‐‐ H Love, 0 1 ‐‐ C Erickson, 10: K Carroll,
20: L Ferrell, 35
14 ‐‐ T Trumble, 11 6 ‐‐ H Love, 0 3 ‐‐ T Trumble, 11
13 ‐‐ T Trumble, 11 7 ‐‐ L Ferrell, 35: H
Love, 0
2 ‐‐ L Ferrell, 35
13 ‐‐ K Carroll, 20 7 ‐‐ T Trumble, 11 4 ‐‐ T Trumble, 11
15 ‐‐ K Carroll, 20 6 ‐‐ K Goglio, 1 2 ‐‐ T Trumble, 11
12 ‐‐ K Carroll, 20 4 ‐‐ K Carroll, 20: H
Love, 0
3 ‐‐ T Trumble, 11
16 ‐‐ K Goglio, 1 8 ‐‐ T Trumble, 11 4 ‐‐ T Trumble, 11
11 ‐‐ K Goglio, 1: H
Love, 0
6 ‐‐ T Trumble, 11 2 ‐‐ T Trumble, 11
www.wyopreps.com
Home for High School StatsWyoming High School Basketball ‐ 4A BB2014 ‐ 2015 Season

State Third Place 4A BB West24 18 6 8 2
PLAYER,# GP 3FGM 3FGA 3FG % 2FGM 2FGA 2FG % FTM FTA FT % PTSOFF
REB
DEF
REBREB AST STL BLK TO'S FOUL
PTS /
GM
O REB
/GM
D REB
/GM
REB /
GM
AST /
GM
STL /
GM
BLK /
GM
TO'S /
GM
FOUL
/ GM
Cameron Carter, 2 20 4 15 27% 12 35 34% 4 8 50% 40 1 17 18 19 5 23 15 2.0 0.1 0.9 0.9 1.0 0.3 1.2 0.8
Drew Petrie, 3 24 34 101 34% 40 86 47% 59 84 70% 241 2 50 52 74 30 1 35 48 10.0 0.1 2.1 2.2 3.1 1.3 0.0 1.5 2.0
Marcus Nolan, 4 24 7 42 17% 84 162 52% 58 100 58% 247 36 99 135 57 24 15 37 68 10.3 1.5 4.1 5.6 2.4 1.0 0.6 1.5 2.8
Manny N'Tula, 5 22 3 5 60% 11 26 42% 14 19 74% 45 9 19 28 8 10 1 16 17 2.0 0.4 0.9 1.3 0.4 0.5 0.0 0.7 0.8
Jaxon Hiatt, 11 24 14 39 36% 17 39 44% 16 28 57% 92 18 53 71 22 15 7 21 30 3.8 0.8 2.2 3.0 0.9 0.6 0.3 0.9 1.3
Grant Murphy, 12 24 19 58 33% 3 8 38% 5 6 83% 68 2 21 23 20 12 1 17 31 2.8 0.1 0.9 1.0 0.8 0.5 0.0 0.7 1.3
Tanner Hilderbrand, 13 24 36 101 36% 13 26 50% 15 22 68% 149 24 38 62 16 13 2 20 35 6.2 1.0 1.6 2.6 0.7 0.5 0.1 0.8 1.5
Ethan Applegate, 15 24 3 6 50% 69 147 47% 51 92 55% 198 74 108 182 27 23 4 32 68 8.3 3.1 4.5 7.6 1.1 1.0 0.2 1.3 2.8
Marcus Hoversland, 23 24 2 7 29% 44 88 50% 19 28 68% 113 32 54 86 16 4 26 13 42 4.7 1.3 2.3 3.6 0.7 0.2 1.1 0.5 1.8
Cam Mcdaniel, 24 24 4 24 17% 45 70 64% 20 37 54% 122 45 39 84 29 21 2 20 53 5.1 1.9 1.6 3.5 1.2 0.9 0.1 0.8 2.2
Sam Marsh, 20 11 2 10 20% 7 13 54% 5 9 56% 25 4 9 13 2 1 14 2.3 0.4 0.8 1.2 0.2 0.1 1.3
Joel Strube, 32 8 2 5 40% 2 4 3 4 7 4 0.5 0.4 0.5 0.9 0.5
Team Totals 24 128 408 31% 347 705 49% 266 435 61% 1344 250 511 761 290 158 59 234 425 56.0 10.4 21.3 31.7 12.1 6.6 2.5 9.8 17.7
Opponent Totals 20 64 272 24% 207 537 39% 248 366 68% 1043 136 315 451 146 107 24 237 325 43.4 6.8 15.8 22.6 7.3 5.4 1.2 11.9 16.3
Peak Performances
Points
Lowest Opp Points
FG%
FT%
Rebounds
Assists
Steals
Blocked Shots
Most Opp TO's
Season Recap ** Indicates Conference Game
Opponent: Score 3FG 3FGA 3FG % 2FG 2FGA 2FG % FT FTA FT % FG % O REB D REB REB AST STL BLK TO'S FOUL
South: 12/11/14 7 21 33% 16 26 62% 7 14 50% 49% 13 22 35 11 6 4 8 16
60 ‐ 31 3 10 30% 9 33 27% 4 7 57% 28% 3 12 15 7 6 10 17
Sheridan: 12/12/14 7 15 47% 15 30 50% 11 19 58% 49% 10 23 33 17 1 5 7 12
62 ‐ 43 7 15 47% 5 29 17% 12 17 71% 27% 7 11 18 8 3 2 7 20
Laramie: 12/13/14 8 15 53% 12 22 55% 9 19 47% 54% 5 20 25 17 5 2 11 16
57 ‐ 29 3 20 15% 8 18 44% 4 10 40% 29% 9 14 23 6 6 19 11
Billings West: 12/19/14 9 22 41% 12 30 40% 8 12 67% 40% 8 19 27 12 10 3 18 17
59 ‐ 64
Billings Skyview: 12/20/14 7 17 41% 14 30 47% 13 22 59% 45% 8 26 34 14 4 5 14 23
62 ‐ 53
Kelly Walsh Trojans Overall Record 18 ‐ 6 Conference Record 8 ‐ 2
Team Best Opponent Individual Best Player, # Opponent
73 Riverton 23 E Applegate, 15 Riverton
20 Green River
57% Natrona 73% E Applegate, 15 Riverton
86% Central 75% D Petrie, 3: D Petrie, 3 Billings Skyview: Evanston
52 Gering NE 13 M Nolan, 4 Gering NE
17 Sheridan: Laramie: Green River 7 D Petrie, 3 Rock Springs
14 Rock Springs 5 C Mcdaniel, 24 Gering NE
5 Sheridan: Billings Skyview: Gering NE 4 M Hoversland, 23: M Hoversland, 23 South: Sheridan
POINTS REB AST
13 ‐‐ M Hoversland,
23
7 ‐‐ E Applegate, 15 5 ‐‐ C Carter, 2
21 Rock Springs
Defensive Stats PEAK PERFORMERS
14 ‐‐ M Nolan, 4 8 ‐‐ E Applegate, 15 4 ‐‐ M Nolan, 4
20 ‐‐ D Petrie, 3 8 ‐‐ M Nolan, 4: E
Applegate, 15
6 ‐‐ M Nolan, 4
10 ‐‐ T Hilderbrand,
13: E Applegate, 15
8 ‐‐ E Applegate, 15 4 ‐‐ M Nolan, 4
13 ‐‐ J Hiatt, 11 6 ‐‐ M Nolan, 4 5 ‐‐ D Petrie, 3
www.wyopreps.com
Home for High School StatsWyoming High School Basketball ‐ 4A BB2014 ‐ 2015 Season

Central: 1/8/15 3 8 38% 14 26 54% 18 21 86% 50% 8 14 22 13 6 2 12 18
55 ‐ 42 4 12 33% 8 20 40% 16 21 76% 38% 7 11 18 7 6 3 15 14
East: 1/9/15 4 19 21% 13 21 62% 6 17 35% 43% 10 16 26 13 4 3 8 19
44 ‐ 59 2 5 40% 19 40 48% 15 19 79% 47% 4 17 21 15 7 6 18
Sheridan: 1/10/15 1 9 11% 16 35 46% 7 15 47% 39% 8 28 36 12 8 1 17 16
42 ‐ 30 2 19 11% 5 35 14% 14 19 74% 13% 18 20 38 3 12 6 18 13
Gering NE: 1/17/15 6 15 40% 18 42 43% 16 21 76% 42% 15 37 52 12 11 5 18 14
70 ‐ 40
Natrona: 1/22/15 ** 5 24 21% 8 26 31% 10 17 59% 26% 8 17 25 9 5 2 10 28
41 ‐ 50 1 6 17% 10 25 40% 27 39 69% 35% 9 26 35 5 4 2 11 21
Riverton: 1/30/15 ** 5 19 26% 21 37 57% 15 25 60% 46% 15 22 37 14 6 2 9 21
72 ‐ 61 6 19 32% 10 26 38% 23 26 88% 36% 7 15 22 14 6 1 7 19
Evanston: 1/31/15 ** 4 13 31% 10 23 43% 16 25 64% 39% 9 16 25 7 6 2 9 19
48 ‐ 52 4 12 33% 12 27 44% 16 18 89% 41% 4 14 18 9 3 1 8 19
Rock Springs: 2/6/15 ** 6 20 30% 12 36 33% 12 22 55% 32% 22 14 36 13 14 1 8 12
54 ‐ 33 1 9 11% 10 16 63% 10 16 63% 44% 4 16 20 6 4 1 21 14
Green River: 2/7/15 ** 7 16 44% 18 39 46% 12 16 75% 45% 13 20 33 17 11 2 4 15
69 ‐ 20 10 5 22 23% 10 19 53% 16% 9 15 24 2 1 19 13
Natrona: 2/12/15 ** 7 14 50% 9 14 64% 10 14 71% 57% 4 16 20 12 7 2 17 16
49 ‐ 31 1 12 8% 11 29 38% 6 11 55% 29% 12 9 21 5 10 3 19 16
Evanston: 2/20/15 ** 5 19 26% 16 29 55% 5 12 42% 44% 10 20 30 11 7 1 9 15
52 ‐ 30 11 10 28 36% 10 16 63% 26% 5 16 21 1 5 13 13
Riverton: 2/21/15 ** 3 11 27% 14 27 52% 8 14 57% 45% 9 20 29 12 5 3 8 6
45 ‐ 43 4 19 21% 13 26 50% 5 5 100% 38% 7 14 21 12 7 1 7 13
Rock Springs: 2/27/15 ** 7 20 35% 14 27 52% 2 6 33% 45% 7 21 28 16 9 4 9 17
51 ‐ 32
Green River: 2/28/15 ** 7 20 35% 19 33 58% 12 22 55% 49% 10 24 34 12 12 1 3 20
71 ‐ 44 3 12 25% 9 23 39% 17 22 77% 34% 3 16 19 4 4 18 16
Riverton: 3/6/15 5 21 24% 14 27 52% 6 11 55% 40% 10 17 27 10 2 2 7 14
49 ‐ 61 6 14 43% 18 32 56% 6 9 67% 52% 3 19 22 13 5 2 6 10
Evanston: 3/7/15 5 20 25% 16 29 55% 15 19 79% 43% 16 26 42 10 4 1 9 23
62 ‐ 39 4 15 27% 6 25 24% 15 25 60% 25% 6 11 17 9 6 1 5 19
Sheridan: 3/12/15 4 12 33% 14 33 42% 18 30 60% 40% 10 34 44 9 3 4 7 26
58 ‐ 41 5 27 19% 5 22 23% 16 25 64% 20% 6 20 26 2 2 7 26
Natrona: 3/13/15 2 18 11% 13 26 50% 7 13 54% 34% 10 21 31 6 5 7 22
39 ‐ 46 3 8 38% 14 29 48% 9 26 35% 46% 9 18 27 7 6 7 13
Riverton: 3/14/15 4 20 20% 19 37 51% 23 29 79% 40% 12 18 30 11 7 2 5 20
73 ‐ 68 OT 5 17 29% 20 32 63% 13 16 81% 51% 4 21 25 11 4 1 14 20
11 ‐‐ M Nolan, 4 11 ‐‐ E Applegate, 15 5 ‐‐ D Petrie, 3
18 ‐‐ M Nolan, 4 13 ‐‐ M Nolan, 4 3 ‐‐ D Petrie, 3
18 ‐‐ E Applegate, 15 8 ‐‐ E Applegate, 15 4 ‐‐ D Petrie, 3: M Nolan, 4
12 ‐‐ M Nolan, 4 6 ‐‐ E Applegate, 15 4 ‐‐ C Carter, 2
14 ‐‐ D Petrie, 3 6 ‐‐ E Applegate, 15 2 ‐‐ D Petrie, 3: E Applegate,
15
11 ‐‐ E Applegate, 15 11 ‐‐ E Applegate, 15 7 ‐‐ D Petrie, 3
11 ‐‐ T Hilderbrand, 13 7 ‐‐ C Mcdaniel, 24 3 ‐‐ C Carter, 2: D Petrie, 3
23 ‐‐ E Applegate, 15 12 ‐‐ E Applegate, 15 6 ‐‐ D Petrie, 3
15 ‐‐ M Nolan, 4 7 ‐‐ E Applegate, 15:
M Hoversland, 23
3 ‐‐ M Nolan, 4
13 ‐‐ M Nolan, 4 11 ‐‐ M Nolan, 4 3 ‐‐ D Petrie, 3
15 ‐‐ E Applegate, 15 10 ‐‐ E Applegate, 15 5 ‐‐ D Petrie, 3: G Murphy, 12
16 ‐‐ T Hilderbrand, 13 5 ‐‐ E Applegate, 15 6 ‐‐ D Petrie, 3
16 ‐‐ E Applegate, 15 12 ‐‐ E Applegate, 15 3 ‐‐ D Petrie, 3: M Nolan, 4
17 ‐‐ D Petrie, 3 10 ‐‐ E Applegate, 15 3 ‐‐ J Hiatt, 11
14 ‐‐ E Applegate, 15 9 ‐‐ E Applegate, 15 5 ‐‐ M Nolan, 4
12 ‐‐ D Petrie, 3 7 ‐‐ M Nolan, 4 3 ‐‐ C Carter, 2: D Petrie, 3
21 ‐‐ D Petrie, 3 7 ‐‐ C Mcdaniel, 24 4 ‐‐ M Nolan, 4
14 ‐‐ D Petrie, 3 10 ‐‐ M Nolan, 4 3 ‐‐ C Mcdaniel, 24
11 ‐‐ M Nolan, 4 8 ‐‐ E Applegate, 15 1 ‐‐ D Petrie, 3: G Murphy, 12:
T Hilderbrand, 13: E
www.wyopreps.com
Home for High School StatsWyoming High School Basketball ‐ 4A BB2014 ‐ 2015 Season

State Champion 4A BB West25 16 9 7 3
PLAYER,# GP 3FGM 3FGA 3FG % 2FGM 2FGA 2FG % FTM FTA FT % PTSOFF
REB
DEF
REBREB AST STL BLK TO'S FOUL
PTS /
GM
O REB
/GM
D REB
/GM
REB /
GM
AST /
GM
STL /
GM
BLK /
GM
TO'S /
GM
FOUL
/ GM
Josh Harshman, 2 25 37 122 30% 42 89 47% 39 58 67% 234 40 62 102 47 21 8 41 88 9.4 1.6 2.5 4.1 1.9 0.8 0.3 1.6 3.5
Parker Browning, 3 25 26 115 23% 58 132 44% 60 81 74% 254 28 47 75 49 32 6 67 48 10.2 1.1 1.9 3.0 2.0 1.3 0.2 2.7 1.9
Logan Wilson, 5 23 1 41 68 60% 6 26 23% 88 30 56 86 27 42 3 14 53 3.8 1.3 2.4 3.7 1.2 1.8 0.1 0.6 2.3
Layne O'Neal, 10 25 7 30 23% 21 47 45% 13 23 57% 76 18 43 61 26 20 1 18 40 3.0 0.7 1.7 2.4 1.0 0.8 0.0 0.7 1.6
Kaleb Spiva, 11 7 1 1 2 1 0.1 0.1 0.3 0.1
Casson Burgen, 12 22 8 6 17 35% 5 12 14 11 25 11 12 6 6 12 0.5 0.6 0.5 1.1 0.5 0.5 0.3 0.3 0.5
Parker Franzen, 14 21 16 33 48% 10 23 43% 42 18 29 47 2 5 9 40 2.0 0.9 1.4 2.2 0.1 0.2 0.4 1.9
Brentyn Shaffer, 20 23 4 21 19% 4 14 29% 8 14 57% 28 2 10 12 9 6 1 13 21 1.2 0.1 0.4 0.5 0.4 0.3 0.0 0.6 0.9
Drew Switzer, 21 1 1 1.0
Stevann Brown, 22 25 22 51 43% 38 122 31% 54 83 65% 196 19 30 49 55 35 6 54 42 7.8 0.8 1.2 2.0 2.2 1.4 0.2 2.2 1.7
Logan Harbaugh, 25 8 2 3 4 75% 6 6 6 1 0.8 0.8 0.8 0.1
Caleb Hett, 30 5 4 2 2 1 1 1 0.4 0.4 0.2 0.2 0.2
Austin Luers, 32 24 1 24 4% 32 70 46% 36 50 72% 103 4 18 22 34 19 2 30 47 4.3 0.2 0.8 0.9 1.4 0.8 0.1 1.3 2.0
Hunter Kuhn, 33 5 2 1 1 0.2
Peter Bergman, 55 23 107 184 58% 54 86 63% 268 89 123 212 25 9 31 36 72 11.7 3.9 5.3 9.2 1.1 0.4 1.3 1.6 3.1
Team Totals 25 97 376 26% 368 781 47% 280 453 62% 1307 263 437 700 289 202 64 290 465 52.3 10.5 17.5 28.0 11.6 8.1 2.6 11.6 18.6
Opponent Totals 25 137 385 36% 267 605 44% 285 445 64% 1230 166 469 635 269 146 54 379 454 49.2 6.6 18.8 25.4 10.8 5.8 2.2 15.2 18.2
Peak Performances
Points
Lowest Opp Points
FG%
FT%
Rebounds
Assists
Steals
Blocked Shots
Most Opp TO's
Season Recap ** Indicates Conference Game
Opponent: Score 3FG 3FGA 3FG % 2FG 2FGA 2FG % FT FTA FT % FG % O REB D REB REB AST STL BLK TO'S FOUL
Gillette: 12/11/14 2 17 12% 12 26 46% 6 17 35% 33% 7 16 23 8 3 2 21 17
36 ‐ 78 15 33 45% 12 25 48% 9 15 60% 47% 13 31 44 23 10 2 9 18
Rapid City Central SD: 12/12/14 6 18 33% 13 37 35% 6 9 67% 35% 13 14 27 9 8 5 12 11
50 ‐ 49 3 9 33% 17 36 47% 6 6 100% 44% 7 23 30 16 3 8 22 16
Central: 12/13/14 6 14 43% 11 29 38% 17 21 81% 40% 9 18 27 12 9 4 11 19
57 ‐ 45 9 27 33% 4 18 22% 10 16 63% 29% 14 15 29 7 6 2 16 23
Billings Skyview MT: 12/19/14 4 19 21% 14 26 54% 11 19 58% 40% 10 14 24 10 8 1 12 26
51 ‐ 58 6 12 50% 10 26 38% 20 30 67% 42% 9 20 29 9 6 4 16 19
Billings West MT: 12/20/14 4 23 17% 11 27 41% 21 34 62% 30% 10 16 26 9 10 1 11 31
55 ‐ 66 4 13 31% 15 25 60% 24 42 57% 50% 10 27 37 16 8 2 19 28
Natrona Mustangs Overall Record 16 ‐ 9 Conference Record 7 ‐ 3
Team Best Opponent Individual Best Player, # Opponent
66 South: Evanston 23 P Browning, 3 Rapid City Central SD
35 Riverton
57% East 80% P Bergman, 55 Green River
85% South: Evanston 90% S Brown, 22 Kelly Walsh
43 Riverton 16 P Bergman, 55 Riverton
19 Riverton 8 S Brown, 22 Green River
18 Green River 5 L Wilson, 5 Rock Springs
7 Rock Springs 5 P Bergman, 55 Rock Springs
POINTS REB AST
10 ‐‐ P Browning, 3 4 ‐‐ P Browning, 3 3 ‐‐ P Browning, 3
30 Green River
Defensive Stats PEAK PERFORMERS
20 ‐‐ P Browning, 3 5 ‐‐ P Browning, 3: P
Bergman, 55
3 ‐‐ S Brown, 22
11 ‐‐ P Browning, 3: S
Brown, 22
6 ‐‐ L Wilson, 5 4 ‐‐ A Luers, 32
23 ‐‐ P Browning, 3 6 ‐‐ P Browning, 3: P
Franzen, 14
2 ‐‐ C Burgen, 12: A Luers, 32
13 ‐‐ S Brown, 22 9 ‐‐ P Bergman, 55 3 ‐‐ A Luers, 32
www.wyopreps.com
Home for High School StatsWyoming High School Basketball ‐ 4A BB2014 ‐ 2015 Season

Rapid City Central SD: 1/2/15 5 15 33% 16 37 43% 15 21 71% 40% 7 19 26 14 12 3 15 19
62 ‐ 63 OT 8 19 42% 13 29 45% 13 21 62% 44% 9 26 35 20 7 1 23 18
South: 1/8/15 7 16 44% 17 31 55% 11 13 85% 51% 9 21 30 17 7 15 24
66 ‐ 50 3 14 21% 11 27 41% 19 28 68% 34% 7 13 20 8 11 1 17 15
East: 1/10/15 5 12 42% 16 25 64% 4 10 40% 57% 7 10 17 17 9 3 14 17
51 ‐ 50 4 10 40% 18 34 53% 2 3 67% 50% 8 14 22 12 8 13 13
Windsor CO: 1/9/15 4 19 21% 16 33 48% 8 15 53% 38% 13 25 38 15 4 4 12 26
52 ‐ 58 7 21 33% 9 25 36% 19 30 63% 35% 10 22 32 9 3 2 9 16
Sheridan: 1/17/15 5 25 20% 10 17 59% 10 16 63% 36% 10 11 21 10 5 3 16 21
45 ‐ 57 9 16 56% 10 22 45% 10 20 50% 50% 11 19 30 16 7 1 17 19
Kelly Walsh: 1/22/15 ** 1 6 17% 10 25 40% 27 39 69% 35% 9 26 35 5 4 2 11 21
50 ‐ 41 5 24 21% 8 26 31% 10 17 59% 26% 8 17 25 9 5 2 10 28
Riverton: 1/31/15 ** 5 15 33% 17 36 47% 8 12 67% 43% 10 21 31 18 12 4 8 14
57 ‐ 35 3 12 25% 10 25 40% 6 6 100% 35% 2 16 18 10 8 4 15 12
Evanston: 1/30/15 ** 5 18 28% 20 32 63% 11 13 85% 50% 12 10 22 15 8 2 10 10
66 ‐ 48 6 14 43% 10 18 56% 10 12 83% 50% 2 13 15 15 5 2 21 13
Green River: 2/6/15 ** 1 14 7% 25 50 50% 10 22 45% 41% 16 16 32 15 18 2 7 20
63 ‐ 36 4 11 36% 5 14 36% 14 20 70% 36% 1 26 27 6 1 2 30 19
Rock Springs: 2/7/15 ** 4 13 31% 19 44 43% 8 10 80% 40% 14 18 32 16 16 7 10 6
58 ‐ 39 4 14 29% 12 27 44% 3 4 75% 39% 5 22 27 10 6 2 21 10
Kelly Walsh: 2/12/15 ** 1 12 8% 11 29 38% 6 11 55% 29% 12 9 21 5 10 3 19 16
31 ‐ 49 7 14 50% 9 14 64% 10 14 71% 57% 4 16 20 12 7 2 17 16
Evanston: 2/21/15 ** 5 16 31% 12 30 40% 8 17 47% 37% 8 15 23 11 7 5 6 24
47 ‐ 55 5 11 45% 12 22 55% 16 25 64% 52% 4 20 24 12 3 1 10 18
Riverton: 2/20/15 ** 8 26 31% 14 35 40% 3 6 50% 36% 15 19 34 19 7 2 10 20
55 ‐ 62 OT 10 16 63% 8 23 35% 16 19 84% 46% 2 18 20 13 5 3 9 10
Green River: 2/27/15 ** 2 14 14% 18 35 51% 10 16 63% 41% 8 20 28 14 13 3 14 19
52 ‐ 38 3 12 25% 7 18 39% 15 27 56% 33% 2 21 23 4 8 2 24 18
Rock Springs: 2/28/15 ** 3 12 25% 14 39 36% 13 22 59% 33% 13 19 32 12 9 5 5 20
50 ‐ 41 2 8 25% 10 29 34% 15 22 68% 32% 9 19 28 8 2 6 14 19
Evanston: 3/6/15 2 6 33% 17 28 61% 16 26 62% 56% 7 25 32 10 6 2 15 20
56 ‐ 42 3 11 27% 11 34 32% 11 21 52% 31% 9 14 23 3 8 12 23
Riverton: 3/7/15 3 15 20% 16 33 48% 19 25 76% 40% 19 24 43 11 1 1 9 20
60 ‐ 45 4 18 22% 10 19 53% 13 19 68% 38% 2 14 16 14 6 3 6 24
Central: 3/12/15 4 12 33% 10 16 63% 14 17 82% 50% 6 10 16 4 3 7 12
46 ‐ 43 6 11 55% 12 17 71% 1 4 25% 64% 1 8 9 6 5 2 10 15
Kelly Walsh: 3/13/15 3 8 38% 14 29 48% 9 26 35% 46% 9 18 27 7 6 7 13
46 ‐ 39 2 18 11% 13 26 50% 7 13 54% 34% 10 21 31 6 5 7 22
Gillette: 3/14/15 2 11 18% 15 32 47% 9 16 56% 40% 10 23 33 6 7 13 19
46 ‐ 43 5 17 29% 11 26 42% 6 11 55% 37% 7 14 21 5 3 12 22
16 ‐‐ J Harshman, 2 9 ‐‐ P Bergman, 55 4 ‐‐ S Brown, 22: A Luers, 32
15 ‐‐ P Bergman, 55 10 ‐‐ P Bergman, 55 7 ‐‐ P Browning, 3
16 ‐‐ J Harshman, 2 14 ‐‐ P Bergman, 55 7 ‐‐ P Browning, 3
15 ‐‐ S Brown, 22 6 ‐‐ P Browning, 3: L
Wilson, 5: P Bergman,
4 ‐‐ J Harshman, 2
13 ‐‐ P Bergman, 55 7 ‐‐ J Harshman, 2: P
Bergman, 55
4 ‐‐ P Browning, 3: S Brown,
22
21 ‐‐ P Bergman, 55 9 ‐‐ P Bergman, 55 3 ‐‐ J Harshman, 2: L O'Neal,
10
19 ‐‐ J Harshman, 2 11 ‐‐ P Bergman, 55 2 ‐‐ J Harshman, 2: L Wilson, 5
16 ‐‐ S Brown, 22 10 ‐‐ J Harshman, 2 2 ‐‐ J Harshman, 2
7 ‐‐ P Browning, 3: P
Bergman, 55
5 ‐‐ P Bergman, 55 2 ‐‐ S Brown, 22
17 ‐‐ J Harshman, 2 10 ‐‐ P Bergman, 55 3 ‐‐ L Wilson, 5: A Luers, 32
17 ‐‐ P Bergman, 55 10 ‐‐ P Bergman, 55 8 ‐‐ S Brown, 22
15 ‐‐ P Browning, 3 8 ‐‐ P Bergman, 55 4 ‐‐ J Harshman, 2
14 ‐‐ P Bergman, 55 14 ‐‐ P Bergman, 55 5 ‐‐ P Browning, 3
14 ‐‐ J Harshman, 2 13 ‐‐ P Bergman, 55 3 ‐‐ S Brown, 22: P Bergman,
55
16 ‐‐ P Browning, 3 13 ‐‐ P Bergman, 55 6 ‐‐ L Wilson, 5
15 ‐‐ J Harshman, 2 6 ‐‐ J Harshman, 2: P
Bergman, 55
4 ‐‐ J Harshman, 2
17 ‐‐ J Harshman, 2 7 ‐‐ L Wilson, 5 4 ‐‐ L Wilson, 5
17 ‐‐ P Bergman, 55 11 ‐‐ P Bergman, 55 2 ‐‐ J Harshman, 2: S Brown,
22: A Luers, 32
14 ‐‐ P Bergman, 55 16 ‐‐ P Bergman, 55 4 ‐‐ J Harshman, 2
13 ‐‐ P Bergman, 55 7 ‐‐ P Bergman, 55 1 ‐‐ J Harshman, 2: P
Browning, 3: L Wilson, 5: P
www.wyopreps.com
Home for High School StatsWyoming High School Basketball ‐ 4A BB2014 ‐ 2015 Season

West Regional 2nd Place 4A BB West27 14 13 6 4
PLAYER,# GP 3FGM 3FGA 3FG % 2FGM 2FGA 2FG % FTM FTA FT % PTSOFF
REB
DEF
REBREB AST STL BLK TO'S FOUL
PTS /
GM
O REB
/GM
D REB
/GM
REB /
GM
AST /
GM
STL /
GM
BLK /
GM
TO'S /
GM
FOUL
/ GM
Alec Richardson, 1 3 1 1 100% 2 1 1 1 2 1 1 0.7 0.3 0.3 0.3 0.7 0.3 0.3
Braxton Lajeunesse, 3 21 1 12 19 63% 1 24 1 3 4 8 7 6 17 1.1 0.0 0.1 0.2 0.4 0.3 0.3 0.8
Brandon Fullerton, 10 27 31 95 33% 133 242 55% 87 113 77% 446 41 123 164 83 73 17 48 46 16.5 1.5 4.6 6.1 3.1 2.7 0.6 1.8 1.7
Andre Goodman, 11
Easton Paxton, 12 27 46 105 44% 34 72 47% 13 20 65% 219 5 39 44 39 20 31 53 8.1 0.2 1.4 1.6 1.4 0.7 1.1 2.0
Chris Quayle, 13 27 31 105 30% 86 150 57% 84 119 71% 349 34 131 165 138 72 16 54 65 12.9 1.3 4.9 6.1 5.1 2.7 0.6 2.0 2.4
Keeton Zancanella, 14 27 3 12 25% 3 11 27% 5 9 56% 20 2 21 23 16 11 1 23 25 0.7 0.1 0.8 0.9 0.6 0.4 0.0 0.9 0.9
Austyn Sellers, 20 17 6 12 50% 1 4 25% 13 3 6 9 1 3 7 0.8 0.2 0.4 0.5 0.1 0.2 0.4
Niko Garcia, 21 5 2 8 25% 4 1 1 1 3 0.8 0.2 0.2 0.2 0.6
Brady Fullerton, 23 27 21 63 33% 39 72 54% 14 30 47% 155 11 57 68 88 36 11 41 43 5.7 0.4 2.1 2.5 3.3 1.3 0.4 1.5 1.6
Teron Doebele, 31 9 3 13 22 59% 7 10 70% 33 1 4 5 2 3 14 3.7 0.1 0.4 0.6 0.2 0.3 1.6
Kylan Shultz, 32 4 1 1 1 1 1 0.3 0.3 0.3 0.3
Koleton Lone Bear, 33 23 11 30 37% 10 25 40% 6 9 67% 59 3 18 21 13 10 2 18 28 2.6 0.1 0.8 0.9 0.6 0.4 0.1 0.8 1.2
Jordan Yowell, 34 18 56 111 50% 33 52 63% 145 31 53 84 6 2 16 19 50 8.1 1.7 2.9 4.7 0.3 0.1 0.9 1.1 2.8
Josiah Whiteplume, 35
Winston Tollefsen, 40 7 3 4 75% 6 1 4 5 2 5 0.9 0.1 0.6 0.7 0.3 0.7
Caleb Richmond, 41 27 39 76 51% 8 18 44% 86 27 38 65 32 14 3 33 67 3.2 1.0 1.4 2.4 1.2 0.5 0.1 1.2 2.5
Aaron Ryan, 43 11 9 14 64% 3 6 50% 21 4 7 11 1 3 7 1.9 0.4 0.6 1.0 0.1 0.3 0.6
Team Totals 27 143 414 35% 446 840 53% 261 391 67% 1582 165 506 671 426 249 66 287 432 58.6 6.1 18.7 24.9 15.8 9.2 2.4 10.6 16.0
Opponent Totals 25 118 388 30% 362 810 45% 281 424 66% 1434 234 476 710 256 174 37 341 359 53.1 9.4 19.0 28.4 10.2 7.0 1.5 13.6 14.4
Peak Performances
Points
Lowest Opp Points
FG%
FT%
Rebounds
Assists
Steals
Blocked Shots
Most Opp TO's
Season Recap ** Indicates Conference Game
Opponent: Score 3FG 3FGA 3FG % 2FG 2FGA 2FG % FT FTA FT % FG % O REB D REB REB AST STL BLK TO'S FOUL
Sheridan: 12/11/14 5 16 31% 15 25 60% 11 17 65% 49% 4 19 23 15 9 2 12 14
56 ‐ 62 6 17 35% 18 33 55% 8 13 62% 48% 8 19 27 9 10 4 13 13
Laramie: 12/12/14 4 14 29% 16 27 59% 10 21 48% 49% 8 15 23 15 11 14 21
54 ‐ 60 5 21 24% 15 30 50% 15 22 68% 39% 9 21 30 12 10 20 18
South: 12/13/14 9 17 53% 13 23 57% 10 12 83% 55% 6 28 34 19 4 1 14 17
63 ‐ 42 3 14 21% 10 38 26% 13 23 57% 25% 14 11 25 6 12 1 10 16
Star Valley: 12/18/14 4 18 22% 17 21 81% 7 11 64% 54% 3 17 20 15 13 8 14
53 ‐ 47 7 12 58% 11 28 39% 4 7 57% 45% 6 17 23 12 7 17 13
Lyman: 12/19/14 14 24 58% 16 37 43% 4 8 50% 49% 6 24 30 21 15 6 9 18
78 ‐ 47 4 14 29% 12 38 32% 10 14 71% 31% 9 19 28 5 5 15
Riverton Wolverines Overall Record 14 ‐ 13 Conference Record 6 ‐ 4
Team Best Opponent Individual Best Player, # Opponent
92 Kemmerer 27 B Fullerton, 10: B Fullerton, 10 Lander Valley: Kelly Walsh
16 Kemmerer
67% Kemmerer 92% B Fullerton, 10 Green River
88% Kelly Walsh 93% B Fullerton, 10 Kelly Walsh
38 Rock Springs 12 J Yowell, 34 Rock Springs
33 Kemmerer 10 C Quayle, 13 Rock Springs
25 Kemmerer 6 B Fullerton, 10: B Fullerton, 10: C Quayle, 13: B Fullerton, 10 Lyman: Kemmerer: Rock Springs: Green River
10 Green River 3 llerton, 23: B Fullerton, 10: C Quayle, 13: B Fullerton, 10: J Yowell, 34: C Richmond, 41: C QuayLyman: Jackson: Green River: Green River: Eas
POINTS REB AST
13 ‐‐ E Paxton, 12 8 ‐‐ B Fullerton, 10 7 ‐‐ B Fullerton, 23
25 Lander Valley
Defensive Stats PEAK PERFORMERS
26 ‐‐ B Fullerton, 10 9 ‐‐ C Quayle, 13 8 ‐‐ C Quayle, 13
22 ‐‐ E Paxton, 12 8 ‐‐ C Quayle, 13 6 ‐‐ B Fullerton, 10: B
Fullerton, 23
21 ‐‐ B Fullerton, 10 8 ‐‐ C Quayle, 13 4 ‐‐ B Fullerton, 10: C Quayle,
13
19 ‐‐ B Fullerton, 10 9 ‐‐ C Quayle, 13 5 ‐‐ C Quayle, 13
www.wyopreps.com
Home for High School StatsWyoming High School Basketball ‐ 4A BB2014 ‐ 2015 Season

Kemmerer: 12/20/14 4 8 50% 35 50 70% 10 19 53% 67% 10 18 28 33 25 4 10
92 ‐ 16
South: 1/10/15 3 17 18% 21 33 64% 14 17 82% 48% 7 11 18 15 7 1 9 21
65 ‐ 73 4 10 40% 21 34 62% 19 21 90% 57% 8 23 31 9 6 17 16
East: 1/8/15 4 15 27% 15 28 54% 12 20 60% 44% 7 17 24 13 8 1 9 17
54 ‐ 58 2 6 33% 19 42 45% 14 20 70% 44% 7 18 25 13 10 1 12 16
Laramie: 1/9/15 2 10 20% 10 32 31% 12 18 67% 29% 8 17 25 11 9 12 13
38 ‐ 50 2 8 25% 19 33 58% 6 11 55% 51% 6 16 22 11 6 12
Lander Valley: 1/16/15 3 15 20% 19 37 51% 16 25 64% 42% 7 21 28 16 13 3 5 20
63 ‐ 55 3 16 19% 17 39 44% 12 27 44% 36% 20 26 46 16 4 3 25 19
Rock Springs: 1/23/15 ** 4 11 36% 22 36 61% 13 19 68% 55% 12 26 38 18 16 2 25 17
69 ‐ 56 7 23 30% 12 30 40% 11 20 55% 36% 5 15 20 7 7 1 14 18
Green River: 1/24/15 ** 7 15 47% 23 44 52% 1 6 17% 51% 6 28 34 20 16 8 10 11
68 ‐ 40 5 18 28% 8 28 29% 9 12 75% 28% 3 19 22 5 7 3 17 6
Kelly Walsh: 1/30/15 ** 6 19 32% 10 26 38% 23 26 88% 36% 7 15 22 14 6 1 7 19
61 ‐ 72 5 19 26% 21 37 57% 15 25 60% 46% 15 22 37 14 6 2 9 21
Natrona: 1/31/15 ** 3 12 25% 10 25 40% 6 6 100% 35% 2 16 18 10 8 4 15 12
35 ‐ 57 5 15 33% 17 36 47% 8 12 67% 43% 10 21 31 18 12 4 8 14
Evanston: 2/5/15 ** 7 13 54% 17 30 57% 7 11 64% 56% 6 24 30 18 8 2 12 20
62 ‐ 44 3 16 19% 13 33 39% 9 12 75% 33% 8 14 22 9 10 13 15
Jackson: 2/7/15 5 14 36% 19 42 45% 7 8 88% 43% 7 21 28 16 5 5 12 16
60 ‐ 64 10 19 53% 12 36 33% 10 15 67% 40% 9 25 34 19 7 2 14 12
Green River: 2/13/15 ** 4 11 36% 21 41 51% 8 14 57% 48% 5 28 33 18 11 10 15 17
62 ‐ 35 2 10 20% 8 20 40% 13 18 72% 33% 3 15 18 3 7 2 21 8
Rock Springs: 2/14/15 ** 6 20 30% 17 35 49% 5 7 71% 42% 11 12 23 12 9 1 6 18
57 ‐ 55 OT 7 13 54% 9 23 39% 16 23 70% 44% 8 20 28 2 3 17 15
Kelly Walsh: 2/21/15 ** 4 19 21% 13 26 50% 5 5 100% 38% 7 14 21 12 7 1 7 13
43 ‐ 45 3 11 27% 14 27 52% 8 14 57% 45% 9 20 29 12 5 3 8 6
Natrona: 2/20/15 ** 10 16 63% 8 24 33% 16 19 84% 45% 3 16 19 16 4 1 8 10
62 ‐ 55 OT 8 26 31% 14 35 40% 3 6 50% 36% 15 19 34 19 7 2 10 20
Evanston: 2/26/15 ** 4 12 33% 12 27 44% 5 12 42% 41% 5 13 18 11 1 4 10 15
41 ‐ 56 5 10 50% 14 29 48% 13 16 81% 49% 6 20 26 17 7 1 16 16
Rock Springs: 3/5/15 9 19 47% 14 22 64% 7 8 88% 56% 4 11 15 21 9 3 14 12
62 ‐ 59
Kelly Walsh: 3/6/15 6 14 43% 18 32 56% 7 10 70% 52% 3 19 22 13 5 2 6 10
61 ‐ 49 5 21 24% 14 27 52% 6 11 55% 40% 10 17 27 10 2 2 7 14
Natrona: 3/7/15 4 18 22% 10 19 53% 13 20 65% 38% 2 14 16 14 6 3 6 24
45 ‐ 60 3 15 20% 16 33 48% 19 25 76% 40% 19 24 43 11 1 1 9 20
East: 3/12/15 3 13 23% 20 35 57% 5 15 33% 48% 4 23 27 18 11 3 11 15
54 ‐ 47 5 19 26% 12 35 34% 8 12 67% 31% 10 23 33 2 10 3 16 20
Gillette: 3/13/15 4 17 24% 15 31 48% 14 21 67% 40% 11 18 29 11 9 1 13 18
56 ‐ 58 5 15 33% 17 29 59% 9 16 56% 50% 5 14 19 4 6 16 23
Kelly Walsh: 3/14/15 5 17 29% 20 32 63% 13 16 81% 51% 4 21 25 11 4 1 14 20
68 ‐ 73 OT 4 20 20% 19 37 51% 23 29 79% 40% 12 18 30 11 7 2 5 20
17 ‐‐ C Quayle, 13 6 ‐‐ B Fullerton, 10: C
Quayle, 13
5 ‐‐ C Quayle, 13
12 ‐‐ C Quayle, 13 5 ‐‐ B Fullerton, 10: C
Quayle, 13
3 ‐‐ C Quayle, 13: B Fullerton,
23
18 ‐‐ B Fullerton, 10 6 ‐‐ C Quayle, 13 8 ‐‐ E Paxton, 12: C Quayle, 13
24 ‐‐ C Quayle, 13 6 ‐‐ C Quayle, 13 7 ‐‐ B Fullerton, 23
24 ‐‐ B Fullerton, 10 8 ‐‐ C Quayle, 13 6 ‐‐ C Quayle, 13
27 ‐‐ B Fullerton, 10 11 ‐‐ B Fullerton, 10 6 ‐‐ C Quayle, 13
27 ‐‐ B Fullerton, 10 9 ‐‐ C Quayle, 13 5 ‐‐ B Fullerton, 10: C Quayle,
13
20 ‐‐ B Fullerton, 10 12 ‐‐ J Yowell, 34 8 ‐‐ C Quayle, 13
26 ‐‐ B Fullerton, 10 8 ‐‐ B Fullerton, 10 6 ‐‐ B Fullerton, 23
13 ‐‐ B Fullerton, 10 9 ‐‐ B Fullerton, 10 5 ‐‐ C Quayle, 13
8 ‐‐ E Paxton, 12 5 ‐‐ B Fullerton, 10: C
Quayle, 13
4 ‐‐ C Quayle, 13
19 ‐‐ B Fullerton, 10 10 ‐‐ B Fullerton, 10 9 ‐‐ C Quayle, 13
22 ‐‐ B Fullerton, 10 7 ‐‐ C Quayle, 13 5 ‐‐ B Fullerton, 10
12 ‐‐ E Paxton, 12 7 ‐‐ C Quayle, 13 4 ‐‐ C Quayle, 13
23 ‐‐ C Quayle, 13 6 ‐‐ B Fullerton, 10 3 ‐‐ B Fullerton, 10: C Quayle,
13
15 ‐‐ C Quayle, 13 8 ‐‐ C Quayle, 13 5 ‐‐ C Quayle, 13
11 ‐‐ B Fullerton, 10 6 ‐‐ B Fullerton, 10 4 ‐‐ C Quayle, 13: B Fullerton,
23
12 ‐‐ B Fullerton, 10: E
Paxton, 12
7 ‐‐ B Fullerton, 10: J
Yowell, 34
5 ‐‐ B Fullerton, 23
21 ‐‐ B Fullerton, 10 7 ‐‐ J Yowell, 34 10 ‐‐ C Quayle, 13
22 ‐‐ C Quayle, 13 6 ‐‐ B Fullerton, 10 4 ‐‐ B Fullerton, 10: C Quayle,
13
21 ‐‐ B Fullerton, 10 10 ‐‐ J Yowell, 34 4 ‐‐ B Fullerton, 10: C Quayle,
13
24 ‐‐ C Quayle, 13 7 ‐‐ C Quayle, 13 6 ‐‐ C Quayle, 13
www.wyopreps.com
Home for High School StatsWyoming High School Basketball ‐ 4A BB2014 ‐ 2015 Season
4A BB West22 5 17 3 7
PLAYER,# GP 3FGM 3FGA 3FG % 2FGM 2FGA 2FG % FTM FTA FT % PTSOFF
REB
DEF
REBREB AST STL BLK TO'S FOUL
PTS /
GM
O REB
/GM
D REB
/GM
REB /
GM
AST /
GM
STL /
GM
BLK /
GM
TO'S /
GM
FOUL
/ GM
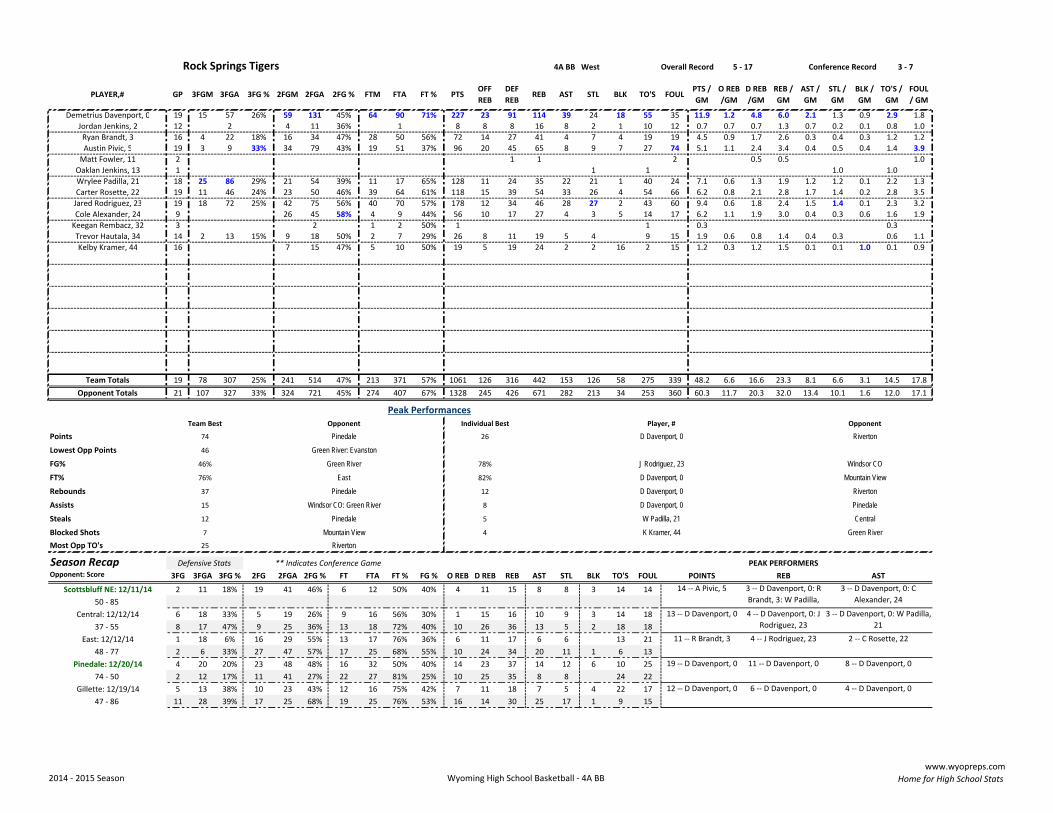
Demetrius Davenport, 0 19 15 57 26% 59 131 45% 64 90 71% 227 23 91 114 39 24 18 55 35 11.9 1.2 4.8 6.0 2.1 1.3 0.9 2.9 1.8
Jordan Jenkins, 2 12 2 4 11 36% 1 8 8 8 16 8 2 1 10 12 0.7 0.7 0.7 1.3 0.7 0.2 0.1 0.8 1.0
Ryan Brandt, 3 16 4 22 18% 16 34 47% 28 50 56% 72 14 27 41 4 7 4 19 19 4.5 0.9 1.7 2.6 0.3 0.4 0.3 1.2 1.2
Austin Pivic, 5 19 3 9 33% 34 79 43% 19 51 37% 96 20 45 65 8 9 7 27 74 5.1 1.1 2.4 3.4 0.4 0.5 0.4 1.4 3.9
Matt Fowler, 11 2 1 1 2 0.5 0.5 1.0
Oaklan Jenkins, 13 1 1 1 1.0 1.0
Wrylee Padilla, 21 18 25 86 29% 21 54 39% 11 17 65% 128 11 24 35 22 21 1 40 24 7.1 0.6 1.3 1.9 1.2 1.2 0.1 2.2 1.3
Carter Rosette, 22 19 11 46 24% 23 50 46% 39 64 61% 118 15 39 54 33 26 4 54 66 6.2 0.8 2.1 2.8 1.7 1.4 0.2 2.8 3.5
Jared Rodriguez, 23 19 18 72 25% 42 75 56% 40 70 57% 178 12 34 46 28 27 2 43 60 9.4 0.6 1.8 2.4 1.5 1.4 0.1 2.3 3.2
Cole Alexander, 24 9 26 45 58% 4 9 44% 56 10 17 27 4 3 5 14 17 6.2 1.1 1.9 3.0 0.4 0.3 0.6 1.6 1.9
Keegan Rembacz, 32 3 2 1 2 50% 1 1 0.3 0.3
Trevor Hautala, 34 14 2 13 15% 9 18 50% 2 7 29% 26 8 11 19 5 4 9 15 1.9 0.6 0.8 1.4 0.4 0.3 0.6 1.1
Kelby Kramer, 44 16 7 15 47% 5 10 50% 19 5 19 24 2 2 16 2 15 1.2 0.3 1.2 1.5 0.1 0.1 1.0 0.1 0.9
Team Totals 19 78 307 25% 241 514 47% 213 371 57% 1061 126 316 442 153 126 58 275 339 48.2 6.6 16.6 23.3 8.1 6.6 3.1 14.5 17.8
Opponent Totals 21 107 327 33% 324 721 45% 274 407 67% 1328 245 426 671 282 213 34 253 360 60.3 11.7 20.3 32.0 13.4 10.1 1.6 12.0 17.1
Peak Performances
Points
Lowest Opp Points
FG%
FT%
Rebounds
Assists
Steals
Blocked Shots
Most Opp TO's
Season Recap ** Indicates Conference Game
Opponent: Score 3FG 3FGA 3FG % 2FG 2FGA 2FG % FT FTA FT % FG % O REB D REB REB AST STL BLK TO'S FOUL
Scottsbluff NE: 12/11/14 2 11 18% 19 41 46% 6 12 50% 40% 4 11 15 8 8 3 14 14
50 ‐ 85
Central: 12/12/14 6 18 33% 5 19 26% 9 16 56% 30% 1 15 16 10 9 3 14 18
37 ‐ 55 8 17 47% 9 25 36% 13 18 72% 40% 10 26 36 13 5 2 18 18
East: 12/12/14 1 18 6% 16 29 55% 13 17 76% 36% 6 11 17 6 6 13 21
48 ‐ 77 2 6 33% 27 47 57% 17 25 68% 55% 10 24 34 20 11 1 6 13
Pinedale: 12/20/14 4 20 20% 23 48 48% 16 32 50% 40% 14 23 37 14 12 6 10 25
74 ‐ 50 2 12 17% 11 41 27% 22 27 81% 25% 10 25 35 8 8 24 22
Gillette: 12/19/14 5 13 38% 10 23 43% 12 16 75% 42% 7 11 18 7 5 4 22 17
47 ‐ 86 11 28 39% 17 25 68% 19 25 76% 53% 16 14 30 25 17 1 9 15
Rock Springs Tigers Overall Record 5 ‐ 17 Conference Record 3 ‐ 7
Team Best Opponent Individual Best Player, # Opponent
74 Pinedale 26 D Davenport, 0 Riverton
46 Green River: Evanston
46% Green River 78% J Rodriguez, 23 Windsor CO
76% East 82% D Davenport, 0 Mountain View
37 Pinedale 12 D Davenport, 0 Riverton
15 Windsor CO: Green River 8 D Davenport, 0 Pinedale
12 Pinedale 5 W Padilla, 21 Central
7 Mountain View 4 K Kramer, 44 Green River
POINTS REB AST
14 ‐‐ A Pivic, 5 3 ‐‐ D Davenport, 0: R
Brandt, 3: W Padilla,
3 ‐‐ D Davenport, 0: C
Alexander, 24
25 Riverton
Defensive Stats PEAK PERFORMERS
19 ‐‐ D Davenport, 0 11 ‐‐ D Davenport, 0 8 ‐‐ D Davenport, 0
12 ‐‐ D Davenport, 0 6 ‐‐ D Davenport, 0 4 ‐‐ D Davenport, 0
13 ‐‐ D Davenport, 0 4 ‐‐ D Davenport, 0: J
Rodriguez, 23
3 ‐‐ D Davenport, 0: W Padilla,
21
11 ‐‐ R Brandt, 3 4 ‐‐ J Rodriguez, 23 2 ‐‐ C Rosette, 22
www.wyopreps.com
Home for High School StatsWyoming High School Basketball ‐ 4A BB2014 ‐ 2015 Season

Mountain View: 12/18/14 6 22 27% 13 27 48% 20 39 51% 39% 12 19 31 9 10 7 18 22
64 ‐ 55 2 9 22% 18 45 40% 13 26 50% 37% 13 21 34 7 12 21 29
Sheridan: 1/9/15 2 21 10% 10 24 42% 14 26 54% 27% 5 22 27 8 7 4 17 22
40 ‐ 69 5 15 33% 18 44 41% 18 27 67% 39% 17 31 48 8 11 2 13 23
Laramie: 1/8/15 2 12 17% 7 26 27% 15 26 58% 24% 8 19 27 3 6 4 18 17
35 ‐ 66 5 17 29% 19 40 48% 13 20 65% 42% 18 23 41 14 13 9 21
Windsor CO: 1/10/15 6 17 35% 16 31 52% 11 24 46% 46% 9 16 25 15 9 3 7 20
61 ‐ 74 6 16 38% 17 28 61% 22 24 92% 52% 9 22 31 14 3 1 13 15
Laramie: 1/16/15 3 13 23% 10 18 56% 14 22 64% 42% 14 14 5 4 2 15 16
43 ‐ 59 7 22 32% 16 31 52% 6 10 60% 43% 10 15 25 10 10 10 22
South: 1/17/15 4 17 24% 13 26 50% 10 14 71% 40% 4 13 17 7 10 5 13 17
48 ‐ 54 4 13 31% 15 33 45% 12 16 75% 41% 4 25 29 14 9 16 16
Riverton: 1/23/15 ** 7 23 30% 12 30 40% 11 20 55% 36% 5 15 20 7 7 1 14 18
56 ‐ 69 4 11 36% 22 36 61% 13 19 68% 55% 12 26 38 18 16 2 25 17
Evanston: 1/24/15 ** 6 18 33% 6 17 35% 8 11 73% 34% 3 12 15 10 2 2 7 16
38 ‐ 51 2 5 40% 17 33 52% 11 16 69% 50% 7 20 27 16 7 1 6 12
Green River: 1/29/15 ** 4 16 25% 17 32 53% 10 18 56% 44% 9 22 31 7 3 5 9 21
56 ‐ 46 7 23 30% 3 26 12% 19 26 73% 20% 13 17 30 8 9 7 17
Kelly Walsh: 2/6/15 ** 1 9 11% 10 16 63% 10 16 63% 44% 4 16 20 6 4 1 21 14
33 ‐ 54 6 20 30% 12 36 33% 12 22 55% 32% 22 14 36 13 14 1 8 12
Natrona: 2/7/15 ** 4 12 33% 12 25 48% 3 4 75% 43% 5 17 22 5 6 1 20 10
39 ‐ 58 4 13 31% 19 44 43% 8 10 80% 40% 14 18 32 16 16 7 10 6
Evanston: 2/13/15 ** 4 19 21% 14 24 58% 9 20 45% 42% 10 21 31 9 6 2 10 18
49 ‐ 46 3 12 25% 14 30 47% 9 25 36% 40% 11 25 36 9 5 2 10 18
Riverton: 2/14/15 ** 7 13 54% 9 23 39% 16 23 70% 44% 8 20 28 2 3 17 15
55 ‐ 57 OT 6 20 30% 17 35 49% 5 7 71% 42% 11 12 23 12 9 1 6 18
Green River: 2/19/15 ** 4 15 27% 19 35 54% 6 15 40% 46% 12 19 31 15 9 5 16 18
56 ‐ 53 4 17 24% 11 34 32% 19 27 70% 29% 14 17 31 8 11 1 14 17
Kelly Walsh: 2/27/15 **
32 ‐ 51 7 20 35% 14 27 52% 2 6 33% 45% 7 21 28 16 9 4 9 17
Natrona: 2/28/15 **
41 ‐ 50 3 12 25% 14 39 36% 13 22 59% 33% 13 19 32 12 9 5 5 20
Riverton: 3/5/15
59 ‐ 62 9 19 47% 14 22 64% 8 9 89% 56% 4 11 15 21 9 3 14 12
10 ‐‐ C Rosette, 22 6 ‐‐ D Davenport, 0 1 ‐‐ J Jenkins, 2: R Brandt, 3: J
Rodriguez, 23
17 ‐‐ J Rodriguez, 23 8 ‐‐ D Davenport, 0 4 ‐‐ C Rosette, 22
17 ‐‐ D Davenport, 0 11 ‐‐ A Pivic, 5 3 ‐‐ C Rosette, 22
12 ‐‐ J Rodriguez, 23 5 ‐‐ D Davenport, 0: A
Pivic, 5: C Rosette, 22
2 ‐‐ D Davenport, 0: W Padilla,
21: C Rosette, 22
13 ‐‐ C Rosette, 22 6 ‐‐ W Padilla, 21 2 ‐‐ A Pivic, 5: W Padilla, 21
10 ‐‐ W Padilla, 21 5 ‐‐ A Pivic, 5 3 ‐‐ D Davenport, 0: W Padilla,
21
8 ‐‐ D Davenport, 0 7 ‐‐ D Davenport, 0 2 ‐‐ W Padilla, 21: C Rosette,
22
22 ‐‐ J Rodriguez, 23 6 ‐‐ D Davenport, 0 3 ‐‐ D Davenport, 0
17 ‐‐ D Davenport, 0 6 ‐‐ D Davenport, 0 2 ‐‐ C Rosette, 22
19 ‐‐ D Davenport, 0 8 ‐‐ D Davenport, 0: C
Alexander, 24
3 ‐‐ C Rosette, 22
16 ‐‐ D Davenport, 0 6 ‐‐ D Davenport, 0: A
Pivic, 5: C Alexander,
4 ‐‐ J Rodriguez, 23
8 ‐‐ C Alexander, 24 8 ‐‐ D Davenport, 0 3 ‐‐ C Rosette, 22
‐‐ ‐‐ ‐‐
‐‐ ‐‐ ‐‐
26 ‐‐ D Davenport, 0 12 ‐‐ D Davenport, 0 1 ‐‐ A Pivic, 5: J Rodriguez, 23
17 ‐‐ W Padilla, 21 10 ‐‐ D Davenport, 0 6 ‐‐ J Rodriguez, 23
‐‐ ‐‐ ‐‐
www.wyopreps.com
Home for High School StatsWyoming High School Basketball ‐ 4A BB2014 ‐ 2015 Season

State Fourth Place 4A BB East27 13 14 5 5
PLAYER,# GP 3FGM 3FGA 3FG % 2FGM 2FGA 2FG % FTM FTA FT % PTSOFF
REB
DEF
REBREB AST STL BLK TO'S FOUL
PTS /
GM
O REB
/GM
D REB
/GM
REB /
GM
AST /
GM
STL /
GM
BLK /
GM
TO'S /
GM
FOUL
/ GM
Dontel Ybarra, 1 27 21 53 40% 37 73 51% 24 37 65% 161 22 50 72 34 35 7 76 62 6.0 0.8 1.9 2.7 1.3 1.3 0.3 2.8 2.3
Nicholas Fraley, 2 27 41 114 36% 61 128 48% 52 72 72% 297 30 87 117 25 21 12 36 44 11.0 1.1 3.2 4.3 0.9 0.8 0.4 1.3 1.6
Bryce Francois, 4 26 15 49 31% 20 35 57% 12 19 63% 97 13 33 46 24 28 15 39 54 3.7 0.5 1.3 1.8 0.9 1.1 0.6 1.5 2.1
Jason Teixeira, 11 27 18 36 73 49% 48 69 70% 120 17 38 55 35 14 3 69 75 4.4 0.6 1.4 2.0 1.3 0.5 0.1 2.6 2.8
Dominic Sanchez, 14 11 1 8 13% 2 2 100% 4 3 2 5 1 2 5 4 0.4 0.3 0.2 0.5 0.1 0.2 0.5 0.4
Skye Soffe, 21 12 1 2 50% 1 3 33% 3 2 1 3 3 3 1 2 8 0.3 0.2 0.1 0.3 0.3 0.3 0.1 0.2 0.7
Brock Anderson, 22 25 9 41 22% 65 143 45% 38 61 62% 195 28 89 117 41 32 8 66 54 7.8 1.1 3.6 4.7 1.6 1.3 0.3 2.6 2.2
Grayson Voycheske, 23 4 1 2 1 3 1 3 1 0.5 0.3 0.8 0.3 0.8 0.3
Jessen Reckling, 24 27 2 38 81 47% 24 39 62% 100 16 48 64 11 5 7 23 33 3.7 0.6 1.8 2.4 0.4 0.2 0.3 0.9 1.2
Jackson Ayala, 25 27 7 22 32% 43 86 50% 17 42 40% 124 23 46 69 19 16 3 38 78 4.6 0.9 1.7 2.6 0.7 0.6 0.1 1.4 2.9
Grant Storebo, 33 27 30 73 41% 29 49 59% 58 73 79% 206 22 57 79 18 18 12 32 48 7.6 0.8 2.1 2.9 0.7 0.7 0.4 1.2 1.8
Niko Bostic, 3 1 1 2 2 100% 2 1 1 2.0 1.0 1.0
Jon Scott, 55 9 1 3 1 2 50% 1 3 3 1 3 1 3 0.1 0.3 0.3 0.1 0.3 0.1 0.3
Willie Jones, 30 8 1 1 3 33% 1 2 3 3 2 3 2 0.3 0.4 0.4 0.3 0.4 0.3
Team Totals 27 123 376 33% 332 684 49% 279 422 66% 1312 179 458 637 213 174 73 393 466 48.6 6.6 17.0 23.6 7.9 6.4 2.7 14.6 17.3
Opponent Totals 27 159 478 33% 257 645 40% 312 458 68% 1303 227 445 672 168 167 33 336 456 48.3 8.4 16.5 24.9 6.2 6.2 1.2 12.4 16.9
Peak Performances
Points
Lowest Opp Points
FG%
FT%
Rebounds
Assists
Steals
Blocked Shots
Most Opp TO's
Season Recap ** Indicates Conference Game
Opponent: Score 3FG 3FGA 3FG % 2FG 2FGA 2FG % FT FTA FT % FG % O REB D REB REB AST STL BLK TO'S FOUL
Bismark Century ND: 12/11/14 6 18 33% 12 19 63% 8 9 89% 49% 6 12 18 13 7 17 18
50 ‐ 61 9 17 53% 12 24 50% 10 14 71% 51% 9 11 20 4 3 1 14 14
Rock Springs: 12/12/14 8 17 47% 9 25 36% 13 18 72% 40% 10 26 36 13 5 2 18 18
55 ‐ 37 5 13 38% 6 24 25% 10 16 63% 30% 8 14 22 1 2 1 18 19
Natrona: 12/13/14 9 27 33% 4 18 22% 10 16 63% 29% 14 15 29 7 6 2 16 23
45 ‐ 57 6 12 50% 11 30 37% 17 21 81% 40% 11 21 32 8 2 2 14 23
Frederick CO: 12/18/14 5 14 36% 14 29 48% 10 14 71% 44% 8 19 27 11 15 15 18
53 ‐ 41 8 20 40% 8 19 42% 1 6 17% 41% 2 19 21 5 1 16 16
Greeley Central CO: 12/19/14 2 9 22% 19 31 61% 4 10 40% 53% 9 18 27 9 10 1 12 17
48 ‐ 28 4 13 31% 3 17 18% 10 13 77% 23% 4 13 17 2 4 17 14
Central Indians Overall Record 13 ‐ 14 Conference Record 5 ‐ 5
Team Best Opponent Individual Best Player, # Opponent
75 South 27 N Fraley, 2 South
28 Greeley Central CO
64% Natrona 88% B Anderson, 22 Sheridan
89% Bismark Century ND 100% G Storebo, 33: G Storebo, 33 Sheridan: South
36 Rock Springs 10 B Anderson, 22: N Fraley, 2 Bismark Century ND: Sheridan
13 Bismark Century ND: Rock Springs 5 J Teixeira, 11 Rock Springs
15 Frederick CO 5 D Ybarra, 1 Gillette
7 Sheridan: Evanston 4 B Francois, 4 Green River
POINTS REB AST
15 ‐‐ D Ybarra, 1 10 ‐‐ B Anderson, 22 3 ‐‐ D Ybarra, 1
20 South
Defensive Stats PEAK PERFORMERS
15 ‐‐ B Anderson, 22 8 ‐‐ N Fraley, 2 4 ‐‐ D Ybarra, 1
12 ‐‐ B Anderson, 22 6 ‐‐ B Anderson, 22 4 ‐‐ J Teixeira, 11
10 ‐‐ D Ybarra, 1: N
Fraley, 2
8 ‐‐ J Ayala, 25 5 ‐‐ J Teixeira, 11
12 ‐‐ B Francois, 4 5 ‐‐ D Ybarra, 1: B
Francois, 4: B
2 ‐‐ N Fraley, 2
www.wyopreps.com
Home for High School StatsWyoming High School Basketball ‐ 4A BB2014 ‐ 2015 Season

Greeley Northridge CO: 12/20/14 5 20 25% 13 28 46% 6 9 67% 38% 10 10 20 8 5 3 15 18
47 ‐ 51 7 21 33% 10 19 53% 10 15 67% 43% 9 17 26 1 6 15 16
Thompson Valley: 1/3/15 4 13 31% 15 26 58% 13 17 76% 49% 3 14 17 8 5 3 12 21
55 ‐ 54 7 15 47% 11 26 42% 11 20 55% 44% 6 11 17 6 3 2 15 19
Kelly Walsh: 1/8/15 4 12 33% 8 20 40% 16 21 76% 38% 7 11 18 7 6 3 15 14
42 ‐ 55 3 8 38% 14 26 54% 18 21 86% 50% 8 14 22 13 6 2 12 18
Evanston: 1/9/15 3 20 15% 13 25 52% 6 8 75% 36% 5 15 20 4 8 2 11 19
41 ‐ 47 5 11 45% 9 27 33% 14 19 74% 37% 9 22 31 4 2 1 13 13
Green River: 1/10/15 6 20 30% 13 21 62% 13 22 59% 46% 10 13 23 6 10 6 17 23
57 ‐ 46 4 15 27% 7 18 39% 20 27 74% 33% 10 16 26 2 4 19 21
Scottsbluff NE: 1/19/15 5 22 23% 8 29 28% 4 6 67% 25% 6 14 20 7 5 3 8 18
35 ‐ 50 3 14 21% 12 21 57% 17 23 74% 43% 4 30 34 8 3 4 12 11
East: 1/23/15 ** 3 8 38% 13 33 39% 13 27 48% 39% 9 21 30 10 7 5 14 22
48 ‐ 38 2 22 9% 7 32 22% 18 23 78% 17% 11 18 29 5 9 2 14 22
Gillette: 1/31/15 ** 4 9 44% 14 25 56% 15 22 68% 53% 4 22 26 11 9 1 12 15
55 ‐ 50 11 35 31% 6 18 33% 5 11 45% 32% 15 13 28 7 5 2 13 19
Sheridan: 1/30/15 ** 7 11 64% 16 27 59% 1 4 25% 61% 1 13 14 9 5 3 16 12
54 ‐ 57 8 20 40% 13 23 57% 7 10 70% 49% 8 15 23 11 12 1 10 14
Laramie: 2/5/15 ** 3 16 19% 13 27 48% 19 24 79% 37% 6 23 29 11 8 20 27
54 ‐ 61 2OT 5 20 25% 10 28 36% 26 38 68% 31% 13 14 27 4 11 13 21
South: 2/6/15 ** 4 13 31% 16 30 53% 8 16 50% 47% 10 20 30 11 8 2 15 12
52 ‐ 31 7 16 44% 3 18 17% 4 6 67% 29% 5 12 17 7 9 2 20 18
Sheridan: 2/14/15 ** 2 8 25% 9 25 36% 24 32 75% 33% 10 19 29 2 7 1 12 10
48 ‐ 42 11 38 29% 3 19 16% 3 4 75% 25% 19 16 35 9 6 9 22
Gillette: 2/13/15 ** 5 12 42% 13 24 54% 4 10 40% 50% 8 10 18 5 10 19 12
45 ‐ 63 11 21 52% 12 18 67% 6 11 55% 59% 5 18 23 14 12 1 13 14
East: 2/20/15 ** 3 12 25% 14 29 48% 2 13 15% 41% 4 27 31 8 4 6 22 19
39 ‐ 41 OT 5 17 29% 9 35 26% 8 18 44% 27% 4 19 23 10 16 2 7 10
South: 2/27/15 ** 11 22 50% 11 13 85% 20 24 83% 63% 6 12 18 11 3 2 14 20
75 ‐ 79 10 18 56% 14 21 67% 21 30 70% 62% 4 12 16 12 9 1 11 18
Laramie: 2/27/15 ** 4 12 33% 10 19 53% 12 19 63% 45% 2 24 26 7 4 4 14 17
44 ‐ 41 6 13 46% 9 26 35% 5 13 38% 38% 5 20 25 7 7 8 18
Laramie: 3/5/15 1 6 17% 14 27 52% 19 27 70% 45% 2 18 20 9 2 4 13 17
50 ‐ 47 2 8 25% 15 28 54% 11 18 61% 47% 10 18 28 3 3 2 9 22
Sheridan: 3/6/15 2 14 14% 16 35 46% 3 5 60% 37% 11 22 33 7 7 3 17 17
43 ‐ 46 6 23 26% 9 27 33% 10 13 77% 30% 12 19 31 4 7 8 15
East: 3/7/15 5 13 38% 10 26 38% 4 6 67% 38% 6 14 20 6 4 1 16 15
39 ‐ 53 2 14 14% 14 31 45% 19 23 83% 36% 5 16 21 10 12 5 8 11
Natrona: 3/12/15 6 11 55% 12 17 71% 1 4 25% 64% 1 8 9 6 5 2 10 15
43 ‐ 46 4 12 33% 10 16 63% 14 17 82% 50% 5 12 17 4 3 7 12
Sheridan: 3/13/15 4 16 35 46% 19 25 76% 41% 3 22 25 4 4 7 7 16
51 ‐ 50 6 25 24% 10 29 34% 12 22 55% 30% 16 22 38 5 4 2 8 20
Evanston: 3/14/15 6 13 46% 7 21 33% 12 14 86% 38% 8 16 24 3 5 7 16 13
44 ‐ 31 2 17 12% 10 25 40% 5 6 83% 29% 10 13 23 2 6 13 16
12 ‐‐ G Storebo, 33 5 ‐‐ N Fraley, 2 2 ‐‐ B Francois, 4
12 ‐‐ N Fraley, 2 6 ‐‐ D Ybarra, 1 2 ‐‐ D Ybarra, 1
11 ‐‐ B Anderson, 22 6 ‐‐ B Anderson, 22 2 ‐‐ D Ybarra, 1: B Francois, 4:
B Anderson, 22
11 ‐‐ N Fraley, 2: B
Anderson, 22
6 ‐‐ B Anderson, 22 4 ‐‐ J Teixeira, 11
11 ‐‐ N Fraley, 2: J
Ayala, 25
8 ‐‐ N Fraley, 2: B
Anderson, 22
3 ‐‐ B Anderson, 22
17 ‐‐ B Anderson, 22 7 ‐‐ B Anderson, 22 4 ‐‐ B Anderson, 22
18 ‐‐ G Storebo, 33 5 ‐‐ J Reckling, 24 1 ‐‐ D Ybarra, 1: B Francois, 4:
D Sanchez, 14: S Soffe, 21: B
10 ‐‐ D Ybarra, 1 5 ‐‐ B Anderson, 22 2 ‐‐ B Francois, 4: B Anderson,
22: G Storebo, 33
19 ‐‐ N Fraley, 2 6 ‐‐ N Fraley, 2: B
Anderson, 22
4 ‐‐ B Anderson, 22
19 ‐‐ G Storebo, 33 7 ‐‐ G Storebo, 33 1 ‐‐ D Ybarra, 1: J Ayala, 25
16 ‐‐ B Anderson, 22 5 ‐‐ G Storebo, 33 2 ‐‐ N Fraley, 2: J Teixeira, 11:
B Anderson, 22
17 ‐‐ N Fraley, 2 8 ‐‐ B Anderson, 22 3 ‐‐ N Fraley, 2
27 ‐‐ N Fraley, 2 4 ‐‐ N Fraley, 2 4 ‐‐ J Teixeira, 11
11 ‐‐ N Fraley, 2: G
Storebo, 33
7 ‐‐ N Fraley, 2 3 ‐‐ J Teixeira, 11
16 ‐‐ D Ybarra, 1 4 ‐‐ G Storebo, 33 1 ‐‐ D Ybarra, 1: N Fraley, 2: B
Francois, 4: B Anderson, 22: J
12 ‐‐ D Ybarra, 1 6 ‐‐ D Ybarra, 1: N
Fraley, 2
4 ‐‐ J Ayala, 25
10 ‐‐ N Fraley, 2: G
Storebo, 33
6 ‐‐ J Reckling, 24 2 ‐‐ J Reckling, 24
15 ‐‐ G Storebo, 33 3 ‐‐ N Fraley, 2 2 ‐‐ J Teixeira, 11
12 ‐‐ N Fraley, 2 4 ‐‐ J Teixeira, 11 3 ‐‐ G Storebo, 33
14 ‐‐ G Storebo, 33 10 ‐‐ N Fraley, 2 2 ‐‐ B Francois, 4
14 ‐‐ N Fraley, 2 6 ‐‐ B Anderson, 22: J
Ayala, 25
2 ‐‐ B Anderson, 22
10 ‐‐ N Fraley, 2: J
Ayala, 25
6 ‐‐ N Fraley, 2 1 ‐‐ N Fraley, 2: J Reckling, 24:
J Ayala, 25
www.wyopreps.com
Home for High School StatsWyoming High School Basketball ‐ 4A BB2014 ‐ 2015 Season

East Regional 3rd Place 4A BB East25 15 10 5 5
PLAYER,# GP 3FGM 3FGA 3FG % 2FGM 2FGA 2FG % FTM FTA FT % PTSOFF
REB
DEF
REBREB AST STL BLK TO'S FOUL
PTS /
GM
O REB
/GM
D REB
/GM
REB /
GM
AST /
GM
STL /
GM
BLK /
GM
TO'S /
GM
FOUL
/ GM
Trevahn Jackson, 1 6 4 2 2 100% 2 2 100% 6 1 1 2 1 1 2 1.0 0.2 0.2 0.3 0.2 0.2 0.3
Zach Mccord, 2 25 25 86 29% 124 286 43% 110 150 73% 433 24 56 80 78 44 1 47 45 17.3 1.0 2.2 3.2 3.1 1.8 0.0 1.9 1.8
Trey Lesley, 3 6 1 4 25% 1 1 1 2 2 0.2 0.2 0.2 0.3 0.3
Tyler Weinberger, 4 24 17 48 35% 4 16 25% 6 10 60% 65 7 17 24 31 10 14 16 2.7 0.3 0.7 1.0 1.3 0.4 0.6 0.7
Tyler Peeples, 10 25 2 11 18% 33 78 42% 30 53 57% 102 33 58 91 55 49 6 32 71 4.1 1.3 2.3 3.6 2.2 2.0 0.2 1.3 2.8
Dashay Hunt, 11 20 14 2 6 33% 10 16 63% 14 6 8 14 4 9 10 9 0.7 0.3 0.4 0.7 0.2 0.5 0.5 0.5
Tyrell Proby, 12 20 1 8 13% 9 20 45% 1 4 25% 22 10 6 16 8 10 1 11 11 1.1 0.5 0.3 0.8 0.4 0.5 0.1 0.6 0.6
Conner Leihsing, 13 14 7 22 32% 13 44 30% 18 26 69% 65 13 26 39 14 10 4 11 38 4.6 0.9 1.9 2.8 1.0 0.7 0.3 0.8 2.7
T.J. Olsen, 14 23 22 39 56% 15 23 65% 59 26 32 58 11 7 2 15 28 2.6 1.1 1.4 2.5 0.5 0.3 0.1 0.7 1.2
Robert Munoz, 15 25 2 11 27 41% 15 22 68% 37 19 33 52 52 38 2 30 55 1.5 0.8 1.3 2.1 2.1 1.5 0.1 1.2 2.2
Caleb Reeb, 22
Austin Brodahl, 24 6 3 2 6 33% 2 2 2 4 1 1 2 6 0.3 0.3 0.3 0.7 0.2 0.2 0.3 1.0
Elijah Oliver, 30 25 31 102 30% 141 302 47% 110 146 75% 485 25 142 167 29 46 5 54 56 19.4 1.0 5.7 6.7 1.2 1.8 0.2 2.2 2.2
Jacob Ross, 31 21 18 48 38% 16 21 76% 52 34 38 72 5 9 18 26 26 2.5 1.6 1.8 3.4 0.2 0.4 0.9 1.2 1.2
Rhett Sanders, 45 13 7 20 35% 10 34 29% 9 17 53% 50 13 29 42 5 10 8 12 24 3.8 1.0 2.2 3.2 0.4 0.8 0.6 0.9 1.8
Baylor Hayes, 25 2 1 1 1 0.5 0.5 0.5
Team Totals 25 90 317 28% 389 905 43% 345 500 69% 1393 214 449 663 294 244 47 266 390 55.7 8.6 18.0 26.5 11.8 9.8 1.9 10.6 15.6
Opponent Totals 22 96 316 30% 312 640 49% 229 377 61% 1333 168 401 569 242 145 27 317 417 53.3 7.6 18.2 25.9 11.0 6.6 1.2 14.4 19.0
Peak Performances
Points
Lowest Opp Points
FG%
FT%
Rebounds
Assists
Steals
Blocked Shots
Most Opp TO's
Season Recap ** Indicates Conference Game
Opponent: Score 3FG 3FGA 3FG % 2FG 2FGA 2FG % FT FTA FT % FG % O REB D REB REB AST STL BLK TO'S FOUL
Scottsbluff NE: 12/12/14 6 17 35% 21 37 57% 9 13 69% 50% 5 21 26 14 10 1 6 18
69 ‐ 74
Rock Springs: 12/12/14 2 6 33% 27 47 57% 17 25 68% 55% 10 24 34 20 11 1 6 13
77 ‐ 48 1 18 6% 16 29 55% 13 17 76% 36% 6 11 17 6 6 13 21
Star Valley: 12/19/14 5 14 36% 16 36 44% 11 13 85% 42% 9 23 32 16 6 1 9 13
58 ‐ 47 8 19 42% 10 32 31% 3 11 27% 35% 9 15 24 15 7 11 15
Evanston: 12/18/14 3 10 30% 19 35 54% 9 13 69% 49% 9 18 27 10 11 1 5 10
56 ‐ 31 15 11 25 44% 9 10 90% 28% 7 16 23 9 6 1 13 19
Green River: 12/20/14 1 10 10% 22 43 51% 19 25 76% 43% 10 17 27 19 14 1 7 15
66 ‐ 46 1 3 33% 11 35 31% 21 26 81% 32% 4 21 25 9 3 21 21
East Thunderbirds Overall Record 15 ‐ 10 Conference Record 5 ‐ 5
Team Best Opponent Individual Best Player, # Opponent
77 Rock Springs 32 E Oliver, 30 Rock Springs
31 Evanston
55% Rock Springs 72% E Oliver, 30 Rock Springs
86% Laramie 91% Z Mccord, 2 Central
34 Rock Springs: Gillette 11 J Ross, 31: E Oliver, 30: E Oliver, 30 Scottsbluff NE: South: Riverton
20 Rock Springs 7 Z Mccord, 2 Rock Springs
17 Sheridan 6 T Peeples, 10: T Peeples, 10 Riverton: Central
6 South 4 J Ross, 31 South
POINTS REB AST
29 ‐‐ E Oliver, 30 8 ‐‐ E Oliver, 30 4 ‐‐ T Peeples, 10
25 Evanston
Defensive Stats PEAK PERFORMERS
24 ‐‐ Z Mccord, 2 9 ‐‐ E Oliver, 30 4 ‐‐ Z Mccord, 2
21 ‐‐ E Oliver, 30 8 ‐‐ E Oliver, 30 5 ‐‐ Z Mccord, 2: R Munoz, 15
32 ‐‐ E Oliver, 30 7 ‐‐ T Olsen, 14 7 ‐‐ Z Mccord, 2
17 ‐‐ Z Mccord, 2: E
Oliver, 30
10 ‐‐ E Oliver, 30 5 ‐‐ Z Mccord, 2
www.wyopreps.com
Home for High School StatsWyoming High School Basketball ‐ 4A BB2014 ‐ 2015 Season

Fort Collins CO: 1/2/15 4 9 44% 12 40 30% 16 31 52% 33% 7 17 24 11 10 6 8
52 ‐ 49
Kelly Walsh: 1/9/15 2 5 40% 19 40 48% 15 19 79% 47% 4 17 21 15 7 6 18
59 ‐ 44 4 19 21% 13 21 62% 6 17 35% 43% 10 16 26 13 4 3 8 19
Riverton: 1/8/15 2 6 33% 19 42 45% 14 20 70% 44% 7 18 25 13 10 1 12 16
58 ‐ 54 4 15 27% 15 28 54% 12 20 60% 44% 7 17 24 13 8 1 9 17
Natrona: 1/10/15 4 10 40% 18 34 53% 2 3 67% 50% 8 14 22 12 8 13 13
50 ‐ 51 5 12 42% 16 25 64% 4 10 40% 57% 7 10 17 17 9 3 14 17
Scottsbluff NE: 1/16/15 6 17 35% 19 40 48% 19 26 73% 44% 15 17 32 16 7 3 7 16
75 ‐ 69
Central: 1/23/15 ** 2 22 9% 7 32 22% 18 23 78% 17% 11 18 29 5 9 2 14 22
38 ‐ 48 3 8 38% 13 33 39% 13 27 48% 39% 9 21 30 10 7 5 14 22
Gillette: 1/30/15 ** 3 9 33% 21 44 48% 16 21 76% 45% 13 21 34 15 12 2 9 11
67 ‐ 66 9 21 43% 15 27 56% 9 14 64% 50% 7 19 26 19 6 13 19
Sheridan: 1/31/15 ** 9 17 53% 12 31 39% 17 33 52% 44% 12 19 31 17 17 3 14 9
68 ‐ 61 9 24 38% 13 28 46% 8 15 53% 42% 14 21 35 11 7 18 24
Laramie: 2/6/16 ** 5 19 26% 9 27 33% 12 14 86% 30% 6 18 24 10 7 2 16 18
45 ‐ 61 1 12 8% 17 31 55% 24 29 83% 42% 5 23 28 7 7 13 13
South: 2/5/15 ** 1 12 8% 17 39 44% 19 28 68% 35% 10 21 31 12 14 6 13 20
56 ‐ 53 5 11 45% 11 35 31% 16 26 62% 35% 5 17 22 7 9 1 16 22
Sheridan: 2/13/15 ** 3 5 60% 18 40 45% 9 15 60% 47% 7 21 28 18 5 4 9 16
54 ‐ 60 OT 9 26 35% 13 30 43% 7 11 64% 39% 15 19 34 10 8 1 11 15
Gillette: 2/14/14 ** 3 7 43% 12 35 34% 15 20 75% 36% 7 12 19 9 4 2 10 17
48 ‐ 60 6 12 50% 16 26 62% 10 13 77% 58% 4 19 23 16 3 11 17
Central: 2/20/15 ** 5 17 29% 9 35 26% 8 18 44% 27% 4 19 23 10 16 2 7 10
41 ‐ 39 OT 3 12 25% 14 29 48% 2 13 15% 41% 4 27 31 8 4 6 22 19
South: 2/25/15 ** 3 20 15% 17 40 43% 13 16 81% 33% 14 14 28 12 9 3 13 21
56 ‐ 60 3 9 33% 17 33 52% 17 25 68% 48% 8 22 30 10 10 2 16 18
Laramie: 2/27/15 ** 6 15 40% 9 24 38% 23 37 62% 38% 9 22 31 9 6 8 18
59 ‐ 48 4 14 29% 12 23 52% 12 19 63% 43% 5 17 22 1 1 11 30
South: 3/5/15 2 10 20% 16 32 50% 15 20 75% 43% 7 23 30 6 13 3 18 19
53 ‐ 46 3 10 30% 13 31 42% 11 19 58% 39% 8 14 22 7 12 19 23
Gillette: 3/6/15 4 13 31% 9 31 29% 12 17 71% 30% 8 12 20 8 6 1 20 19
42 ‐ 69 6 20 30% 19 34 56% 13 18 72% 46% 15 20 35 19 10 12 16
Central: 3/7/15 2 14 14% 14 31 45% 19 23 83% 36% 5 16 21 10 12 5 8 11
53 ‐ 39 5 13 38% 10 26 38% 4 6 67% 38% 6 14 20 6 4 1 16 15
Riverton: 3/12/15 5 19 26% 12 35 34% 8 12 67% 31% 10 23 33 2 10 3 16 20
47 ‐ 54 3 13 23% 20 35 57% 5 15 33% 48% 4 23 27 18 11 3 11 15
Evanston: 3/13/15 2 14 14% 15 35 43% 10 15 67% 35% 7 4 11 5 10 14 19
46 ‐ 56 4 10 40% 17 24 71% 10 16 63% 62% 9 19 28 11 3 25 20
23 ‐‐ E Oliver, 30 6 ‐‐ E Oliver, 30 5 ‐‐ Z Mccord, 2
18 ‐‐ Z Mccord, 2: E
Oliver, 30
9 ‐‐ E Oliver, 30 3 ‐‐ Z Mccord, 2: R Munoz, 15
23 ‐‐ E Oliver, 30 8 ‐‐ E Oliver, 30 4 ‐‐ R Munoz, 15
21 ‐‐ E Oliver, 30 9 ‐‐ E Oliver, 30 4 ‐‐ R Munoz, 15
24 ‐‐ Z Mccord, 2 9 ‐‐ E Oliver, 30 5 ‐‐ T Weinberger, 4
22 ‐‐ Z Mccord, 2 6 ‐‐ Z Mccord, 2: C
Leihsing, 13: J Ross, 31
5 ‐‐ T Peeples, 10
30 ‐‐ E Oliver, 30 11 ‐‐ J Ross, 31 6 ‐‐ Z Mccord, 2
14 ‐‐ Z Mccord, 2 9 ‐‐ J Ross, 31 2 ‐‐ E Oliver, 30
21 ‐‐ Z Mccord, 2 7 ‐‐ J Ross, 31 4 ‐‐ Z Mccord, 2: T Peeples, 10
16 ‐‐ Z Mccord, 2 4 ‐‐ T Peeples, 10: R
Sanders, 45
3 ‐‐ T Peeples, 10
20 ‐‐ Z Mccord, 2 7 ‐‐ T Peeples, 10 5 ‐‐ Z Mccord, 2
15 ‐‐ Z Mccord, 2 11 ‐‐ E Oliver, 30 4 ‐‐ Z Mccord, 2
17 ‐‐ E Oliver, 30 9 ‐‐ R Sanders, 45 3 ‐‐ T Weinberger, 4: T
Peeples, 10
21 ‐‐ E Oliver, 30 9 ‐‐ R Sanders, 45 2 ‐‐ Z Mccord, 2
17 ‐‐ E Oliver, 30 6 ‐‐ T Peeples, 10: E
Oliver, 30
3 ‐‐ Z Mccord, 2: T Peeples, 10
31 ‐‐ E Oliver, 30 6 ‐‐ E Oliver, 30 4 ‐‐ Z Mccord, 2
19 ‐‐ E Oliver, 30 11 ‐‐ E Oliver, 30 1 ‐‐ Z Mccord, 2: R Munoz, 15
13 ‐‐ Z Mccord, 2 2 ‐‐ T Peeples, 10: R
Munoz, 15: J Ross, 31
1 ‐‐ Z Mccord, 2: T Peeples,
10: D Hunt, 11: T Olsen, 14: E
19 ‐‐ E Oliver, 30 5 ‐‐ E Oliver, 30 3 ‐‐ Z Mccord, 2
20 ‐‐ Z Mccord, 2 5 ‐‐ R Munoz, 15 3 ‐‐ Z Mccord, 2
www.wyopreps.com
Home for High School StatsWyoming High School Basketball ‐ 4A BB2014 ‐ 2015 Season

State Second Place 4A BB East26 15 11 6 4
PLAYER,# GP 3FGM 3FGA 3FG % 2FGM 2FGA 2FG % FTM FTA FT % PTSOFF
REB
DEF
REBREB AST STL BLK TO'S FOUL
PTS /
GM
O REB
/GM
D REB
/GM
REB /
GM
AST /
GM
STL /
GM
BLK /
GM
TO'S /
GM
FOUL
/ GM
Trey Larson, 2 26 26 95 27% 63 97 65% 58 79 73% 262 24 47 71 40 30 9 32 77 10.1 0.9 1.8 2.7 1.5 1.2 0.3 1.2 3.0
Talon Nelson, 5 24 3 12 25% 54 87 62% 12 22 55% 129 33 35 68 29 24 24 32 5.4 1.4 1.5 2.8 1.2 1.0 1.0 1.3
Cale Miessler, 24 26 63 169 37% 21 51 41% 51 61 84% 282 17 66 83 100 41 2 45 52 10.8 0.7 2.5 3.2 3.8 1.6 0.1 1.7 2.0
Andrew Hays, 12 26 21 61 34% 56 95 59% 74 101 73% 249 22 48 70 51 34 1 48 65 9.6 0.8 1.8 2.7 2.0 1.3 0.0 1.8 2.5
Joe Quinn, 13 4 1 3 33% 3 2 2 2 4 3 0.8 0.5 0.5 0.5 1.0 0.8
Zach Obermire, 14 5 1 1 100% 4 4 100% 5 8 63% 16 5 5 1 2 1 6 3.2 1.0 1.0 0.2 0.4 0.2 1.2
Dalton Holst, 15 26 11 40 28% 13 23 57% 13 23 57% 72 23 33 56 31 21 2 21 25 2.8 0.9 1.3 2.2 1.2 0.8 0.1 0.8 1.0
Hunter Sylte, 21 4 1 1 100% 2 4 50% 1 3 33% 8 1 1 2 2 2.0 0.3 0.3 0.5 0.5
Ian Durgin, 31 26 12 31 39% 15 41 37% 19 35 54% 85 18 31 49 25 12 1 16 33 3.3 0.7 1.2 1.9 1.0 0.5 0.0 0.6 1.3
Eli Voigt, 33 26 57 125 46% 48 110 44% 26 33 79% 293 15 35 50 36 21 3 31 64 11.3 0.6 1.3 1.9 1.4 0.8 0.1 1.2 2.5
Kain Morehead, 34 25 12 33 36% 23 39 59% 13 20 65% 95 13 38 51 11 10 24 14 31 3.8 0.5 1.5 2.0 0.4 0.4 1.0 0.6 1.2
Lane Tucker, 40 14 1 3 33% 4 9 44% 6 14 43% 17 6 11 17 2 5 6 13 1.2 0.4 0.8 1.2 0.1 0.4 0.4 0.9
Brandon Koch, 43 26 8 31 26% 87 157 55% 32 48 67% 230 77 104 181 33 28 9 56 90 8.8 3.0 4.0 7.0 1.3 1.1 0.3 2.2 3.5
Team Totals 26 217 605 36% 390 717 54% 310 447 69% 1741 255 449 704 363 228 51 300 491 67.0 9.8 17.3 27.1 14.0 8.8 2.0 11.5 18.9
Opponent Totals 19 82 256 32% 275 598 46% 231 340 68% 1511 181 337 518 163 131 27 317 340 58.1 9.5 17.7 27.3 8.6 6.9 1.4 16.7 17.9
Peak Performances
Points
Lowest Opp Points
FG%
FT%
Rebounds
Assists
Steals
Blocked Shots
Most Opp TO's
Season Recap ** Indicates Conference Game
Opponent: Score 3FG 3FGA 3FG % 2FG 2FGA 2FG % FT FTA FT % FG % O REB D REB REB AST STL BLK TO'S FOUL
Natrona: 12/11/14 15 33 45% 12 25 48% 9 15 60% 47% 13 31 44 23 10 2 9 18
78 ‐ 36 2 17 12% 12 26 46% 6 17 35% 33% 7 16 23 8 3 2 21 17
Bismark Century ND: 12/12/14 8 26 31% 10 23 43% 9 12 75% 37% 9 12 21 8 10 5 12 25
53 ‐ 57
Scottsbluff NE: 12/13/14 8 27 30% 22 41 54% 11 14 79% 44% 13 16 29 6 5 11 22
79 ‐ 82 OT
Evanston: 12/20/14 8 31 26% 15 26 58% 9 18 50% 40% 10 15 25 6 4 8 27
63 ‐ 72 6 11 55% 16 29 55% 22 28 79% 55% 5 19 24 15 3 4 13 19
Green River: 12/18/14 12 29 41% 19 33 58% 25 29 86% 50% 10 18 28 15 11 3 13 22
99 ‐ 61 5 18 28% 15 42 36% 16 28 57% 33% 17 18 35 11 6 1 23 24
Gillette Camels Overall Record 15 ‐ 11 Conference Record 6 ‐ 4
Team Best Opponent Individual Best Player, # Opponent
99 Green River 25 E Voigt, 33 South Eugene OR
35 Evanston
59% Central 89% E Voigt, 33: A Hays, 12 East: Central
87% South 100% T Larson, 2 East
44 Natrona 13 B Koch, 43 Sheridan
25 Rock Springs: Granger UT 9 C Miessler, 24 Natrona
18 South 5 A Hays, 12 South
8 Laramie 5 K Morehead, 34 Laramie
POINTS REB AST
21 ‐‐ E Voigt, 33 7 ‐‐ D Holst, 15 9 ‐‐ C Miessler, 24
27 South
Defensive Stats PEAK PERFORMERS
15 ‐‐ B Koch, 43 9 ‐‐ B Koch, 43 1 ‐‐ T Larson, 2: T Nelson, 5: C
Miessler, 24: A Hays, 12: D
19 ‐‐ E Voigt, 33 6 ‐‐ B Koch, 43 6 ‐‐ C Miessler, 24
18 ‐‐ C Miessler, 24 6 ‐‐ B Koch, 43 2 ‐‐ C Miessler, 24: E Voigt, 33:
B Koch, 43
19 ‐‐ C Miessler, 24 8 ‐‐ B Koch, 43 3 ‐‐ I Durgin, 31
www.wyopreps.com
Home for High School StatsWyoming High School Basketball ‐ 4A BB2014 ‐ 2015 Season

Rock Springs: 12/19/14 11 28 39% 17 25 68% 19 25 76% 53% 16 14 30 25 17 1 9 15
86 ‐ 47 5 13 38% 10 23 43% 12 16 75% 42% 7 11 18 7 5 4 22 17
Meridian ID: 12/29/14 17 29 59% 10 22 45% 9 12 75% 53% 9 9 18 20 12 2 12 13
80 ‐ 57
Granger UT: 12/30/14 9 25 36% 22 35 63% 7 9 78% 52% 7 20 27 25 15 1 11 15
78 ‐ 64
South Eugene OR: 12/30/14 13 32 41% 13 19 68% 8 10 80% 51% 7 14 21 17 8 19 16
73 ‐ 79
RC Central SD: 1/16/15 3 22 14% 17 30 57% 18 29 62% 38% 12 17 29 12 9 7 24
61 ‐ 62
RC Stevens SD: 1/17/15 11 31 35% 13 27 48% 12 20 60% 41% 10 17 27 9 5 4 8 24
71 ‐ 83
Laramie: 1/23/15 ** 6 25 24% 14 29 48% 10 12 83% 37% 10 20 30 14 12 8 15 18
56 ‐ 60 2 6 33% 21 37 57% 12 17 71% 53% 7 22 29 7 13 21 11
South: 1/24/15 ** 3 14 21% 21 34 62% 6 8 75% 50% 10 17 27 18 15 4 16 16
57 ‐ 43 3 10 30% 13 28 46% 8 14 57% 42% 6 16 22 7 9 1 27 17
East: 1/30/15 ** 9 21 43% 15 27 56% 9 14 64% 50% 7 19 26 19 6 13 19
66 ‐ 67 3 9 33% 21 44 48% 16 21 76% 45% 13 21 34 15 12 2 9 11
Central: 1/31/15 ** 9 30 30% 9 19 47% 5 11 45% 37% 10 14 24 14 6 3 15 18
50 ‐ 55 4 9 44% 14 25 56% 15 22 68% 53% 4 22 26 11 9 1 12 15
Sheridan: 2/6/15 ** 7 20 35% 13 29 45% 21 31 68% 41% 11 16 27 14 5 5 9 20
68 ‐ 74 11 24 46% 10 29 34% 21 24 88% 40% 14 21 35 7 7 3 13 24
East: 2/14/14 ** 6 12 50% 16 26 62% 10 13 77% 58% 4 19 23 16 3 11 17
60 ‐ 48 3 7 43% 12 35 34% 15 20 75% 36% 7 12 19 9 4 2 10 17
Central: 2/13/15 ** 11 21 52% 12 18 67% 6 11 55% 59% 5 18 23 14 12 1 13 14
63 ‐ 45 5 12 42% 13 24 54% 4 10 40% 50% 8 10 18 5 10 19 12
Laramie: 2/21/15 ** 7 20 35% 17 26 65% 10 15 67% 52% 11 17 28 13 6 11 20
65 ‐ 53 2 9 22% 17 34 50% 13 19 68% 44% 12 16 28 8 7 2 16 14
South: 2/20/15 ** 9 23 39% 16 31 52% 13 15 87% 46% 10 15 25 17 18 3 8 19
72 ‐ 66 5 13 38% 19 27 70% 13 15 87% 60% 7 23 30 10 6 1 26 18
Sheridan: 2/27/15 ** 5 17 29% 16 35 46% 22 27 81% 40% 17 22 39 11 5 5 9 14
69 ‐ 57 8 25 32% 15 36 42% 3 3 100% 38% 17 16 33 3 4 1 11 22
East: 3/6/15 6 20 30% 19 34 56% 13 18 72% 46% 15 20 35 19 10 12 16
69 ‐ 42 4 13 31% 9 31 29% 12 17 71% 30% 8 12 20 8 6 1 20 19
Sheridan: 3/7/15 7 18 39% 11 23 48% 23 37 62% 44% 7 22 29 13 9 4 10 18
66 ‐ 64 6 22 27% 15 33 45% 16 21 76% 38% 16 25 41 11 5 1 13 27
Evanston: 3/12/15 7 19 37% 13 25 52% 11 15 73% 45% 10 19 29 6 6 11 16
58 ‐ 35 2 10 20% 13 32 41% 3 11 27% 36% 5 16 21 4 6 15 19
Riverton: 3/13/15 5 15 33% 17 29 59% 9 16 56% 50% 5 14 19 4 6 16 23
58 ‐ 56 4 17 24% 15 31 48% 14 21 67% 40% 11 18 29 11 9 1 13 18
Natrona: 3/14/15 5 17 29% 11 26 42% 6 11 55% 37% 7 14 21 5 3 12 22
43 ‐ 46 2 11 18% 15 32 47% 10 16 63% 40% 10 23 33 6 7 13 19
17 ‐‐ T Larson, 2 10 ‐‐ B Koch, 43 8 ‐‐ C Miessler, 24
25 ‐‐ E Voigt, 33 8 ‐‐ B Koch, 43 5 ‐‐ C Miessler, 24
14 ‐‐ D Holst, 15 9 ‐‐ B Koch, 43 5 ‐‐ T Larson, 2: I Durgin, 31
19 ‐‐ E Voigt, 33 6 ‐‐ B Koch, 43 7 ‐‐ C Miessler, 24
13 ‐‐ B Koch, 43 8 ‐‐ B Koch, 43 4 ‐‐ C Miessler, 24
13 ‐‐ K Morehead, 34 6 ‐‐ A Hays, 12 5 ‐‐ C Miessler, 24
15 ‐‐ E Voigt, 33 5 ‐‐ C Miessler, 24: B
Koch, 43
6 ‐‐ C Miessler, 24
19 ‐‐ E Voigt, 33 8 ‐‐ T Nelson, 5: B
Koch, 43
5 ‐‐ C Miessler, 24
18 ‐‐ A Hays, 12 7 ‐‐ B Koch, 43 7 ‐‐ C Miessler, 24
20 ‐‐ E Voigt, 33 6 ‐‐ K Morehead, 34 6 ‐‐ A Hays, 12
15 ‐‐ C Miessler, 24 5 ‐‐ B Koch, 43 4 ‐‐ T Nelson, 5: E Voigt, 33
12 ‐‐ C Miessler, 24 5 ‐‐ B Koch, 43 5 ‐‐ C Miessler, 24
17 ‐‐ C Miessler, 24 7 ‐‐ B Koch, 43 6 ‐‐ A Hays, 12
21 ‐‐ T Larson, 2 13 ‐‐ B Koch, 43 4 ‐‐ D Holst, 15
22 ‐‐ A Hays, 12 6 ‐‐ C Miessler, 24 5 ‐‐ C Miessler, 24
16 ‐‐ T Larson, 2 9 ‐‐ B Koch, 43 5 ‐‐ A Hays, 12
16 ‐‐ T Larson, 2 7 ‐‐ B Koch, 43 2 ‐‐ C Miessler, 24: A Hays, 12
12 ‐‐ B Koch, 43 4 ‐‐ D Holst, 15: B
Koch, 43
2 ‐‐ I Durgin, 31
22 ‐‐ T Larson, 2 10 ‐‐ B Koch, 43 5 ‐‐ T Larson, 2
19 ‐‐ C Miessler, 24 8 ‐‐ C Miessler, 24 4 ‐‐ A Hays, 12
17 ‐‐ T Larson, 2 5 ‐‐ T Larson, 2: B
Koch, 43
3 ‐‐ T Larson, 2
www.wyopreps.com
Home for High School StatsWyoming High School Basketball ‐ 4A BB2014 ‐ 2015 Season

4A BB East21 12 9 5 5
PLAYER,# GP 3FGM 3FGA 3FG % 2FGM 2FGA 2FG % FTM FTA FT % PTSOFF
REB
DEF
REBREB AST STL BLK TO'S FOUL
PTS /
GM
O REB
/GM
D REB
/GM
REB /
GM
AST /
GM
STL /
GM
BLK /
GM
TO'S /
GM
FOUL
/ GM
Andrew Barnes, 0 12 2 6 33% 3 4 75% 7 4 2 6 1 1 3 3 0.6 0.3 0.2 0.5 0.1 0.1 0.3 0.3
Andy Pearson, 1 20 13 33 39% 40 82 49% 36 57 63% 155 34 41 75 26 24 1 28 16 7.8 1.7 2.1 3.8 1.3 1.2 0.1 1.4 0.8
Jake Aadland, 2 20 42 122 34% 71 115 62% 49 58 84% 317 10 47 57 27 19 1 41 10 15.9 0.5 2.4 2.9 1.4 1.0 0.1 2.1 0.5
Andrew Garcia, 3 21 2 13 15% 9 19 47% 13 17 76% 37 15 24 39 21 21 20 11 1.8 0.7 1.1 1.9 1.0 1.0 1.0 0.5
Drew Worman, 4 15 1 1 100% 2 5 40% 4 1 4 5 4 1 2 2 0.3 0.1 0.3 0.3 0.3 0.1 0.1 0.1
Nate Hill, 11 21 1 12 8% 13 32 41% 20 33 61% 49 14 24 38 12 21 24 13 2.3 0.7 1.1 1.8 0.6 1.0 1.1 0.6
Tye Brown, 22 21 16 24 61 39% 21 39 54% 69 12 38 50 40 27 61 12 3.3 0.6 1.8 2.4 1.9 1.3 2.9 0.6
Joe Legerski, 30 21 17 69 25% 24 38 63% 24 33 73% 123 11 27 38 11 13 1 22 25 5.9 0.5 1.3 1.8 0.5 0.6 0.0 1.0 1.2
Tristan Eickbush, 33 21 7 16 44% 76 148 51% 37 66 56% 210 55 80 135 8 24 2 26 17 10.0 2.6 3.8 6.4 0.4 1.1 0.1 1.2 0.8
Lance Garland, 34 9 1 3 33% 1 2 50% 2 3 67% 7 1 3 4 1 2 0.8 0.1 0.3 0.4 0.1 0.2
Danny Bradfield, 44 21 1 1 100% 25 55 45% 16 25 64% 69 27 42 69 3 1 1 18 23 3.3 1.3 2.0 3.3 0.1 0.0 0.0 0.9 1.1
Ty Hofflund, 42 2 1 1 1 1 2 0.5 0.5 1.0
Owen Cossairt, 50 2 1 3 33% 2 1 1.0 0.5
Josh Wilson, 5 18 4 12 33% 25 53 47% 29 40 73% 91 17 29 46 12 15 22 6 5.1 0.9 1.6 2.6 0.7 0.8 1.2 0.3
18
Team Totals 21 88 298 30% 312 616 51% 252 380 66% 1140 201 362 563 165 168 6 271 157 54.3 9.6 17.2 26.8 7.9 8.0 0.3 12.9 7.5
Opponent Totals 19 88 280 31% 216 463 47% 251 380 66% 1050 114 331 445 193 118 36 251 339 50.0 6.0 17.4 23.4 10.2 6.2 1.9 13.2 17.8
Peak Performances
Points
Lowest Opp Points
FG%
FT%
Rebounds
Assists
Steals
Blocked Shots
Most Opp TO's
Season Recap ** Indicates Conference Game
Opponent: Score 3FG 3FGA 3FG % 2FG 2FGA 2FG % FT FTA FT % FG % O REB D REB REB AST STL BLK TO'S FOUL
Evanston: 12/11/14 2 12 17% 10 25 40% 4 5 80% 32% 10 10 20 3 11 15 12
30 ‐ 49 6 16 38% 12 23 52% 7 10 70% 46% 7 16 23 16 11 2 12 12
Riverton: 12/12/14 5 21 24% 15 30 50% 15 22 68% 39% 9 21 30 12 10 20 18
60 ‐ 54 4 14 29% 16 27 59% 10 21 48% 49% 8 15 23 15 11 14 21
Kelly Walsh: 12/13/14 3 20 15% 8 18 44% 4 10 40% 29% 9 14 23 6 6 19 11
29 ‐ 57 8 15 53% 12 22 55% 9 19 47% 54% 5 20 25 17 5 2 11 16
Central City NE: 1/2/15 3 14 21% 24 36 67% 8 11 73% 54% 10 21 31 16 6 12 21
65 ‐ 46
Gering NE: 1/3/15 10 18 56% 16 33 48% 12 18 67% 51% 8 17 25 16 9 21 17
74 ‐ 57
Laramie Plainsmen Overall Record 12 ‐ 9 Conference Record 5 ‐ 5
Team Best Opponent Individual Best Player, # Opponent
74 Gering NE: Green River 28 J Aadland, 2 Central
35 Rock Springs
58% Green River 88% T Eickbush, 33 Green River
83% East 90% J Aadland, 2 Central
41 Rock Springs 11 T Eickbush, 33 South
16 Central City NE: Gering NE 5 J Aadland, 2: A Garcia, 3: T Brown, 22 Riverton: Central City NE: Gering NE
14 Green River 4 A Garcia, 3: J Aadland, 2: T Brown, 22: J Aadland, 2 Riverton: Gering NE: Rock Springs: Gillette
2 Sheridan: Gillette: Central 1 A Pearson, 1: J Aadland, 2: J Legerski, 30: T Eickbush, 33: T Eickbush, 33: D Bradfield, 44 Sheridan: Gillette: Central
POINTS REB AST
14 ‐‐ J Aadland, 2 5 ‐‐ T Brown, 22: T
Eickbush, 33
2 ‐‐ T Brown, 22
22 Green River
Defensive Stats PEAK PERFORMERS
19 ‐‐ J Legerski, 30 8 ‐‐ D Bradfield, 44 5 ‐‐ A Garcia, 3
22 ‐‐ J Aadland, 2 5 ‐‐ A Pearson, 1 5 ‐‐ T Brown, 22
18 ‐‐ J Aadland, 2 8 ‐‐ T Eickbush, 33 5 ‐‐ J Aadland, 2
7 ‐‐ J Aadland, 2: T
Eickbush, 33
9 ‐‐ T Eickbush, 33 3 ‐‐ A Garcia, 3
www.wyopreps.com
Home for High School StatsWyoming High School Basketball ‐ 4A BB2014 ‐ 2015 Season
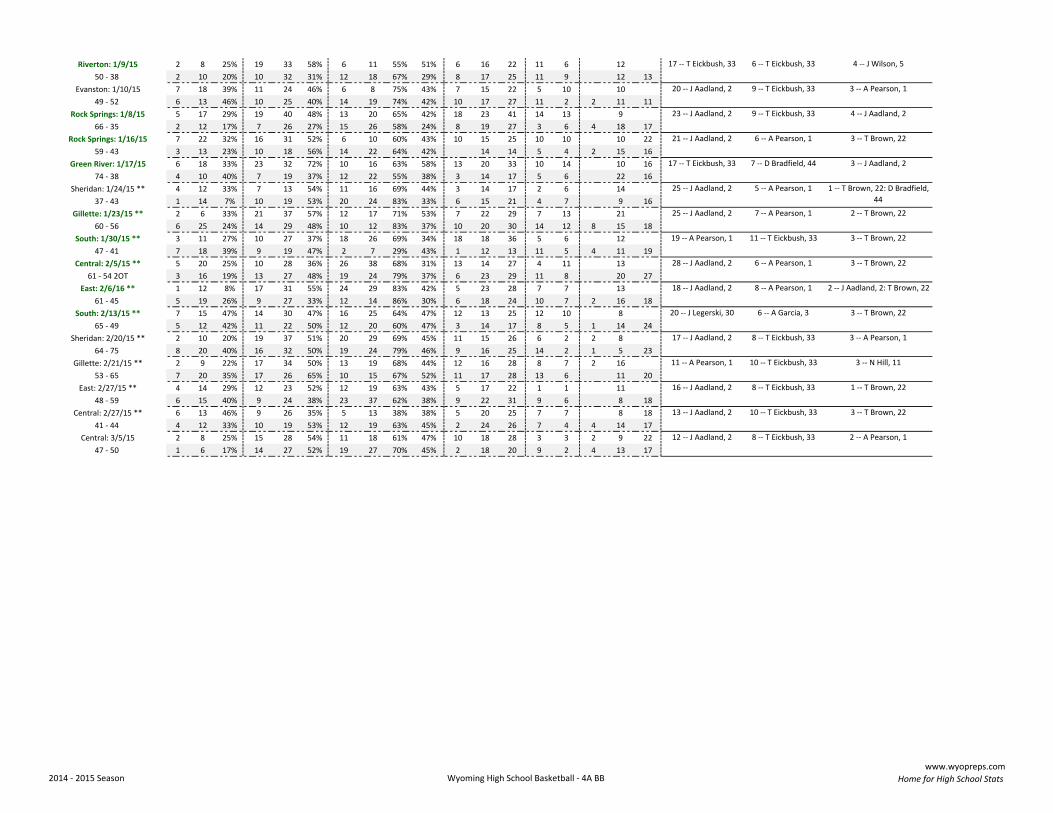
Riverton: 1/9/15 2 8 25% 19 33 58% 6 11 55% 51% 6 16 22 11 6 12
50 ‐ 38 2 10 20% 10 32 31% 12 18 67% 29% 8 17 25 11 9 12 13
Evanston: 1/10/15 7 18 39% 11 24 46% 6 8 75% 43% 7 15 22 5 10 10
49 ‐ 52 6 13 46% 10 25 40% 14 19 74% 42% 10 17 27 11 2 2 11 11
Rock Springs: 1/8/15 5 17 29% 19 40 48% 13 20 65% 42% 18 23 41 14 13 9
66 ‐ 35 2 12 17% 7 26 27% 15 26 58% 24% 8 19 27 3 6 4 18 17
Rock Springs: 1/16/15 7 22 32% 16 31 52% 6 10 60% 43% 10 15 25 10 10 10 22
59 ‐ 43 3 13 23% 10 18 56% 14 22 64% 42% 14 14 5 4 2 15 16
Green River: 1/17/15 6 18 33% 23 32 72% 10 16 63% 58% 13 20 33 10 14 10 16
74 ‐ 38 4 10 40% 7 19 37% 12 22 55% 38% 3 14 17 5 6 22 16
Sheridan: 1/24/15 ** 4 12 33% 7 13 54% 11 16 69% 44% 3 14 17 2 6 14
37 ‐ 43 1 14 7% 10 19 53% 20 24 83% 33% 6 15 21 4 7 9 16
Gillette: 1/23/15 ** 2 6 33% 21 37 57% 12 17 71% 53% 7 22 29 7 13 21
60 ‐ 56 6 25 24% 14 29 48% 10 12 83% 37% 10 20 30 14 12 8 15 18
South: 1/30/15 ** 3 11 27% 10 27 37% 18 26 69% 34% 18 18 36 5 6 12
47 ‐ 41 7 18 39% 9 19 47% 2 7 29% 43% 1 12 13 11 5 4 11 19
Central: 2/5/15 ** 5 20 25% 10 28 36% 26 38 68% 31% 13 14 27 4 11 13
61 ‐ 54 2OT 3 16 19% 13 27 48% 19 24 79% 37% 6 23 29 11 8 20 27
East: 2/6/16 ** 1 12 8% 17 31 55% 24 29 83% 42% 5 23 28 7 7 13
61 ‐ 45 5 19 26% 9 27 33% 12 14 86% 30% 6 18 24 10 7 2 16 18
South: 2/13/15 ** 7 15 47% 14 30 47% 16 25 64% 47% 12 13 25 12 10 8
65 ‐ 49 5 12 42% 11 22 50% 12 20 60% 47% 3 14 17 8 5 1 14 24
Sheridan: 2/20/15 ** 2 10 20% 19 37 51% 20 29 69% 45% 11 15 26 6 2 2 8
64 ‐ 75 8 20 40% 16 32 50% 19 24 79% 46% 9 16 25 14 2 1 5 23
Gillette: 2/21/15 ** 2 9 22% 17 34 50% 13 19 68% 44% 12 16 28 8 7 2 16
53 ‐ 65 7 20 35% 17 26 65% 10 15 67% 52% 11 17 28 13 6 11 20
East: 2/27/15 ** 4 14 29% 12 23 52% 12 19 63% 43% 5 17 22 1 1 11
48 ‐ 59 6 15 40% 9 24 38% 23 37 62% 38% 9 22 31 9 6 8 18
Central: 2/27/15 ** 6 13 46% 9 26 35% 5 13 38% 38% 5 20 25 7 7 8 18
41 ‐ 44 4 12 33% 10 19 53% 12 19 63% 45% 2 24 26 7 4 4 14 17
Central: 3/5/15 2 8 25% 15 28 54% 11 18 61% 47% 10 18 28 3 3 2 9 22
47 ‐ 50 1 6 17% 14 27 52% 19 27 70% 45% 2 18 20 9 2 4 13 17
23 ‐‐ J Aadland, 2 9 ‐‐ T Eickbush, 33 4 ‐‐ J Aadland, 2
21 ‐‐ J Aadland, 2 6 ‐‐ A Pearson, 1 3 ‐‐ T Brown, 22
17 ‐‐ T Eickbush, 33 6 ‐‐ T Eickbush, 33 4 ‐‐ J Wilson, 5
20 ‐‐ J Aadland, 2 9 ‐‐ T Eickbush, 33 3 ‐‐ A Pearson, 1
25 ‐‐ J Aadland, 2 7 ‐‐ A Pearson, 1 2 ‐‐ T Brown, 22
19 ‐‐ A Pearson, 1 11 ‐‐ T Eickbush, 33 3 ‐‐ T Brown, 22
17 ‐‐ T Eickbush, 33 7 ‐‐ D Bradfield, 44 3 ‐‐ J Aadland, 2
25 ‐‐ J Aadland, 2 5 ‐‐ A Pearson, 1 1 ‐‐ T Brown, 22: D Bradfield,
44
20 ‐‐ J Legerski, 30 6 ‐‐ A Garcia, 3 3 ‐‐ T Brown, 22
17 ‐‐ J Aadland, 2 8 ‐‐ T Eickbush, 33 3 ‐‐ A Pearson, 1
28 ‐‐ J Aadland, 2 6 ‐‐ A Pearson, 1 3 ‐‐ T Brown, 22
18 ‐‐ J Aadland, 2 8 ‐‐ A Pearson, 1 2 ‐‐ J Aadland, 2: T Brown, 22
13 ‐‐ J Aadland, 2 10 ‐‐ T Eickbush, 33 3 ‐‐ T Brown, 22
12 ‐‐ J Aadland, 2 8 ‐‐ T Eickbush, 33 2 ‐‐ A Pearson, 1
11 ‐‐ A Pearson, 1 10 ‐‐ T Eickbush, 33 3 ‐‐ N Hill, 11
16 ‐‐ J Aadland, 2 8 ‐‐ T Eickbush, 33 1 ‐‐ T Brown, 22
www.wyopreps.com
Home for High School StatsWyoming High School Basketball ‐ 4A BB2014 ‐ 2015 Season

East Regional 2nd Place 4A BB East24 14 10 7 3
PLAYER,# GP 3FGM 3FGA 3FG % 2FGM 2FGA 2FG % FTM FTA FT % PTSOFF
REB
DEF
REBREB AST STL BLK TO'S FOUL
PTS /
GM
O REB
/GM
D REB
/GM
REB /
GM
AST /
GM
STL /
GM
BLK /
GM
TO'S /
GM
FOUL
/ GM
Zach Campbell, 1 24 19 73 26% 13 39 33% 23 46 50% 106 8 16 24 14 28 1 16 71 4.4 0.3 0.7 1.0 0.6 1.2 0.0 0.7 3.0
Cody Williams, 2 18 8 27 30% 20 54 37% 24 35 69% 88 11 19 30 21 11 1 20 42 4.9 0.6 1.1 1.7 1.2 0.6 0.1 1.1 2.3
Kris Clark, 4 24 35 75 47% 31 54 57% 101 126 114 240 21 19 1 24 77 4.2 5.3 4.8 10.0 0.9 0.8 0.0 1.0 3.2
Dontae Crow, 5 23 3 11 27% 14 28 50% 10 14 71% 47 5 21 26 13 18 17 22 2.0 0.2 0.9 1.1 0.6 0.8 0.7 1.0
Drew Boedecker, 11 21 1 8 13% 5 13 38% 11 16 69% 24 13 20 33 3 3 5 13 23 1.1 0.6 1.0 1.6 0.1 0.1 0.2 0.6 1.1
Coy Steel, 12 18 19 60 32% 17 29 59% 21 31 68% 112 10 28 38 14 14 1 30 36 6.2 0.6 1.6 2.1 0.8 0.8 0.1 1.7 2.0
Dylan Daniels, 13 24 52 155 34% 66 184 36% 69 97 71% 357 9 69 78 72 41 3 46 54 14.9 0.4 2.9 3.3 3.0 1.7 0.1 1.9 2.3
Cutter Silcox, 22 7 2 4 50% 12 32 38% 9 16 56% 39 7 18 25 1 9 9 10 16 5.6 1.0 2.6 3.6 0.1 1.3 1.3 1.4 2.3
Blake Godwin, 31 24 63 184 34% 34 99 34% 53 65 82% 310 25 55 80 43 27 42 42 12.9 1.0 2.3 3.3 1.8 1.1 1.8 1.8
Blaze Mickelson, 32 7 1 2 50% 1 3 1 4 5 1 1 3 0.4 0.1 0.6 0.7 0.1 0.1 0.4
Clayton Partridge, 33 22 1 3 33% 9 19 47% 5 7 71% 26 9 16 25 3 4 1 8 18 1.2 0.4 0.7 1.1 0.1 0.2 0.0 0.4 0.8
Blake Baker, 34 24 1 3 33% 40 94 43% 30 42 71% 113 59 54 113 21 14 12 36 62 4.7 2.5 2.3 4.7 0.9 0.6 0.5 1.5 2.6
Bhadshad Khan, 15
Riley Sessions, 23 8 3 4 5 80% 1 4 25% 9 4 10 14 1 1 1 6 5 1.1 0.5 1.3 1.8 0.1 0.1 0.1 0.8 0.6
Eli Rides Horse, 24
Team Totals 24 170 533 32% 269 672 40% 287 427 67% 1335 287 444 731 228 189 35 269 471 55.6 12.0 18.5 30.5 9.5 7.9 1.5 11.2 19.6
Opponent Totals 22 86 288 30% 298 635 47% 306 475 64% 1277 177 435 612 218 141 67 289 364 53.2 8.0 19.8 27.8 9.9 6.4 3.0 13.1 16.5
Peak Performances
Points
Lowest Opp Points
FG%
FT%
Rebounds
Assists
Steals
Blocked Shots
Most Opp TO's
Season Recap ** Indicates Conference Game
Opponent: Score 3FG 3FGA 3FG % 2FG 2FGA 2FG % FT FTA FT % FG % O REB D REB REB AST STL BLK TO'S FOUL
Riverton: 12/11/14 6 17 35% 18 33 55% 8 13 62% 48% 8 19 27 9 10 4 13 13
62 ‐ 56 5 16 31% 15 25 60% 11 17 65% 49% 4 19 23 15 9 2 12 14
Kelly Walsh: 12/12/14 7 15 47% 5 29 17% 12 17 71% 27% 7 11 18 8 3 2 7 20
43 ‐ 62 7 15 47% 15 30 50% 11 19 58% 49% 10 23 33 17 1 5 7 12
Evanston: 12/13/14 4 19 21% 15 24 63% 5 14 36% 44% 3 11 14 7 10 3 8
47 ‐ 56 4 11 36% 11 30 37% 22 29 76% 37% 13 24 37 11 5 3 15 15
Billings Sr MT: 12/19/14 7 19 37% 12 33 36% 18 28 64% 37% 13 16 29 14 11 1 10 39
63 ‐ 56
Powell: 12/20/14 10 29 34% 9 31 29% 11 18 61% 32% 18 15 33 17 7 1 12 17
59 ‐ 56 3 10 30% 20 43 47% 7 12 58% 43% 9 24 33 12 11 2 14 16
Sheridan Broncs Overall Record 14 ‐ 10 Conference Record 7 ‐ 3
Team Best Opponent Individual Best Player, # Opponent
75 Laramie 29 D Daniels, 13 Rock Springs
29 Green River
50% Natrona 67% C Silcox, 22 Rock Springs
88% Gillette 100% B Godwin, 31 South
48 Rock Springs 17 K Clark, 4 Gillette
17 Powell: Green River 7 D Daniels, 13: D Daniels, 13 Powell: Laramie
15 Green River 6 D Daniels, 13 Central
6 Kelly Walsh 3 C Silcox, 22: B Baker, 34 Kelly Walsh
POINTS REB AST
17 ‐‐ D Daniels, 13 7 ‐‐ K Clark, 4 4 ‐‐ D Daniels, 13
24 Green River
Defensive Stats PEAK PERFORMERS
15 ‐‐ B Godwin, 31 15 ‐‐ K Clark, 4 4 ‐‐ D Daniels, 13
14 ‐‐ B Godwin, 31 7 ‐‐ B Baker, 34 7 ‐‐ D Daniels, 13
17 ‐‐ D Daniels, 13 5 ‐‐ K Clark, 4: C Silcox,
22
3 ‐‐ D Daniels, 13
18 ‐‐ D Daniels, 13 3 ‐‐ C Williams, 2: B
Baker, 34
5 ‐‐ D Daniels, 13
www.wyopreps.com
Home for High School StatsWyoming High School Basketball ‐ 4A BB2014 ‐ 2015 Season

Kelly Walsh: 1/10/15 2 19 11% 5 35 14% 14 19 74% 13% 18 20 38 3 12 6 18 19
30 ‐ 42 1 9 11% 16 35 46% 7 15 47% 39% 8 28 36 12 8 1 17 16
Green River: 1/8/15 8 25 32% 14 29 48% 11 21 52% 41% 16 19 35 17 15 1 10 20
63 ‐ 29 1 9 11% 7 16 44% 12 19 63% 32% 2 15 17 5 5 2 24 16
Rock Springs: 1/9/15 5 15 33% 18 44 41% 18 27 67% 39% 17 31 48 8 11 2 13 23
69 ‐ 40 2 21 10% 10 24 42% 14 26 54% 27% 5 22 27 8 7 4 17 22
Billings Sr MT: 1/16/15 5 25 20% 12 25 48% 8 13 62% 34% 9 21 30 11 12 19 18
47 ‐ 61
Natrona: 1/17/15 9 16 56% 10 22 45% 10 20 50% 50% 11 19 30 16 7 1 17 19
57 ‐ 45 5 25 20% 10 17 59% 10 16 63% 36% 10 11 21 10 5 3 16 21
South: 1/23/15 ** 8 23 35% 10 22 45% 23 30 77% 40% 9 17 26 15 13 1 8 20
67 ‐ 45 2 9 22% 11 21 52% 17 26 65% 43% 5 18 23 5 5 2 23 17
Laramie: 1/24/15 ** 1 14 7% 10 19 53% 20 24 83% 33% 6 15 21 4 7 9 16
43 ‐ 37 4 12 33% 7 13 54% 11 16 69% 44% 3 14 17 2 6 14 20
East: 1/31/15 ** 9 24 38% 13 28 46% 8 15 53% 42% 14 21 35 11 7 18 24
61 ‐ 68 9 17 53% 12 31 39% 17 33 52% 44% 12 19 31 17 17 3 14 9
Central: 1/30/15 ** 8 20 40% 13 23 57% 7 10 70% 49% 8 15 23 11 12 1 10 14
57 ‐ 54 7 11 64% 16 27 59% 1 4 25% 61% 1 13 14 9 5 3 16 12
Gillette: 2/6/15 ** 11 24 46% 10 29 34% 21 24 88% 40% 14 21 35 7 7 3 13 24
74 ‐ 68 7 20 35% 13 29 45% 21 31 68% 41% 11 16 27 14 5 5 9 20
East: 2/13/15 ** 9 26 35% 13 30 43% 7 11 64% 39% 15 19 34 10 8 1 11 15
60 ‐ 54 OT 3 5 60% 18 40 45% 9 15 60% 47% 7 21 28 18 5 4 9 16
Central: 2/14/15 ** 11 38 29% 3 19 16% 3 4 75% 25% 19 16 35 9 6 9 22
42 ‐ 48 2 8 25% 9 25 36% 24 32 75% 33% 10 19 29 2 7 1 12 10
Laramie: 2/20/15 ** 8 20 40% 16 32 50% 19 24 79% 46% 9 16 25 14 2 1 5 23
75 ‐ 64 2 10 20% 19 37 51% 20 29 69% 45% 11 15 26 6 2 2 8 22
South: 2/21/15 ** 11 23 48% 9 18 50% 7 11 64% 49% 12 20 32 12 7 5 12 15
58 ‐ 49 4 15 27% 15 31 48% 7 12 58% 41% 8 12 20 11 10 2 12 15
Gillette: 2/27/15 ** 8 25 32% 15 36 42% 3 3 100% 38% 17 16 33 3 4 1 11 22
57 ‐ 69 5 17 29% 16 35 46% 22 27 81% 40% 17 22 39 11 5 5 9 14
Central: 3/6/15 6 23 26% 9 27 33% 10 13 77% 30% 12 19 31 4 7 8 15
46 ‐ 43 2 14 14% 17 35 49% 3 5 60% 39% 11 22 33 7 7 3 17 17
Gillette: 3/7/15 6 22 27% 15 33 45% 16 21 76% 38% 16 25 41 11 5 1 13 27
64 ‐ 66 7 18 39% 11 23 48% 23 37 62% 44% 7 22 29 13 9 4 10 18
Kelly Walsh: 3/12/15 5 27 19% 5 22 23% 16 25 64% 20% 6 20 26 2 2 7 26
41 ‐ 58 4 12 33% 14 33 42% 18 30 60% 40% 10 34 44 9 3 4 7 26
Central: 3/13/15 6 25 24% 10 29 34% 12 22 55% 30% 10 22 32 5 4 8 20
50 ‐ 51 4 16 35 46% 19 25 76% 41% 3 22 25 4 4 7 7 16
29 ‐‐ D Daniels, 13 15 ‐‐ K Clark, 4 3 ‐‐ D Daniels, 13
11 ‐‐ D Daniels, 13: B
Godwin, 31
10 ‐‐ K Clark, 4 4 ‐‐ B Baker, 34
7 ‐‐ K Clark, 4: B
Godwin, 31
14 ‐‐ K Clark, 4 1 ‐‐ D Daniels, 13: B Godwin,
31: B Baker, 34
17 ‐‐ B Godwin, 31 10 ‐‐ K Clark, 4 5 ‐‐ B Godwin, 31
17 ‐‐ D Daniels, 13 10 ‐‐ K Clark, 4 1 ‐‐ Z Campbell, 1: D Daniels,
13: B Godwin, 31: B Baker, 34
21 ‐‐ D Daniels, 13 10 ‐‐ K Clark, 4 6 ‐‐ D Daniels, 13
11 ‐‐ Z Campbell, 1: C
Steel, 12
9 ‐‐ K Clark, 4 4 ‐‐ B Godwin, 31
15 ‐‐ D Daniels, 13 9 ‐‐ K Clark, 4 4 ‐‐ C Steel, 12: D Daniels, 13
22 ‐‐ B Godwin, 31 12 ‐‐ K Clark, 4 4 ‐‐ D Daniels, 13
21 ‐‐ B Godwin, 31 11 ‐‐ K Clark, 4 3 ‐‐ C Williams, 2: D Daniels,
13
15 ‐‐ D Daniels, 13 6 ‐‐ K Clark, 4: C Steel,
12
4 ‐‐ D Daniels, 13
28 ‐‐ B Godwin, 31 8 ‐‐ K Clark, 4 3 ‐‐ B Godwin, 31
20 ‐‐ D Daniels, 13 16 ‐‐ K Clark, 4 1 ‐‐ C Williams, 2: D Daniels,
13: B Baker, 34
21 ‐‐ D Daniels, 13 10 ‐‐ B Baker, 34 2 ‐‐ D Daniels, 13
25 ‐‐ B Godwin, 31 7 ‐‐ K Clark, 4: B
Baker, 34
7 ‐‐ D Daniels, 13
16 ‐‐ B Godwin, 31 15 ‐‐ K Clark, 4 3 ‐‐ K Clark, 4
13 ‐‐ D Daniels, 13 8 ‐‐ K Clark, 4 2 ‐‐ B Godwin, 31
18 ‐‐ B Godwin, 31 17 ‐‐ K Clark, 4 3 ‐‐ B Godwin, 31
20 ‐‐ D Daniels, 13 9 ‐‐ K Clark, 4 1 ‐‐ C Williams, 2: C Steel, 12
www.wyopreps.com
Home for High School StatsWyoming High School Basketball ‐ 4A BB2014 ‐ 2015 Season

4A BB East22 9 13 2 8
PLAYER,# GP 3FGM 3FGA 3FG % 2FGM 2FGA 2FG % FTM FTA FT % PTSOFF
REB
DEF
REBREB AST STL BLK TO'S FOUL
PTS /
GM
O REB
/GM
D REB
/GM
REB /
GM
AST /
GM
STL /
GM
BLK /
GM
TO'S /
GM
FOUL
/ GM
Michael Debruyn, 2 22 28 89 31% 70 146 48% 75 105 71% 299 13 48 61 37 56 2 58 70 13.6 0.6 2.2 2.8 1.7 2.5 0.1 2.6 3.2
Marquez Jefferson, 3 22 32 66 48% 32 79 41% 43 58 74% 203 5 55 60 55 43 1 58 55 9.2 0.2 2.5 2.7 2.5 2.0 0.0 2.6 2.5
Austin Smith, 4 6 2 1 2 2 1 1 4 0.3 0.3 0.2 0.2 0.7
Matt Romero, 5 5 2 2 100% 2 1 1 1 0.4 0.2 0.2 0.2
Florencio Beltran, 11 22 5 26 19% 9 21 43% 4 6 67% 37 9 24 33 10 12 3 27 40 1.7 0.4 1.1 1.5 0.5 0.5 0.1 1.2 1.8
Riley Haberkorn, 12
Brendyn Nelson, 13 22 5 16 31% 44 91 48% 26 52 50% 129 25 52 77 22 25 7 44 29 5.9 1.1 2.4 3.5 1.0 1.1 0.3 2.0 1.3
D'Antae Mccray, 14 11 4 10 40% 3 21 14% 5 8 63% 23 2 12 14 4 8 14 9 2.1 0.2 1.1 1.3 0.4 0.7 1.3 0.8
Chris Smith, 15 2
Dre Mccray, 22 2 1 2 50% 3 1 1 1 2 1.5 0.5 0.5 0.5 1.0
Austin Barker, 24 22 19 52 37% 9 29 31% 34 47 72% 109 4 26 30 16 12 35 40 5.0 0.2 1.2 1.4 0.7 0.5 1.6 1.8
Richard Blackwell, 30 16 2 9 22% 85 151 56% 80 110 73% 256 34 54 88 11 18 3 57 41 16.0 2.1 3.4 5.5 0.7 1.1 0.2 3.6 2.6
Tyreese Reed, 33
Gabe Mcdonald, 34 13 4 7 10 70% 3 5 60% 17 1 6 7 3 3 6 6 1.3 0.1 0.5 0.5 0.2 0.2 0.5 0.5
Shane Dilsaver, 35 22 2 8 24 33% 6 10 60% 22 25 46 71 29 13 23 69 1.0 1.1 2.1 3.2 1.3 0.6 1.0 3.1
Isaiah Dicks, 41 22 1 7 14% 22 53 42% 15 25 60% 62 25 36 61 5 13 13 24 20 2.8 1.1 1.6 2.8 0.2 0.6 0.6 1.1 0.9
Keyshawn Farmer, 43 9 3 1 2 50% 3 4 75% 5 2 2 4 1 1 2 3 0.6 0.2 0.2 0.4 0.1 0.1 0.2 0.3
Devin Douglass, 44 3 1 3 12 25% 3 6 50% 9 2 6 8 1 1 1 6 3.0 0.7 2.0 2.7 0.3 0.3 0.3 2.0
Team Totals 22 97 287 34% 293 641 46% 299 439 68% 1176 148 370 518 195 207 29 354 390 53.5 6.7 16.8 23.5 8.9 9.4 1.3 16.1 17.7
Opponent Totals 19 106 326 33% 266 523 51% 236 334 71% 1244 180 323 503 231 167 43 248 349 56.5 9.5 17.0 26.5 12.2 8.8 2.3 13.1 18.4
Peak Performances
Points
Lowest Opp Points
FG%
FT%
Rebounds
Assists
Steals
Blocked Shots
Most Opp TO's
Season Recap ** Indicates Conference Game
Opponent: Score 3FG 3FGA 3FG % 2FG 2FGA 2FG % FT FTA FT % FG % O REB D REB REB AST STL BLK TO'S FOUL
Kelly Walsh: 12/11/14 3 10 30% 9 33 27% 4 7 57% 28% 3 12 15 7 6 10 17
31 ‐ 60 7 21 33% 16 26 62% 7 14 50% 49% 13 22 35 11 6 4 8 16
Evanston: 12/12/14 2 11 18% 16 27 59% 27 35 77% 47% 5 28 33 7 12 1 18 20
65 ‐ 47 3 20 15% 13 29 45% 12 20 60% 33% 8 15 23 13 4 11 30
Riverton: 12/13/14 3 14 21% 10 38 26% 13 23 57% 25% 14 11 25 6 12 1 10 16
42 ‐ 63 9 17 53% 13 23 57% 10 12 83% 55% 6 28 34 19 4 1 14 17
Montrose CO: 12/18/14 3 15 20% 11 28 39% 21 26 81% 33% 6 13 19 11 15 3 14 15
52 ‐ 49 OT
Parker Lutheran CO: 12/19/14 8 20 40% 7 24 29% 15 22 68% 34% 7 14 21 8 3 1 9 20
53 ‐ 64
South Bison Overall Record 9 ‐ 13 Conference Record 2 ‐ 8
Team Best Opponent Individual Best Player, # Opponent
79 Central 34 R Blackwell, 30 Riverton
28 Green River
62% Central 87% R Blackwell, 30 Riverton
90% Riverton 100% A Barker, 24: R Blackwell, 30 Riverton: Gillette
35 Palisade CO 12 R Blackwell, 30 Riverton
14 Rock Springs 6 M Debruyn, 2: M Jefferson, 3 Rock Springs: Central
18 Green River 6 B Nelson, 13: M Debruyn, 2: M Debruyn, 2 Green River: Central: Central
4 Laramie 4 I Dicks, 41 Laramie
POINTS REB AST
10 ‐‐ B Nelson, 13 4 ‐‐ S Dilsaver, 35 2 ‐‐ M Jefferson, 3
22 Green River
Defensive Stats PEAK PERFORMERS
22 ‐‐ R Blackwell, 30 6 ‐‐ S Dilsaver, 35 3 ‐‐ M Jefferson, 3: B Nelson,
13
18 ‐‐ M Debruyn, 2 3 ‐‐ M Debruyn, 2: F
Beltran, 11: B Nelson,
3 ‐‐ M Jefferson, 3
18 ‐‐ R Blackwell, 30 7 ‐‐ M Debruyn, 2: M
Jefferson, 3
2 ‐‐ M Debruyn, 2: B Nelson,
13
9 ‐‐ M Debruyn, 2: M
Jefferson, 3
5 ‐‐ M Debruyn, 2 2 ‐‐ M Jefferson, 3
www.wyopreps.com
Home for High School StatsWyoming High School Basketball ‐ 4A BB2014 ‐ 2015 Season
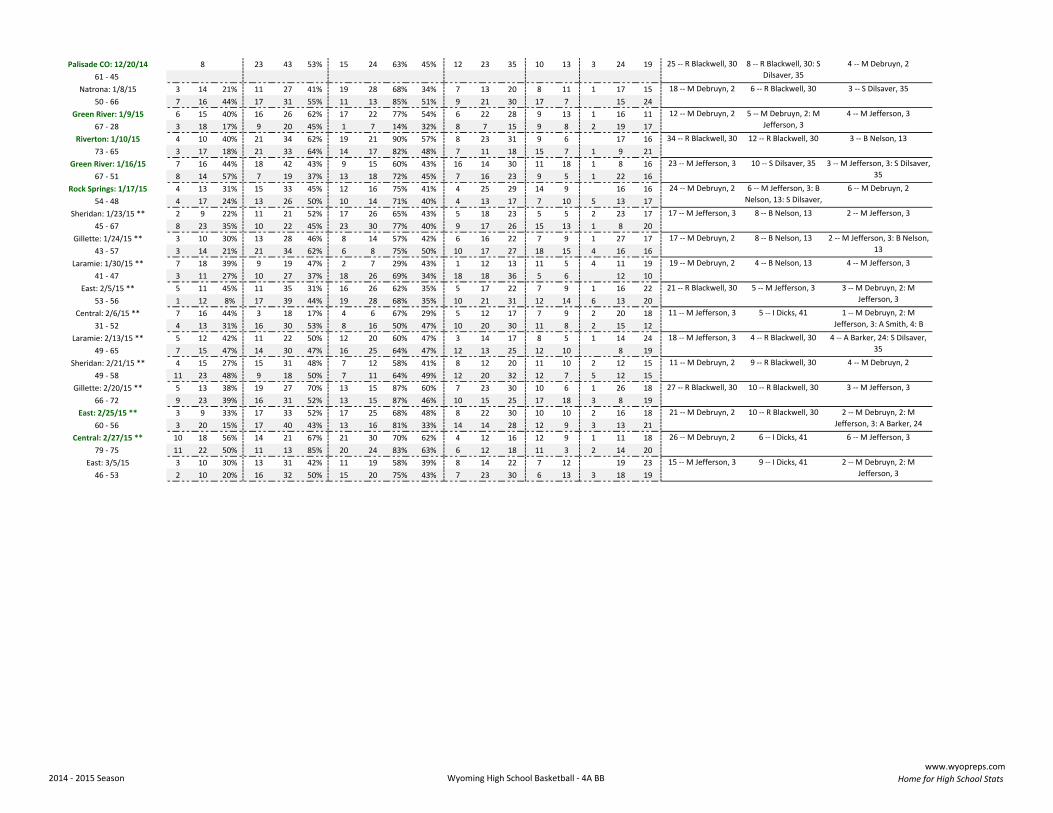
Palisade CO: 12/20/14 8 23 43 53% 15 24 63% 45% 12 23 35 10 13 3 24 19
61 ‐ 45
Natrona: 1/8/15 3 14 21% 11 27 41% 19 28 68% 34% 7 13 20 8 11 1 17 15
50 ‐ 66 7 16 44% 17 31 55% 11 13 85% 51% 9 21 30 17 7 15 24
Green River: 1/9/15 6 15 40% 16 26 62% 17 22 77% 54% 6 22 28 9 13 1 16 11
67 ‐ 28 3 18 17% 9 20 45% 1 7 14% 32% 8 7 15 9 8 2 19 17
Riverton: 1/10/15 4 10 40% 21 34 62% 19 21 90% 57% 8 23 31 9 6 17 16
73 ‐ 65 3 17 18% 21 33 64% 14 17 82% 48% 7 11 18 15 7 1 9 21
Green River: 1/16/15 7 16 44% 18 42 43% 9 15 60% 43% 16 14 30 11 18 1 8 16
67 ‐ 51 8 14 57% 7 19 37% 13 18 72% 45% 7 16 23 9 5 1 22 16
Rock Springs: 1/17/15 4 13 31% 15 33 45% 12 16 75% 41% 4 25 29 14 9 16 16
54 ‐ 48 4 17 24% 13 26 50% 10 14 71% 40% 4 13 17 7 10 5 13 17
Sheridan: 1/23/15 ** 2 9 22% 11 21 52% 17 26 65% 43% 5 18 23 5 5 2 23 17
45 ‐ 67 8 23 35% 10 22 45% 23 30 77% 40% 9 17 26 15 13 1 8 20
Gillette: 1/24/15 ** 3 10 30% 13 28 46% 8 14 57% 42% 6 16 22 7 9 1 27 17
43 ‐ 57 3 14 21% 21 34 62% 6 8 75% 50% 10 17 27 18 15 4 16 16
Laramie: 1/30/15 ** 7 18 39% 9 19 47% 2 7 29% 43% 1 12 13 11 5 4 11 19
41 ‐ 47 3 11 27% 10 27 37% 18 26 69% 34% 18 18 36 5 6 12 10
East: 2/5/15 ** 5 11 45% 11 35 31% 16 26 62% 35% 5 17 22 7 9 1 16 22
53 ‐ 56 1 12 8% 17 39 44% 19 28 68% 35% 10 21 31 12 14 6 13 20
Central: 2/6/15 ** 7 16 44% 3 18 17% 4 6 67% 29% 5 12 17 7 9 2 20 18
31 ‐ 52 4 13 31% 16 30 53% 8 16 50% 47% 10 20 30 11 8 2 15 12
Laramie: 2/13/15 ** 5 12 42% 11 22 50% 12 20 60% 47% 3 14 17 8 5 1 14 24
49 ‐ 65 7 15 47% 14 30 47% 16 25 64% 47% 12 13 25 12 10 8 19
Sheridan: 2/21/15 ** 4 15 27% 15 31 48% 7 12 58% 41% 8 12 20 11 10 2 12 15
49 ‐ 58 11 23 48% 9 18 50% 7 11 64% 49% 12 20 32 12 7 5 12 15
Gillette: 2/20/15 ** 5 13 38% 19 27 70% 13 15 87% 60% 7 23 30 10 6 1 26 18
66 ‐ 72 9 23 39% 16 31 52% 13 15 87% 46% 10 15 25 17 18 3 8 19
East: 2/25/15 ** 3 9 33% 17 33 52% 17 25 68% 48% 8 22 30 10 10 2 16 18
60 ‐ 56 3 20 15% 17 40 43% 13 16 81% 33% 14 14 28 12 9 3 13 21
Central: 2/27/15 ** 10 18 56% 14 21 67% 21 30 70% 62% 4 12 16 12 9 1 11 18
79 ‐ 75 11 22 50% 11 13 85% 20 24 83% 63% 6 12 18 11 3 2 14 20
East: 3/5/15 3 10 30% 13 31 42% 11 19 58% 39% 8 14 22 7 12 19 23
46 ‐ 53 2 10 20% 16 32 50% 15 20 75% 43% 7 23 30 6 13 3 18 19
12 ‐‐ M Debruyn, 2 5 ‐‐ M Debruyn, 2: M
Jefferson, 3
4 ‐‐ M Jefferson, 3
34 ‐‐ R Blackwell, 30 12 ‐‐ R Blackwell, 30 3 ‐‐ B Nelson, 13
25 ‐‐ R Blackwell, 30 8 ‐‐ R Blackwell, 30: S
Dilsaver, 35
4 ‐‐ M Debruyn, 2
18 ‐‐ M Debruyn, 2 6 ‐‐ R Blackwell, 30 3 ‐‐ S Dilsaver, 35
17 ‐‐ M Jefferson, 3 8 ‐‐ B Nelson, 13 2 ‐‐ M Jefferson, 3
17 ‐‐ M Debruyn, 2 8 ‐‐ B Nelson, 13 2 ‐‐ M Jefferson, 3: B Nelson,
13
23 ‐‐ M Jefferson, 3 10 ‐‐ S Dilsaver, 35 3 ‐‐ M Jefferson, 3: S Dilsaver,
35
24 ‐‐ M Debruyn, 2 6 ‐‐ M Jefferson, 3: B
Nelson, 13: S Dilsaver,
6 ‐‐ M Debruyn, 2
11 ‐‐ M Jefferson, 3 5 ‐‐ I Dicks, 41 1 ‐‐ M Debruyn, 2: M
Jefferson, 3: A Smith, 4: B
18 ‐‐ M Jefferson, 3 4 ‐‐ R Blackwell, 30 4 ‐‐ A Barker, 24: S Dilsaver,
35
19 ‐‐ M Debruyn, 2 4 ‐‐ B Nelson, 13 4 ‐‐ M Jefferson, 3
21 ‐‐ R Blackwell, 30 5 ‐‐ M Jefferson, 3 3 ‐‐ M Debruyn, 2: M
Jefferson, 3
21 ‐‐ M Debruyn, 2 10 ‐‐ R Blackwell, 30 2 ‐‐ M Debruyn, 2: M
Jefferson, 3: A Barker, 24
26 ‐‐ M Debruyn, 2 6 ‐‐ I Dicks, 41 6 ‐‐ M Jefferson, 3
11 ‐‐ M Debruyn, 2 9 ‐‐ R Blackwell, 30 4 ‐‐ M Debruyn, 2
27 ‐‐ R Blackwell, 30 10 ‐‐ R Blackwell, 30 3 ‐‐ M Jefferson, 3
15 ‐‐ M Jefferson, 3 9 ‐‐ I Dicks, 41 2 ‐‐ M Debruyn, 2: M
Jefferson, 3
www.wyopreps.com
Home for High School StatsWyoming High School Basketball ‐ 4A BB2014 ‐ 2015 Season