Embed Size (px)
Citation preview
Liberal Arts Mathematics 1 Curriculum Map
2014 - 2015
Mathematics Florida Standards Volusia County Curriculum Maps are revised annually and updated throughout the year.
The learning goals are a work in progress and may be modified as needed.
Mathematics Department Liberal Arts Mathematics Curriculum Map Volusia County Schools May 2014
Florida Standards Standards for Mathematical Practice
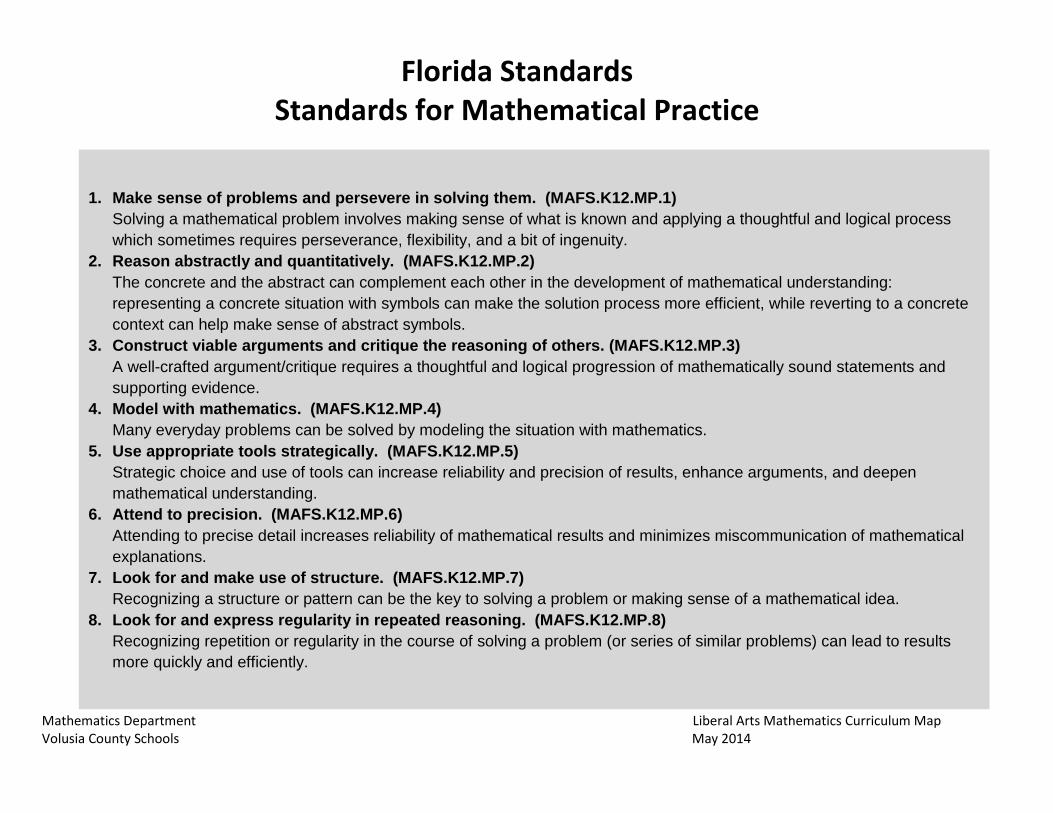
1. Make sense of problems and persevere in solving them. (MAFS.K12.MP.1) Solving a mathematical problem involves making sense of what is known and applying a thoughtful and logical process which sometimes requires perseverance, flexibility, and a bit of ingenuity.
2. Reason abstractly and quantitatively. (MAFS.K12.MP.2) The concrete and the abstract can complement each other in the development of mathematical understanding: representing a concrete situation with symbols can make the solution process more efficient, while reverting to a concrete context can help make sense of abstract symbols.
3. Construct viable arguments and critique the reasoning of others. (MAFS.K12.MP.3) A well-crafted argument/critique requires a thoughtful and logical progression of mathematically sound statements and supporting evidence.
4. Model with mathematics. (MAFS.K12.MP.4) Many everyday problems can be solved by modeling the situation with mathematics.
5. Use appropriate tools strategically. (MAFS.K12.MP.5) Strategic choice and use of tools can increase reliability and precision of results, enhance arguments, and deepen mathematical understanding.
6. Attend to precision. (MAFS.K12.MP.6) Attending to precise detail increases reliability of mathematical results and minimizes miscommunication of mathematical explanations.
7. Look for and make use of structure. (MAFS.K12.MP.7) Recognizing a structure or pattern can be the key to solving a problem or making sense of a mathematical idea.
8. Look for and express regularity in repeated reasoning. (MAFS.K12.MP.8) Recognizing repetition or regularity in the course of solving a problem (or series of similar problems) can lead to results more quickly and efficiently.
Mathematics Department Liberal Arts Mathematics Curriculum Map Volusia County Schools May 2014
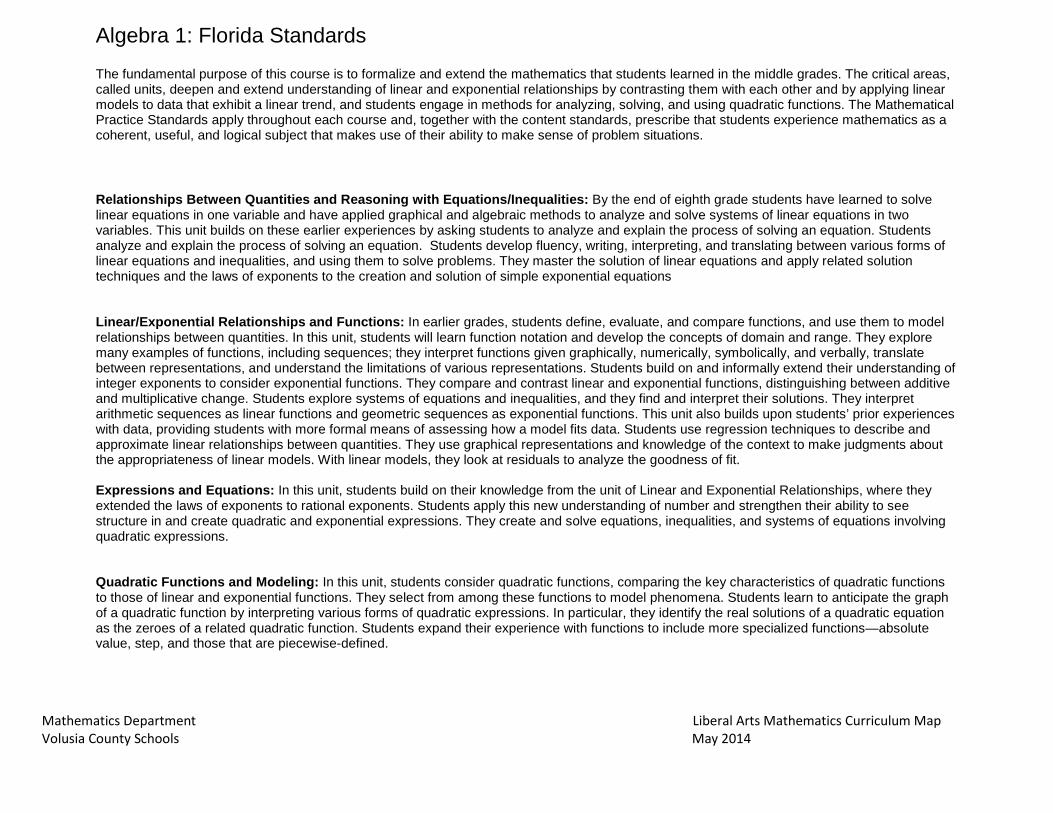
Algebra 1: Florida Standards
The fundamental purpose of this course is to formalize and extend the mathematics that students learned in the middle grades. The critical areas, called units, deepen and extend understanding of linear and exponential relationships by contrasting them with each other and by applying linear models to data that exhibit a linear trend, and students engage in methods for analyzing, solving, and using quadratic functions. The Mathematical Practice Standards apply throughout each course and, together with the content standards, prescribe that students experience mathematics as a coherent, useful, and logical subject that makes use of their ability to make sense of problem situations.
Relationships Between Quantities and Reasoning with Equations/Inequalities: By the end of eighth grade students have learned to solve linear equations in one variable and have applied graphical and algebraic methods to analyze and solve systems of linear equations in two variables. This unit builds on these earlier experiences by asking students to analyze and explain the process of solving an equation. Students analyze and explain the process of solving an equation. Students develop fluency, writing, interpreting, and translating between various forms of linear equations and inequalities, and using them to solve problems. They master the solution of linear equations and apply related solution techniques and the laws of exponents to the creation and solution of simple exponential equations Linear/Exponential Relationships and Functions: In earlier grades, students define, evaluate, and compare functions, and use them to model relationships between quantities. In this unit, students will learn function notation and develop the concepts of domain and range. They explore many examples of functions, including sequences; they interpret functions given graphically, numerically, symbolically, and verbally, translate between representations, and understand the limitations of various representations. Students build on and informally extend their understanding of integer exponents to consider exponential functions. They compare and contrast linear and exponential functions, distinguishing between additive and multiplicative change. Students explore systems of equations and inequalities, and they find and interpret their solutions. They interpret arithmetic sequences as linear functions and geometric sequences as exponential functions. This unit also builds upon students’ prior experiences with data, providing students with more formal means of assessing how a model fits data. Students use regression techniques to describe and approximate linear relationships between quantities. They use graphical representations and knowledge of the context to make judgments about the appropriateness of linear models. With linear models, they look at residuals to analyze the goodness of fit. Expressions and Equations: In this unit, students build on their knowledge from the unit of Linear and Exponential Relationships, where they extended the laws of exponents to rational exponents. Students apply this new understanding of number and strengthen their ability to see structure in and create quadratic and exponential expressions. They create and solve equations, inequalities, and systems of equations involving quadratic expressions. Quadratic Functions and Modeling: In this unit, students consider quadratic functions, comparing the key characteristics of quadratic functions to those of linear and exponential functions. They select from among these functions to model phenomena. Students learn to anticipate the graph of a quadratic function by interpreting various forms of quadratic expressions. In particular, they identify the real solutions of a quadratic equation as the zeroes of a related quadratic function. Students expand their experience with functions to include more specialized functions—absolute value, step, and those that are piecewise-defined.
Mathematics Department Liberal Arts Mathematics Curriculum Map Volusia County Schools May 2014
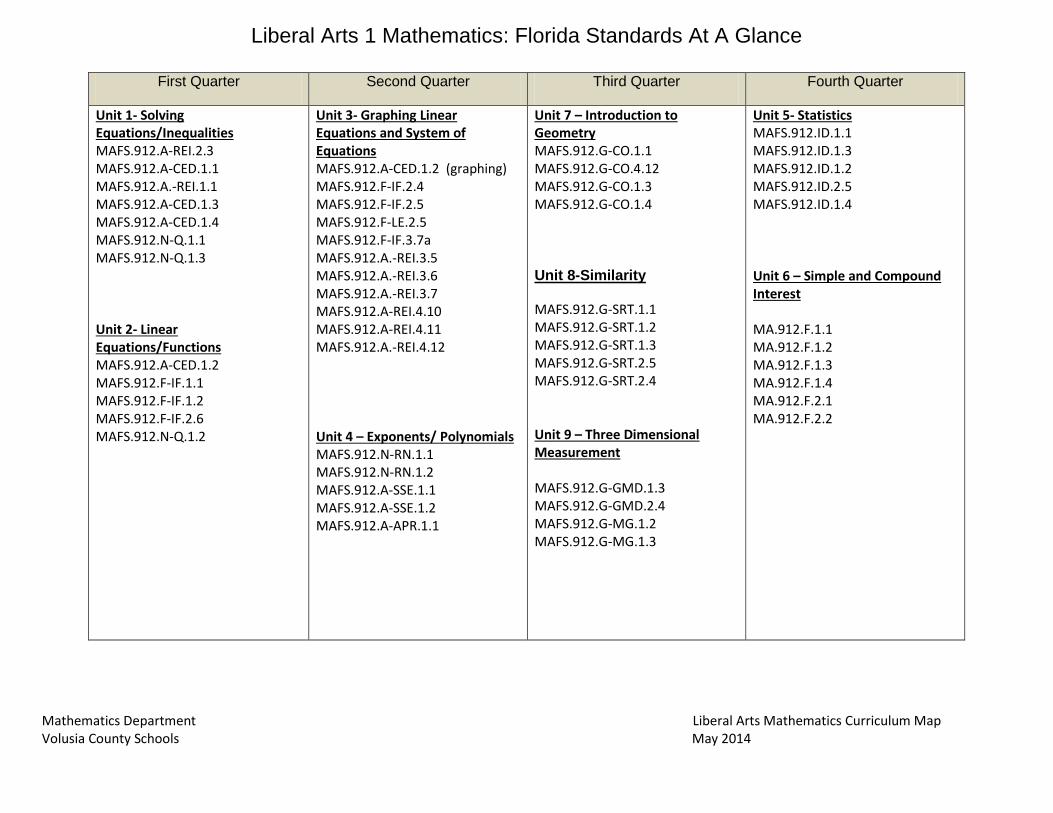
Liberal Arts 1 Mathematics: Florida Standards At A Glance
First Quarter Second Quarter Third Quarter Fourth Quarter
Unit 1- Solving Equations/Inequalities MAFS.912.A-REI.2.3 MAFS.912.A-CED.1.1 MAFS.912.A.-REI.1.1 MAFS.912.A-CED.1.3 MAFS.912.A-CED.1.4 MAFS.912.N-Q.1.1 MAFS.912.N-Q.1.3 Unit 2- Linear Equations/Functions MAFS.912.A-CED.1.2 MAFS.912.F-IF.1.1 MAFS.912.F-IF.1.2 MAFS.912.F-IF.2.6 MAFS.912.N-Q.1.2
Unit 3- Graphing Linear Equations and System of Equations MAFS.912.A-CED.1.2 (graphing) MAFS.912.F-IF.2.4 MAFS.912.F-IF.2.5 MAFS.912.F-LE.2.5 MAFS.912.F-IF.3.7a MAFS.912.A.-REI.3.5 MAFS.912.A.-REI.3.6 MAFS.912.A.-REI.3.7 MAFS.912.A-REI.4.10 MAFS.912.A-REI.4.11 MAFS.912.A.-REI.4.12
Unit 4 – Exponents/ Polynomials MAFS.912.N-RN.1.1 MAFS.912.N-RN.1.2 MAFS.912.A-SSE.1.1 MAFS.912.A-SSE.1.2 MAFS.912.A-APR.1.1
Unit 7 – Introduction to Geometry MAFS.912.G-CO.1.1 MAFS.912.G-CO.4.12 MAFS.912.G-CO.1.3 MAFS.912.G-CO.1.4 Unit 8-Similarity MAFS.912.G-SRT.1.1 MAFS.912.G-SRT.1.2 MAFS.912.G-SRT.1.3 MAFS.912.G-SRT.2.5 MAFS.912.G-SRT.2.4 Unit 9 – Three Dimensional Measurement MAFS.912.G-GMD.1.3 MAFS.912.G-GMD.2.4 MAFS.912.G-MG.1.2 MAFS.912.G-MG.1.3
Unit 5- Statistics MAFS.912.ID.1.1 MAFS.912.ID.1.3 MAFS.912.ID.1.2 MAFS.912.ID.2.5 MAFS.912.ID.1.4 Unit 6 – Simple and Compound Interest MA.912.F.1.1 MA.912.F.1.2 MA.912.F.1.3 MA.912.F.1.4 MA.912.F.2.1 MA.912.F.2.2
Mathematics Department Liberal Arts Mathematics Curriculum Map Volusia County Schools May 2014
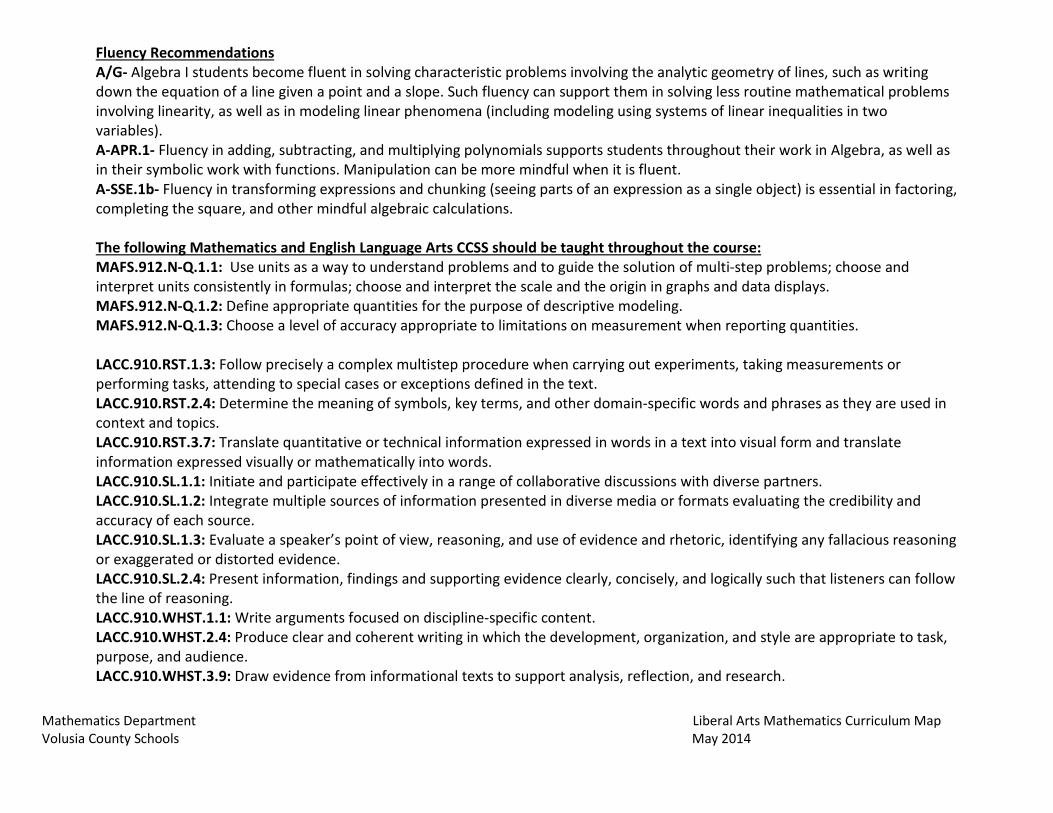
Fluency Recommendations A/G- Algebra I students become fluent in solving characteristic problems involving the analytic geometry of lines, such as writing down the equation of a line given a point and a slope. Such fluency can support them in solving less routine mathematical problems involving linearity, as well as in modeling linear phenomena (including modeling using systems of linear inequalities in two variables). A-APR.1- Fluency in adding, subtracting, and multiplying polynomials supports students throughout their work in Algebra, as well as in their symbolic work with functions. Manipulation can be more mindful when it is fluent. A-SSE.1b- Fluency in transforming expressions and chunking (seeing parts of an expression as a single object) is essential in factoring, completing the square, and other mindful algebraic calculations. The following Mathematics and English Language Arts CCSS should be taught throughout the course: MAFS.912.N-Q.1.1: Use units as a way to understand problems and to guide the solution of multi-step problems; choose and interpret units consistently in formulas; choose and interpret the scale and the origin in graphs and data displays. MAFS.912.N-Q.1.2: Define appropriate quantities for the purpose of descriptive modeling. MAFS.912.N-Q.1.3: Choose a level of accuracy appropriate to limitations on measurement when reporting quantities. LACC.910.RST.1.3: Follow precisely a complex multistep procedure when carrying out experiments, taking measurements or performing tasks, attending to special cases or exceptions defined in the text. LACC.910.RST.2.4: Determine the meaning of symbols, key terms, and other domain-specific words and phrases as they are used in context and topics. LACC.910.RST.3.7: Translate quantitative or technical information expressed in words in a text into visual form and translate information expressed visually or mathematically into words. LACC.910.SL.1.1: Initiate and participate effectively in a range of collaborative discussions with diverse partners. LACC.910.SL.1.2: Integrate multiple sources of information presented in diverse media or formats evaluating the credibility and accuracy of each source. LACC.910.SL.1.3: Evaluate a speaker’s point of view, reasoning, and use of evidence and rhetoric, identifying any fallacious reasoning or exaggerated or distorted evidence. LACC.910.SL.2.4: Present information, findings and supporting evidence clearly, concisely, and logically such that listeners can follow the line of reasoning. LACC.910.WHST.1.1: Write arguments focused on discipline-specific content. LACC.910.WHST.2.4: Produce clear and coherent writing in which the development, organization, and style are appropriate to task, purpose, and audience. LACC.910.WHST.3.9: Draw evidence from informational texts to support analysis, reflection, and research.
Mathematics Department Liberal Arts Mathematics Curriculum Map Volusia County Schools May 2014
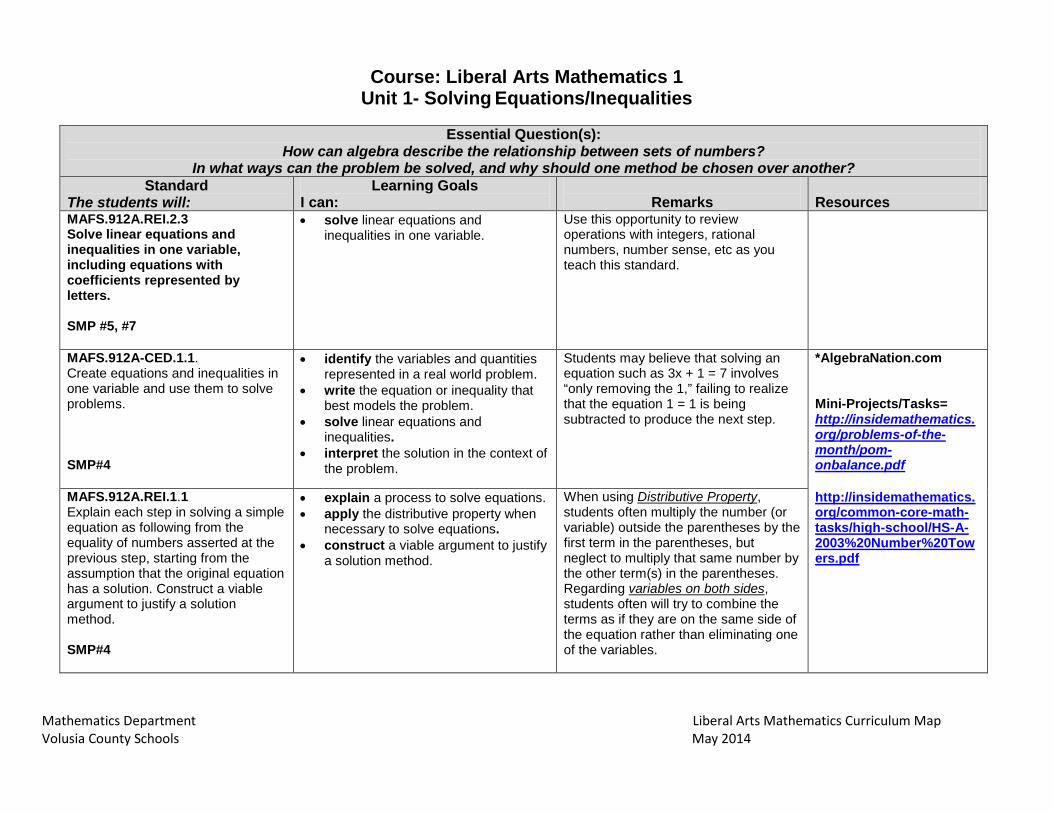
Course: Liberal Arts Mathematics 1 Unit 1- Solving Equations/Inequalities
Essential Question(s): How can algebra describe the relationship between sets of numbers?
In what ways can the problem be solved, and why should one method be chosen over another? Standard
The students will: Learning Goals
I can:
Remarks Resources
MAFS.912A.REI.2.3 Solve linear equations and inequalities in one variable, including equations with coefficients represented by letters. SMP #5, #7
• solve linear equations and inequalities in one variable.
Use this opportunity to review operations with integers, rational numbers, number sense, etc as you teach this standard.
MAFS.912A-CED.1.1. Create equations and inequalities in one variable and use them to solve problems. SMP#4
• identify the variables and quantities represented in a real world problem.
• write the equation or inequality that best models the problem.
• solve linear equations and inequalities.
• interpret the solution in the context of the problem.
Students may believe that solving an equation such as 3x + 1 = 7 involves “only removing the 1,” failing to realize that the equation 1 = 1 is being subtracted to produce the next step.
*AlgebraNation.com Mini-Projects/Tasks= http://insidemathematics.org/problems-of-the-month/pom-onbalance.pdf http://insidemathematics.org/common-core-math-tasks/high-school/HS-A-2003%20Number%20Towers.pdf
MAFS.912A.REI.1.1 Explain each step in solving a simple equation as following from the equality of numbers asserted at the previous step, starting from the assumption that the original equation has a solution. Construct a viable argument to justify a solution method. SMP#4
• explain a process to solve equations. • apply the distributive property when
necessary to solve equations. • construct a viable argument to justify
a solution method.
When using Distributive Property, students often multiply the number (or variable) outside the parentheses by the first term in the parentheses, but neglect to multiply that same number by the other term(s) in the parentheses. Regarding variables on both sides, students often will try to combine the terms as if they are on the same side of the equation rather than eliminating one of the variables.
Mathematics Department Liberal Arts Mathematics Curriculum Map Volusia County Schools May 2014
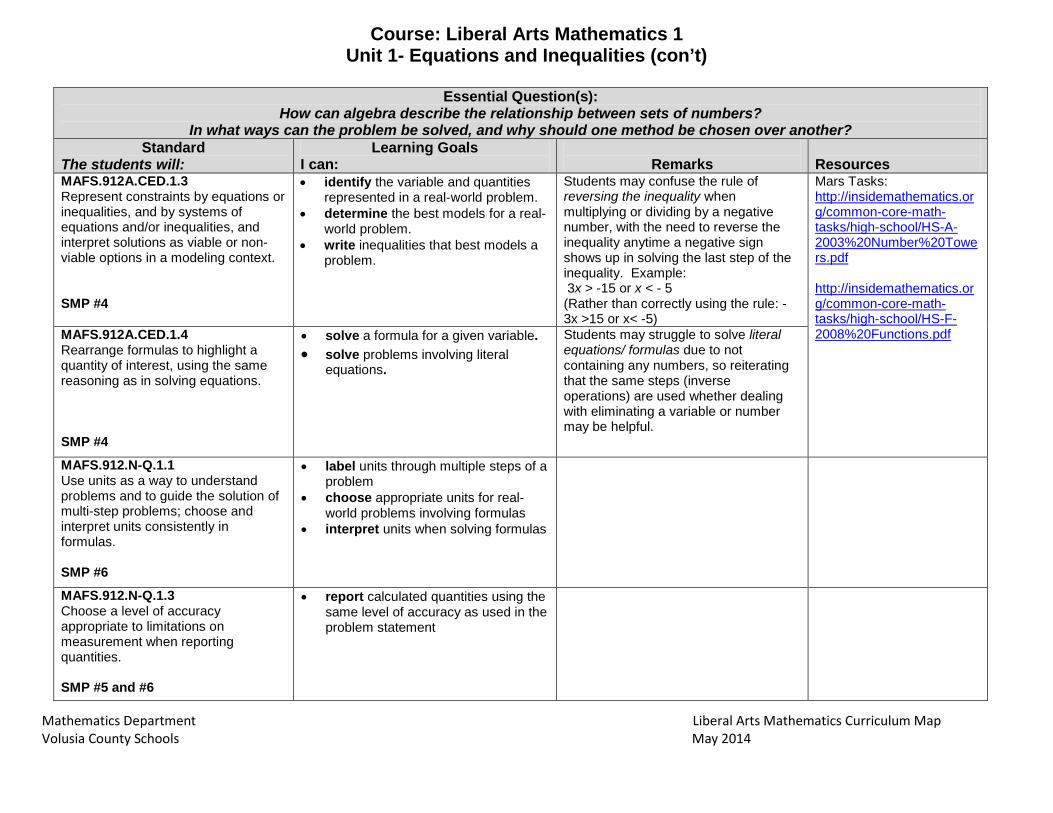
Course: Liberal Arts Mathematics 1 Unit 1- Equations and Inequalities (con’t)
Essential Question(s):
How can algebra describe the relationship between sets of numbers? In what ways can the problem be solved, and why should one method be chosen over another?
Standard The students will:
Learning Goals I can:
Remarks
Resources
MAFS.912A.CED.1.3 Represent constraints by equations or inequalities, and by systems of equations and/or inequalities, and interpret solutions as viable or non-viable options in a modeling context. SMP #4
• identify the variable and quantities represented in a real-world problem.
• determine the best models for a real-world problem.
• write inequalities that best models a problem.
Students may confuse the rule of reversing the inequality when multiplying or dividing by a negative number, with the need to reverse the inequality anytime a negative sign shows up in solving the last step of the inequality. Example: 3x > -15 or x < - 5 (Rather than correctly using the rule: -3x >15 or x< -5)
Mars Tasks: http://insidemathematics.org/common-core-math-tasks/high-school/HS-A-2003%20Number%20Towers.pdf http://insidemathematics.org/common-core-math-tasks/high-school/HS-F-2008%20Functions.pdf
MAFS.912A.CED.1.4 Rearrange formulas to highlight a quantity of interest, using the same reasoning as in solving equations. SMP #4
• solve a formula for a given variable. • solve problems involving literal
equations.
Students may struggle to solve literal equations/ formulas due to not containing any numbers, so reiterating that the same steps (inverse operations) are used whether dealing with eliminating a variable or number may be helpful.
MAFS.912.N-Q.1.1 Use units as a way to understand problems and to guide the solution of multi-step problems; choose and interpret units consistently in formulas. SMP #6
• label units through multiple steps of a problem
• choose appropriate units for real-world problems involving formulas
• interpret units when solving formulas
MAFS.912.N-Q.1.3 Choose a level of accuracy appropriate to limitations on measurement when reporting quantities. SMP #5 and #6
• report calculated quantities using the same level of accuracy as used in the problem statement
Mathematics Department Liberal Arts Mathematics Curriculum Map Volusia County Schools May 2014
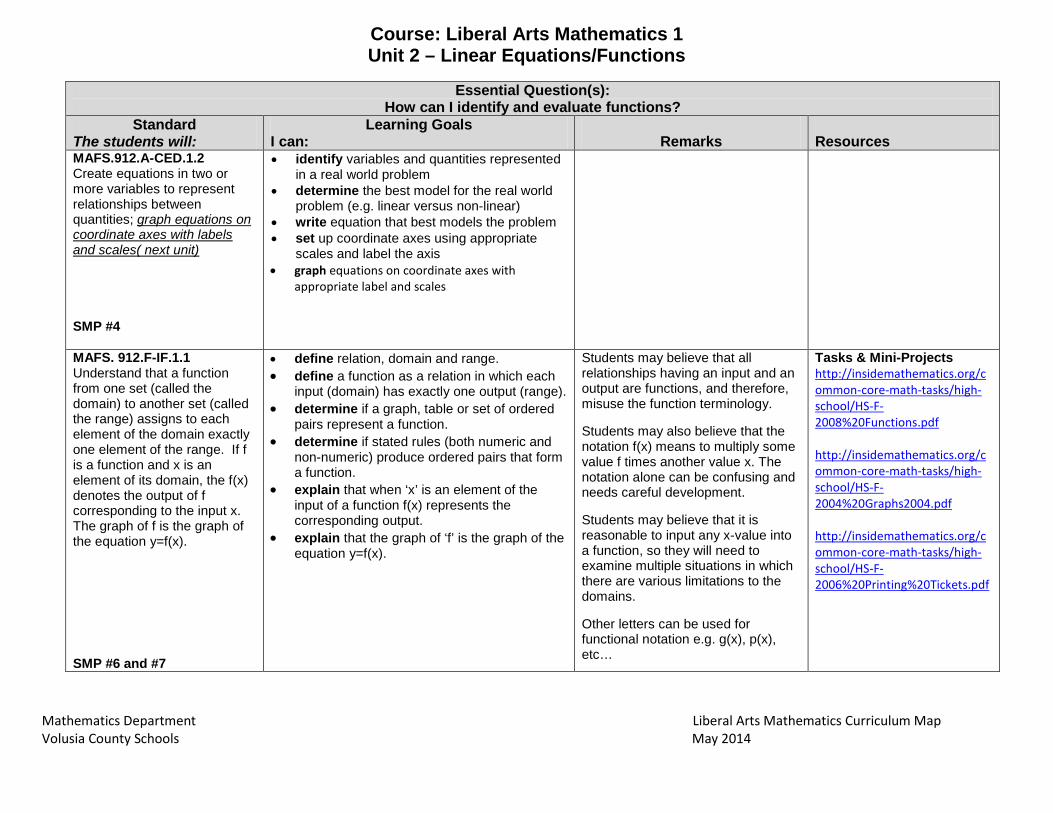
Course: Liberal Arts Mathematics 1 Unit 2 – Linear Equations/Functions
Essential Question(s):
How can I identify and evaluate functions? Standard
The students will: Learning Goals
I can:
Remarks Resources
MAFS.912.A-CED.1.2 Create equations in two or more variables to represent relationships between quantities; graph equations on coordinate axes with labels and scales( next unit) SMP #4
• identify variables and quantities represented in a real world problem
• determine the best model for the real world problem (e.g. linear versus non-linear)
• write equation that best models the problem • set up coordinate axes using appropriate
scales and label the axis • graph equations on coordinate axes with
appropriate label and scales
MAFS. 912.F-IF.1.1 Understand that a function from one set (called the domain) to another set (called the range) assigns to each element of the domain exactly one element of the range. If f is a function and x is an element of its domain, the f(x) denotes the output of f corresponding to the input x. The graph of f is the graph of the equation y=f(x). SMP #6 and #7
• define relation, domain and range. • define a function as a relation in which each
input (domain) has exactly one output (range). • determine if a graph, table or set of ordered
pairs represent a function. • determine if stated rules (both numeric and
non-numeric) produce ordered pairs that form a function.
• explain that when ‘x’ is an element of the input of a function f(x) represents the corresponding output.
• explain that the graph of ‘f’ is the graph of the equation y=f(x).
Students may believe that all relationships having an input and an output are functions, and therefore, misuse the function terminology. Students may also believe that the notation f(x) means to multiply some value f times another value x. The notation alone can be confusing and needs careful development. Students may believe that it is reasonable to input any x-value into a function, so they will need to examine multiple situations in which there are various limitations to the domains. Other letters can be used for functional notation e.g. g(x), p(x), etc…
Tasks & Mini-Projects http://insidemathematics.org/common-core-math-tasks/high-school/HS-F-2008%20Functions.pdf http://insidemathematics.org/common-core-math-tasks/high-school/HS-F-2004%20Graphs2004.pdf http://insidemathematics.org/common-core-math-tasks/high-school/HS-F-2006%20Printing%20Tickets.pdf
Mathematics Department Liberal Arts Mathematics Curriculum Map Volusia County Schools May 2014
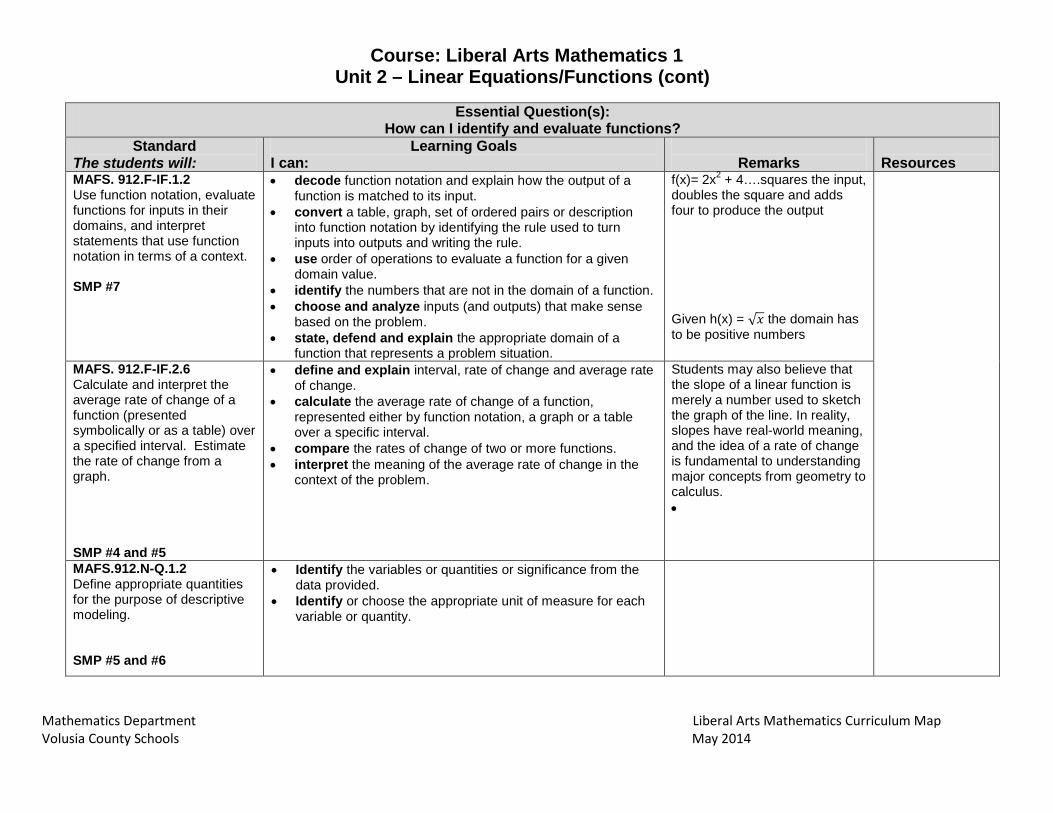
Course: Liberal Arts Mathematics 1
Unit 2 – Linear Equations/Functions (cont)
Essential Question(s): How can I identify and evaluate functions?
Standard The students will:
Learning Goals I can:
Remarks
Resources
MAFS. 912.F-IF.1.2 Use function notation, evaluate functions for inputs in their domains, and interpret statements that use function notation in terms of a context. SMP #7
• decode function notation and explain how the output of a function is matched to its input.
• convert a table, graph, set of ordered pairs or description into function notation by identifying the rule used to turn inputs into outputs and writing the rule.
• use order of operations to evaluate a function for a given domain value.
• identify the numbers that are not in the domain of a function. • choose and analyze inputs (and outputs) that make sense
based on the problem. • state, defend and explain the appropriate domain of a
function that represents a problem situation.
f(x)= 2x2 + 4….squares the input, doubles the square and adds four to produce the output Given h(x) = √𝑥 the domain has to be positive numbers
MAFS. 912.F-IF.2.6 Calculate and interpret the average rate of change of a function (presented symbolically or as a table) over a specified interval. Estimate the rate of change from a graph. SMP #4 and #5
• define and explain interval, rate of change and average rate of change.
• calculate the average rate of change of a function, represented either by function notation, a graph or a table over a specific interval.
• compare the rates of change of two or more functions. • interpret the meaning of the average rate of change in the
context of the problem.
Students may also believe that the slope of a linear function is merely a number used to sketch the graph of the line. In reality, slopes have real-world meaning, and the idea of a rate of change is fundamental to understanding major concepts from geometry to calculus. •
MAFS.912.N-Q.1.2 Define appropriate quantities for the purpose of descriptive modeling. SMP #5 and #6
• Identify the variables or quantities or significance from the data provided.
• Identify or choose the appropriate unit of measure for each variable or quantity.
Mathematics Department Liberal Arts Mathematics Curriculum Map Volusia County Schools May 2014
Course: Liberal Arts Mathematics 1
Unit 3 – Graphing Linear Equations and Systems of Equations
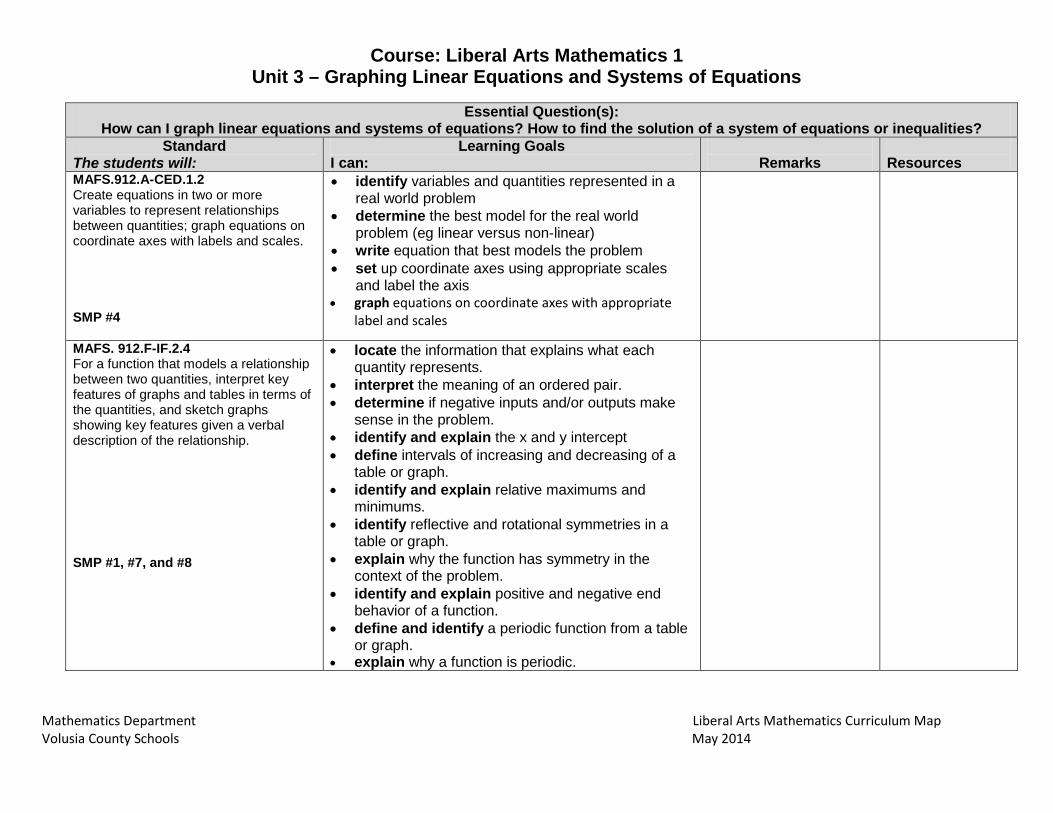
Essential Question(s): How can I graph linear equations and systems of equations? How to find the solution of a system of equations or inequalities?
Standard The students will:
Learning Goals I can:
Remarks
Resources
MAFS.912.A-CED.1.2 Create equations in two or more variables to represent relationships between quantities; graph equations on coordinate axes with labels and scales. SMP #4
• identify variables and quantities represented in a real world problem
• determine the best model for the real world problem (eg linear versus non-linear)
• write equation that best models the problem • set up coordinate axes using appropriate scales
and label the axis • graph equations on coordinate axes with appropriate
label and scales
MAFS. 912.F-IF.2.4 For a function that models a relationship between two quantities, interpret key features of graphs and tables in terms of the quantities, and sketch graphs showing key features given a verbal description of the relationship. SMP #1, #7, and #8
• locate the information that explains what each quantity represents.
• interpret the meaning of an ordered pair. • determine if negative inputs and/or outputs make
sense in the problem. • identify and explain the x and y intercept • define intervals of increasing and decreasing of a
table or graph. • identify and explain relative maximums and
minimums. • identify reflective and rotational symmetries in a
table or graph. • explain why the function has symmetry in the
context of the problem. • identify and explain positive and negative end
behavior of a function. • define and identify a periodic function from a table
or graph. • explain why a function is periodic.
Mathematics Department Liberal Arts Mathematics Curriculum Map Volusia County Schools May 2014
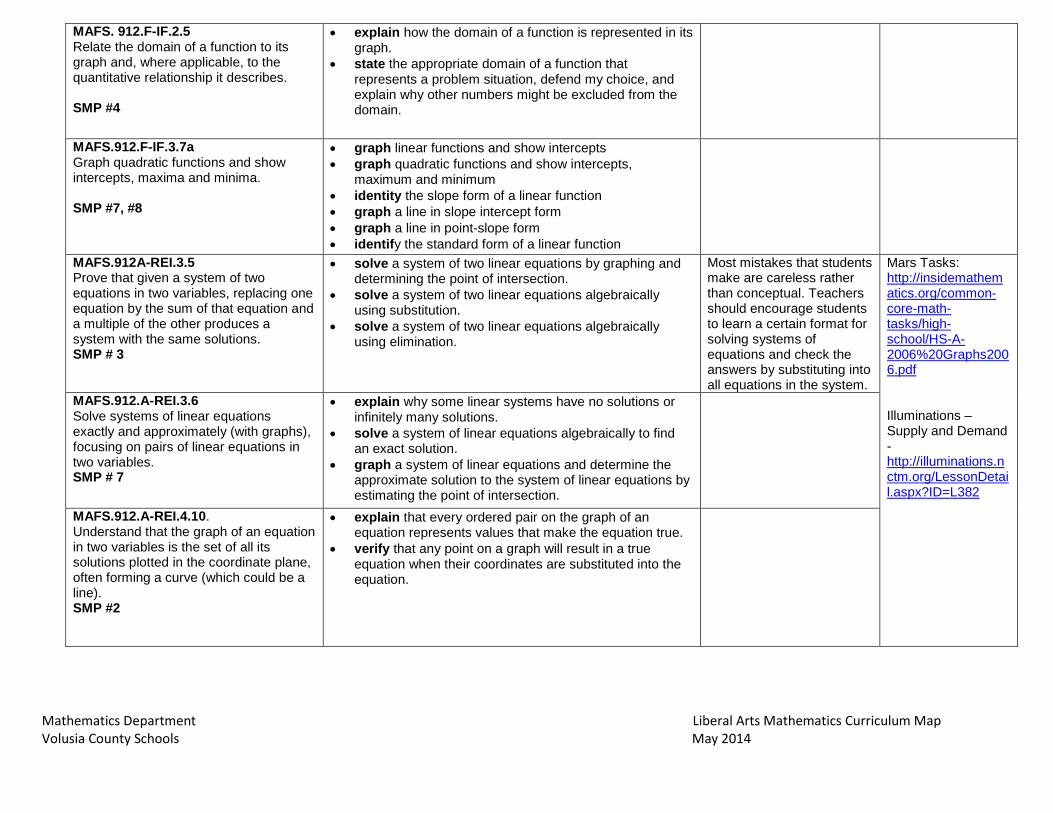
MAFS. 912.F-IF.2.5 Relate the domain of a function to its graph and, where applicable, to the quantitative relationship it describes. SMP #4
• explain how the domain of a function is represented in its graph.
• state the appropriate domain of a function that represents a problem situation, defend my choice, and explain why other numbers might be excluded from the domain.
MAFS.912.F-IF.3.7a Graph quadratic functions and show intercepts, maxima and minima. SMP #7, #8
• graph linear functions and show intercepts • graph quadratic functions and show intercepts,
maximum and minimum • identity the slope form of a linear function • graph a line in slope intercept form • graph a line in point-slope form • identify the standard form of a linear function
MAFS.912A-REI.3.5 Prove that given a system of two equations in two variables, replacing one equation by the sum of that equation and a multiple of the other produces a system with the same solutions. SMP # 3
• solve a system of two linear equations by graphing and determining the point of intersection.
• solve a system of two linear equations algebraically using substitution.
• solve a system of two linear equations algebraically using elimination.
Most mistakes that students make are careless rather than conceptual. Teachers should encourage students to learn a certain format for solving systems of equations and check the answers by substituting into all equations in the system.
Mars Tasks: http://insidemathematics.org/common-core-math-tasks/high-school/HS-A-2006%20Graphs2006.pdf Illuminations – Supply and Demand - http://illuminations.nctm.org/LessonDetail.aspx?ID=L382
MAFS.912.A-REI.3.6 Solve systems of linear equations exactly and approximately (with graphs), focusing on pairs of linear equations in two variables. SMP # 7
• explain why some linear systems have no solutions or infinitely many solutions.
• solve a system of linear equations algebraically to find an exact solution.
• graph a system of linear equations and determine the approximate solution to the system of linear equations by estimating the point of intersection.
MAFS.912.A-REI.4.10. Understand that the graph of an equation in two variables is the set of all its solutions plotted in the coordinate plane, often forming a curve (which could be a line). SMP #2
• explain that every ordered pair on the graph of an equation represents values that make the equation true.
• verify that any point on a graph will result in a true equation when their coordinates are substituted into the equation.
Mathematics Department Liberal Arts Mathematics Curriculum Map Volusia County Schools May 2014
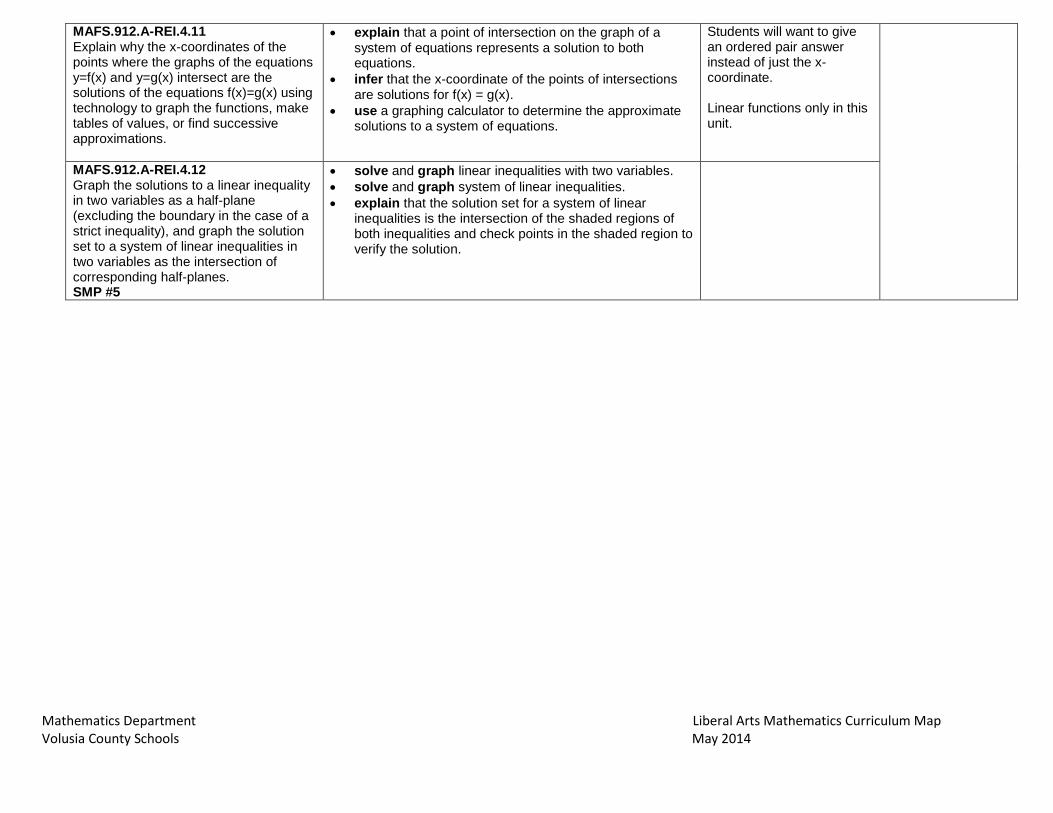
MAFS.912.A-REI.4.11 Explain why the x-coordinates of the points where the graphs of the equations y=f(x) and y=g(x) intersect are the solutions of the equations f(x)=g(x) using technology to graph the functions, make tables of values, or find successive approximations.
• explain that a point of intersection on the graph of a system of equations represents a solution to both equations.
• infer that the x-coordinate of the points of intersections are solutions for f(x) = g(x).
• use a graphing calculator to determine the approximate solutions to a system of equations.
Students will want to give an ordered pair answer instead of just the x-coordinate. Linear functions only in this unit.
MAFS.912.A-REI.4.12 Graph the solutions to a linear inequality in two variables as a half-plane (excluding the boundary in the case of a strict inequality), and graph the solution set to a system of linear inequalities in two variables as the intersection of corresponding half-planes. SMP #5
• solve and graph linear inequalities with two variables. • solve and graph system of linear inequalities. • explain that the solution set for a system of linear
inequalities is the intersection of the shaded regions of both inequalities and check points in the shaded region to verify the solution.
Mathematics Department Liberal Arts Mathematics Curriculum Map Volusia County Schools May 2014
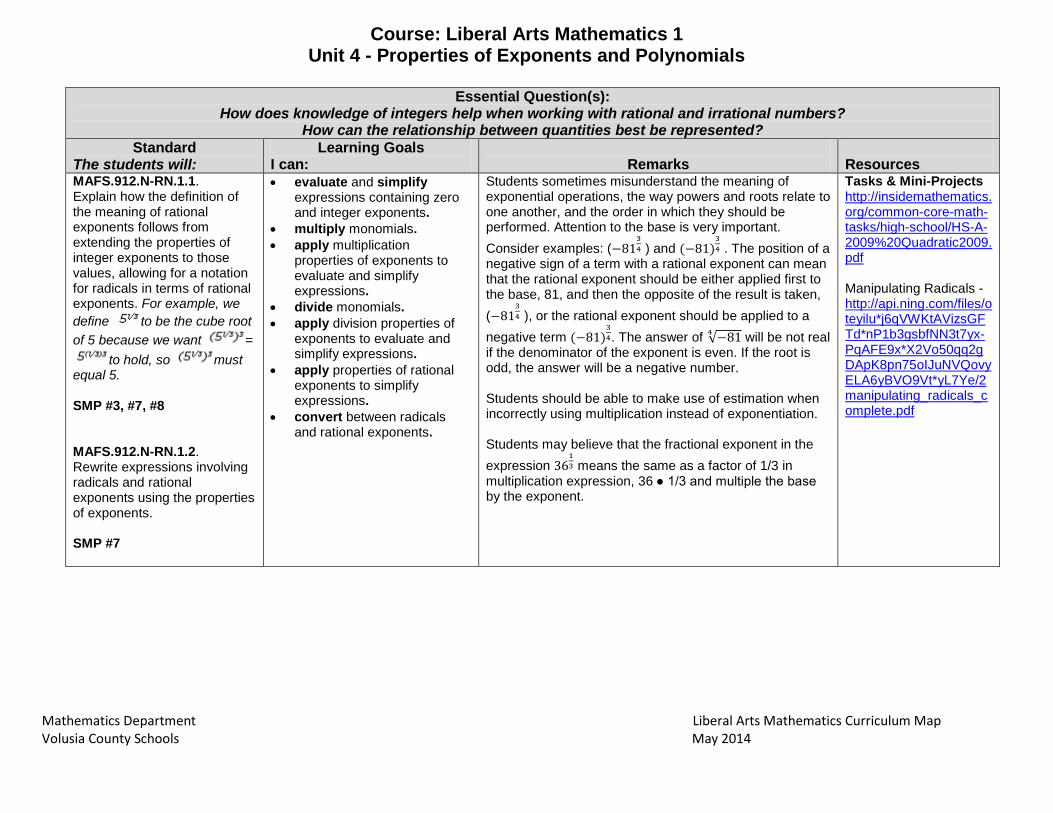
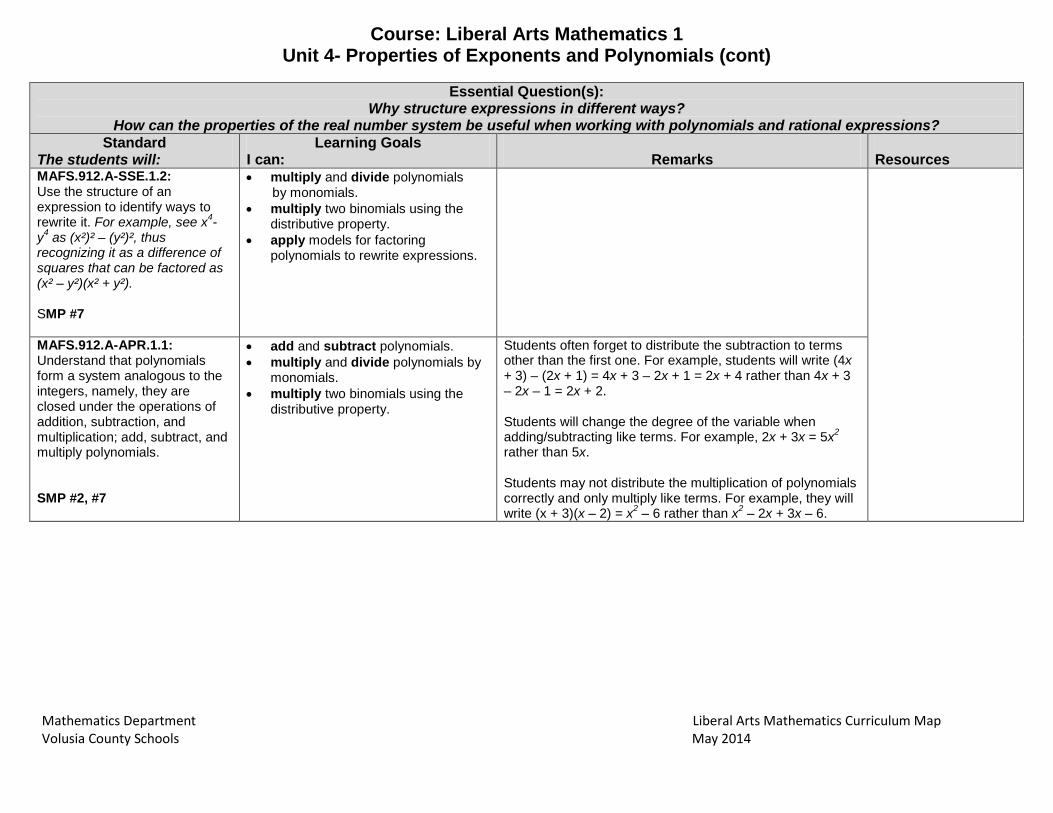
Course: Liberal Arts Mathematics 1 Unit 4 - Properties of Exponents and Polynomials
Essential Question(s):
How does knowledge of integers help when working with rational and irrational numbers? How can the relationship between quantities best be represented?
Standard The students will:
Learning Goals I can:
Remarks
Resources
MAFS.912.N-RN.1.1. Explain how the definition of the meaning of rational exponents follows from extending the properties of integer exponents to those values, allowing for a notation for radicals in terms of rational exponents. For example, we define to be the cube root of 5 because we want =
to hold, so must equal 5. SMP #3, #7, #8 MAFS.912.N-RN.1.2. Rewrite expressions involving radicals and rational exponents using the properties of exponents. SMP #7
• evaluate and simplify expressions containing zero and integer exponents.
• multiply monomials. • apply multiplication
properties of exponents to evaluate and simplify expressions.
• divide monomials. • apply division properties of
exponents to evaluate and simplify expressions.
• apply properties of rational exponents to simplify expressions.
• convert between radicals and rational exponents.
Students sometimes misunderstand the meaning of exponential operations, the way powers and roots relate to one another, and the order in which they should be performed. Attention to the base is very important. Consider examples: (−81
34 ) and (−81)
34 . The position of a
negative sign of a term with a rational exponent can mean that the rational exponent should be either applied first to the base, 81, and then the opposite of the result is taken, (−81
34 ), or the rational exponent should be applied to a
negative term (−81)34. The answer of √−814 will be not real
if the denominator of the exponent is even. If the root is odd, the answer will be a negative number. Students should be able to make use of estimation when incorrectly using multiplication instead of exponentiation. Students may believe that the fractional exponent in the expression 36
13 means the same as a factor of 1/3 in
multiplication expression, 36 ● 1/3 and multiple the base by the exponent.
Tasks & Mini-Projects http://insidemathematics.org/common-core-math-tasks/high-school/HS-A-2009%20Quadratic2009.pdf Manipulating Radicals - http://api.ning.com/files/oteyilu*j6qVWKtAVizsGFTd*nP1b3gsbfNN3t7yx-PqAFE9x*X2Vo50qq2gDApK8pn75oIJuNVQovyELA6yBVO9Vt*yL7Ye/2manipulating_radicals_complete.pdf

Mathematics Department Liberal Arts Mathematics Curriculum Map Volusia County Schools May 2014
Course: Liberal Arts Mathematics 1 Unit 4 - Properties of Exponents and Polynomials (cont)
Essential Question(s):
How does knowledge of integers help when working with rational and irrational numbers? How can the relationship between quantities best be represented? Why structure expressions in different ways?
How can the properties of the real number system be useful when working with polynomials and rational expressions? Standard
The students will: Learning Goals
I can:
Remarks Resources
MAFS.912.A-SSE.1.1: Interpret expressions that represent a quantity in terms of its context. a. Interpret parts of an expression, such as terms, factors and coefficients. b. Interpret complicated expressions by viewing one or more of their parts as a single entity. SMP #7
• classify and write polynomials in standard form.
• evaluate polynomial expressions.
• define expression, term, factor, and coefficient.
• interpret the real-world meaning of the terms, factors and coefficients of an expression in terms of their units.
• group the parts of an expression differently in order to better interpret their meaning.
Students may believe that an expression cannot be factored because it does not fit into a form they recognize. They need help with reorganizing the terms until structures become evident. Students will often combine terms that are not like terms. For example, 2 + 3x = 5x or 3x + 2y = 5xy. Students sometimes forget the coefficient of 1 when adding like terms. For example, x + 2x + 3x = 5x rather than 6x. Students will change the degree of the variable when adding/subtracting like terms. For example, 2x + 3x = 5x2 rather than 5x. Students will forget to distribute to all terms when multiplying. For example, 6(2x + 1) = 12x + 1 rather than 12x + 6. Students may not follow the Order of Operations when simplifying expressions. For example, 4x2 when x = 3 may be incorrectly evaluated as 4•32 = 122 = 144, rather than 4•9 = 36. Students fail to use the property of exponents correctly when using the distributive property. For example, 3x(2x – 1) = 6x – 3x = 3x instead of simplifying as 3x(2x – 1) = 6x2 – 3x. Students fail to understand the structure of expressions. For example, they will write 4x when x = 3 is 43 instead of 4x = 4•x so when x = 3, 4x = 4•3 = 12. In addition, students commonly misevaluate –32 = 9 rather than –32 = –9. Students routinely see –32 as the same as (–3)2 = 9. Students commonly confuse the properties of exponents, specifically the product of powers property with the power of a power property. Students will incorrectly translate expressions that contain a difference of terms. For example, 8 less than 5 times a number is often incorrectly translated as 8 – 5n rather than 5n – 8.
Tasks & Mini-Projects http://engageny.org/resource/common-core-exemplar-for-high-school-math
Mathematics Department Liberal Arts Mathematics Curriculum Map Volusia County Schools May 2014
Course: Liberal Arts Mathematics 1 Unit 4- Properties of Exponents and Polynomials (cont)
Essential Question(s): Why structure expressions in different ways?
How can the properties of the real number system be useful when working with polynomials and rational expressions? Standard
The students will: Learning Goals
I can:
Remarks Resources
MAFS.912.A-SSE.1.2: Use the structure of an expression to identify ways to rewrite it. For example, see x4- y4 as (x²)² – (y²)², thus recognizing it as a difference of squares that can be factored as (x² – y²)(x² + y²). SMP #7
• multiply and divide polynomials by monomials. • multiply two binomials using the
distributive property. • apply models for factoring
polynomials to rewrite expressions.
MAFS.912.A-APR.1.1: Understand that polynomials form a system analogous to the integers, namely, they are closed under the operations of addition, subtraction, and multiplication; add, subtract, and multiply polynomials. SMP #2, #7
• add and subtract polynomials. • multiply and divide polynomials by
monomials. • multiply two binomials using the
distributive property.
Students often forget to distribute the subtraction to terms other than the first one. For example, students will write (4x + 3) – (2x + 1) = 4x + 3 – 2x + 1 = 2x + 4 rather than 4x + 3 – 2x – 1 = 2x + 2. Students will change the degree of the variable when adding/subtracting like terms. For example, 2x + 3x = 5x2 rather than 5x. Students may not distribute the multiplication of polynomials correctly and only multiply like terms. For example, they will write (x + 3)(x – 2) = x2 – 6 rather than x2 – 2x + 3x – 6.
Mathematics Department Liberal Arts Mathematics Curriculum Map Volusia County Schools May 2014
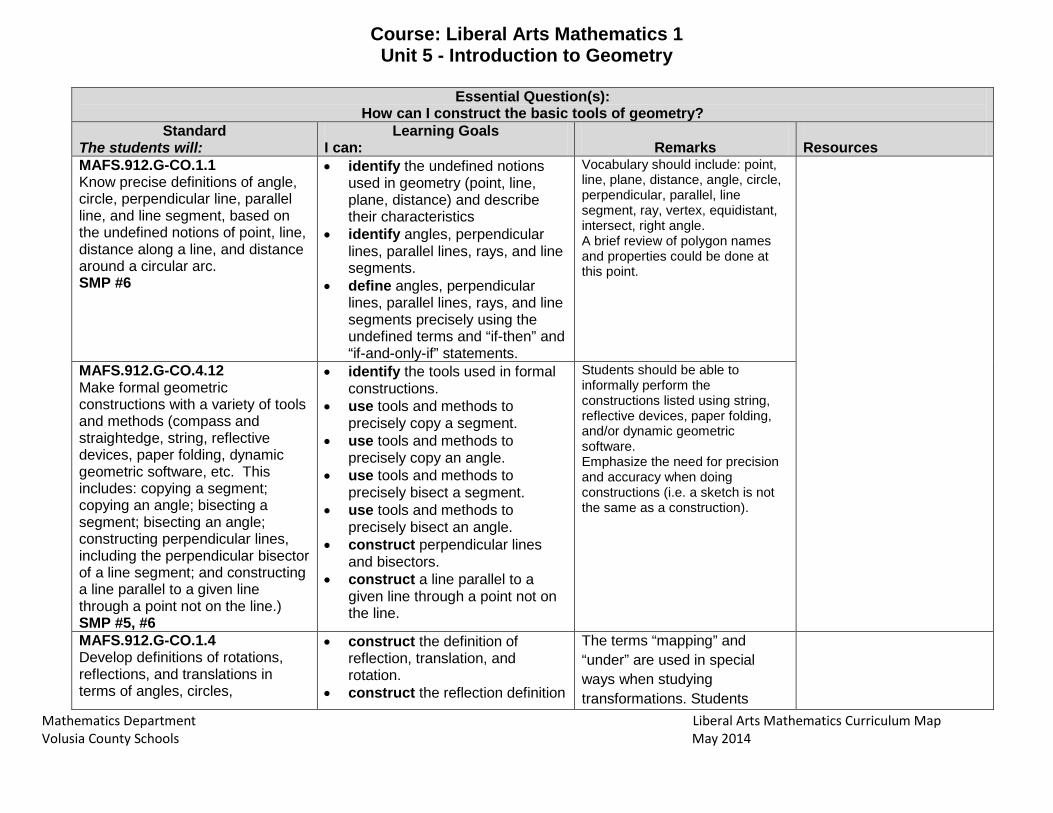
Course: Liberal Arts Mathematics 1 Unit 5 - Introduction to Geometry
Essential Question(s):
How can I construct the basic tools of geometry? Standard
The students will: Learning Goals
I can:
Remarks Resources
MAFS.912.G-CO.1.1 Know precise definitions of angle, circle, perpendicular line, parallel line, and line segment, based on the undefined notions of point, line, distance along a line, and distance around a circular arc. SMP #6
• identify the undefined notions used in geometry (point, line, plane, distance) and describe their characteristics
• identify angles, perpendicular lines, parallel lines, rays, and line segments.
• define angles, perpendicular lines, parallel lines, rays, and line segments precisely using the undefined terms and “if-then” and “if-and-only-if” statements.
Vocabulary should include: point, line, plane, distance, angle, circle, perpendicular, parallel, line segment, ray, vertex, equidistant, intersect, right angle. A brief review of polygon names and properties could be done at this point.
MAFS.912.G-CO.4.12 Make formal geometric constructions with a variety of tools and methods (compass and straightedge, string, reflective devices, paper folding, dynamic geometric software, etc. This includes: copying a segment; copying an angle; bisecting a segment; bisecting an angle; constructing perpendicular lines, including the perpendicular bisector of a line segment; and constructing a line parallel to a given line through a point not on the line.) SMP #5, #6
• identify the tools used in formal constructions.
• use tools and methods to precisely copy a segment.
• use tools and methods to precisely copy an angle.
• use tools and methods to precisely bisect a segment.
• use tools and methods to precisely bisect an angle.
• construct perpendicular lines and bisectors.
• construct a line parallel to a given line through a point not on the line.
Students should be able to informally perform the constructions listed using string, reflective devices, paper folding, and/or dynamic geometric software. Emphasize the need for precision and accuracy when doing constructions (i.e. a sketch is not the same as a construction).
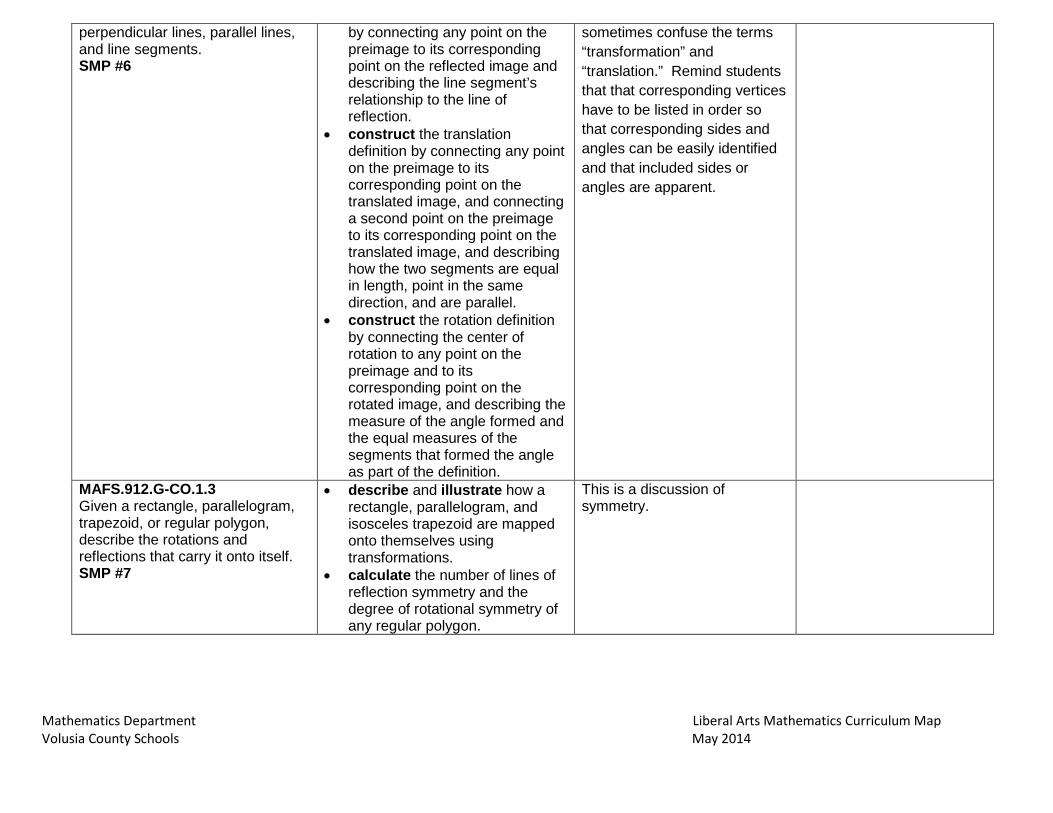
MAFS.912.G-CO.1.4 Develop definitions of rotations, reflections, and translations in terms of angles, circles,
• construct the definition of reflection, translation, and rotation.
• construct the reflection definition
The terms “mapping” and “under” are used in special ways when studying transformations. Students
Mathematics Department Liberal Arts Mathematics Curriculum Map Volusia County Schools May 2014
perpendicular lines, parallel lines, and line segments. SMP #6
by connecting any point on the preimage to its corresponding point on the reflected image and describing the line segment’s relationship to the line of reflection.
• construct the translation definition by connecting any point on the preimage to its corresponding point on the translated image, and connecting a second point on the preimage to its corresponding point on the translated image, and describing how the two segments are equal in length, point in the same direction, and are parallel.
• construct the rotation definition by connecting the center of rotation to any point on the preimage and to its corresponding point on the rotated image, and describing the measure of the angle formed and the equal measures of the segments that formed the angle as part of the definition.
sometimes confuse the terms “transformation” and “translation.” Remind students that that corresponding vertices have to be listed in order so that corresponding sides and angles can be easily identified and that included sides or angles are apparent.
MAFS.912.G-CO.1.3 Given a rectangle, parallelogram, trapezoid, or regular polygon, describe the rotations and reflections that carry it onto itself. SMP #7
• describe and illustrate how a rectangle, parallelogram, and isosceles trapezoid are mapped onto themselves using transformations.
• calculate the number of lines of reflection symmetry and the degree of rotational symmetry of any regular polygon.
This is a discussion of symmetry.
Mathematics Department Liberal Arts Mathematics Curriculum Map Volusia County Schools May 2014
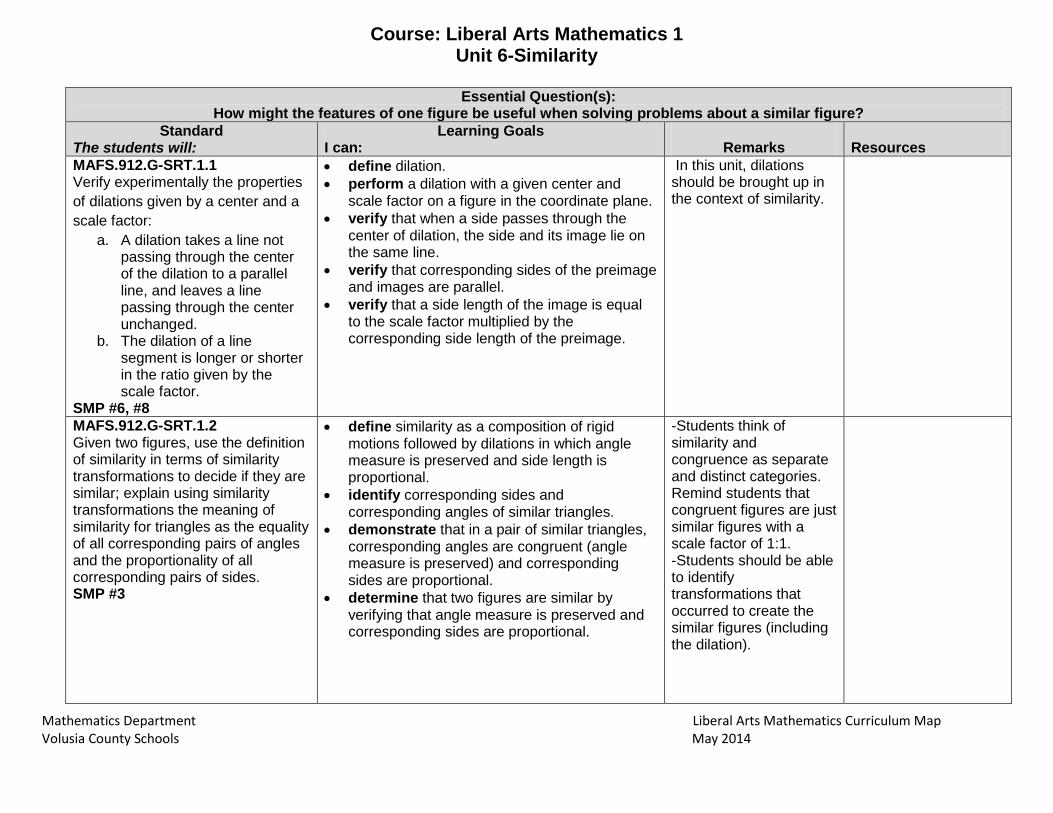
Course: Liberal Arts Mathematics 1 Unit 6-Similarity
Essential Question(s):
How might the features of one figure be useful when solving problems about a similar figure? Standard
The students will: Learning Goals
I can:
Remarks Resources
MAFS.912.G-SRT.1.1 Verify experimentally the properties of dilations given by a center and a scale factor:
a. A dilation takes a line not passing through the center of the dilation to a parallel line, and leaves a line passing through the center unchanged.
b. The dilation of a line segment is longer or shorter in the ratio given by the scale factor.
SMP #6, #8
• define dilation. • perform a dilation with a given center and
scale factor on a figure in the coordinate plane. • verify that when a side passes through the
center of dilation, the side and its image lie on the same line.
• verify that corresponding sides of the preimage and images are parallel.
• verify that a side length of the image is equal to the scale factor multiplied by the corresponding side length of the preimage.
In this unit, dilations should be brought up in the context of similarity.
MAFS.912.G-SRT.1.2 Given two figures, use the definition of similarity in terms of similarity transformations to decide if they are similar; explain using similarity transformations the meaning of similarity for triangles as the equality of all corresponding pairs of angles and the proportionality of all corresponding pairs of sides. SMP #3
• define similarity as a composition of rigid motions followed by dilations in which angle measure is preserved and side length is proportional.
• identify corresponding sides and corresponding angles of similar triangles.
• demonstrate that in a pair of similar triangles, corresponding angles are congruent (angle measure is preserved) and corresponding sides are proportional.
• determine that two figures are similar by verifying that angle measure is preserved and corresponding sides are proportional.
-Students think of similarity and congruence as separate and distinct categories. Remind students that congruent figures are just similar figures with a scale factor of 1:1. -Students should be able to identify transformations that occurred to create the similar figures (including the dilation).
Mathematics Department Liberal Arts Mathematics Curriculum Map Volusia County Schools May 2014
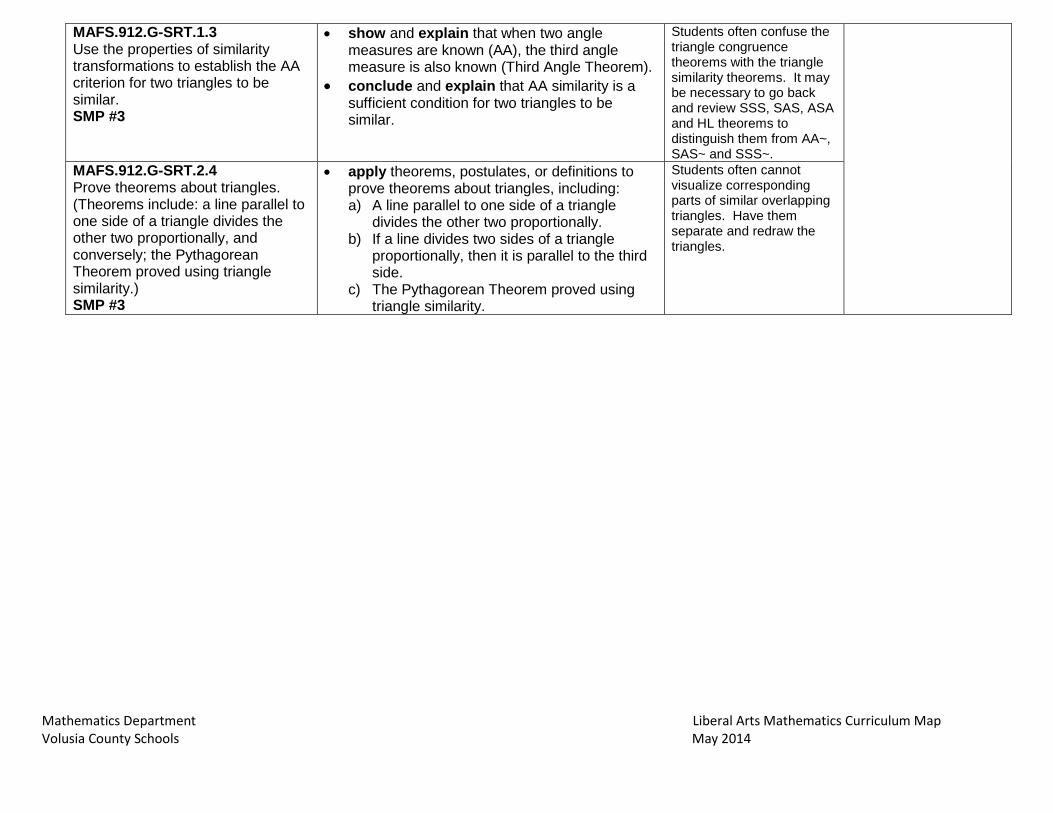
MAFS.912.G-SRT.1.3 Use the properties of similarity transformations to establish the AA criterion for two triangles to be similar. SMP #3
• show and explain that when two angle measures are known (AA), the third angle measure is also known (Third Angle Theorem).
• conclude and explain that AA similarity is a sufficient condition for two triangles to be similar.
Students often confuse the triangle congruence theorems with the triangle similarity theorems. It may be necessary to go back and review SSS, SAS, ASA and HL theorems to distinguish them from AA~, SAS~ and SSS~.
MAFS.912.G-SRT.2.4 Prove theorems about triangles. (Theorems include: a line parallel to one side of a triangle divides the other two proportionally, and conversely; the Pythagorean Theorem proved using triangle similarity.) SMP #3
• apply theorems, postulates, or definitions to prove theorems about triangles, including: a) A line parallel to one side of a triangle
divides the other two proportionally. b) If a line divides two sides of a triangle
proportionally, then it is parallel to the third side.
c) The Pythagorean Theorem proved using triangle similarity.
Students often cannot visualize corresponding parts of similar overlapping triangles. Have them separate and redraw the triangles.
Mathematics Department Liberal Arts Mathematics Curriculum Map Volusia County Schools May 2014
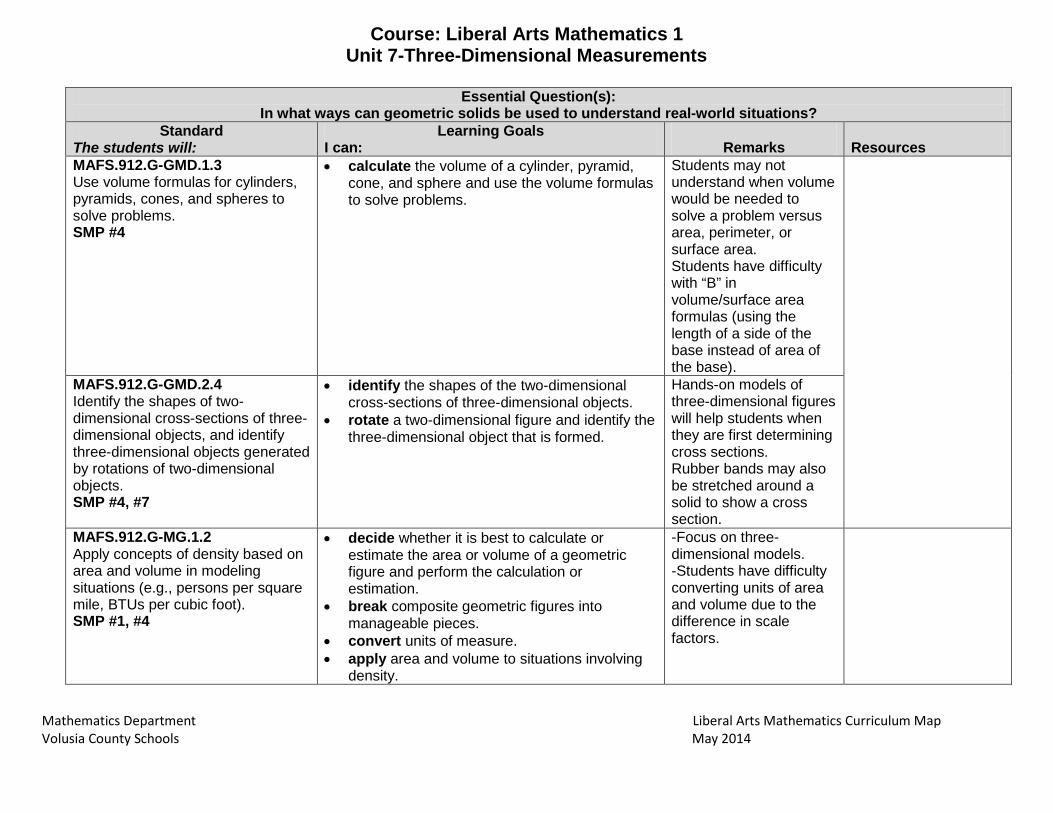
Course: Liberal Arts Mathematics 1 Unit 7-Three-Dimensional Measurements
Essential Question(s):
In what ways can geometric solids be used to understand real-world situations? Standard
The students will: Learning Goals
I can:
Remarks Resources
MAFS.912.G-GMD.1.3 Use volume formulas for cylinders, pyramids, cones, and spheres to solve problems. SMP #4
• calculate the volume of a cylinder, pyramid, cone, and sphere and use the volume formulas to solve problems.
Students may not understand when volume would be needed to solve a problem versus area, perimeter, or surface area. Students have difficulty with “B” in volume/surface area formulas (using the length of a side of the base instead of area of the base).
MAFS.912.G-GMD.2.4 Identify the shapes of two-dimensional cross-sections of three-dimensional objects, and identify three-dimensional objects generated by rotations of two-dimensional objects. SMP #4, #7
• identify the shapes of the two-dimensional cross-sections of three-dimensional objects.
• rotate a two-dimensional figure and identify the three-dimensional object that is formed.
Hands-on models of three-dimensional figures will help students when they are first determining cross sections. Rubber bands may also be stretched around a solid to show a cross section.
MAFS.912.G-MG.1.2 Apply concepts of density based on area and volume in modeling situations (e.g., persons per square mile, BTUs per cubic foot). SMP #1, #4
• decide whether it is best to calculate or estimate the area or volume of a geometric figure and perform the calculation or estimation.
• break composite geometric figures into manageable pieces.
• convert units of measure. • apply area and volume to situations involving
density.
-Focus on three-dimensional models. -Students have difficulty converting units of area and volume due to the difference in scale factors.
Mathematics Department Liberal Arts Mathematics Curriculum Map Volusia County Schools May 2014
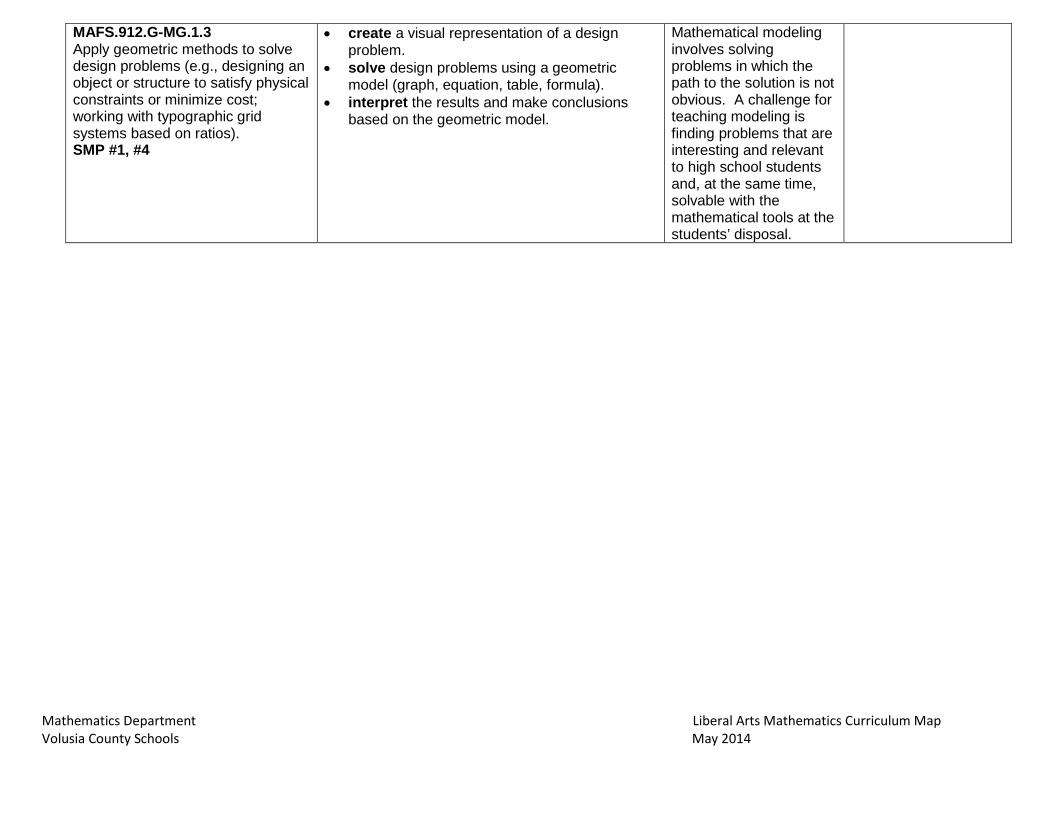
MAFS.912.G-MG.1.3 Apply geometric methods to solve design problems (e.g., designing an object or structure to satisfy physical constraints or minimize cost; working with typographic grid systems based on ratios). SMP #1, #4
• create a visual representation of a design problem.
• solve design problems using a geometric model (graph, equation, table, formula).
• interpret the results and make conclusions based on the geometric model.
Mathematical modeling involves solving problems in which the path to the solution is not obvious. A challenge for teaching modeling is finding problems that are interesting and relevant to high school students and, at the same time, solvable with the mathematical tools at the students’ disposal.
Mathematics Department Liberal Arts Mathematics Curriculum Map Volusia County Schools May 2014
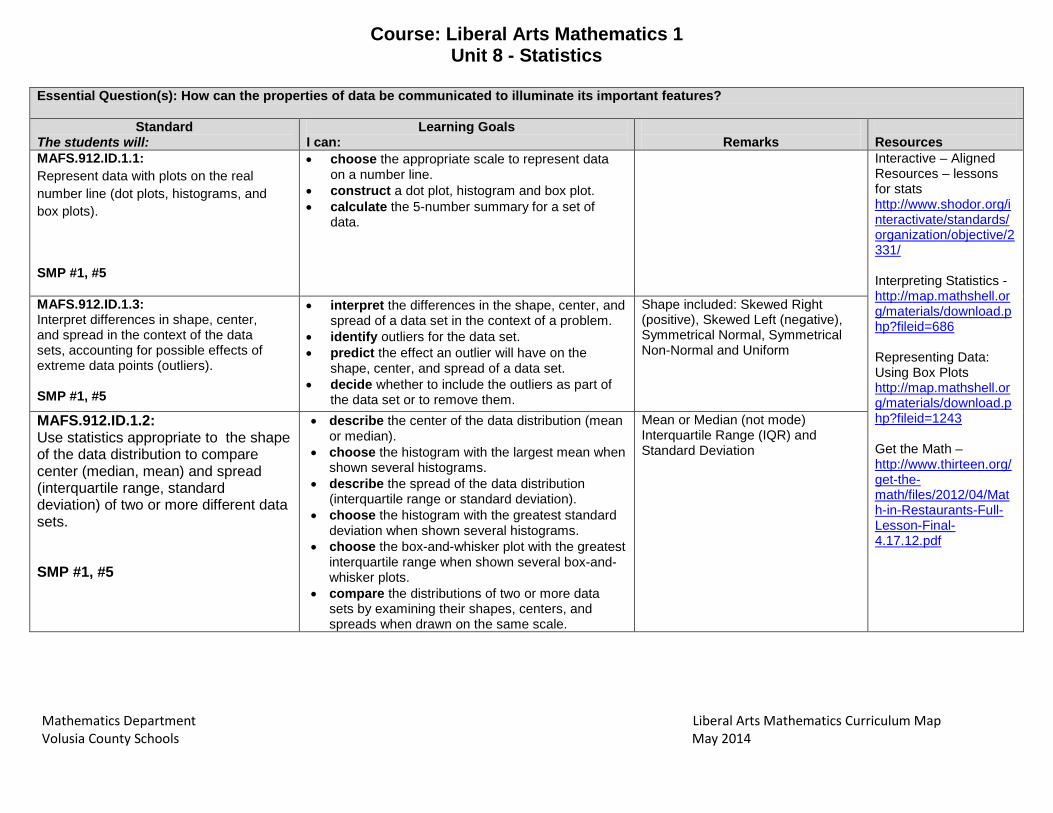
Course: Liberal Arts Mathematics 1 Unit 8 - Statistics
Essential Question(s): How can the properties of data be communicated to illuminate its important features?
Standard The students will:
Learning Goals I can:
Remarks
Resources
MAFS.912.ID.1.1: Represent data with plots on the real number line (dot plots, histograms, and box plots).
SMP #1, #5
• choose the appropriate scale to represent data on a number line.
• construct a dot plot, histogram and box plot. • calculate the 5-number summary for a set of
data.
Interactive – Aligned Resources – lessons for stats http://www.shodor.org/interactivate/standards/organization/objective/2331/ Interpreting Statistics - http://map.mathshell.org/materials/download.php?fileid=686 Representing Data: Using Box Plots http://map.mathshell.org/materials/download.php?fileid=1243 Get the Math – http://www.thirteen.org/get-the-math/files/2012/04/Math-in-Restaurants-Full-Lesson-Final-4.17.12.pdf
MAFS.912.ID.1.3: Interpret differences in shape, center, and spread in the context of the data sets, accounting for possible effects of extreme data points (outliers). SMP #1, #5
• interpret the differences in the shape, center, and spread of a data set in the context of a problem.
• identify outliers for the data set. • predict the effect an outlier will have on the
shape, center, and spread of a data set. • decide whether to include the outliers as part of
the data set or to remove them.
Shape included: Skewed Right (positive), Skewed Left (negative), Symmetrical Normal, Symmetrical Non-Normal and Uniform
MAFS.912.ID.1.2: Use statistics appropriate to the shape of the data distribution to compare center (median, mean) and spread (interquartile range, standard deviation) of two or more different data sets. SMP #1, #5
• describe the center of the data distribution (mean or median).
• choose the histogram with the largest mean when shown several histograms.
• describe the spread of the data distribution (interquartile range or standard deviation).
• choose the histogram with the greatest standard deviation when shown several histograms.
• choose the box-and-whisker plot with the greatest interquartile range when shown several box-and-whisker plots.
• compare the distributions of two or more data sets by examining their shapes, centers, and spreads when drawn on the same scale.
Mean or Median (not mode) Interquartile Range (IQR) and Standard Deviation
Mathematics Department Liberal Arts Mathematics Curriculum Map Volusia County Schools May 2014
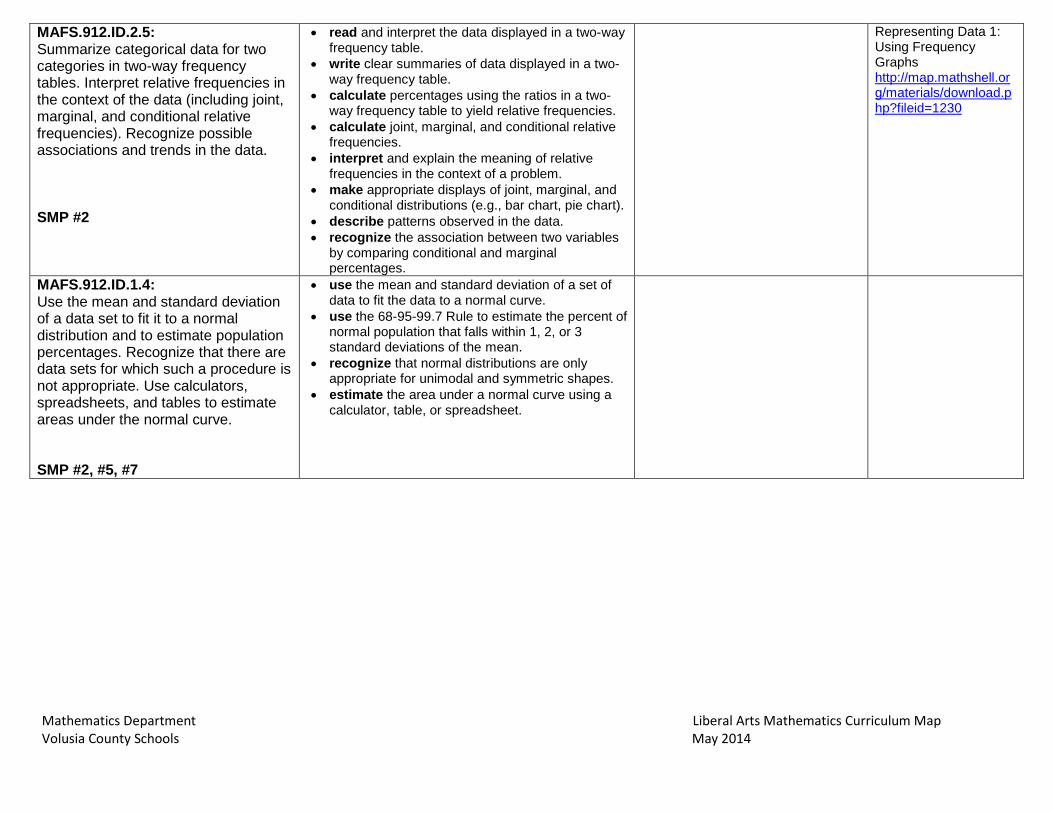
MAFS.912.ID.2.5: Summarize categorical data for two categories in two-way frequency tables. Interpret relative frequencies in the context of the data (including joint, marginal, and conditional relative frequencies). Recognize possible associations and trends in the data. SMP #2
• read and interpret the data displayed in a two-way frequency table.
• write clear summaries of data displayed in a two-way frequency table.
• calculate percentages using the ratios in a two-way frequency table to yield relative frequencies.
• calculate joint, marginal, and conditional relative frequencies.
• interpret and explain the meaning of relative frequencies in the context of a problem.
• make appropriate displays of joint, marginal, and conditional distributions (e.g., bar chart, pie chart).
• describe patterns observed in the data. • recognize the association between two variables
by comparing conditional and marginal percentages.
Representing Data 1: Using Frequency Graphs http://map.mathshell.org/materials/download.php?fileid=1230
MAFS.912.ID.1.4: Use the mean and standard deviation of a data set to fit it to a normal distribution and to estimate population percentages. Recognize that there are data sets for which such a procedure is not appropriate. Use calculators, spreadsheets, and tables to estimate areas under the normal curve. SMP #2, #5, #7
• use the mean and standard deviation of a set of data to fit the data to a normal curve.
• use the 68-95-99.7 Rule to estimate the percent of normal population that falls within 1, 2, or 3 standard deviations of the mean.
• recognize that normal distributions are only appropriate for unimodal and symmetric shapes.
• estimate the area under a normal curve using a calculator, table, or spreadsheet.
Mathematics Department Liberal Arts Mathematics Curriculum Map Volusia County Schools May 2014
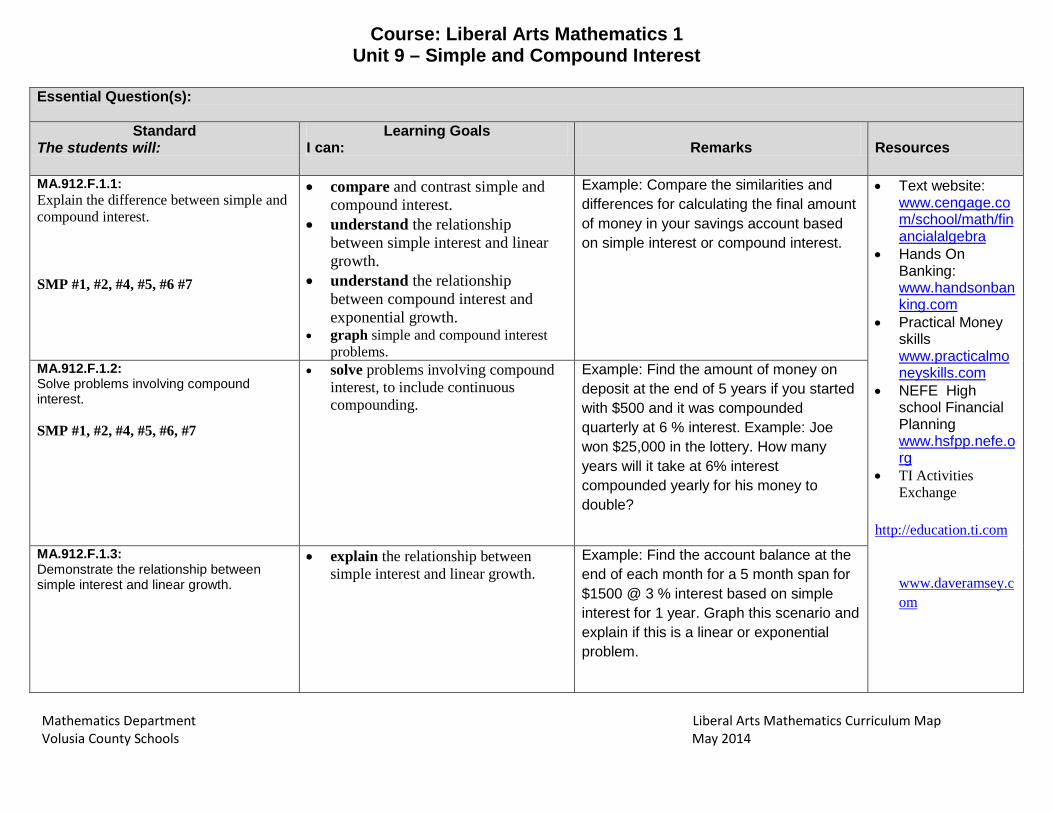
Course: Liberal Arts Mathematics 1 Unit 9 – Simple and Compound Interest
Essential Question(s):
Standard The students will:
Learning Goals I can:
Remarks
Resources
MA.912.F.1.1: Explain the difference between simple and compound interest. SMP #1, #2, #4, #5, #6 #7
• compare and contrast simple and compound interest.
• understand the relationship between simple interest and linear growth.
• understand the relationship between compound interest and exponential growth.
• graph simple and compound interest problems.
Example: Compare the similarities and differences for calculating the final amount of money in your savings account based on simple interest or compound interest.
• Text website: www.cengage.com/school/math/financialalgebra
• Hands On Banking: www.handsonbanking.com
• Practical Money skills www.practicalmoneyskills.com
• NEFE High school Financial Planning www.hsfpp.nefe.org
• TI Activities Exchange
http://education.ti.com
www.daveramsey.com
MA.912.F.1.2: Solve problems involving compound interest. SMP #1, #2, #4, #5, #6, #7
• solve problems involving compound interest, to include continuous compounding.
Example: Find the amount of money on deposit at the end of 5 years if you started with $500 and it was compounded quarterly at 6 % interest. Example: Joe won $25,000 in the lottery. How many years will it take at 6% interest compounded yearly for his money to double?
MA.912.F.1.3: Demonstrate the relationship between simple interest and linear growth.
• explain the relationship between simple interest and linear growth.
Example: Find the account balance at the end of each month for a 5 month span for $1500 @ 3 % interest based on simple interest for 1 year. Graph this scenario and explain if this is a linear or exponential problem.
Mathematics Department Liberal Arts Mathematics Curriculum Map Volusia County Schools May 2014
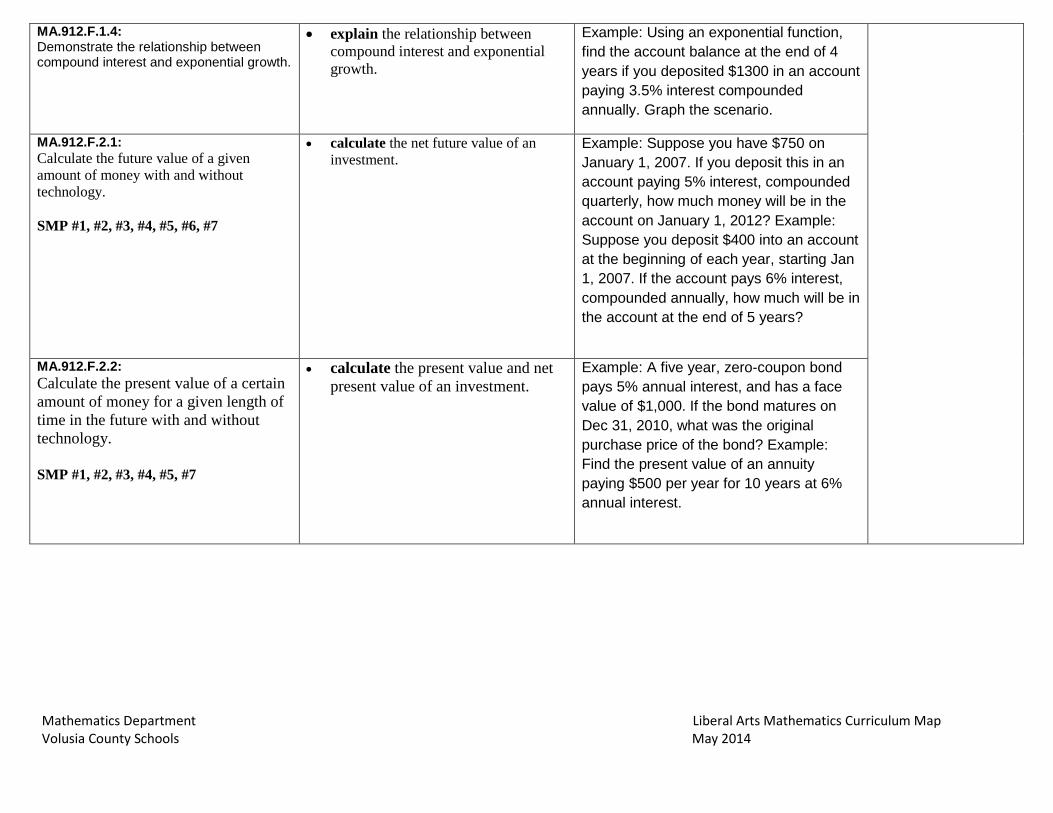
MA.912.F.1.4: Demonstrate the relationship between compound interest and exponential growth.
• explain the relationship between compound interest and exponential growth.
Example: Using an exponential function, find the account balance at the end of 4 years if you deposited $1300 in an account paying 3.5% interest compounded annually. Graph the scenario.
MA.912.F.2.1: Calculate the future value of a given amount of money with and without technology. SMP #1, #2, #3, #4, #5, #6, #7
• calculate the net future value of an investment.
Example: Suppose you have $750 on January 1, 2007. If you deposit this in an account paying 5% interest, compounded quarterly, how much money will be in the account on January 1, 2012? Example: Suppose you deposit $400 into an account at the beginning of each year, starting Jan 1, 2007. If the account pays 6% interest, compounded annually, how much will be in the account at the end of 5 years?
MA.912.F.2.2: Calculate the present value of a certain amount of money for a given length of time in the future with and without technology. SMP #1, #2, #3, #4, #5, #7
• calculate the present value and net present value of an investment.
Example: A five year, zero-coupon bond pays 5% annual interest, and has a face value of $1,000. If the bond matures on Dec 31, 2010, what was the original purchase price of the bond? Example: Find the present value of an annuity paying $500 per year for 10 years at 6% annual interest.