Embed Size (px)
Citation preview
7/23/2019 2014-2015 Graduation Data SCSD
http://slidepdf.com/reader/full/2014-2015-graduation-data-scsd 1/38
SCSD High School OutcomeGraduation Performance for 2011 Total
Cohort
J A N U A R Y 1 1 , 2 0 1 6
O F F I C E O F S H A R E D A C C O U N T AB I L I T Y
SUPERINTENDENT
SHARON L . CONTRERAS, PH.D .
1
7/23/2019 2014-2015 Graduation Data SCSD
http://slidepdf.com/reader/full/2014-2015-graduation-data-scsd 2/38
2
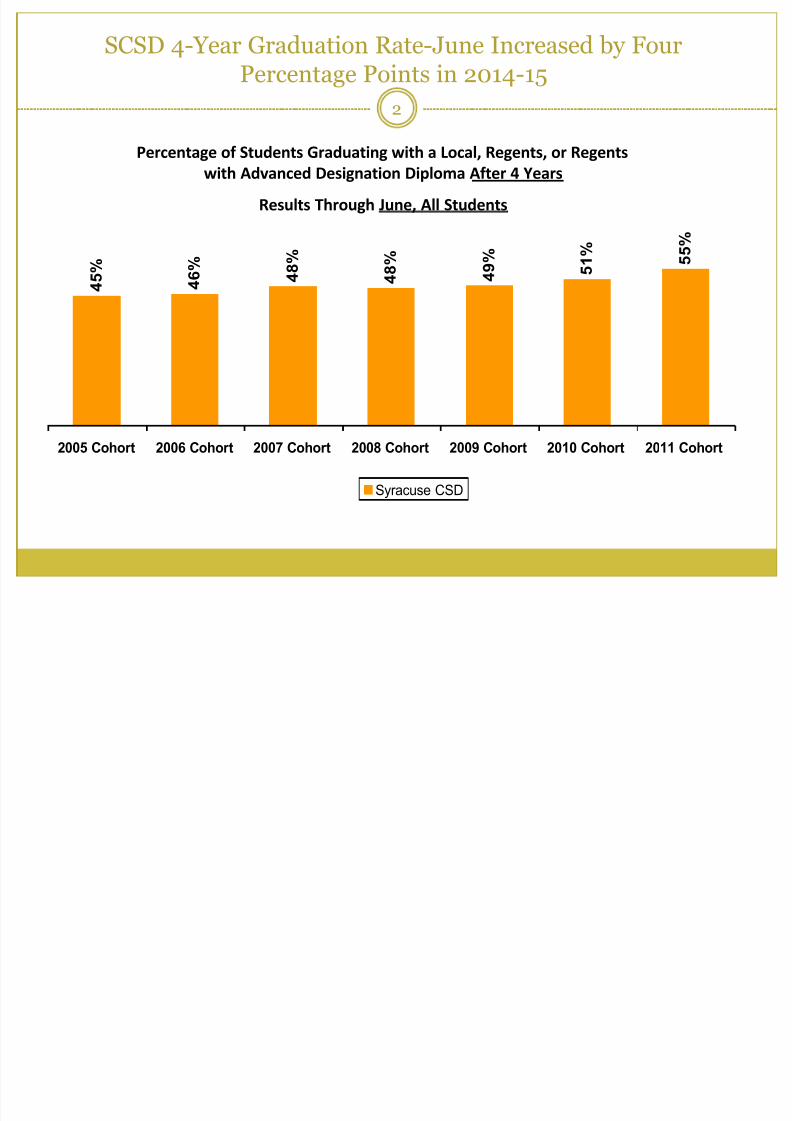
4 5 %
4 6
%
4 8 %
4 8 %
4
9 %
5 1 %
5 5 %
2005 Cohort 2006 Cohort 2007 Cohort 2008 Cohort 2009 Cohort 2010 Cohort 2011 Cohort
Syracuse CSD
Percentage of Students Graduating with a Local, Regents, or Regents
with Advanced Designation Diploma After 4 Years
Results Through June, All Students
SCSD 4-Year Graduation Rate-June Increased by FourPercentage Points in 2014-15
7/23/2019 2014-2015 Graduation Data SCSD
http://slidepdf.com/reader/full/2014-2015-graduation-data-scsd 3/38
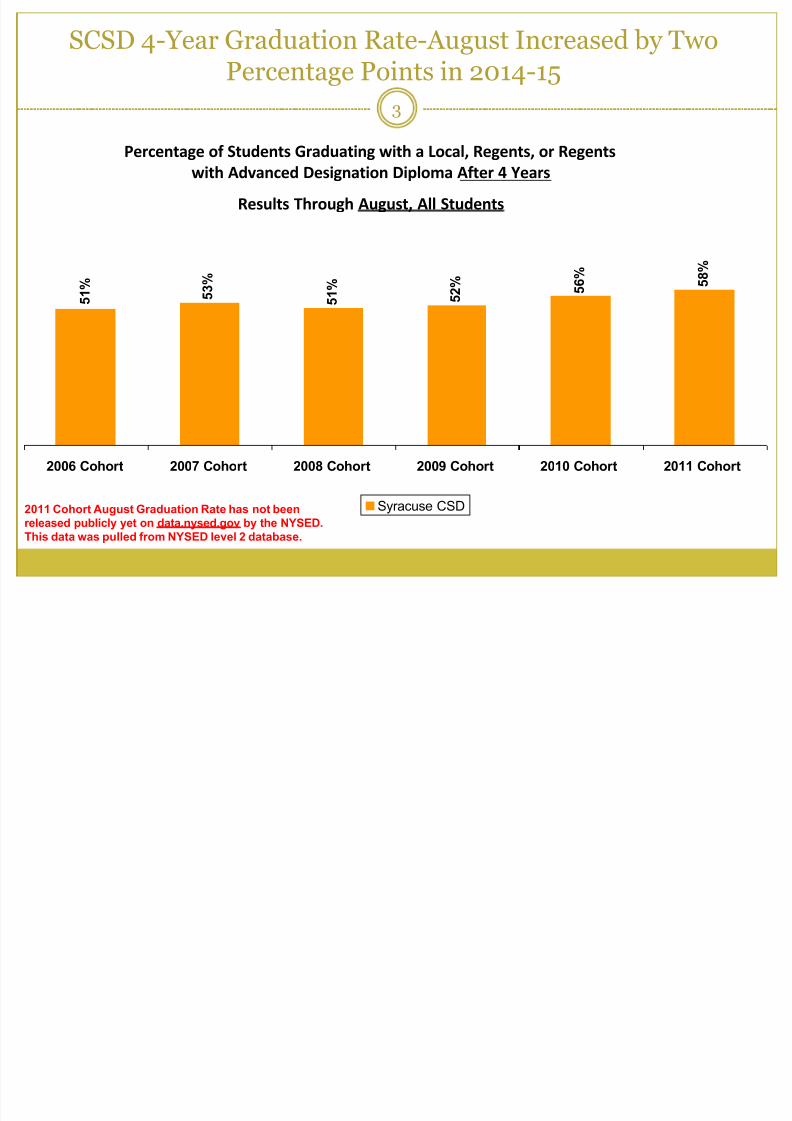
5 8
%
5 6 %
5 2 %
5 1 %
5 3 %
5 1 %
2006 Cohort 2007 Cohort 2008 Cohort 2009 Cohort 2010 Cohort 2011 Cohort
Syracuse CSD
Percentage of Students Graduating with a Local, Regents, or Regents
with Advanced Designation Diploma After 4 Years
Results Through August, All Students
3
SCSD 4-Year Graduation Rate-August Increased by TwoPercentage Points in 2014-15
2011 Cohort August Graduation Rate has not been
released publicly yet on data.nysed.gov by the NYSED.
This data was pulled from NYSED level 2 database.
7/23/2019 2014-2015 Graduation Data SCSD
http://slidepdf.com/reader/full/2014-2015-graduation-data-scsd 4/38
4
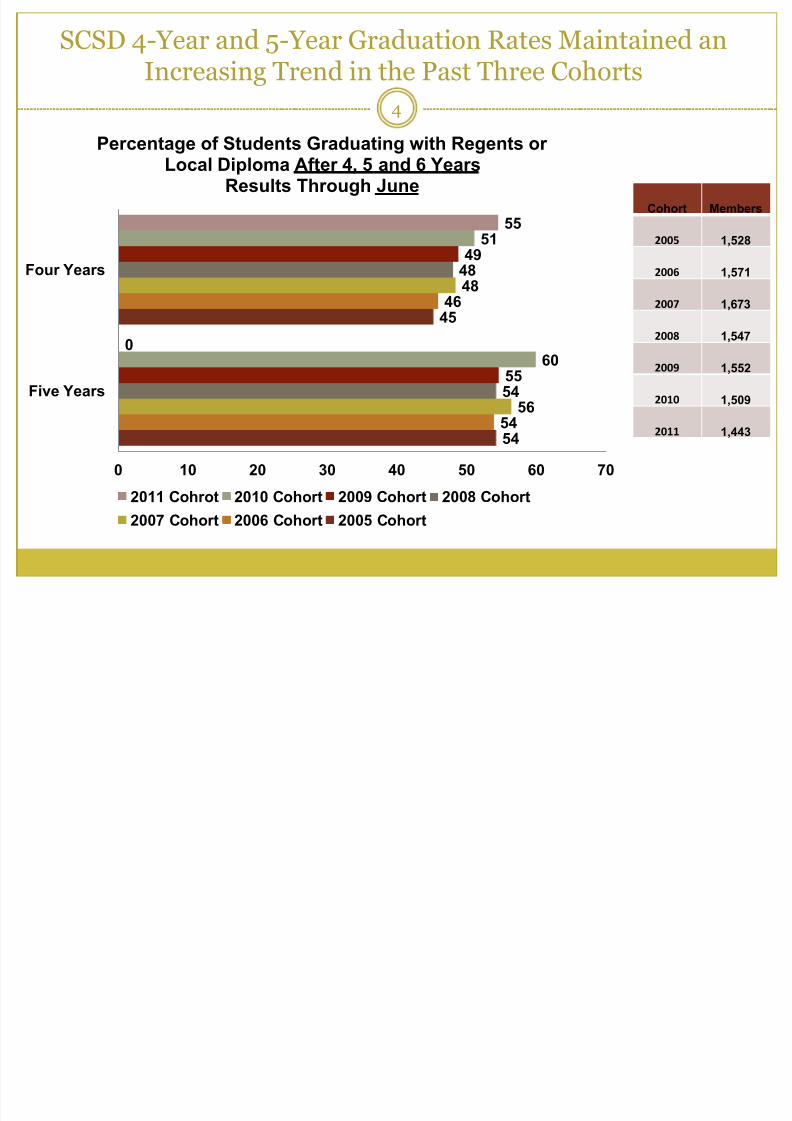
Cohort Members
2005 1,528
2006 1,571
2007 1,673
2008 1,547
2009 1,552
2010 1,509
2011 1,443
SCSD 4-Year and 5-Year Graduation Rates Maintained anIncreasing Trend in the Past Three Cohorts
54
45
54
46
56
48
54
48
55
49
60
51
0
55
0 10 20 30 40 50 60 70
Five Years
Four Years
Percentage of Students Graduating with Regents orLocal Diploma After 4, 5 and 6 Years
Results Through June
2011 Cohrot 2010 Cohort 2009 Cohort 2008 Cohort
2007 Cohort 2006 Cohort 2005 Cohort
7/23/2019 2014-2015 Graduation Data SCSD
http://slidepdf.com/reader/full/2014-2015-graduation-data-scsd 5/38
5
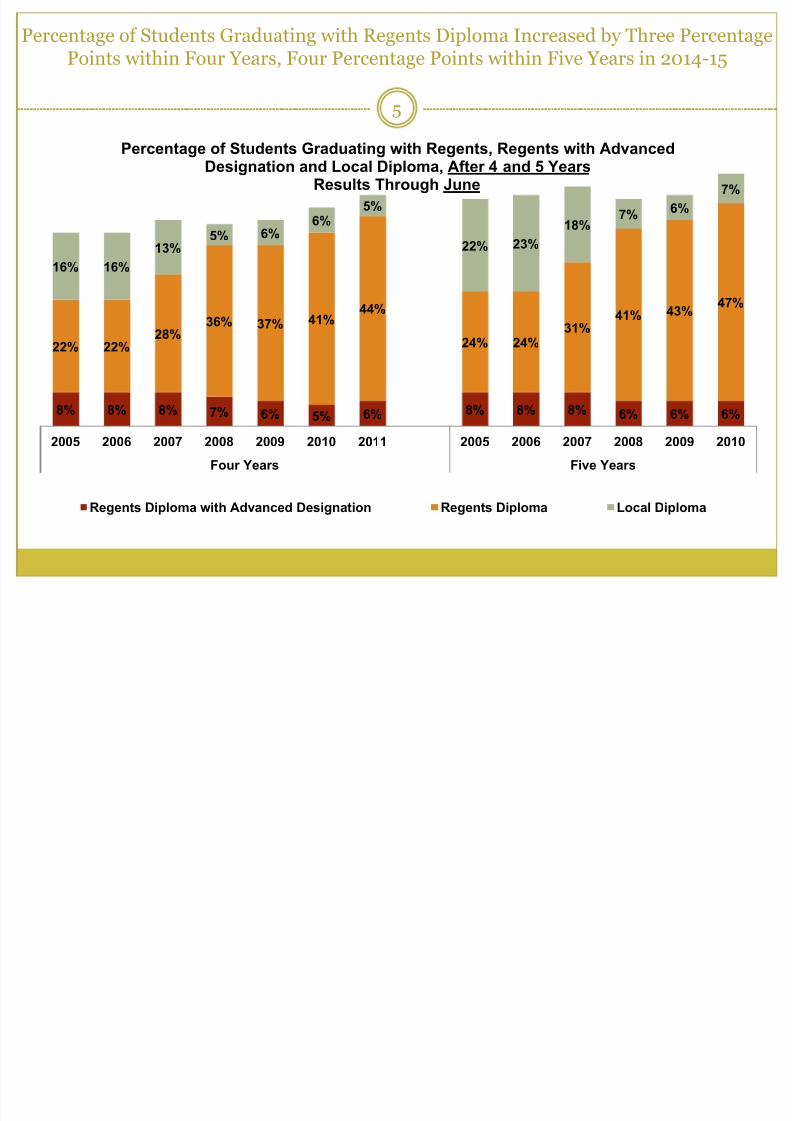
Percentage of Students Graduating with Regents Diploma Increased by Three PercentagePoints within Four Years, Four Percentage Points within Five Years in 2014-15
8% 8% 8% 7% 6% 5% 6% 8% 8% 8% 6% 6% 6%
22% 22%28%
36% 37% 41%44%
24% 24%31%
41% 43%47%
16% 16%
13%5% 6%
6%5%
22% 23%
18%7%
6%
7%
2005 2006 2007 2008 2009 2010 2011 2005 2006 2007 2008 2009 2010
Four Years Five Years
Percentage of Students Graduating with Regents, Regents with AdvancedDesignation and Local Diploma, After 4 and 5 Years
Results Through June
Regents Diploma with Advanced Designation Regents Diploma Local Diploma
7/23/2019 2014-2015 Graduation Data SCSD
http://slidepdf.com/reader/full/2014-2015-graduation-data-scsd 6/38
6
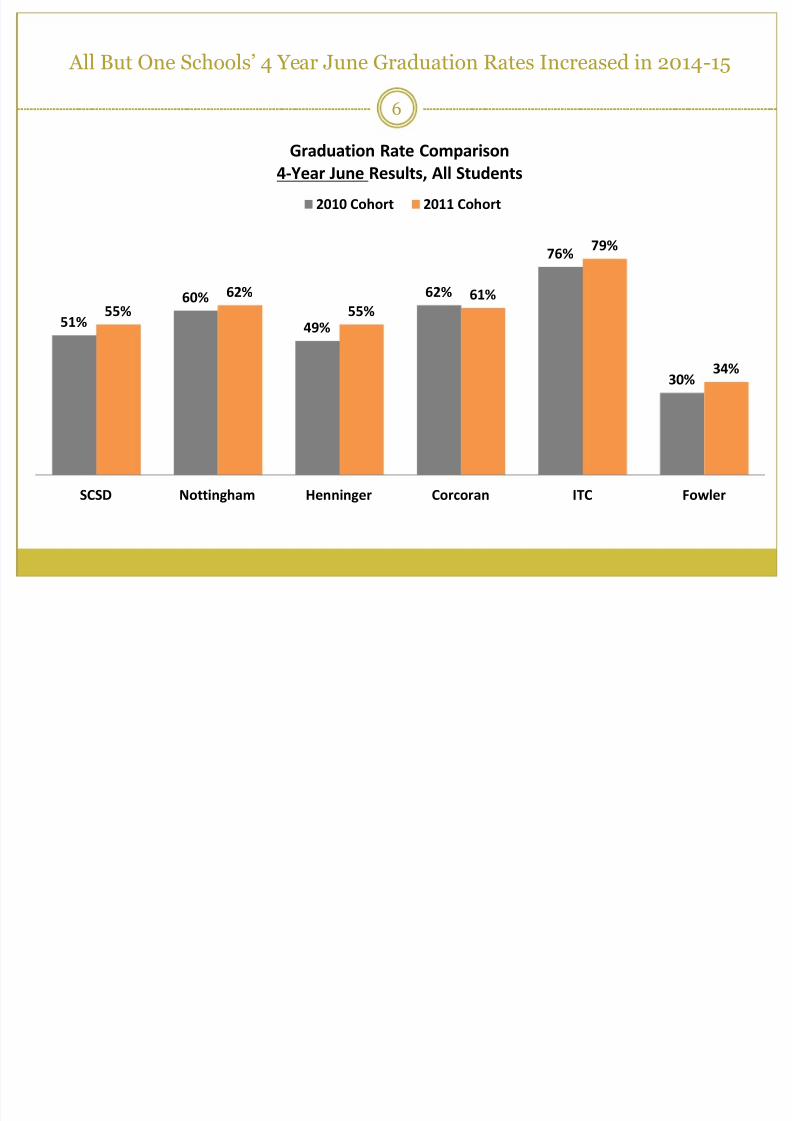
All But One Schools’ 4 Year June Graduation Rates Increased in 2014-15
51%
60%
49%
62%
76%
30%
55%
62%
55%
61%
79%
34%
SCSD Nottingham Henninger Corcoran ITC Fowler
Graduation Rate Comparison
4-Year June Results, All Students
2010 Cohort 2011 Cohort
7/23/2019 2014-2015 Graduation Data SCSD
http://slidepdf.com/reader/full/2014-2015-graduation-data-scsd 7/38
7
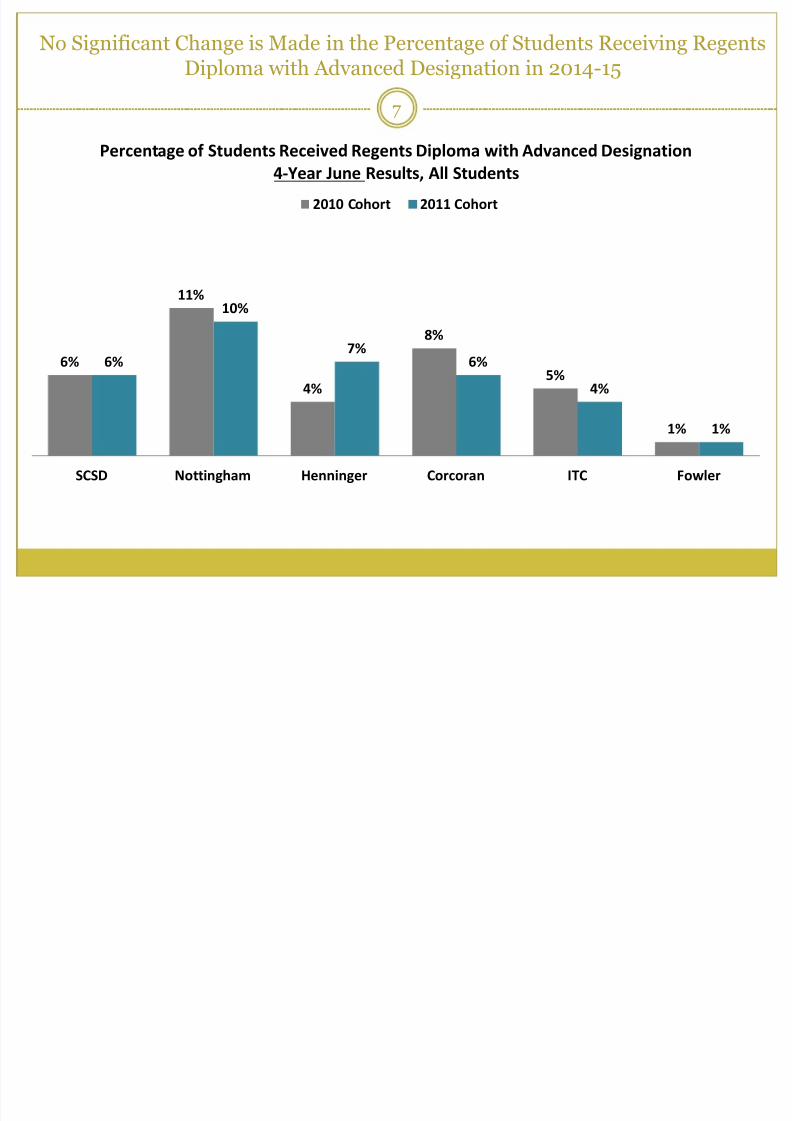
6%
11%
4%
8%
5%
1%
6%
10%
7%6%
4%
1%
SCSD Nottingham Henninger Corcoran ITC Fowler
Percentage of Students Received Regents Diploma with Advanced Designation
4-Year June Results, All Students
2010 Cohort 2011 Cohort
No Significant Change is Made in the Percentage of Students Receiving RegentsDiploma with Advanced Designation in 2014-15
7/23/2019 2014-2015 Graduation Data SCSD
http://slidepdf.com/reader/full/2014-2015-graduation-data-scsd 8/38
8
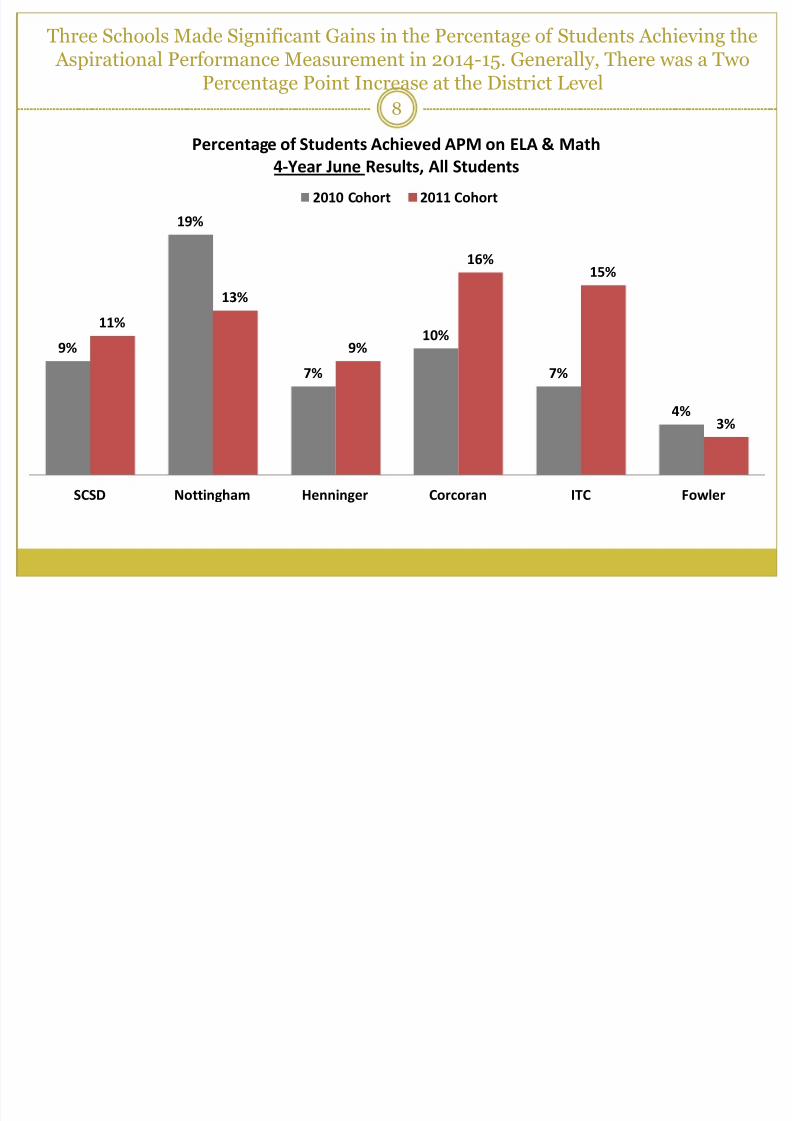
9%
19%
7%
10%
7%
4%
11%
13%
9%
16%
15%
3%
SCSD Nottingham Henninger Corcoran ITC Fowler
Percentage of Students Achieved APM on ELA & Math
4-Year June Results, All Students
2010 Cohort 2011 Cohort
Three Schools Made Significant Gains in the Percentage of Students Achieving the Aspirational Performance Measurement in 2014-15. Generally, There was a Two
Percentage Point Increase at the District Level
7/23/2019 2014-2015 Graduation Data SCSD
http://slidepdf.com/reader/full/2014-2015-graduation-data-scsd 9/38
9
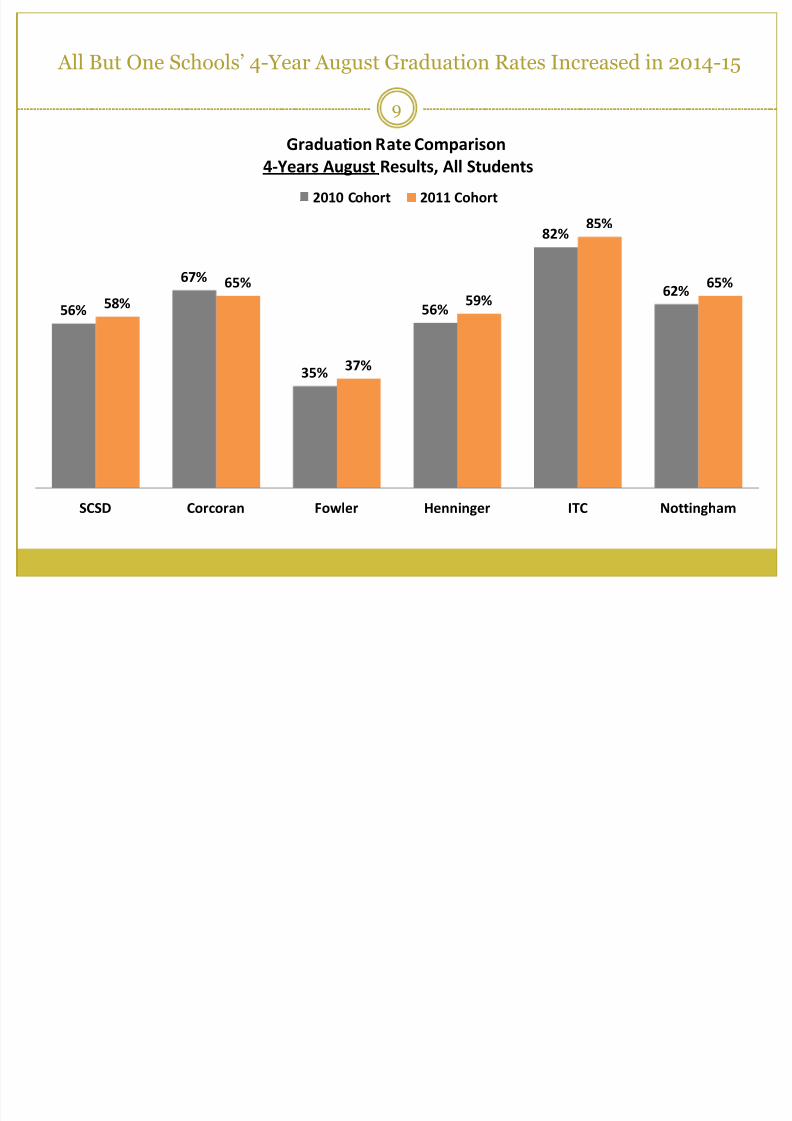
All But One Schools’ 4-Year August Graduation Rates Increased in 2014-15
56%
67%
35%
56%
82%
62%58%
65%
37%
59%
85%
65%
SCSD Corcoran Fowler Henninger ITC Nottingham
Graduation Rate Comparison
4-Years August Results, All Students
2010 Cohort 2011 Cohort
7/23/2019 2014-2015 Graduation Data SCSD
http://slidepdf.com/reader/full/2014-2015-graduation-data-scsd 10/38
10
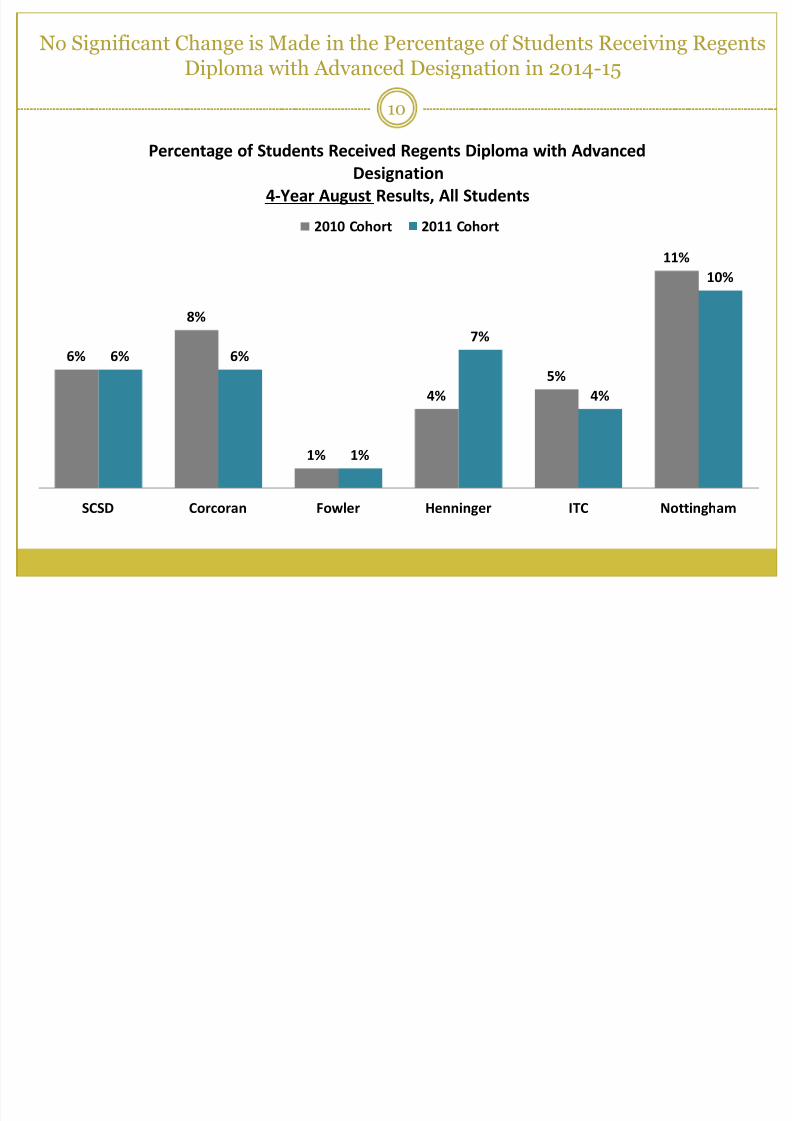
No Significant Change is Made in the Percentage of Students Receiving RegentsDiploma with Advanced Designation in 2014-15
6%
8%
1%
4%
5%
11%
6% 6%
1%
7%
4%
10%
SCSD Corcoran Fowler Henninger ITC Nottingham
Percentage of Students Received Regents Diploma with Advanced
Designation
4-Year August Results, All Students
2010 Cohort 2011 Cohort
7/23/2019 2014-2015 Graduation Data SCSD
http://slidepdf.com/reader/full/2014-2015-graduation-data-scsd 11/38
11
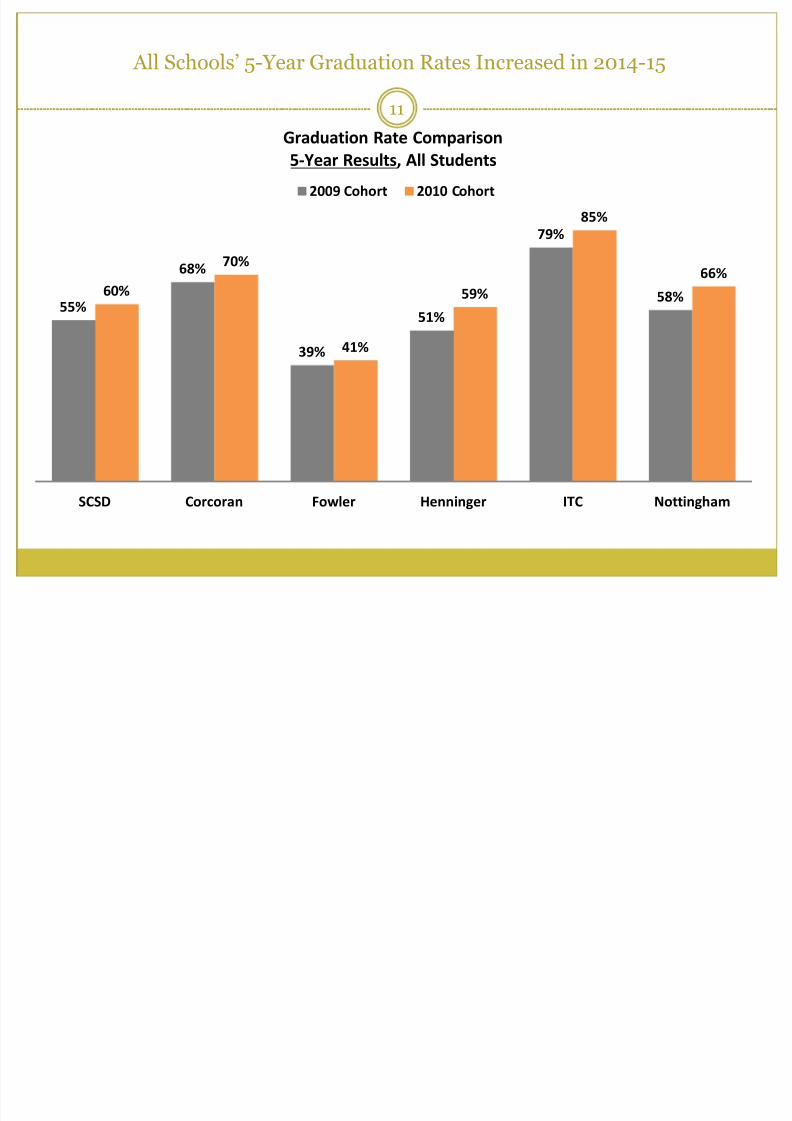
All Schools’ 5-Year Graduation Rates Increased in 2014-15
55%
68%
39%
51%
79%
58%60%
70%
41%
59%
85%
66%
SCSD Corcoran Fowler Henninger ITC Nottingham
Graduation Rate Comparison5-Year Results, All Students
2009 Cohort 2010 Cohort
7/23/2019 2014-2015 Graduation Data SCSD
http://slidepdf.com/reader/full/2014-2015-graduation-data-scsd 12/38
12
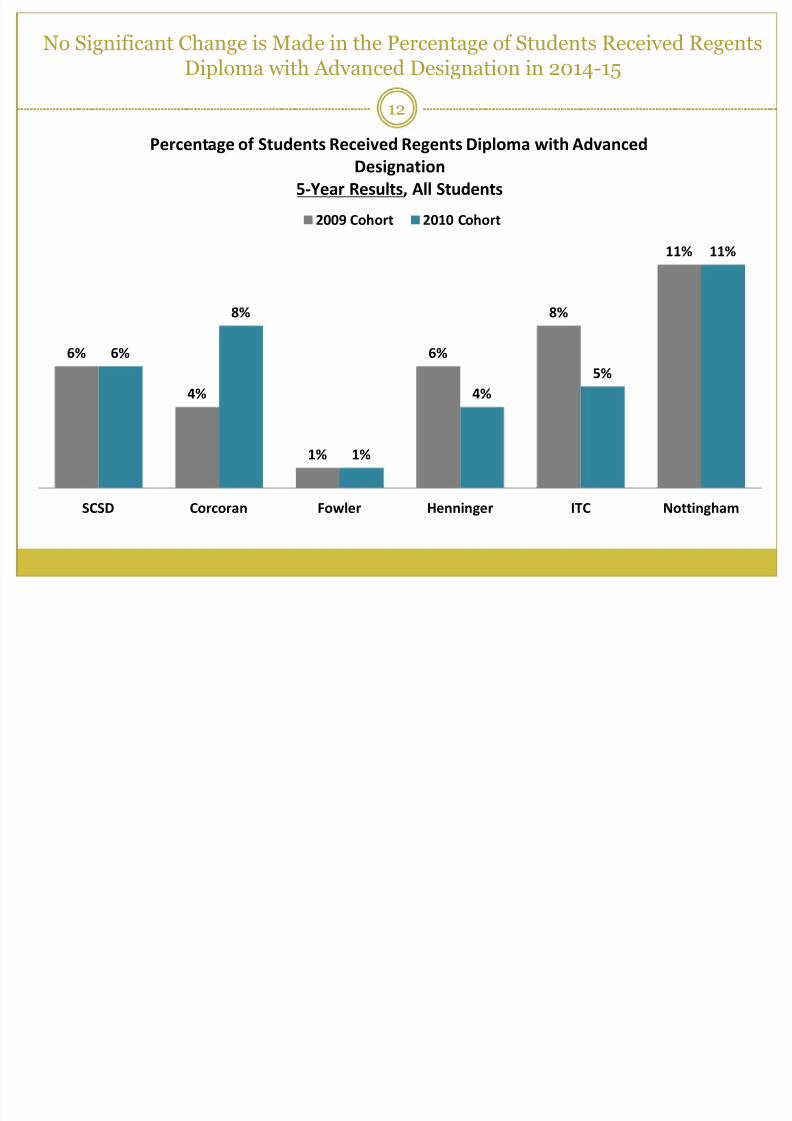
No Significant Change is Made in the Percentage of Students Received RegentsDiploma with Advanced Designation in 2014-15
6%
4%
1%
6%
8%
11%
6%
8%
1%
4%
5%
11%
SCSD Corcoran Fowler Henninger ITC Nottingham
Percentage of Students Received Regents Diploma with Advanced
Designation
5-Year Results, All Students
2009 Cohort 2010 Cohort
7/23/2019 2014-2015 Graduation Data SCSD
http://slidepdf.com/reader/full/2014-2015-graduation-data-scsd 13/38
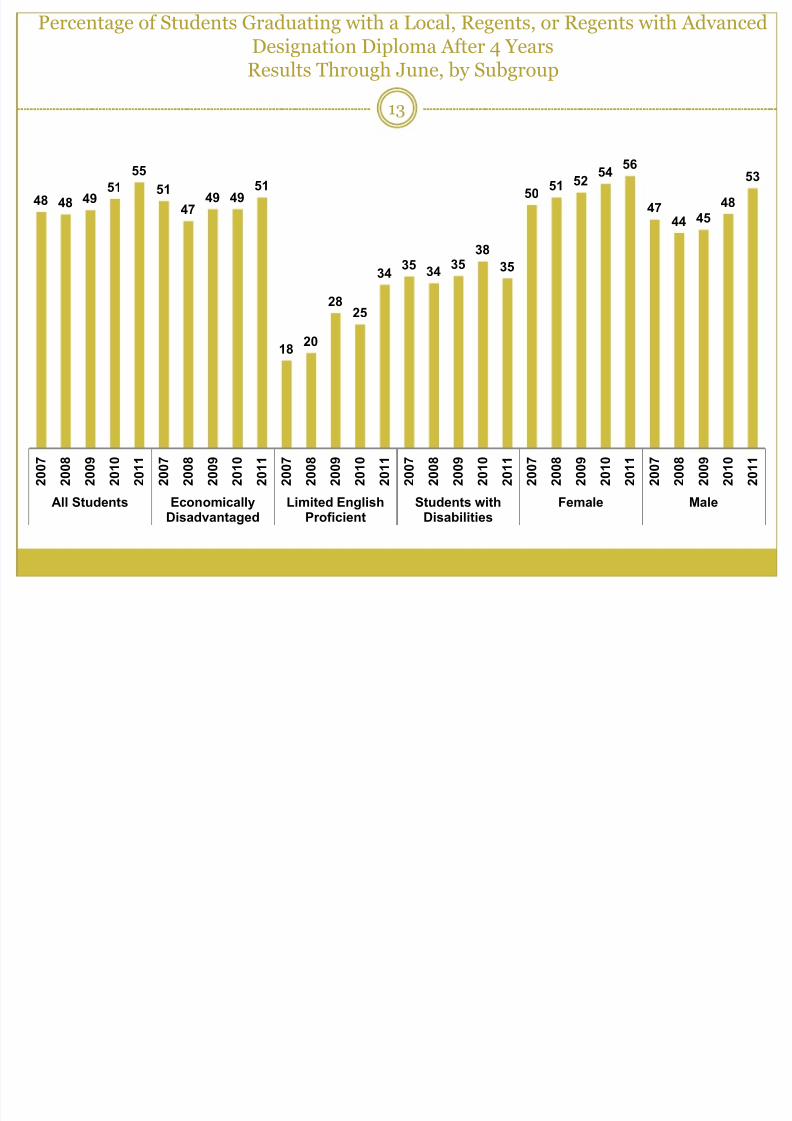
Percentage of Students Graduating with a Local, Regents, or Regents with AdvancedDesignation Diploma After 4 YearsResults Through June, by Subgroup
13
48 48 4951
55
51
4749 49
51
1820
2825
34
35
34
3538
35
5051 52
5456
4744 45
48
53
2 0 0 7
2 0 0 8
2 0 0 9
2 0 1 0
2 0 1 1
2 0 0 7
2 0 0 8
2 0 0 9
2 0 1 0
2 0 1 1
2 0 0 7
2 0 0 8
2 0 0 9
2 0 1 0
2 0 1 1
2 0 0 7
2 0 0 8
2 0 0 9
2 0 1 0
2 0 1 1
2 0 0 7
2 0 0 8
2 0 0 9
2 0 1 0
2 0 1 1
2 0 0 7
2 0 0 8
2 0 0 9
2 0 1 0
2 0 1 1
All Students EconomicallyDisadvantaged
Limited EnglishProficient
Students withDisabilities
Female Male
7/23/2019 2014-2015 Graduation Data SCSD
http://slidepdf.com/reader/full/2014-2015-graduation-data-scsd 14/38
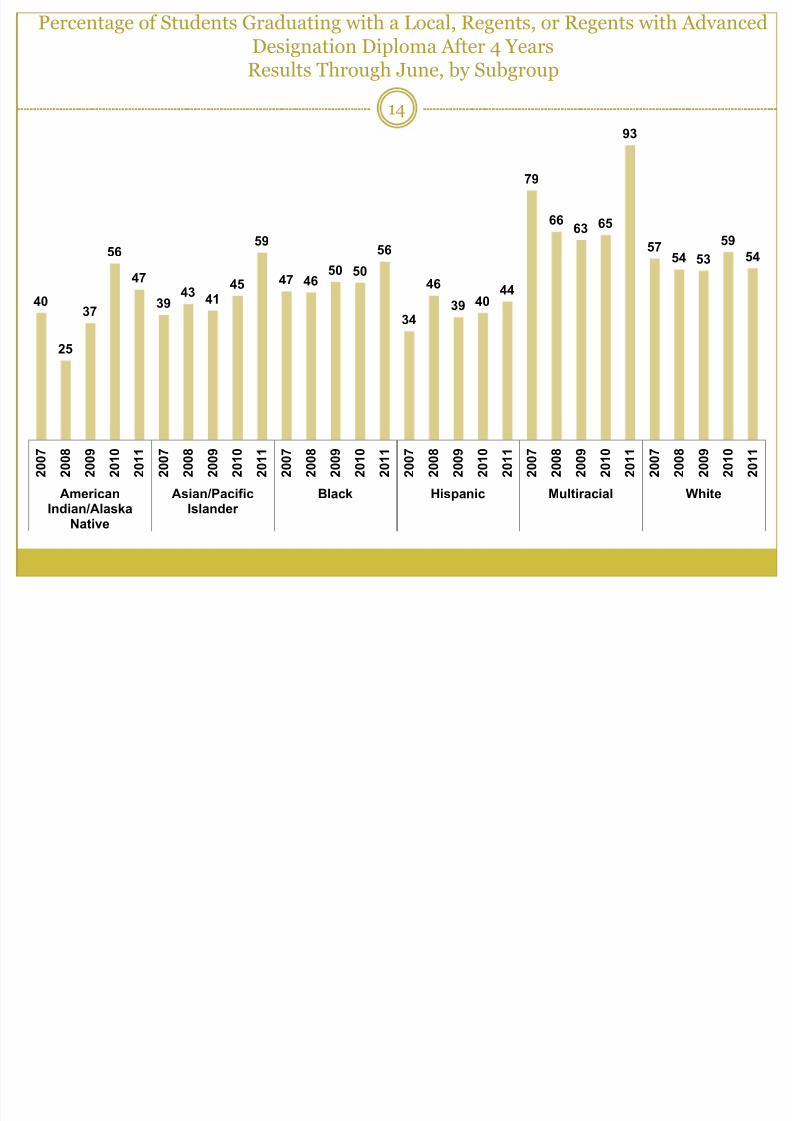
Percentage of Students Graduating with a Local, Regents, or Regents with AdvancedDesignation Diploma After 4 YearsResults Through June, by Subgroup
14
40
25
37
56
47
3943
4145
59
47 4650
50
56
34
46
39 4044
79
6663 65
93
5754 53
59
54
2 0 0 7
2 0 0 8
2 0 0 9
2 0 1 0
2 0 1 1
2 0 0 7
2 0 0 8
2 0 0 9
2 0 1 0
2 0 1 1
2 0 0 7
2 0 0 8
2 0 0 9
2 0 1 0
2 0 1 1
2 0 0 7
2 0 0 8
2 0 0 9
2 0 1 0
2 0 1 1
2 0 0 7
2 0 0 8
2 0 0 9
2 0 1 0
2 0 1 1
2 0 0 7
2 0 0 8
2 0 0 9
2 0 1 0
2 0 1 1
AmericanIndian/Alaska
Native
Asian/PacificIslander
Black Hispanic Multiracial White
7/23/2019 2014-2015 Graduation Data SCSD
http://slidepdf.com/reader/full/2014-2015-graduation-data-scsd 15/38
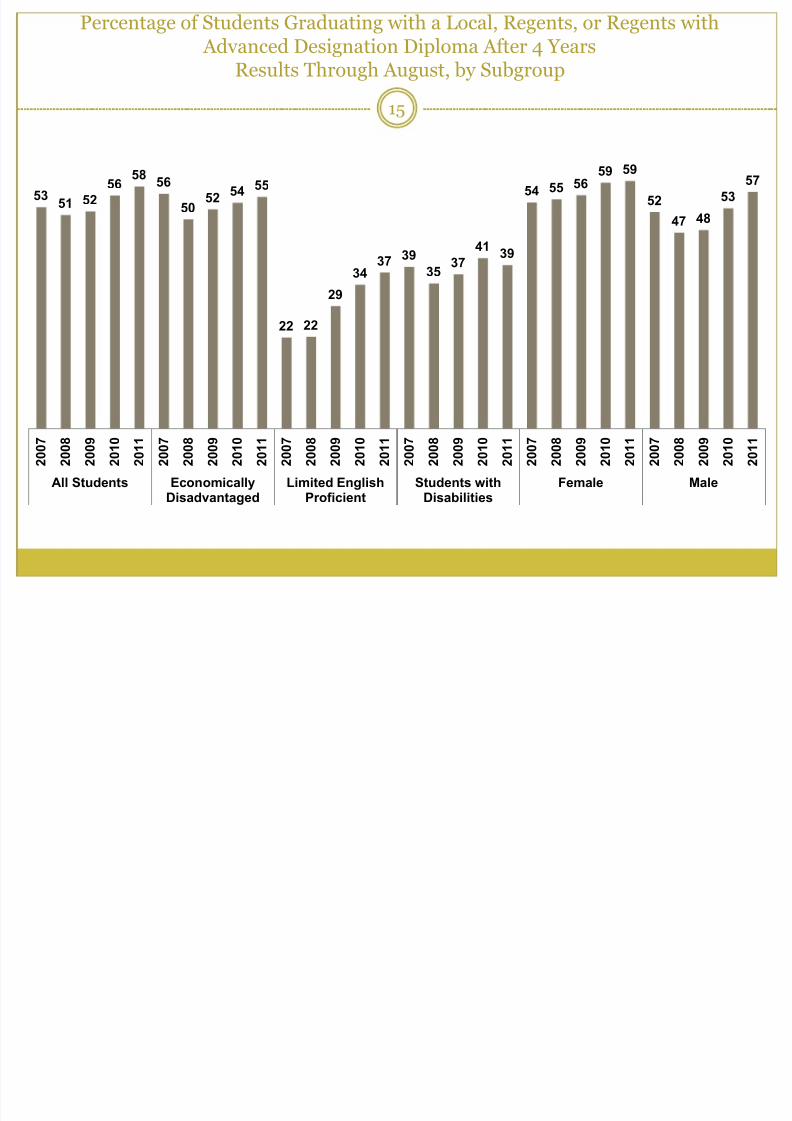
Percentage of Students Graduating with a Local, Regents, or Regents with Advanced Designation Diploma After 4 Years
Results Through August, by Subgroup
15
5351 52
5658
56
5052
54 55
22 22
2934
37 39
35
37
4139
54 55 5659 59
52
47 48
53
57
2 0 0 7
2 0 0 8
2 0 0 9
2 0 1 0
2 0 1 1
2 0 0 7
2 0 0 8
2 0 0 9
2 0 1 0
2 0 1 1
2 0 0 7
2 0 0 8
2 0 0 9
2 0 1 0
2 0 1 1
2 0 0 7
2 0 0 8
2 0 0 9
2 0 1 0
2 0 1 1
2 0 0 7
2 0 0 8
2 0 0 9
2 0 1 0
2 0 1 1
2 0 0 7
2 0 0 8
2 0 0 9
2 0 1 0
2 0 1 1
All Students EconomicallyDisadvantaged
Limited EnglishProficient
Students withDisabilities
Female Male
7/23/2019 2014-2015 Graduation Data SCSD
http://slidepdf.com/reader/full/2014-2015-graduation-data-scsd 16/38
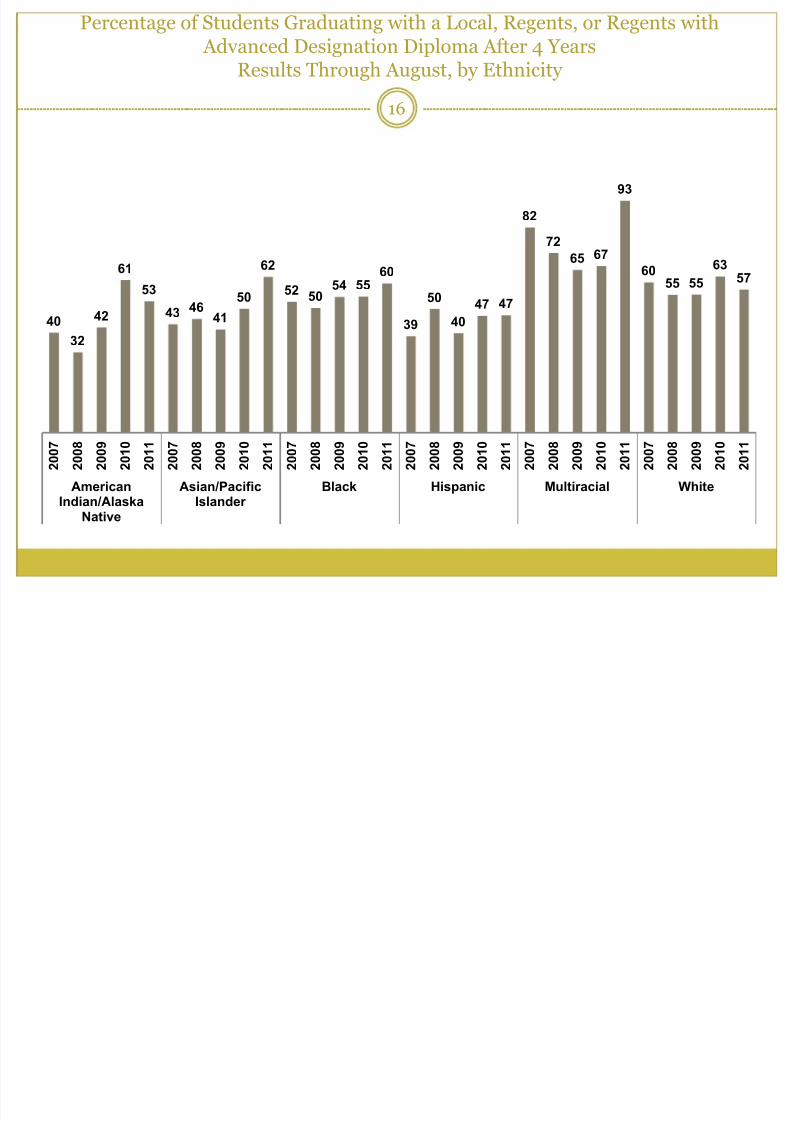
Percentage of Students Graduating with a Local, Regents, or Regents with Advanced Designation Diploma After 4 Years
Results Through August, by Ethnicity
16
40
32
42
61
53
43 4641
50
62
52 5054 55 60
39
50
40
47 47
82
72
65 67
93
6055 55
63
57
2 0 0 7
2 0 0 8
2 0 0 9
2 0 1 0
2 0 1 1
2 0 0 7
2 0 0 8
2 0 0 9
2 0 1 0
2 0 1 1
2 0 0 7
2 0 0 8
2 0 0 9
2 0 1 0
2 0 1 1
2 0 0 7
2 0 0 8
2 0 0 9
2 0 1 0
2 0 1 1
2 0 0 7
2 0 0 8
2 0 0 9
2 0 1 0
2 0 1 1
2 0 0 7
2 0 0 8
2 0 0 9
2 0 1 0
2 0 1 1
AmericanIndian/Alaska
Native
Asian/PacificIslander
Black Hispanic Multiracial White
7/23/2019 2014-2015 Graduation Data SCSD
http://slidepdf.com/reader/full/2014-2015-graduation-data-scsd 17/38
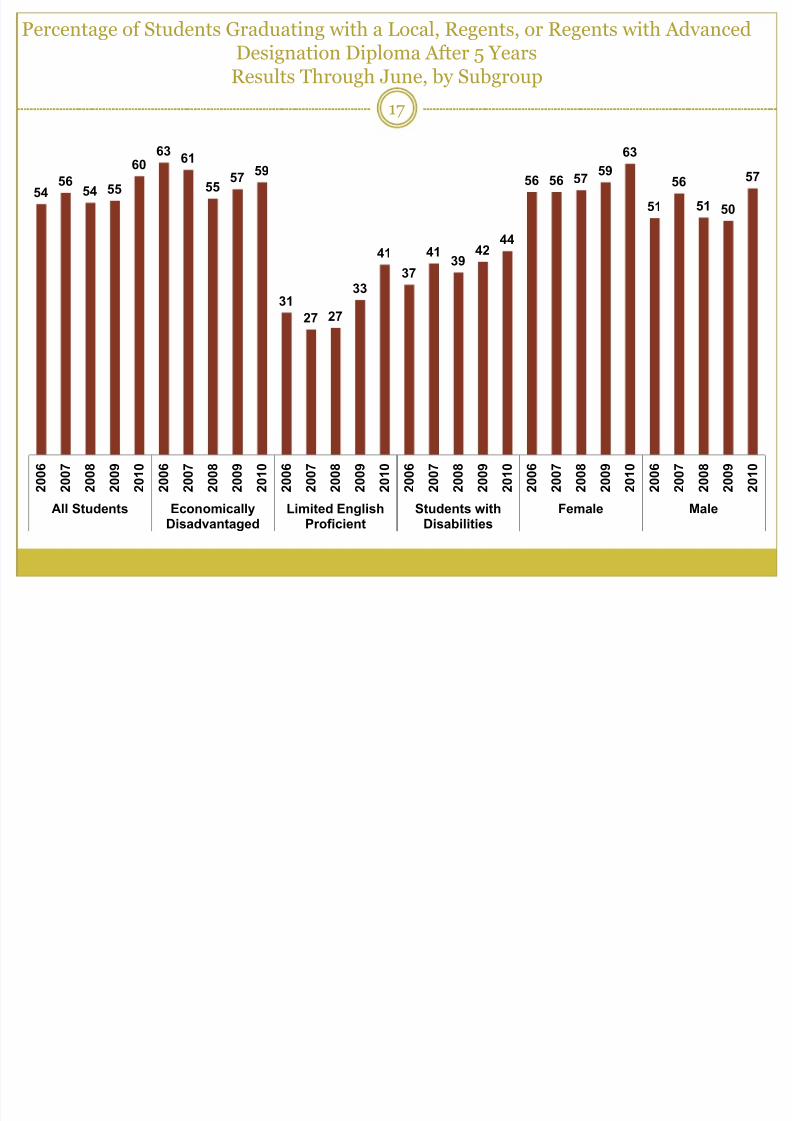
Percentage of Students Graduating with a Local, Regents, or Regents with AdvancedDesignation Diploma After 5 Years
Results Through June, by Subgroup
17
5456
54 55
6063
61
5557
59
31
27 27
33
41
37
4139
4244
56 56 5759
63
51
56
51 50
57
2 0 0 6
2 0 0 7
2 0 0 8
2 0 0 9
2 0 1 0
2 0 0 6
2 0 0 7
2 0 0 8
2 0 0 9
2 0 1 0
2 0 0 6
2 0 0 7
2 0 0 8
2 0 0 9
2 0 1 0
2 0 0 6
2 0 0 7
2 0 0 8
2 0 0 9
2 0 1 0
2 0 0 6
2 0 0 7
2 0 0 8
2 0 0 9
2 0 1 0
2 0 0 6
2 0 0 7
2 0 0 8
2 0 0 9
2 0 1 0
All Students EconomicallyDisadvantaged
Limited EnglishProficient
Students withDisabilities
Female Male
7/23/2019 2014-2015 Graduation Data SCSD
http://slidepdf.com/reader/full/2014-2015-graduation-data-scsd 18/38
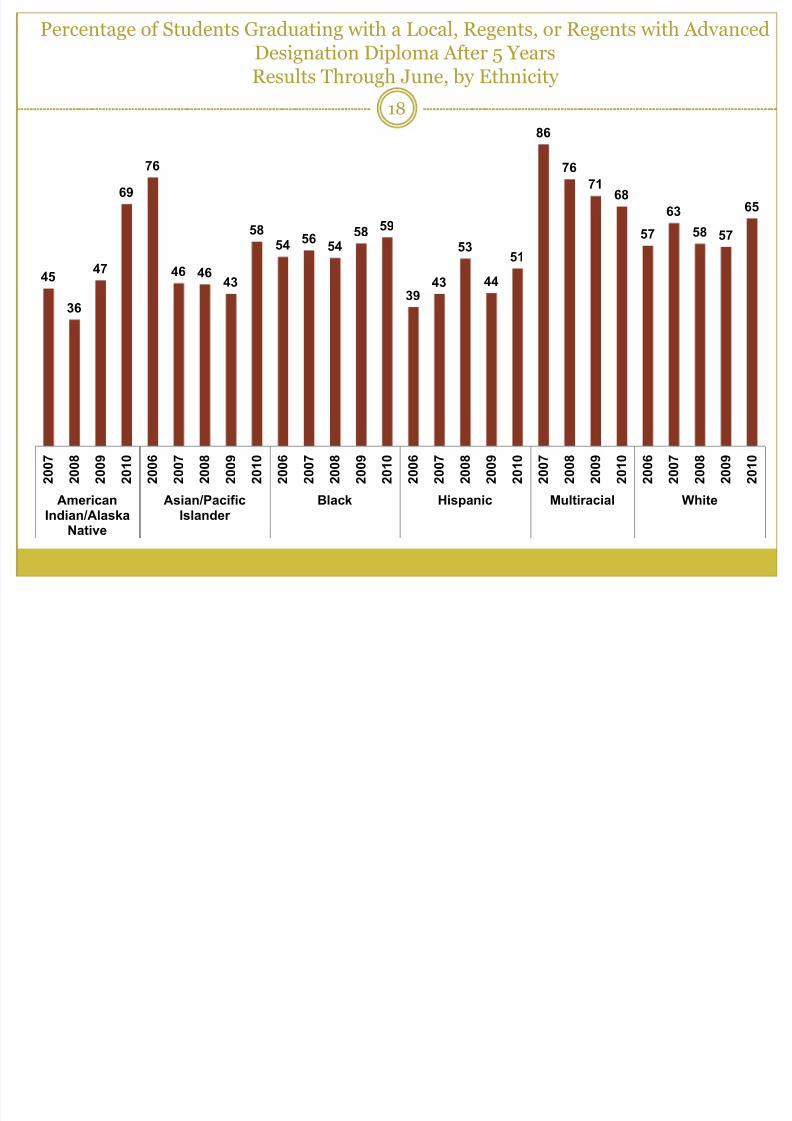
Percentage of Students Graduating with a Local, Regents, or Regents with AdvancedDesignation Diploma After 5 YearsResults Through June, by Ethnicity
18
45
36
47
69
76
46 46 43
5854
5654
58 59
3943
53
44
51
86
76
7168
57
63
58 57
65
2 0 0 7
2 0 0 8
2 0 0 9
2 0 1 0
2 0 0 6
2 0 0 7
2 0 0 8
2 0 0 9
2 0 1 0
2 0 0 6
2 0 0 7
2 0 0 8
2 0 0 9
2 0 1 0
2 0 0 6
2 0 0 7
2 0 0 8
2 0 0 9
2 0 1 0
2 0 0 7
2 0 0 8
2 0 0 9
2 0 1 0
2 0 0 6
2 0 0 7
2 0 0 8
2 0 0 9
2 0 1 0
AmericanIndian/Alaska
Native
Asian/PacificIslander
Black Hispanic Multiracial White
7/23/2019 2014-2015 Graduation Data SCSD
http://slidepdf.com/reader/full/2014-2015-graduation-data-scsd 19/38
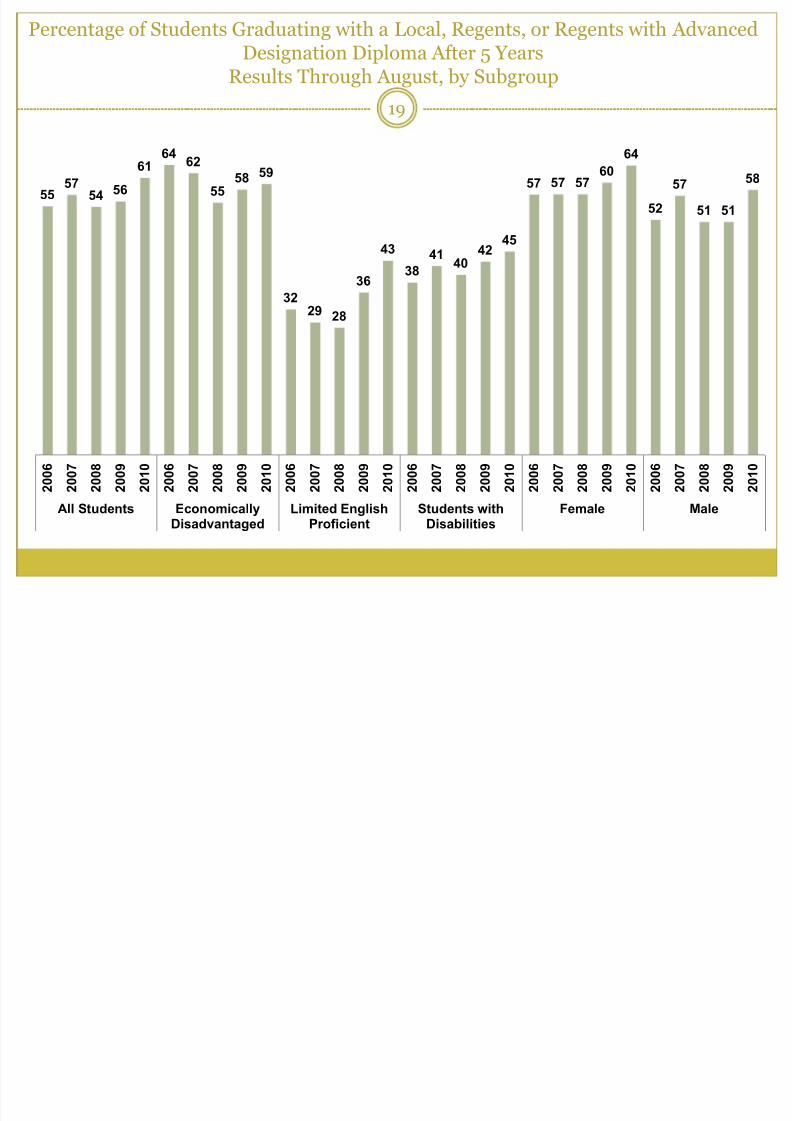
Percentage of Students Graduating with a Local, Regents, or Regents with AdvancedDesignation Diploma After 5 Years
Results Through August, by Subgroup
19
5557
54 56
6164
62
5558 59
3229 28
36
43
38
4140
4245
57 57 5760
64
52
57
51 51
58
2 0 0 6
2 0 0 7
2 0 0 8
2 0 0 9
2 0 1 0
2 0 0 6
2 0 0 7
2 0 0 8
2 0 0 9
2 0 1 0
2 0 0 6
2 0 0 7
2 0 0 8
2 0 0 9
2 0 1 0
2 0 0 6
2 0 0 7
2 0 0 8
2 0 0 9
2 0 1 0
2 0 0 6
2 0 0 7
2 0 0 8
2 0 0 9
2 0 1 0
2 0 0 6
2 0 0 7
2 0 0 8
2 0 0 9
2 0 1 0
All Students EconomicallyDisadvantaged
Limited EnglishProficient
Students withDisabilities
Female Male
7/23/2019 2014-2015 Graduation Data SCSD
http://slidepdf.com/reader/full/2014-2015-graduation-data-scsd 20/38
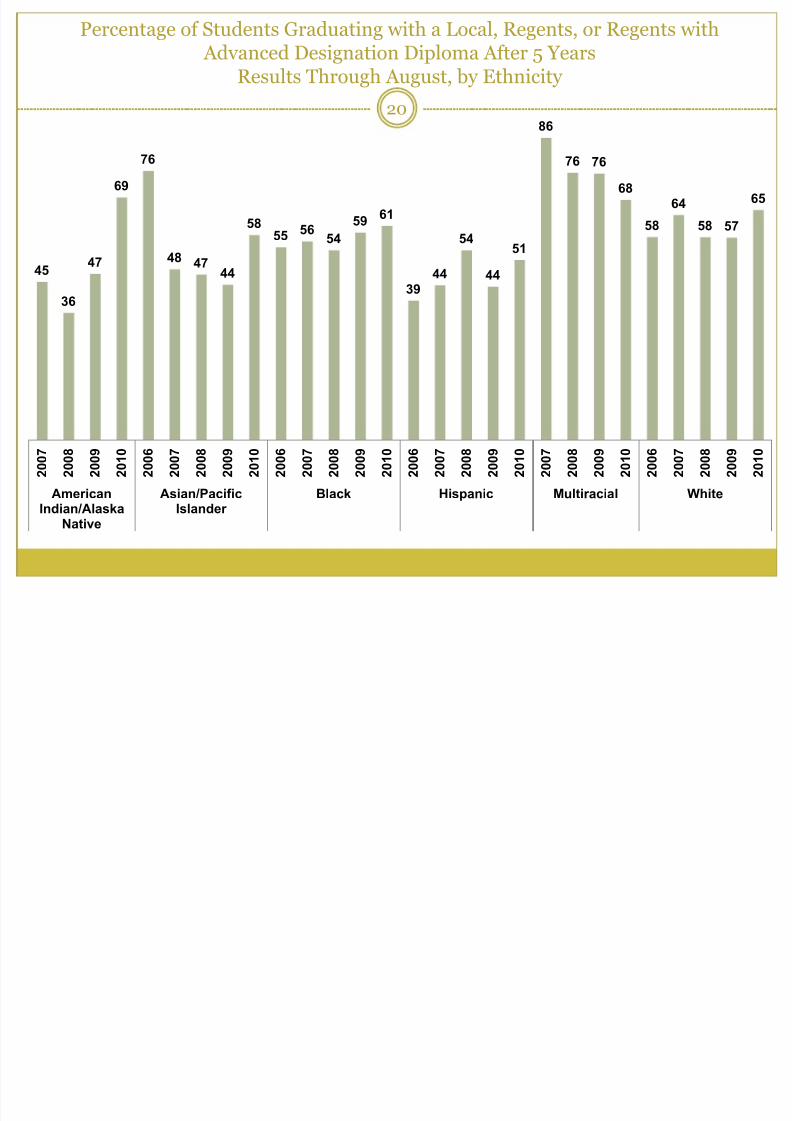
Percentage of Students Graduating with a Local, Regents, or Regents with Advanced Designation Diploma After 5 Years
Results Through August, by Ethnicity
20
45
36
47
69
76
48 47
44
5855 56
54
5961
39 44
54
44
51
86
76 76
68
58
64
58 57
65
2 0 0 7
2 0 0 8
2 0 0 9
2 0 1 0
2 0 0 6
2 0 0 7
2 0 0 8
2 0 0 9
2 0 1 0
2 0 0 6
2 0 0 7
2 0 0 8
2 0 0 9
2 0 1 0
2 0 0 6
2 0 0 7
2 0 0 8
2 0 0 9
2 0 1 0
2 0 0 7
2 0 0 8
2 0 0 9
2 0 1 0
2 0 0 6
2 0 0 7
2 0 0 8
2 0 0 9
2 0 1 0
AmericanIndian/Alaska
Native
Asian/PacificIslander
Black Hispanic Multiracial White
7/23/2019 2014-2015 Graduation Data SCSD
http://slidepdf.com/reader/full/2014-2015-graduation-data-scsd 21/38
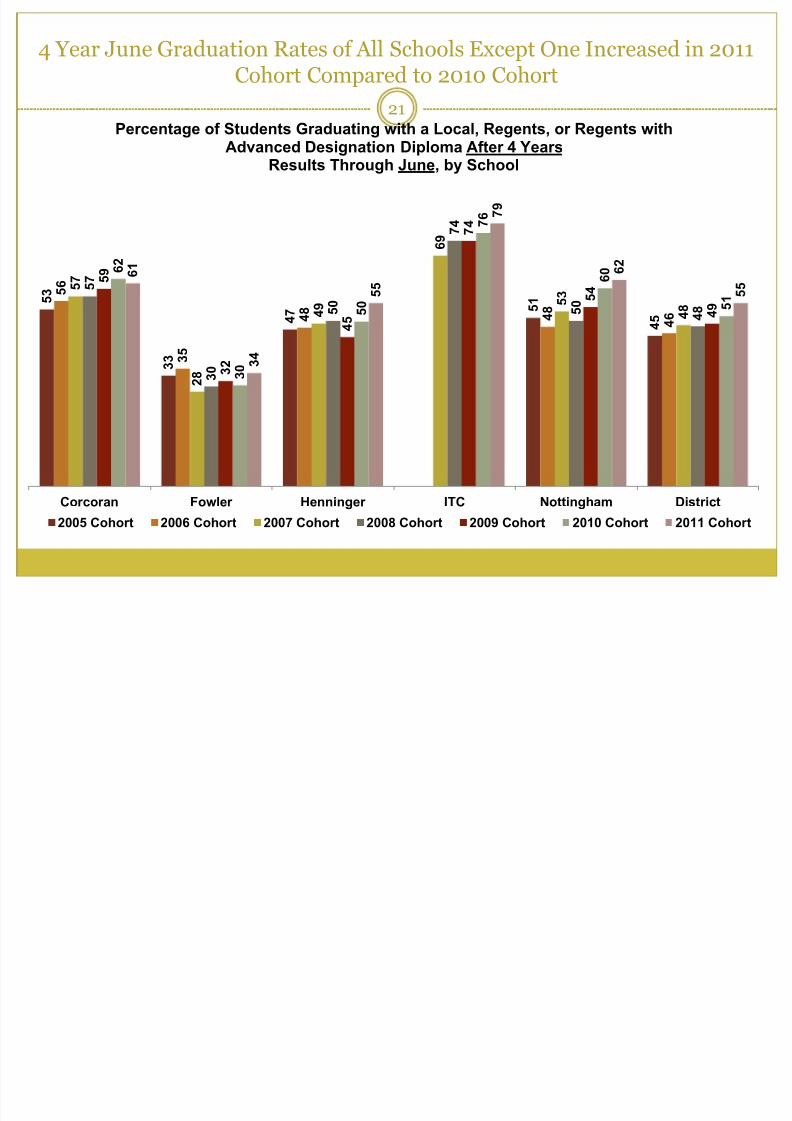
4 Year June Graduation Rates of All Schools Except One Increased in 2011Cohort Compared to 2010 Cohort
21
5 3
3 3
4 7 5
1
4 5
5 6
3 5
4 8
4 8
4 6
5 7
2 8
4 9
6 9
5 3
4 8
5 7
3 0
5 0
7 4
5 0
4 8
5
9
3 2
4 5
7 4
5 4
4 9
6 2
3 0
5 0
7 6
6
0
5 1
6 1
3 4
5 5
7 9
6 2
5 5
Corcoran Fowler Henninger ITC Nottingham District
Percentage of Students Graduating with a Local, Regents, or Regents withAdvanced Designation Diploma After 4 Years
Results Through June, by School
2005 Cohort 2006 Cohort 2007 Cohort 2008 Cohort 2009 Cohort 2010 Cohort 2011 Cohort
7/23/2019 2014-2015 Graduation Data SCSD
http://slidepdf.com/reader/full/2014-2015-graduation-data-scsd 22/38
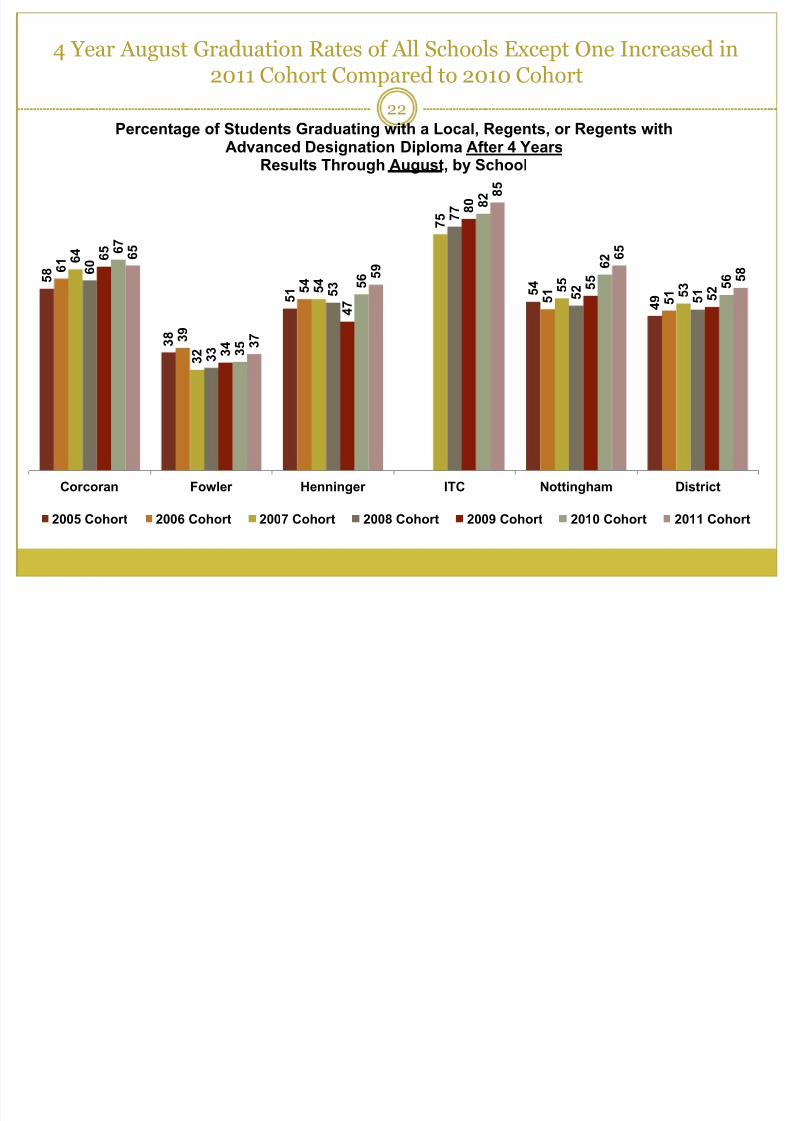
4 Year August Graduation Rates of All Schools Except One Increased in2011 Cohort Compared to 2010 Cohort
22
5
8
3 8
5 1
5 4
4 9
6 1
3 9
5 4
5 1
5 1
6 4
3 2
5 4
7 5
5 5
5 3
6 0
3 3
5 3
7 7
5 2
5 1
6 5
3 4
4 7
8 0
5 5
5 2
6 7
3 5
5 6
8 2
6 2
5 6
6 5
3 7
5 9
8 5
6 5
5
8
Corcoran Fowler Henninger ITC Nottingham District
Percentage of Students Graduating with a Local, Regents, or Regents withAdvanced Designation Diploma After 4 Years
Results Through August, by School
2005 Cohort 2006 Cohort 2007 Cohort 2008 Cohort 2009 Cohort 2010 Cohort 2011 Cohort
7/23/2019 2014-2015 Graduation Data SCSD
http://slidepdf.com/reader/full/2014-2015-graduation-data-scsd 23/38
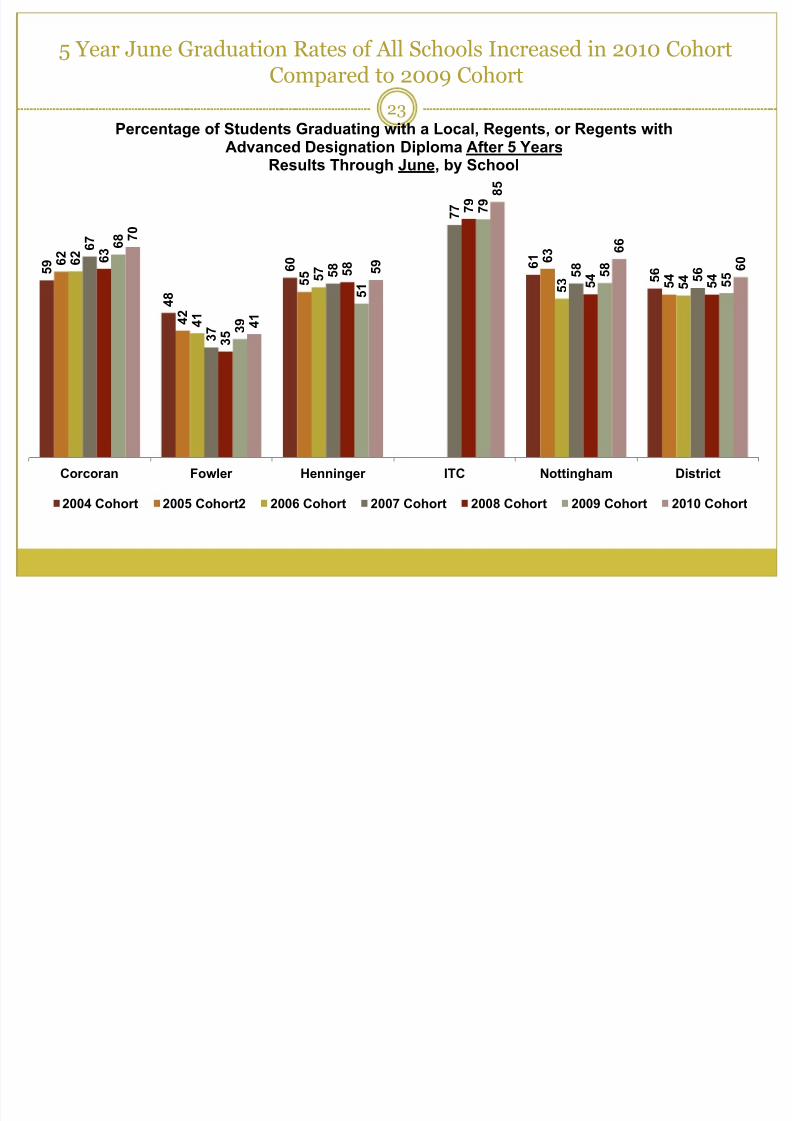
5 Year June Graduation Rates of All Schools Increased in 2010 CohortCompared to 2009 Cohort
23
5 9
4 8
6 0
6 1
5
6 6
2
4 2
5 5
6 3
5 4
6 2
4 1
5
7
5 3
5 4
6 7
3 7
5 8
7 7
5 8
5
6
6 3
3 5
5 8
7 9
5 4
5 4
6 8
3 9
5 1
7 9
5 8
5 5
7 0
4 1
5 9
8 5
6 6
6 0
Corcoran Fowler Henninger ITC Nottingham District
Percentage of Students Graduating with a Local, Regents, or Regents with
Advanced Designation Diploma After 5 YearsResults Through June, by School
2004 Cohort 2005 Cohort2 2006 Cohort 2007 Cohort 2008 Cohort 2009 Cohort 2010 Cohort
7/23/2019 2014-2015 Graduation Data SCSD
http://slidepdf.com/reader/full/2014-2015-graduation-data-scsd 24/38
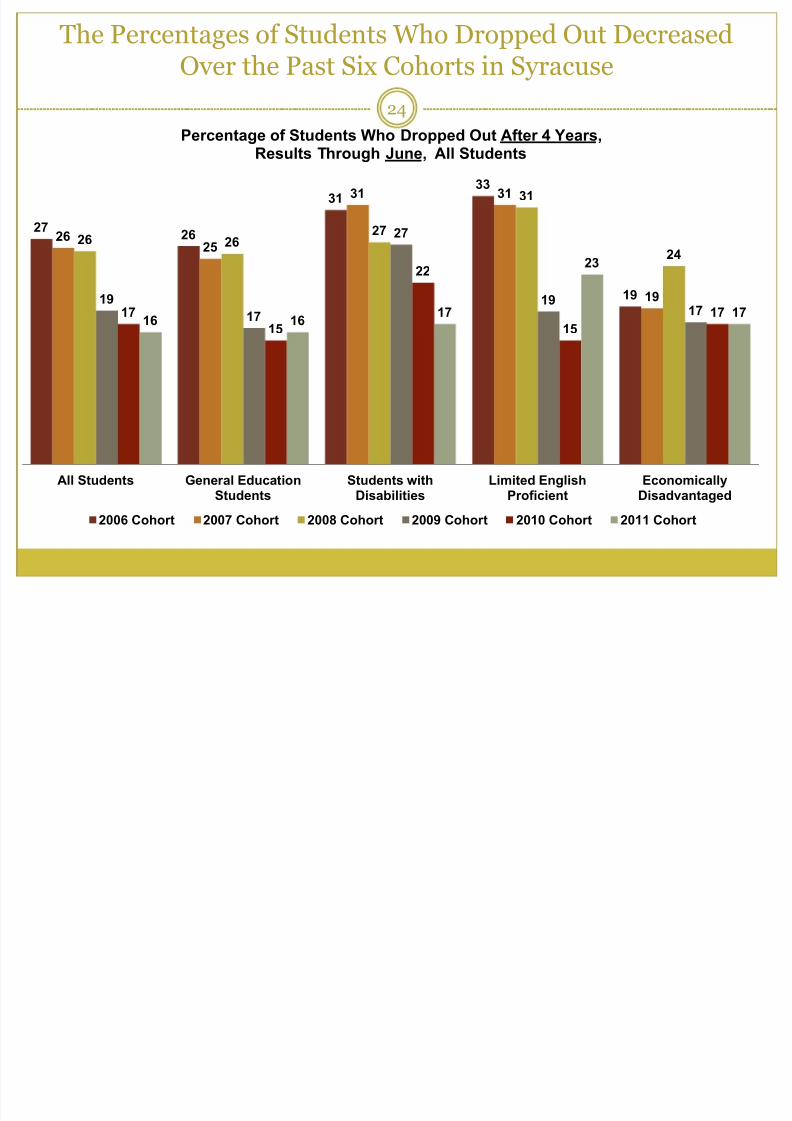
The Percentages of Students Who Dropped Out DecreasedOver the Past Six Cohorts in Syracuse
24
2726
3133
19
2625
31 31
19
26 2627
31
24
19
17
27
191717
15
22
15
1716 16
17
23
17
All Students General EducationStudents
Students withDisabilities
Limited EnglishProficient
EconomicallyDisadvantaged
Percentage of Students Who Dropped Out After 4 Years,Results Through June, All Students
2006 Cohort 2007 Cohort 2008 Cohort 2009 Cohort 2010 Cohort 2011 Cohort
7/23/2019 2014-2015 Graduation Data SCSD
http://slidepdf.com/reader/full/2014-2015-graduation-data-scsd 25/38
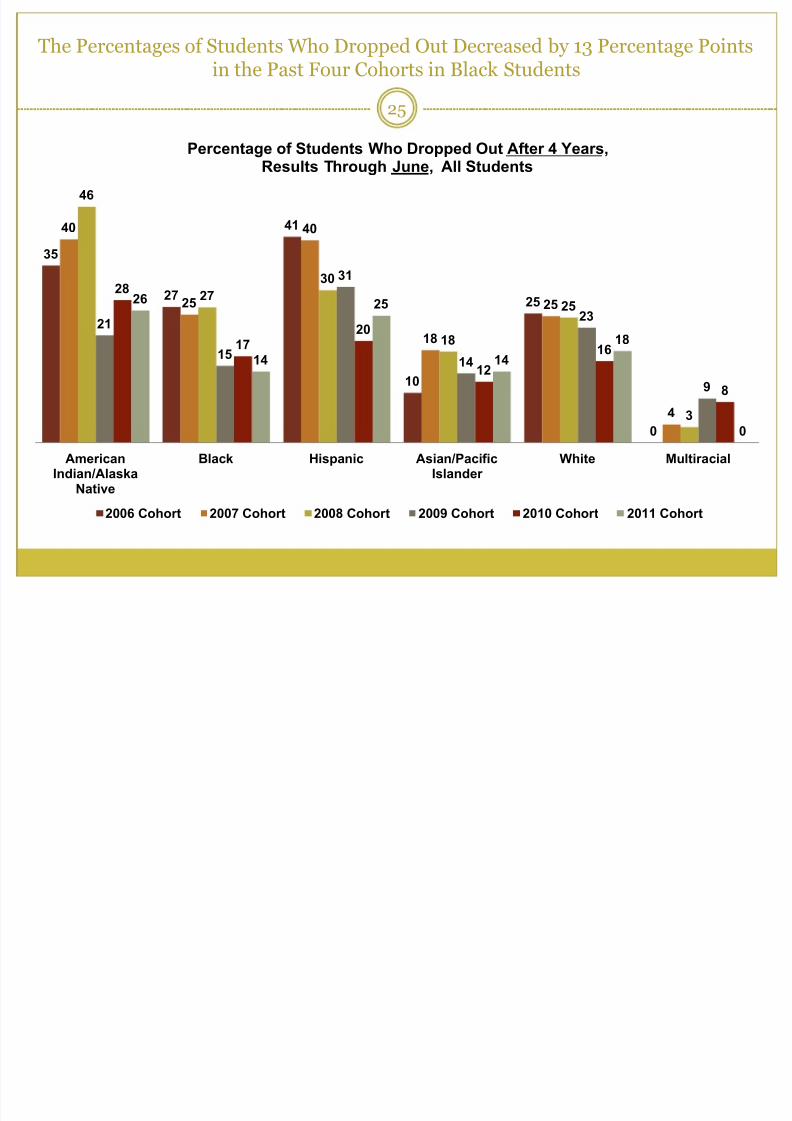
The Percentages of Students Who Dropped Out Decreased by 13 Percentage Pointsin the Past Four Cohorts in Black Students
25
35
27
41
10
25
0
40
25
40
18
25
4
46
2730
18
25
3
21
15
31
14
23
9
28
1720
12
16
8
26
14
25
14
18
0
AmericanIndian/Alaska
Native
Black Hispanic Asian/PacificIslander
White Multiracial
Percentage of Students Who Dropped Out After 4 Years,Results Through June, All Students
2006 Cohort 2007 Cohort 2008 Cohort 2009 Cohort 2010 Cohort 2011 Cohort
7/23/2019 2014-2015 Graduation Data SCSD
http://slidepdf.com/reader/full/2014-2015-graduation-data-scsd 26/38
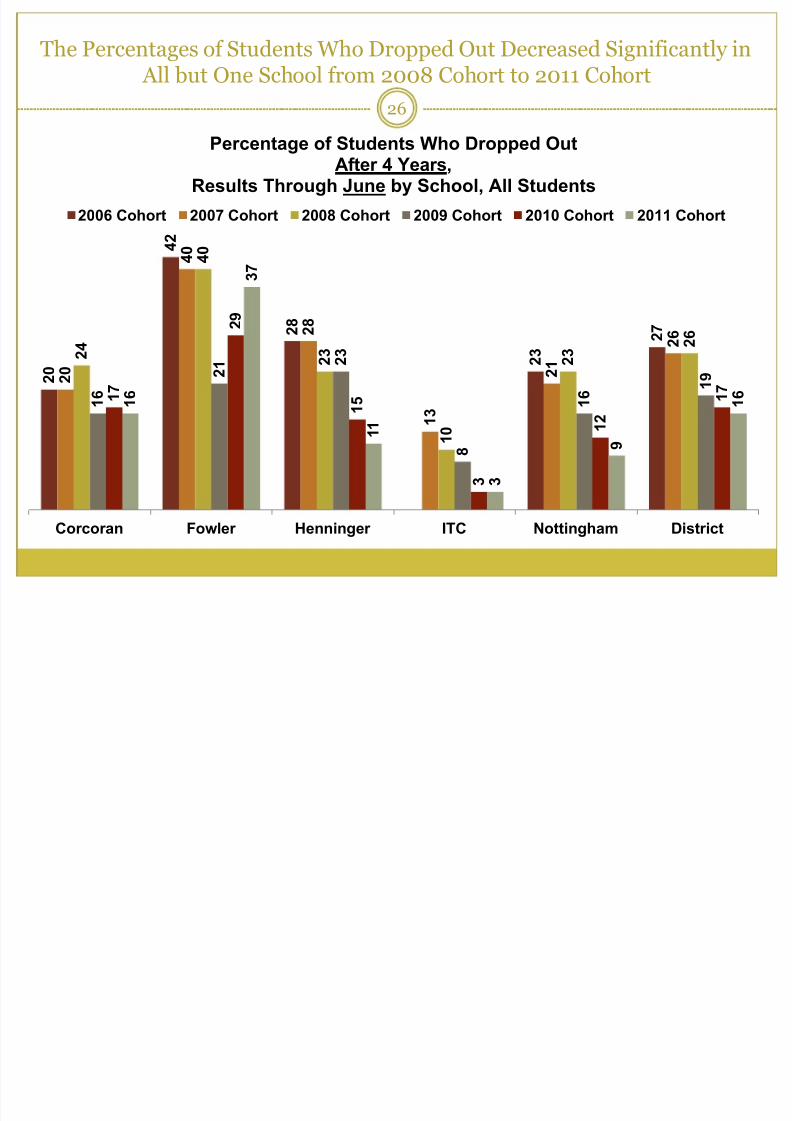
The Percentages of Students Who Dropped Out Decreased Significantly in All but One School from 2008 Cohort to 2011 Cohort
26
2 0
4 2
2 8
2 3
2 7
2 0
4 0
2 8
1 3
2 1
2 6
2 4
4 0
2 3
1 0
2 3 2
6
1 6
2 1
2 3
8
1 6 1
9
1 7
2 9
1 5
3
1 2
1 7
1 6
3
7
1 1
3
9
1 6
Corcoran Fowler Henninger ITC Nottingham District
Percentage of Students Who Dropped OutAfter 4 Years,
Results Through June by School, All Students
2006 Cohort 2007 Cohort 2008 Cohort 2009 Cohort 2010 Cohort 2011 Cohort
7/23/2019 2014-2015 Graduation Data SCSD
http://slidepdf.com/reader/full/2014-2015-graduation-data-scsd 27/38
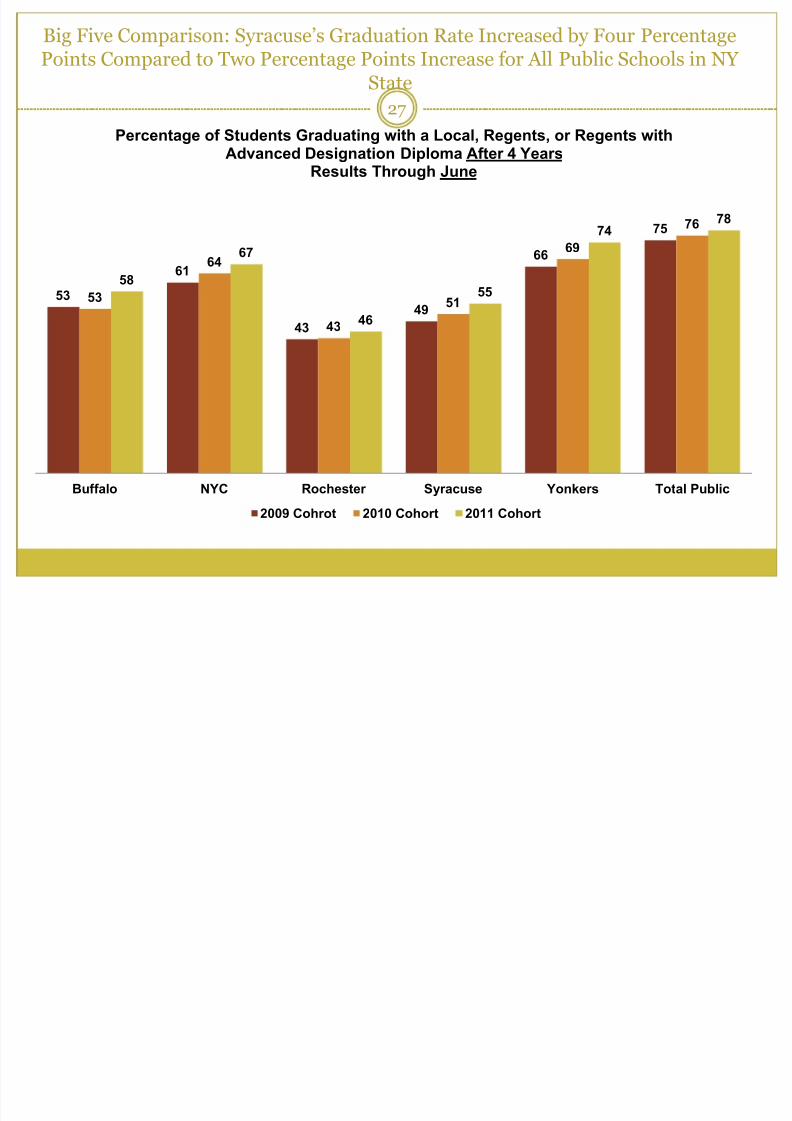
Big Five Comparison: Syracuse’s Graduation Rate Increased by Four PercentagePoints Compared to Two Percentage Points Increase for All Public Schools in NY
State
27
53
61
43
49
66
75
53
64
43
51
69
76
58
67
46
55
7478
Buffalo NYC Rochester Syracuse Yonkers Total Public
Percentage of Students Graduating with a Local, Regents, or Regents withAdvanced Designation Diploma After 4 YearsResults Through June
2009 Cohrot 2010 Cohort 2011 Cohort
7/23/2019 2014-2015 Graduation Data SCSD
http://slidepdf.com/reader/full/2014-2015-graduation-data-scsd 28/38
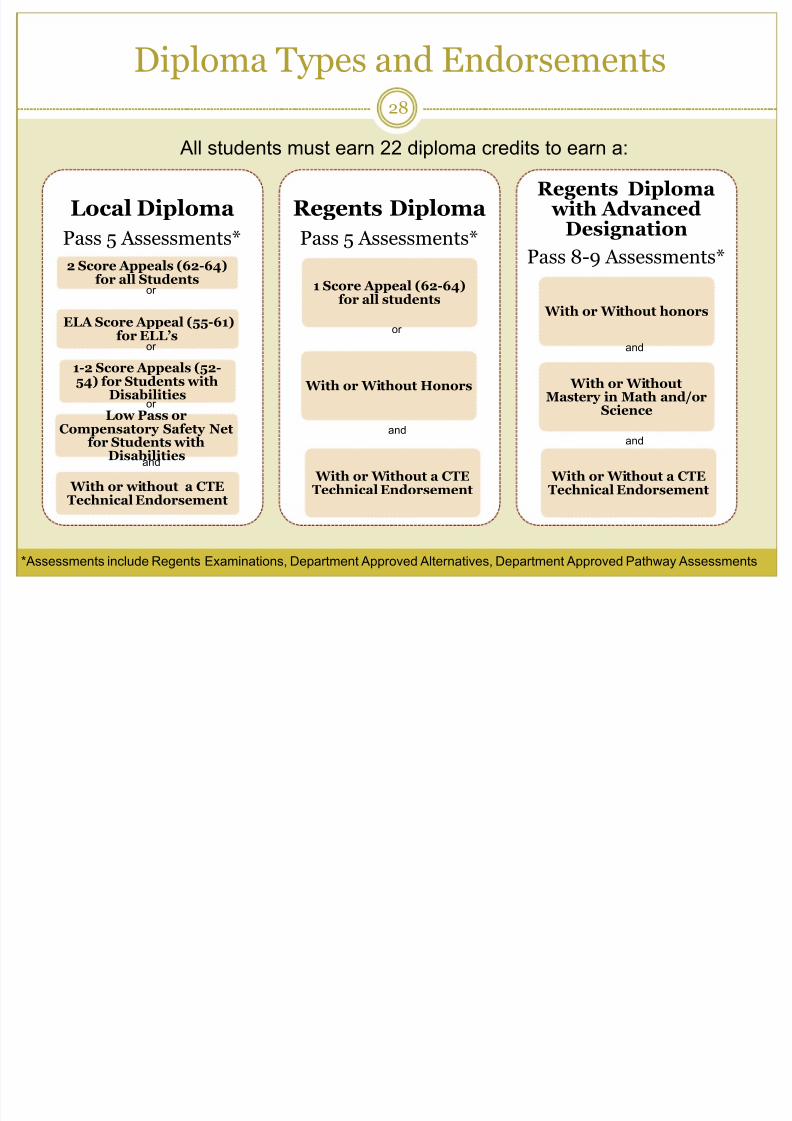
Diploma Types and Endorsements
Local Diploma
Pass 5 Assessments*
2 Score Appeals (62-64)
for all Students
ELA Score Appeal (55-61)for ELL’s
1-2 Score Appeals (52-54) for Students with
Disabilities
Low Pass orCompensatory Safety Netfor Students with
Disabilities
With or without a CTETechnical Endorsement
Regents Diploma
Pass 5 Assessments*
1 Score Appeal (62-64)for all students
With or Without Honors
With or Without a CTETechnical Endorsement
Regents Diploma with Advanced
Designation
Pass 8-9 Assessments*
With or Without honors
With or WithoutMastery in Math and/or
Science
With or Without a CTETechnical Endorsement
All students must earn 22 diploma credits to earn a:
or
or
and
or
and
and
and
or
*Assessments include Regents Examinations, Department Approved Alternatives, Department Approved Pathway Assessments
28
7/23/2019 2014-2015 Graduation Data SCSD
http://slidepdf.com/reader/full/2014-2015-graduation-data-scsd 29/38
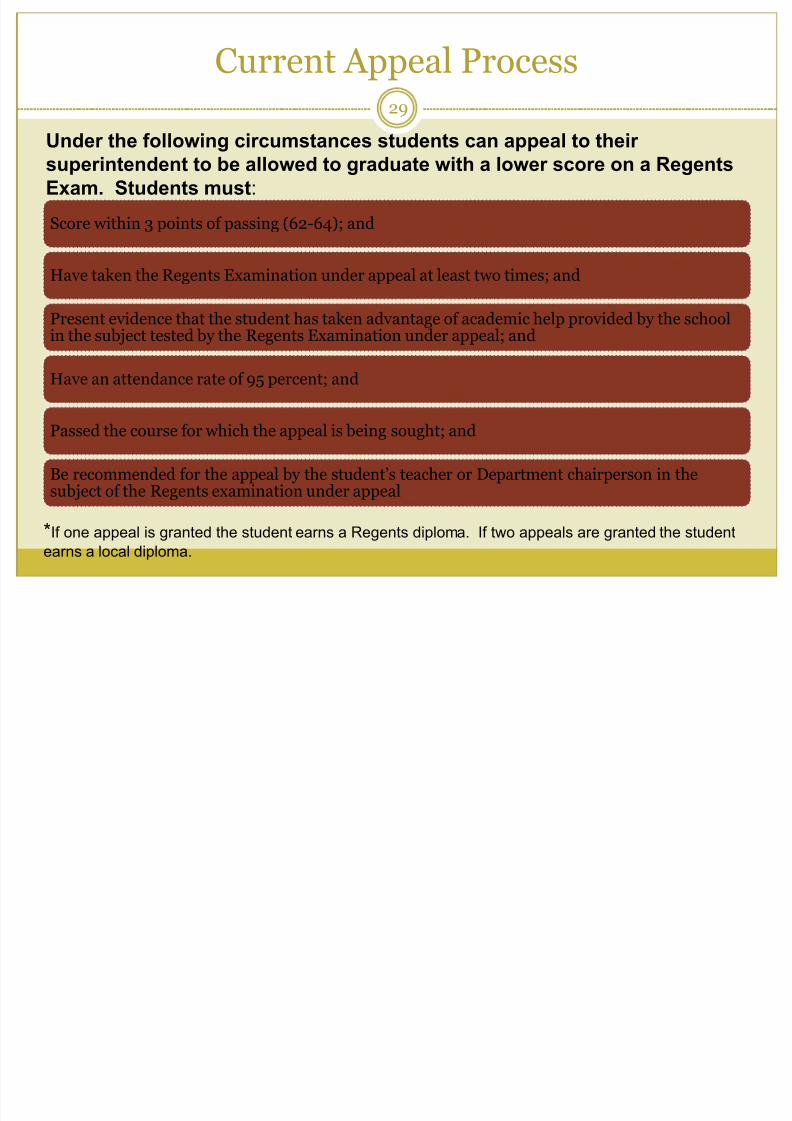
Current Appeal Process
Under the following circumstances students can appeal to theirsuperintendent to be allowed to graduate with a lower score on a Regents
Exam. Students must:
*If one appeal is granted the student earns a Regents diploma. If two appeals are granted the student
earns a local diploma.
Score within 3 points of passing (62-64); and
Have taken the Regents Examination under appeal at least two times; and
Present evidence that the student has taken advantage of academic help provided by the schoolin the subject tested by the Regents Examination under appeal; and
Have an attendance rate of 95 percent; and
Passed the course for which the appeal is being sought; and
Be recommended for the appeal by the student’s teacher or Department chairperson in thesubject of the Regents examination under appeal
29
7/23/2019 2014-2015 Graduation Data SCSD
http://slidepdf.com/reader/full/2014-2015-graduation-data-scsd 30/38
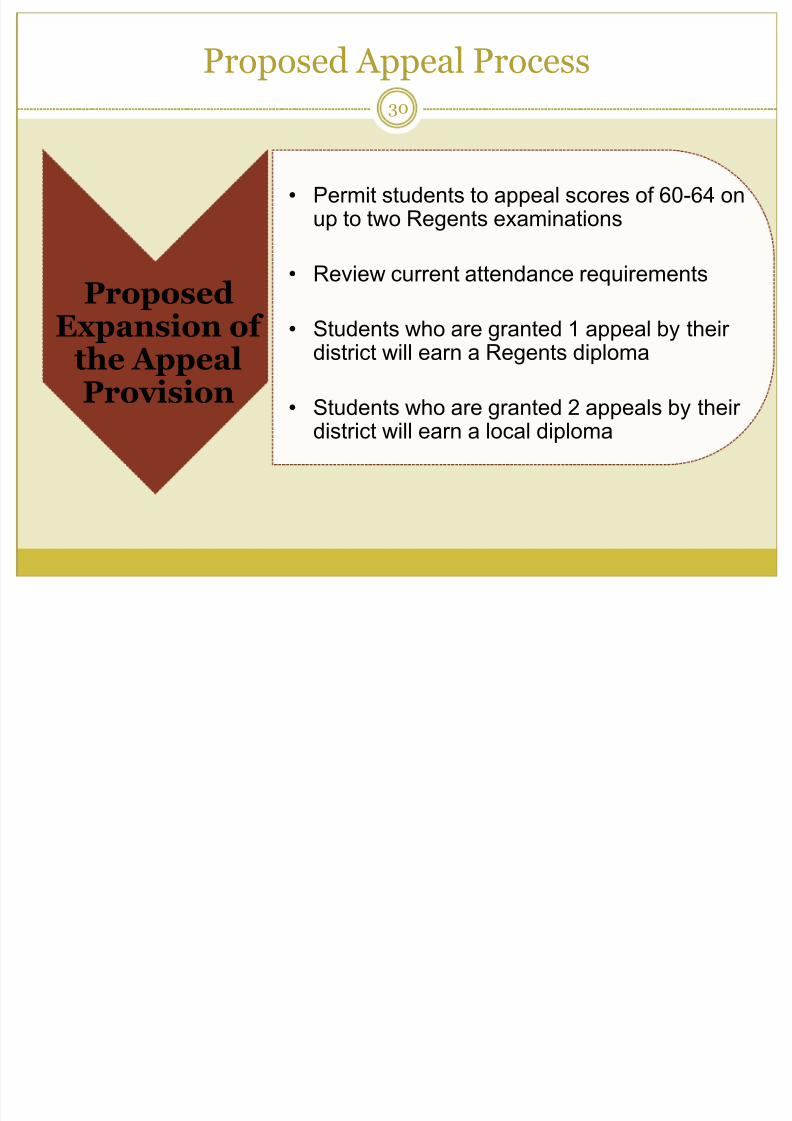
ProposedExpansion of
the AppealProvision
• Permit students to appeal scores of 60-64 onup to two Regents examinations
•
Review current attendance requirements
• Students who are granted 1 appeal by theirdistrict will earn a Regents diploma
•
Students who are granted 2 appeals by theirdistrict will earn a local diploma
Proposed Appeal Process30
7/23/2019 2014-2015 Graduation Data SCSD
http://slidepdf.com/reader/full/2014-2015-graduation-data-scsd 31/38
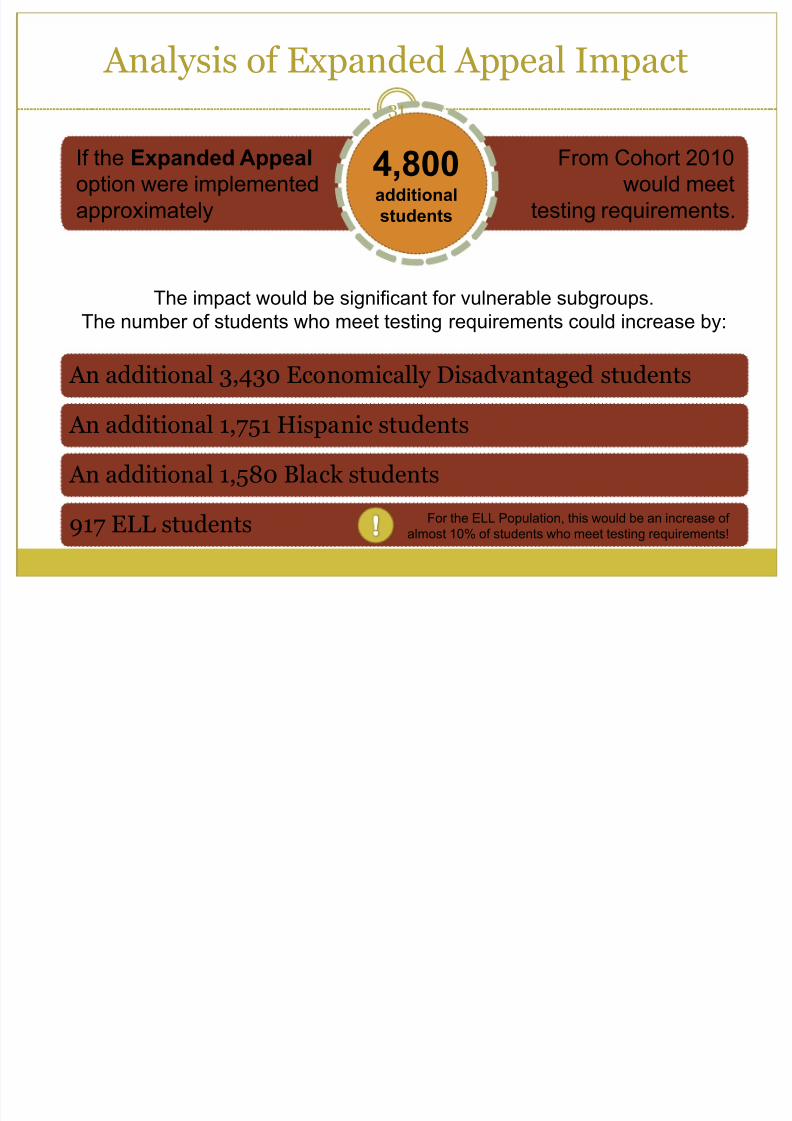
Analysis of Expanded Appeal Impact
4,800additional
students
If the Expanded Appeal
option were implemented
approximately
From Cohort 2010
would meet
testing requirements.
The impact would be significant for vulnerable subgroups.
The number of students who meet testing requirements could increase by:
An additional 3,430 Economically Disadvantaged students
An additional 1,751 Hispanic students
An additional 1,580 Black students
917 ELL students For the ELL Population, this would be an increase of
almost 10% of students who meet testing requirements!
31
7/23/2019 2014-2015 Graduation Data SCSD
http://slidepdf.com/reader/full/2014-2015-graduation-data-scsd 32/38
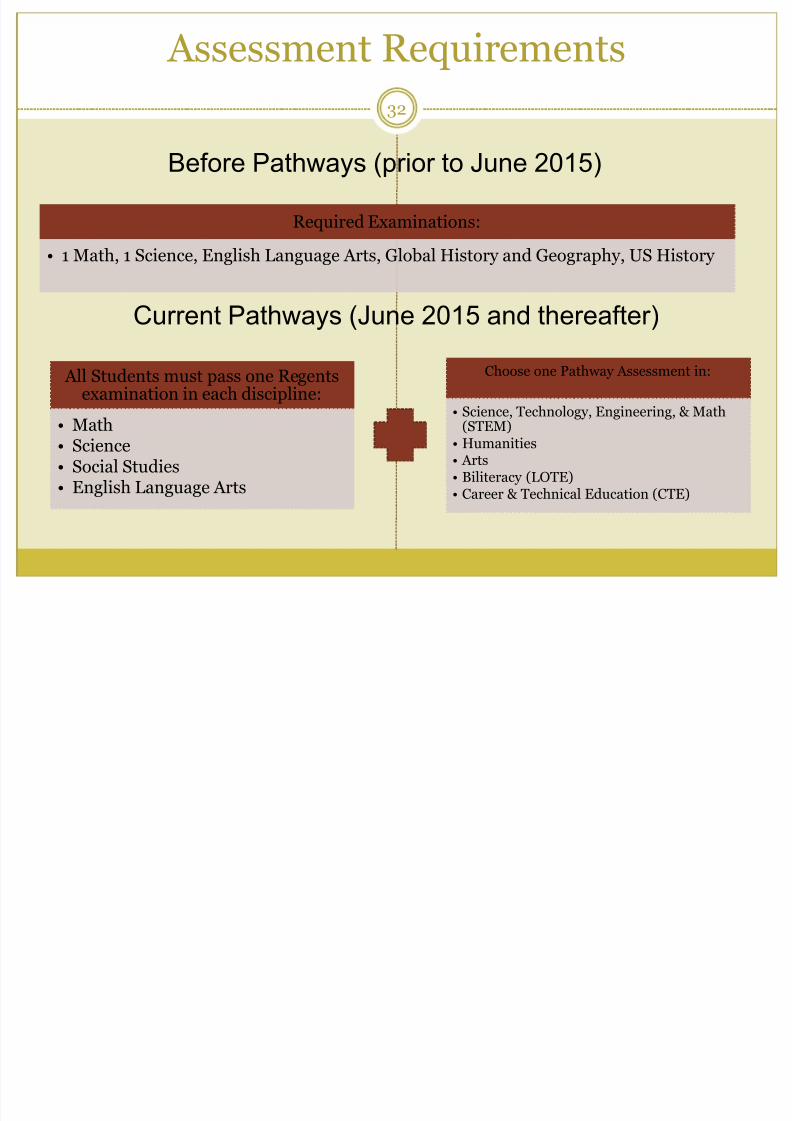
All Students must pass one Regentsexamination in each discipline:
• Math• Science• Social Studies• English Language Arts
Before Pathways (prior to June 2015)
Current Pathways (June 2015 and thereafter)
Choose one Pathway Assessment in:
• Science, Technology, Engineering, & Math(STEM)• Humanities• Arts• Biliteracy (LOTE)• Career & Technical Education (CTE)
Required Examinations:
• 1 Math, 1 Science, English Language Arts, Global History and Geography, US History
Assessment Requirements
32
7/23/2019 2014-2015 Graduation Data SCSD
http://slidepdf.com/reader/full/2014-2015-graduation-data-scsd 33/38
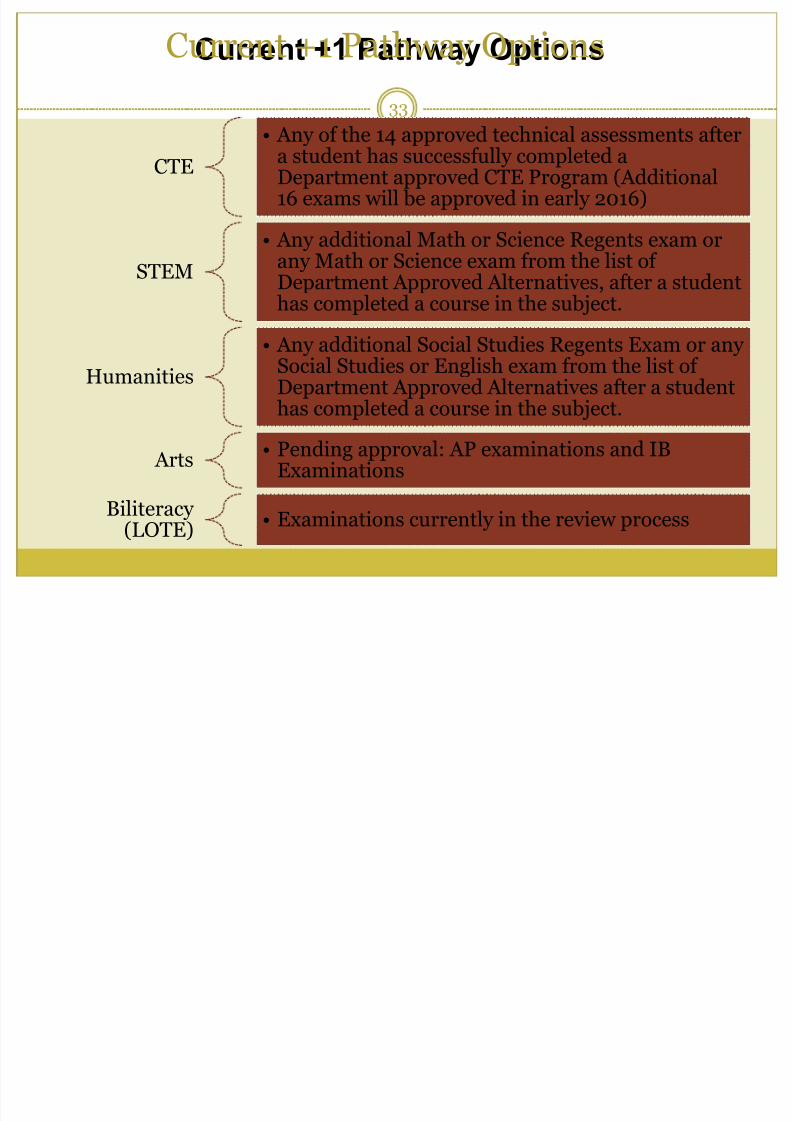
Current +1 Pathway Options
CTE• Any of the 14 approved technical assessments aftera student has successfully completed a
Department approved CTE Program (Additional16 exams will be approved in early 2016)
STEM
• Any additional Math or Science Regents exam orany Math or Science exam from the list of
Department Approved Alternatives, after a studenthas completed a course in the subject.
Humanities
• Any additional Social Studies Regents Exam or anySocial Studies or English exam from the list ofDepartment Approved Alternatives after a student
has completed a course in the subject.
Arts• Pending approval: AP examinations and IB
Examinations
Biliteracy(LOTE)
• Examinations currently in the review process
Current +1 Pathway Options
33
7/23/2019 2014-2015 Graduation Data SCSD
http://slidepdf.com/reader/full/2014-2015-graduation-data-scsd 34/38
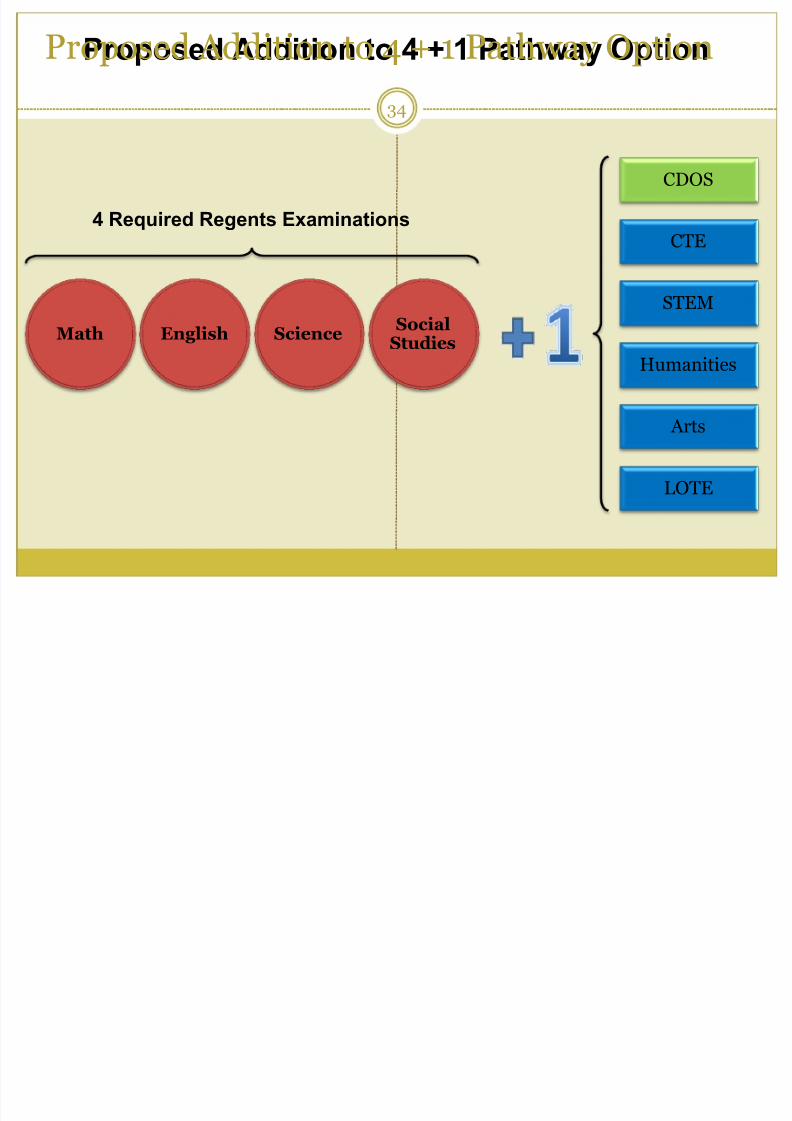
Proposed Addition to 4 + 1 Pathway Option
English ScienceSocial
StudiesMath
4 Required Regents Examinations
CDOS
CTE
STEM
Humanities
Arts
LOTE
Proposed Addition to 4 + 1 Pathway Option
34
7/23/2019 2014-2015 Graduation Data SCSD
http://slidepdf.com/reader/full/2014-2015-graduation-data-scsd 35/38
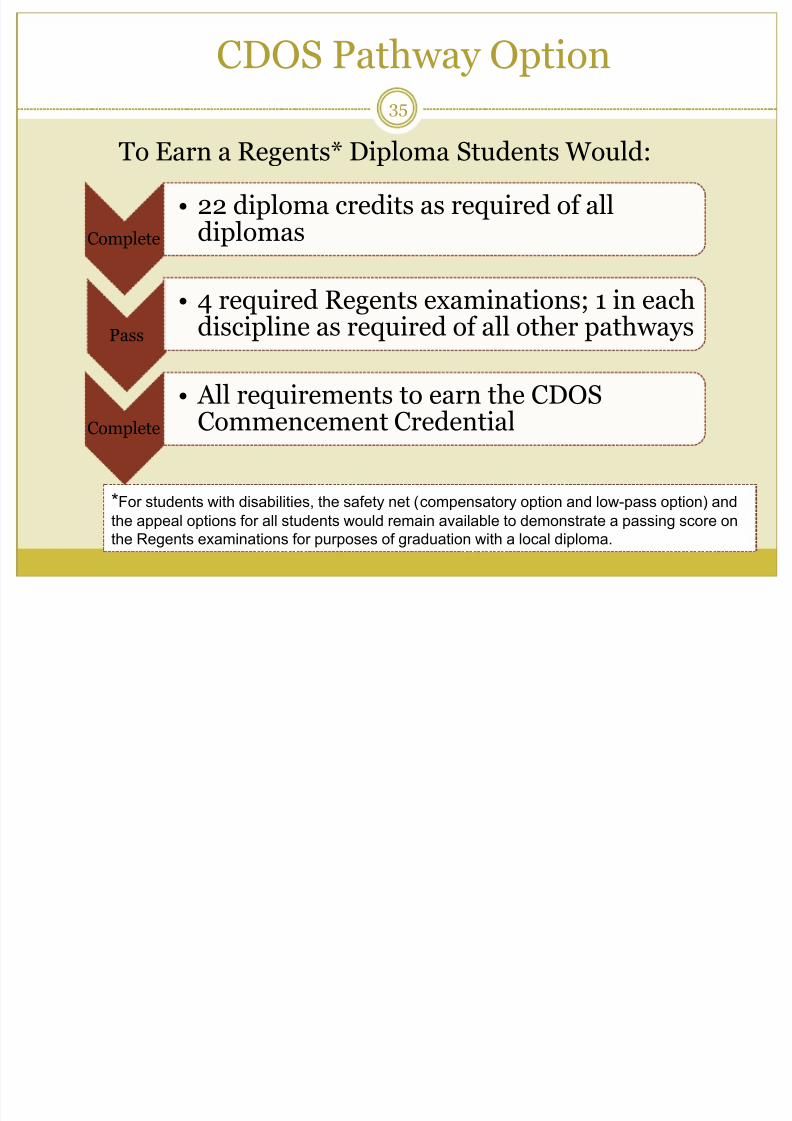
*For students with disabilities, the safety net (compensatory option and low-pass option) and
the appeal options for all students would remain available to demonstrate a passing score on
the Regents examinations for purposes of graduation with a local diploma.
Complete
• 22 diploma credits as required of alldiplomas
Pass
• 4 required Regents examinations; 1 in eachdiscipline as required of all other pathways
Complete
• All requirements to earn the CDOS
Commencement Credential
To Earn a Regents* Diploma Students Would:
CDOS Pathway Option35
CDOS A P i f Skill D l t f
7/23/2019 2014-2015 Graduation Data SCSD
http://slidepdf.com/reader/full/2014-2015-graduation-data-scsd 36/38
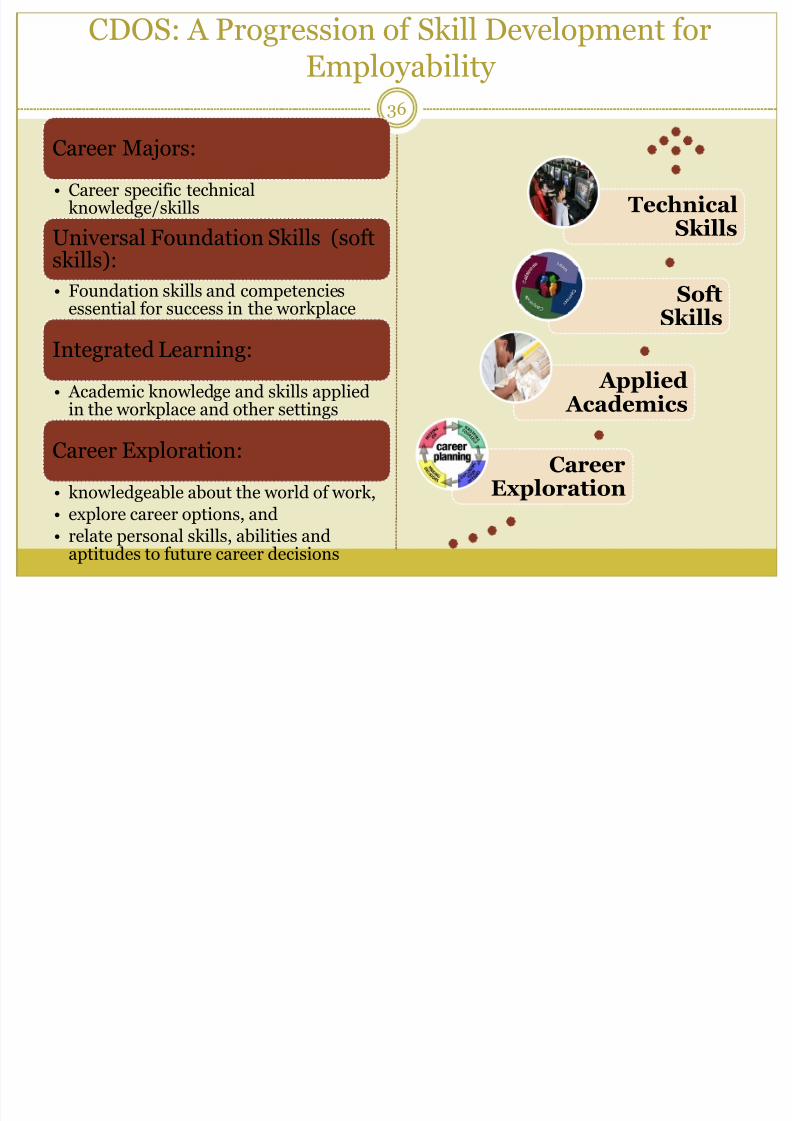
CareerExploration
Applied Academics
SoftSkills
TechnicalSkills
Career Majors:
• Career specific technicalknowledge/skills
Universal Foundation Skills (softskills):
• Foundation skills and competenciesessential for success in the workplace
Integrated Learning:
• Academic knowledge and skills appliedin the workplace and other settings
Career Exploration:
• knowledgeable about the world of work,
• explore career options, and
• relate personal skills, abilities and
aptitudes to future career decisions
CDOS: A Progression of Skill Development forEmployability
36
7/23/2019 2014-2015 Graduation Data SCSD
http://slidepdf.com/reader/full/2014-2015-graduation-data-scsd 37/38
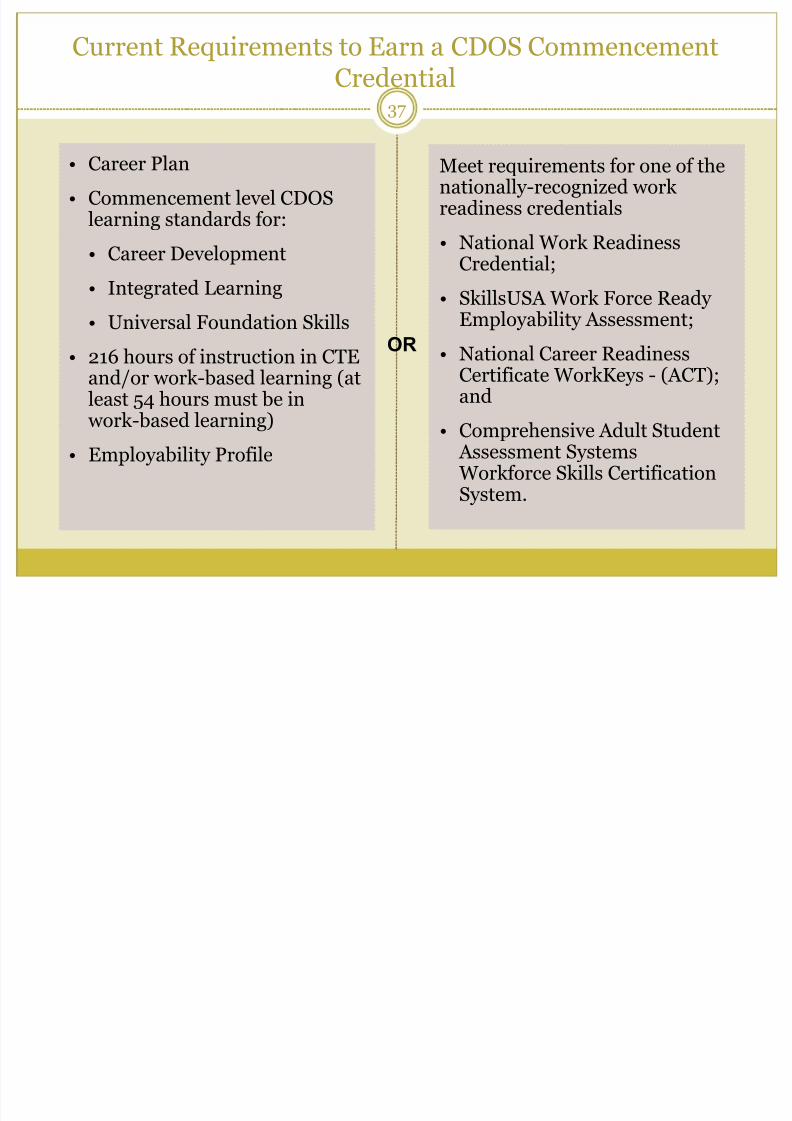
Meet requirements for one of thenationally-recognized workreadiness credentials
• National Work ReadinessCredential;
• SkillsUSA Work Force ReadyEmployability Assessment;
• National Career ReadinessCertificate WorkKeys - (ACT);and
• Comprehensive Adult Student Assessment Systems Workforce Skills CertificationSystem.
• Career Plan
• Commencement level CDOSlearning standards for:
• Career Development
• Integrated Learning
• Universal Foundation Skills
• 216 hours of instruction in CTEand/or work-based learning (atleast 54 hours must be in
work-based learning)
• Employability Profile
OR
Current Requirements to Earn a CDOS CommencementCredential
37
7/23/2019 2014-2015 Graduation Data SCSD
http://slidepdf.com/reader/full/2014-2015-graduation-data-scsd 38/38
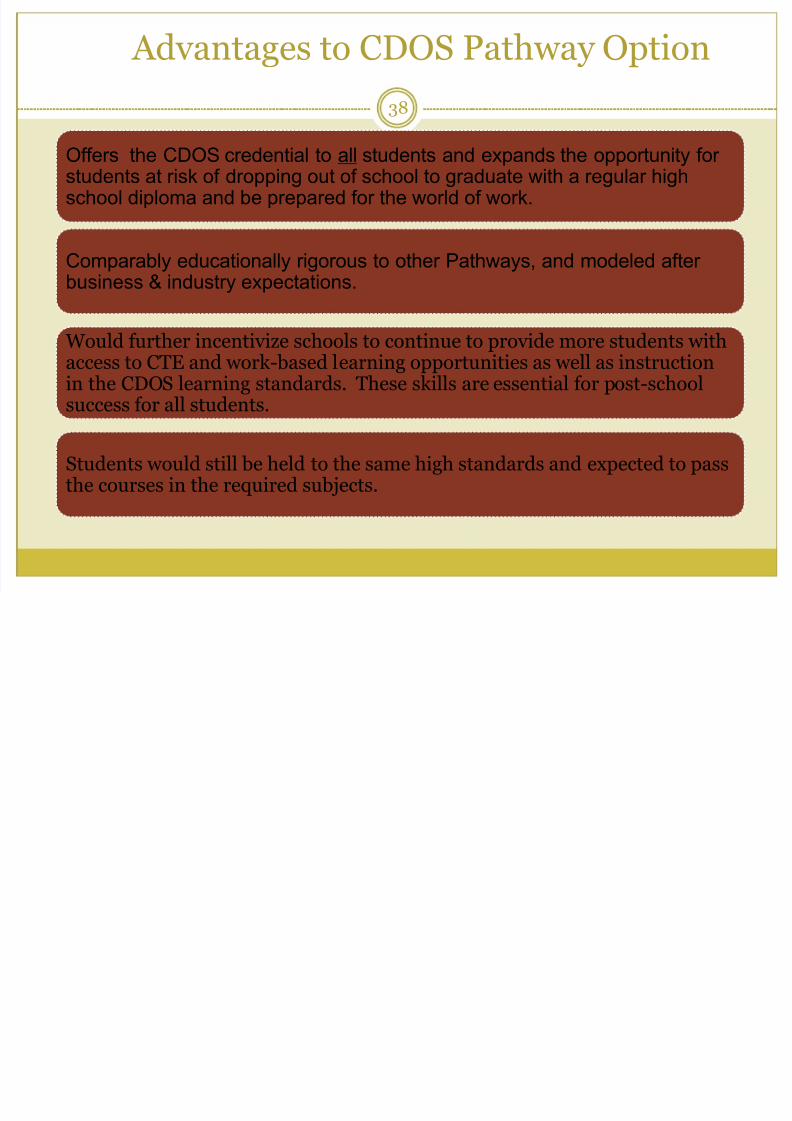
Offers the CDOS credential to all students and expands the opportunity forstudents at risk of dropping out of school to graduate with a regular highschool diploma and be prepared for the world of work.
Comparably educationally rigorous to other Pathways, and modeled after
business & industry expectations.
Would further incentivize schools to continue to provide more students withaccess to CTE and work-based learning opportunities as well as instructionin the CDOS learning standards. These skills are essential for post-schoolsuccess for all students.
Students would still be held to the same high standards and expected to passthe courses in the required subjects.
Advantages to CDOS Pathway Option
38


![INDEX [] · 2021. 5. 14. · index scsd welcomes 49 new officers department continues outreach to encourage vaccinations scsd joins with community partners to provide resources for](https://img.pdfslide.us/doc/110x75/61357d610ad5d20676476928/index-2021-5-14-index-scsd-welcomes-49-new-officers-department-continues.jpg)