Embed Size (px)
Citation preview

2014-2015 Financial Statements

NORFOLK STATE UNIVERSITY TABLE OF CONTENTS
LETTER FROM THE VICE PRESIDENT FOR FINANCE AND ADMINISTRATION ....................... 1
MANAGEMENT’S DISCUSSION AND ANALYSIS .............................................................................. 2-8
FINANCIAL STATEMENTS Statement of Net Position .................................................................................................................................... 9 Statement of Revenues, Expenses and Changes in Net Position ..................................................................... 10 Statement of Cash Flows ............................................................................................................................. 11-12 Notes to the Financial Statements ............................................................................................................... 13-53
REQUIRED SUPPLEMENTARY INFORMATION (RSI)
Schedule of Norfolk State University’s Share of Net Pension Liability ........................................................ 54-55 Schedule of Employer Contributions .................................................................................................................. 56 Notes to Required Supplemental Information .................................................................................................... 57
UNIVERSITY HIGHLIGHTS .......................................................................................................................... 58
REPORT OF INDEPENDENT AUDITOR ............................................................................................. 59-61
BOARD OF VISITORS AND UNIVERSITY ADMINISTRATORS ....................................................... 62

Norfolk State University - An Equal Opportunity Employer
Vice President for Finance and Administration 700 Park Avenue, Suite 310, Norfolk, Virginia 23504
Tel: (757) 823-8011 Fax: (757) 823-8048 Web: www.nsu.edu
October 8, 2015
Mr. Eddie N. Moore, Jr., Interim President/CEO and the Board of Visitors Norfolk State University 700 Park Avenue Norfolk, VA 23504
The official Financial Statements of Norfolk State University (NSU) for the fiscal year ended June 30, 2015 are hereby submitted. The statements include an accompanying statement of net position, statement of revenues, expenses, changes in net position and statement of cash flows, along with accompanying notes and schedules.
These financial statements were prepared in conformity with Generally Accepted Accounting Principles and represent a comprehensive record of the financial position of NSU operations for the fiscal year ended June 30, 2015.
Responsibility for both the accuracy and the completeness of the data and the fairness of presentation, including disclosures is the responsibility of University management. University management assumes full responsibility and to the best of our knowledge and belief asserts that the information is accurate in all material aspects. To provide a reasonable basis for making these representations, University management has established balanced internal controls designed to protect the University’s assets from loss, theft and misuse and established an accounting system to compile sufficient reliable information for the preparation of the University’s statements.
The Commonwealth of Virginia Auditor of Public Accounts audited and rendered an opinion on the University’s financial statements on pages 59-61 and issued a report on internal control titled “Independent Auditor’s Report On Internal Control Over Financial Reporting And On Compliance And Other Matters”, dated October 8, 2015.
The Governmental Accounting Standard Board (GASB) requires that management provide a narrative introduction, overview and analysis to accompany the basic financial statements in the form of Management’s Discussion and Analysis. This letter, the Management’s Discussion and Analysis section and the Auditor of Public Accounts’ report should all be read in conjunction to gain enhanced understanding of the University’s basic financial statements and required supplementary information.
The preparation of the financial statements is a collaborative effort of many staff. All of the staff in the Division of Finance and Administration are to be commended for their efforts in maintaining the fiscal integrity and financial information of the University throughout the year and they are especially recognized and appreciated for the preparation and presentation of the financial statements.
Sincerely,
Gerald E. Hunter Vice President Finance and Administration

NORFOLK STATE UNIVERSITY MANAGEMENT’S DISCUSSION AND ANALYSIS
2
Overview
The following Management’s Discussion and Analysis (MD&A) is required supplemental information under the Governmental Accounting Standards Board (GASB) reporting model. It is designed to assist readers in understanding the accompanying financial statements and provides an objective, easily readable analysis of Norfolk State University’s (University) financial activities based on currently known facts, decisions, and conditions. This discussion includes an analysis of the University’s financial condition and results of operations for the fiscal year ended June 30, 2015. Note that although the University’s foundations identified as component units under GASB Statement No.14, as amended by GASB Statement No. 39 and 61 are reported in the financial statements, they are excluded from this MD&A, except where specifically noted. Comparative numbers, where presented, are for the fiscal year ended June 30, 2014. Since this presentation includes highly summarized data, it should be read in conjunction with the accompanying financial statements, notes to the financial statements, and other supplementary information. University management is responsible for all of the financial information presented, including this discussion and analysis.
The three basic financial statements are the Statement of Net Position (balance sheet), the Statement of Revenues, Expenses, and Changes in Net Position (operating statement), and the Statement of Cash Flows. The following analysis discusses elements from each of these statements, as well as an overview of the University’s activities.
Statement of Net Position
The Statement of Net Position presents the University’s assets, liabilities, deferred inflows and net position as of the end of the fiscal year. The purpose of this statement is to present to the financial statement readers a fiscal snapshot at June 30, 2015. From the data presented, readers of the Statement of Net Position are able to determine the assets available to continue the University’s operations. They are also able to determine how much the University owes vendors and creditors.
Net Position is divided into three major categories. The first category, net investment in capital assets, represents the University’s total investment in capital assets, net of accumulated depreciation and outstanding debt obligations related to those capital assets. The next category is restricted which is divided into two categories in the financial statements, nonexpendable and expendable. Restricted nonexpendable net position consists solely of the permanent endowment fund and is only available for investment purposes. As of June 30, 2015, the University does not have any permanent endowments. Expendable restricted net position is available for expenditure by the University but must be spent for purposes as determined by the donors and/or external entities that have placed time or purpose restrictions on the use of the asset. Unrestricted net position is available to the University for any lawful purpose of the University.
Effective fiscal year 2015, the GASB issued Statement 68, Accounting and Financial Reporting for Pensions, and Statement 71, Pension Transition for Contributions Made Subsequent to the Measurement Date, an amendment of GASB Statement 68. These reporting changes require the University to record its portion of the pension liabilities and expenses from the Virginia Retirement System (VRS) State Employee Retirement Plan and the Virginia Law Officers’ System (VaLORS) Retirement Plan. Prior to the implementation of GASB 68, VRS did not measure assets and pension benefit obligations separately for individual state institutions. Therefore, for the purpose of the MD&A, fiscal year 2014 comparative numbers have not been restated. As of result of this change in reporting, the University has recorded its proportionate share of the net pension liability, pension expense, deferred outflows and deferred inflows in the financial statements presented within. Footnote 1 to the financial statements includes the summary of significant accounting policies for pensions. Footnote 11 and the required supplementary information discloses information on the pension plans available to all full-time, salaried permanent employees of Norfolk State University, along with detail on pension liability and pension expense, and pension contributions by the University.

NORFOLK STATE UNIVERSITY MANAGEMENT’S DISCUSSION AND ANALYSIS
3
Condensed Summary of Net Position
(amounts in thousands)
Comments:
The University’s financial position continues to remain strong at the end of the fiscal year 2015. The decrease in total assets is attributed to a decrease in current and non-current assets offset by an increase in capital assets. Current assets decreased by $6.2 million or 16% as a result of a decrease in cash, grants receivable, and auxiliary enterprises transactions. Capital assets increased by $8.3 million or 4% due to continued construction costs and the purchase of equipment for the new Nursing Building, which was open for occupancy in January 2015, and renovations to Brown Hall. Other non-current assets decreased by $4.7 million or 33% due to decrease in appropriations due from primary government as well as a reduction in restricted cash due to the extinguishment of the University’s revenue bond debt obligations during the year. The University paid off debt outstanding for the Phyllis Wheatley and Rosa Alexander residence halls and the athletic stadium.
The increase of $4.6 million or 100% in deferred outflows is attributed to the implementation of the GASB 68/71. These deferred outflows are related to pensions and represents the fiscal year 2015 contribution made by the University after the measurement date and will be recognized as a reduction of the net pension liability in the year ended June 30, 2016.
Current liabilities increased by $236 thousand or 1% as a result the decrease in current portion of the debt obligation due to the payoff of the revenue bond debt obligation offset by the increase in the current portion related to the net pension liability. Non-current liabilities increased by $46.0 million or 95% primarily due to the recording
2015 2014 Amount Percent
Assets:
Current 31,449$ 37,610$ (6,161)$ -16%
Capital, net of accumulated depreciation 235,373 227,036 8,337 4%
Other non-current 9,804 14,549 (4,745) -33%
Total assets 276,626 279,195 (2,569) -1%
Deferred outflows 4,576 - 4,576 100%
Total assets and deferred outflows 281,202$ 279,195$ 2,007$ 1%
Liabilities:
Current 22,556 22,320 236 1%
Non-current 94,377 48,383 45,994 95%
Total liabilities 116,933 70,703 46,230 65%
Deferred inflows 10,220 61 10,159 16654%
Total liabilities and deferred inflows 127,153 70,764 56,389 80%
Net position:
Net investment in capital assets 195,608 181,014 14,594 8%
Restricted 4,743 - 4,743 100%
Unrestricted (46,302) 27,417 (73,719) -269%
Total net position 154,049$ 208,431$ (54,382)$ -26%
As of June 30, Increase/(Decrease)

NORFOLK STATE UNIVERSITY MANAGEMENT’S DISCUSSION AND ANALYSIS
4
of the University’s net pension liability non-current amount of $52.0 million per the implementation of GASB 68/71. The remaining decrease of $6 million was due to normal payment of debt.
The increase of $10.2 million or 16654% in deferred inflows is attributed to the implementation of the GASB 68/71. These deferred inflows are related to pensions and represents pension plan investments and contributions that will be recognized as pension expenses in future years. The pension expense recognition is shown in detail in footnote 11 of the notes to the financial statements.
The decrease in total net position is attributed to the increase in net investment in capital asset and restricted net position offset by the decrease in unrestricted net position. Net investment in capital assets increased by $14.6 million due to construction cost and equipment purchases netted against the decrease in outstanding debt related to capital assets. Restricted net position increased by $4.7 million primarily due to funding set aside for maintenance reverse projects. Due to the change reporting per GASB 68/71, unrestricted net position for fiscal year 2015 includes the University’s net pension liability of $56.6 million, pension deferred outflows of $4.6 million and pension deferred inflows of $10.1 million.

NORFOLK STATE UNIVERSITY MANAGEMENT’S DISCUSSION AND ANALYSIS
5
Statement of Revenues, Expenses, and Changes in Net Position Changes in total Net Position as presented on the Statement of Net Position are based on the activity as presented in the Statement of Revenues, Expenses, and Changes in Net Position. The purpose of this statement is to present the University’s operating and non-operating revenues recognized and expenses incurred and any other revenues, expenses, gains, and losses. Generally speaking, operating revenues are received for providing goods and services to students and other constituencies of the institution. Operating expenses are those expenses incurred to acquire or produce the goods and services provided in return for the operating revenues and to carry out the University’s mission. Salaries, wages and fringe benefits for faculty and staff are the largest type of operating expense. Non-operating revenues are revenues received for which goods and services are not provided. For example, the University’s state appropriations are non-operating because they are provided by the state legislature without the legislature directly receiving commensurate goods and services for those revenues. Other sources of revenue mainly consist of capital bond proceeds received from the 21ST Century Program that is managed by the Virginia College Building Authority (VCBA) for the construction of the Nursing Building and renovations of the Wilder Center and Brown Hall and maintenance reserve.

NORFOLK STATE UNIVERSITY MANAGEMENT’S DISCUSSION AND ANALYSIS
6
Condensed Summary Statement of Revenues, Expenses, and Changes in Net Position (amounts in thousands)
2015 2014 Amount Percent
Operating revenues:
Student tuition and fees, net of scholarship
allowances of $11,741 and $10,418 26,354$ 27,012$ (658)$ -2%
Federal grants and contracts 13,937 16,246 (2,309) -14%
State grants and contracts 559 335 224 67%
Nongovernmental grants and contracts 1,240 1,691 (451) -27%
Public service 354 394 (40) -10%
Auxiliary enterprises, net of scholarship
allowances of $10,889 and $12,582 20,665 26,296 (5,631) -21% Other operating revenues 204 503 (299) -59%
Total operating revenues 63,313 72,477 (9,164) -13%
Operating expenses:
Instructional 37,952 37,076 876 2%
Research 4,895 6,413 (1,518) -24%
Public service 1,098 867 231 27%
Academic support 12,025 15,802 (3,777) -24%
Student services 4,314 4,384 (70) -2%
Institutional support 14,844 12,912 1,932 15%
Operation and maintenance - plant 15,612 13,543 2,069 15%
Depreciation expense 12,886 11,504 1,382 12%
Student Aid 17,398 20,697 (3,299) -16%
Auxiliary activities 25,835 23,505 2,330 10%
Loss on disposal of assets 395 236 159 67%
Total operating expenses 147,254 146,939 315 0%
Operating loss (83,941) (74,462) (9,479) 13%
Net non-operating revenues 64,235 65,249 (1,014) -2%
Increase (decrease) before other revenues,
expenses, gains or losses (19,706) (9,213) (10,493) 114%
Net other revenues 28,382 37,770 (9,388) -25%
Increase in net position 8,676 28,557 (19,881) -70%
Net position - beginning of the year 145,373 179,874 (34,501) -19%
Net position - end of year 154,049$ 208,431$ (54,382)$ -26%
As of June 30, Increase/(Decrease)

NORFOLK STATE UNIVERSITY MANAGEMENT’S DISCUSSION AND ANALYSIS
7
Comments:
Operating revenues primarily consist of tuition and fees, auxiliary enterprises and revenues from grants and contracts. The 13% or $9.2 million decrease is mainly attributed to a decrease in grants and contracts and auxiliary enterprises. Operating expenses increase by $.3 million or 0%. Pension expense of $3.7 million related to the implementation of GASB 68/71 is reported as operating expense. The University’s fiscal year 2015 VRS and VaLORS contributions of $4.5 million is credited against operating expenses and reported as deferred outflows on the Statement of Net Position. Net Non-Operating Revenues and Expenses decreased by $1 million or 2% mainly due to the decrease in Pell grants. Net Other Revenues decreased by $9.4 million or 25% due to the decrease of capital bond proceeds received from the 21ST Century Program that is managed by the Virginia College Building Authority (VCBA) for the construction of the Nursing Building, maintenance reserve projects and renovations of the Wilder Center and Brown Hall.
Statement of Cash Flows The final statement presented by the University is the Statement of Cash Flows. This statement presents detailed information about the institution’s cash activity during the year. Operating cash flows shows the net cash used by the operating activities of the University. Significant sources of cash include student tuition and fees ($26.8 million), grants and contracts ($16.4 million), and auxiliary enterprises receipts ($20.6 million). Major uses of cash include payments for salaries, wages, and fringe benefits ($80.9 million), payments for scholarships and fellowships ($17.4 million), payments for services and supplies ($32.0 million) and payments for utilities ($4.0 million). The next section reflects the cash flows from non-capital financial activities and includes state appropriations for the University’s educational and general programs and financial aid ($51.7 million) and Pell grants ($15.2 million). The cash flows from capital financing activities section reflect cash used for capital and related items. Primary sources of cash are proceeds from bond issues ($30.7 million) and proceeds from refunded bond issues ($9 million). Significant cash outflows include the purchase of capital assets ($22.6 million), repayment of principal on capital related debt ($15.3 million), and interest paid on capital debt ($2 million). Cash flows from investing activities include interest from investments. The final section of the cash flow statement reconciles the net cash used by operating activities to the operating loss reflected on the Statement of Revenue, Expenses, and Changes in Net Position.
Summary Statement of Cash Flows (amounts in thousands)
2015 2014 Amount Percent
Cash flows from operating activities (73,010)$ (67,131)$ (5,879)$ 8.8%
Cash flows from noncapital
financing activities 66,697 70,556 (3,859) -5.5%
Cash flows from capital financing activities 1,534 (5,161) 6,695 -129.7%
Cash flows from investing activities 10 1 9 900.0%
Net change in cash (4,769)$ (1,735)$ (3,034)$ 174.9%
As of June 30, Increase/(Decrease)
NORFOLK STATE UNIVERSITY MANAGEMENT’S DISCUSSION AND ANALYSIS
8
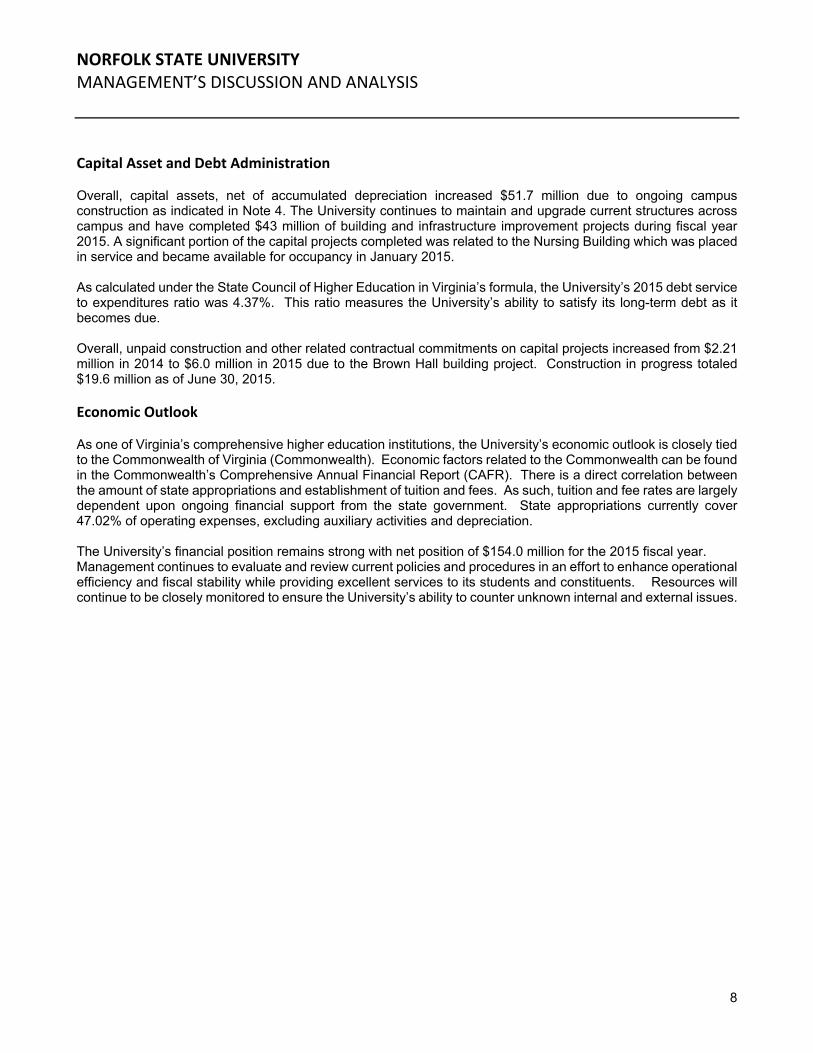
Capital Asset and Debt Administration Overall, capital assets, net of accumulated depreciation increased $51.7 million due to ongoing campus construction as indicated in Note 4. The University continues to maintain and upgrade current structures across campus and have completed $43 million of building and infrastructure improvement projects during fiscal year 2015. A significant portion of the capital projects completed was related to the Nursing Building which was placed in service and became available for occupancy in January 2015. As calculated under the State Council of Higher Education in Virginia’s formula, the University’s 2015 debt service to expenditures ratio was 4.37%. This ratio measures the University’s ability to satisfy its long-term debt as it becomes due. Overall, unpaid construction and other related contractual commitments on capital projects increased from $2.21 million in 2014 to $6.0 million in 2015 due to the Brown Hall building project. Construction in progress totaled $19.6 million as of June 30, 2015. Economic Outlook As one of Virginia’s comprehensive higher education institutions, the University’s economic outlook is closely tied to the Commonwealth of Virginia (Commonwealth). Economic factors related to the Commonwealth can be found in the Commonwealth’s Comprehensive Annual Financial Report (CAFR). There is a direct correlation between the amount of state appropriations and establishment of tuition and fees. As such, tuition and fee rates are largely dependent upon ongoing financial support from the state government. State appropriations currently cover 47.02% of operating expenses, excluding auxiliary activities and depreciation. The University’s financial position remains strong with net position of $154.0 million for the 2015 fiscal year. Management continues to evaluate and review current policies and procedures in an effort to enhance operational efficiency and fiscal stability while providing excellent services to its students and constituents. Resources will continue to be closely monitored to ensure the University’s ability to counter unknown internal and external issues.

NORFOLK STATE UNIVERSITY STATEMENT OF NET POSITION JUNE 30, 2015
The accompanying notes are an integral part of these financial statements. 9
Current assets: Cash and cash equivalents (Note 2) 20,254,470$ 1,684,709$
Cash held for securities lending (Note 2) 692,437 -
Restricted cash and cash equivalents - 504,395
Short-term investments (Note 2) 25,062 103,790
Accounts receivable, net of allowance for doubtful accounts of $ 558,179 (Note 3) 4,735,536 -
Contributions receivable, net of allowance for doubtful accounts of $14,201 (Note 3) - 277,625
Due from the Commonwealth 4,680,090 -
Prepaid expenses 888,638 91,690
Notes receivable, net of allowance for doubtful accounts of $422,618 172,928 -
Other assets - 1,477,308
Total current assets 31,449,161 4,139,517
Noncurrent assets:
Restricted cash and cash equivalents (Note 2) 2,207,465 3,010,158
Appropriation available/due from primary government 6,178,918 -
Investments - 27,887,012
Contributions receivable, net of allowance for uncollectible contributions
of $49,742 - 262,750
Notes receivable, net of allowance for doubtful accounts of $2,149,876 1,417,331 -
Nondepreciable capital assets (Note 4) 25,553,648 570,384
Depreciable capital assets, net (Note 4) 209,819,011 22,455,847
Total noncurrent assets 245,176,373 54,186,151
Total Assets 276,625,534 58,325,668
Deferred outflows (Note 11) 4,575,655 -
Total Assets and deferred inflows 281,201,189$ 58,325,668$
Current liabilities:
Accounts payable and accrued expenses (Note 5) 8,457,741$ 433,515$
Unearned revenue 3,674,468 43,188
Obligations under securities lending 717,499 -
Deposits held in custody for others 1,541,368 -
Long-term liabilities - current portion (Note 6) 8,165,012 400,000
Total current liabilities 22,556,088 876,703
Noncurrent liabilities (Note 6) 94,376,688 31,917,595
Total Liabilities 116,932,776 32,794,298
Deferred inflows (Note 11) 10,219,497 -
Total Liabilities and deferred inflows 127,152,273 32,794,298
Net position:
Net investment in capital assets 195,607,614 (7,888,769)
Restricted for:
Nonexpendable - 8,962,412
Expendable 4,743,287 17,670,625
Unrestricted (46,301,985) 6,787,102 Total Net Position 154,048,916$ 25,531,370$
Norfolk State University
Component Units

NORFOLK STATE UNIVERSITY STATEMENT OF REVENUES, EXPENSES, AND CHANGE OF NET POSITION FOR THE YEAR ENDED JUNE 30, 2015
The accompanying notes are an integral part of these financial statements. 10
Operating revenues: Student tuition and fees, net of scholarship allowances of $11,740,677 26,354,021$ -$ Federal grants and contracts 13,936,758 - State grants and contracts 559,044 - Nongovernmental grants and contracts 1,239,746 - Public service 353,710 - Auxiliary enterprises, net of scholarship allowances of $10,888,671 20,665,533 - Other operating revenues 204,443 4,884,162 Total operating revenues 63,313,255 4,884,162
Operating expenses: Instructional 37,951,673 - Research 4,894,431 - Public service 1,097,855 - Academic support 12,024,946 - Student services 4,314,402 -
Institutional support 14,844,249 3,916,674 Operation and maintenance - plant 15,612,301 1,400,843 Depreciation expense 12,885,649 1,227,406 Student Aid 17,397,700 521,829 Auxiliary activities 25,835,318 - Loss of disposal of assets 395,443 - Total operating expenses (Note 8) 147,253,967 7,066,752 Operating loss (83,940,712) (2,182,590)
Non‐operating revenues: State appropriations (Note 9) 51,035,437 - Investment income net of investment expense 9,826 218,997 Realized/unrealized gain on investments - 450,980 Unrealized gain on interest rate swap - 974,242 Interest on capital asset - related debt (1,580,326) - Gifts 684,127 1,493,432 Pell grants 15,204,549 - Other non-operating expenses (1,118,431) 37,240 Net non-operating revenues 64,235,182 3,174,891
Increase (decrease) before other revenues, expenses, gains or losses (19,705,530) 992,301
Capital bond proceeds 27,143,167 - Capital gifts and grants 1,238,627 - Contributions to permanently restricted endowments - 275,895 Net other revenues 28,381,794 275,895
Increase in net position 8,676,264 1,268,196
Net position - beginning of the year (restated Note 16) 145,372,652 24,263,174
Net position - end of year 154,048,916$ 25,531,370$
Norfolk State
University
Component
Units

NORFOLK STATE UNIVERSITY STATEMENT OF CASH FLOWS FOR THE YEAR ENDED JUNE 30, 2015
The accompanying notes are an integral part of these financial statements. 11
Cash flows from operating activities: Student tuition and fees 26,780,501$
Grants and contracts 16,353,988
Public service 353,710
Auxiliary enterprises 20,603,966
Other receipts 204,443
Payments to employees (60,184,153)
Payments for fringe benefits (20,704,007)
Payments for services and supplies (32,036,961)
Payments for utilities (3,989,316)
Payments scholarships and fellowships (17,397,700)
Payments for non-capitalized plant improvements and equipment (3,075,205)
Collections of loans from students 2,303,672
Loans issued to students (2,223,071)
Net cash used in operating activities (73,010,133)
Cash flows from non‐capital financing activities:State appropriations 51,652,531
Gifts and grants for other than capital purposes 684,127
Direct lending receipts 47,972,221
Direct lending payments (47,972,221)
Agency receipts 36,687,250
Agency payments (36,413,507)
Pell grant receipts 15,204,549
Other non-operating expenses (1,118,431)
Net cash provided by non-capital financing activities 66,696,519
Cash flows from capital financing activities: Capital gifts 1,238,626
Proceeds from bond issues 30,734,423
Proceeds from refunded bonds issues 9,006,963
Purchase of capital assets (22,599,249)
Principal paid on capital debt, leases and installments (15,267,708)
Interest paid on capital debt, leases and installments (1,578,575)
Net cash provided by capital financing activities 1,534,480
Cash flows from investing activities:Interest on investments 9,826
Net cash provided by investing activities 9,826
Net decrease in cash and cash equivalents (4,769,308)
Cash and cash equivalents - beginning of year 27,231,243
Cash and cash equivalents - end of year 22,461,935$

NORFOLK STATE UNIVERSITY STATEMENT OF CASH FLOWS (CONTINUED) FOR THE YEAR ENDED JUNE 30, 2015
The accompanying notes are an integral part of these financial statements. 12
RECONCILIATION OF NET OPERATING EXPENSES TO NET CASH
USEB BY OPERATING ACTIVITIES:
Operating loss (83,940,712)$
Adjustment to reconcile operating loss to net cash used in
operating activities:
Depreciation expense 12,885,649 Loss on disposal of assets 395,443 Pension expense 3,679,591
Change in assets, liabilities, and deferred outflows:
Receivables, net 296,229
Notes receivable, net 80,601
Prepaid expenses (490,101)
Accounts payable and accrued expenses (1,751,681)
Unearned revenue 687,124
Accrued compensated absences (276,621)
Deferred outflows (4,575,655)
Net cash used in operating activities (73,010,133)$
Non-cash investing, capital and financing activities:
Securities lending 692,437$
Amortization of bond premium 272,485$
Amortization of bond discount (20,788)$

NORFOLK STATE UNIVERSITY NOTES TO THE FINANCIAL STATEMENTS JUNE 30, 2015
13
Note 1—SUMMARY OF SIGNIFICANT ACCOUNTING POLICIES
A. Reporting Entity
Norfolk State University (the “University”) is a comprehensive university that is part of the Commonwealth of Virginia’s (the “Commonwealth”) statewide system of public higher education. The University’s Board of Visitors, appointed by the Governor, is responsible for overseeing governance of the University. A separate report is prepared for the Commonwealth of Virginia, which includes all agencies, higher education institutions, boards, commissions, and authorities over which the Commonwealth exercises, or has the ability to exercise, oversight authority. The University is a component unit of the Commonwealth of Virginia and is included in the basic financial statements of the Commonwealth.
The Norfolk State University Foundation, Inc. and Subsidiary, the Athletics Foundation of Norfolk State University, Inc. and the Norfolk State University Research and Innovation Foundation and Affiliates meet criteria under GASB Statement No. 14, As amended by GASB Statements 39 and 61, qualifying them as component units of the University.
The Norfolk State University Foundation, Inc. and its wholly-owned subsidiary, Marshall Avenue Properties, Inc., is a legally separate, not-for-profit organization established to provide financial support to Norfolk State University.
The Athletics Foundation of Norfolk State University, Inc. is a legally separate, not-for-profit charitable organization governed by a local Board of Directors dedicated to raising funds for the benefit, scholarship, and educational needs of students attending and participating in athletic programs at Norfolk State University.
The Norfolk State University Research and Innovation Foundation and Affiliates (formerly Enterprise and Empowerment Foundation of Norfolk State University and Affiliates) is a legally separate, not-for-profit charitable organization governed by a Board of Directors dedicated to raising funds for a development called the Marie V. McDemmond Center for Applied Research. The development is organized around a public private partnership and is designed to create a digital village that acts as a hub for the Hampton Roads region’s technology-led economic development agenda.
Complete financial statements for the component units can be obtained by writing the Assistant Vice President for Advancement/Fiscal Officer for Foundations, Norfolk State University Foundation, c/o University Advancement, 700 Park Avenue, Suite 410, Norfolk, Virginia, 23504.
Although the University does not control the timing or amount of receipts from the foundations, the majority of resources or income thereon that the foundations hold and invest is restricted to the activities of the University by the donors. These restricted resources held by the foundations can only be used by, or for the benefit of the University. Therefore, the foundations are considered component units of the University and are discretely presented in the financial statements.
During the year ended June 30, 2015, the Norfolk State University Foundation, Inc. and the Athletics Foundation of Norfolk State, Inc. made distributions of $425,220 and $258,907, respectively, to or on behalf of the University for both restricted and unrestricted purposes.

NORFOLK STATE UNIVERSITY NOTES TO THE FINANCIAL STATEMENTS JUNE 30, 2015
14
Note 1—SUMMARY OF SIGNIFICANT ACCOUNTING POLICIES (CONTINUED)
B. Basis of Presentation
Norfolk State University prepares its financial statements in conformity with accounting principles generally accepted in the United States of America. As a public institution, the University adheres to standards promulgated by the Governmental Accounting Standards Board (GASB). The financial statements have been prepared in accordance with GASB Statement 34, Basic Financial Statements – and Management’s Discussion and Analysis – for State and Local Government and GASB Statement 35, Basic Financial Statements and Management’s Discussion and Analysis for Public Colleges and Universities. The University follows Statement 34 and 35 requirements for “reporting by special purpose governments engaged only in business-type activities.” The financial statement presentation provides a comprehensive entity-wide look at the University’s financial activities and replaces the fund-group perspective previously reported. In June 2011, the GASB issued Statement 63, Financial Reporting of Deferred Outflows of Resources, Deferred Inflows of Resources, and Net position, effective for the University’s fiscal year ended June 30, 2013. This statement modifies the presentation of deferred inflows and deferred out-flows in the financial statements and establishes the concept of net position. In March 2012, the GASB issued Statement 65, Items Previously Reported as Assets and Liabilities, effective for the University’s fiscal year beginning July 1, 2013. This statement establishes accounting and financial reporting standards that reclassify, as deferred outflows of resources or deferred inflows of resources, certain items that were previously reported as assets and liabilities.
In June 2012, the GASB issued Statement 68, Accounting and Financial Reporting for Pensions, effective for the University’s fiscal year beginning July 1, 2014. This Statement replaces the requirements of Statement No. 27, Accounting for Pensions by State and Local Governmental Employees, as well as the requirements of Statement No. 50, Pension Disclosures, as they relate to pensions that are provided through pension plans administered as trusts or equivalent arrangements (hereafter jointly referred to as trusts) that meet certain criteria. The requirements of Statements 27 and 50 remain applicable for pensions that are not covered by the scope of this Statement. This statement improves the reporting of pension liabilities and expenses, resulting in a more faithful representation of the full impact of pension obligation. The new note disclosures and required supplementary information will provide a better explanation of how and why the net pension liability changes from year to year. It will improve consistency and transparency of the information reported about pension transactions, as well as, the improvement of the comparability of reported pension information. In addition, this Statement details the recognition and disclosure requirements for employers with liabilities (payables) to a defined benefit pension plan and for employers whose employees are provided with defined contribution pensions. This Statement also addresses circumstances in which a nonemployer entity has a legal requirement to make contributions directly to a pension plan. For purposes of measuring the net pension liability, deferred outflows of resources and deferred inflows of resources related to pensions, and pension expense, information about the fiduciary net position of the Virginia Retirement System (VRS) State Employee Retirement Plan and the Virginia Law Officers’ System (VaLORS) Retirement Plan; and the additions to/deductions from the VRS State Employee Retirement Plan’s and the VaLORS Retirement Plan’s net fiduciary position have been determined on the same basis as they were reported by VRS. For this purpose, benefit payments (including refunds of employee contributions) are recognized when due and payable in accordance with the benefit terms. Investments are reported at fair value.

NORFOLK STATE UNIVERSITY NOTES TO THE FINANCIAL STATEMENTS JUNE 30, 2015
15
Note 1—SUMMARY OF SIGNIFICANT ACCOUNTING POLICIES (CONTINUED)
In November 2013, the GASB issued Statement 71, Pension Transition for Contributions Made Subsequent to the Measurement Date, an amendment of GASB Statement 68. The provisions of this Statement was required to be applied simultaneously with the provisions of Statement 68; and therefore, effective for the University’s fiscal year beginning July 1, 2014. The requirements of this Statement will eliminate the source of a potential significant understatement of restated beginning net position and expense in the first year of implementation of Statement 68 for the University. The foundations are private, non-profit organizations that report under Financial Accounting Standards Board (FASB) standards, including FASB Statement 117, Financial Reporting for Not-for-Profit Organizations. As such, certain revenue recognition criteria and presentation features are different from GASB revenue recognition and presentation features. Reclassifications have been made to convert the foundations’ financial information to GASB format. The foundation statements and subsequent notes comply with the GASB presentation format.
C. Basis of Accounting
The University’s financial statements have been prepared using the economic resources measurement focus and the accrual basis of accounting. Under the accrual basis, revenues are recognized when earned and expenses are recorded when a liability is incurred, regardless of the timing of related cash flows. Bond premiums and discounts are deferred and amortized over the life of the debt. All significant intra-agency transactions have been eliminated.
The University’s accounting policies conform with generally accepted accounting principles as prescribed by GASB, including all applicable GASB pronouncements.
D. Cash and Cash Equivalents
In accordance with the GASB Statement No. 9, Reporting Cash Flows of Proprietary and Nonexpendable Trust Funds and Governmental Entities That Use Proprietary Fund Accounting, definition, cash and cash equivalents consist of cash on hand, money market funds, and temporary highly liquid investments with an original maturity of three months or less. E. Investments
In accordance with GASB Statement 31, Accounting and Financial Reporting for Certain Investments and for External Investment Pools, purchased investments, interest bearing temporary investments classified with cash, and investments received as gifts are recorded at fair value. All investment income, including changes in the fair value of investments (unrealized gains and losses), are reported as non-operating revenue in the Statement of Revenues, Expenses, and Changes in Net Position. F. Prepaid Expenses As of June 30, 2015, the University’s prepaid expenses included items such as, advertising, and publication subscriptions, which include initial and renewal annual subscriptions for technical and professional publications. The University recognizes prepaids when purchased and expensed when used.

NORFOLK STATE UNIVERSITY NOTES TO THE FINANCIAL STATEMENTS JUNE 30, 2015
16
Note 1—SUMMARY OF SIGNIFICANT ACCOUNTING POLICIES (CONTINUED)
G. Receivables
Receivables consist of tuition and fee charges to students and auxiliary enterprises’ sales and services. Receivables also include amounts due from the Federal government, state and local governments, or private sources, in connection with reimbursement of allowable expenditures made pursuant to grants and contracts. Receivables are recorded net of estimated uncollectible amounts.
H. Capital Assets
Capital assets include land, buildings and other improvements, library materials, equipment and infrastructure assets such as parking lots, sidewalks, campus lighting, intangible assets, and computer network cabling systems. The University generally defines capital assets as assets with an initial cost of $5,000 or more and an estimated useful life in excess of two years. Such assets are recorded at historical cost or estimated historical cost except for land acquired prior to 1979, which is valued at appraisal value. Library materials are valued using published average prices for library acquisitions. Donated capital assets are recorded at the estimated fair market value at the date of contribution. Expenses for major capital assets and improvements are capitalized (construction-in-progress) as projects are constructed. The University holds a number of patents which were obtained with the sole intent of earning revenue in the future. As such, they do not meet the capitalization criteria of an intangible asset set out in GASB 51 and are not included in Capital Assets. The University also includes any software development projects in excess of $100,000 as an intangible asset capitalizable under GASB 51. Any software purchased prior to July 1, 2009 was modified to the extent that it became internally generated software and is not required to be retroactively capitalized under GASB 51. The University has chosen not to retroactively capitalize internally generated software. The costs of normal maintenance and repairs that do not add to an asset’s value or materially extend its useful life are not capitalized. The University has reviewed its capital assets for impairment using criteria set forth in GASB 42, Impairment of Capital Assets, and has no impaired assets at year end. Depreciation is computed using the straight-line method over the estimated useful life of the asset and is not allocated to the functional expense categories. Useful lives by asset categories are listed below:
Buildings - 30 years Other improvements and infrastructure - 8 to 25 years Equipment - 4 to 25 years Library materials - 5 years Intangible assets - 3 to 5 years
The University’s art collections are held for public exhibition, education, and research in furtherance of public service rather than financial gain; are protected, kept unencumbered, cared for, and preserved; and are subject to University policy that requires the proceeds from sales of collection items to be used to acquire other items for the collection. Since these conditions exist and historical cost data for the collections are not available; in accordance with GASB Statement 34, no balances are reported in the accompanying financial statements.
NORFOLK STATE UNIVERSITY NOTES TO THE FINANCIAL STATEMENTS JUNE 30, 2015
17
Note 1—SUMMARY OF SIGNIFICANT ACCOUNTING POLICIES (CONTINUED)
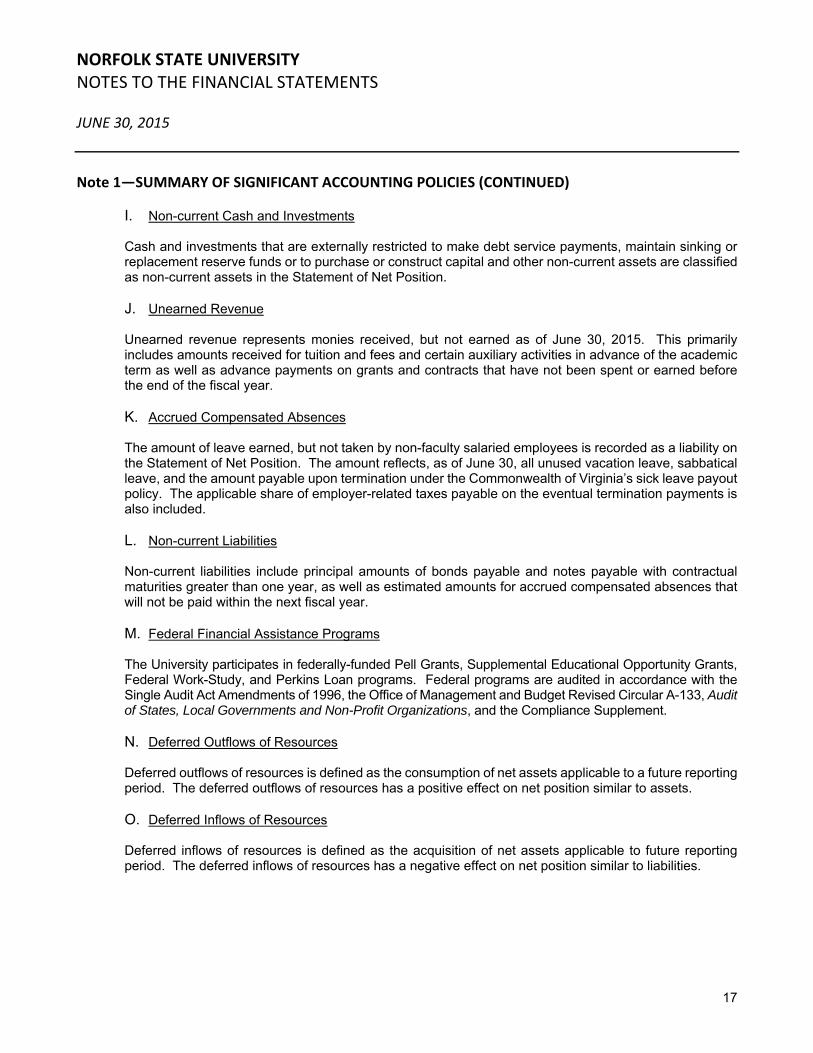
I. Non-current Cash and Investments
Cash and investments that are externally restricted to make debt service payments, maintain sinking or replacement reserve funds or to purchase or construct capital and other non-current assets are classified as non-current assets in the Statement of Net Position.
J. Unearned Revenue
Unearned revenue represents monies received, but not earned as of June 30, 2015. This primarily includes amounts received for tuition and fees and certain auxiliary activities in advance of the academic term as well as advance payments on grants and contracts that have not been spent or earned before the end of the fiscal year.
K. Accrued Compensated Absences
The amount of leave earned, but not taken by non-faculty salaried employees is recorded as a liability on the Statement of Net Position. The amount reflects, as of June 30, all unused vacation leave, sabbatical leave, and the amount payable upon termination under the Commonwealth of Virginia’s sick leave payout policy. The applicable share of employer-related taxes payable on the eventual termination payments is also included.
L. Non-current Liabilities
Non-current liabilities include principal amounts of bonds payable and notes payable with contractual maturities greater than one year, as well as estimated amounts for accrued compensated absences that will not be paid within the next fiscal year.
M. Federal Financial Assistance Programs
The University participates in federally-funded Pell Grants, Supplemental Educational Opportunity Grants, Federal Work-Study, and Perkins Loan programs. Federal programs are audited in accordance with the Single Audit Act Amendments of 1996, the Office of Management and Budget Revised Circular A-133, Audit of States, Local Governments and Non-Profit Organizations, and the Compliance Supplement. N. Deferred Outflows of Resources Deferred outflows of resources is defined as the consumption of net assets applicable to a future reporting period. The deferred outflows of resources has a positive effect on net position similar to assets. O. Deferred Inflows of Resources
Deferred inflows of resources is defined as the acquisition of net assets applicable to future reporting period. The deferred inflows of resources has a negative effect on net position similar to liabilities.

NORFOLK STATE UNIVERSITY NOTES TO THE FINANCIAL STATEMENTS JUNE 30, 2015
18
Note 1—SUMMARY OF SIGNIFICANT ACCOUNTING POLICIES (CONTINUED) P. Net Position
GASB standards require the classification of net position into three components: net investment in capital assets, amounts that are restricted and amounts that are unrestricted. These classifications are defined as follows: Net investment in Capital Assets – component of net position consists of capital assets, net of accumulated depreciation, reduced by the outstanding balances of bonds, mortgages, notes, or other borrowings that are attributable to the acquisition, construction, or improvement of those assets. Deferred outflows of resources and deferred inflows of resources that are attributable to the acquisition, construction, or improvement of those assets or related debt is also included in this component of net position. If there are significant unspent related debt proceeds or deferred inflows of resources at the end of the reporting period, the portion of the debt or deferred inflows of resources attributable to the unspent amount is not included in the calculation of net investment in capital assets. Instead, that portion of the debt or deferred inflows of resources is included in the same net position component (restricted or unrestricted) as the unspent amount.
Restricted Net Position:
Nonexpendable – represents endowment and similar type assets whose use is limited by donors or other outside sources and as a condition of the gift, the principal; is to be maintained in perpetuity. Expendable – represents funds that have been received for specific purposes and the University is legally or contractually obligated to spend the resources in accordance with restrictions imposed by external parties.
Unrestricted Net Position – represents resources derived from student tuition and fees, state appropriations, unrestricted gifts, interest income, and sales and services of educational departments and auxiliary enterprises.
When an expense is incurred that can be paid using either restricted or unrestricted resources, the University’s policy is to first apply the expense toward restricted resources and then toward unrestricted. Restricted funds remain classified as such until restrictions have been satisfied. Q. Revenue and Expense Classifications
Operating revenues include activities that have the characteristics of exchange transactions, such as: (1) student tuition and fees, net of scholarship discounts and allowances; (2) sales and services of auxiliary enterprises, net of scholarship allowances; and (3) federal, state, and nongovernmental grants and contracts.
Non-operating revenues include activities that have the characteristics of non-exchange transactions, such as gifts, and other revenue sources that are defined as non-operating revenues by GASB Statement 9 and GASB Statement 34, such as state appropriations and investment and interest income.
Non-operating expenses include interest on debt related to the purchase of capital assets and state appropriation reversions. All other expenses are classified as operating expenses.

NORFOLK STATE UNIVERSITY NOTES TO THE FINANCIAL STATEMENTS JUNE 30, 2015
19
Note 1—SUMMARY OF SIGNIFICANT ACCOUNTING POLICIES (CONTINUED)
R. Scholarship Discounts and Allowances
Student tuition and fees revenues and certain other revenues from students are reported net of scholarship discounts and allowances in the Statement of Revenue, Expenses, and Changes in Net Position. Scholarship discounts and allowances are the difference between the stated charge for goods and services provided by the University and the amount that is paid by students and/or third parties making payments on the student’s behalf. Certain governmental grants, such as Pell grants, and other federal, state, or nongovernmental programs are recorded as either operating or non-operating revenues in the University’s financial statements. To the extent that such revenues are used to satisfy tuition and fees and other student charges, the University has recorded a scholarship discount and allowance.
Note 2—CASH AND CASH EQUIVALENTS AND INVESTMENTS
Pursuant to Section 2.2-1800, et seq., Code of Virginia, all state funds of the University are maintained by the Treasurer of Virginia, who is responsible for the collection, disbursement, custody, and investment of State funds. Certain deposits held by the University are maintained in accounts that are collateralized in accordance with the Virginia Securities for Public Deposits Act, Section 2.2-4400, et seq., Code of Virginia. Cash equivalents are defined as investments with original maturities of three months or less. Cash equivalents also include the Virginia State Non-Arbitrage Program (SNAP). SNAP is an open-end management investment company registered with the federal Security and Exchange Commission.
Deposits with banks are covered by the FDIC and collateralized in accordance with the Virginia Security for Public Deposits Act (the “Act”). Under the Act, banks and saving institutions holding public deposits in excess of the amount insured by the FDIC must pledge collateral to the Commonwealth of Virginia Treasury Board. Financial Institutions may choose between two collateralization methodologies and depending upon that choice will pledge collateral that ranges in amounts from 50% to 130% of excess deposits. Accordingly, all deposits are considered fully collateralized.
The Virginia Security for Public Deposits Act eliminates any custodial credit risk for the University.
A. Investments
The investment policy of the University is established by the Board of Visitors and monitored by the Board’s Audit and Finance Committee. Authorized investments are set forth in the Investment of Public Funds Act of the Code of Virginia, Sections 2.2-4500 through 2.2-4516. Authorized investments include Certificates of Deposit, Commercial Paper, Bankers Acceptances, Repurchase Agreements, Agency Notes and Bonds, Treasury Bills, and Mutual Funds. The University’s investments are in investment pools held by the Treasurer of Virginia and are not categorized as to levels of risk. Investments fall into two groups: short and long-term. Short-term investments have an original maturity of over 90 days but less than or equal to one year.
GASB Statement 40, Deposit and Investment Risk Disclosures, requires the following risk disclosures:
Concentration of Credit Risk – Concentration of credit risk requires the disclosure by amount and issuer of any investments in any one issuer that represents 5% or more of total investments. As of June 30, 2015, none of the University’s investments involve concentration of credit risk.

NORFOLK STATE UNIVERSITY NOTES TO THE FINANCIAL STATEMENTS JUNE 30, 2015
20
Note 2—CASH AND CASH EQUIVALENTS AND INVESTMENTS (CONTINUED) Custodial Credit Risk – The custodial credit risk is the risk that, in the event of failure of the counterparty, the University would not be able to recover the value of its investment or collateral securities that are in the possession of the outside party. All investments are registered and held in the name of the University and, therefore, the University does not have this risk. Interest Rate Risk – The interest rate risk is the risk that changes in interest rates will adversely affect the fair value of an investment. The University limits its exposure to interest rate risk by limiting the maximum maturity lengths of investments and structuring the portfolio to maintain adequate liquidity to ensure the University’s ability to meet its operating requirements.
Foreign Currency Risk – Foreign currency risk is the risk that changes in exchange rates will adversely affect the fair value of an investment or a deposit. The University does not have investments in foreign currency.
B. Securities Lending Transactions Securities lending transactions represent the University’s allocated share of securities received for securities lending transactions held in the General Account of the Commonwealth. Loaned securities, for which the collateral is reported on the Statement of Net Position, are non-categorized as to credit risk. The Commonwealth’s policy is to record unrealized gains and losses in the General Fund in the Commonwealth’s basic financial statements. When gains or losses are realized, the actual gains and losses are recorded by the affected agencies. Details of the General Account securities lending program are included in the Commonwealth’s Comprehensive Annual Financial Report.
C. Credit and Concentration of Credit Risks
Fair Value 0-3 months Credit Rating
Cash equivalents:
Repurchase agreements 4,172,034$ 4,172,034$ A-1
Money market funds 854,251 854,251 A-1
SNAP 1,845,704 1,845,704 AAAm
Securities lending 692,437 692,437 Unrated
Investments:
Securities lending 25,062 25,062 Unrated
Totals 7,589,488$ 7,589,488$

NORFOLK STATE UNIVERSITY NOTES TO THE FINANCIAL STATEMENTS JUNE 30, 2015
21
Note 2—CASH AND CASH EQUIVALENTS AND INVESTMENTS (CONTINUED)
The Norfolk State University Foundation’s investments are managed by external investment managers in compliance with investments guidelines established by the Board of Directors. Financial instruments, which potentially subject the Foundation to concentration of credit risk, consist principally of cash, investments, and promises to give receivable. The Foundation places unrestricted cash and temporary overnight investments with high credit quality financial institutions. At times the balances may exceed the FDIC insurable limit. Promises to give – net include one promise that is approximately 56% of gross balance.
As of December 31, 2014, the Norfolk State University Foundation held the following investments:
Investments: Total Fair Value
Commonfund - multi strategy equity fund 15,891,577$
Commonfund - multi strategy bond fund 10,234,150
Securities and money market funds 1,437,541
Commonfund - Capital Partner IV 224,830
Exchange traded funds 18,905
Other 80,009
Total 27,887,012$
NORFOLK STATE UNIVERSITY NOTES TO THE FINANCIAL STATEMENTS JUNE 30, 2015
22
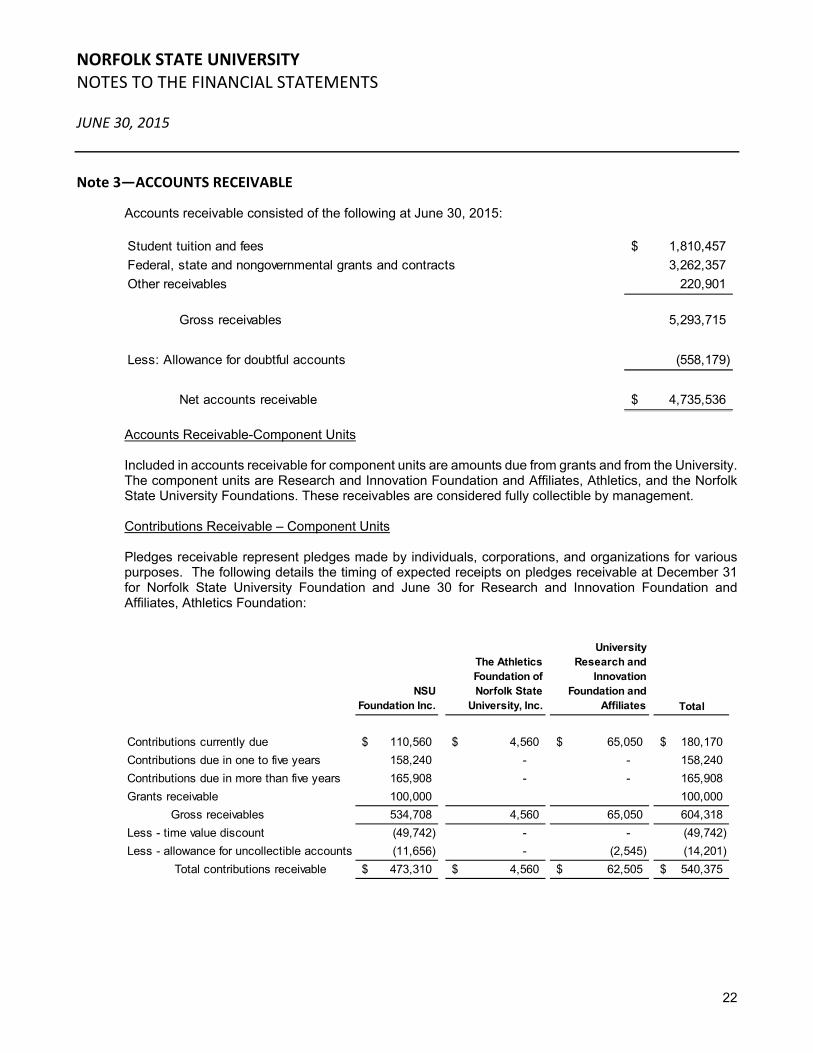
Note 3—ACCOUNTS RECEIVABLE
Accounts receivable consisted of the following at June 30, 2015:
Accounts Receivable-Component Units
Included in accounts receivable for component units are amounts due from grants and from the University. The component units are Research and Innovation Foundation and Affiliates, Athletics, and the Norfolk State University Foundations. These receivables are considered fully collectible by management.
Contributions Receivable – Component Units
Pledges receivable represent pledges made by individuals, corporations, and organizations for various purposes. The following details the timing of expected receipts on pledges receivable at December 31 for Norfolk State University Foundation and June 30 for Research and Innovation Foundation and Affiliates, Athletics Foundation:
Student tuition and fees 1,810,457$
Federal, state and nongovernmental grants and contracts 3,262,357
Other receivables 220,901
Gross receivables 5,293,715
Less: Allowance for doubtful accounts (558,179)
Net accounts receivable 4,735,536$
NSU Foundation Inc.
The Athletics Foundation of Norfolk State
University, Inc.
University Research and
Innovation Foundation and
Affiliates Total
Contributions currently due 110,560$ 4,560$ 65,050$ 180,170$
Contributions due in one to five years 158,240 - - 158,240
Contributions due in more than five years 165,908 - - 165,908
Grants receivable 100,000 100,000
Gross receivables 534,708 4,560 65,050 604,318
Less - time value discount (49,742) - - (49,742)
Less - allowance for uncollectible accounts (11,656) - (2,545) (14,201)
Total contributions receivable 473,310$ 4,560$ 62,505$ 540,375$

NORFOLK STATE UNIVERSITY NOTES TO THE FINANCIAL STATEMENTS JUNE 30, 2015
23
Note 4—CAPITAL ASSETS
A summary of changes in the various capital asset categories for the year ended June 30, 2015, is presented as follows.
Beginning Balance
Ending Balance
July 1, 2014 Additions Deletions June 30, 2015
Nondepreciable capital assets:
Land 5,941,099$ -$ -$ 5,941,099$
Construction in progress 47,761,795 14,888,036 43,037,282 19,612,549
Total nondepreciable capital assets 53,702,894 14,888,036 43,037,282 25,553,648
Depreciable capital assets:
Buildings 276,467,304 37,135,658 - 313,602,962
Infrastructure 7,525,762 2,345,599 - 9,871,361
Equipment 35,145,580 5,961,836 622,645 40,484,771
Other improvements 60,823 4,152,124 - 4,212,947
Software 1,240,909 8,500 - 1,249,409 Library materials 8,864,707 163,512 1,353,483 7,674,736
Total depreciable capital assets 329,305,085 49,767,229 1,976,128 377,096,186
Less accumulated depreciation for:
Buildings 120,498,519 9,210,312 - 129,708,831
Infrastructure 5,404,010 225,330 - 5,629,340
Equipment 20,763,146 2,997,168 227,202 23,533,112
Other improvements 53,128 88,713 - 141,841
Software 632,198 249,435 - 881,633
Library materials 8,621,210 114,691 1,353,483 7,382,418
Total accumulated depreciation 155,972,211 12,885,649 1,580,685 167,277,175
Depreciable capital assets, net 173,332,874 36,881,580 395,443 209,819,011
Total capital assets, net 227,035,768$ 51,769,616$ 43,432,725$ 235,372,659$

NORFOLK STATE UNIVERSITY NOTES TO THE FINANCIAL STATEMENTS JUNE 30, 2015
24
Note 4—CAPITAL ASSETS (CONTINUED) Capital Assets – Component Units
Note 5—ACCOUNTS PAYABLE AND ACCRUED EXPENSES
Accounts payable and accrued expenses consisted of the following at June 30, 2015:
NSU
Foundation
Inc.
Nondepreciable capital assets:
Land 24,310$ -$ -$ 24,310$
Development costs - - 546,074 546,074
Total nondepreciable capital assets 24,310 - 546,074 570,384
Depreciable capital assets:
Buildings - - 28,137,869 28,137,869
Equipment 871,912 104,755 3,492,188 4,468,855
Total depreciable capital assets 871,912 104,755 31,630,057 32,606,724
Less accumulated depreciation (632,041) (37,902) (9,480,934) (10,150,877)
Total depreciable capital assets, net 239,871 66,853 22,149,123 22,455,847
Total capital assets, net 264,181$ 66,853$ 22,695,197$ 23,026,231$
The Athletics Foundation of Norfolk
State University,
Inc.
NSU Research
and Innovation Foundation
and Affiliates Total
Vendors and suppliers accounts payable 2,905,226$
Employee salaries, wages, and fringe benefits payable 4,175,587
Accrued interest payable 535,337
Retainage payable 789,720
Spartan Suites rent and scholarships 51,871
Total accounts payable and accrued liabilities 8,457,741$

NORFOLK STATE UNIVERSITY NOTES TO THE FINANCIAL STATEMENTS JUNE 30, 2015
25
Note 6—NON‐CURRENT LIABILITIES
The University, Norfolk State University Research and Innovation Foundation and Affiliates and Norfolk State University Foundation, Inc.’s non-current liabilities consist of long-term debt (further described in Note 7) and other non-current liabilities. A summary of changes in non-current liabilities for the year ended June 30, 2015, is presented as follows:
Additions Deletions
Long-term debt:
Bonds payable 9c and 9d 3,718,220$ -$ 3,718,220$ -$ -$
Notes payable 34,772,066 9,070,000 10,100,378 33,741,688 1,305,885
Installment purchases 7,495,472 - 1,214,073 6,281,399 1,258,695
Unamortized bond discount (103,940) (63,037) (20,788) (146,189) (22,926)
Unamortized bond premium 1,926,838 - 272,485 1,654,353 125,219
Total long-term debt 47,808,656 9,006,963 15,284,368 41,531,251 2,666,873
Accrued compensated absences 3,162,143 1,315,973 1,592,594 2,885,522 922,484
Federal loan capital contributions 1,526,927 - - 1,526,927 -
Net pension liability 63,058,409 3,679,591 10,140,000 56,598,000 4,575,655
Total long-term liabilities 115,556,135$ 14,002,527$ 27,016,962$ 102,541,700$ 8,165,012$
Additions Deletions
Long-term debt:
Bonds payable 31,235,000$ -$ 320,000$ 30,915,000$ 400,000$
Notes payable 174,298 - 174,298 - -
Total long-term debt 31,409,298 - 494,298 30,915,000 400,000
Derivative - interest rate swap 2,209,505 - 974,242 1,235,263 -
Total long-term liabilities 33,618,803$ -$ 1,468,540$ 32,150,263$ 400,000$
Additions Deletions
Long-term liabilities:
Split-interest agreement 182,321$ -$ 14,989$ 167,332$ -$
Total long-term liabilities 182,321$ -$ 14,989$ 167,332$ -$
Ending BalanceCurrent Portion
Note (1) Beginning balance of long term liabilities was restated due to the implementation of GASB 68, Accounting and Financial Reporting for Pensions.
Norfolk State University Foundation, Inc. and
SubsidiaryBeginning Balance Ending Balance
Current Portion
Beginning Balance (1) Ending Balance
Current PortionUniversity
Research and Innovation Foundation and Affiliates
Beginning Balance

NORFOLK STATE UNIVERSITY NOTES TO THE FINANCIAL STATEMENTS JUNE 30, 2015
26
Note 7—LONG‐TERM DEBT
Norfolk State University has issued two categories of bonds pursuant to Section 9 of Article X of the Constitution of Virginia. Section 9 (d) bonds are revenue bonds, which are limited obligations of the University payable exclusively from pledged general revenues and are not debt of the Commonwealth, legally, morally, or otherwise. Pledged general fund revenues include general fund appropriations, tuition and fees, auxiliary enterprise revenues, and other revenues not required by law to be used for another purpose. The University issued the 9(d) bond directly through underwriters and also participates in the Public Higher Education Financing Program (Pooled Bond Program) created by the Virginia General Assembly in 1996. Through the Pooled Bond Program, the Virginia College Building Authority (VCBA) also issues 9(d) bonds and uses the proceeds to purchase debt obligations (notes) of the University and various other institutions of higher education. The University’s general revenue also secures these notes.
The Virginia College Building Authority (VCBA) issued 9(d) VCBA pooled bonds in previous fiscal years to refund prior issuances, the proceeds of which were deposited in an irrevocable trust with an escrow agent to provide for all future debt service payments on other debt. The notes representing that other debt are therefore considered defeased. Accordingly, the trust account’s assets and liabilities for the defeased notes are not included in the University’s financial statements. On June 30, 2012, $8,956,000 of Notes from Series 2004A bonds were considered defeased. As of June 30, 2015, $7,865,000 remains outstanding from the Series 2004A bonds. On July 1, 2014, the University defeased two debt obligations that were close to maturity, Phyllis Wheatley and Rosa Alexander dormitories (Series 1982) and the Dick Price Stadium athletic facility (Series 1996). The University used funds that were held in reserves by the State Treasury to extinguish the remaining debt of $1.2 million for the dormitories and $2.6 million for the stadium. The bonds were called on July 1, 2014. On October 22, 2014 the VCBA sold 186,035,000 Educational Facilities Revenue Refunding Bonds (Public Higher Educational Financing Program) Series 2014B with interest rates ranging from 3.0% to 3.25%. The sale of these bonds enabled the University to advance refund $8,845,000 of debt outstanding on the Series 2004A bond issues, which had interest rates ranging from 4.62% to 4.750%. The net proceeds were placed with an escrow agent to provide for all future debt service payment on refunded bonds. As a result, the bonds are considered to be defeased and the liability associated with these bonds has been removed from the long-term liabilities. The defeasance reduced total debt service payments over the next twenty-two years by $2,320,068, resulting a net present value savings of $1,946,453 based on a present value rate of 2.18%. The 2014B Series VCBA Educational Revenue Bonds were issued at a discount of $63,037 below the face value of the bonds. Section 9(c) bonds are general obligation bonds issued by the Commonwealth of Virginia on the behalf of the University, which are secured by the net revenues of the completed project and the full faith, credit, and taxing power of the Commonwealth of Virginia.
The University entered into a deed of bargain and sale with the City of Norfolk for the acquisition of the Brambleton Center. The note is payable in six full scholarships each year varying from $4,953 to $6,341 with the final amount due in 2019.
At June 30, 2015, installment purchases consist of the current and long-term portions of obligations resulting from various contracts used to finance the acquisition of equipment. The lengths of the purchase agreements are for five years and the interest rates charged are from 1.207% to 4.500%.
NORFOLK STATE UNIVERSITY NOTES TO THE FINANCIAL STATEMENTS JUNE 30, 2015
27
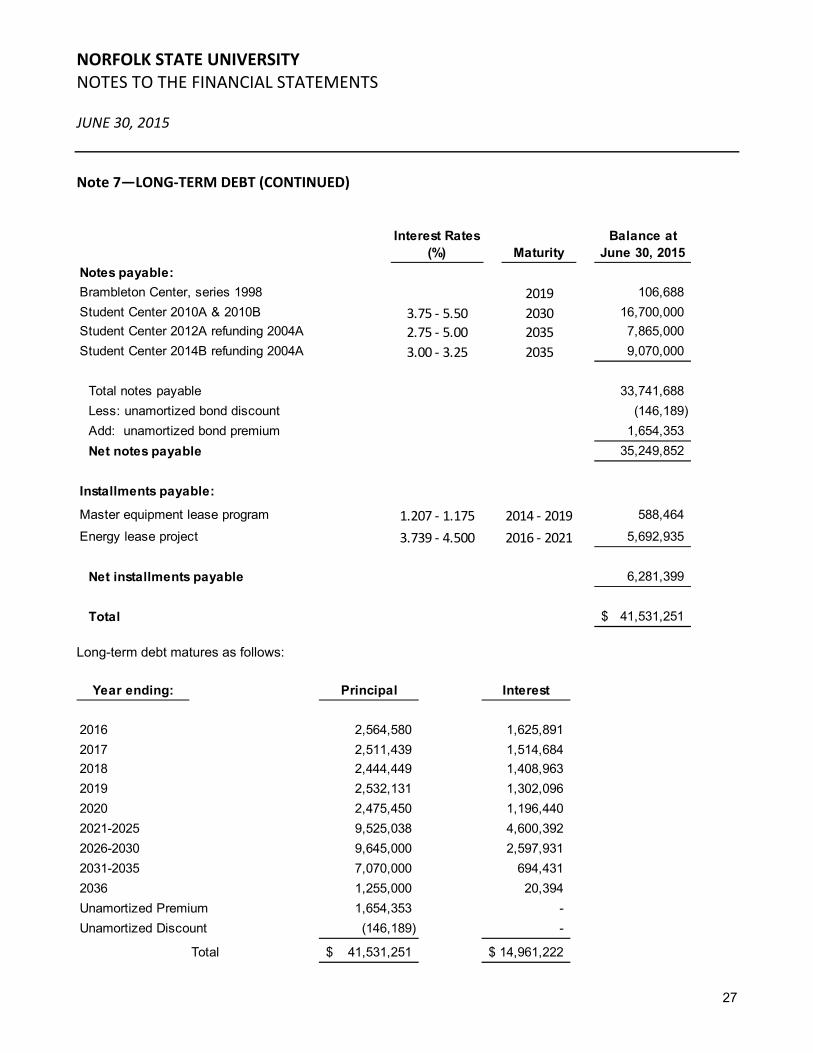
Note 7—LONG‐TERM DEBT (CONTINUED)
Long-term debt matures as follows:
Maturity
Notes payable:
Brambleton Center, series 1998 2019 106,688
Student Center 2010A & 2010B 3.75 ‐ 5.50 2030 16,700,000
Student Center 2012A refunding 2004A 2.75 ‐ 5.00 2035 7,865,000
Student Center 2014B refunding 2004A 3.00 ‐ 3.25 2035 9,070,000
Total notes payable 33,741,688
Less: unamortized bond discount (146,189)
Add: unamortized bond premium 1,654,353
Net notes payable 35,249,852
Installments payable:
Master equipment lease program 1.207 ‐ 1.175 2014 ‐ 2019 588,464
Energy lease project 3.739 ‐ 4.500 2016 ‐ 2021 5,692,935
Net installments payable 6,281,399
Total 41,531,251$
Interest Rates (%)
Balance at June 30, 2015
Principal Interest
2016 2,564,580 1,625,891
2017 2,511,439 1,514,684
2018 2,444,449 1,408,963
2019 2,532,131 1,302,096
2020 2,475,450 1,196,440
2021-2025 9,525,038 4,600,392
2026-2030 9,645,000 2,597,931
2031-2035 7,070,000 694,431
2036 1,255,000 20,394
Unamortized Premium 1,654,353 -
Unamortized Discount (146,189) -
Total 41,531,251$ 14,961,222$
Year ending:

NORFOLK STATE UNIVERSITY NOTES TO THE FINANCIAL STATEMENTS JUNE 30, 2015
28
Note 7—LONG‐TERM DEBT (CONTINUED)
Norfolk State University Research and Innovation Foundation and Affiliates Debt
In February 2005, the Norfolk State University Research and Innovation Foundation and Affiliates Debt entered into an agreement to finance the construction of a 620-bed student housing facility. The terms of the agreement obligate the Foundation pursuant to $32,000,000 Tax-Exempt Variable Rate Demand Qualified 501(c)(3) Bonds Series 2005. The terms of the indenture call for varying annual maturities through July 1, 2034, with a variable interest rate determined based on the flexible weekly rate as determined by the remarketing agent; principal payments are due semiannually starting July 1, 2008. The terms of the agreement require a debt service coverage ratio of at least 1.2:1 beginning July 1, 2006. The interest rate was .52% at June 30, 2015. The balance due on this loan as of June 30, 2015 was $30,915,000.
Notes payable to bank, interest at LIBOR plus 1.5% due monthly, principal payments to be escrowed by the Foundation beginning July 1, 2008 through July 1, 2015, secured by property and equipment. The interest rate was 2.27% at June 30, 2015. The balance as of June 30, 2015 was $0. As of June 30, 2015, the Norfolk State University Research and Innovation Foundation and Affiliates bonds mature as follows:
Future principal payments are as follows:
The bonds payable bear interest at a variable interest rate based on the flexible weekly rate as determined by the remarketing agent. To minimize the effect of changes in the variable rate, the Foundation entered an interest rate swap contract with a notional amount of $32,000,000 with a term of 29 years. The contract pays interest at a fixed 3.733% rate and receives interest at 67% of LIBOR. The net interest gain of $974,242 from changes in the swap contract’s fair value during the fiscal year is included as unrealized gain on interest swap in the Statement of Revenues, Expenses and Changes in Net Position. The contract includes a provision for three optional early termination periods between January 2016 and January 2018. The balance as of June 30, 2015 was $1,235,263.
In conjunction with the bond issuance, the University signed a support agreement with the Norfolk State University Research and Innovation Foundation and Affiliates stating that the project will be an equal part of the Student Housing Program, provide preferential treatment to provide 95% occupancy if the debt service coverage ratio is less than 1.2 to 1, and limit additional housing projects.
2016 400,000
2017 480,000
2018 570,000
2019 660,000
2020 760,000
2021-2025 5,600,000
2026-2030 9,450,000
2031-2035 12,995,000
Total 30,915,000$

NORFOLK STATE UNIVERSITY NOTES TO THE FINANCIAL STATEMENTS JUNE 30, 2015
29
Note 8—EXPENSES BY NATURAL CLASSIFICATIONS
The following table shows a classification of expenses both by function as listed in the Statement of Revenues, Expenses, and Changes in Net Position and by natural classification, which is the basis for amounts shown in the Statement of Cash Flows.
Instruction 25,437,689$ 7,773,906$ 3,564,003$ -$ -$ 1,176,075$ -$ 37,951,673$
Research 2,121,994 260,499 2,621,620 - - (109,682) - 4,894,431
Public service 438,342 112,667 537,363 - - 9,483 - 1,097,855
Academic support 8,767,279 2,759,820 (634,413) - - 1,132,260 - 12,024,946
Student services 2,408,955 954,278 942,938 - - 8,231 - 4,314,402
Institutional support 10,004,219 3,739,581 401,174 - - 699,275 - 14,844,249
Operations and maintence-plant 3,886,066 1,932,015 8,218,666 - 2,230,316 (654,762) - 15,612,301
Depreciation expense - - - - - - 12,885,649 12,885,649
Loss on disposal of assets - - - - - 395,443 - 395,443
Scholarship and fellowship - - - 17,397,700 - - - 17,397,700
Auxiliary activities 6,638,612 2,275,177 14,494,517 - 1,759,000 668,012 - 25,835,318
Total operating expenses 59,703,156$ 19,807,943$ 30,145,868$ 17,397,700$ 3,989,316$ 3,324,335$ 12,885,649$ 147,253,967$
Depreciation TotalSalaries and
WagesFringe
BenefitsServices and
Supplies
Scholarship and
Fellowship UtilitiesPlant and
Equipment

NORFOLK STATE UNIVERSITY NOTES TO THE FINANCIAL STATEMENTS JUNE 30, 2015
30
Note 9—STATE APPROPRIATIONS
The University receives state appropriations from the General Fund of the Commonwealth. The Appropriation Act specifies that such unexpended appropriations shall revert, as specifically provided by the General Assembly, at the end of the biennium. For years ending at the middle of a biennium, unexpended appropriations that have not been approved for reappropriation in the next year by the Governor become part of the General Fund of the Commonwealth and are, therefore, no longer available to the University for disbursements. The following is a summary of education and general state appropriations received by the University including all supplemental appropriations and reversions:
Original legislative appropriation:
Educational and general programs 41,800,286$
Student financial assistance 8,219,664
Adjustments:
VIVA ILL allocation 3,961
Clinical faculty grant 42,620
Virginia military survivors and dependents 95,625
Two year college transfer grant 5,000
Brown vs. Board of Education 3,255
Personnel cost 817,454
App Tr HEOF to GF 944
Miscellanous educational and general 46,628
Adjusted appropriation 51,035,437$

NORFOLK STATE UNIVERSITY NOTES TO THE FINANCIAL STATEMENTS JUNE 30, 2015
31
Note 10—COMMITMENTS
At June 30, 2015, the University was committed to construction contracts totaling approximately $24,159,806. Outstanding commitments on these contracts totaled $5,967,814 as of June 30, 2015.
The University is committed under various operating leases for equipment and facilities. In general, the leases are for a one-year term and the University has renewal options on equipment and facilities for another one-year term. In most cases, the University expects that in the normal course of business, these leases will be replaced by similar leases. Rental expense for the fiscal year ended June 30, 2015, was $1,032,040. The City of Newport News lease contains an escalation clause, which allows for a base rent adjustment every two years. The percentage increase is equal to one-half of the percentage increase of the consumer price index for the corresponding period.
Norfolk State University has as of June 30, 2015, the following total future minimum rental payments due under the above leases:
Year
Operating Lease
Obligation
2016 804,605$
2017 730,284
2018 755,742
2019 463,776
2020 473,524
Total 3,227,931$

NORFOLK STATE UNIVERSITY NOTES TO THE FINANCIAL STATEMENTS JUNE 30, 2015
32
Note 11—RETIREMENT PLANS
Virginia Retirement System - General Information about the Pension Plan
Plan Description
All full-time, salaried permanent employees of state agencies and institutions are automatically covered by VRS State Employee Retirement Plan or the VaLORS Retirement Plan upon employment. These plans are administered by the Virginia Retirement System (the System) along with plans for other employer groups in the Commonwealth of Virginia. The VRS State Employee Retirement Plan and VaLORS Retirement Plan are single employer plans treated as a cost-sharing employer plan for financial reporting purposes. Members earn one month of service credit for each month they are employed and for which they and their employer are pay contributions to VRS. Members are eligible to purchase prior service, based on specific criteria a defined in the Code of Virginia, as amended. Eligible prior service that may be purchased includes prior public service, active military service, certain periods of leave, and previously refunded service.
The System administers three different benefit structures for covered employees in the VRS State Employee Retirement Plan – Plan 1, Plan 2, and, Hybrid and two different benefit structures for covered employees in the VaLORS Retirement Plan – Plan 1 and Plan 2. Each of these benefit structures has a different eligibility criteria. The specific information for each plan and the eligibility for covered groups within each plan are set out in the table below:
RETIREMENT PLAN PROVISIONS BY PLAN STRUCTURE
PLAN 1
PLAN 2 HYBRID
RETIREMENT PLAN About Plan 1 Plan 1 is a defined benefit plan. The retirement benefit is based on a member’s age, creditable service and average final compensation at retirement using a formula. Employees are eligible for Plan 1 if their membership date is before July 1, 2010, and they were vested as of January 1, 2013.
About Plan 2 Plan 2 is a defined benefit plan. The retirement benefit is based on a member’s age, creditable service and average final compensation at retirement using a formula. Employees are eligible for Plan 2 if their membership date is on or after July 1, 2010, or their membership date is before July 1, 2010, and they were not vested as of January 1, 2013.
About the Hybrid Retirement Plan The Hybrid Retirement Plan combines the features of a defined benefit plan and a defined contribution plan. Most members hired on or after January 1, 2014 are in this plan, as well as Plan 1 and Plan 2 members who were eligible and opted into the plan during a special election window. (see “Eligible Members”)
• The defined benefit is based on a member’s age, creditable service and average final compensation at retirement using a formula. • The benefit from the defined contribution component of the plan depends on the member and employer contributions made to the plan and the investment performance of those contributions.

NORFOLK STATE UNIVERSITY NOTES TO THE FINANCIAL STATEMENTS JUNE 30, 2015
33
Note 11—RETIREMENT PLANS (CONTINUED) Plan Description • In addition to the monthly
benefit payment payable from the defined benefit plan at retirement, a member may start receiving distributions from the balance in the defined contribution account, reflecting the contributions, investment gains or losses, and any required fees.
Eligible Members Employees are in Plan 1 if their membership date is before July 1, 2010, and they were vested as of January 1, 2013. Hybrid Opt-In Election VRS non-hazardous duty covered Plan 1 members were allowed to make an irrevocable decision to opt into the Hybrid Retirement Plan during a special election window held January 1 through April 30, 2014. The Hybrid Retirement Plan’s effective date for eligible Plan 1 members who opted in was July 1, 2014. If eligible deferred members returned to work during the election window, they were also eligible to opt into the Hybrid Retirement Plan. Members who were eligible for an optional retirement plan (ORP) and had prior service under Plan 1 were not eligible to elect the Hybrid Retirement Plan and remain as Plan 1 or ORP.
Eligible Members Employees are in Plan 2 if their membership date is on or after July 1, 2010, or their membership date is before July 1, 2010, and they were not vested as of January 1, 2013. Hybrid Opt-In Election Eligible Plan 2 members were allowed to make an irrevocable decision to opt into the Hybrid Retirement Plan during a special election window held January 1 through April 30, 2014. The Hybrid Retirement Plan’s effective date for eligible Plan 2 members who opted in was July 1, 2014. If eligible deferred members returned to work during the election window, they were also eligible to opt into the Hybrid Retirement Plan. Members who were eligible for an optional retirement plan (ORP) and have prior service under Plan 2 were not eligible to elect the Hybrid Retirement Plan and remain as Plan 2 or ORP.
Eligible Members Employees are in the Hybrid Retirement Plan if their membership date is on or after January 1, 2014. This includes:
• State employees* • Members in Plan 1 or Plan 2 who elected to opt into the plan during the election window held January 1-April 30, 2014; the plan’s effective date for opt-in members was July 1, 2014
*Non-Eligible Members Some employees are not eligible to participate in the Hybrid Retirement Plan. They include:
• Members of the Virginia Law Officers’ Retirement System (VaLORS)
Those employees eligible for an optional retirement plan (ORP) must elect the ORP plan or the Hybrid Retirement Plan. If these members have prior service under Plan 1 or Plan 2, they are not eligible to elect the Hybrid Retirement Plan and must select Plan 1 or Plan 2 (as applicable) or ORP.

NORFOLK STATE UNIVERSITY NOTES TO THE FINANCIAL STATEMENTS JUNE 30, 2015
34
Note 11—RETIREMENT PLANS (CONTINUED) Plan Description Retirement Contributions State employees, excluding state elected officials, and optional retirement plan participants, contribute 5% of their compensation each month to their member contribution account through a pre-tax salary reduction. Member contributions are tax-deferred until they are withdrawn as part of a retirement benefit or as a refund. The employer makes a separate actuarially determined contribution to VRS for all covered employees. VRS invests both member and employer contributions to provide funding for the future benefit payment.
Retirement Contributions State employees contribute 5% of their compensation each month to their member contribution account through a pre-tax salary reduction.
Retirement Contributions A member’s retirement benefit is funded through mandatory and voluntary contributions made by the member and the employer to both the defined benefit and the defined contribution components of the plan. Mandatory contributions are based on a percentage of the employee’s creditable compensation and are required from both the member and the employer. Additionally, members may choose to make voluntary contributions to the defined contribution component of the plan, and the employer is required to match those voluntary contributions according to specified percentages.

NORFOLK STATE UNIVERSITY NOTES TO THE FINANCIAL STATEMENTS JUNE 30, 2015
35
Note 11—RETIREMENT PLANS (CONTINUED) Plan Description Creditable Service Creditable service includes active service. Members earn creditable service for each month they are employed in a covered position. It also may include credit for prior service the member has purchased or additional creditable service the member was granted. A member’s total creditable service is one of the factors used to determine their eligibility for retirement and to calculate their retirement benefit. It also may count toward eligibility for the health insurance credit in retirement, if the employer offers the health insurance credit.
Creditable Service Same as Plan 1.
Creditable Service Defined Benefit Component: Under the defined benefit component of the plan, creditable service includes active service. Members earn creditable service for each month they are employed in a covered position. It also may include credit for prior service the member has purchased or additional creditable service the member was granted. A member’s total creditable service is one of the factors used to determine their eligibility for retirement and to calculate their retirement benefit. It also may count toward eligibility for the health insurance credit in retirement, if the employer offers the health insurance credit. Defined Contributions Component: Under the defined contribution component, creditable service is used to determine vesting for the employer contribution portion of the plan.

NORFOLK STATE UNIVERSITY NOTES TO THE FINANCIAL STATEMENTS JUNE 30, 2015
36
Note 11—RETIREMENT PLANS (CONTINUED) Plan Description Vesting Vesting is the minimum length of service a member needs to qualify for a future retirement benefit. Members become vested when they have at least five years (60 months) of creditable service. Vesting means members are eligible to qualify for retirement if they meet the age and service requirements for their plan. Members also must be vested to receive a full refund of their member contribution account balance if they leave employment and request a refund. Members are always 100% vested in the contributions that they make.
Vesting Same as Plan 1.
Vesting Defined Benefit Component: Defined benefit vesting is the minimum length of service a member needs to qualify for a future retirement benefit. Members are vested under the defined benefit component of the Hybrid Retirement Plan when they reach five years (60 months) of creditable service. Plan 1 or Plan 2 members with at least five years (60 months) of creditable service who opted into the Hybrid Retirement Plan remain vested in the defined benefit component. Defined Contributions Component: Defined contribution vesting refers to the minimum length of service a member needs to be eligible to withdraw the employer contributions from the defined contribution component of the plan. Members are always 100% vested in the contributions that they make. Upon retirement or leaving covered employment, a member is eligible to withdraw a percentage of employer contributions to the defined contribution component of the plan, based on service.
• After two years, a member is 50% vested and may withdraw 50% of employer contributions. • After three years, a member is 75% vested and may withdraw 75% of employer contributions. • After four or more years, a member is 100% vested and may withdraw 100% of employer contributions.
Distribution is not required by law until age 70½.

NORFOLK STATE UNIVERSITY NOTES TO THE FINANCIAL STATEMENTS JUNE 30, 2015
37
Note 11—RETIREMENT PLANS (CONTINUED) Plan Description Calculating the Benefit The Basic Benefit is calculated based on a formula using the member’s average final compensation, a retirement multiplier and total service credit at retirement. It is one of the benefit payout options available to a member at retirement. An early retirement reduction factor is applied to the Basic Benefit if the member retires with a reduced retirement benefit or selects a benefit payout option other than the Basic Benefit.
Calculating the Benefit See definition under Plan 1.
Calculating the Benefit Defined Benefit Component: See definition under Plan 1 Defined Contribution Component: The benefit is based on contributions made by the member and any matching contributions made by the employer, plus net investment earnings on those contributions.
Average Final Compensation A member’s average final compensation is the average of the 36 consecutive months of highest compensation as a covered employee.
Average Final Compensation A member’s average final compensation is the average of their 60 consecutive months of highest compensation as a covered employee.
Average Final Compensation Same as Plan 2. It is used in the retirement formula for the defined benefit component of the plan.
Service Retirement Multiplier VRS: The retirement multiplier is a factor used in the formula to determine a final retirement benefit. The retirement multiplier for non-hazardous duty members is 1.7%. VaLORS: The retirement multiplier for VaLORS employees is 1.70% or 2.00%.
Service Retirement Multiplier VRS: Same as Plan 1 for service earned, purchased or granted prior to January 1, 2013. For non-hazardous duty members the retirement multiplier is 1.65% for creditable service earned, purchased or granted on or after January 1, 2013. VaLORS: The retirement multiplier for VaLORS employees is 2.00%.
Service Retirement Multiplier Defined Benefit Component: VRS: The retirement multiplier for the defined benefit component is 1.0%. For members who opted into the Hybrid Retirement Plan from Plan 1 or Plan 2, the applicable multipliers for those plans will be used to calculate the retirement benefit for service credited in those plans. VaLORS: Not applicable. Defined Contribution Component: Not applicable.

NORFOLK STATE UNIVERSITY NOTES TO THE FINANCIAL STATEMENTS JUNE 30, 2015
38
Note 11—RETIREMENT PLANS (CONTINUED) Plan Description Normal Retirement Age VRS: Age 65. VaLORS: Age 60.
Normal Retirement Age VRS: Normal Social Security retirement age. VaLORS: Same as Plan 1.
Normal Retirement Age Defined Benefit Component: VRS: Same as Plan 2. VaLORS: Not applicable. Defined Contribution Component: Members are eligible to receive distributions upon leaving employment, subject to restrictions.
Earliest Unreduced Retirement Eligibility VRS: Age 65 with at least five years (60 months) of creditable service or at age 50 with at least 30 years of creditable service. VaLORS: Age 60 with at least five years of creditable service or age 50 with at least 25 years of creditable service.
Earliest Unreduced Retirement Eligibility VRS: Normal Social Security retirement age with at least five years (60 months) of creditable service or when their age and service equal 90. VaLORS: Same as Plan 1.
Earliest Unreduced Retirement Eligibility Defined Benefit Component: VRS: Normal Social Security retirement age and have at least five years (60 months) of creditable service or when their age and service equal 90. VaLORS: Not applicable. Defined Contribution Component: Members are eligible to receive distributions upon leaving employment, subject to restrictions.

NORFOLK STATE UNIVERSITY NOTES TO THE FINANCIAL STATEMENTS JUNE 30, 2015
39
Note 11—RETIREMENT PLANS (CONTINUED) Plan Description Earliest Reduced Retirement Eligibility VRS: Age 55 with at least five years (60 months) of creditable service or age 50 with at least 10 years of creditable service. VaLORS: 50 with at least five years of creditable service.
Earliest Reduced Retirement Eligibility VRS: Age 60 with at least five years (60 months) of creditable service. VaLORS: Same as Plan 1.
Earliest Unreduced Retirement Eligibility Defined Benefit Component: VRS: Age Members may retire with a reduced benefit as early as age 60 with at least five years (60 months) of creditable service. VaLORS: Not applicable. Defined Contribution Component: Members are eligible to receive distributions upon leaving employment, subject to restrictions.
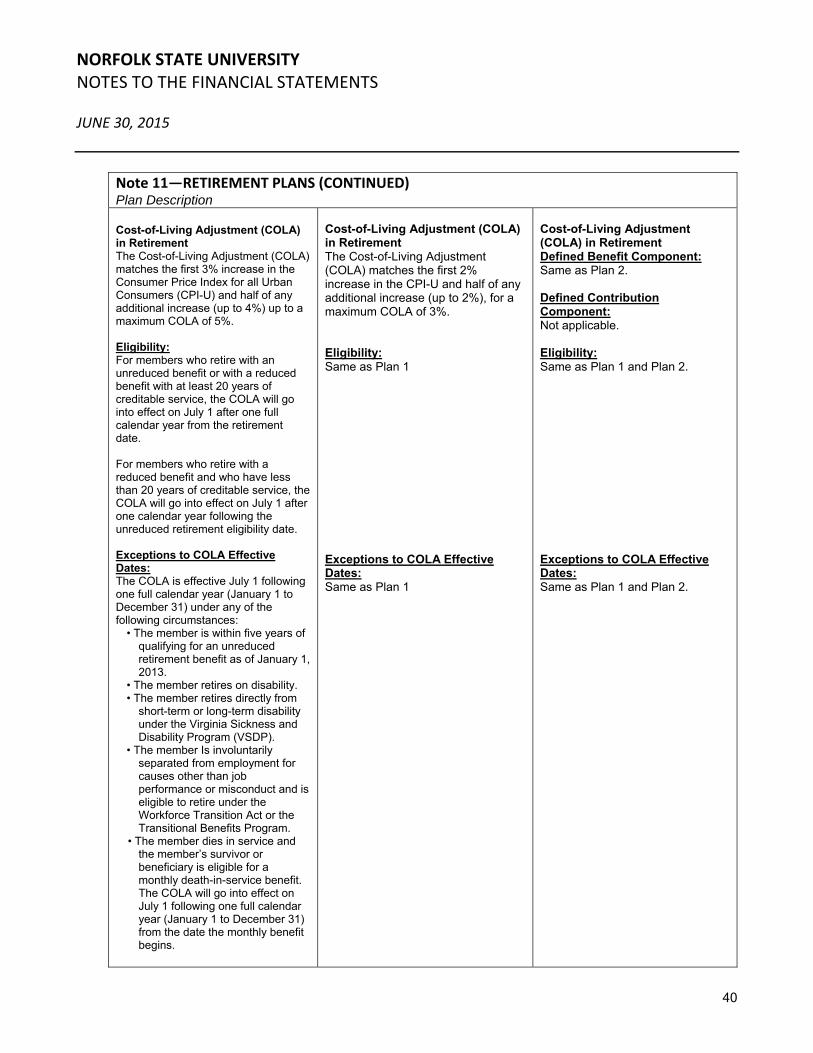
NORFOLK STATE UNIVERSITY NOTES TO THE FINANCIAL STATEMENTS JUNE 30, 2015
40
Note 11—RETIREMENT PLANS (CONTINUED) Plan Description Cost-of-Living Adjustment (COLA) in Retirement The Cost-of-Living Adjustment (COLA) matches the first 3% increase in the Consumer Price Index for all Urban Consumers (CPI-U) and half of any additional increase (up to 4%) up to a maximum COLA of 5%. Eligibility: For members who retire with an unreduced benefit or with a reduced benefit with at least 20 years of creditable service, the COLA will go into effect on July 1 after one full calendar year from the retirement date. For members who retire with a reduced benefit and who have less than 20 years of creditable service, the COLA will go into effect on July 1 after one calendar year following the unreduced retirement eligibility date. Exceptions to COLA Effective Dates: The COLA is effective July 1 following one full calendar year (January 1 to December 31) under any of the following circumstances:
• The member is within five years of qualifying for an unreduced retirement benefit as of January 1, 2013.
• The member retires on disability. • The member retires directly from
short-term or long-term disability under the Virginia Sickness and Disability Program (VSDP).
• The member Is involuntarily separated from employment for causes other than job performance or misconduct and is eligible to retire under the Workforce Transition Act or the Transitional Benefits Program.
• The member dies in service and the member’s survivor or beneficiary is eligible for a monthly death-in-service benefit. The COLA will go into effect on July 1 following one full calendar year (January 1 to December 31) from the date the monthly benefit begins.
Cost-of-Living Adjustment (COLA) in Retirement The Cost-of-Living Adjustment (COLA) matches the first 2% increase in the CPI-U and half of any additional increase (up to 2%), for a maximum COLA of 3%. Eligibility: Same as Plan 1 Exceptions to COLA Effective Dates: Same as Plan 1
Cost-of-Living Adjustment (COLA) in Retirement Defined Benefit Component: Same as Plan 2. Defined Contribution Component: Not applicable. Eligibility: Same as Plan 1 and Plan 2. Exceptions to COLA Effective Dates: Same as Plan 1 and Plan 2.

NORFOLK STATE UNIVERSITY NOTES TO THE FINANCIAL STATEMENTS JUNE 30, 2015
41
Note 11—RETIREMENT PLANS (CONTINUED) Plan Description Disability Coverage Members who are eligible to be considered for disability retirement and retire on disability, the retirement multiplier is 1.7% on all service, regardless of when it was earned, purchased or granted. Most state employees are covered under the Virginia Sickness and Disability Program (VSDP), and are not eligible for disability retirement. VSDP members are subject to a one-year waiting period before becoming eligible for non-work-related disability benefits.
Disability Coverage Members who are eligible to be considered for disability retirement and retire on disability, the retirement multiplier is 1.65% on all service, regardless of when it was earned, purchased or granted. Most state employees are covered under the Virginia Sickness and Disability Program (VSDP), and are not eligible for disability retirement. VSDP members are subject to a one-year waiting period before becoming eligible for non-work related disability benefits.
Disability Coverage State employees (including Plan 1 and Plan 2 opt-ins) participating in the Hybrid Retirement Plan are covered under the Virginia Sickness and Disability Program (VSDP), and are not eligible for disability retirement. Hybrid members (including Plan 1 and Plan 2 opt-ins) covered under VSDP are subject to a one-year waiting period before becoming eligible for non-work-related disability benefits.
Purchase of Prior Service Members may be eligible to purchase service from previous public employment, active duty military service, an eligible period of leave or VRS refunded service as creditable service in their plan. Prior creditable service counts toward vesting, eligibility for retirement and the health insurance credit. Only active members are eligible to purchase prior service. When buying service, members must purchase their most recent period of service first. Members also may be eligible to purchase periods of leave without pay.
Purchase of Prior Service Same as Plan 1.
Purchase of Prior Service Defined Benefit Component: Same as Plan 1, with the following exceptions: Hybrid Retirement Plan
members are ineligible for ported service.
The cost for purchasing refunded service is the higher of 4% of creditable compensation or average final compensation.
Plan members have one year from their date of hire or return from leave to purchase all but refunded prior service at approximate normal cost./ After that on-year period, the rate for most categories of service will change to actuarial cost.
Defined Contribution Component: Not applicable.

NORFOLK STATE UNIVERSITY NOTES TO THE FINANCIAL STATEMENTS
JUNE 30, 2015
42
Note 11—RETIREMENT PLANS (CONTINUED)
Contributions
The contribution requirement for active employees is governed by §51.1-145 of the Code of Virginia, as amended, but may be impacted as a result of funding provided to state agencies by the Virginia General Assembly. Employees are required to contribute 5.00% of their compensation toward their retirement. Prior to July 1, 2012, the 5.00% member contribution was paid by the employer. Beginning July 1, 2012 state employees were required to pay the 5% member contribution and the employer was required to provide a salary increase equal to the amount of the increase in the employee-paid member contribution. Each state agency’s contractually required contribution rate for the year ended June 30, 2015 was 12.33% of covered employee compensation for employees in the VRS State Employee Retirement Plan and 17.67% of covered employee compensation for employees in the VaLORS Retirement Plan. These rates were based on an actuarially determined rate from an actuarial valuation as of June 30, 2013. The actuarial rate for the VRS State Employee Retirement Plan was 15.80% and the actuarial rate for VaLORS Retirement Plan was 21.06%. The actuarially determined rate, when combined with employee contributions, was expected to finance the costs of benefits earned by employee during the year, with an additional amount to finance any unfunded accrued liability. Based on the provisions of §51.1-145 of the Code of Virginia, as amended, the contributions for the VRS State Employee Retirement Plan were funded at 78.02% of the actuarial rate and the contributions for the VaLORS Retirement Plan were funded at 83.88% of the actuarial rate for the year ended June 30, 2015. Contributions from Norfolk State University to the VRS State Employee Retirement Plan were $4,405,042 and $3,311,079 for the years ended June 30, 2015 and June 30, 2014, respectively. Contributions from the University to the VaLORS Retirement Plan were $170,613 and $139,512 for the years ended June 30, 2015 and June 30, 2014, respectively.
Pension Liabilities, Pension Expense, and Deferred Outflows of Resources and Deferred Inflows of Resources Related to Pensions
At June 30, 2015, Norfolk State University reported a liability of $54,796,000 for its proportionate share of the VRS State Employee Retirement Plan Net Pension Liability and a liability of $1,802,000 for its proportionate share of the VaLORS Retirement Plan Net Pension Liability. The Net Pension Liability was measured as of June 30, 2014 and the total pension liability used to calculate the Net Pension Liability was determined by an actuarial valuation as of that date. The University’s proportion of the Net Pension Liability was based on the University’s actuarially determined employer contributions to the pension plan for the year ended June 30, 2014 relative to the total of the actuarially determined employer contributions for all participating employers. At June 30, 2014, the University’s proportion of the VRS State Employee Retirement Plan was .98% as compared to .98% at June 30, 2013. At June 30, 2014, the University’s proportion of the VaLORS Retirement Plan .27% as compared to .27% at June 30, 2013.
For the year ended June 30, 2015, Norfolk State University recognized pension expense of $3,571,079 for the VRS State Employee Retirement Plan and $108,512 for the VaLORS Retirement Plan. Since there was a change in proportionate share between June 30, 2013 and June 30, 2014, a portion of the pension expense was related to deferred amounts from changes in proportion and from differences between employer contributions and the proportionate share of employer contributions.
At June 30, 2015, Norfolk State University reported deferred outflows of resources and deferred inflows of resources related to pensions from the following sources:

NORFOLK STATE UNIVERSITY NOTES TO THE FINANCIAL STATEMENTS JUNE 30, 2015
43
Note 11—RETIREMENT PLANS (CONTINUED)
VRS Retirement Plan Deferred Outflows of Deferred Inflows of($ thousands) Resources Resources
Differences between expected and actual experience -$ $ 9,780
Change in assumptions - -
Net difference between projected and actual earnings on pension plan investments -
Changes in proportion and differences between Employer contributions and proportionate share of contributions - 135
Employer contributions subsequent to the measurement date 4,405,042 -
Total 4,405,042$ 9,915$
VaLORS Retirement Plan Deferred Outflows of Deferred Inflows of($ thousands) Resources Resources
Differences between expected and actual experience -$ $ 187
Change in assumptions - -
Net difference between projected and actual earnings on pension plan investments -
Changes in proportion and differences between Employer contributions and proportionate share of contributions - 38
Employer contributions subsequent to the measurement date 170,613 -
Total 170,613$ 225$
-
-

NORFOLK STATE UNIVERSITY NOTES TO THE FINANCIAL STATEMENTS JUNE 30, 2015
44
Note 11—RETIREMENT PLANS (CONTINUED)
Norfolk State University has $4,405,042 for VRS and $170,613 for VaLORS reported as deferred outflows of resources related to pensions resulting from the University’s contributions subsequent to the measurement date will be recognized as a reduction of the Net Pension Liability in the year ended June 30, 2016. Other amounts reported as deferred inflows of resources related to pensions will be recognized in pension expense as follows:
Year ended June 30
($ thousands)VRS Retirement Plan VaLORS Retirement Plan
2016 2,492$ 61$ 2017 2,492$ 61$ 2018 2,486$ 57$ 2019 2,445$ 46$
Actuarial Assumptions
The total pension liability for the VRS State Employee Retirement Plan was based on an actuarial valuation as of June 30, 2013, using the Entry Age Normal actuarial cost method and the following assumptions, applied to all periods included in the measurement and rolled forward to the measurement date of June 30, 2014.
Inflation 2.5 percent
Salary increases, including Inflation 3.5 percent – 5.35 percent Investment rate of return 7.0 percent, net of pension plan investment
expense, including inflation*
* Administrative expenses as a percent of the market value of assets for the last experience study were found to be approximately 0.06% of the market assets for all of the VRS plans. This would provide an assumed investment return rate for GASB purposes of slightly more than the assumed 7.0%. However, since the difference was minimal, and a more conservative 7.0% investment return assumption provided a projected plan net position that exceeded the projected benefit payments, the long-term expected rate of return on investments was assumed to be 7.0% to simplify preparation of pension liabilities.
Mortality rates: Pre-Retirement:
RP-2000 Employee Mortality Table Projected with Scale AA to 2020 with males set forward 2 years and females were set back 3 years.
Post-Retirement:
RP-2000 Combined Mortality Table Projected with Scale AA to 2020 with females set back 1 year.

NORFOLK STATE UNIVERSITY NOTES TO THE FINANCIAL STATEMENTS JUNE 30, 2015
45
Note 11—RETIREMENT PLANS (CONTINUED) Post-Disablement:
RP-2000 Disability Life Mortality Table Projected to 2020 with males set back 3 years and no provision for future mortality improvement
The actuarial assumptions used in the June 30, 2013 valuation were based on the results of an actuarial experience study for the period from July 1, 2008 through June 30, 2012. Changes to the actuarial assumptions as a result of the experience study are as follows:
- Update mortality table - Decrease in rates of service retirement - Decrease in rates of withdrawals for less than 10 years of service - Decrease in rates of male disability retirement - Reduce rates of salary increase by 0.25% per year
The total pension liability for the VaLORS Retirement Plan was based on an actuarial valuation as of June 30, 2013, using the Entry Age Normal actuarial cost method and the following assumptions, applied to all periods included in the measurement and rolled forward to the measurement date of June 30, 2014.
Inflation 2.5 percent
Salary increases, including Inflation 3.5 percent – 4.75 percent Investment rate of return 7.0 percent, net of pension plan investment
expense, including inflation*
* Administrative expenses as a percent of the market value of assets for the last experience study were found to be approximately 0.06% of the market assets for all of the VRS plans. This would provide an assumed investment return rate for GASB purposes of slightly more than the assumed 7.0%. However, since the difference was minimal, and a more conservative 7.0% investment return assumption provided a projected plan net position that exceeded the projected benefit payments, the long-term expected rate of return on investments was assumed to be 7.0% to simplify preparation of pension liabilities.
Mortality rates: Pre-Retirement:
RP-2000 Employee Mortality Table Projected with Scale AA to 2020 with males set forward 5 years and females were set back 3 years.
Post-Retirement:
RP-2000 Combined Mortality Table Projected with Scale AA to 2020 with females set back 1 year. Post-Disablement:
RP-2000 Disability Life Mortality Table Projected to 2020 with males set back 3 years and no provision for future mortality improvement.

NORFOLK STATE UNIVERSITY NOTES TO THE FINANCIAL STATEMENTS JUNE 30, 2015
46
Note 11—RETIREMENT PLANS (CONTINUED)
The actuarial assumptions used in the June 30, 2013 valuation were based on the results of an actuarial experience study for the period from July 1, 2008 through June 30, 2012. Changes to the actuarial assumptions as a result of the experience study are as follows:
- Update mortality table - Adjustments to the rates of service retirement - Decrease in rates of withdrawals for females under 10 years of service - Increase in rates of disability - Decrease service related disability rate from 60% to 50%
Net Pension Liability
The net pension liability (NPL) is calculated separately for each system and represents that particular system’s total pension liability determined in accordance with GASB Statement No. 67, less that system’s fiduciary net position. As of June 30, 2014, NPL amounts for the VRS State Employee Retirement Plan and the VaLORS Retirement Plan are as follows (amounts expressed in thousands):
State Employee VaLORS Retirement Retirement Plan Plan Total Pension Liability $ 21,766,933 $ 1,824,577 Plan Fiduciary Net Position 16,168,535 1,150,450 Employers’ Net Pension Liability (Asset) $ 5,598,398 $ 674,127 Plan Fiduciary Net Position as a Percentage of the Total Pension Liability 74.28% 63.05%
The total pension liability is calculated by the System’s actuary, and each plan’s fiduciary net position is reported in the System’s financial statements. The net pension liability is disclosed in accordance with the requirements of GASB Statement No. 67 in the Commonwealth’s) notes to the Comprehensive Annual Financial Report (CAFR) and required supplementary information.
Long-Term Expected Rate of Return The long-term expected rate of return on pension System investments was determined using a log-normal distribution analysis in which best-estimate ranges of expected future real rates of return (expected returns, net of pension System investment expense and inflation) are developed for each major asset class. These ranges are combined to produce the long-term expected rate of return by weighting the expected future real rates of return by the target asset allocation percentage and by adding expected inflation. The target asset allocation and best estimate of arithmetic real rates of return for each major asset class are summarized in the following table:

NORFOLK STATE UNIVERSITY NOTES TO THE FINANCIAL STATEMENTS JUNE 30, 2015
47
Note 11—RETIREMENT PLANS (CONTINUED) Weighted
Arithmetic AverageLong-Term Long-Term
Target Expected ExpectedAsset Class (Strategy) Allocation Rate of Return Rate of Return
U.S. Equity 19.50% 6.46% 1.26%Developed Non U.S Equity 16.50% 6.28% 1.04%Emerging Market Equity 6.00% 10.00% 0.60%Fixed Income 15.00% 0.09% 0.01%Emerging Debt 3.00% 3.51% 0.11%Rate Sensitive Credit 4.50% 3.51% 0.16%Non Rate Sensitive Credit 4.50% 5.00% 0.23%Convertibles 3.00% 4.81% 0.14%Public Real Estate 2.25% 6.12% 0.14%Private Real Estate 12.75% 7.10% 0.91%Private Equity 12.00% 10.41% 1.25%Cash 1.00% -1.50% -0.02%
Total 100.00% 5.83%
Inflation 2.50%* Expected arithmetic nominal return 8.33%
* Using stochastic projection results provides an expected range of real rates of return over various time horizons. Looking at one year results produces an expected real return of 8.33% but also has a high standard deviation, which means there is high volatility. Over larger time horizons the volatility declines significantly and provides a median return of 7.44%, including expected inflation of 2.50%.
Discount Rate
The discount rate used to measure the total pension liability was 7.00%. The projection of cash flows used to determine the discount rate assumed that System member contributions will be made per the VRS Statutes and the employer contributions will be made in accordance with the VRS funding policy at rates equal to the difference between actuarially determined contribution rates adopted by the VRS Board of Trustees and the member rate. Through the fiscal year ending June 30, 2018, the rate contributed by the University for the VRS State Employee Retirement Plan and the VaLORS Retirement Plan will be subject to the portion of the VRS Board-certified rates that are funded by the Virginia General Assembly. From July 1, 2018 on, all agencies are assumed to contribute 100% of the actuarially determined contribution rates. Based on those assumptions, the pension plan’s fiduciary net position was projected to be available to make all projected future benefit payments of current active and inactive employees. Therefore the long-term expected rate of return was applied to all periods of projected benefit payments to determine the total pension liability,

NORFOLK STATE UNIVERSITY NOTES TO THE FINANCIAL STATEMENTS JUNE 30, 2015
48
Note 11—RETIREMENT PLANS (CONTINUED)
Sensitivity of the University’s Proportionate Share of the Net Pension Liability to Changes in the Discount Rate
The following presents Norfolk State University’s (amounts expressed in thousands) proportionate share of the VRS State Employee Retirement Plan net pension liability using the discount rate of 7.00%, as well as what the University’s proportionate share of the net pension liability would be if it were calculated using a discount rate that is one percentage point lower (6.00%) or one percentage point higher (8.00%) than the current rate:
1.00% Decrease Current Discount 1.00% Increase
(6.00%) Rate (7.00%) (8.00%)Norfolk State University proportionate share of the VRS State Employee Retirement Plan Net Pension Liability $ 33,435 $ 80,271 $ 54,796
The following presents Norfolk State University’s (amounts expressed in thousands) proportionate share of the VaLORS Retirement Plan net pension liability using the discount rate of 7.00%, as well as what the University’s proportionate share of the net pension liability would be if it were calculated using a discount rate that is one percentage point lower (6.00%) or one percentage point higher (8.00%) than the current rate:
1.00% Decrease Current Discount 1.00% Increase
(6.00%) Rate (7.00%) (8.00%)
Norfolk State University proportionate share of the VaLORS VaLORS Retirement Plan Net Pension Liability $ 1,260 $ 2,463 $ 1,802
Pension Plan Fiduciary Net Position
Detailed information about the VRS State Employee Retirement Plan’s Fiduciary Net Position or the VaLORS Retirement Plan’s Fiduciary Net Position is available in the separately issued VRS 2014 Comprehensive Annual Financial Report (CAFR). A copy of the 2014 VRS CAFR may be downloaded from the VRS website at http://www.varetire.org/Pdf/Publications/2014-annual-report.pdf, or by writing to the System’s Chief Financial Officer at P.O. Box 2500, Richmond, VA, 23218-2500.

NORFOLK STATE UNIVERSITY NOTES TO THE FINANCIAL STATEMENTS JUNE 30, 2015
49
Note 11—RETIREMENT PLANS (CONTINUED) Optional Retirement Plans The Commonwealth’s colleges and universities participate in the retirement plans administered by VRS. In addition, full-time faculty and certain administrative staff of the Commonwealth’s colleges and universities may participate in optional retirement plans as authorized by the Code of Virginia rather than the VRS retirement plans. These optional retirement plans are defined contributions plans offered through Teachers Insurance and Annuity Association – college Retirement Equities Fund (TIAA-CREF), and Fidelity Investments Tax-Exempt Services Company. There are two defined contributions plans. Plan 1 is for employees hired prior to July 1, 2010, and retirement benefits received are based upon the employer’s 10.4 percent contributions, plus net investment gains. Plan 2 is for employees hired on or after July 1, 2010, and retirement benefits received are based upon the employer’s 8.5 percent not to exceed 8.9 percent contribution and the employee’s 5.0 percent contribution, plus net investment gains. For Plan 2, the employer contributions for fiscal year 2015 were 8.5 percent. Vesting is full and immediate for both employer and employee contributions. For fiscal year 2015, total pension expense recognized was $1,329,510. For fiscal year 2015, contributions were calculated using the base salary amount of $13,557,981. Deferred Compensation Plan Most employees of the Commonwealth’s colleges and universities may participate in the Commonwealth’s deferred compensation plan in accordance with Internal Revenue code Section 457(b) and/or the institution’s deferred compensation plan in accordance with Internal Revenue code Sections 403(b). Under either plan, the institution’s cash match under the Internal Revenue code Sections 401(a) during fiscal year 2015 was a maximum match up to $20 per pay period or $40 per month. This employer match is for either plan but not both plans. Employer contributions under these plans were approximately $194,837 for fiscal year 2015.
Note 12—POSTEMPLOYMENT BENEFITS
The Commonwealth participates in the VRS-administered statewide group life insurance program, which provides postemployment life insurance benefits to eligible retired and terminated employees. The Commonwealth also provides health care credits against the monthly health insurance premiums of its retirees who have at least 15 years of state service and participate in the state’s health plan. Information related to these plans is available at the statewide level in the Commonwealth’s Comprehensive Annual Financial Report.
NORFOLK STATE UNIVERSITY NOTES TO THE FINANCIAL STATEMENTS JUNE 30, 2015
50
Note 13—CONTINGENCIES
Grants and Contracts
The University has received grants for specific purposes that are subject to review and audit by the grantor agencies. Claims against these resources are generally conditional upon compliance with the terms and conditions of grant agreements and applicable federal regulations, including the expenditures of resources for allowable purposes. Any disallowance resulting from a federal audit may become a liability of the University.
In addition, the University is required to comply with the various federal regulations issued by the Office of Management and Budget. Failure to comply with certain requirements of these regulations may result in questions concerning the allowability of related direct and indirect charges pursuant to such agreements. As of June 30, 2015, the University estimates that no material liabilities will result from such audits or questions.
Litigation
The University has been named a defendant in a number of grievances and lawsuits. The final outcome of these grievances and lawsuits cannot be determined at this time. However, management is of the opinion that any ultimate liability to which the University may be exposed will not have a material effect upon the University’s financial position.
Note 14—RISK MANAGEMENT AND EMPLOYEE HEALTH CARE PLANS
The University is exposed to various risks of loss related to torts; theft of, damage to, and destruction of assets; errors and omissions; non-performance of duty; injuries to employees; and natural disasters. The University participates in insurance plans maintained by the Commonwealth of Virginia. The state employee health care and worker’s compensation plans are administered by the Department of Human Resource Management and the risk management insurance plans are administered by the Department of Treasury, Division of Risk Management. Risk management insurance includes property, general liability, medical malpractice, faithful performance of duty bond, automobile, and air and watercraft plans. The University pays premiums to each of these Departments for its insurance coverage. Information relating to the Commonwealth’s insurance plans is available at the statewide level in the Commonwealth’s Comprehensive Annual Financial Report.

NORFOLK STATE UNIVERSITY NOTES TO THE FINANCIAL STATEMENTS JUNE 30, 2015
51
Note 15—COMPONENT UNITS
NSU Foundation Inc. as of
December 31, 2014
The Athletics Foundation of Norfolk State
University, Inc. as of June 30,
2015
University Research and
Innovation Foundation and Affiliates as of June 30, 2015 Total
Current assets:
Cash and cash equivalents 620,471$ 92,469$ 971,769$ 1,684,709$
Restricted cash and cash equivalents - - 504,395 504,395
Short-term investments - 103,790 - 103,790
Contributions receivable, net 210,560 4,560 62,505 277,625
Prepaid expenses - - 91,690 91,690
Other assets 211,674 - 1,265,634 1,477,308
Total current assets 1,042,705 200,819 2,895,993 4,139,517
Restricted cash and cash equivalents - - 3,010,158 3,010,158
Investments 27,887,012 - - 27,887,012
Contributions receivable, net 262,750 - - 262,750
Nondepreciable capital assets 24,310 - 546,074 570,384
Depreciable capital assets, net 239,871 66,853 22,149,123 22,455,847
Total noncurrent assets 28,413,943 66,853 25,705,355 54,186,151
Total Assets 29,456,648$ 267,672$ 28,601,348$ 58,325,668$
Accounts payable and accrued expenses 81,063 25,334 327,118 433,515$
Unearned revenue - 43,188 - 43,188
Long-term liabilities - current portion - - 400,000 400,000
Total current liabilities 81,063 68,522 727,118 876,703
Noncurrent liabilities 167,332 - 31,750,263 31,917,595
Total Liabilities 248,395 68,522 32,477,381 32,794,298
Net position:
Net investment in capital assets 264,181 66,853 (8,219,803) (7,888,769)
Restricted for:
Nonexpendable 8,912,412 50,000 - 8,962,412
Expendable 17,574,175 96,450 - 17,670,625
Unrestricted 2,457,485 (14,153) 4,343,770 6,787,102
Total Net Position 29,208,253$ 199,150$ (3,876,033)$ 25,531,370$

NORFOLK STATE UNIVERSITY NOTES TO THE FINANCIAL STATEMENTS JUNE 30, 2015
52
Note 15—COMPONENT UNITS (CONTINUED)
NSU Foundation Inc. as of
December 31, 2014
The Athletics Foundation of Norfolk State
University, Inc. as of June 30,
2015
Norfolk State University
Research and Innovation
Foundation and Affiliates as of June 30, 2015 Total
Operating revenues:
Other operating revenues -$ 282,027$ 4,602,135$ 4,884,162$
Total operating revenues - 282,027 4,602,135 4,884,162
Operating expenses:
Institutional support 627,194 364,675 2,924,805 3,916,674
Operation and maintenance - plant - 24,597 1,376,246 1,400,843
Depreciation expense 21,329 8,136 1,197,941 1,227,406
Student Aid 502,319 19,510 - 521,829
Total operating expenses 1,150,842 416,918 5,498,992 7,066,752
Operating loss (1,150,842) (134,891) (896,857) (2,182,590)
Non-operating revenues:
Investment income net of investment expense 215,141 3,856 - 218,997
Realized/unrealized gain on investments 453,368 (2,388) - 450,980
Unrealized gain on interest rate swap - - 974,242 974,242
Gifts 1,332,890 160,542 - 1,493,432
Other non-operating revenues - 37,240 - 37,240
Net non-operating revenues 2,001,399 199,250 974,242 3,174,891
Increase before other revenues, expenses, gains or losses 850,557 64,359 77,385 992,301 Contributions to permanently restricted endowments 275,895 - - 275,895
Net other revenues 275,895 - - 275,895
Increase in net position 1,126,452 64,359 77,385 1,268,196
Net position - beginning of the year 28,081,801 134,791 (3,953,418) 24,263,174
Net position - end of year 29,208,253$ 199,150$ (3,876,033)$ 25,531,370$

NORFOLK STATE UNIVERSITY NOTES TO THE FINANCIAL STATEMENTS JUNE 30, 2015
53
Note 16—RESTATEMENT OF NET POSITION
The following prior period adjustments were made to the beginning net position previously reported in the University’s financial statements at June 30, 2014.
Net position as originally stated at June 30, 2014 208,431,061$
Change in reporting for the implementation of GASB No. 68, Accounting andFinancial Reporting for Pensions and GASB No. 71, Pension Transition forContributions Made Subsequent to the Measurement Date:
Net pension liability (measurement date) (66,509,000)
Deferred outflows - University's contributions made during fiscal year 2014 3,450,591
Total prior period adjustment (63,058,409)
Net position restated at June 30, 2014 145,372,652$

NORFOLK STATE UNIVERSITY REQUIRED SUPPLEMENTARY INFORMATION (RSI) JUNE 30, 2015
54
Schedule of Norfolk State University's (NSU) Share of Net Pension LiabilityVRS State Employee Retirement PlanFor the Year Ended June 30, 2015 *
2015NSU's Proportion of the Net Pension Liability (Asset) 0.98%
NSU's Proportionate Share of the Net Pension Liability (Asset) $54,796,000
NSU's Covered-Employee Payroll $38,194,169
NSU's Proportionate Share of the Net Pension Liability (Asset) as a Percentage of its Covered-Employee Payroll 143.47%
Plan Fiduciary Net Position as a Percentage of the Total Pension Liability
Schedule is intended to show information for 10 years. Since 2015 is the firstyear for this presentation, no other data is available. However, additional yearswill be included as they become available.
* The amounts presented have a measurement date of the previous fiscal year end.
74.28%

NORFOLK STATE UNIVERSITY REQUIRED SUPPLEMENTARY INFORMATION (RSI) JUNE 30, 2015
55
Schedule of Norfolk State University's (NSU) Share of Net Pension LiabilityVaLORS Retirement PlanFor the Year Ended June 30, 2015 *
2015NSU's Proportion of the Net Pension Liability (Asset)
NSU's Proportionate Share of the Net Pension Liability (Asset) $1,802,000
NSU's Covered-Employee Payroll $1,165,478
NSU's Proportionate Share of the Net Pension Liability (Asset) as a Percentage of its Covered-Employee Payroll 154.61%
Plan Fiduciary Net Position as a Percentage of the Total Pension Liability
Schedule is intended to show information for 10 years. Since 2015 is the firstyear for this presentation, no other data is available. However, additional yearswill be included as they become available.
* The amounts presented have a measurement date of the previous fiscal year end.
0.27%
63.05%

NORFOLK STATE UNIVERSITY REQUIRED SUPPLEMENTARY INFORMATION (RSI) JUNE 30, 2015
56
Schedule of Employer ContributionsFor the Year Ended June 30, 2015
Contributions in Contributions
Relation to Employer's as a % ofContractually Contractually Contribution Covered Covered
Required Required Deficiency Employee EmployeePlan Contribution Contribution (Excess) Payroll Payroll
State Employee $4,405,042 $4,405,042 $0 36,347,040 12%VaLORS Employee $170,613 $170,613 $0 1,300,252 13%
Schedule is intended to show information for 10 years. Since 2015 is the first year for thispresentation, no other data is available. However, additional years will be included asthey become available.

NORFOLK STATE UNIVERSITY NOTES TO REQUIRED SUPPLEMENTAL INFORMATION
JUNE 30, 2015
57
Changes of benefit terms – There have been no significant changes to the System benefit provisions since the prior actuarial valuation. A hybrid plan with changes to the defined benefit plan structure and a new defined contribution component were adopted in 2012. The hybrid plan applies to most new employees hired on or after January 1, 2014 and not covered by enhanced hazardous duty benefits. The liabilities presented do not reflect the hybrid plan since it covers new members joining the System after the valuation date of June 30, 2013.and the impact on the liabilities as of the measurement date of June 30, 2014 are minimal. Changes of assumptions – The following changes in actuarial assumptions were made for the VRS - State Employee Retirement Plan effective June 30, 2013 based on the most recent experience study of the System for the four-year period ending June 30, 2012:
- Update mortality table - Decrease in rates of service retirement - Decrease in rates of withdrawals for less than 10 years of service - Decrease in rates of male disability retirement - Reduce rates of salary increase by 0.25% per year
The following changes in actuarial assumptions were made for the VaLORS Retirement Plan effective June 30, 2013 based on the most recent experience study of the System for the four-year period ending June 30, 2012:
- Update mortality table - Adjustments to the rates of service retirement - Decrease in rates of withdrawals for females under 10 years of service - Increase in rates of disability - Decrease service related disability rate from 60% to 50%

NORFOLK STATE UNIVERSITY HIGHLIGHTS FIVE YEARS IN REVIEW
58
FALL SEMESTER 2010-11 2011-12 2012-13 2013-14 2014-15
ENROLLMENT
Total 6,964 7,091 7,100 6,728 6,027
In-state 5,752 5,932 6,004 5,773 5,191
Out-of-state 1,212 1,159 1,096 955 836
FRESHMAN APPLICATIONS
Number of Applications Received 3,967 4,163 4,231 3,373 2,817
In-state 1,734 1,756 2,107 1,964 1,509
Out-of-state 2,233 2,407 2,124 1,409 1,308
Number of Applications Accepted 2,521 2,811 2,847 2,192 1,850
In-state 1,115 1,164 1,446 1,312 1,007
Out-of-state 1,406 1,647 1,401 880 843
Number of Accepted Enrolled 942 923 1,088 818 572
In-state 710 728 899 686 440
Out-of-state 232 195 189 132 132
TRANSFER APPLICATIONS
Number of Applications Received 1,214 1,216 995 959 884
In-state 671 701 675 677 628
Out-of-state 543 515 320 282 256
Number of Applications Accepted 1,042 1,075 868 854 687
In-state 576 628 584 604 483
Out-of-state 466 447 284 250 204
Number of Accepted Enrolled 471 499 534 496 446
In-state 380 425 462 432 379
Out-of-state 91 74 72 64 67
GRADUATE APPLICATIONS
Number of Applications Received 433 409 335 344 293
In-state 257 227 222 250 211
Out-of-state 176 182 113 94 82
Number of Applications Accepted 346 302 247 261 239
In-state 218 175 167 187 176
Out-of-state 128 127 80 74 63
Number of Accepted Enrolled 225 216 187 175 183
In-state 193 170 150 138 154
Out-of-state 32 46 37 37 29
TUITION AND FEES
Undergraduate
In-state $6,327 $6,700 $6,860 $7,226 $7,552
Out-of-state $19,380 $20,343 $20,360 $20,696 $20,696
Graduate
In-state $8,577 $9,115 $9,388 $9,916 $8,692
Out-of-state $25,534 $26,809 $26,812 $27,268 $21,560
ROOM AND BOARD
Total Room and Board $7,622 $7,927 $8,130 $8,374 $8,658
Room rates $4,857 $5,051 $5,254 $5,412 $5,574
Board rates $2,765 $2,876 $2,876 $2,962 $3,050


62
NORFOLK STATE UNIVERSITY Norfolk, Virginia
BOARD OF VISITORS
Thomas N. Chewning, Rector Dr. Byron L. Cherry, SR., COL (Ret), Vice Rector
Lula B. Holland, COL (Ret), Secretary The Honorable Lamont Bagby
The Honorable Lloyd Banks, Jr.* Elwood B. Boone, III
Bryan D. Cuffee Dr. Deborah M. DiCroce
Larry A. Griffith Peter J. Kao Beth Murphy
Michael D. Rochelle, LTG (Ret) Dr. Melvin T. Stith
OFFICIALS
Eddie N. Moore, Jr., Interim President and CEO Dr. Sandra J. DeLoatch, Provost and Vice President for Academic Affairs
Gerald E. Hunter, Vice President for Finance and Administration Edward M. Willis, Vice President for Student Affairs
Dr. Deborah C. Fontaine, Interim Vice President for University Advancement Mona Adkins-Easley, Associate Vice President, Human Resources
Clementine S. Cone, Executive Assistant to the President for University Compliance Dr. Paula Gentius, Assistant to the President
Marty L. Miller, Athletics Director
Represents Board of Visitors and University Administrators as of June 30, 2015 *Vice Rector thru May 8, 2015
ACKNOWLEDGEMENTS
The preparation of this report has been accomplished by the efficient and dedicated services of the staff of the University Controller’s Office and various departments who have been assisted by the Auditor of Public Accounts. The contributions of all are invaluable and sincerely appreciated and clearly reflect the high standards which have been set by the University. The following Controller’s Office employees were instrumental in the preparation of this report:
It is also appropriate to thank the Interim President, and Members of the Board of Visitors for their interest and support in planning and conducting the financial affairs of the University.
Karla Amaya Gordon Karen Funk Nichole Horton Monica Morris Candace Thompson
Bobbie Berger Sarah Green Sonya Jackson Elena Ottey Delores White
Rita Bowen Sabrina Gregory Karma Johnson-Freeman Sandra Riggs Tanya White
Deloris Britton Debra Haper-Moyler Danielle Jones Katina Roberts Shaquey Wragg
Audra Bunch Denise Henderson Tanisha Jones deLisa Roberts-Jenkins
Geral Collins Beverly Herndon Monsurat Kadri Comarth Saunders
Regina Ferandes Michelle Holland-Frazier Stephanie Logan Joy Scott
Sherry Flegler Jennifer Holmes Jackie Matthews Renee Stewart
Betty Fulgham Charolette Horsey Janice Moore Zaheer Tariq