Embed Size (px)
Citation preview

2014-2015 | Fact Book

ACCREDITATION AND APPROVALS
SACS Accreditation
State Approvals
The Texas Workforce Commission has approved programs for veteran education benefits.
The Texas Higher Education Coordinating Board has approved college/university parallel offerings and programs in technical education.
Houston Community College is accredited by the Southern Association of Colleges and Schools Commission on Colleges to award associate degrees. Contact the Commission of Colleges at 1866 Southern Lane, Decatur, Georgia 30033‐4097 or call 404‐679‐4500 for questions about the Accreditation of Houston Community College.
Houston Community College 2014‐2015 Fact Book i
PREFACE
The Houston Community College (HCC) 2014‐2015 Fact Book provides statistical information about the college district. Data presented in this publication may differ slightly from statistics found in other reports. Such variances may result from differences methodology including the source of information used, the reporting period covered (semester, academic year), or the student base included (semester credit, continuing education, adult education and literacy). The source of the information in each table and graph is cited, along with the date generated, the reporting period, and the students included.
The 2014‐2015 Fact Book is available online at http://www.hccs.edu/oir.
Houston Community College 2014‐2015 Fact Book ii
TABLE OF CONTENTS
GENERAL INFORMATION 1
STUDENT PROFILE 7
INSTRUCTIONAL PROGRAMS 20
ACADEMIC ACHIEVEMENT 34
PERSONNEL PROFILE 43
FINANCIAL INFORMATION 50
Houston Community College 2014‐2015 Fact Book iii
History of HCC
GEN
ERAL
INFO
RMAT
ION
The Houston Community College District was created under the governance of the Houston Independent School District (HISD) as the result of a public referendum on May 18, 1971. In August of that year, more than 5,700 students enrolled in workforce education courses held at the Houston Technical Institute (housed in what was then HISD’s San Jacinto High School). In the following semester, academic transfer classes were added and taught at six HISD locations.
Since its opening in 1971, more than 2 million students have improved their lives through education and training obtained from Houston Community College. An open‐admission public institution, HCC awards associate degrees and certificates in academic studies and career and technology programs. HCC is committed to meeting the needs of its diverse communities, providing academic courses for transfer to four‐year institutions, terminal degrees and certificates in more than 70 fields of work; as well as, continuing education and corporate training, lifelong learning and enrichment programs, and adult education.
By 1977, HCC had an enrollment of more than 28,000 students and was accredited by the Southern Association of Colleges and Schools (SACS). In 1989, HCC separated from HISD, establishing its own Board of Trustees and taxing authority. HCC restructured in 1991, creating five regional colleges, as well as the College Without Walls, and selected presidents for each. The president of HCC then became the HCC System Chancellor. The Coleman College for Health Sciences replaced the College Without Walls in 2004. Dr. Cesar Maldonado became the ninth Houston Community College Chancellor in May of 2014. By Fall 2014, HCC had over 70,000 students enrolled, and consisted of 22 campuses with a service area of 631.3 square miles.
Houston Community College 2014‐2015 Fact Book Page 1
GENERAL INFORMATION
MISSION, GUIDING PRINCIPLES, VISION, & STRATEDIC INITIATIVES |2012 ‐ 2015 3
BOARD OF TRUSTEESELECTED BOARD OF TRUSTEES 4BOARD MEMBER DISTRICTS MAP 4
SERVICE AREA SERVICE AREA DEMOGRAPHICS 5SERVICE AREA MAP ‐ BY COLLEGE 6
Houston Community College 2014‐2015 Fact Book Page 2
MISSION, GUIDING PRINCIPLES, VISION, & STRATEDIC INITIATIVES |2012 ‐ 2015
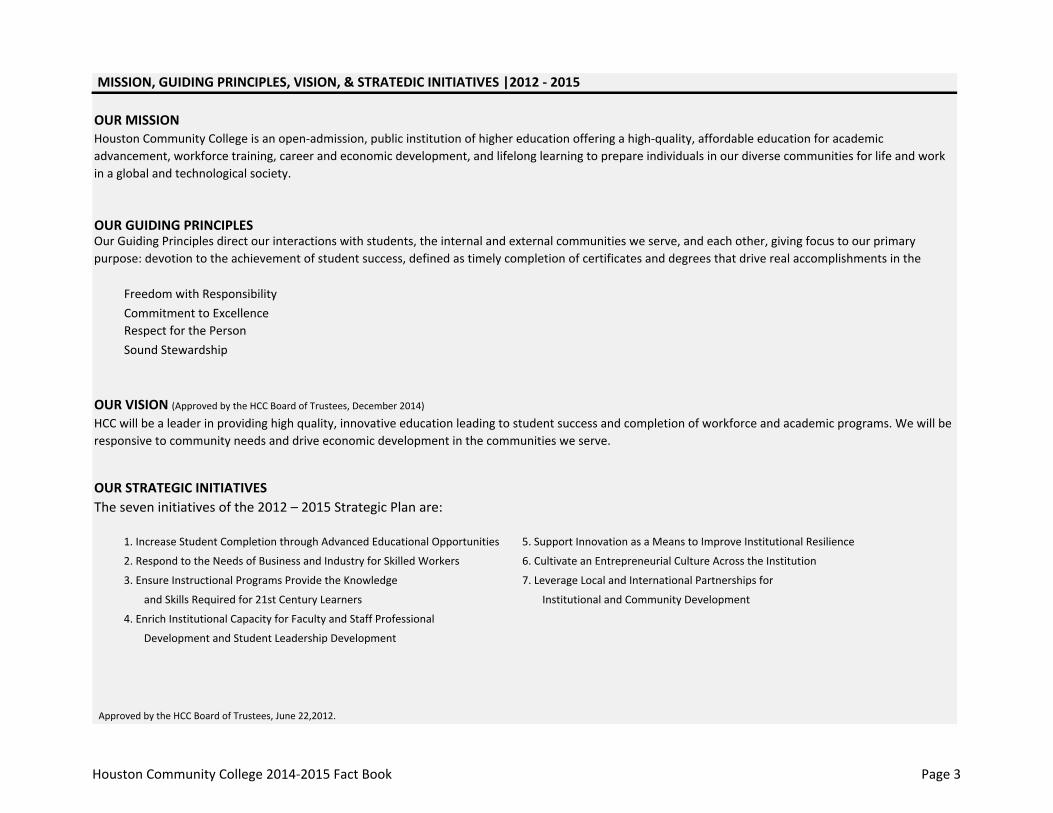
OUR MISSION
OUR GUIDING PRINCIPLES
Freedom with ResponsibilityCommitment to ExcellenceRespect for the PersonSound Stewardship
OUR VISION (Approved by the HCC Board of Trustees, December 2014)
OUR STRATEGIC INITIATIVESThe seven initiatives of the 2012 – 2015 Strategic Plan are:
1. Increase Student Completion through Advanced Educational Opportunities 5. Support Innovation as a Means to Improve Institutional Resilience
2. Respond to the Needs of Business and Industry for Skilled Workers 6. Cultivate an Entrepreneurial Culture Across the Institution
3. Ensure Instructional Programs Provide the Knowledge 7. Leverage Local and International Partnerships for
and Skills Required for 21st Century Learners Institutional and Community Development
4. Enrich Institutional Capacity for Faculty and Staff Professional
Development and Student Leadership Development
Approved by the HCC Board of Trustees, June 22,2012.
HCC will be a leader in providing high quality, innovative education leading to student success and completion of workforce and academic programs. We will be responsive to community needs and drive economic development in the communities we serve.
Houston Community College is an open‐admission, public institution of higher education offering a high‐quality, affordable education for academic advancement, workforce training, career and economic development, and lifelong learning to prepare individuals in our diverse communities for life and work in a global and technological society.
Our Guiding Principles direct our interactions with students, the internal and external communities we serve, and each other, giving focus to our primary purpose: devotion to the achievement of student success, defined as timely completion of certificates and degrees that drive real accomplishments in the
Houston Community College 2014‐2015 Fact Book Page 3
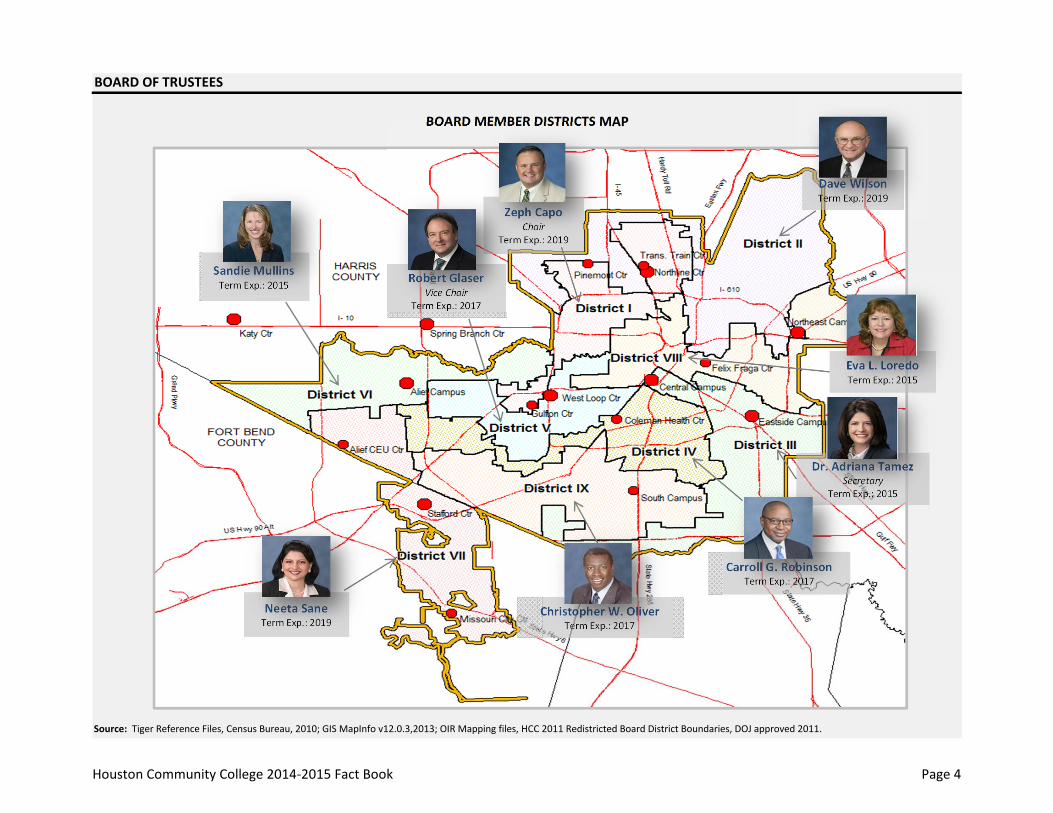
BOARD OF TRUSTEES
Source: Tiger Reference Files, Census Bureau, 2010; GIS MapInfo v12.0.3,2013; OIR Mapping files, HCC 2011 Redistricted Board District Boundaries, DOJ approved 2011.
BOARD MEMBER DISTRICTS MAP
Zeph CapoChair
Term Exp.: 2019
Dave WilsonTerm Exp.: 2019
Dr. Adriana TamezSecretary
Term Exp.: 2015
Carroll G. RobinsonTerm Exp.: 2017
Robert GlaserVice Chair
Term Exp.: 2017
Neeta SaneTerm Exp.: 2019
Sandie MullinsTerm Exp.: 2015
Christopher W. OliverTerm Exp.: 2017
Eva L. LoredoTerm Exp.: 2015
Houston Community College 2014‐2015 Fact Book Page 4
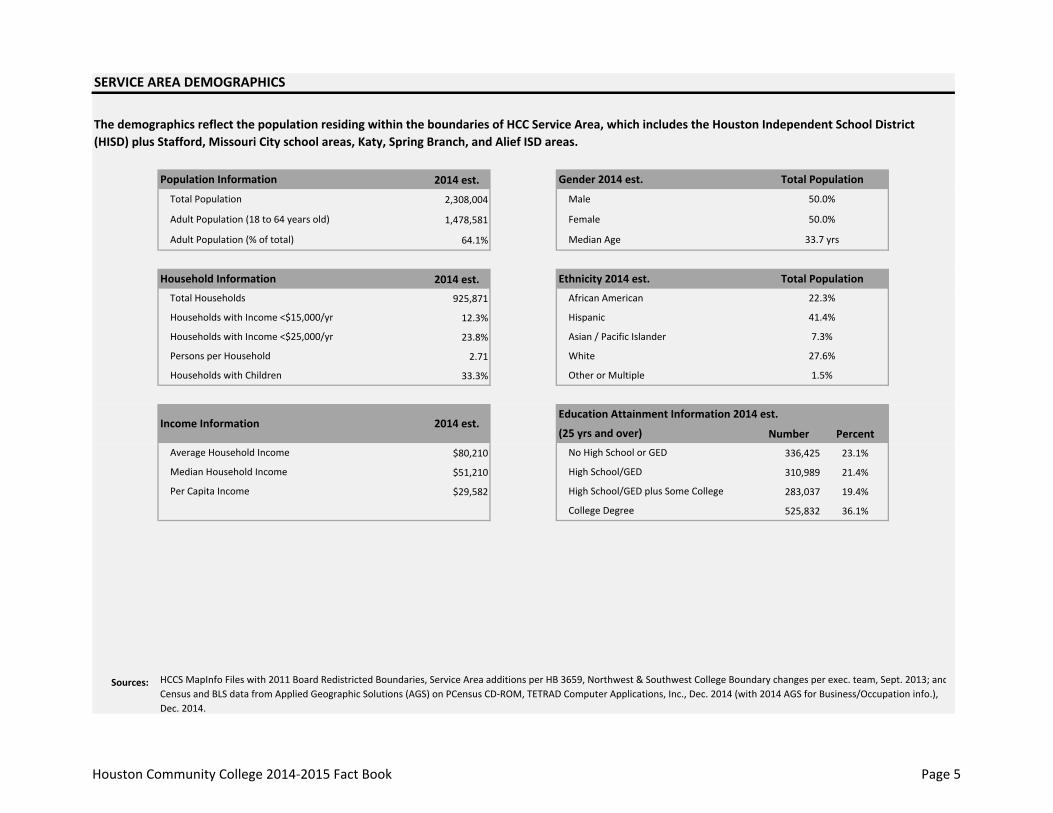
SERVICE AREA DEMOGRAPHICS
2014 est.
2,308,004
1,478,581
64.1%
2014 est.
925,871
12.3%
23.8%
2.71
33.3%
Number Percent
$80,210 336,425 23.1%
$51,210 310,989 21.4%
$29,582 283,037 19.4%
525,832 36.1%
Sources:
The demographics reflect the population residing within the boundaries of HCC Service Area, which includes the Houston Independent School District (HISD) plus Stafford, Missouri City school areas, Katy, Spring Branch, and Alief ISD areas.
Gender 2014 est.
Male
Female
Median Age
Population Information
Total Population
Adult Population (18 to 64 years old)
Adult Population (% of total)
Total Population
50.0%
50.0%
33.7 yrs
Other or Multiple
Total Population
22.3%
41.4%
7.3%
27.6%
1.5%
Ethnicity 2014 est.
African American
Hispanic
Asian / Pacific Islander
White
Households with Children
Average Household Income
Household Information
Total Households
Households with Income <$15,000/yr
Households with Income <$25,000/yr
Persons per Household
HCCS MapInfo Files with 2011 Board Redistricted Boundaries, Service Area additions per HB 3659, Northwest & Southwest College Boundary changes per exec. team, Sept. 2013; andCensus and BLS data from Applied Geographic Solutions (AGS) on PCensus CD‐ROM, TETRAD Computer Applications, Inc., Dec. 2014 (with 2014 AGS for Business/Occupation info.), Dec. 2014.
Median Household Income
Per Capita Income
Education Attainment Information 2014 est.
(25 yrs and over)
No High School or GED
High School/GED
High School/GED plus Some College
College Degree
Income Information 2014 est.
Houston Community College 2014‐2015 Fact Book Page 5
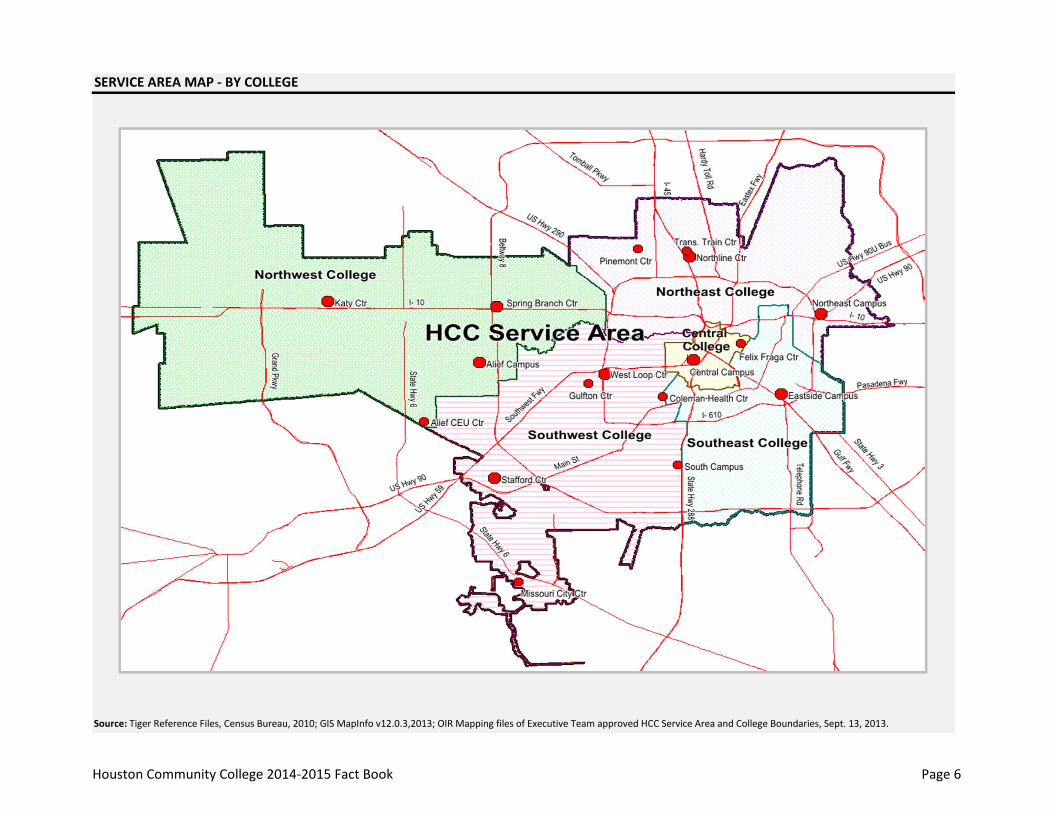
SERVICE AREA MAP ‐ BY COLLEGE
Source: Tiger Reference Files, Census Bureau, 2010; GIS MapInfo v12.0.3,2013; OIR Mapping files of Executive Team approved HCC Service Area and College Boundaries, Sept. 13, 2013.
Houston Community College 2014‐2015 Fact Book Page 6
STUDEN
T PR
OFILE
Houston Community College 2014‐2015 Fact Book Page 7
STUDENT PROFILE
TOTAL STUDENT ENROLLMENT—FALL 2010‐FALL 2014 9
UNDUPLICATED ENROLLMENT—2010‐2014UNDUPLICATED ENROLLMENT TREND ‐‐ ALL CAREER TYPES (ANNUAL) 10UNDUPLICATED ENROLLMENT TREND ‐‐ SCH & CEU (ANNUAL) 10
FULL‐TIME STUDENT EQUIVALENT ‐ IPEDS—FALL2010‐2014 11
SEMESTER CREDIT HOUR STUDENT ENROLLMENT—FALL 2014GENDER AND ETHNICITY 12GENDER AND ETHNICITY TRENDS 13AGE GROUP 14
SEMESTER CREDIT HOUR STUDENTS RESIDENCY—FALL 2010‐FALL 2014 15
SEMESTER CREDIT HOUR ENROLLMENT BY 18 HIGHEST ZIP CODES—FALL 2010‐FALL 2014 16
INTERNATIONAL STUDENT POPULATIONSALL INTERNATIONAL STUDENTS ENROLLMENT BY VISA TYPE —FALL 2012‐FALL 2014 17INTERNATIONAL STUDENT POPULATIONS BY TOP 40 COUNTRIES —FALL 2013‐FALL 2014 18
DAY, EVENING, AND WEEKEND COURSE ENROLLMENT—FALL 2010‐FALL 2014 19
Houston Community College 2014‐2015 Fact Book Page 8
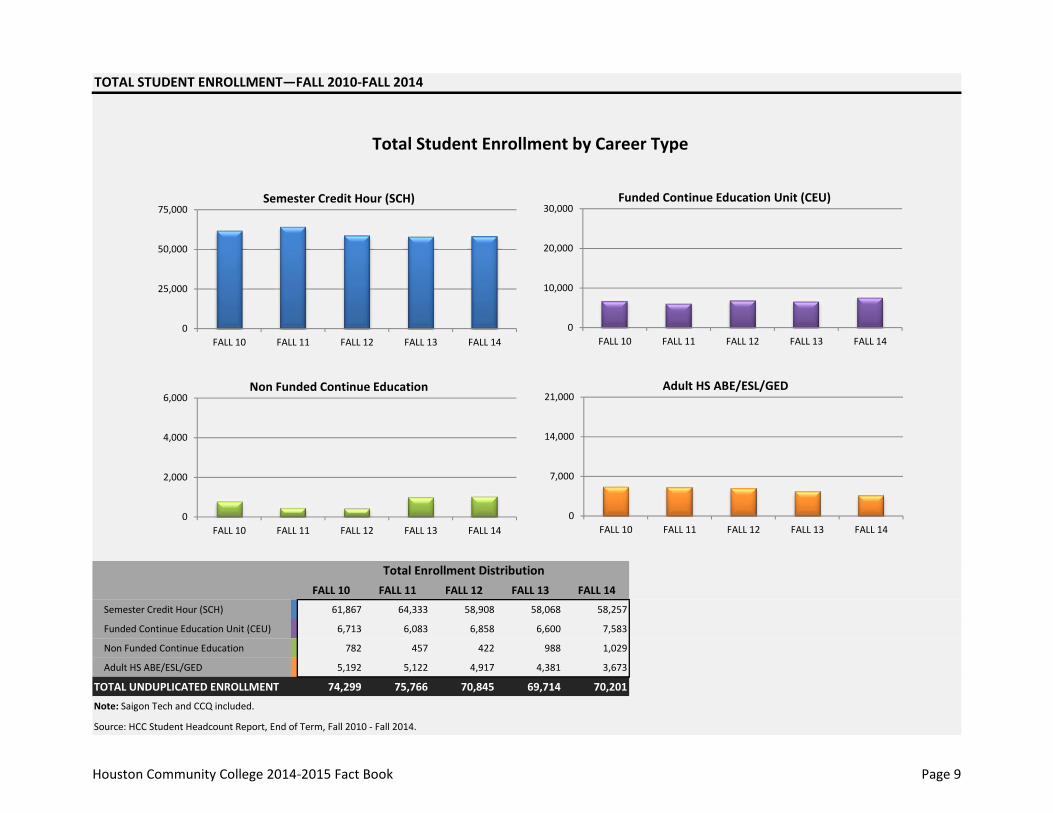
TOTAL STUDENT ENROLLMENT—FALL 2010‐FALL 2014
FALL 10 FALL 11 FALL 12 FALL 13 FALL 14
Semester Credit Hour (SCH) 61,867 64,333 58,908 58,068 58,257
Funded Continue Education Unit (CEU) 6,713 6,083 6,858 6,600 7,583
Non Funded Continue Education 782 457 422 988 1,029
Adult HS ABE/ESL/GED 5,192 5,122 4,917 4,381 3,673
TOTAL UNDUPLICATED ENROLLMENT 74,299 75,766 70,845 69,714 70,201
Note: Saigon Tech and CCQ included.
Source: HCC Student Headcount Report, End of Term, Fall 2010 ‐ Fall 2014.
Total Student Enrollment by Career Type
Total Enrollment Distribution
0
25,000
50,000
75,000
FALL 10 FALL 11 FALL 12 FALL 13 FALL 14
Semester Credit Hour (SCH)
0
10,000
20,000
30,000
FALL 10 FALL 11 FALL 12 FALL 13 FALL 14
Funded Continue Education Unit (CEU)
0
2,000
4,000
6,000
FALL 10 FALL 11 FALL 12 FALL 13 FALL 14
Non Funded Continue Education
0
7,000
14,000
21,000
FALL 10 FALL 11 FALL 12 FALL 13 FALL 14
Adult HS ABE/ESL/GED
Houston Community College 2014‐2015 Fact Book Page 9
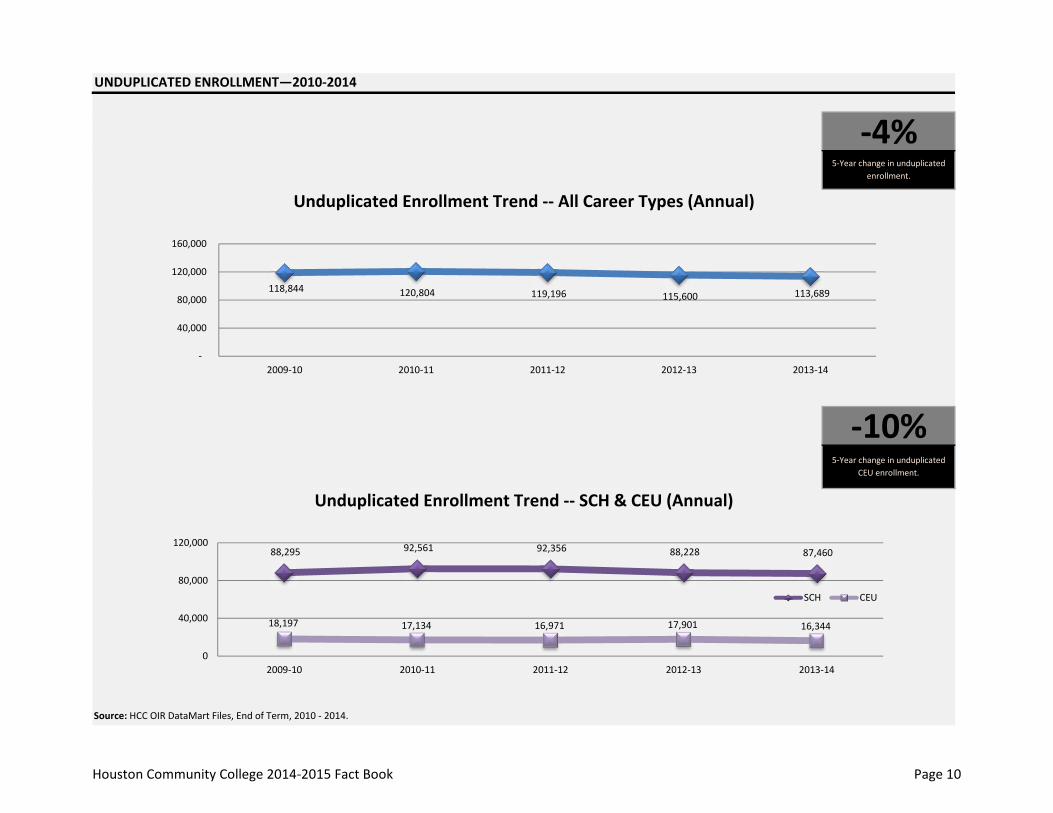
UNDUPLICATED ENROLLMENT—2010‐2014
Source: HCC OIR DataMart Files, End of Term, 2010 ‐ 2014.
Unduplicated Enrollment Trend ‐‐ SCH & CEU (Annual)
‐4%5‐Year change in unduplicated
enrollment.
Unduplicated Enrollment Trend ‐‐ All Career Types (Annual)
‐10%5‐Year change in unduplicated
CEU enrollment.
118,844 120,804 119,196 115,600 113,689
‐
40,000
80,000
120,000
160,000
2009‐10 2010‐11 2011‐12 2012‐13 2013‐14
88,295 92,561 92,356 88,228 87,460
18,197 17,134 16,971 17,901 16,344
0
40,000
80,000
120,000
2009‐10 2010‐11 2011‐12 2012‐13 2013‐14
SCH CEU
Houston Community College 2014‐2015 Fact Book Page 10
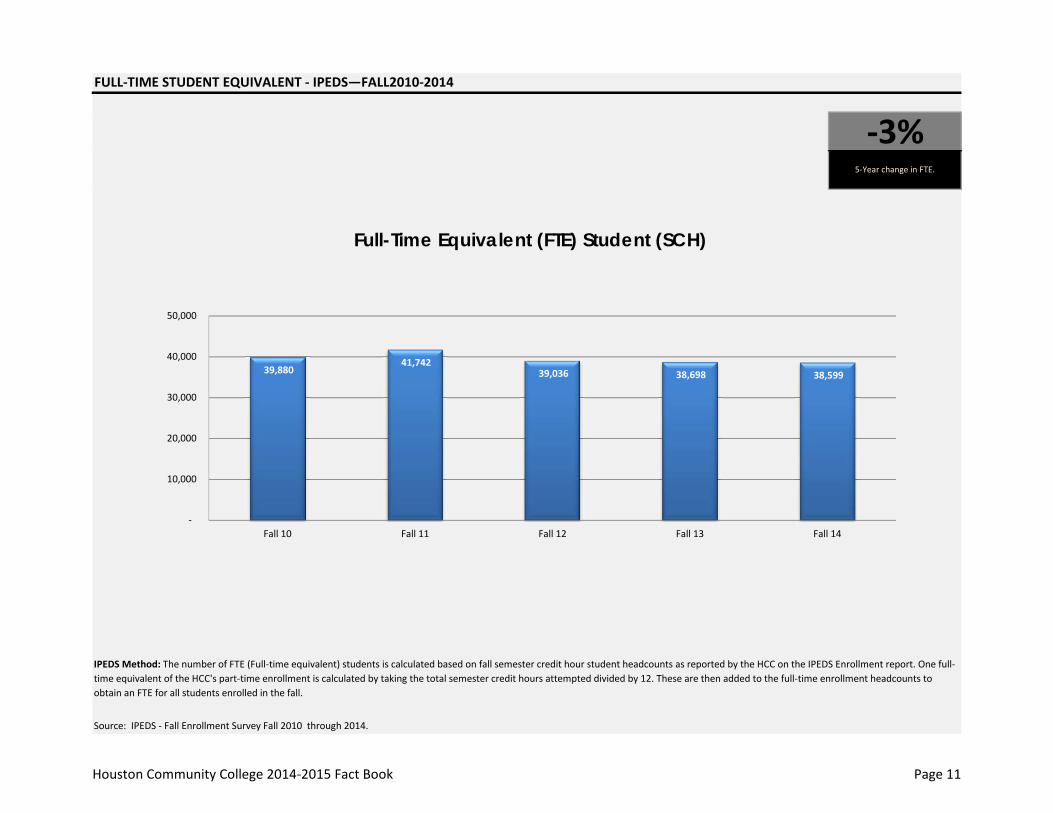
FULL‐TIME STUDENT EQUIVALENT ‐ IPEDS—FALL2010‐2014
Source: IPEDS ‐ Fall Enrollment Survey Fall 2010 through 2014.
‐3%5‐Year change in FTE.
Full-Time Equivalent (FTE) Student (SCH)
IPEDS Method: The number of FTE (Full‐time equivalent) students is calculated based on fall semester credit hour student headcounts as reported by the HCC on the IPEDS Enrollment report. One full‐time equivalent of the HCC's part‐time enrollment is calculated by taking the total semester credit hours attempted divided by 12. These are then added to the full‐time enrollment headcounts to obtain an FTE for all students enrolled in the fall.
39,880 41,742
39,036 38,698 38,599
‐
10,000
20,000
30,000
40,000
50,000
Fall 10 Fall 11 Fall 12 Fall 13 Fall 14
Houston Community College 2014‐2015 Fact Book Page 11
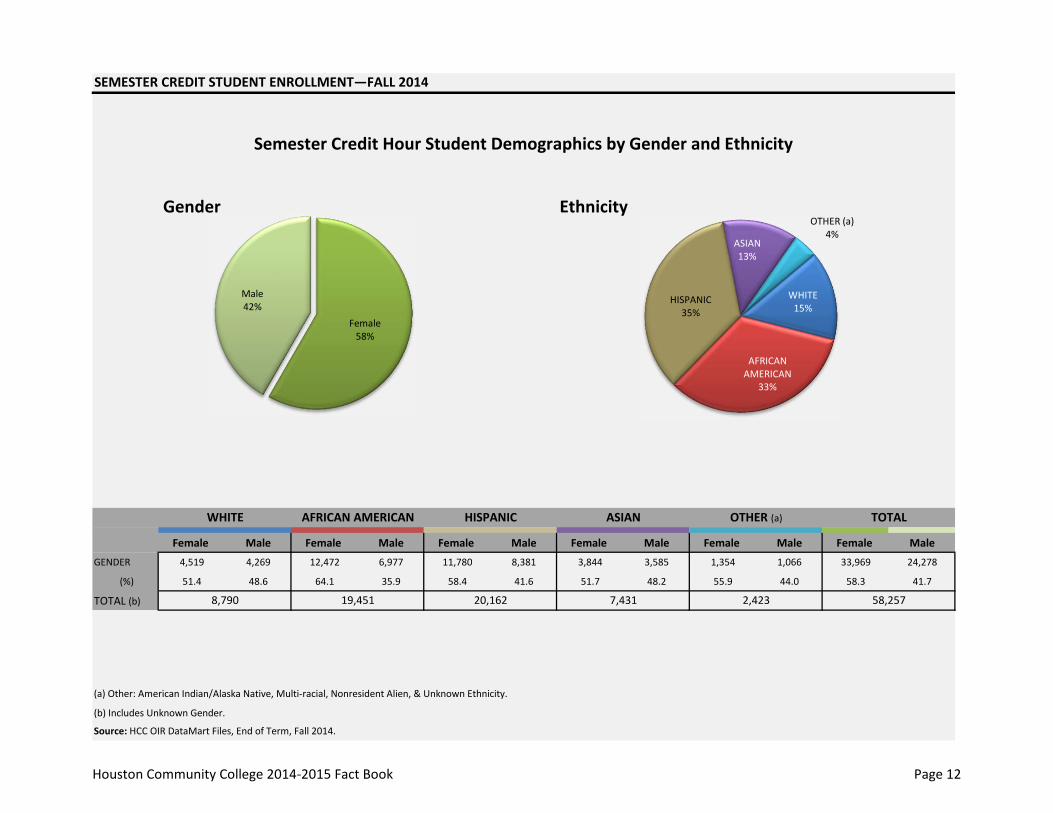
SEMESTER CREDIT STUDENT ENROLLMENT—FALL 2014
Gender Ethnicity
Female Male Female Male Female Male Female Male Female Male Female Male
GENDER 4,519 4,269 12,472 6,977 11,780 8,381 3,844 3,585 1,354 1,066 33,969 24,278
(%) 51.4 48.6 64.1 35.9 58.4 41.6 51.7 48.2 55.9 44.0 58.3 41.7
TOTAL (b)
(a) Other: American Indian/Alaska Native, Multi‐racial, Nonresident Alien, & Unknown Ethnicity.
(b) Includes Unknown Gender.
Source: HCC OIR DataMart Files, End of Term, Fall 2014.
Semester Credit Hour Student Demographics by Gender and Ethnicity
58,257
WHITE AFRICAN AMERICAN HISPANIC ASIAN OTHER (a) TOTAL
8,790 19,451 20,162 7,431 2,423
Female 58%
Male42%
WHITE15%
AFRICAN AMERICAN
33%
HISPANIC35%
ASIAN13%
OTHER (a)4%
Houston Community College 2014‐2015 Fact Book Page 12

TOTAL STUDENT ENROLLMENT—FALL 2010‐FALL 2014
FALL 10 FALL 11 FALL 12 FALL 13 FALL 14
WHITE 11,310 11,143 9,780 9,279 8,790
AFRICAN AMERICAN 18,782 21,219 19,114 18,996 19,451
HISPANIC 20,624 20,868 19,687 19,976 20,162
ASIAN 8,581 8,663 7,714 7,587 7,431
OTHER (a) 1,877 1,909 2,292 2,230 2,423
TOTAL 61,174 63,802 58,587 58,068 58,257
(1) Other: American Indian/Alaska Native, Nonresident Alien, & Unknown Ethnicity.Source: HCC OIR DataMart Files, End of Term, Fall 2010 ‐ 2014.
‐22%5‐Year change in White unduplicated enrollment.
Semester Credit Student Demographics by Gender
Semester Credit Hour Student Demographics by Ethnicity
‐
11,000
22,000
33,000
44,000
Fall10 Fall11 Fall12 Fall13 Fall14
Female Male
0
6,250
12,500
18,750
25,000
FALL 10 FALL 11 FALL 12 FALL 13 FALL 14
WHITE
12,500
18,750
25,000
FALL 10 FALL 11 FALL 12 FALL 13 FALL 14
AFRICAN AMERICAN
0
6,250
12,500
18,750
25,000
FALL 10 FALL 11 FALL 12 FALL 13 FALL 14
HISPANIC
0
6,250
12,500
18,750
25,000
FALL 10 FALL 11 FALL 12 FALL 13 FALL 14
ASIAN
Houston Community College 2014‐2015 Fact Book Page 13
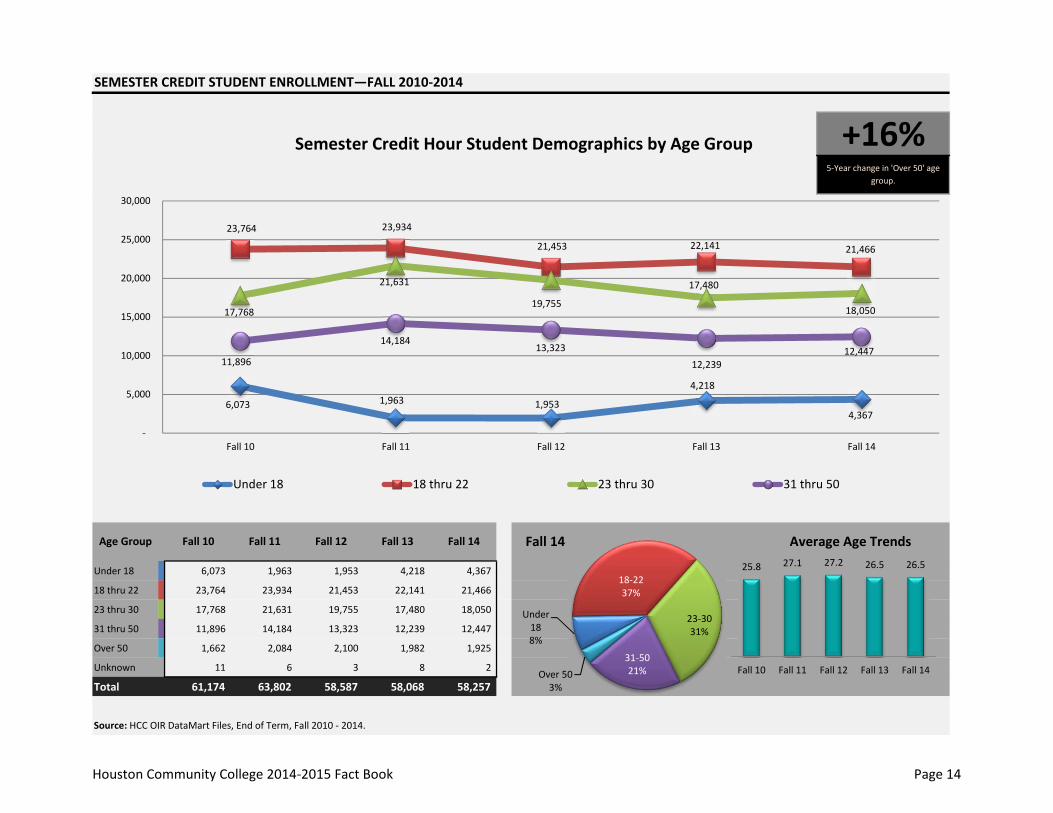
SEMESTER CREDIT STUDENT ENROLLMENT—FALL 2010‐2014
Under 18 6,073 1,963 1,953 4,218 4,367
18 thru 22 23,764 23,934 21,453 22,141 21,466
23 thru 30 17,768 21,631 19,755 17,480 18,050
31 thru 50 11,896 14,184 13,323 12,239 12,447
Over 50 1,662 2,084 2,100 1,982 1,925
Unknown 11 6 3 8 2
Total 61,174 63,802 58,587 58,068 58,257
Source: HCC OIR DataMart Files, End of Term, Fall 2010 ‐ 2014.
+16%5‐Year change in 'Over 50' age
group.
Semester Credit Hour Student Demographics by Age Group
Age Group Fall 10 Fall 11 Fall 12 Fall 13 Fall 14 Fall 14 Average Age Trends
6,073 1,963 1,953
4,218
4,367
23,764 23,934
21,453 22,141 21,466
17,768
21,631
19,755
17,480
18,050
11,896
14,184 13,323
12,239 12,447
‐
5,000
10,000
15,000
20,000
25,000
30,000
Fall 10 Fall 11 Fall 12 Fall 13 Fall 14
Under 18 18 thru 22 23 thru 30 31 thru 50
Under 188%
18‐2237%
23‐3031%
31‐5021%Over 50
3%
25.8 27.1 27.2 26.5 26.5
Fall 10 Fall 11 Fall 12 Fall 13 Fall 14
Houston Community College 2014‐2015 Fact Book Page 14
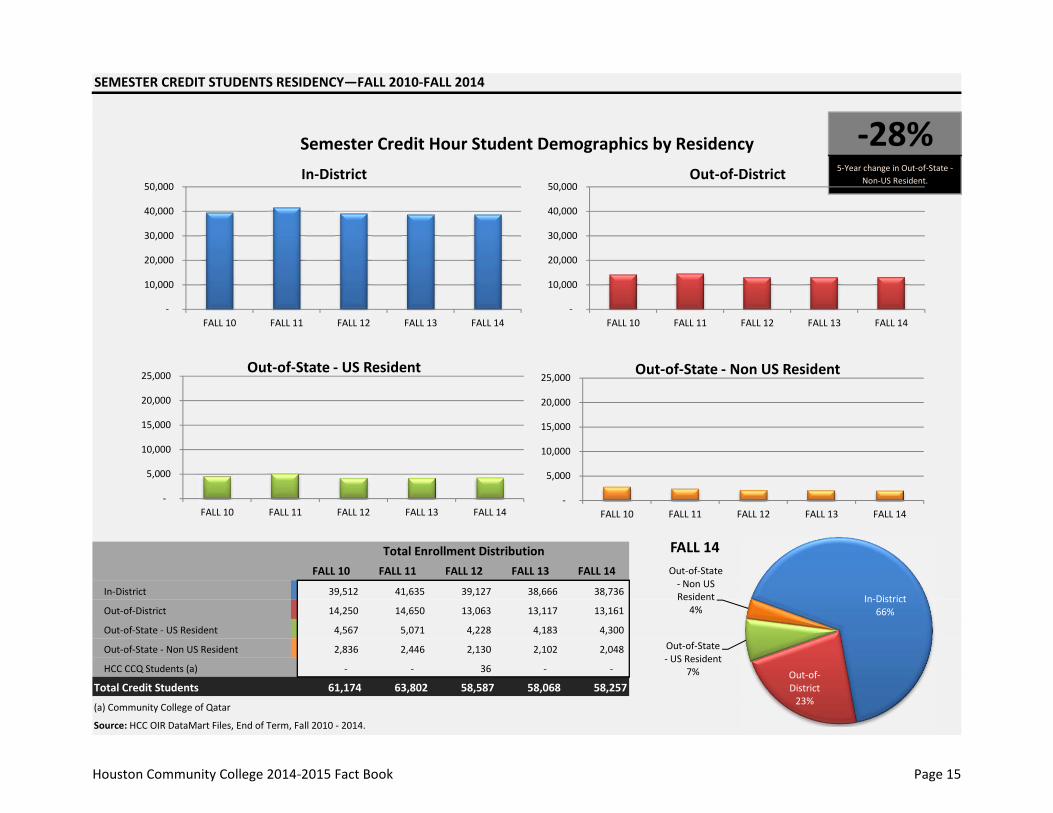
SEMESTER CREDIT STUDENTS RESIDENCY—FALL 2010‐FALL 2014
FALL 10 FALL 11 FALL 12 FALL 13 FALL 14
In‐District 39,512 41,635 39,127 38,666 38,736
Out‐of‐District 14,250 14,650 13,063 13,117 13,161
Out‐of‐State ‐ US Resident 4,567 5,071 4,228 4,183 4,300
Out‐of‐State ‐ Non US Resident 2,836 2,446 2,130 2,102 2,048
HCC CCQ Students (a) ‐ ‐ 36 ‐ ‐
Total Credit Students 61,174 63,802 58,587 58,068 58,257
(a) Community College of Qatar
Source: HCC OIR DataMart Files, End of Term, Fall 2010 ‐ 2014.
Total Enrollment Distribution
‐28%5‐Year change in Out‐of‐State ‐
Non‐US Resident.
Semester Credit Hour Student Demographics by Residency
In‐District66%
Out‐of‐District23%
Out‐of‐State ‐ US Resident
7%
Out‐of‐State ‐ Non US Resident
4%
FALL 14
‐
10,000
20,000
30,000
40,000
50,000
FALL 10 FALL 11 FALL 12 FALL 13 FALL 14
In‐District
‐
10,000
20,000
30,000
40,000
50,000
FALL 10 FALL 11 FALL 12 FALL 13 FALL 14
Out‐of‐District
‐
5,000
10,000
15,000
20,000
25,000
FALL 10 FALL 11 FALL 12 FALL 13 FALL 14
Out‐of‐State ‐ US Resident
‐
5,000
10,000
15,000
20,000
25,000
FALL 10 FALL 11 FALL 12 FALL 13 FALL 14
Out‐of‐State ‐ Non US Resident
Houston Community College 2014‐2015 Fact Book Page 15
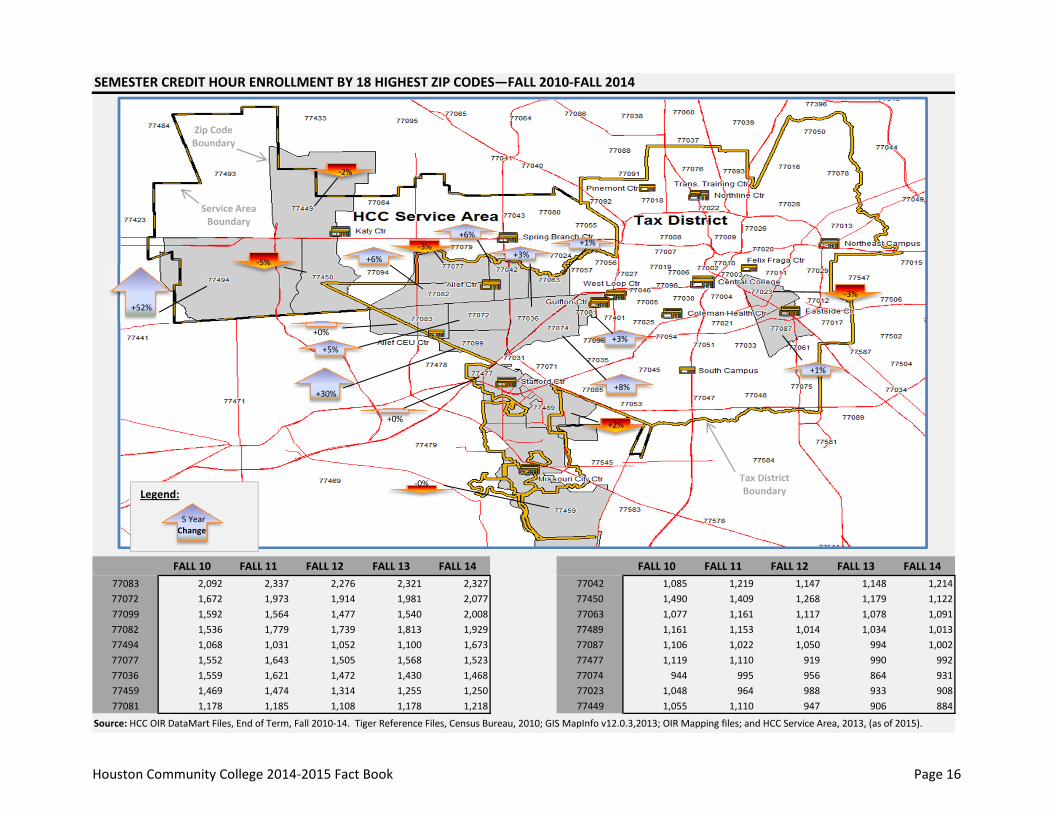
SEMESTER CREDIT HOUR ENROLLMENT BY 18 HIGHEST ZIP CODES—FALL 2010‐FALL 2014
FALL 10 FALL 11 FALL 12 FALL 13 FALL 14 FALL 10 FALL 11 FALL 12 FALL 13 FALL 1477083 2,092 2,337 2,276 2,321 2,327 77042 1,085 1,219 1,147 1,148 1,21477072 1,672 1,973 1,914 1,981 2,077 77450 1,490 1,409 1,268 1,179 1,12277099 1,592 1,564 1,477 1,540 2,008 77063 1,077 1,161 1,117 1,078 1,09177082 1,536 1,779 1,739 1,813 1,929 77489 1,161 1,153 1,014 1,034 1,01377494 1,068 1,031 1,052 1,100 1,673 77087 1,106 1,022 1,050 994 1,00277077 1,552 1,643 1,505 1,568 1,523 77477 1,119 1,110 919 990 99277036 1,559 1,621 1,472 1,430 1,468 77074 944 995 956 864 93177459 1,469 1,474 1,314 1,255 1,250 77023 1,048 964 988 933 90877081 1,178 1,185 1,108 1,178 1,218 77449 1,055 1,110 947 906 884
Source: HCC OIR DataMart Files, End of Term, Fall 2010‐14. Tiger Reference Files, Census Bureau, 2010; GIS MapInfo v12.0.3,2013; OIR Mapping files; and HCC Service Area, 2013, (as of 2015).
‐0%
‐3%
+1%
‐2%
‐5% +6%
+0%
‐3%
+0% +2%
+6%+1%
+5%+3%
+8%
+3%
Legend:
5 YearChange
Zip Code Boundary
Service Area Boundary
Tax District Boundary
+30%
+52%
Houston Community College 2014‐2015 Fact Book Page 16
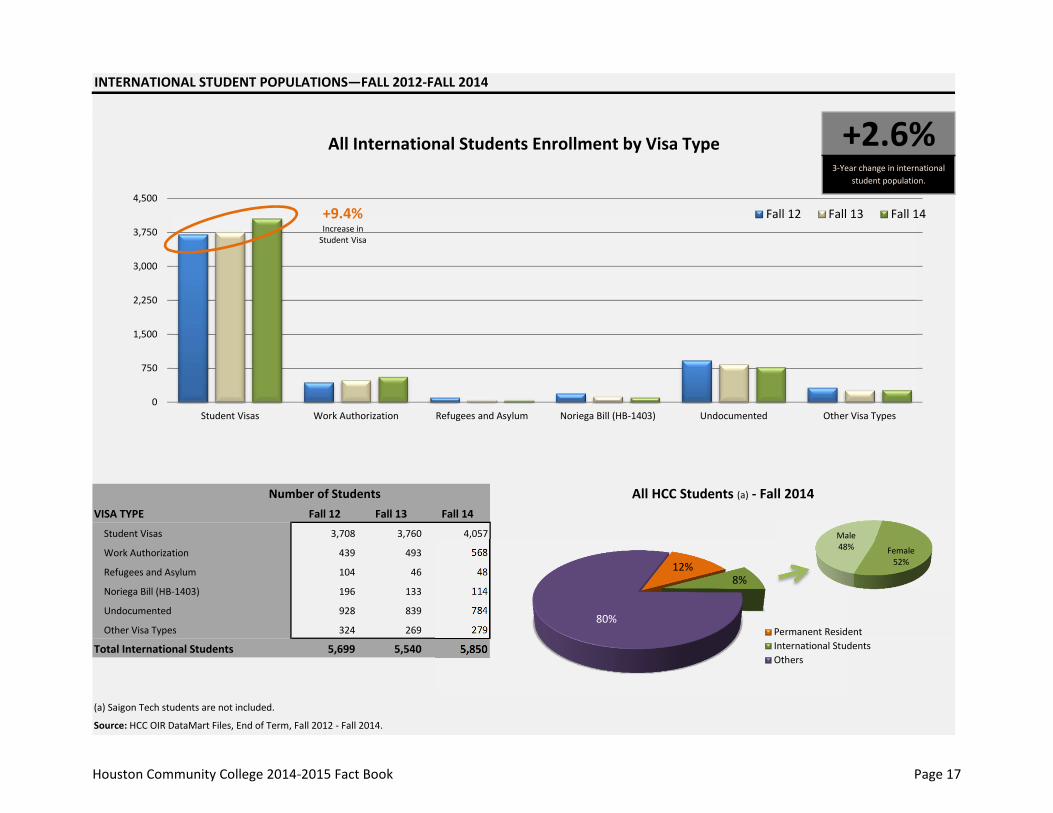
INTERNATIONAL STUDENT POPULATIONS—FALL 2012‐FALL 2014
Number of StudentsVISA TYPE Fall 12 Fall 13 Fall 14
Student Visas 3,708 3,760 4,057
Work Authorization 439 493 568
Refugees and Asylum 104 46 48
Noriega Bill (HB‐1403) 196 133 114
Undocumented 928 839 784
Other Visa Types 324 269 279
Total International Students 5,699 5,540 5,850
(a) Saigon Tech students are not included.
Source: HCC OIR DataMart Files, End of Term, Fall 2012 ‐ Fall 2014.
+2.6%3‐Year change in international
student population.
All HCC Students (a) ‐ Fall 2014
All International Students Enrollment by Visa Type
0
750
1,500
2,250
3,000
3,750
4,500
Student Visas Work Authorization Refugees and Asylum Noriega Bill (HB‐1403) Undocumented Other Visa Types
Fall 12 Fall 13 Fall 14+9.4%Increase in Student Visa
12%8%
80%Permanent ResidentInternational StudentsOthers
Female52%
Male48%
Houston Community College 2014‐2015 Fact Book Page 17
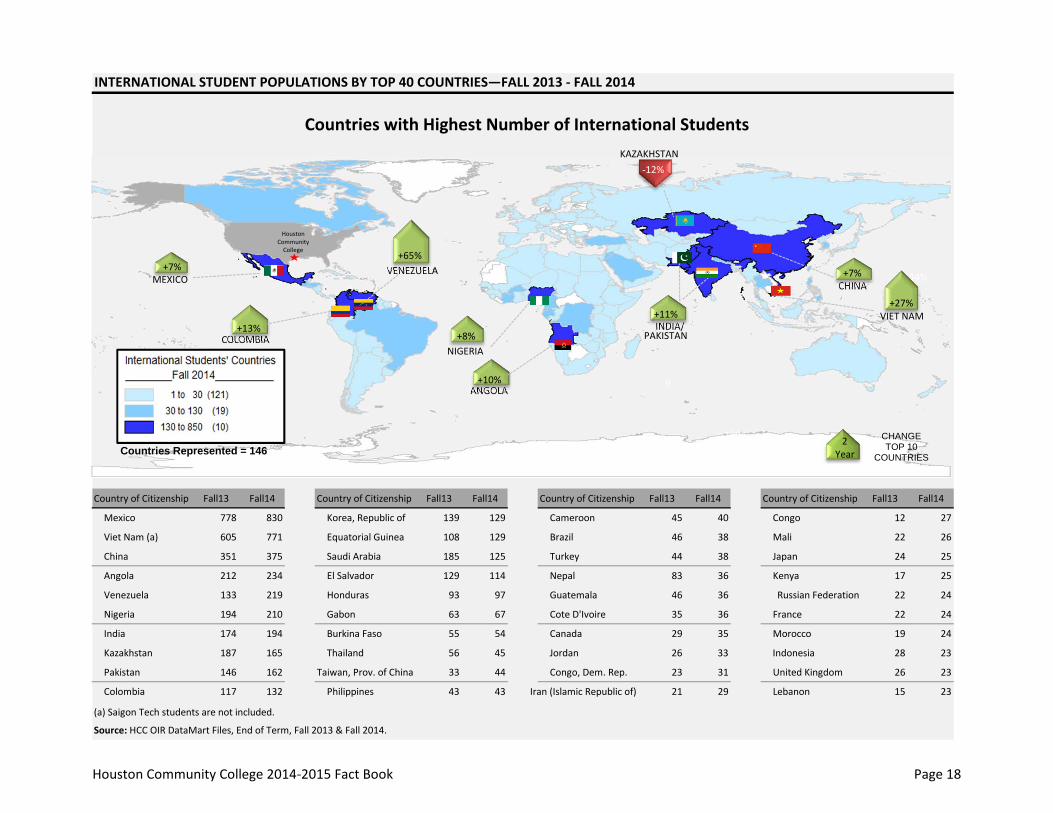
INTERNATIONAL STUDENT POPULATIONS BY TOP 40 COUNTRIES—FALL 2013 ‐ FALL 2014
Country of Citizenship Fall13 Fall14 Country of Citizenship Fall13 Fall14 Country of Citizenship Fall13 Fall14 Country of Citizenship Fall13 Fall14
Mexico 778 830 Korea, Republic of 139 129 Cameroon 45 40 Congo 12 27
Viet Nam (a) 605 771 Equatorial Guinea 108 129 Brazil 46 38 Mali 22 26
China 351 375 Saudi Arabia 185 125 Turkey 44 38 Japan 24 25
Angola 212 234 El Salvador 129 114 Nepal 83 36 Kenya 17 25
Venezuela 133 219 Honduras 93 97 Guatemala 46 36 Russian Federation 22 24
Nigeria 194 210 Gabon 63 67 Cote D'Ivoire 35 36 France 22 24
India 174 194 Burkina Faso 55 54 Canada 29 35 Morocco 19 24
Kazakhstan 187 165 Thailand 56 45 Jordan 26 33 Indonesia 28 23
Pakistan 146 162 Taiwan, Prov. of China 33 44 Congo, Dem. Rep. 23 31 United Kingdom 26 23
Colombia 117 132 Philippines 43 43 Iran (Islamic Republic of) 21 29 Lebanon 15 23
(a) Saigon Tech students are not included.
Source: HCC OIR DataMart Files, End of Term, Fall 2013 & Fall 2014.
Countries with Highest Number of International Students
9
130+4%
‐14%MEXICO+7%
KAZAKHSTAN‐12%
ANGOLA+10%
NIGERIA+8% PAKISTAN
INDIA/
CHINA+7%VENEZUELA
+65%
+27%VIET NAM
Countries Represented = 146CHANGETOP 10
COUNTRIES
2Year
+11%
COLOMBIA+13%
Houston Community College
Houston Community College 2014‐2015 Fact Book Page 18
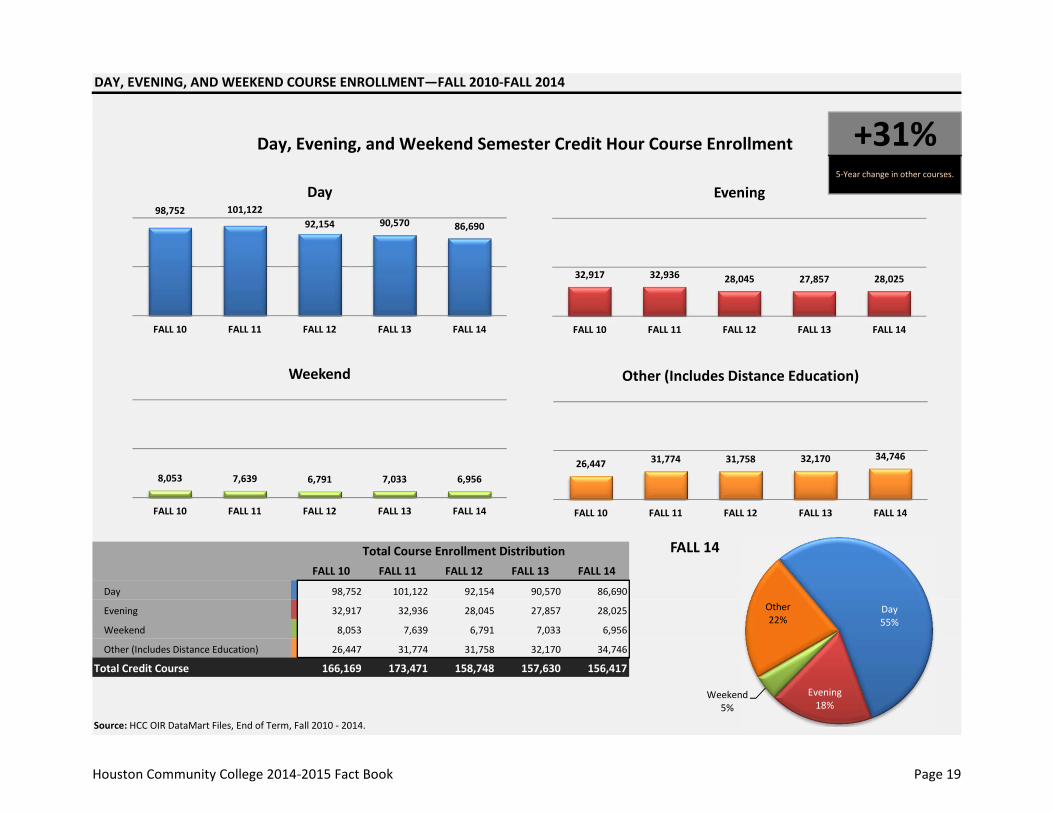
DAY, EVENING, AND WEEKEND COURSE ENROLLMENT—FALL 2010‐FALL 2014
FALL 10 FALL 11 FALL 12 FALL 13 FALL 14
Day 98,752 101,122 92,154 90,570 86,690
Evening 32,917 32,936 28,045 27,857 28,025
Weekend 8,053 7,639 6,791 7,033 6,956
Other (Includes Distance Education) 26,447 31,774 31,758 32,170 34,746
Total Credit Course 166,169 173,471 158,748 157,630 156,417
Source: HCC OIR DataMart Files, End of Term, Fall 2010 ‐ 2014.
+31%5‐Year change in other courses.
Total Course Enrollment Distribution
Day, Evening, and Weekend Semester Credit Hour Course Enrollment
Day55%
Evening18%
Weekend5%
Other22%
FALL 14
98,752 101,12292,154 90,570 86,690
FALL 10 FALL 11 FALL 12 FALL 13 FALL 14
Day
32,917 32,936 28,045 27,857 28,025
FALL 10 FALL 11 FALL 12 FALL 13 FALL 14
Evening
8,053 7,639 6,791 7,033 6,956
FALL 10 FALL 11 FALL 12 FALL 13 FALL 14
Weekend
26,447 31,774 31,758 32,170 34,746
FALL 10 FALL 11 FALL 12 FALL 13 FALL 14
Other (Includes Distance Education)
Houston Community College 2014‐2015 Fact Book Page 19
INSTRU
CTIONAL
PRO
GRA
MS
Houston Community College 2014‐2015 Fact Book Page 20
INSTRUCTIONAL PROGRAMS
SEMESTER CREDIT HOUR STUDENTS ‐ ACADEMIC/TECHNICAL AREAS—2010‐2014CONTACT HOUR TRENDS 22TOP ACADEMIC DISCIPLINES BY CONTACT HOURS 23TOP TECHNICAL PROGRAMS BY CONTACT HOURS 23
SEMESTER CREDIT HOUR COURSE ENROLLMENT AND SECTIONS—2010‐2014COURSE ENROLLMENT TRENDS 24NUMBER OF SECTIONS TRENDS 24
SEMESTER CREDIT HOUR DEVELOPMENTAL EDUCATION—Fall 2010‐2014DEVELOPMENTAL EDUCATION STUDENT ENROLLMENT BY SUBJECT 25
DISTANCE EDUCATION COURSE ENROLLMENT AND SECTIONS—2010‐2014COURSE ENROLLMENT TRENDS 26NUMBER OF SECTIONS TRENDS 26
DUAL CREDIT—FALL 2010‐FALL 2014HIGH SCHOOL BASED DUAL CREDIT ‐‐ UNDUPLICATED ENROLLMENT BY INDEPENDENT SCHOOL DISTRICT 27
ADULT EDUCATION PROGRAMS—2010‐2014ABE/GED/ESL
ENROLLMENT BY GENDER 28ENROLLMENT BY ETHNICITY 29ENROLLMENT BY AGE GROUP 30
ADULT HIGH SCHOOLENROLLMENT TRENDS AND TOP FEEDER HIGH SCHOOLS 31
CONTINUING EDUCATION COURSE ENROLLMENT BY CLUSTERS—2012‐2014CONTINUING EDUCATION ENROLLMENT TRENDS 32
LIBRARY SERVICE—FALL 2010‐2014 33
Houston Community College 2014‐2015 Fact Book Page 21
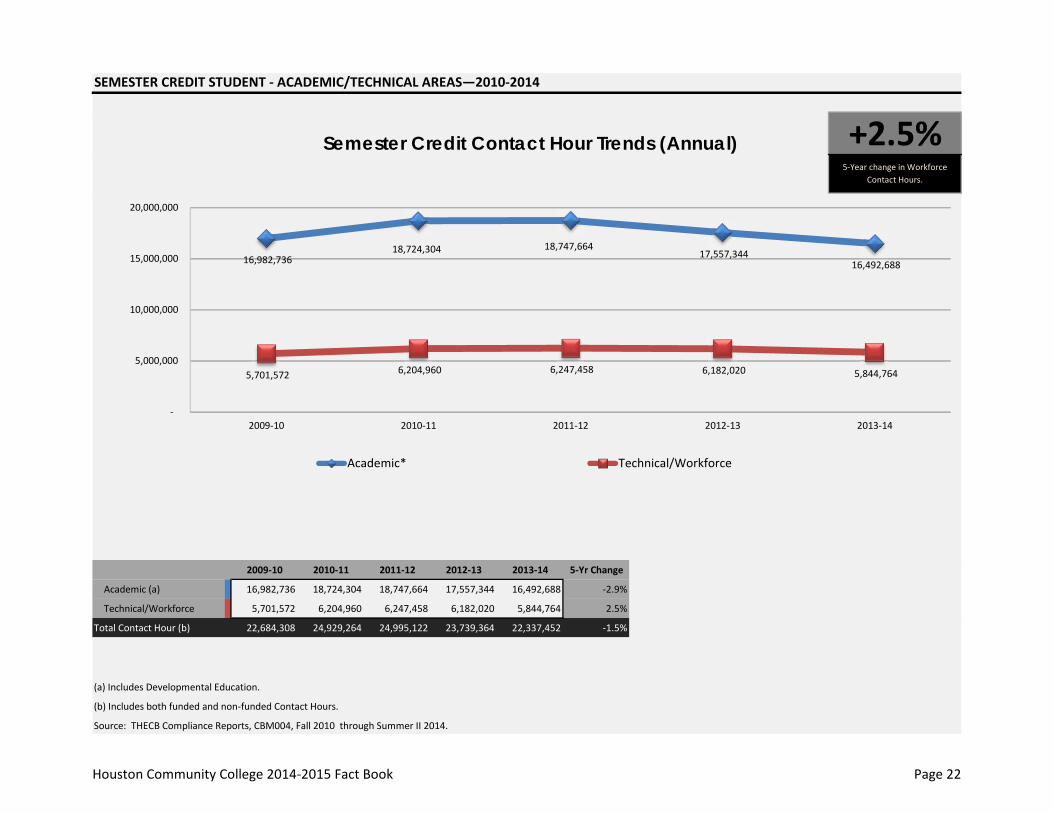
SEMESTER CREDIT STUDENT ‐ ACADEMIC/TECHNICAL AREAS—2010‐2014
2009‐10 2010‐11 2011‐12 2012‐13 2013‐14 5‐Yr Change
Academic (a) 16,982,736 18,724,304 18,747,664 17,557,344 16,492,688 ‐2.9%
Technical/Workforce 5,701,572 6,204,960 6,247,458 6,182,020 5,844,764 2.5%
Total Contact Hour (b) 22,684,308 24,929,264 24,995,122 23,739,364 22,337,452 ‐1.5%
(a) Includes Developmental Education.
(b) Includes both funded and non‐funded Contact Hours.
Source: THECB Compliance Reports, CBM004, Fall 2010 through Summer II 2014.
+2.5%5‐Year change in Workforce
Contact Hours.
Semester Credit Contact Hour Trends (Annual)
16,982,736 18,724,304 18,747,664
17,557,344 16,492,688
5,701,572 6,204,960 6,247,458 6,182,020 5,844,764
‐
5,000,000
10,000,000
15,000,000
20,000,000
2009‐10 2010‐11 2011‐12 2012‐13 2013‐14
Academic* Technical/Workforce
Houston Community College 2014‐2015 Fact Book Page 22
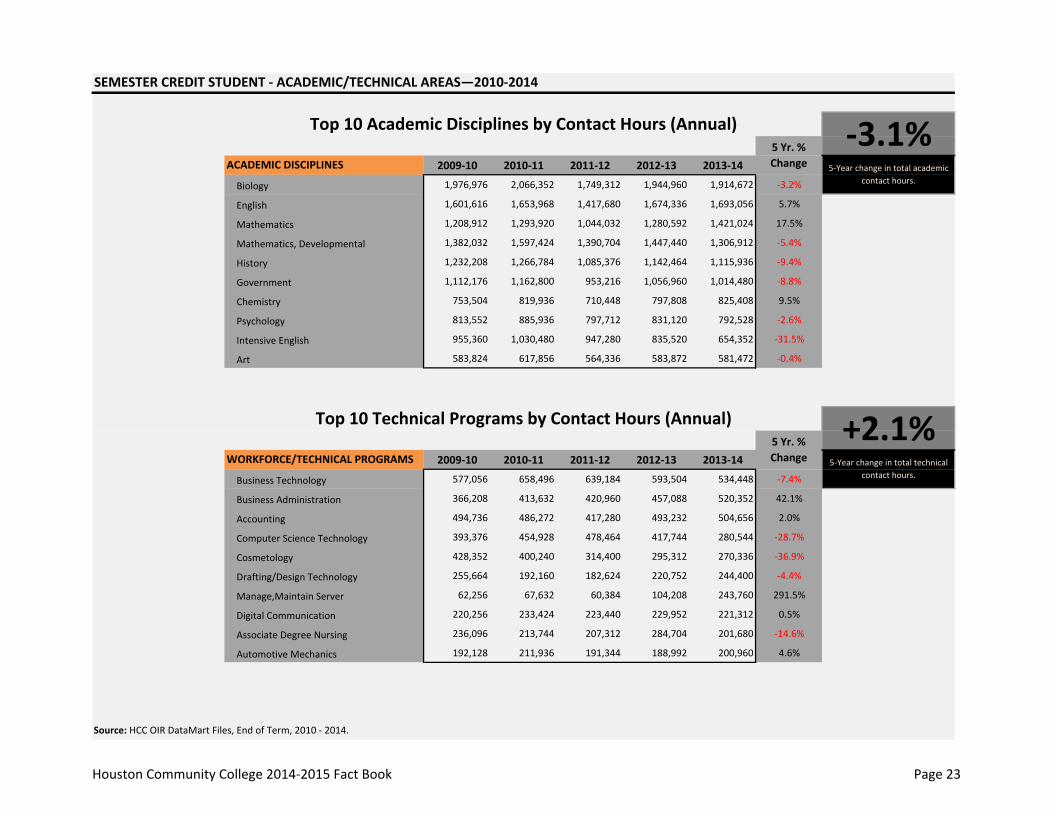
SEMESTER CREDIT STUDENT ‐ ACADEMIC/TECHNICAL AREAS—2010‐2014
2009‐10 2010‐11 2011‐12 2012‐13 2013‐14
Biology 1,976,976 2,066,352 1,749,312 1,944,960 1,914,672 ‐3.2%
English 1,601,616 1,653,968 1,417,680 1,674,336 1,693,056 5.7%
Mathematics 1,208,912 1,293,920 1,044,032 1,280,592 1,421,024 17.5%
Mathematics, Developmental 1,382,032 1,597,424 1,390,704 1,447,440 1,306,912 ‐5.4%
History 1,232,208 1,266,784 1,085,376 1,142,464 1,115,936 ‐9.4%
Government 1,112,176 1,162,800 953,216 1,056,960 1,014,480 ‐8.8%
Chemistry 753,504 819,936 710,448 797,808 825,408 9.5%
Psychology 813,552 885,936 797,712 831,120 792,528 ‐2.6%
Intensive English 955,360 1,030,480 947,280 835,520 654,352 ‐31.5%
Art 583,824 617,856 564,336 583,872 581,472 ‐0.4%
2009‐10 2010‐11 2011‐12 2012‐13 2013‐14
Business Technology 577,056 658,496 639,184 593,504 534,448 ‐7.4%
Business Administration 366,208 413,632 420,960 457,088 520,352 42.1%
Accounting 494,736 486,272 417,280 493,232 504,656 2.0%
Computer Science Technology 393,376 454,928 478,464 417,744 280,544 ‐28.7%
Cosmetology 428,352 400,240 314,400 295,312 270,336 ‐36.9%
Drafting/Design Technology 255,664 192,160 182,624 220,752 244,400 ‐4.4%
Manage,Maintain Server 62,256 67,632 60,384 104,208 243,760 291.5%
Digital Communication 220,256 233,424 223,440 229,952 221,312 0.5%
Associate Degree Nursing 236,096 213,744 207,312 284,704 201,680 ‐14.6%
Automotive Mechanics 192,128 211,936 191,344 188,992 200,960 4.6%
Source: HCC OIR DataMart Files, End of Term, 2010 ‐ 2014.
‐3.1%5‐Year change in total academic
contact hours.
+2.1%5‐Year change in total technical
contact hours.
Top 10 Academic Disciplines by Contact Hours (Annual)
ACADEMIC DISCIPLINES
WORKFORCE/TECHNICAL PROGRAMS
5 Yr. % Change
5 Yr. % Change
Top 10 Technical Programs by Contact Hours (Annual)
Houston Community College 2014‐2015 Fact Book Page 23
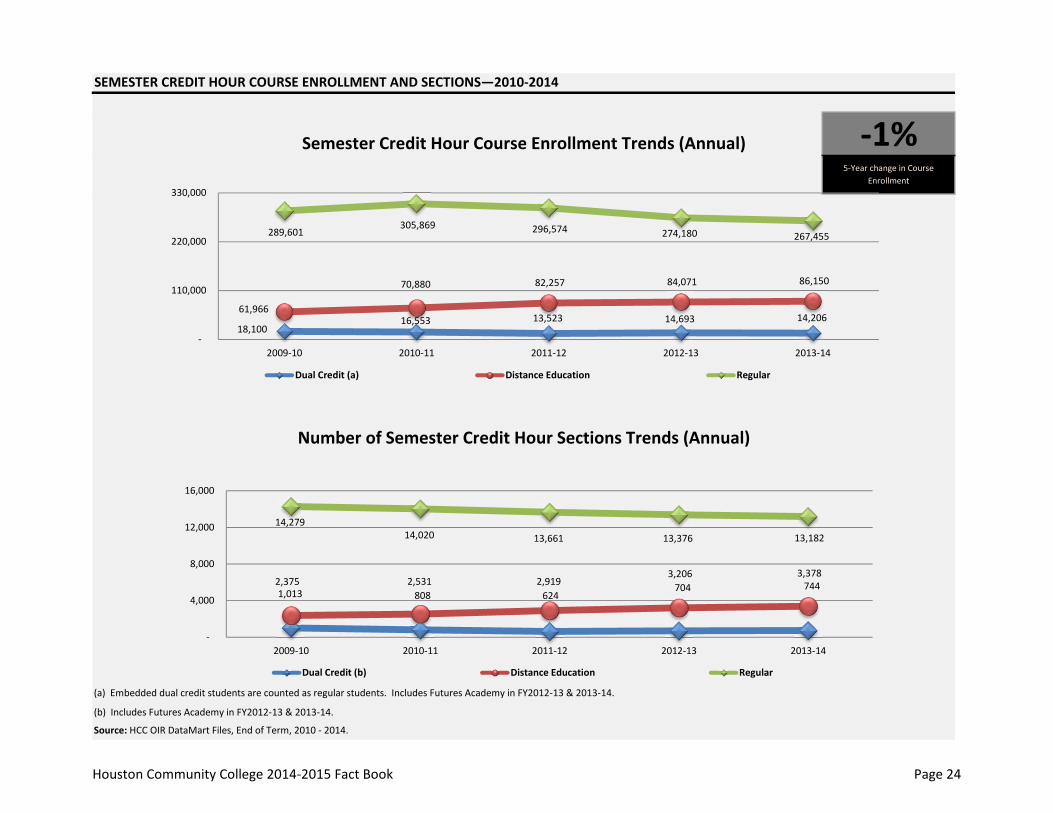
SEMESTER CREDIT HOUR COURSE ENROLLMENT AND SECTIONS—2010‐2014
(a) Embedded dual credit students are counted as regular students. Includes Futures Academy in FY2012‐13 & 2013‐14.
(b) Includes Futures Academy in FY2012‐13 & 2013‐14.
Source: HCC OIR DataMart Files, End of Term, 2010 ‐ 2014.
‐1%5‐Year change in Course
Enrollment
Semester Credit Hour Course Enrollment Trends (Annual)
Number of Semester Credit Hour Sections Trends (Annual)
1,013 808 624 704 744 2,375 2,531 2,919
3,206 3,378
14,279 14,020 13,661 13,376 13,182
‐
4,000
8,000
12,000
16,000
2009‐10 2010‐11 2011‐12 2012‐13 2013‐14
Dual Credit (b) Distance Education Regular
18,100 16,553 13,523 14,693 14,206
61,966
70,880 82,257 84,071 86,150
289,601 305,869 296,574 274,180 267,455
‐
110,000
220,000
330,000
2009‐10 2010‐11 2011‐12 2012‐13 2013‐14
Dual Credit (a) Distance Education Regular
Houston Community College 2014‐2015 Fact Book Page 24
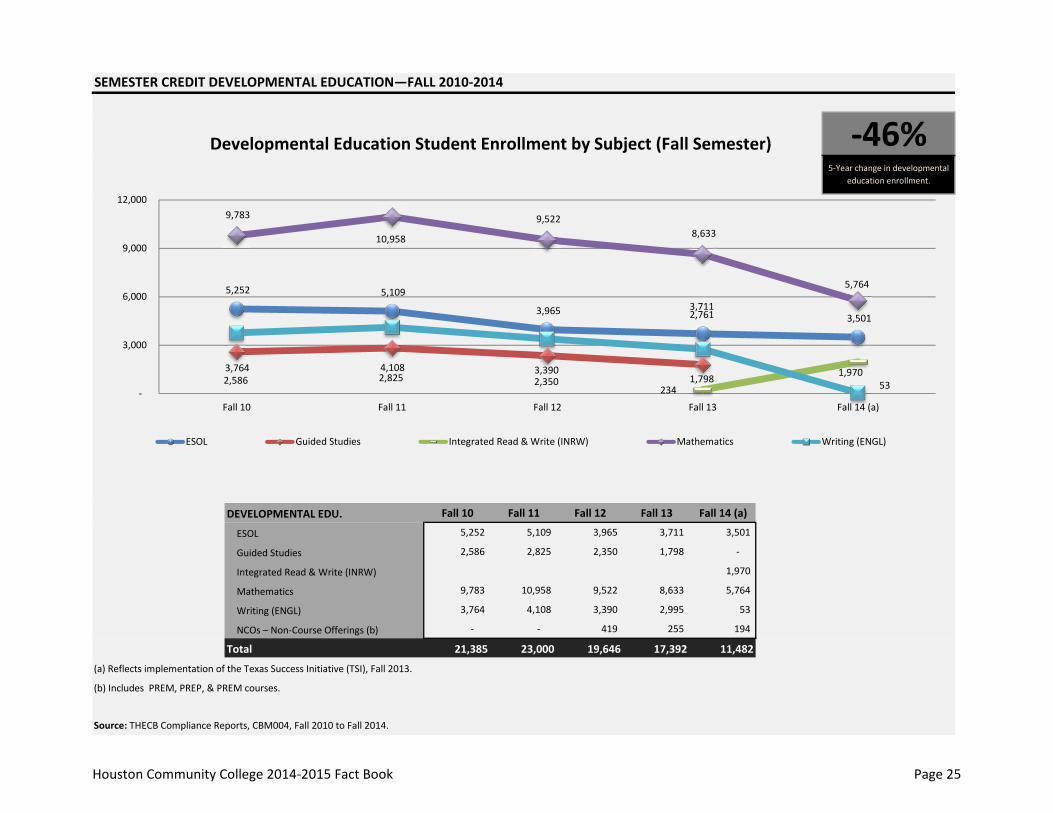
SEMESTER CREDIT DEVELOPMENTAL EDUCATION—FALL 2010‐2014
DEVELOPMENTAL EDU. Fall 10 Fall 11 Fall 12 Fall 13 Fall 14 (a)
ESOL 5,252 5,109 3,965 3,711 3,501
Guided Studies 2,586 2,825 2,350 1,798 ‐
Integrated Read & Write (INRW) 1,970
Mathematics 9,783 10,958 9,522 8,633 5,764
Writing (ENGL) 3,764 4,108 3,390 2,995 53
NCOs – Non‐Course Offerings (b) ‐ ‐ 419 255 194
Total 21,385 23,000 19,646 17,392 11,482
(a) Reflects implementation of the Texas Success Initiative (TSI), Fall 2013.
(b) Includes PREM, PREP, & PREM courses.
Source: THECB Compliance Reports, CBM004, Fall 2010 to Fall 2014.
‐46%5‐Year change in developmental
education enrollment.
Developmental Education Student Enrollment by Subject (Fall Semester)
5,252 5,109
3,965 3,711 3,501
2,586 2,825 2,350 1,798 234
1,970
9,783
10,958
9,522 8,633
5,764
3,764 4,108 3,390
2,761
53 ‐
3,000
6,000
9,000
12,000
Fall 10 Fall 11 Fall 12 Fall 13 Fall 14 (a)
ESOL Guided Studies Integrated Read & Write (INRW) Mathematics Writing (ENGL)
Houston Community College 2014‐2015 Fact Book Page 25
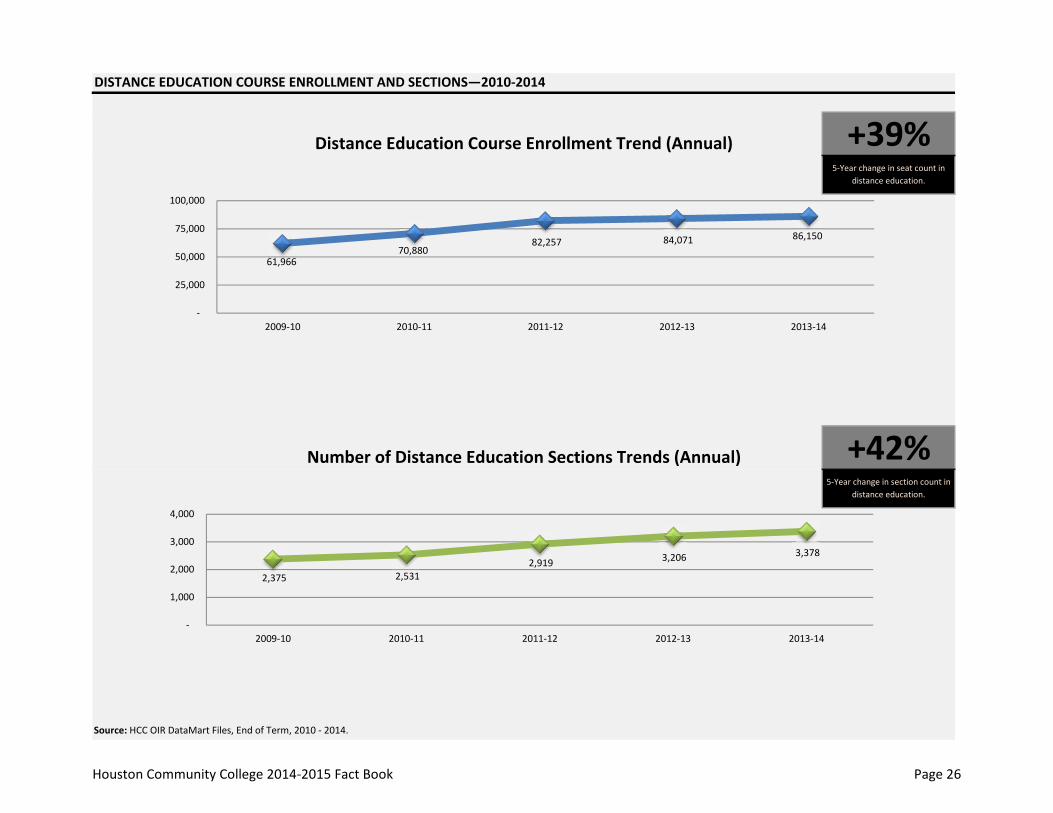
DISTANCE EDUCATION COURSE ENROLLMENT AND SECTIONS—2010‐2014
Source: HCC OIR DataMart Files, End of Term, 2010 ‐ 2014.
5‐Year change in section count in distance education.
Distance Education Course Enrollment Trend (Annual) +39%5‐Year change in seat count in
distance education.
+42%Number of Distance Education Sections Trends (Annual)
61,966 70,880
82,257 84,071 86,150
‐
25,000
50,000
75,000
100,000
2009‐10 2010‐11 2011‐12 2012‐13 2013‐14
2,375 2,531 2,919 3,206 3,378
‐
1,000
2,000
3,000
4,000
2009‐10 2010‐11 2011‐12 2012‐13 2013‐14
Houston Community College 2014‐2015 Fact Book Page 26
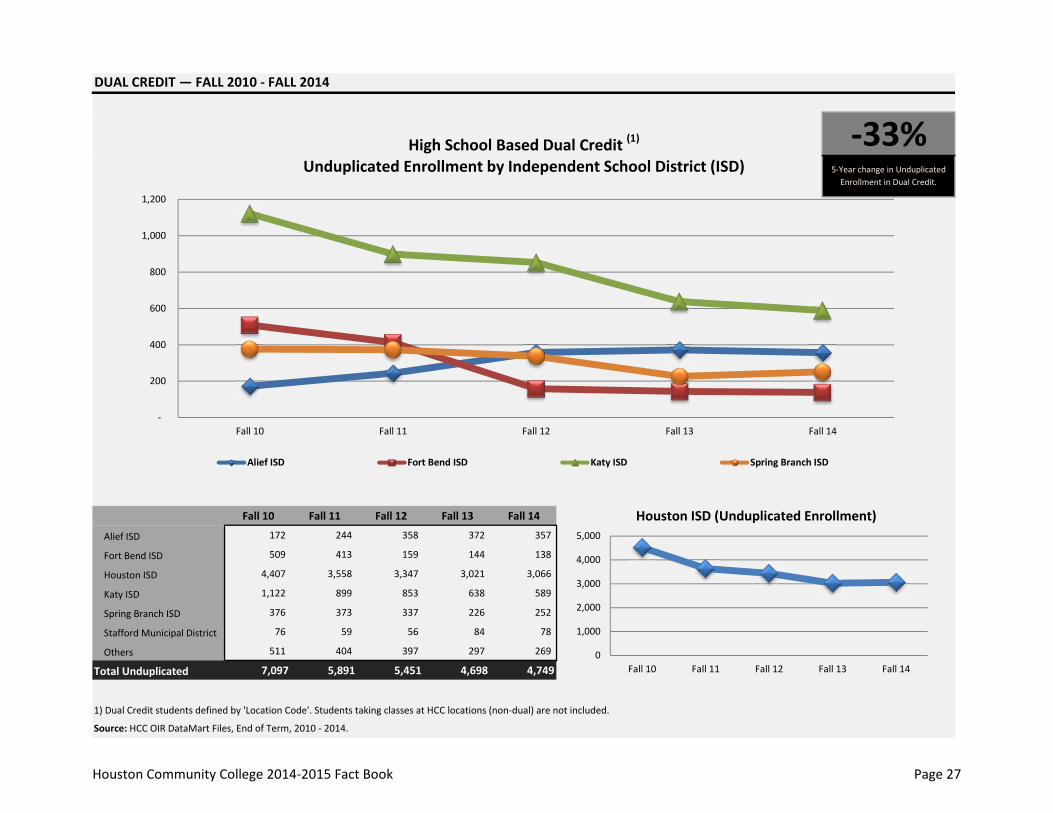
DUAL CREDIT — FALL 2010 ‐ FALL 2014
Fall 10 Fall 11 Fall 12 Fall 13 Fall 14
Alief ISD 172 244 358 372 357
Fort Bend ISD 509 413 159 144 138
Houston ISD 4,407 3,558 3,347 3,021 3,066
Katy ISD 1,122 899 853 638 589
Spring Branch ISD 376 373 337 226 252
Stafford Municipal District 76 59 56 84 78
Others 511 404 397 297 269
Total Unduplicated 7,097 5,891 5,451 4,698 4,749
1) Dual Credit students defined by 'Location Code'. Students taking classes at HCC locations (non‐dual) are not included.
Source: HCC OIR DataMart Files, End of Term, 2010 ‐ 2014.
‐33%5‐Year change in Unduplicated Enrollment in Dual Credit.
Unduplicated Enrollment by Independent School District (ISD)
Houston ISD (Unduplicated Enrollment)
High School Based Dual Credit (1)
‐
200
400
600
800
1,000
1,200
Fall 10 Fall 11 Fall 12 Fall 13 Fall 14
Alief ISD Fort Bend ISD Katy ISD Spring Branch ISD
0
1,000
2,000
3,000
4,000
5,000
Fall 10 Fall 11 Fall 12 Fall 13 Fall 14
Houston Community College 2014‐2015 Fact Book Page 27

ADULT EDUCATION PROGRAMS BY GENDER—2010‐2014
Gender
Male 4,577 42.2% 3,692 38.8% 3,645 37.6% 3,410 36.8% 3,373 37.1%
Female 6,277 57.8% 5,823 61.2% 6,060 62.4% 5,866 63.2% 5,712 62.9%
Total
Source: Texas Educating Adults Management System (TEAMS) Reports, 2010‐2014.
(a) ASE‐Adult Secondary Education students function at the 9th grade level or higher in reading, mathematics, and language as assessed by the Test of Adult Basic Education (TABE).
‐16%5‐Year change in total population.
10,854 9,515 9,705 9,276
2009‐10 2012‐13
ABE/ASE (a)/ESL Enrollment by Ethnicity (Annual)
2013‐14
9,085
2011‐122010‐11
4,577
3,692 3,645 3,410 3,373
6,2775,823 6,060 5,866 5,712
0
3,000
6,000
9,000
2009‐10 2010‐11 2011‐12 2012‐13 2013‐14
Male Female
Houston Community College 2014‐2015 Fact Book Page 28
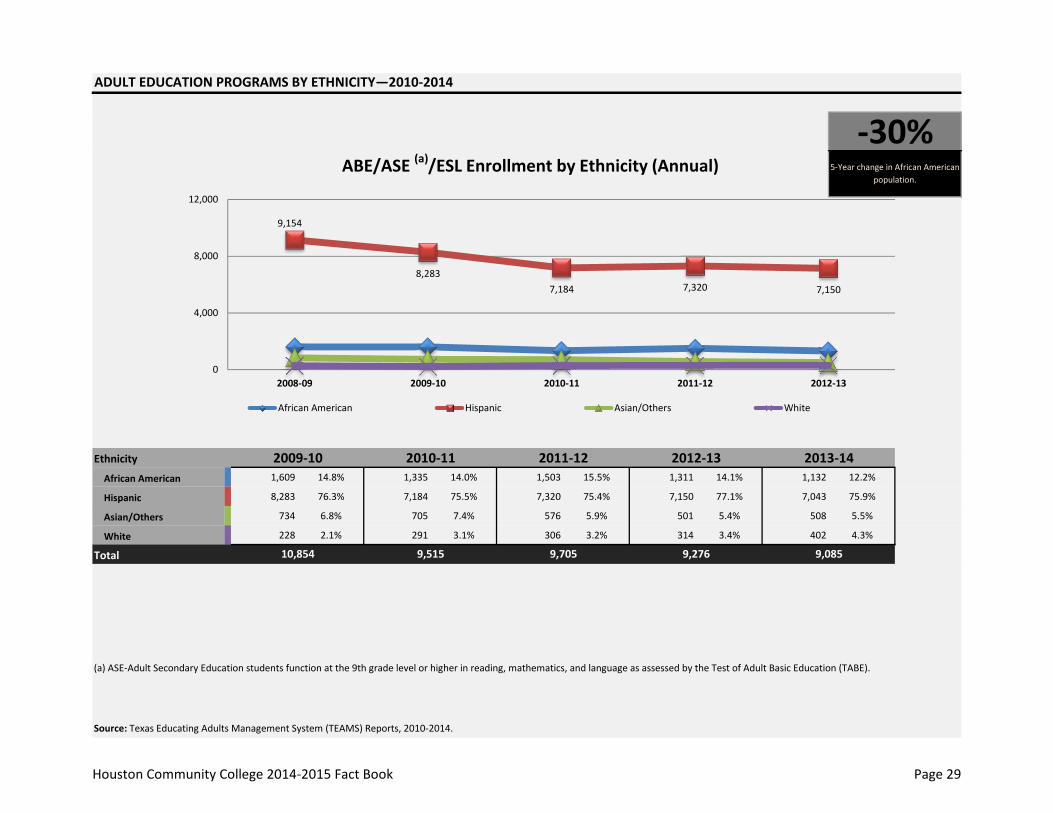
ADULT EDUCATION PROGRAMS BY ETHNICITY—2010‐2014
1,609 14.8% 1,335 14.0% 1,503 15.5% 1,311 14.1% 1,132 12.2%
8,283 76.3% 7,184 75.5% 7,320 75.4% 7,150 77.1% 7,043 75.9%
734 6.8% 705 7.4% 576 5.9% 501 5.4% 508 5.5%
228 2.1% 291 3.1% 306 3.2% 314 3.4% 402 4.3%
Source: Texas Educating Adults Management System (TEAMS) Reports, 2010‐2014.
Ethnicity
African American
Hispanic
Asian/Others
White
Total 10,854 9,515 9,705
(a) ASE‐Adult Secondary Education students function at the 9th grade level or higher in reading, mathematics, and language as assessed by the Test of Adult Basic Education (TABE).
‐30%5‐Year change in African American
population.ABE/ASE (a)/ESL Enrollment by Ethnicity (Annual)
2013‐14
9,085
2011‐12
9,276
2009‐10 2012‐132010‐11
9,154
8,2837,184 7,320 7,150
0
4,000
8,000
12,000
2008‐09 2009‐10 2010‐11 2011‐12 2012‐13
African American Hispanic Asian/Others White
Houston Community College 2014‐2015 Fact Book Page 29
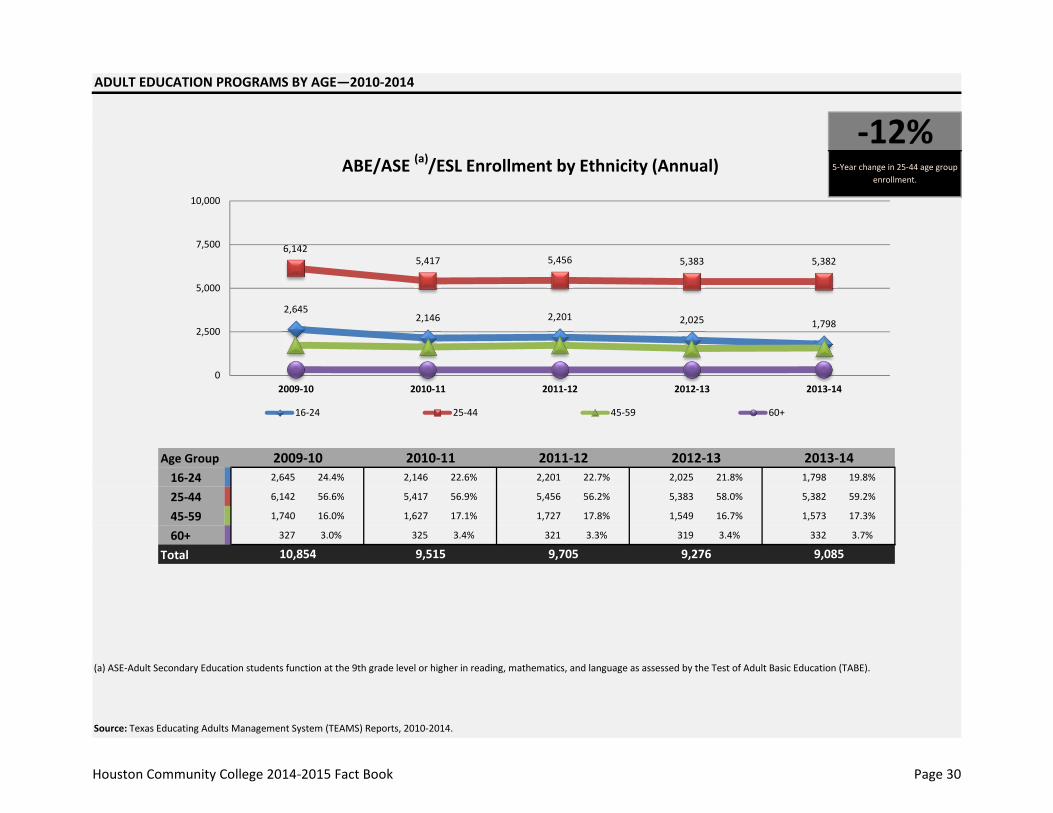
ADULT EDUCATION PROGRAMS BY AGE—2010‐2014
Age Group16‐24 2,645 24.4% 2,146 22.6% 2,201 22.7% 2,025 21.8% 1,798 19.8%
25‐44 6,142 56.6% 5,417 56.9% 5,456 56.2% 5,383 58.0% 5,382 59.2%
45‐59 1,740 16.0% 1,627 17.1% 1,727 17.8% 1,549 16.7% 1,573 17.3%
60+ 327 3.0% 325 3.4% 321 3.3% 319 3.4% 332 3.7%
Total
Source: Texas Educating Adults Management System (TEAMS) Reports, 2010‐2014.
10,854
(a) ASE‐Adult Secondary Education students function at the 9th grade level or higher in reading, mathematics, and language as assessed by the Test of Adult Basic Education (TABE).
‐12%5‐Year change in 25‐44 age group
enrollment.
2009‐10 2012‐13
ABE/ASE (a)/ESL Enrollment by Ethnicity (Annual)
2013‐14
9,085
2010‐11 2011‐12
9,2769,7059,515
2,6452,146 2,201 2,025 1,798
6,1425,417 5,456 5,383 5,382
0
2,500
5,000
7,500
10,000
2009‐10 2010‐11 2011‐12 2012‐13 2013‐14
16‐24 25‐44 45‐59 60+
Houston Community College 2014‐2015 Fact Book Page 30
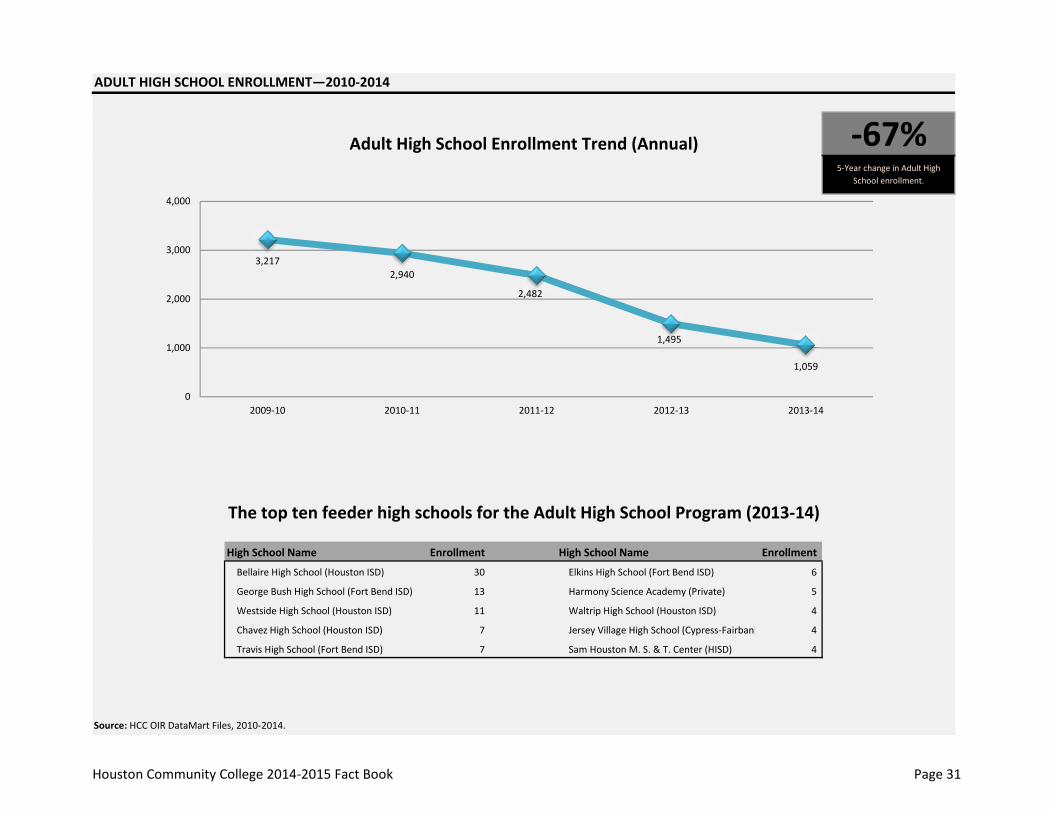
ADULT HIGH SCHOOL ENROLLMENT—2010‐2014
High School Name Enrollment High School Name Enrollment
Bellaire High School (Houston ISD) 30 Elkins High School (Fort Bend ISD) 6
George Bush High School (Fort Bend ISD) 13 Harmony Science Academy (Private) 5
Westside High School (Houston ISD) 11 Waltrip High School (Houston ISD) 4
Chavez High School (Houston ISD) 7 Jersey Village High School (Cypress‐Fairbank 4
Travis High School (Fort Bend ISD) 7 Sam Houston M. S. & T. Center (HISD) 4
Source: HCC OIR DataMart Files, 2010‐2014.
The top ten feeder high schools for the Adult High School Program (2013‐14)
‐67%5‐Year change in Adult High
School enrollment.
Adult High School Enrollment Trend (Annual)
3,2172,940
2,482
1,495
1,059
0
1,000
2,000
3,000
4,000
2009‐10 2010‐11 2011‐12 2012‐13 2013‐14
Houston Community College 2014‐2015 Fact Book Page 31

CONTINUING EDUCATION COURSE ENROLLMENT BY CLUSTERS—2012‐2014
COURSE TYPE COURSE TYPEContinuing Education Unit Content Area: 2011‐12 2012‐13 2013‐14 Non‐Credit Content Area: 2011‐12 2012‐13 2013‐14
Apprentice 9,828 11,196 7,634 Health Careers ‐ 195 301
Center for Health Care Prof ‐ 2,376 790 Online CE Courses 1,485 1,584 1,169
Construction 738 969 580 Leisure 910 838 820
Corrections Program 16,001 10,175 8,835 Transportation Motorcycle 246 ‐ ‐
Business 1,451 1,035 976 Public Safety Institute ‐ ‐ 2,102
Public Safety Institute 2,493 3,245 4,078 Total Enrollment (Duplicated) 2,641 2,617 4,392
Information Technology 1,327 1,501 961
Health Careers 5,381 2,306 1,567
Languages 3,161 6,915 7,771
Transportation 1,267 1,692 840
Total Enrollment (Duplicated) 41,647 41,410 34,032
Numbers on this page represent seat count, not number of students.
Source: PeopleSoft Query – “All ClassesMonitor” by Term ‐ Fall 2011 to Summer 2014.
‐13.2%3‐Year change in The Division of
Extended Learning.Continuing Education Course Enrollment Trend (Annual)
0
2,500
5,000
7,500
10,000
12,500
Apprentice Construction Corrections Program Business Public Safety Institute InformationTechnology
Health Careers Languages Transportation
2011‐12 2012‐13 2013‐14
Houston Community College 2014‐2015 Fact Book Page 32
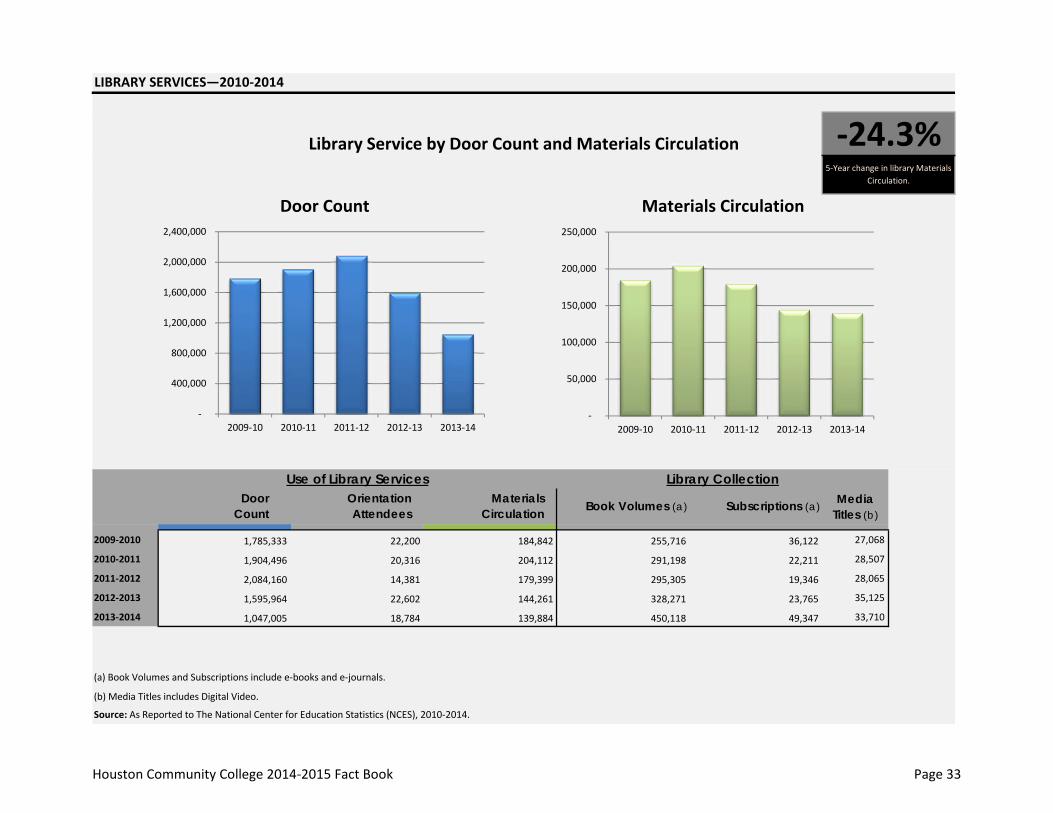
LIBRARY SERVICES—2010‐2014
Media Titles (b)
2009‐2010 27,068
2010‐2011 28,507
2011‐2012 28,065
2012‐2013 35,125
2013‐2014 33,710
(a) Book Volumes and Subscriptions include e‐books and e‐journals.
(b) Media Titles includes Digital Video.
Source: As Reported to The National Center for Education Statistics (NCES), 2010‐2014.
Book Volumes (a) Subscriptions (a)
‐24.3%Library Service by Door Count and Materials Circulation5‐Year change in library Materials
Circulation.
Use of Library Services
Door Count Materials Circulation
Door Count
Orientation Attendees
Materials Circulation
Library Collection
255,716 36,122
1,904,496 20,316 204,112 291,198 22,211
1,785,333 22,200 184,842
49,347 450,118
295,305 19,346
1,595,964 22,602 144,261 328,271 23,765
139,884 1,047,005 18,784
2,084,160 14,381 179,399
‐
400,000
800,000
1,200,000
1,600,000
2,000,000
2,400,000
2009‐10 2010‐11 2011‐12 2012‐13 2013‐14 ‐
50,000
100,000
150,000
200,000
250,000
2009‐10 2010‐11 2011‐12 2012‐13 2013‐14
Houston Community College 2014‐2015 Fact Book Page 33
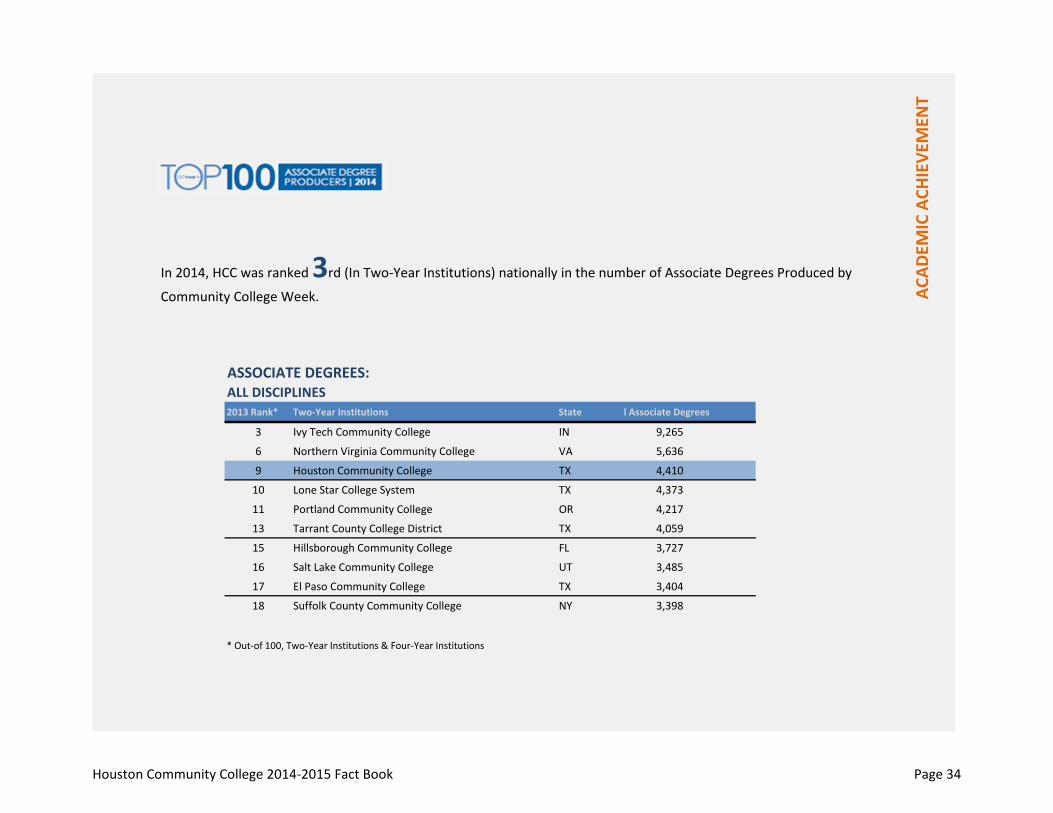
ASSOCIATE DEGREES:ALL DISCIPLINES2013 Rank* Two‐Year Institutions State l Associate Degrees
3 Ivy Tech Community College IN 9,265
6 Northern Virginia Community College VA 5,636
9 Houston Community College TX 4,410
10 Lone Star College System TX 4,373
11 Portland Community College OR 4,217
13 Tarrant County College District TX 4,059
15 Hillsborough Community College FL 3,727
16 Salt Lake Community College UT 3,485
17 El Paso Community College TX 3,404
18 Suffolk County Community College NY 3,398
* Out‐of 100, Two‐Year Institutions & Four‐Year Institutions
ACAD
EMIC ACH
IEVE
MEN
T
In 2014, HCC was ranked 3rd (In Two‐Year Institutions) nationally in the number of Associate Degrees Produced by
Community College Week.
Houston Community College 2014‐2015 Fact Book Page 34

ACADEMIC ACHIEVEMENT
AWARDS AND COMPLETIONSAWARDS AND COMPLETIONS ACADEMIC YEAR 2013‐2014 36ASSOCIATE DEGREE BY PROGRAM —2014 37AWARD AND COMPLETION TRENDS —2010‐2014 38
SEMESTER CREDIT HOUR STUDENT RETENTION—FALL2009‐2013 39
GRADE DISTRIBUTIONGRADE DISTRIBUTION TRENDS —2010‐2014 40
TRANSFER STUDENTSTOP TWELVE (12) PUBLIC TEXAS UNIVERSITIES FOR HCC TRANSFERS—FALL 2009 ‐ FALL 2013 41TRANSFER RATE TRENDS 2009‐2013 42
Houston Community College 2014‐2015 Fact Book Page 35
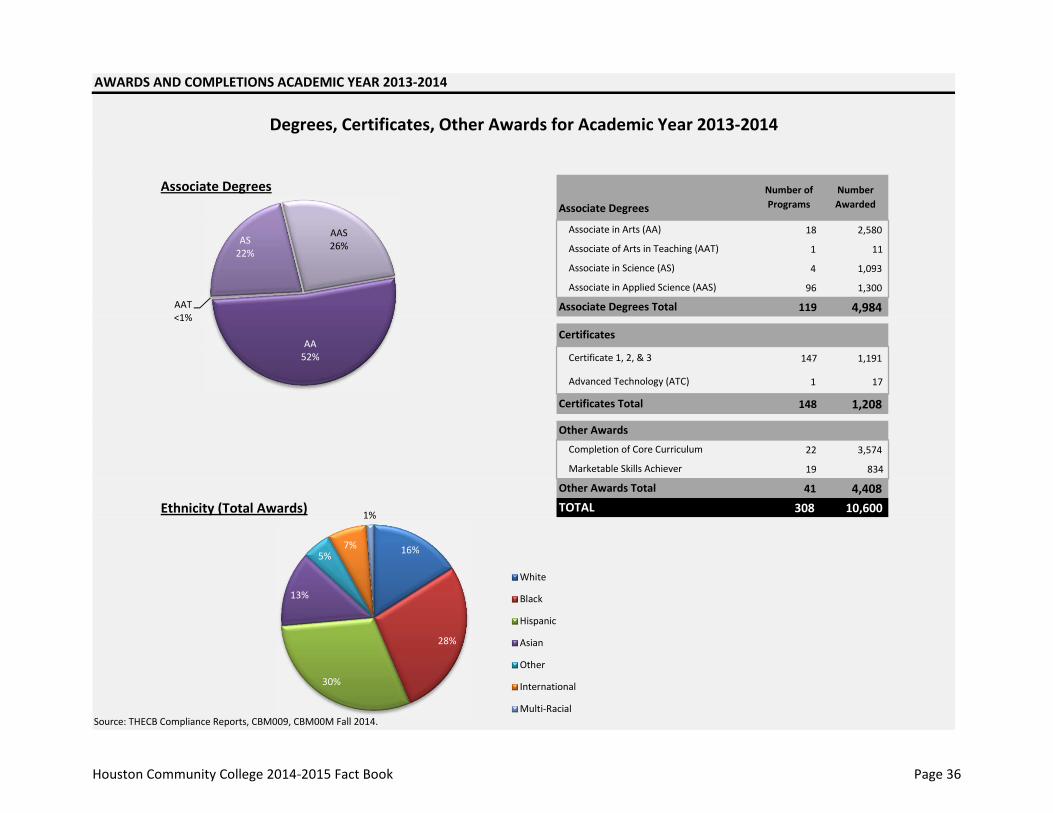
AWARDS AND COMPLETIONS ACADEMIC YEAR 2013‐2014
Associate Degrees
18 2,580
1 11
4 1,093
96 1,300
119 4,984
147 1,191
1 17
148 1,208
22 3,574
19 834
41 4,408 Ethnicity (Total Awards) 308 10,600
Source: THECB Compliance Reports, CBM009, CBM00M Fall 2014.
Other Awards
Completion of Core Curriculum
Marketable Skills Achiever
Other Awards Total
TOTAL
Number Awarded
Degrees, Certificates, Other Awards for Academic Year 2013‐2014
Certificates
Certificates Total
Advanced Technology (ATC)
Associate in Applied Science (AAS)
Associate Degrees Total
Certificate 1, 2, & 3
Associate Degrees
Associate in Arts (AA)
Associate of Arts in Teaching (AAT)
Associate in Science (AS)
Number of Programs
16%
28%
30%
13%
5%7%
1%
White
Black
Hispanic
Asian
Other
International
Multi‐Racial
AA52%
AAT<1%
AS22%
AAS26%
Houston Community College 2014‐2015 Fact Book Page 36
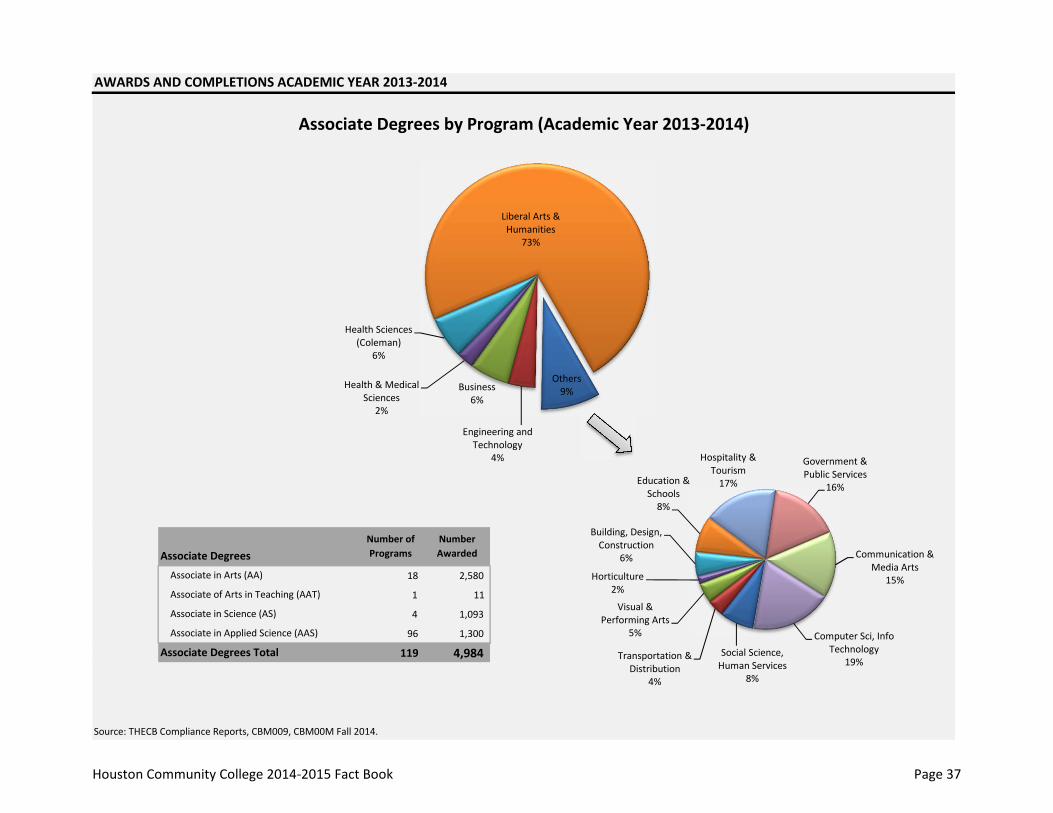
AWARDS AND COMPLETIONS ACADEMIC YEAR 2013‐2014
18 2,580
1 11
4 1,093
96 1,300
119 4,984
Source: THECB Compliance Reports, CBM009, CBM00M Fall 2014.
Associate in Science (AS)
Associate in Applied Science (AAS)
Associate Degrees Total
Number of Programs
Number AwardedAssociate Degrees
Associate in Arts (AA)
Associate of Arts in Teaching (AAT)
Associate Degrees by Program (Academic Year 2013‐2014)
Others9%
Engineering and Technology
4%
Business6%
Health & Medical Sciences
2%
Health Sciences (Coleman)
6%
Liberal Arts & Humanities
73%
Social Science, Human Services
8%
Transportation & Distribution
4%
Visual & Performing Arts
5%
Horticulture2%
Building, Design, Construction
6%
Education & Schools8%
Hospitality & Tourism17%
Government & Public Services
16%
Communication & Media Arts
15%
Computer Sci, Info Technology
19%
Houston Community College 2014‐2015 Fact Book Page 37
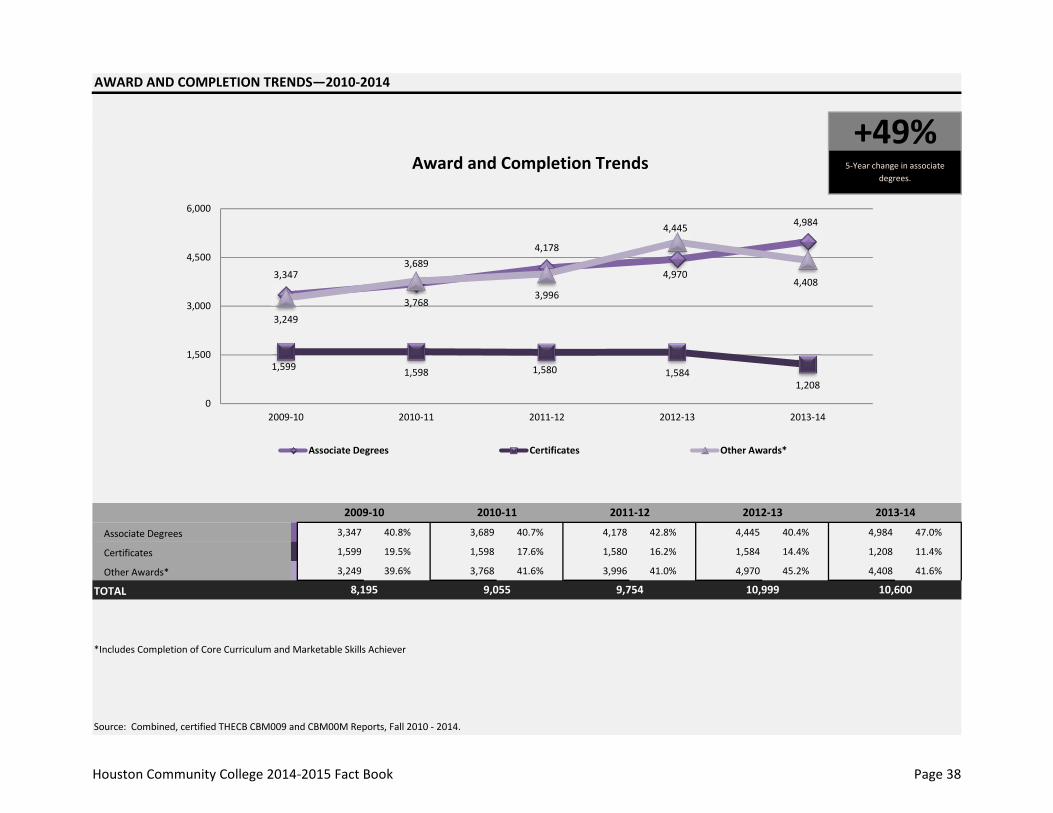
AWARD AND COMPLETION TRENDS—2010‐2014
Associate Degrees 3,347 40.8% 3,689 40.7% 4,178 42.8% 4,445 40.4% 4,984 47.0%
Certificates 1,599 19.5% 1,598 17.6% 1,580 16.2% 1,584 14.4% 1,208 11.4%
Other Awards* 3,249 39.6% 3,768 41.6% 3,996 41.0% 4,970 45.2% 4,408 41.6%
TOTAL
*Includes Completion of Core Curriculum and Marketable Skills Achiever
Source: Combined, certified THECB CBM009 and CBM00M Reports, Fall 2010 ‐ 2014.
Award and Completion Trends+49%
5‐Year change in associate degrees.
2012‐13
10,999
2009‐10 2010‐11 2011‐12 2013‐14
10,6009,7549,0558,195
3,3473,689
4,178
4,445 4,984
1,599 1,598 1,580 1,5841,208
3,249
3,7683,996
4,9704,408
0
1,500
3,000
4,500
6,000
2009‐10 2010‐11 2011‐12 2012‐13 2013‐14
Associate Degrees Certificates Other Awards*
Houston Community College 2014‐2015 Fact Book Page 38
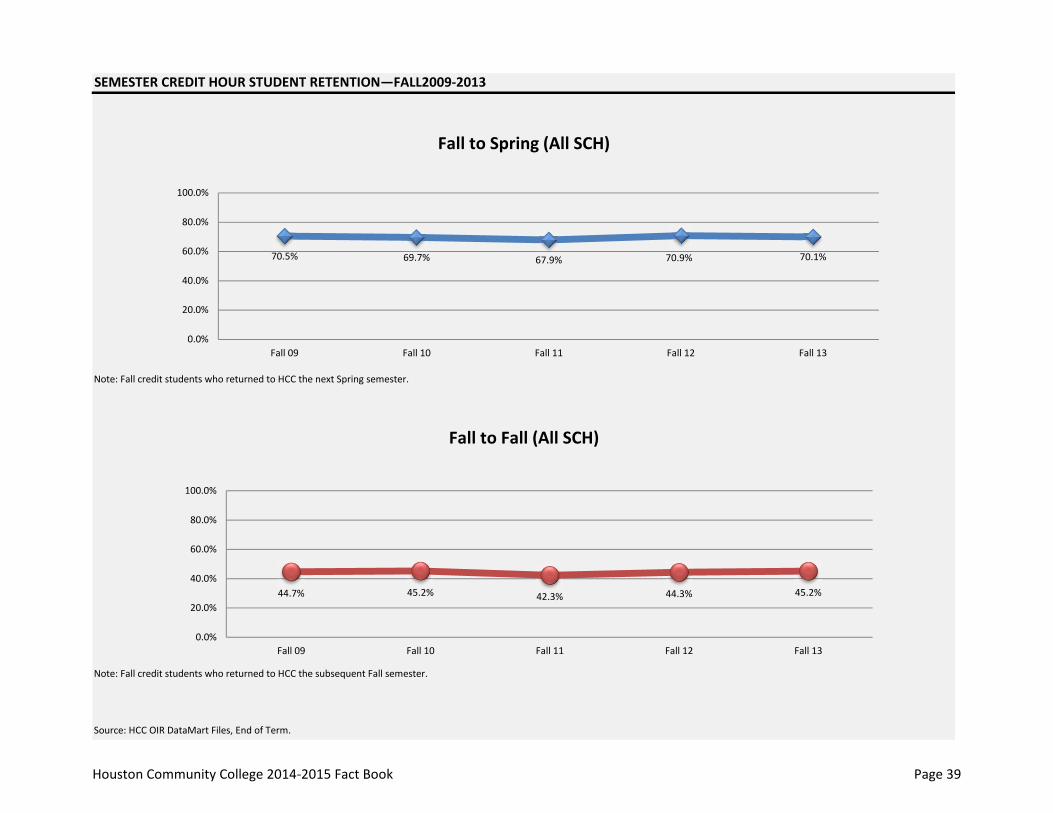
SEMESTER CREDIT HOUR STUDENT RETENTION—FALL2009‐2013
Note: Fall credit students who returned to HCC the next Spring semester.
Note: Fall credit students who returned to HCC the subsequent Fall semester.
Source: HCC OIR DataMart Files, End of Term.
Fall to Spring (All SCH)
Fall to Fall (All SCH)
44.7% 45.2% 42.3% 44.3% 45.2%
0.0%
20.0%
40.0%
60.0%
80.0%
100.0%
Fall 09 Fall 10 Fall 11 Fall 12 Fall 13
70.5% 69.7% 67.9% 70.9% 70.1%
0.0%
20.0%
40.0%
60.0%
80.0%
100.0%
Fall 09 Fall 10 Fall 11 Fall 12 Fall 13
Houston Community College 2014‐2015 Fact Book Page 39
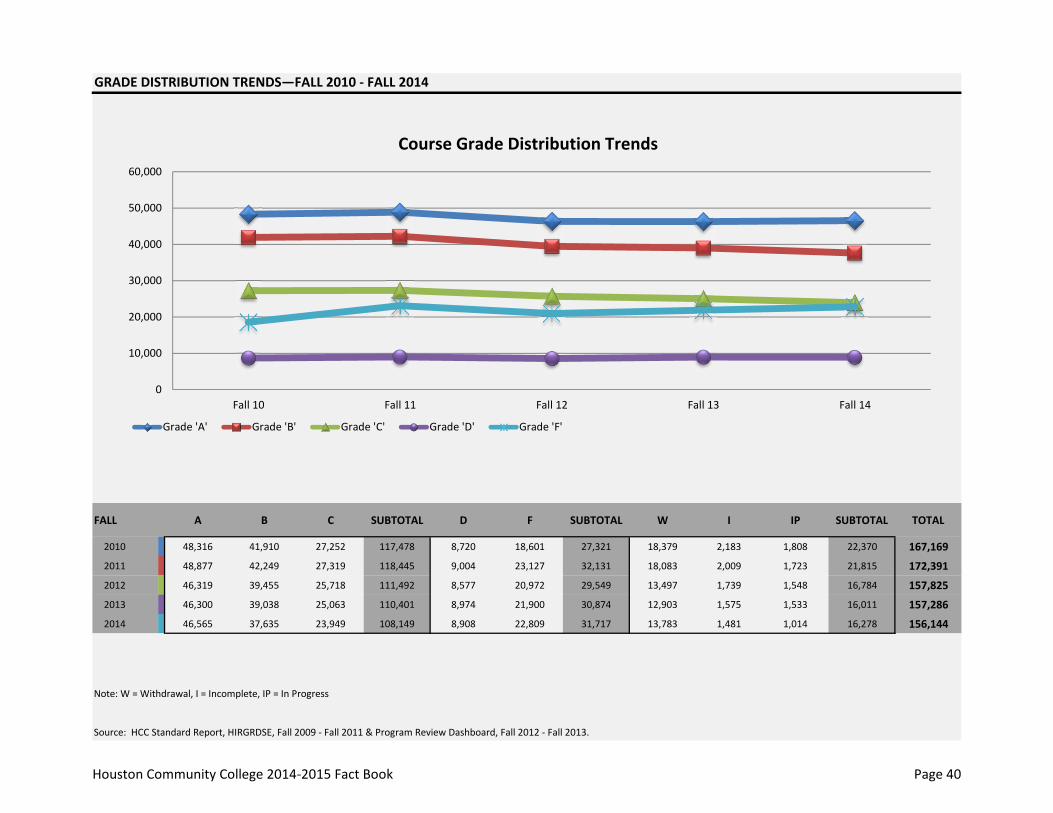
GRADE DISTRIBUTION TRENDS—FALL 2010 ‐ FALL 2014
FALL A B C SUBTOTAL D F SUBTOTAL W I IP SUBTOTAL TOTAL
2010 48,316 41,910 27,252 117,478 8,720 18,601 27,321 18,379 2,183 1,808 22,370 167,169
2011 48,877 42,249 27,319 118,445 9,004 23,127 32,131 18,083 2,009 1,723 21,815 172,391
2012 46,319 39,455 25,718 111,492 8,577 20,972 29,549 13,497 1,739 1,548 16,784 157,825
2013 46,300 39,038 25,063 110,401 8,974 21,900 30,874 12,903 1,575 1,533 16,011 157,286
2014 46,565 37,635 23,949 108,149 8,908 22,809 31,717 13,783 1,481 1,014 16,278 156,144
Note: W = Withdrawal, I = Incomplete, IP = In Progress
Source: HCC Standard Report, HIRGRDSE, Fall 2009 ‐ Fall 2011 & Program Review Dashboard, Fall 2012 ‐ Fall 2013.
Course Grade Distribution Trends
0
10,000
20,000
30,000
40,000
50,000
60,000
Fall 10 Fall 11 Fall 12 Fall 13 Fall 14
Grade 'A' Grade 'B' Grade 'C' Grade 'D' Grade 'F'
Houston Community College 2014‐2015 Fact Book Page 40
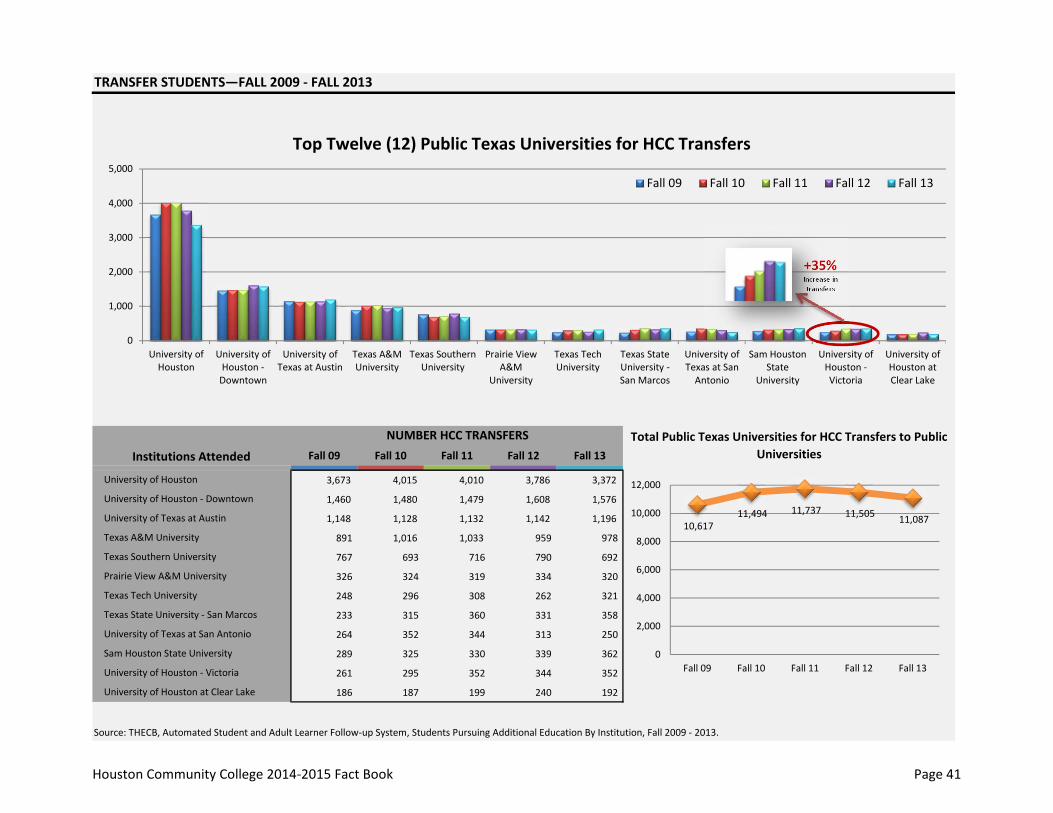
TRANSFER STUDENTS—FALL 2009 ‐ FALL 2013
Fall 09 Fall 10 Fall 11 Fall 12 Fall 13
3,673 4,015 4,010 3,786 3,372
1,460 1,480 1,479 1,608 1,576
1,148 1,128 1,132 1,142 1,196
891 1,016 1,033 959 978
767 693 716 790 692
326 324 319 334 320
248 296 308 262 321
233 315 360 331 358
264 352 344 313 250
289 325 330 339 362
261 295 352 344 352
186 187 199 240 192
Source: THECB, Automated Student and Adult Learner Follow‐up System, Students Pursuing Additional Education By Institution, Fall 2009 ‐ 2013.
Top Twelve (12) Public Texas Universities for HCC Transfers
Sam Houston State University
University of Houston ‐ Victoria
University of Houston at Clear Lake
Texas A&M University
Texas Southern University
Prairie View A&M University
Texas Tech University
Texas State University ‐ San Marcos
University of Texas at San Antonio
NUMBER HCC TRANSFERS
University of Houston
University of Houston ‐ Downtown
University of Texas at Austin
Total Public Texas Universities for HCC Transfers to Public UniversitiesInstitutions Attended
0
1,000
2,000
3,000
4,000
5,000
University ofHouston
University ofHouston ‐Downtown
University ofTexas at Austin
Texas A&MUniversity
Texas SouthernUniversity
Prairie ViewA&M
University
Texas TechUniversity
Texas StateUniversity ‐San Marcos
University ofTexas at SanAntonio
Sam HoustonState
University
University ofHouston ‐Victoria
University ofHouston atClear Lake
Fall 09 Fall 10 Fall 11 Fall 12 Fall 13
+35%Increase in transfers
10,617 11,494 11,737 11,505 11,087
0
2,000
4,000
6,000
8,000
10,000
12,000
Fall 09 Fall 10 Fall 11 Fall 12 Fall 13
Houston Community College 2014‐2015 Fact Book Page 41
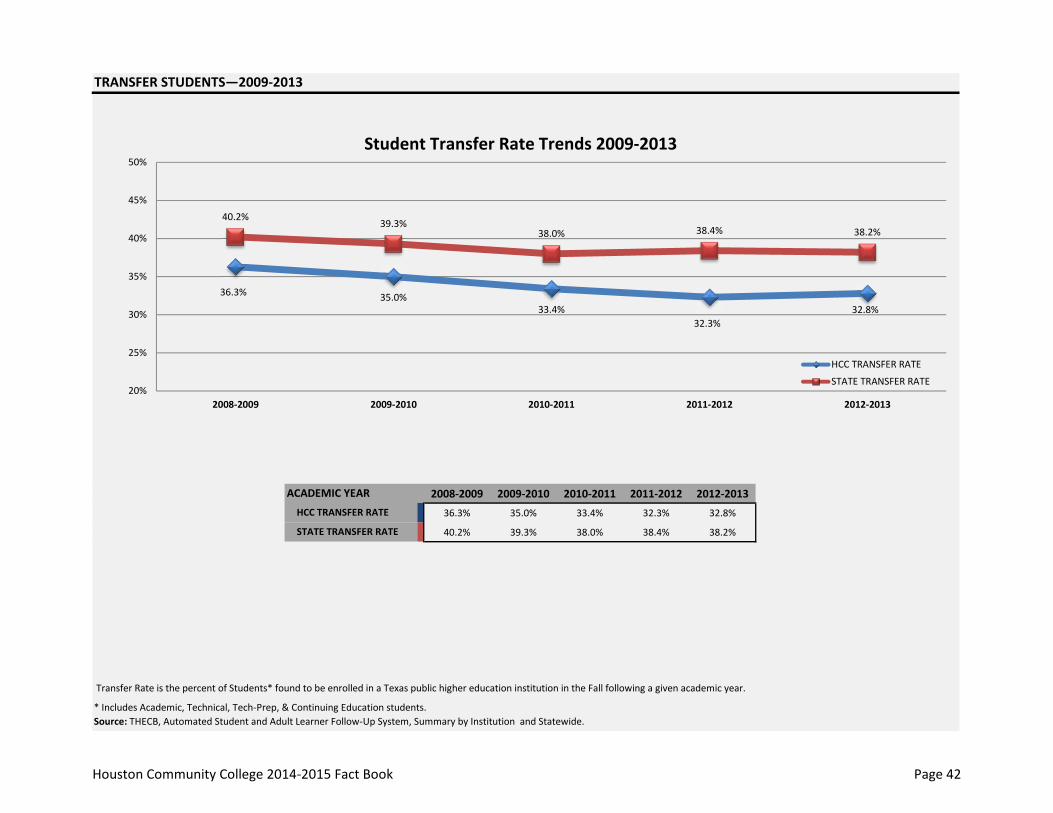
TRANSFER STUDENTS—2009‐2013
2008‐2009 2009‐2010 2010‐2011 2011‐2012 2012‐2013
36.3% 35.0% 33.4% 32.3% 32.8%
40.2% 39.3% 38.0% 38.4% 38.2%
Transfer Rate is the percent of Students* found to be enrolled in a Texas public higher education institution in the Fall following a given academic year.
* Includes Academic, Technical, Tech‐Prep, & Continuing Education students.Source: THECB, Automated Student and Adult Learner Follow‐Up System, Summary by Institution and Statewide.
Student Transfer Rate Trends 2009‐2013
HCC TRANSFER RATE
STATE TRANSFER RATE
ACADEMIC YEAR
36.3% 35.0%33.4%
32.3%32.8%
40.2%39.3%
38.0% 38.4% 38.2%
20%
25%
30%
35%
40%
45%
50%
2008‐2009 2009‐2010 2010‐2011 2011‐2012 2012‐2013
HCC TRANSFER RATE
STATE TRANSFER RATE
Houston Community College 2014‐2015 Fact Book Page 42
PERS
ONNEL PRO
FILE
Houston Community College 2014‐2015 Fact Book Page 43
PERSONNEL PROFILE
TOTAL FULL‐TIME EMPLOYEES—FALL 2010‐FALL 2014GENDER AND ETHNICITY 45
FULL‐TIME FACULTY—FALL 2010‐FALL 2014GENDER AND ETHNICITY 46
PART‐TIME FACULTY—FALL 2010‐FALL 2014GENDER AND ETHNICITY 47
FULL‐TIME ADMINISTRATION—FALL 2010‐FALL 2014GENDER AND ETHNICITY 48
FULL‐TIME SUPPORT STAFF—FALL 2010‐FALL 2014GENDER AND ETHNICITY 49
Houston Community College 2014‐2015 Fact Book Page 44
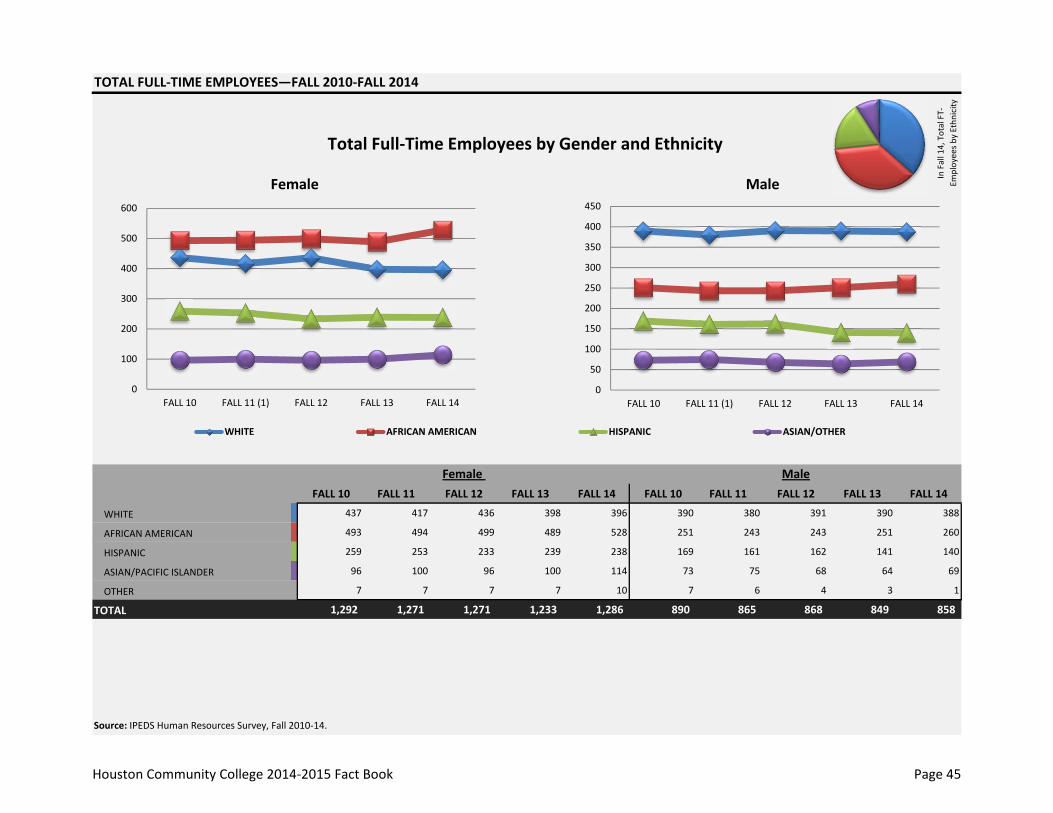
TOTAL FULL‐TIME EMPLOYEES—FALL 2010‐FALL 2014
FALL 10 FALL 11 FALL 12 FALL 13 FALL 14 FALL 10 FALL 11 FALL 12 FALL 13 FALL 14
WHITE 437 417 436 398 396 390 380 391 390 388
AFRICAN AMERICAN 493 494 499 489 528 251 243 243 251 260
HISPANIC 259 253 233 239 238 169 161 162 141 140
ASIAN/PACIFIC ISLANDER 96 100 96 100 114 73 75 68 64 69
OTHER 7 7 7 7 10 7 6 4 3 1
TOTAL 1,292 1,271 1,271 1,233 1,286 890 865 868 849 858
Source: IPEDS Human Resources Survey, Fall 2010‐14.
Female Male
Total Full‐Time Employees by Gender and Ethnicity
Female Male
In Fall 14, Total FT‐
Employees b
y Ethn
icity
0
100
200
300
400
500
600
FALL 10 FALL 11 (1) FALL 12 FALL 13 FALL 140
50
100
150
200
250
300
350
400
450
FALL 10 FALL 11 (1) FALL 12 FALL 13 FALL 14
WHITE AFRICAN AMERICAN HISPANIC ASIAN/OTHER
Houston Community College 2014‐2015 Fact Book Page 45

FULL‐TIME FACULTY—FALL 2010‐FALL 2014
FALL 10 FALL 11 FALL 12 FALL 13 FALL 14 FALL 10 FALL 11 FALL 12 FALL 13 FALL 14
WHITE 262 224 222 205 200 254 240 241 231 229
AFRICAN AMERICAN 119 108 98 96 95 97 77 77 80 83
HISPANIC 48 37 35 33 34 47 42 40 37 37
ASIAN/PACIFIC ISLANDER 46 45 42 44 51 30 30 28 26 27
OTHER 3 3 5 6 3 4 3 1 1 0
TOTAL 478 417 402 384 383 432 392 387 375 376
Source: IPEDS Human Resources Survey, Fall 2010‐14.
Female Male
MaleFemale
Full‐Time Faculty by Gender and Ethnicity
In Fall 14, Total FT‐Faculty
by
Ethnicity
0
50
100
150
200
250
300
FALL 10 FALL 11 (1) FALL 12 FALL 13 FALL 140
50
100
150
200
250
300
FALL 10 FALL 11 (1) FALL 12 FALL 13 FALL 14
WHITE AFRICAN AMERICAN HISPANIC ASIAN/OTHER
Houston Community College 2014‐2015 Fact Book Page 46

PART‐TIME FACULTY—FALL 2010 ‐ FALL 2014
FALL 10 FALL 11 FALL 12 (1) FALL 13 FALL 14 FALL 10 FALL 11 FALL 12 (1) FALL 13 FALL 14
WHITE 607 592 363 360 350 722 688 445 431 411
AFRICAN AMERICAN 642 613 368 396 377 356 344 215 209 217
HISPANIC 144 126 65 76 69 155 148 85 76 72
ASIAN/PACIFIC ISLANDER 82 90 79 80 91 82 98 62 74 80
OTHER 73 55 21 22 14 58 27 12 18 6
TOTAL 1,548 1,476 896 934 901 1,373 1,305 819 808 786
(1) Prior to Fall 2012, tutors were erroneously classified as part‐time faculty.
Source: IPEDS Human Resources Survey, Fall 2010‐14.
Female Male
Female Male
Part‐Time Faculty by Gender and Ethnicity
In Fall 14, Total PT‐
Faculty
by Ethn
icity
‐
190
380
570
760
Fall 10 Fall 11 FALL 12 (1) FALL 13 FALL 14 ‐
190
380
570
760
Fall 10 Fall 11 FALL 12 (1) FALL 13 FALL 14
WHITE AFRICAN AMERICAN HISPANIC ASIAN/OTHER
Houston Community College 2014‐2015 Fact Book Page 47
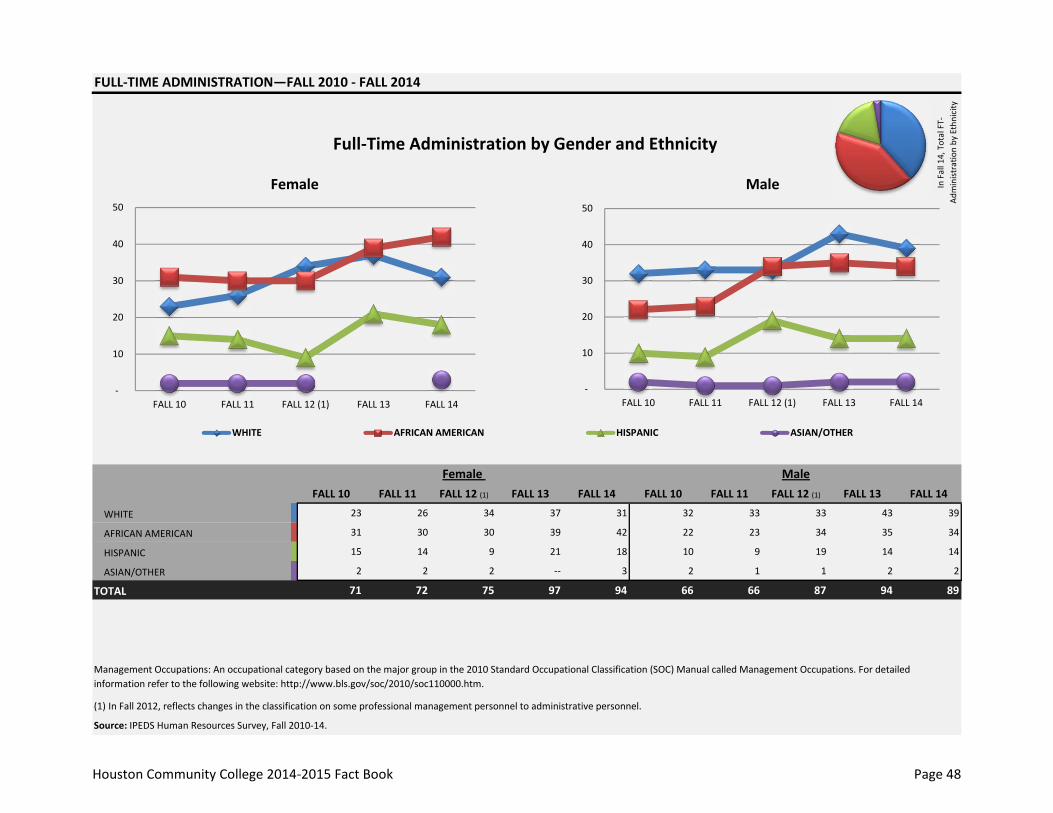
FULL‐TIME ADMINISTRATION—FALL 2010 ‐ FALL 2014
FALL 10 FALL 11 FALL 12 (1) FALL 13 FALL 14 FALL 10 FALL 11 FALL 12 (1) FALL 13 FALL 14
WHITE 23 26 34 37 31 32 33 33 43 39
AFRICAN AMERICAN 31 30 30 39 42 22 23 34 35 34
HISPANIC 15 14 9 21 18 10 9 19 14 14
ASIAN/OTHER 2 2 2 ‐‐ 3 2 1 1 2 2
TOTAL 71 72 75 97 94 66 66 87 94 89
(1) In Fall 2012, reflects changes in the classification on some professional management personnel to administrative personnel.
Source: IPEDS Human Resources Survey, Fall 2010‐14.
Full‐Time Administration by Gender and Ethnicity
In Fall 14, Total FT‐
Administratio
n by
Ethnicity
Management Occupations: An occupational category based on the major group in the 2010 Standard Occupational Classification (SOC) Manual called Management Occupations. For detailed information refer to the following website: http://www.bls.gov/soc/2010/soc110000.htm.
Female Male
Female Male
‐
10
20
30
40
50
FALL 10 FALL 11 FALL 12 (1) FALL 13 FALL 14 ‐
10
20
30
40
50
FALL 10 FALL 11 FALL 12 (1) FALL 13 FALL 14
WHITE AFRICAN AMERICAN HISPANIC ASIAN/OTHER
Houston Community College 2014‐2015 Fact Book Page 48

FULL‐TIME SUPPORT STAFF—FALL 2010 ‐ FALL 2014
FALL 10 FALL 11 FALL 12 FALL 13 FALL 14 FALL 10 FALL 11 FALL 12 FALL 13 FALL 14
WHITE 152 167 180 156 165 104 107 117 116 120
AFRICAN AMERICAN 343 356 371 354 391 132 143 132 136 143
HISPANIC 196 202 189 185 186 112 110 103 90 89
ASIAN/PACIFIC ISLANDER 48 53 52 56 60 41 44 39 36 40
OTHER 4 4 2 1 7 3 3 3 2 1
TOTAL 743 782 794 752 809 392 407 394 380 393
Source: IPEDS Human Resources Survey, Fall 2010‐14.
Female Male
Female Male
Full‐Time Support Staff by Gender and Ethnicity
In Fall 14, Total FT‐Supp
ort
Staff b
y Ethn
icity
‐
100
200
300
400
500
FALL 10 FALL 11 FALL 12 FALL 13 FALL 14 ‐
100
200
300
400
500
FALL 10 FALL 11 FALL 12 FALL 13 FALL 14
WHITE AFRICAN AMERICAN HISPANIC ASIAN/OTHER
Houston Community College 2014‐2015 Fact Book Page 49
FINAN
CIAL
INFO
RMAT
ION
Houston Community College 2014‐2015 Fact Book Page 50

FINANCIAL INFORMATION
APPROVED BUDGET UNRESTRICTED REVENUES AND EXPENDITURES (OPERATING FUND)—2014‐2015DISTRIBUTION OF REVENUES 52DISTRIBUTION OF EXPENDITURES 52
TAX RATE—2014‐2015 52
AUDITED REVENUES, EXPENDITURES, ALL FUNDS—2013‐2014DISTRIBUTION OF REVENUES 53DISTRIBUTION OF EXPENDITURES 53
TUITION AND FEES 54
FINANCIAL AID AWARDSSTUDENTS RECEIVING FINANCIAL AID AWARDS 55AMOUNT DISBURSED TO FINANCIAL AID STUDENTS 56
APPROVED CONSTRUCTION PROJECTS —2014‐2015 57
Houston Community College 2014‐2015 Fact Book Page 51
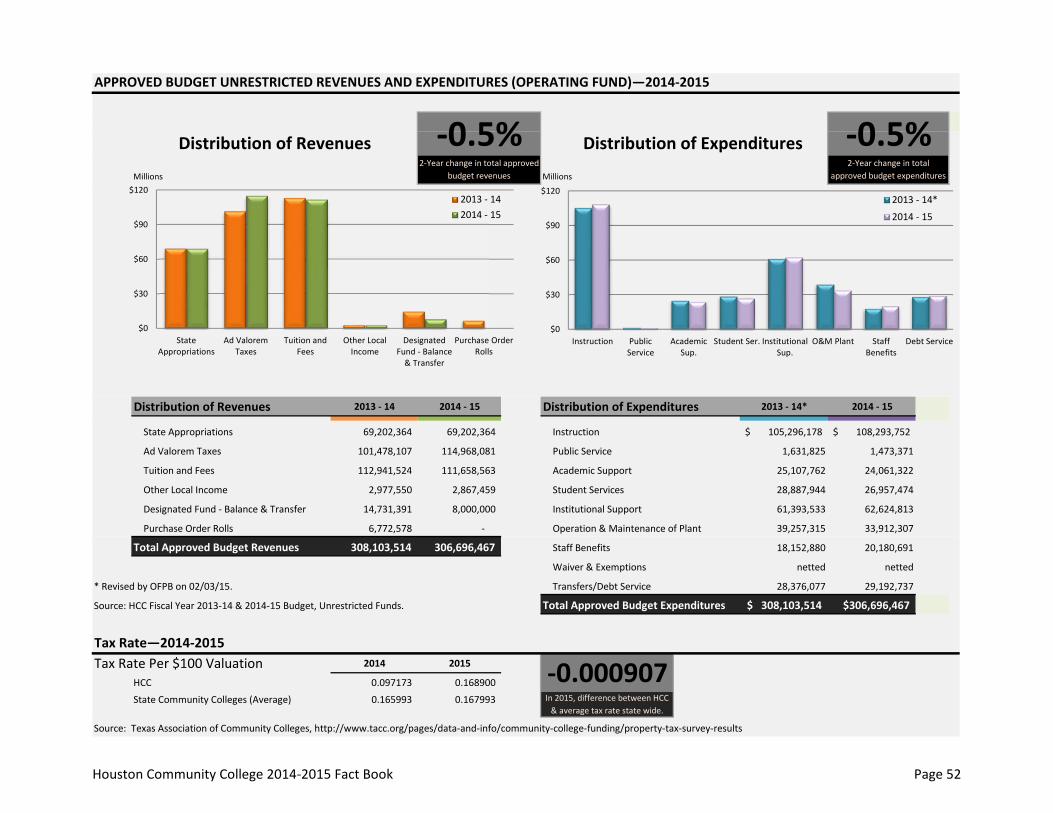
APPROVED BUDGET UNRESTRICTED REVENUES AND EXPENDITURES (OPERATING FUND)—2014‐2015
Millions Millions
Distribution of Revenues 2013 ‐ 14 2014 ‐ 15 Distribution of Expenditures 2013 ‐ 14* 2014 ‐ 15
State Appropriations 69,202,364 69,202,364 Instruction 105,296,178$ 108,293,752$
Ad Valorem Taxes 101,478,107 114,968,081 Public Service 1,631,825 1,473,371
Tuition and Fees 112,941,524 111,658,563 Academic Support 25,107,762 24,061,322
Other Local Income 2,977,550 2,867,459 Student Services 28,887,944 26,957,474
Designated Fund ‐ Balance & Transfer 14,731,391 8,000,000 Institutional Support 61,393,533 62,624,813
Purchase Order Rolls 6,772,578 ‐ Operation & Maintenance of Plant 39,257,315 33,912,307
Total Approved Budget Revenues 308,103,514 306,696,467 Staff Benefits 18,152,880 20,180,691
Waiver & Exemptions netted netted
* Revised by OFPB on 02/03/15. Transfers/Debt Service 28,376,077 29,192,737
Source: HCC Fiscal Year 2013‐14 & 2014‐15 Budget, Unrestricted Funds. Total Approved Budget Expenditures 308,103,514$ $306,696,467
Tax Rate—2014‐2015Tax Rate Per $100 Valuation 2014 2015
HCC 0.097173 0.168900
State Community Colleges (Average) 0.165993 0.167993
Source: Texas Association of Community Colleges, http://www.tacc.org/pages/data‐and‐info/community‐college‐funding/property‐tax‐survey‐results
‐0.5%2‐Year change in total
approved budget expenditures
In 2015, difference between HCC & average tax rate state wide.
Distribution of ExpendituresDistribution of Revenues ‐0.5%
‐0.000907
2‐Year change in total approved budget revenues
$0
$30
$60
$90
$120
StateAppropriations
Ad ValoremTaxes
Tuition andFees
Other LocalIncome
DesignatedFund ‐ Balance& Transfer
Purchase OrderRolls
2013 ‐ 142014 ‐ 15
$0
$30
$60
$90
$120
Instruction PublicService
AcademicSup.
Student Ser. InstitutionalSup.
O&M Plant StaffBenefits
Debt Service
2013 ‐ 14*
2014 ‐ 15
Houston Community College 2014‐2015 Fact Book Page 52
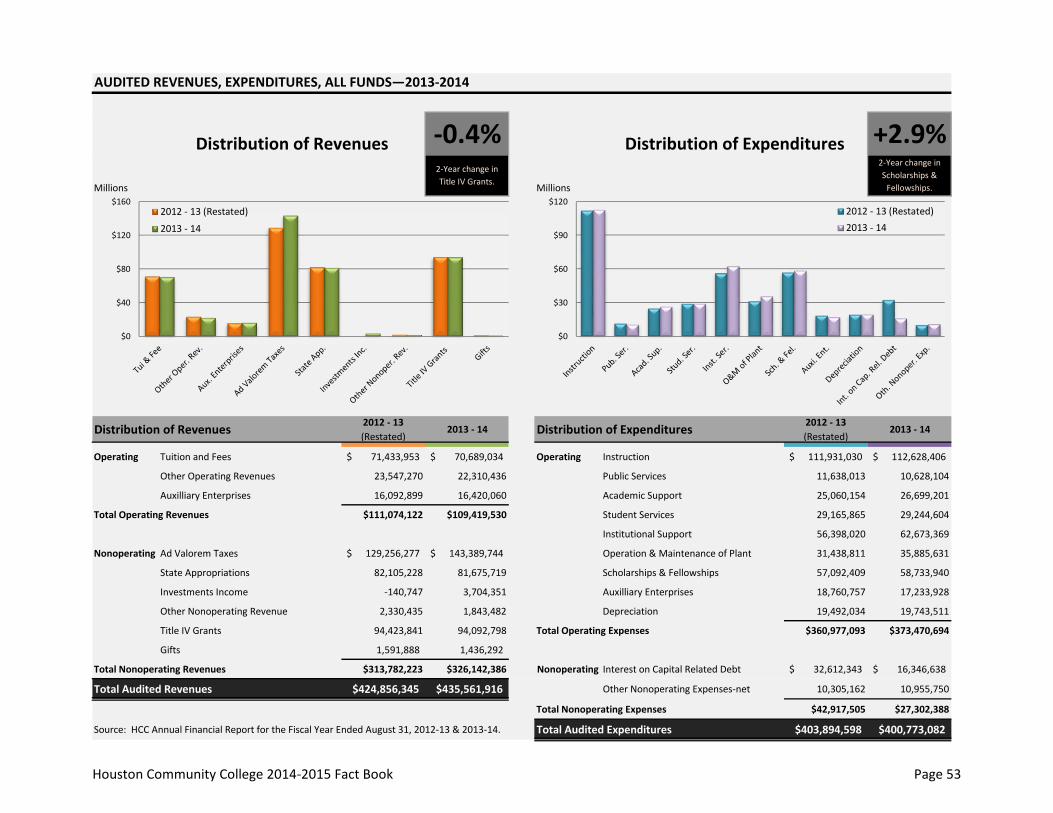
AUDITED REVENUES, EXPENDITURES, ALL FUNDS—2013‐2014
Millions Millions
Distribution of Revenues 2012 ‐ 13 (Restated)
2013 ‐ 14 Distribution of Expenditures 2012 ‐ 13 (Restated)
2013 ‐ 14
Operating Tuition and Fees 71,433,953$ 70,689,034$ Operating Instruction 111,931,030$ 112,628,406$
Other Operating Revenues 23,547,270 22,310,436 Public Services 11,638,013 10,628,104
Auxilliary Enterprises 16,092,899 16,420,060 Academic Support 25,060,154 26,699,201
Total Operating Revenues $111,074,122 $109,419,530 Student Services 29,165,865 29,244,604
Institutional Support 56,398,020 62,673,369
Nonoperating Ad Valorem Taxes 129,256,277$ 143,389,744$ Operation & Maintenance of Plant 31,438,811 35,885,631
State Appropriations 82,105,228 81,675,719 Scholarships & Fellowships 57,092,409 58,733,940
Investments Income ‐140,747 3,704,351 Auxilliary Enterprises 18,760,757 17,233,928
Other Nonoperating Revenue 2,330,435 1,843,482 Depreciation 19,492,034 19,743,511
Title IV Grants 94,423,841 94,092,798 Total Operating Expenses $360,977,093 $373,470,694
Gifts 1,591,888 1,436,292
Total Nonoperating Revenues $313,782,223 $326,142,386 Nonoperating Interest on Capital Related Debt 32,612,343$ 16,346,638$
Total Audited Revenues $424,856,345 $435,561,916 Other Nonoperating Expenses‐net 10,305,162 10,955,750
Total Nonoperating Expenses $42,917,505 $27,302,388
Source: HCC Annual Financial Report for the Fiscal Year Ended August 31, 2012‐13 & 2013‐14. Total Audited Expenditures $403,894,598 $400,773,082
+2.9%Distribution of Expenditures‐0.4%Distribution of Revenues2‐Year change in Title IV Grants.
2‐Year change in Scholarships & Fellowships.
$0
$40
$80
$120
$1602012 ‐ 13 (Restated)
2013 ‐ 14
$0
$30
$60
$90
$1202012 ‐ 13 (Restated)2013 ‐ 14
Houston Community College 2014‐2015 Fact Book Page 53
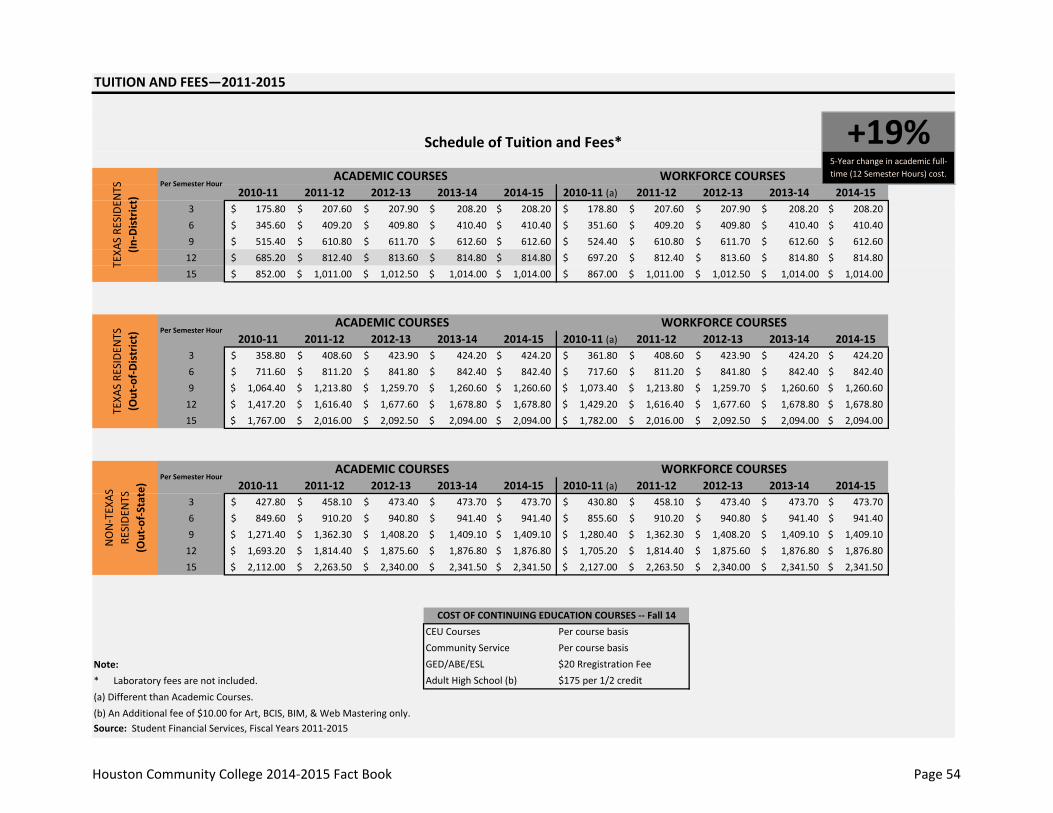
TUITION AND FEES—2011‐2015
2010‐11 2011‐12 2012‐13 2013‐14 2014‐15 2010‐11 (a) 2011‐12 2012‐13 2013‐14 2014‐153 175.80$ 207.60$ 207.90$ $ 208.20 208.20$ 178.80$ 207.60$ 207.90$ $ 208.20 208.20$ 6 345.60$ 409.20$ 409.80$ $ 410.40 410.40$ 351.60$ 409.20$ 409.80$ $ 410.40 410.40$ 9 515.40$ 610.80$ 611.70$ $ 612.60 612.60$ 524.40$ 610.80$ 611.70$ $ 612.60 612.60$ 12 685.20$ 812.40$ 813.60$ $ 814.80 814.80$ 697.20$ 812.40$ 813.60$ $ 814.80 814.80$ 15 852.00$ 1,011.00$ 1,012.50$ $ 1,014.00 1,014.00$ 867.00$ 1,011.00$ 1,012.50$ $ 1,014.00 1,014.00$
2010‐11 2011‐12 2012‐13 2013‐14 2014‐15 2010‐11 (a) 2011‐12 2012‐13 2013‐14 2014‐153 358.80$ 408.60$ 423.90$ $ 424.20 424.20$ 361.80$ 408.60$ 423.90$ $ 424.20 424.20$ 6 711.60$ 811.20$ 841.80$ $ 842.40 842.40$ 717.60$ 811.20$ 841.80$ $ 842.40 842.40$ 9 1,064.40$ 1,213.80$ 1,259.70$ $ 1,260.60 1,260.60$ 1,073.40$ 1,213.80$ 1,259.70$ $ 1,260.60 1,260.60$ 12 1,417.20$ 1,616.40$ 1,677.60$ $ 1,678.80 1,678.80$ 1,429.20$ 1,616.40$ 1,677.60$ $ 1,678.80 1,678.80$ 15 1,767.00$ 2,016.00$ 2,092.50$ $ 2,094.00 2,094.00$ 1,782.00$ 2,016.00$ 2,092.50$ $ 2,094.00 2,094.00$
2010‐11 2011‐12 2012‐13 2013‐14 2014‐15 2010‐11 (a) 2011‐12 2012‐13 2013‐14 2014‐153 427.80$ 458.10$ 473.40$ $ 473.70 473.70$ 430.80$ 458.10$ 473.40$ $ 473.70 473.70$ 6 849.60$ 910.20$ 940.80$ $ 941.40 941.40$ 855.60$ 910.20$ 940.80$ $ 941.40 941.40$ 9 1,271.40$ 1,362.30$ 1,408.20$ $ 1,409.10 1,409.10$ 1,280.40$ 1,362.30$ 1,408.20$ $ 1,409.10 1,409.10$ 12 1,693.20$ 1,814.40$ 1,875.60$ $ 1,876.80 1,876.80$ 1,705.20$ 1,814.40$ 1,875.60$ $ 1,876.80 1,876.80$ 15 2,112.00$ 2,263.50$ 2,340.00$ $ 2,341.50 2,341.50$ 2,127.00$ 2,263.50$ 2,340.00$ $ 2,341.50 2,341.50$
Note:* Laboratory fees are not included.(a) Different than Academic Courses.(b) An Additional fee of $10.00 for Art, BCIS, BIM, & Web Mastering only.Source: Student Financial Services, Fiscal Years 2011‐2015.
Schedule of Tuition and Fees*
WORKFORCE COURSES
NON‐TEXAS
RE
SIDE
NTS
(Out‐of‐State)
Per Semester HourACADEMIC COURSES WORKFORCE COURSES
+19%5‐Year change in academic full‐time (12 Semester Hours) cost.
TEXA
S RE
SIDE
NTS
(In‐District)
TEXA
S RE
SIDE
NTS
(Out‐of‐District) Per Semester Hour
ACADEMIC COURSES WORKFORCE COURSES
Per Semester HourACADEMIC COURSES
Adult High School (b) $175 per 1/2 credit
COST OF CONTINUING EDUCATION COURSES ‐‐ Fall 14CEU Courses Per course basisCommunity Service Per course basisGED/ABE/ESL $20 Rregistration Fee
Houston Community College 2014‐2015 Fact Book Page 54
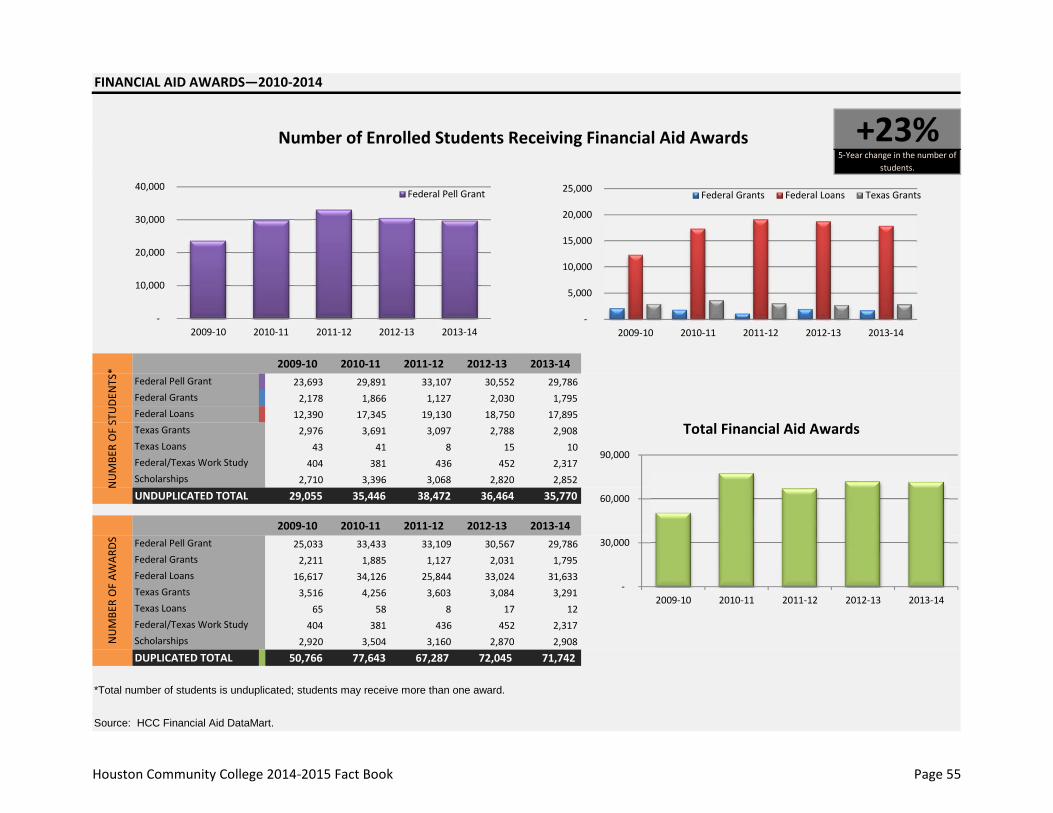
FINANCIAL AID AWARDS—2010‐2014
2009‐10 2010‐11 2011‐12 2012‐13 2013‐1423,693 29,891 33,107 30,552 29,786 2,178 1,866 1,127 2,030 1,795 12,390 17,345 19,130 18,750 17,895 2,976 3,691 3,097 2,788 2,908
43 41 8 15 10 404 381 436 452 2,317
2,710 3,396 3,068 2,820 2,852 29,055 35,446 38,472 36,464 35,770
2009‐10 2010‐11 2011‐12 2012‐13 2013‐1425,033 33,433 33,109 30,567 29,786 2,211 1,885 1,127 2,031 1,795 16,617 34,126 25,844 33,024 31,633 3,516 4,256 3,603 3,084 3,291
65 58 8 17 12 404 381 436 452 2,317
2,920 3,504 3,160 2,870 2,908 50,766 77,643 67,287 72,045 71,742
*Total number of students is unduplicated; students may receive more than one award.
Source: HCC Financial Aid DataMart.
Texas Grants
Federal Pell Grant
UNDUPLICATED TOTAL
Federal Pell GrantFederal GrantsFederal Loans
NUMBE
R OF STUDE
NTS*
NUMBE
R OF AW
ARDS
+23%5‐Year change in the number of
students.
Number of Enrolled Students Receiving Financial Aid Awards
Federal/Texas Work Study
Total Financial Aid Awards
Federal GrantsFederal LoansTexas GrantsTexas Loans
Texas LoansFederal/Texas Work StudyScholarships
Scholarships
DUPLICATED TOTAL
‐
30,000
60,000
90,000
2009‐10 2010‐11 2011‐12 2012‐13 2013‐14
‐
10,000
20,000
30,000
40,000
2009‐10 2010‐11 2011‐12 2012‐13 2013‐14
Federal Pell Grant
‐
5,000
10,000
15,000
20,000
25,000
2009‐10 2010‐11 2011‐12 2012‐13 2013‐14
Federal Grants Federal Loans Texas Grants
Houston Community College 2014‐2015 Fact Book Page 55

FINANCIAL AID AWARDS—2010‐2014
2009‐10 2010‐11 2011‐12 2012‐13 2013‐14 TOTAL AMOUNT DISBURSED73,707,201$ 94,669,181$ $ 101,090,293 $ 93,144,848 $ 92,715,529 1,873,169 1,669,415 1,227,601 1,798,900 1,600,879 33,127,059 95,769,522 82,733,894 108,421,188 110,127,249 4,097,563 5,099,104 4,679,695 4,734,393 5,718,904
34,980 31,277 41,785 54,534 17,578 n/a n/a n/a n/a n/a n/a n/a n/a n/a n/a
2,421,632 4,773,225 4,565,712 3,838,735 3,799,569 TOTAL 115,261,604$ 202,011,724$ $ 194,338,980 $ 211,992,598 $ 213,979,708
Source: HCC Financial Aid DataMart.
$99 Million Amount Disbursed to Financial Aid Enrolled StudentsIncrease in the total amount disbursed,
when compared to Yr 2009‐10.
AMOUNT DISBURSED
Federal Pell GrantFederal GrantsFederal LoansTexas GrantsTexas LoansFederal Work StudyTexas Work StudyScholarships
$‐
$30,000,000
$60,000,000
$90,000,000
$120,000,000
2009‐10 2010‐11 2011‐12 2012‐13 2013‐14
Federal Pell Grant Federal Loans Texas Grants
‐
60
120
180
240
2009‐10 2010‐11 2011‐12 2012‐13 2013‐14
Millions
Houston Community College 2014‐2015 Fact Book Page 56
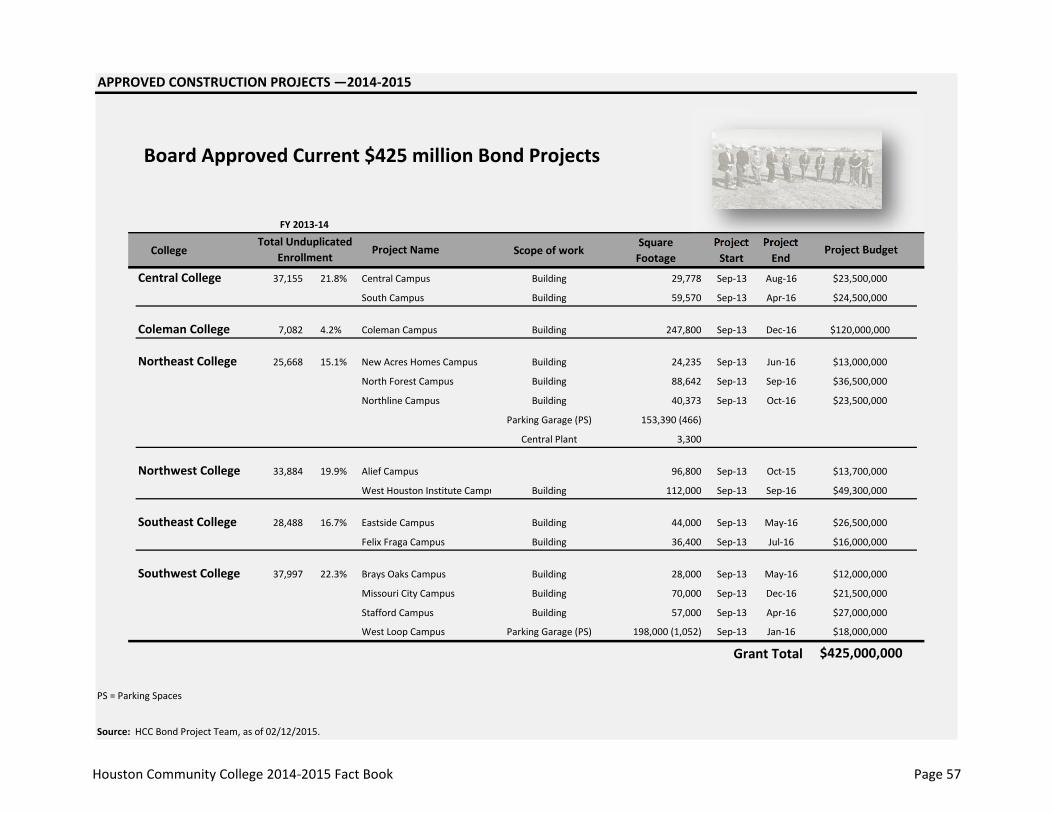
APPROVED CONSTRUCTION PROJECTS —2014‐2015
College Scope of workSquare Footage
Project Start
Project End
Central College 37,155 21.8% Central Campus Building 29,778 Sep‐13 Aug‐16
South Campus Building 59,570 Sep‐13 Apr‐16
Coleman College 7,082 4.2% Coleman Campus Building 247,800 Sep‐13 Dec‐16
Northeast College 25,668 15.1% New Acres Homes Campus Building 24,235 Sep‐13 Jun‐16
North Forest Campus Building 88,642 Sep‐13 Sep‐16
Northline Campus Building 40,373 Sep‐13 Oct‐16
Parking Garage (PS) 153,390 (466)
Central Plant 3,300
Northwest College 33,884 19.9% Alief Campus 96,800 Sep‐13 Oct‐15
West Houston Institute Campu Building 112,000 Sep‐13 Sep‐16
Southeast College 28,488 16.7% Eastside Campus Building 44,000 Sep‐13 May‐16
Felix Fraga Campus Building 36,400 Sep‐13 Jul‐16
Southwest College 37,997 22.3% Brays Oaks Campus Building 28,000 Sep‐13 May‐16
Missouri City Campus Building 70,000 Sep‐13 Dec‐16
Stafford Campus Building 57,000 Sep‐13 Apr‐16
West Loop Campus Parking Garage (PS) 198,000 (1,052) Sep‐13 Jan‐16
Grant Total
PS = Parking Spaces
Source: HCC Bond Project Team, as of 02/12/2015.
$425,000,000
$23,500,000
FY 2013‐14
Total Unduplicated Enrollment
Project Name Project Budget
$23,500,000
$24,500,000
$120,000,000
$13,000,000
$36,500,000
$27,000,000
$18,000,000
Board Approved Current $425 million Bond Projects
$21,500,000
$13,700,000
$49,300,000
$26,500,000
$16,000,000
$12,000,000
Houston Community College 2014‐2015 Fact Book Page 57
CHANCELLOR: Dr. Cesar Maldonado
HCC is committed to a workplace and educational environment free of discrimination and harassment based upon race, color, religion, age, sex, gender
expression, gender identity,national origin, disability, veteran status, or sexual
orientation.
Glenda Barrett, Research Technician
Mario Heredia, Director of Research Support ServicesRaymond Golitko, Research Associate II
HOUSTON COMMUNITY COLLEGE3100 Main StreetHouston TX, 77002
www.hccs.edu/
Office of Institutional Research
Martha Oburn, Ph.D., Executive Director of Institutional Research and Innovationwww.hccs.edu/oir
Damian Garza, Office Manager
Ali Tipu, Research Associate I
Margaret Drain, Research Associate IIHazel Milan, Research Analyst II
HCC BOARD OF TRUSTEES: Zeph Capo, Chair, District I Dave Wilson, District I Dr. Adriana Tamez, Secretary, District III Carroll G. Robinson, District IV Robert Glaser, Vice Chair, District V Sandie Mullins, District VI Neeta Sane, District VII Eva L. Loredo, District VIII Christopher W. Oliver, District IX