Embed Size (px)
Citation preview

© ePlus inc. Confidential and Proprietary. E X C E L L E N C E T H R O U G H E X P E R I E N C E© ePlus inc. Confidential and Proprietary.
E X C E L L E N C E T H R O U G H E X P E R I E N C E
ePlus
Investor PresentationJune 2014

© ePlus inc. Confidential and Proprietary. E X C E L L E N C E T H R O U G H E X P E R I E N C E
Safe Harbor StatementStatements in this presentation, which are not historical facts, may be deemed to be "forward‐looking statements.” Actual andanticipated future results may vary due to certain risks and uncertainties, including, without limitation; possible adverse effectsresulting from the recent uncertainty in the economic environment and general slowdown of the U.S. economy such as our currentand potential customers delaying or reducing technology purchases, increasing credit risk associated with our customers and vendors,reduction of vendor incentive programs, the possibility of additional goodwill impairment charges, and restrictions on our access tocapital necessary to fund our operations; our ability to implement comprehensive plans to achieve customer account coverage, costcontainment, asset rationalization, systems integration and other key strategies; our ability to secure our electronic and otherconfidential information; changes to our senior management team; the existence of demand for, and acceptance of, our products andservices; significant changes in accounting standards including changes to the financial reporting of leases which could impact thedemand for our leasing services, or misclassification of products and services we sell resulting in the misapplication of revenuerecognition policies; our ability to adapt to changes in the IT industry and/or rapid change in product standards; our ability to hire andretain sufficient personnel; our ability to protect our intellectual property; our ability to raise capital and obtain non‐recoursefinancing for our transactions; our ability to realize our investment in leased equipment; our ability to reserve adequately for creditlosses; our ability to successfully integrate acquired businesses; significant adverse changes in, reductions in, or losses of relationshipswith major customers or vendors; the possibility of defects in our products or catalog content data; and other risks or uncertaintiesdetailed in the Company’s Annual Report on Form 10‐K for the fiscal year ended March 31, 2014 and other periodic filings with theSecurities and Exchange Commission and available at the SEC’s website at http://www.sec.gov.
We wish to caution you that these factors could affect our financial performance and could cause actual results for future periods todiffer materially from any opinions or statements expressed with respect to future periods in any current statements. All informationset forth in this presentation is current as of the date of this presentation and ePlus undertakes no duty or obligation to update thisinformation.
All statements in this report attributable to Gartner represent ePlus’ interpretation of data, research opinion or viewpoints publishedas part of a syndicated subscription service by Gartner, Inc., and have not been reviewed by Gartner. Each Gartner publication speaksas of its original publication date (and not as of the date of this presentation. The opinions expressed in Gartner publications are notrepresentations of fact, and are subject to change without notice.
2

© ePlus inc. Confidential and Proprietary. E X C E L L E N C E T H R O U G H E X P E R I E N C E
ePlus at a Glance
+ Leading provider of technology solutions focused on cloud, data center, security, networking and collaboration solutions
+ Technology partners include Cisco, EMC, HP, NetApp and VMware
+ FY14 revenue: $1.1 billion
18% CAGR FY10‐FY14
+ FY 14 earnings per share: $4.37
31% CAGR FY10‐FY14
+ Headquarters: Herndon, Virginia
+ Presence in 21 states
+ 934 employees
Note: Fiscal year ends March 31 1 See appendix for operating income calculation
3

© ePlus inc. Confidential and Proprietary. E X C E L L E N C E T H R O U G H E X P E R I E N C E
Experienced Leadership Team with Strong Alignment of Interest
Years with ePlus:Years of experience: 29
8
Mark Marron Chief Operating Officer and
President of ePlus Technology, inc.
43
19
Phil NortonChairman, Chief Executive Officer
and President
23
15
Elaine MarionChief Financial Officer
Years with ePlus:Years of experience:
Steve Mencarini Senior Vice President of Business Operations
16
33
Mark MelvinChief Technology Officer
8
31
Erica StoeckerGeneral Counsel
13
18
26
22
Kley ParkhurstSenior Vice President, Corporate Development
30
6
Dan FarrellSenior Vice President of National
Professional Services
+ Stable senior management team; compensation aligned with growth objectives
4

© ePlus inc. Confidential and Proprietary. E X C E L L E N C E T H R O U G H E X P E R I E N C E
Breadth of Products + Vendor Focus + Service Capability = High Value AddBreadth of Products + Vendor Focus + Service Capability = High Value Add
ePlus is Well Positioned in the Market
Select large‐scaleIT platforms
Small, regional VARs
Widening gap
‐ Narrower solutions focus
‐ Regionally oriented‐ Limited Scale
+ Broad product/service offering+ Deep technical expertise+ Meaningful vendor relationships+ Top vendor certifications+ National U.S. footprint
}
5

© ePlus inc. Confidential and Proprietary. E X C E L L E N C E T H R O U G H E X P E R I E N C E
Investment Highlights
6
+ Track record of strong financial performance and industry‐leading margins+ Track record of strong financial performance and industry‐leading margins
+ Increasingly complex IT environment drives demand for sophisticated, broad‐based solutions+ Increasingly complex IT environment drives demand for sophisticated, broad‐based solutions
+ Differentiated business model serving entire IT lifecycle, with focus on high‐end products and services+ Differentiated business model serving entire IT lifecycle, with focus on high‐end products and services
+ Established relationships with key and emerging vendors+ Established relationships with key and emerging vendors
+ Diversified customer base across a broad range of end markets + Diversified customer base across a broad range of end markets
+ Investing to grow in excess of overall IT market and achieve significant growth in services revenues+ Investing to grow in excess of overall IT market and achieve significant growth in services revenues
© ePlus inc. Confidential and Proprietary. E X C E L L E N C E T H R O U G H E X P E R I E N C E
TodayToday2000s2000s
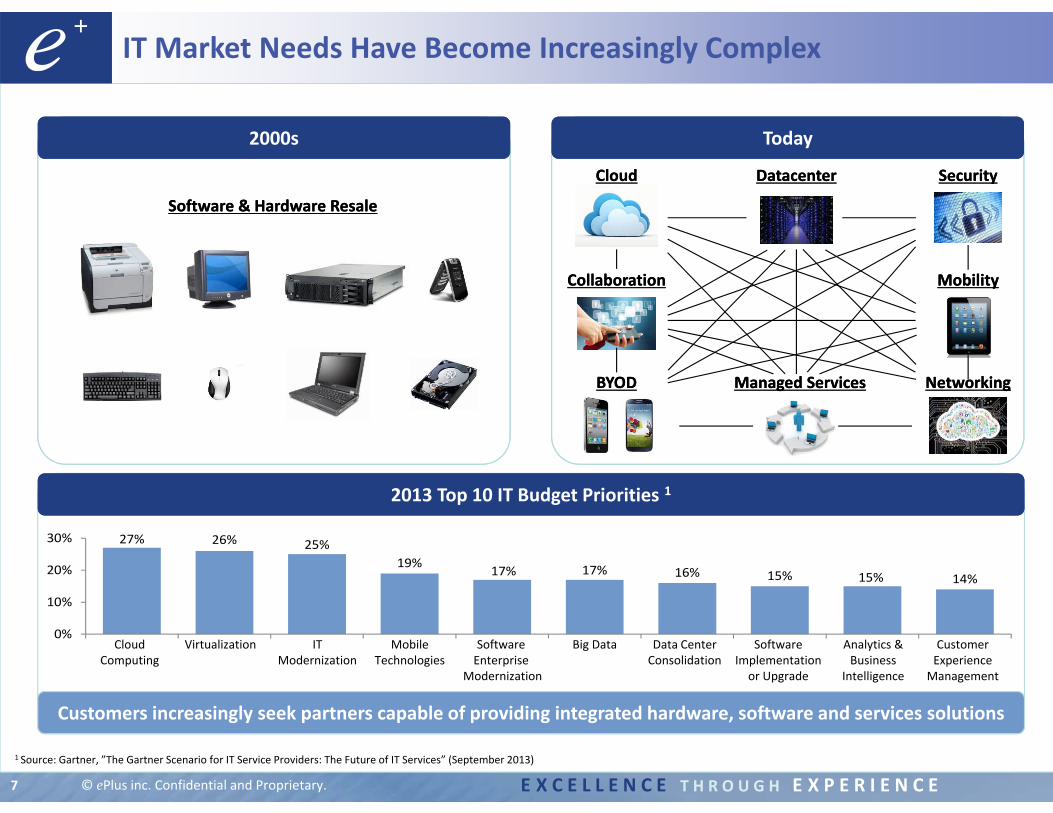
IT Market Needs Have Become Increasingly Complex
Software & Hardware ResaleSoftware & Hardware Resale
CloudCloud DatacenterDatacenter Security Security
MobilityMobilityCollaborationCollaboration
Managed ServicesManaged Services
Cloud Computing
Virtualization IT Modernization
Mobile Technologies
SoftwareEnterprise
Modernization
Big Data Data Center Consolidation
Software Implementation or Upgrade
Analytics & Business
Intelligence
Customer Experience Management
1 Source: Gartner, ”The Gartner Scenario for IT Service Providers: The Future of IT Services” (September 2013)
27% 26% 25%19% 17% 17% 16% 15% 15% 14%
0%
10%
20%
30%
NetworkingNetworkingBYODBYOD
2013 Top 10 IT Budget Priorities 12013 Top 10 IT Budget Priorities 1
Customers increasingly seek partners capable of providing integrated hardware, software and services solutions
7

© ePlus inc. Confidential and Proprietary. E X C E L L E N C E T H R O U G H E X P E R I E N C E
Expectations for U.S. IT Spending 1Expectations for U.S. IT Spending 1 Expected Growth for Complex IT Solutions in the U.S. 2Expected Growth for Complex IT Solutions in the U.S. 2
$1,035 $1,064 $1,110 $1,153 $1,197 $1,242
2012 2013E 2014E 2015E 2016E 2017E
($ in billions)
Total Cost of OwnershipTotal Cost of Ownership
Business EfficiencyBusiness Efficiency
Business Transformation
Business Transformation
Emerging TechnologiesEmerging
TechnologiesBring Your Own DeviceBring Your Own Device
Focus on UserExperience
Focus on UserExperience
Trends Driving IT Spending Growth
Large TAM with Solid Fundamentals
Market 2012 2017E CAGR
Mobility $2.4 $11.7 37%
Cloud $19.1 $49.3 21%
Security $24.6 $36.0 8%
ManagedServices $40.8 $53.7 6%
Virtualization $2.1 $2.8 6%
Total $88.9 $153.5 12%
($ in billions)
1Gartner, “Market Databook, 1Q14 Update,” End‐User Spending on IT Products and Services (U.S.)2Gartner, “Forecast: IT Services, Worldwide, 2012‐2018, 1Q14 Update,” Data Center Outsourcing, Colocation, Hosting and Cloud Access (U.S.); Gartner, “Forecast: Information Security, Worldwide, 2012‐ 2018, 1Q14 Update,” Security Spending (U.S.); Gartner, “Forecast: Enterprise Software Markets, Worldwide, 2011‐2018, 1Q14 Update” Virtualization Infrastructure Software (U.S.); Gartner, “Forecast: PCs, Ultramobiles and Mobile Phones Worldwide, 2011‐2018, 1Q14 Update” Ultramobiles purchased by business customers (U.S.)
8

© ePlus inc. Confidential and Proprietary. E X C E L L E N C E T H R O U G H E X P E R I E N C E
Well Positioned within the IT Ecosystem
9
Vendors Vendors
+ ePlus’ range of complex solutions and services place it at the high end of the IT market
•
ServiceOriented
Gross Margin 1
20 – 65% GM20 – 65% GM 5 – 13% GM5 – 13% GM 20 – 23% GM20 – 23% GM 30 – 32% GM30 – 32% GM
Services / IntegratorsServices / IntegratorsIT SolutionsIT SolutionsDistributorsDistributors
DistributionFocused
13 – 16% GM13 – 16% GM
VARsVARs
1 Based on LTM GAAP gross margin

© ePlus inc. Confidential and Proprietary. E X C E L L E N C E T H R O U G H E X P E R I E N C E
Targeted M&A Strategy with Track Record of SuccessTargeted M&A Strategy with Track Record of Success
+ 369 sales resources
+ 293 engineering professionals
+ Serving middle‐market clients to large multinational enterprises
+ Customer‐centric project management
+ Ability to deploy complex solutions globally
Expanding Footprint and Capabilities
+ Regional Offices ★Sales Offices ★Managed Service Center
+ November 2013 ($2.8 million) + Rochester area reseller with storage expertise + Strengthened position as leading US FlexPod
reseller
+ February 2012 ($7.0 million)+ SoCal Cisco reseller+ Acquired new customers & west coast NOC
+ January 2012 ($2.2 million) + Northern New England+ Gained state contracts and Cisco Call Center Express
expertise
+ June 2011 ($3.5 million) 1+ Security expertise & Security Operations Center (SOC)+ Acquired nationwide security sales capabilities
+ November 2010 ($1.8 million) + Tandberg Platinum VAR+ Acquired Cisco/Tandberg resale capability nationwide
1 Excludes contingent consideration of up to $3.2 million
10

© ePlus inc. Confidential and Proprietary. E X C E L L E N C E T H R O U G H E X P E R I E N C E
+ Assessments+ Consulting+ Project Management+ Staging & Configuration+ Integration
+ Unified Communications+ Video Systems / TelePresence+ Streaming Solutions+ Secure Mobility
+ Flexible Payment Solutions+ Operating Leases+ Capital Leases+ Entire Asset Acquisition Process+ Trade‐In Programs
+ Wireless+ Core Networking+ Multiple Client Devices+ Client Security
+ Procurement+ Asset Management+ Supplier Enablement+ Document Management
End‐to‐End Suite of Customized Solutions
+ Managed Security+ Threat Defense+ BYOD Security+ Content Security+ Endpoint Security
+ Cloud Computing+ Virtual Desktop Infrastructure / VXI+ Server Consolidation / Virtualization+ Storage & Backup+ Data Security
11

© ePlus inc. Confidential and Proprietary. E X C E L L E N C E T H R O U G H E X P E R I E N C E
Expansion HighlightsExpansion Highlights
Expanding Professional and Managed Services
+ Hired Dan Farrell as Senior Vice President of National Professional Services in 2010
+ Expanded Services headcount by 93%
+ Grew managed service center locations from 1 to 3
+ Consistent growth in services revenue
+ Enhanced Maintenance Support
+ Managed Services
+ Staffing
+ Executive Services Portfolio
Key ServicesKey Services
Services revenue carries a higher gross margin
12

© ePlus inc. Confidential and Proprietary. E X C E L L E N C E T H R O U G H E X P E R I E N C E
Selected Strategic PartnersSelected Strategic Partners
ePlus serves as an extension of vendors’ internal sales force with the ability to select best‐of‐breed solutions
+ Top vendor for ePlus, representing 48% of technology sales 1
+ Networking, security, converged infrastructure
+ ePlus engineers are trained in 26 different Cisco product lines
+ Represents ~10% of technology sales 1
+ Converged infrastructure, enterprise storage, networking and virtualization
+ NetApp Star Partner and Professional Services Partner
+ Network storage and services focused applications, such as virtualization, file server consolidation, private cloud, and public cloud
+ ePlus professionals maintain a variety of EMC engineering certifications
+ Networking storage and services
+ Virtual infrastructure solutions
Independent Provider with Deep Strategic Relationships
1 Based on the year ended March 31, 2014
Complemented by Additional RelationshipsComplemented by Additional Relationships
13

© ePlus inc. Confidential and Proprietary. E X C E L L E N C E T H R O U G H E X P E R I E N C E
Exceptional Momentum with Key Partners
14
+ Additional awards received at Partner Summit: Commercial Partner of the Year,
Americas Architectural Excellence ‐ Collaboration,
US/Canada: East Cisco Meraki Elevate East Partner of the
Year, US/Canada: East SLED Partner of the Year, US/Canada:
West
+ Cisco expects to invest over $1bn to expand its cloud business over the next two years, through its partner‐centric model
2014 Partner Summit Global Award for Cloud Builder of the Year
+ Co‐winner in the Enterprise Group U.S. 2014 Top Growth Partner HP Storage VAR category at HP’s Global Partner Conference
+ ePlus is an HP Platinum Partner with HP specializations in Converged Infrastructure and Printing and Computing Systems
2014 Top Growth StoragePartner Award
Additional Designations:Additional Designations:
+ Achieved top partner ranking in FlexPod sales for the first half of NetApp’s fiscal year 2014
+ ePlus has been a leading FlexPodprovider since the solution’s inception and has deployed Flexpods in a wide variety of verticals
2013 Top‐Ranked Partner in US FlexPod Sales
“Cisco is privileged to work alongside the most talented channel partners in the industry, and we remain committed to our partners’ success. We are
honored to name ePlus as Cloud Builder of the Year, to acknowledge their outstanding achievements.”‐Edison Peres, Senior Vice President, Worldwide
Channels, Cisco
“Modern storage designs, such as HP 3PAR StoreServStorage and HP StoreOnce Backup, are built for a new style of IT that customers are deploying. Partners like ePlus play a critical role in consulting with their clients to accelerate storage transformation efforts to meet changing IT
demands.”‐Andrew Manners, Vice President, HP Storage
“ePlus has demonstrated a commitment to NetAppsolutions and ongoing investments to maintain the highest levels of FlexPod expertise. We look forward to continuing to work together to enable our joint customers to lower deployment risk, increase data center efficiencies, and
create a flexible IT environment through FlexPod solutions.”‐Peter Howard, Vice President, Worldwide Channel Sales,
NetApp

© ePlus inc. Confidential and Proprietary. E X C E L L E N C E T H R O U G H E X P E R I E N C E
Deep Expertise and Experience with Emerging Vendors
Network
Vendor AVendor A
Vendor BVendor B
Vendor CVendor C
($ in thousands, FYE 3/31)Storage
Security
Big Data
Servers
Selected Emerging Vendors Selected Emerging Vendors
Well‐positioned for continued above‐market growth as disruptive vendors take market share
Featured VendorsFeatured Vendors
15
$285
$5,085
FY2012 FY2014
$1,004
$16,003
FY2012 FY2014
$146
$2,160
FY2012 FY2014
© ePlus inc. Confidential and Proprietary. E X C E L L E N C E T H R O U G H E X P E R I E N C E
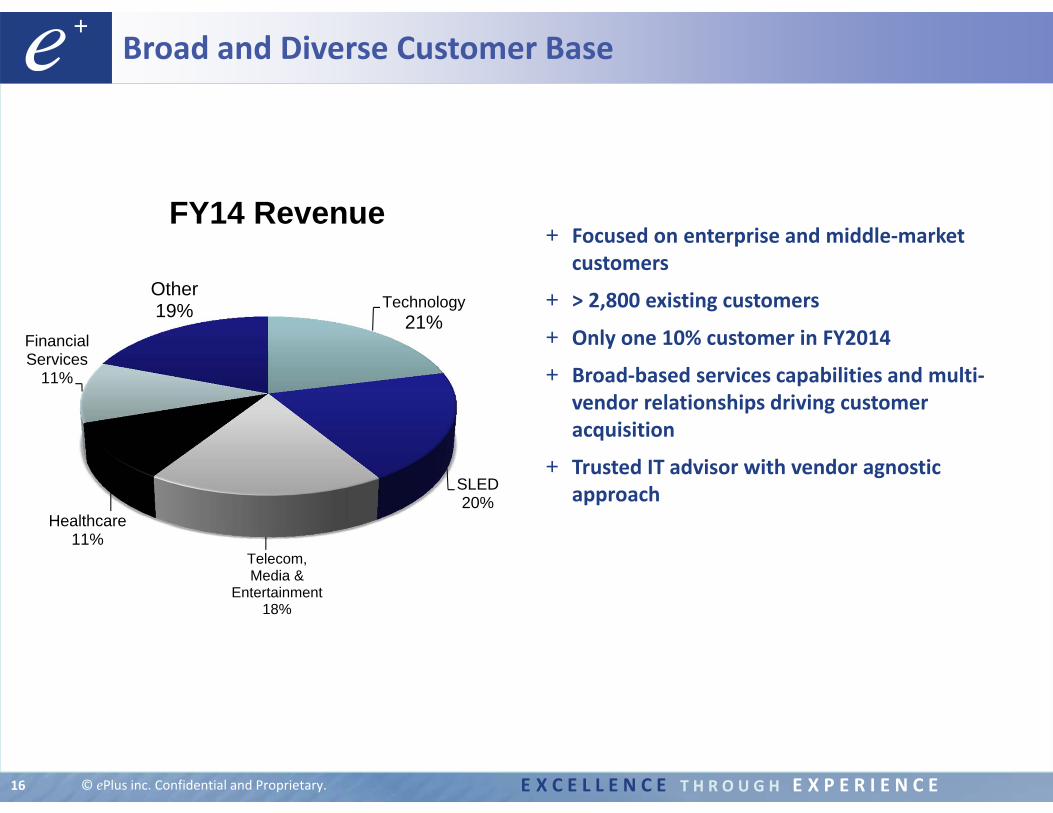
Broad and Diverse Customer Base
+ Focused on enterprise and middle‐market customers
+ > 2,800 existing customers
+ Only one 10% customer in FY2014
+ Broad‐based services capabilities and multi‐vendor relationships driving customer acquisition
+ Trusted IT advisor with vendor agnostic approach
16
Technology21%
SLED20%
Telecom, Media &
Entertainment18%
Healthcare 11%
Financial Services
11%
Other19%
FY14 Revenue

© ePlus inc. Confidential and Proprietary. E X C E L L E N C E T H R O U G H E X P E R I E N C E
Financial ServicesFinancial Services
Telecom, Media & Entertainment
Telecom, Media & EntertainmentTechnologyTechnology
Select clients
HealthcareHealthcare
17
State & Local Government and Education
State & Local Government and Education
OtherOther

© ePlus inc. Confidential and Proprietary. E X C E L L E N C E T H R O U G H E X P E R I E N C E
Customer Case Study: Large Technology Customer
The ProblemThe Problem
+ Overpaying for substandard support under its existing long‐term contract for managed services and staff augmentation
+ No customization for infrastructure needs included in existing contract
+ Obsolete platforms and systems
Business Challenges &
Issues
Business Challenges &
Issues
+ Lack of alignment between customer and IT partner+ Customer was undergoing a volatile period in its history and
needed an agile partner that would best meet its infrastructure needs
Solution & BenefitsSolution & Benefits
+ ePlus Managed Services now monitors and manages the customer’s Cisco route/switch and wireless infrastructure (~1,000 devices)
+ Five people are now on‐site 24X7X4 for service delivery management and engineering support for 17 U.S. sites
+ Adaptive IT infrastructure and ~$2.5 million annual cost savings
Why ePlus?Why ePlus?+ Highest levels of technical expertise, agility and business focus,
concentrating on the customer’s specific business challenges and providing extremely flexible and innovative solutions
+ Willingness to adapt the ePlus model to meet the customer’s needs
18

© ePlus inc. Confidential and Proprietary. E X C E L L E N C E T H R O U G H E X P E R I E N C E
Customer Case Study: Large Natural Resources Customer
The ProblemThe Problem
+ Needed to consolidate field operations infrastructure for shared services applications (Email, SharePoint, file/print etc.)
+ Had a highly heterogeneous mix of manufacturers that had become outdated/obsolete through the years
Business Challenges &
Issues
Business Challenges &
Issues
+ Higher maintenance and operational costs+ Business downtime/operational instability risks due to lack of
support for EOSL and EOL+ Inability to adapt / grow to meet field operational needs
Solution & BenefitsSolution & Benefits
+ Basic FlexPod – Cisco, NetApp & VMware+ ePlus Professional Services and Configuration / Staging+ Reduced operational support costs with standardized infrastructure + Reliable and secure infrastructure that is flexible, adaptive and scalable
Why ePlus?Why ePlus?
+ Strong partnerships with Cisco and NetApp+ Ability to provide a complete solution, including staging/configuration
services+ Engineering talent and expertise in each of the required cross‐
disciplines (networking, storage, compute and virtualization)
CompetitionCompetition
19

© ePlus inc. Confidential and Proprietary. E X C E L L E N C E T H R O U G H E X P E R I E N C E
Multiple Vectors of Growth
Innovate and Deliver New Solutions
Grow Revenues from Existing Clients
Growth
Time
Attract New Clients
Expand Professional and Managed Services
+ Continue to expand next generation capabilities
+ Cross‐sell full breadth of products and technologies + Further penetrate with expanding Service offerings
+ Capitalize on reputation as trusted advisor + Continue to build relationships with OEMs to
ensure customer referrals
+ Continue to consolidate fragmented industry + Focus on expanding customer base, geographic
coverage and vendor relationships+ Build out national footprint
+ Continue to hire and retain engineering talent+ Continue to grow Managed Service business
Pursue Strategic
Acquisitions
20

© ePlus inc. Confidential and Proprietary. E X C E L L E N C E T H R O U G H E X P E R I E N C E
$21
$41 $40
$59 $60
$0
$20
$40
$60
$80
FY2010 FY2011 FY2012 FY2013 FY2014
Operating Income 2Operating Income 2
$1.49
$2.78 $2.79
$4.32 $4.37
$0.00
$1.00
$2.00
$3.00
$4.00
$5.00
FY2010 FY2011 FY2012 FY2013 FY2014
GAAP EPS GAAP EPS
Gross ProfitGross ProfitRevenue Revenue
Impressive Financial Results
2 See appendix for operating income calculation
($ in millions, except per share data, FYE 3/31)
21
$129$157 $172
$205 $217
17.7% 17.9% 17.8% 18.0% 18.3%
0%
10%
20%
30%
40%
50%
$0
$50
$100
$150
$200
$250
FY2010 FY2011 FY2012 FY2013 FY2014
$551
$719$826
$983 $1,057
$0
$200
$400
$600
$800
$1,000
FY2010 FY2011 FY2012 FY2013 FY2014
© ePlus inc. Confidential and Proprietary. E X C E L L E N C E T H R O U G H E X P E R I E N C E
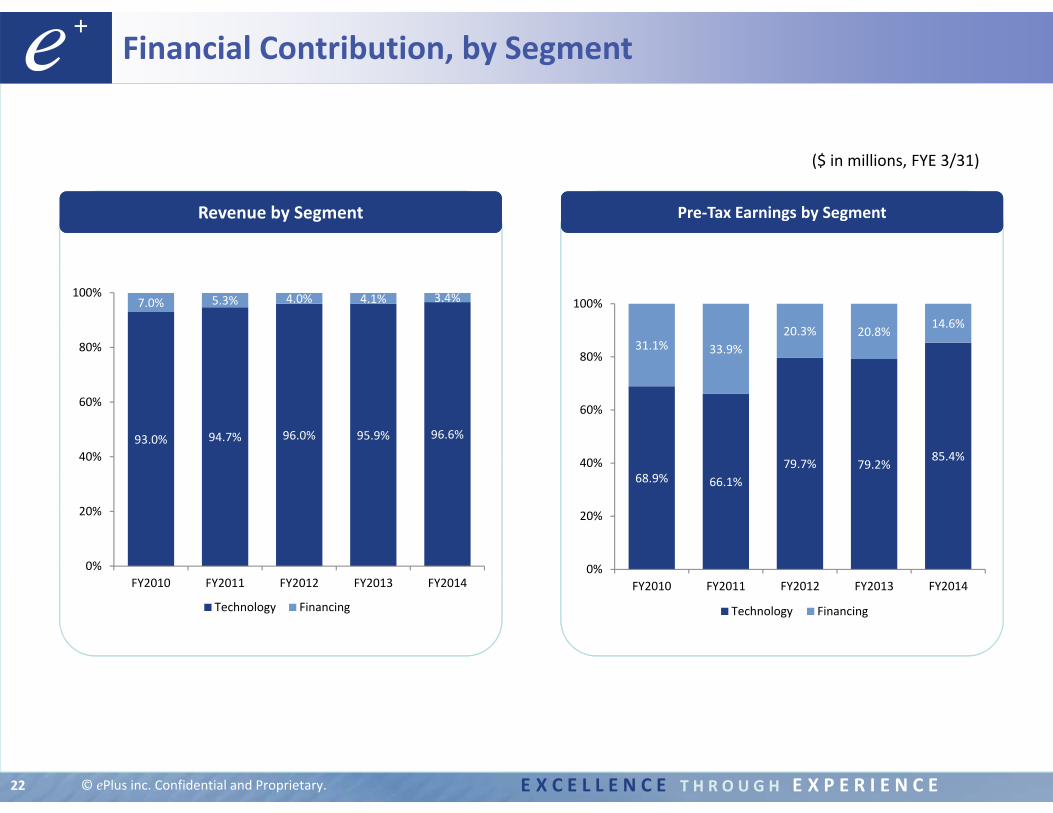
Revenue by SegmentRevenue by Segment Pre‐Tax Earnings by Segment Pre‐Tax Earnings by Segment
Financial Contribution, by Segment
($ in millions, FYE 3/31)
22
93.0% 94.7% 96.0% 95.9% 96.6%
7.0% 5.3% 4.0% 4.1% 3.4%
0%
20%
40%
60%
80%
100%
FY2010 FY2011 FY2012 FY2013 FY2014
Technology Financing
68.9% 66.1%79.7% 79.2% 85.4%
31.1% 33.9%20.3% 20.8% 14.6%
0%
20%
40%
60%
80%
100%
FY2010 FY2011 FY2012 FY2013 FY2014
Technology Financing

© ePlus inc. Confidential and Proprietary. E X C E L L E N C E T H R O U G H E X P E R I E N C E
Employee Headcount Growth by FunctionEmployee Headcount Growth by Function
Revenue per EmployeeRevenue per Employee
Growing Productivity While Strategically Expanding Workforce
Note: Excludes part time employees
($ in millions, FYE 3/31)
Revenue per Sales & Marketing EmployeeRevenue per Sales & Marketing Employee
23
$0.9
$1.1
$0.0
$0.2
$0.4
$0.6
$0.8
$1.0
$1.2
FY2010 FY2014
$2.1
$2.9
268369
152
29363
82
169
181
9
9
661
934
0
200
400
600
800
1,000
FY2010 FY2014
Sales & Marketing Professional Services
Software Develop. & Internal IT Administration
Executive
+13%
+58%

© ePlus inc. Confidential and Proprietary. E X C E L L E N C E T H R O U G H E X P E R I E N C E
Strong Balance Sheet
24
+ $80 million in cash and equivalents
+ $175 million financing facility with GE Commercial Distribution Finance
+ Financing portfolio of $147 million as of 3/31/14, representing investments in leases and notes
+ Portfolio monetization can be utilized to raise additional cash
+ Minimal capex+ 400,000 share repurchase in
connection with secondary offering, May 2014
($ in millions)
Assets 3/31/2014 3/31/2013
Cash and equivalents $80 $54
Accounts receivable 243 192
Inventory 23 15
Financing investments 147 123
Property & equipment and other 28 21
Goodwill & other intangibles 35 33
Total assets $555 $438
Liabilities
Accounts payable 162 103
Recourse notes payable 2 1
Non-recourse notes payable 69 40
Accrued expenses & other liabilities 55 56
Total liabilities $287 $200
Shareholders' Equity
Equity 268 238
Total liabilities & equity $555 $438

© ePlus inc. Confidential and Proprietary. E X C E L L E N C E T H R O U G H E X P E R I E N C E
Investment Highlights
25
+ Robust balance sheet provides opportunity for accretive M&A + Robust balance sheet provides opportunity for accretive M&A
+ Focused on growing service revenues to maintain and expand margins + Focused on growing service revenues to maintain and expand margins
+ Investments in key engineering and sales personnel to drive growth in excess of market + Investments in key engineering and sales personnel to drive growth in excess of market
+ Growing geographic footprint offers entry into new regional markets+ Growing geographic footprint offers entry into new regional markets
+ Targeting new and existing client bases for revenue growth+ Targeting new and existing client bases for revenue growth

© ePlus inc. Confidential and Proprietary. E X C E L L E N C E T H R O U G H E X P E R I E N C E26
Appendix
E X C E L L E N C E T H R O U G H E X P E R I E N C E
© ePlus inc. Confidential and Proprietary. E X C E L L E N C E T H R O U G H E X P E R I E N C E
Operating Income Calculation
27
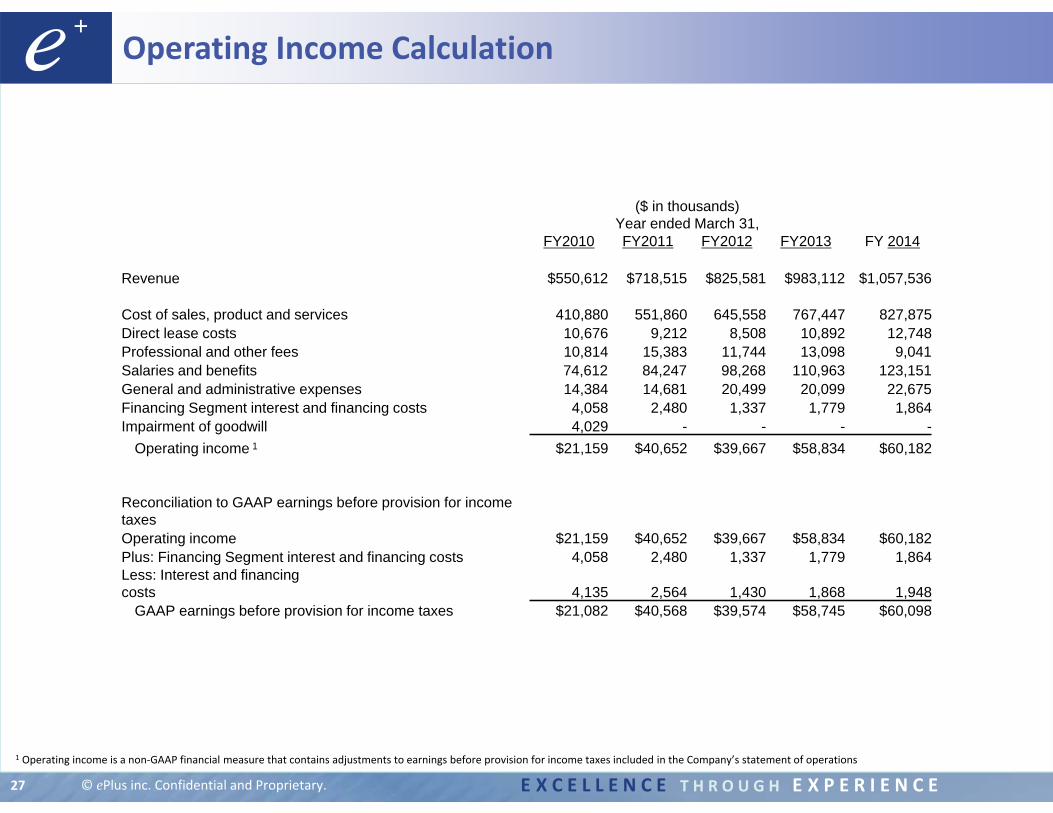
1 Operating income is a non‐GAAP financial measure that contains adjustments to earnings before provision for income taxes included in the Company’s statement of operations
($ in thousands)Year ended March 31,
FY2010 FY2011 FY2012 FY2013 FY 2014
Revenue $550,612 $718,515 $825,581 $983,112 $1,057,536
Cost of sales, product and services 410,880 551,860 645,558 767,447 827,875Direct lease costs 10,676 9,212 8,508 10,892 12,748 Professional and other fees 10,814 15,383 11,744 13,098 9,041 Salaries and benefits 74,612 84,247 98,268 110,963 123,151 General and administrative expenses 14,384 14,681 20,499 20,099 22,675 Financing Segment interest and financing costs 4,058 2,480 1,337 1,779 1,864 Impairment of goodwill 4,029 - - - -
Operating income 1 $21,159 $40,652 $39,667 $58,834 $60,182
Reconciliation to GAAP earnings before provision for income taxesOperating income $21,159 $40,652 $39,667 $58,834 $60,182 Plus: Financing Segment interest and financing costs 4,058 2,480 1,337 1,779 1,864 Less: Interest and financing costs 4,135 2,564 1,430 1,868 1,948
GAAP earnings before provision for income taxes $21,082 $40,568 $39,574 $58,745 $60,098

© ePlus inc. Confidential and Proprietary. E X C E L L E N C E T H R O U G H E X P E R I E N C E
Contact Information
Kley Parkhurst, SVPePlus inc.
(703) 984‐[email protected]
ePlus inc.13595 Dulles Technology Drive
Herndon, VA 20171‐3413(703) 984‐8400www.eplus.com
28


![PM 2014 investor day 2014-06-26-Da-eu Region Investor Day Slides [Website Final]](https://img.pdfslide.us/doc/110x75/577cbc651a28aba7118da315/pm-2014-investor-day-2014-06-26-da-eu-region-investor-day-slides-website-final.jpg)

![PM 2014 investor day 2014-06-26-Operations Investor Day Slides [FINAL]](https://img.pdfslide.us/doc/110x75/577cbc651a28aba7118da314/pm-2014-investor-day-2014-06-26-operations-investor-day-slides-final.jpg)