Embed Size (px)
Citation preview
To Our Business Partners
Here is our annual report for 2013. Each year we write
this letter to update you on the financial performance of
your company and to qualitatively describe what went on
at Markel. This is your company. We as managers are
stewards of your capital. You’ve entrusted us with the
authority to run this business, and this annual report
functions as our report card to you. As John Cheever said
about a kiss, “You can’t do it alone.” We thank you for
your partnership and the opportunity to do this because
among other things . . . it’s fun.
Part of what makes it fun stems from the fact that 2013
was a year of fabulous financial performance. Financial
results are a scorecard that measures one dimension of
how good we are at doing our jobs. We like to think we
are good at what we do, and it is pleasant to be able to
report outstanding financial results and good marks.
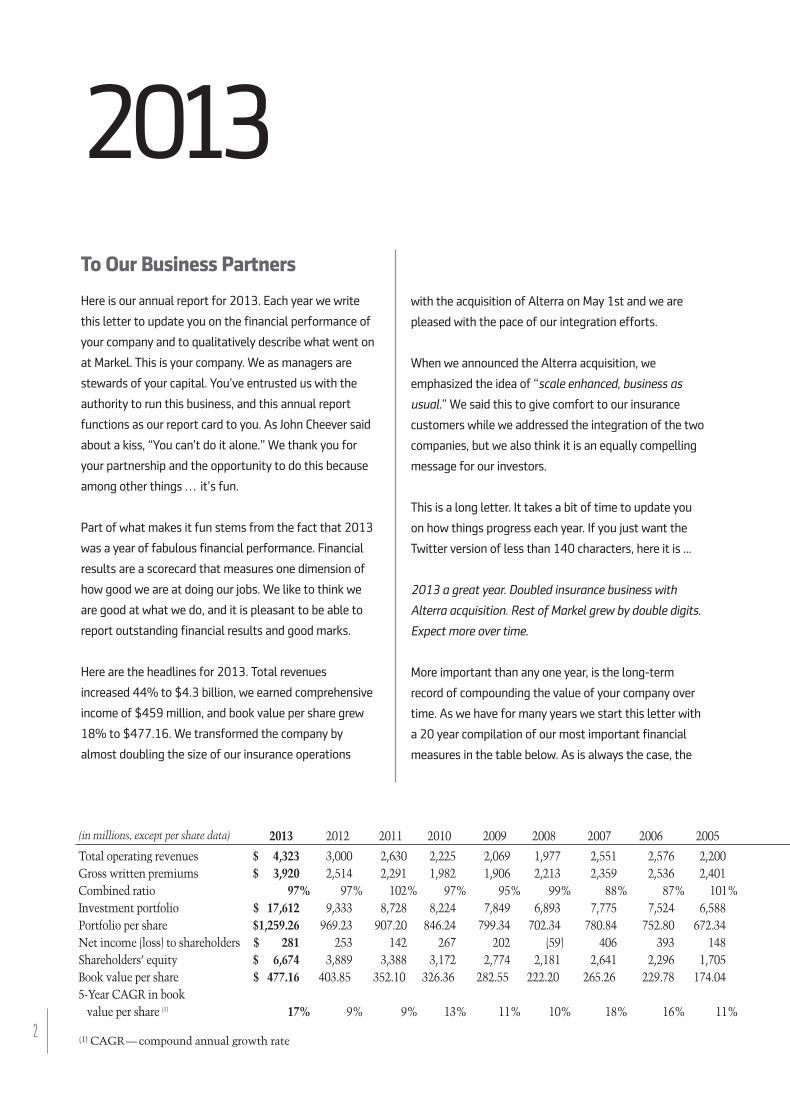
Here are the headlines for 2013. Total revenues
increased 44% to $4.3 billion, we earned comprehensive
income of $459 million, and book value per share grew
18% to $477.16. We transformed the company by
almost doubling the size of our insurance operations
2
with the acquisition of Alterra on May 1st and we are
pleased with the pace of our integration efforts.
When we announced the Alterra acquisition, we
emphasized the idea of “scale enhanced, business as
usual.” We said this to give comfort to our insurance
customers while we addressed the integration of the two
companies, but we also think it is an equally compelling
message for our investors.
This is a long letter. It takes a bit of time to update you
on how things progress each year. If you just want the
Twitter version of less than 140 characters, here it is ...
2013 a great year. Doubled insurance business with
Alterra acquisition. Rest of Markel grew by double digits.
Expect more over time.
More important than any one year, is the long-term
record of compounding the value of your company over
time. As we have for many years we start this letter with
a 20 year compilation of our most important financial
measures in the table below. As is always the case, the
2013
(1) CAGR—compound annual growth rate
(in millions, except per share data)
Total operating revenues $ 4,323% 3,000% 2,630% 2,225% 2,069% 1,977)% 2,551% 2,576% 2,200%Gross written premiums $ 3,920% 2,514% 2,291% 1,982% 1,906% 2,213)% 2,359% 2,536% 2,401%Combined ratio 97% 97% 102% 97% 95% 99%) 88% 87% 101%Investment portfolio $ 17,612% 9,333% 8,728% 8,224% 7,849% 6,893)% 7,775% 7,524% 6,588%Portfolio per share $1,259.26% 969.23% 907.20% 846.24% 799.34% 702.34)% 780.84% 752.80% 672.34%Net income (loss) to shareholders $ 281% 253% 142% 267% 202% (59)% 406% 393% 148%Shareholders’ equity $ 6,674% 3,889% 3,388% 3,172% 2,774% 2,181)% 2,641% 2,296% 1,705%Book value per share $ 477.16% 403.85% 352.10% 326.36% 282.55% 222.20)% 265.26% 229.78% 174.04%5-Year CAGR in book value per share (1) 17% 9% 9% 13% 11% 10%) 18% 16% 11%
2013 2012 2011 2010 2009 2008 2007 2006 2005
excellent financial results over time, as well as providing
you with some insights into the non-financial factors
that give us confidence we can continue to earn your
trust in running this company.
One of the key features that help to produce these
results over such long time horizons is the sense of
teamwork that exists at Markel. Jim Collins in his book
“Good to Great” noted that organizations tend to cluster
around two basic models, “teams” or “a genius with a
thousand helpers.”
Markel functions as a team. We’ve got a deep and
growing roster of skilled players. We know that on a
team different players assume different roles and
responsibilities. Sometimes it means scoring points,
sometimes it means passing the ball to someone else,
sometimes it means teaching a new player how to do
something, and sometimes it means driving the van to
the next game.
Those roles can and do change over time. We believe
that teams last longer and produce better, more durable
results than the “genius with a thousand helpers” model.
We love the team of our colleagues and long-term
shareholders, and we hope the following discussion of
our key financial measures will provide some insight into
that reality and how it works at Markel.
numbers in this chart stem from the unique financial
architecture in place at Markel. We’ve earned wonderful
returns on your capital over decades. One reason for that
is that each year, and in fact, each day, we get to choose
from a varied menu as to how to allocate capital to
continue to build the value of your company. Most
companies do not enjoy the 360 degree range of choices
we do to build value.
Our first and favorite option is to fund organic growth
opportunities within our proven, existing line up of
insurance and non -insurance businesses. Our next choice
is to buy new businesses. Our third choice is to allocate
capital to publicly traded equity and fixed income
securities, and our final choice is to repurchase shares of
our own stock when it is attractively priced and increases
the value of each remaining outstanding share.
In 2013 we did all four of those activities just as we have
for several years. The execution of our daily business
against that framework is what produces the results
we've earned for you over time and display for you here.
We are proud of this record and we hope that you as the
long-term owners of this business are as well.
In the balance of this letter, we’ll organize things by
commenting on each of the elements of this table. We
hope to give you some sense of how we produce these
3
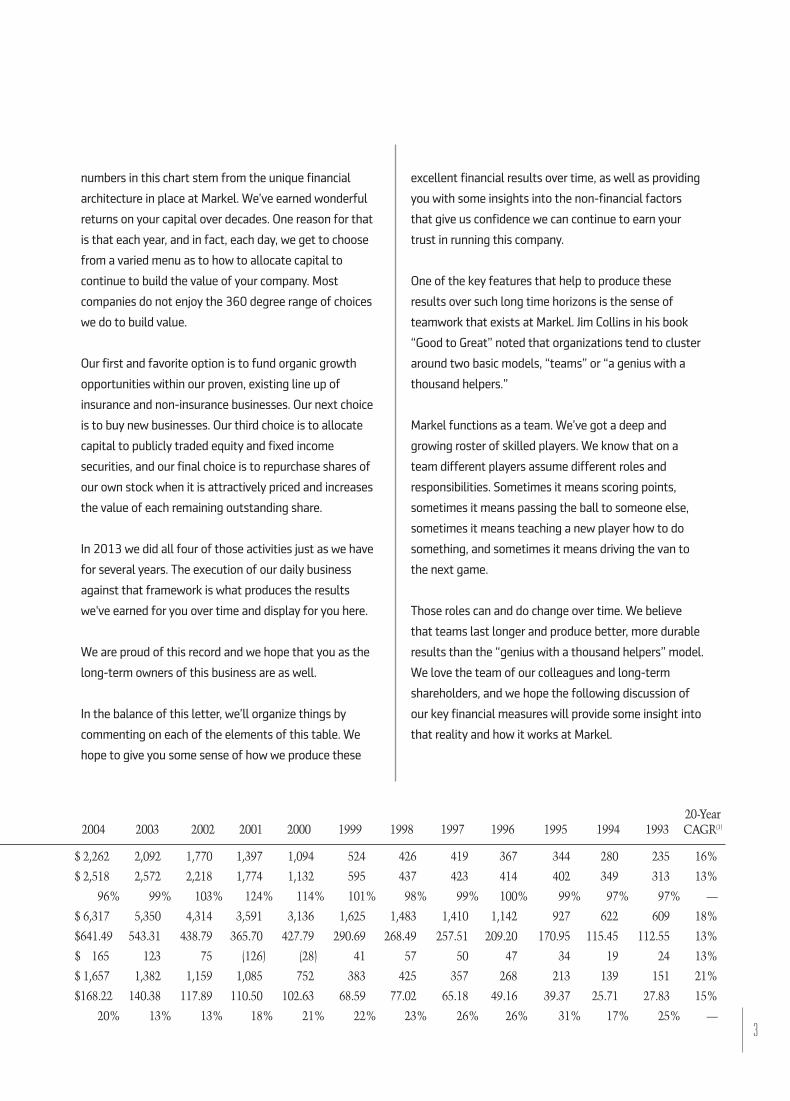
$ 2,262% 2,092% 1,770% 1,397)% 1,094)% 524% 426% 419% 367% 344% 280% 235% 16%
$ 2,518% 2,572% 2,218% 1,774)% 1,132)% 595% 437% 423% 414% 402% 349% 313% 13%
96% 99% 103% 124%) 114%) 101% 98% 99% 100% 99% 97% 97% —
$ 6,317% 5,350% 4,314% 3,591)% 3,136)% 1,625% 1,483% 1,410% 1,142% 927% 622% 609% 18%
$641.49% 543.31% 438.79% 365.70)% 427.79)% 290.69% 268.49% 257.51% 209.20% 170.95% 115.45% 112.55% 13%
$ 165% 123% 75% (126)% (28)% 41% 57% 50% 47% 34% 19% 24% 13%
$ 1,657% 1,382% 1,159% 1,085)% 752)% 383% 425% 357% 268% 213% 139% 151% 21%
$168.22% 140.38% 117.89% 110.50)% 102.63)% 68.59% 77.02% 65.18% 49.16% 39.37% 25.71% 27.83% 15%
20% 13% 13% 18%) 21%) 22% 23% 26% 26% 31% 17% 25% —
20-Year2004 2003 2002 2001 2000 1999 1998 1997 1996 1995 1994 1993 CAGR(1)
One - Total Operating Revenues andComprehensive Income
You might notice that we have two items listed here,
revenues and comprehensive income. While we start off
the 20 year table just with the label “Total operating
revenues,” we believe we should discuss comprehensive
income at the same time. It would be a mistake to
celebrate one without the other. In the insurance
business, revenues can be easily obtained. All you need
to do is cut prices and charge less than the ultimate
underwriting losses. The world will beat a path to your
door to pump up your revenues. You will also soon go
broke. Any and all revenue must carry with it the
expectation of profitability. In our insurance operations
profits are measured by underwriting profitability. In our
investment operations profits are shown as total
investment returns. And at Markel Ventures operations
they are demonstrated by EBITDA and net income.
We are focused on the long-term creation of value at
Markel. We therefore focus on bottom line profitability
over multiple year periods, not just short term increases
in total revenues. Our compensation as senior managers,
and our wealth as fellow shareholders of the company,
depends on profitable revenues, not just revenues.
That said, when it comes to profitable revenues, more
is better.
In 2013, just such a happy thing occurred. Revenues rose
44% to $4.3 billion versus $3.0 billion in 2012. This
total comes from earned premiums of $3.2 billion, net
investment income of $317 million, net realized
investment gains of $63 million and other revenues
(primarily from Markel Ventures) of $711 million. This
recitation of these amounts sounds so easy to say, and
the numbers are so straightforward, that it is easy to
forget how much work goes into creating total revenues
of $4.3 billion.
In 1930, “Red” Motley said, “Nothing happens until
somebody sells something.” Each and every associate of
Markel is a salesman in some form or fashion. We mean4
this as high praise and we salute the hard work involved.
Each and every one of those $4.3 billion dollars (or
pounds, euros, krona, pesos, reais) meant that someone
in Markel connected with a customer who needed our
products or services. They explained how we could meet
their needs. They provided insurance coverage, or
mechanical equipment, or products and services that our
customers wanted and needed. Additionally, they
satisfied our customers, as demonstrated by our having
so much repeat and renewal business. The customers
came back again and again. We must be doing
something right.
Our 2013 revenues of $4.3 billion were a new high water
mark for Markel. To give you some sense of perspective,
ten and 20 years ago our revenues were $2.1 billion and
$235 million respectively. While we focus on bottom line
profitability rather than top line revenues, there would
be no opportunity to produce bottom line profits without
revenues coming in the door.
We'd like to thank all of the associates of the Markel
Corporation who serve their customers by producing the
incoming top line revenues of the business. It represents
immense effort, and we are grateful for their skills and
dedication. We cannot begin to do anything that creates
value for you as shareholders without revenues coming
in the front door.
Our comprehensive income totaled $459 million in
2013 and book value per share grew 18% to $477.16
compared to $403.85 at the end of 2012. The five year
compound annual growth in book value was 17%.
We think that the growth rate of our comprehensive
income per share over time is one of the most important
financial metrics at Markel. While it will vary from year
to year due to external market fluctuations and
economic cycles, we think that this measurement over
multi-year periods is the best way to measure our
economic progress.
In the past we've headlined our book value per share,
while at the same time noting our five year compound
annual growth rate in book value (CAGR). Starting this
year, we’d like to shift the emphasis more towards the
five year CAGR rather than the static book value amount.
The reason for this subtle shift is that while the
insurance businesses of Markel remain tethered to the
reasonably accurate GAAP accounting balance sheet
definitions of book value, our growing Markel Ventures
operations are more accurately valued by considering
their generation of cash as shown on the consolidated
statements of income and cash flows. Also, capital
management activities such as share repurchases, and
share issuances in acquisitions, affect the calculation of
raw book value.
We believe that the five year change in book value is now
just as important a measurement to consider when
thinking about the value of your company as the book
value itself. We'll describe our reasons for this statement
later in the letter as we get to the always treasured
accounting discussion. Stay tuned!
Two - Gross Written Premiums
Gross written premiums rose 56% in 2013 to $3.9
billion from $2.5 billion in 2012. Organic premiums from
existing Markel operations rose 7%. Gross written
premiums also increased due to the Alterra acquisition,
with premiums from those operations included for the
last eight months of the year.
Each and every insurance unit within Markel produced
excellent results in 2013.
Our Excess and Surplus segment, which includes our
wholesale division led by John Latham, produced gross
written premiums of $1.1 billion in 2013 versus $956
million in 2012, an increase of 12%.
5
We thank John for his exemplary leadership of the
wholesale business and we wish him the best in his
upcoming transition to a well-deserved retirement in
2015. We’re also delighted that Bryan Sanders, who
joined us as part of the Alterra acquisition, will assume
leadership of our wholesale division and that the two
of them will be working together this year during
the transition.
The outstanding growth in our wholesale operations
reflects the ongoing efforts of our technology and
business leaders to make Markel easier to do business
with. While we always operated creatively, and worked
diligently to figure out ways to assist our insureds with
unusual insurance needs, we had room for improvement
in business processes and technology. We've made great
strides in this area in recent years, and we are now
beginning to see tangible benefits of more business and
lower expense ratios as a result of these initiatives.
Our Broker Portal initiative stands as a great example of
a successful initiative. With this web-based system we
can process more insurance business faster and with
lower expense than ever before. With Broker Portal and
other ongoing business process improvements, we
expect ongoing increases in our ability to write more
business at lower expense ratios in 2014 and beyond.
Our London Insurance Market segment, which includes
the Markel International operations led by William
Stovin, produced gross written premiums of $914 million
in 2013 versus $888 million a year earlier, an increase of
3% compared to 2012.
Markel International continues to spread its wings
around the world with growing businesses in Continental
Europe, Asia and also, as a function of newly acquired
capacities from Alterra, Latin America.
Markel International completed the acquisition of Abbey
Protection plc in January 2014. Abbey provides legal and
tax services to its clients along with related insurance
Markel Corporation
coverages. We plan to focus on cross selling between
Abbey and our existing Markel International UK customer
base. We also expect to expand its business
geographically over time.
Our Specialty Admitted segment includes the operations
of our Markel Specialty division and is led by Greg
Thompson. Greg and his team produced gross written
premiums of $900 million in 2013 versus $670 million
in 2012, an increase of 34%.
During 2013 we focused on streamlining business
processes, cross-selling, and building the value of the
Markel brand in the marketplace. We also became the
premier insurer of classic automobiles through our
underwriting relationship with Hagerty.
With the Alterra acquisition we added several
complementary products to our existing wholesale and
Markel International divisions. We also added two new
divisions, Global Insurance and Global Reinsurance.
The Global Insurance division, led by Lou Adanio, John
Boylan, Jim Gray and Mike Miller, produced gross written
premiums for Markel of $275 million in 2013. The
Global Insurance division provides insurance coverage to
larger entities than we previously served at Markel on a
worldwide basis and stands as a good example of our
expanded capabilities as a result of the Alterra
acquisition. We are very pleased with how the insurance
marketplace has responded to our offerings. The
business grew despite the distractions and disruptions
involved in any acquisition. As we enter 2014, we believe
the distractions of the deal are behind us and the
benefits of the larger balance sheet and market presence
continue to build.
The Global Reinsurance division, led by Dave Kalainoff
and Jed Rhoads, produced gross written premiums of
$408 million for Markel in 2013. We are excited about
the long-term prospects for this new business.
6
Today, reinsurance faces some of the most competitive
marketplace conditions in our insurance portfolio.
Despite that, we expect ongoing profitability in 2014
and beyond. With our new, larger balance sheet and
longstanding commitment to underwriting profitability
and dependability in the marketplace, reinsurance should
be able to grow in well priced insurance markets and
produce large profits in some years. In other years, we
will reduce writings when we are not being paid
appropriately to take risks.
Over time, this culture and discipline at Markel has
served us well. Reinsurance in and of itself is neither a
good or bad business. What can make it good is that, in
certain markets, we can write a lot of profitable premium
volume and compound the returns from doing so with
our investment activities. In tough markets we will need
to be extremely disciplined and willing to walk away
from underpriced business.
We’ve practiced this discipline throughout Markel over
the years, and we will continue to do so. The combination
of our long-term focus, discipline, and diversification
allows us to be patient. We are not dependent on any
one product or customer. As such, we can increase or
decrease our exposures as market conditions warrant
and we are used to doing this. We expect the cumulative
results from doing so will demonstrate the wisdom of
growing our reinsurance business and creating value over
multi year periods.
Three - Combined Ratio
No discussion of gross written premiums makes sense
without discussing the combined ratio and profitability of
those revenues. We’ve got good news on that front as
the overall combined ratio at Markel was 97% in both
2013 and 2012, despite the fact that we incurred two
points of non-recurring expense related to the Alterra
acquisition. While we benefited from a relatively mild
year with lower than normal weather-related
catastrophes, we are pleased with these results.
We also remain committed to our unchanging standard
of conservatism in setting our loss reserves and doing
our best to make sure that we remain “more likely to be
redundant than deficient” in our balance sheet accounts.
We are booking the Alterra business with a margin of
safety consistent with our long standing practices, and
we will continue to do so. This approach protects the
balance sheet, and in our opinion, the value of your
company in many dimensions. It also tends to produce
more volatility in year-to-year results. So be it. We think
it’s the right way to proceed.
In 2013, we wrote more business than we've ever
written before, and we did so at a profit. A number of
factors produced these results. One, the underwriters
throughout our organization thoughtfully and skillfully
selected and priced the risks we take very well. Two, they
were able to do so because the information technology
that supports their efforts improved during the year and
they had more data with which to make decisions. Three,
the increased size and scale of Markel gave underwriters
more opportunities to see and write business than ever
before. Four, the marketing efforts to establish the
Markel brand in the insurance world increased our
opportunities to see and write business. Five, our
financial performance and reputation gave our clients
confidence to trust us to be there when and if a claim
occurred. And so on and so on and so on ...
We believe that these are persistent advantages and we
will continue to build on them over time.
Four - Investment Portfolio
At year-end 2013, the total investment portfolio
reached $17.6 billion compared to $9.3 billion a year
ago. The acquisition of Alterra added $7.9 billion on
May 1st. Interest rates bottomed out for the year almost
exactly on the May 1st closing date of the Alterra
acquisition. The subsequent rise in rates during the rest
of the year reduced the carrying value of the portfolio
which offset increases in the portfolio from our
investment performance and cash flows.
The highlight of the year in our investment portfolio was
the 33.3% return on our equity investments. Over the
last five and ten years we’ve earned 21.6% and 12.4%
respectively per year on our equity portfolio. These are
outstanding investment results. Most insurance based
organizations do not invest in equity securities to the
extent we do at Markel. Our equity portfolio has added
immense value to our total returns over many years and
we think our long standing and consistent commitment
to disciplined equity investing is a unique and valuable
feature.
As long-term readers of this report will know, we follow
a four part discipline when it comes to making our equity
investments. First we seek profitable businesses with
good returns on total capital that don’t use too much
leverage. Second, we look for management teams with
equal measures of talent and integrity. Third, we look for
businesses that can reinvest their earnings and
compound their value or that practice sound capital
management techniques such as good acquisitions,
dividends, and share repurchases. Fourth, we seek these
attributes at fair and reasonable prices.
You can find the incantation of this four part thought
process starting in the 1999 annual report, and we
repeat it every year. We were thinking along these lines
before 1999 but we just started saying it in the annual
report that year and we continue to invoke it as liturgy
year after year.
This four part process guides all of our business
decisions when it comes to investing in publicly traded
equity securities and privately held businesses, as well as
personnel and management evaluations and decisions
within our existing operations.
We hope you take comfort in seeing the consistency of
this approach year after year. We do.
In our fixed income operations we earned a total return
of zero percent. Going into 2013 we worried that interest
rates were unnaturally low and that the risks of owning7
Markel Corporation
increase towards our more normal target of 80%
over time.
Five - Portfolio per Share
At year end, our investment portfolio per share stood at
$1,259 versus $969 a year ago. The Alterra acquisition
added $560 per share at closing on May 1st and our
investment performance, coupled with the cash flow
from operations, allowed us to continue to build our
investment balances during the year.
One wonderful attribute of Markel is that over time our
insurance businesses produce both underwriting profits
and investable funds at the same time. This means that
the total investment balances (after subtracting out our
debt) produce investment income that accrues to the
benefit of the shareholders. In effect, in addition to our
own money (the shareholders’ equity) which we invest,
we get to invest the funds we are holding on behalf of
our insurance claimants until such time as the claims
come due.
Most businesses just have one pool of funds to invest,
namely, shareholders’ equity. At Markel, we have two.
Our own capital plus the funds we are holding on behalf
of others until they are needed. More is better.
Six - Net Income to Shareholders
Our net income totaled $281 million in 2013 versus
$253 million in 2012.
This is the most volatile of the line items in the 20-year
table. We understand this volatility and hope that you do
as well. At many organizations, volatility causes people
to go nuts. Experience has shown they are tempted to
tamp it down and pretend that the world is a smooth
place. We do not share this delusion.
If we were irrationally afraid of volatility, we could get rid
of our equity portfolio, since equities tend to go up and
down by greater percentage amounts than bonds. We
longer-term bonds outweighed the returns available
from doing so. We worried about that in 2012 and earlier
as well.
We knew that we couldn’t forecast when interest rates
would go up with precision. Therefore, we simply let our
fixed income securities mature and we built up our
balances of cash and shorter term bonds.
Starting in the second quarter of 2013, interest rates
finally did begin to rise. Our total return this year was
diminished by the market values of our existing bond
holdings falling. The very good news is that we are
extremely liquid and now able to reinvest our cash
balances at rates which make more sense to us.
We see particular opportunities within the distress of the
municipal securities market, and we are gradually
beginning the process of investing our liquidity in longer
term bonds. Our pace in doing so will depend on our
internal cash flows as well as the rate of change in
interest rates. As 2014 progresses we expect to
structure the portfolio with a longer duration that more
closely matches the duration of our claims liabilities
going forward.
We normally don’t try to predict interest rates but we
can use common sense to say that we believed they were
too low during the last few years, and now they are
trending back to a more normal level. Consequently, we
too will trend back towards a more normal bond
portfolio over time. This should increase our investment
income substantially in the years to come.
Our overall investment return was 6.8% in 2013. We
continued to add to our equity portfolio throughout the
year as we have done consistently since the low point of
equity exposure in the first quarter of 2009. While the
addition of the Alterra portfolio on May 1st reduced our
percentage of the total portfolio in equities back below
50% of shareholders’ equity, we methodically worked to
increase that allocation during the year. At year end that
ratio stood at 49% and we would expect it to gradually8
think that unnaturally attempting to minimize reported
volatility would diminish the long-term profitability of
the company and work against the interests of long-term
owners of the firm compared to short term traders of
the stock.
Specifically, if we re-allocated the equity portfolio, we
would increase the amount of net income that would
flow through the income statement since all of the fixed
income interest income gets reported through this line.
For equities, only the dividends and realized gains show
up as net income. Unrealized gains we earn by holding
onto growing businesses do not.
Over time, we’ve earned hundreds of basis points of
higher returns on our equity portfolio compared to our
fixed income investments. Much of that excess return
shows up only in balance sheet accounts and in
comprehensive income. Unrealized gains never go
through the income statement. By the way, this is also
incredibly tax efficient as we now enjoy a gain of $1.7
billion on our equity portfolio at year end 2013. We’ve
provided for the ultimate tax liability that would be paid
should we sell our holdings, but as long as we hold onto
those securities we defer paying that tax until the future.
At a 35% tax rate, this means we have over $500 million
in our portfolio today, earning a return for our
shareholders, which we would not if we chose to invest
only in fixed income securities or to sell and realize gains
just so they showed up in our net income statement.
We’ll trade a little volatility in reported net income for
$500 million anytime we can. A little over ten years ago
the amount of our deferred tax liability was
approximately $50 million. It’s accurate to say we
accomplished zero in our investment operations for the
last decade. Correct! We added a zero. Please root for us
to do so again.
9
Seven - Shareholders' Equity
Shareholders’ equity totaled $6.7 billion at year end
2013 compared to $3.9 billion a year ago. Our
shareholders’ equity increased $2.3 billion due to our
issuance of 4.3 million shares used to partially pay for
the Alterra acquisition and our comprehensive income of
$459 million offset by $57 million in share repurchases.
Eight - Book Value per Share
Book value per share reached $477.16 in 2013
compared to $403.85 in 2012. Yeah!
Nine - Five year CAGR in Book Value perShare
In 2013, the five year compound annual growth rate in
book value per share was 17%. We are delighted with
this result and we hope that you are as well.
While in the past we have emphasized the book value
per share absolute amount, we think it is important to
emphasize the five year CAGR percentage just as much if
not more than the absolute amount of book value per
share. We'll explain why in the next section.
The Always Treasured Accounting Discussion
Here is the much anticipated accounting discussion. We'll
try to make it worth your while to slog through this.
The accounting comments tie to the changing nature of
Markel over time. In earlier years we were almost
completely, and accurately, described as an insurance
company. As such, while the income statement and the
cash flow statement were inseparably connected to the
balance sheet, the balance sheet stood out as the most
important of our three financial statements. From the
balance sheet, one can calculate the book value per
share, and it would be fair to say that the value of
Markel, as well as any other insurance company,
shouldn't vary too much from what that book value
calculation revealed.
Markel Corporation
The balance sheet of an insurance company should
comprehensively sum up roughly what an insurance
company is worth. The assets consist of relatively easy
to value items such as cash, publicly traded and market
priced fixed income and equity securities, collectible
reinsurance amounts, and so on and so on. Similarly, the
liabilities should be relatively straightforward and show
the future amounts due to policyholders and creditors.
Over time, we've been accorded a premium valuation
compared to our raw book value, and compared to most
insurance competitors. There were many factors that
created our premium valuation in the marketplace, such
as a reputation for conservatism in our financial
reporting practices, demonstrated customer loyalty as
shown by high renewal rates, and excellent long-term
financial performance.
We appreciate the vote of confidence the marketplace
has provided to Markel, and we will do everything in our
power to continue to deserve a premium reputation.
Today, with the ongoing growth of Markel Ventures, the
income statement should begin to come more into play
as an element of focus for the owners of the company.
The value of the Markel Ventures companies stems
almost entirely from their ability to produce cash. That
ability is not measured predominantly by the balance
sheet; it is measured predominantly by current and
future income and cash flow statements.
The net income (and associated cash flows) from the
Markel Ventures companies comes largely from income
statement activities such as selling goods and services
for more than the total costs involved in producing them.
In some cases, such as at our Weldship and ParkLand
operations, the companies are heavy users of capital and
need a substantial balance sheet to produce income. By
contrast, PartnerMD and RetailData stand at the other
end of the spectrum and require only small balance
sheets that are dominated by items like working capital
for payroll, receivables, and day to day operations.
Fortunately, this spectrum of businesses with various
degrees of balance sheet intensity compared to the
income statement resolves itself over time with the
calculation of the five year CAGR measurement that we
emphasize at Markel.
Namely, whatever amount of balance sheet (and
associated book value) that the Markel Ventures
companies require, it should be relatively consistent over
time. The main thing that will change the book value of
the various Markel Ventures entities will be the earnings
of those companies themselves. The CAGR of the book
value of this group should thus serve as a pretty good
proxy for understanding how well they are creating
economic value for our shareholders.
This calculation is continually refreshed and kept
relevant by the passage of time as each year brings a
new vintage of returns and a new, yet consistently
calculated, base of capital being used to produce those
results. The accuracy of this directionally correct
surrogate measure should also increase over time as the
base of the Markel Ventures business gets larger and
more mature.
As our final statement on accounting in this letter think
about two different companies where you only knew two
pieces of data; the book value per share and the five year
CAGR of that book value. At the first company, the book
value was $100 per share and the five year CAGR was
8%. At the second company the book value was $100
per share and the five year CAGR was 12%. You would
probably accurately conclude that the second company
was a better one than the first and worth a higher
multiple of book value in the marketplace. We think that
calculation cuts through a lot of accounting details and is
valuable information to help you evaluate the company.
This concludes the accounting discussion.
Back to business.
10
2014 and Beyond
2013 was a transformational year for your company. The
Alterra acquisition changed the scale and global reach of
your company. Every associate in every area of Markel
worked to improve your company and translate our new
set of opportunities into profitable and durable business.
In addition to the Alterra acquisition, we added Eagle
Construction to our Markel Ventures operation. Eagle is a
leading homebuilder in central Virginia. We’ve known the
principals at the company for two generations and we
had previously partnered with them in a 50/50 joint
venture to purchase attractively priced real estate assets
in the wake of the 2008/2009 financial crisis.
As evidence of Bryan Kornblau and Bud Ohly’s
management ability, Eagle remained profitable in 2008
and 2009 despite the myocardial infarction in housing.
We are delighted to welcome Eagle into Markel and we
think there will be ongoing opportunities to profitably
expand this business.
We spent the past year digesting and integrating those
acquisitions as well as looking after the basic operations
of your company. We invested heavily in our technology
platforms and expect to continue to do so in the future.
We served our insurance customers by providing fair and
prompt claims services when they experienced losses.
We focused on becoming more valuable suppliers to all
of our customers whether they needed insurance,
equipment for their businesses, housing, medical
services, or other expertise.
We protected the balance sheet of the company through
prudent management of credit, interest rate, and equity
market risks as we managed the portfolio.
We sought out new companies, new customers and
new partners as we sought to build the value of
your company.11
Alan I. Kirshner, Chairman of the Board and Chief Executive Officer
Anthony F. Markel, Vice Chairman
Steven A. Markel, Vice Chairman
Richard R. Whitt, III, President and Co-Chief Operating Officer
Thomas S. Gayner, President and Chief Investment Officer
Markel Corporation
F. Michael Crowley, President and Co-Chief Operating Officer
We changed and improved many processes and
expanded geographically.
What didn’t and what won’t change though is the Markel
Style and the values by which your company operates. As
the Markel Style states, “We believe in hard work and a
zealous pursuit of excellence while keeping a sense of
humor. Our creed is honesty and fairness in all our
dealings.” This value system attracts wonderful
associates to this company.
Our decades of doing this consistently show our
associates and customers that these are not just words.
We mean what we say.
We will continue to do what we say we will.
We are pleased to be able to share this report of
long-term financial performance to you as the owners
of the company. We are optimistic that we will continue
to be able to build one of the world’s great businesses
and we look forward to reporting our progress in the
years to come.