Embed Size (px)
Citation preview

University of South Carolina - ColumbiaJanuary 2014
AlcoholEdu for College2013/2014 Executive Summary
© 2014 EverFi Inc. All Rights Reserved.
Roadmap of This Report
I. A profile of University of South Carolina - Columbia Students' DrinkingBehavior
» What are the drinking behaviors of students before they arrive on campus?
» How often, where, when and why do your first-year students drink?
» How do your students compare to students nationally?
» How have drinking rates changed from year to year (if at all)?
» What is the impact of high-risk drinking on your students?
II. Mitigating Risk and Impacting Culture
» What did your students gain from taking AlcoholEdu?
» How can your campus engage students to change the drinking culture?
III. Implications for Your Institution's Prevention Strategy
» How can these data inform your prevention efforts moving forward?
1

Highlights from Your Data
This Executive Summary contains data from your institution's 2013 implementation of AlcoholEdu forCollege. Findings are based on self-report data obtained from 6106 first-year South Carolina students whocompleted all three AlcoholEdu for College Surveys.
Note: An additional 309 students completed Part 1 of the course, but did not complete all three surveys so were not includedin the final data set.
» When measured prior to their arrival on campus, your students' drinking rates are above the national average.
» When measured midway through the fall semester, 33% of South Carolina students reported drinking in a highrisk way.
» South Carolina students are most commonly drinking at an Off-campus residence or a Bar or nightclub.
» The most common drinking-related risk behaviors that your students engage in are pregaming and doingshots.
» Drinking rates differ for men and women. Women are drinking in a high-risk way less frequently than men.
» After completing AlcoholEdu, students reported increases in positive behavioral intentions. Among high-riskdrinkers who did not see a need to change their drinking behavior before the course, 41% indicated a readinessto change their drinking after completing the course.
2

Understanding "The College Effect"
Student drinking rates nationally follow a typical pattern: alcohol use generally rises the summerbefore a student enters college, and then increases substantially after arriving on campus. Thisphenomenon, known as the "College Effect," is represented by the conceptual graphic below.
*Drinking rate is the proportion of students who have had more than a taste or sip of alcohol in the two weeks prior to the survey.3
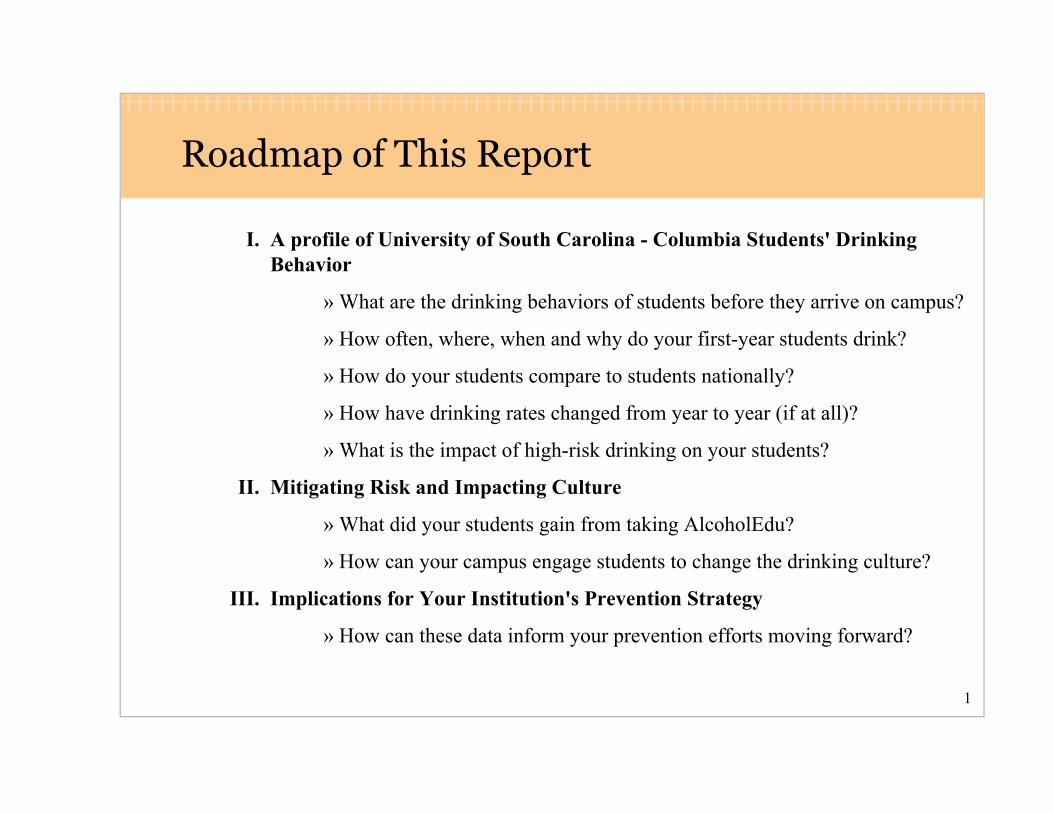
A Profile of Your Incoming Students
In looking at the drinking rates of students prior to their arrival on campus (Survey 1), your institutionis above the national average for high-risk drinkers. Understanding these pre-college drinkingbehaviors can help your campus establish appropriate messaging that sets clear behavioralexpectations early in the semester.
(Includes 7% Problematic)
(Includes 5% Problematic)
» Non-drinkers: 0 drinks in the past two weeks
» Light/Moderate drinkers: 1-3 drinks for women; 1-4 drinks for men on at least one occasion in the past two weeks
» High-risk drinkers: 4 or more drinks for women; 5 or more drinks for men on at least one occasion in the past two weeks (includes Problematic drinkers - 8 or more drinks for women; 10 ormore drinks for men) 4
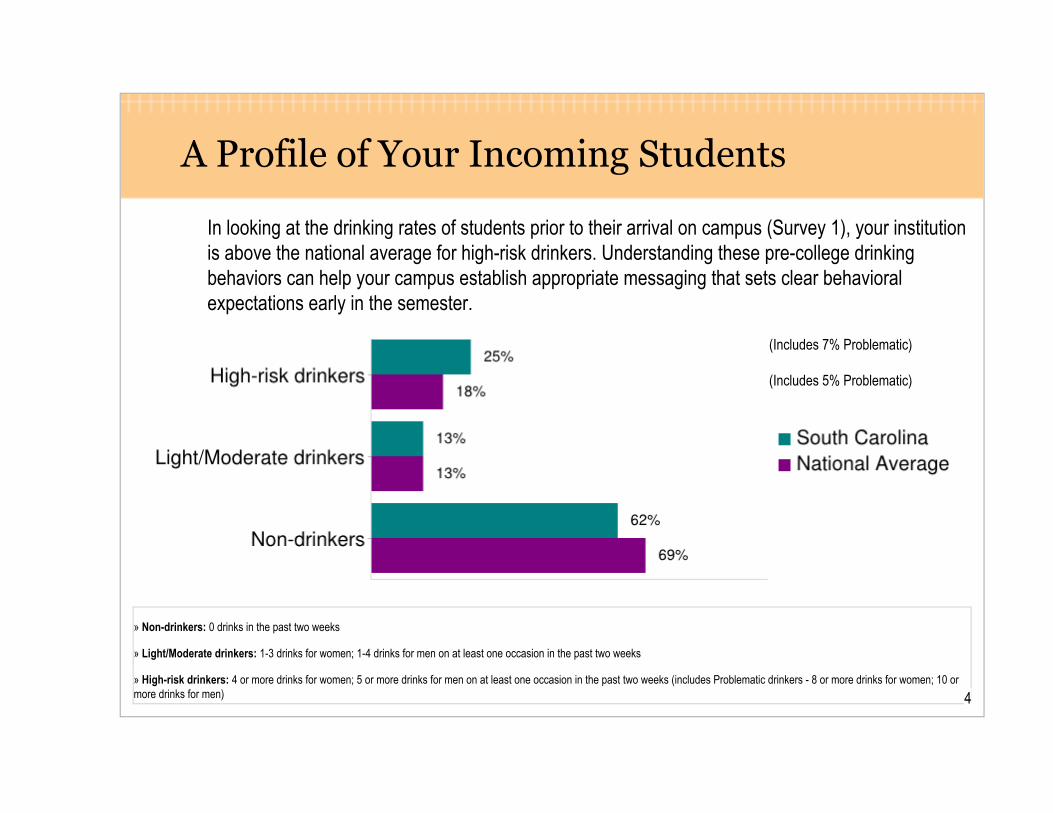
Benchmarking Your Drinking Rate Data
The data below shows your first-year student drinking rates measured midway through the fallsemester (Survey 3) as compared to the national aggregate for all students taking AlcoholEdu duringthe same time period.
Note: As drinking rates vary from campus to campus, it may be helpful to also compare your rates tothose of a peer group (by region, athletic conference, Carnegie classification, etc.). If you areinterested in a peer benchmark report, please contact your Partner Service Director.
(Includes 11% Problematic)
(Includes 8% Problematic)
5

Examining Gender Differences
Midway through the fall semester (Survey 3), the drinkingrates are similar for men and women.
Additionally, women report drinkingin a high-risk way* less frequentlythan men.
Frequency of high riskdrinking in the past twoweeks (Drinkers only)
Males Females
Never 40% 50%
Once 27% 25%
Twice 18% 15%
Three or more times 16% 10%
*In response to the question: During the past two weeks,how many times have you had five or more drinks (for
men)/four our more drinks (for women) in a row within a 2hour period?
6

Observing Drinking Rates Across Years
Drinking rates have remained steady over the last four years. It is important to consider the multiplefactors that influence drinking rates and how these factors may vary from year to year on yourcampus.
Typical factors impacting collegestudents' drinking rates from yearto year:» Alcohol policy changes» Changes in enforcement of alcoholpolicy» Shifts in composition of first yearclass» Consistency in the timing of datacollection
Data represents student responses collected in Survey 3, 30-45 days after completing AlcoholEdu for College. 7

Identifying Peak Drinking Days
Understanding drinking behaviors across time may be useful for identifying weekly patterns ortargeting highest-risk days/events for prevention and enforcement efforts.
Note: This is a snapshot of a 3-week period of time during the fall semester. As drinking rates are impacted by academic calendars, campus-wideevents, holidays, etc., these rates may not be reflective of drinking patterns across the entire semester. 8

Where Students Drink
South Carolina students are most commonly drinking at an off-campus residence or a bar ornightclub. Every effort should be made to target these particular locations with increased preventionand enforcement initiatives.
SouthCarolina National
Off-campus residence 39% 41%
Bar or nightclub 29% 10%
Athletic event 11% 3%
On-campus residence 10% 24%
All other location(s) 12% 22%
Data represents student responses collected in Survey 3, 30-45 days after completing AlcoholEdu for College.
9
Reasons for Drinking or Not Drinking
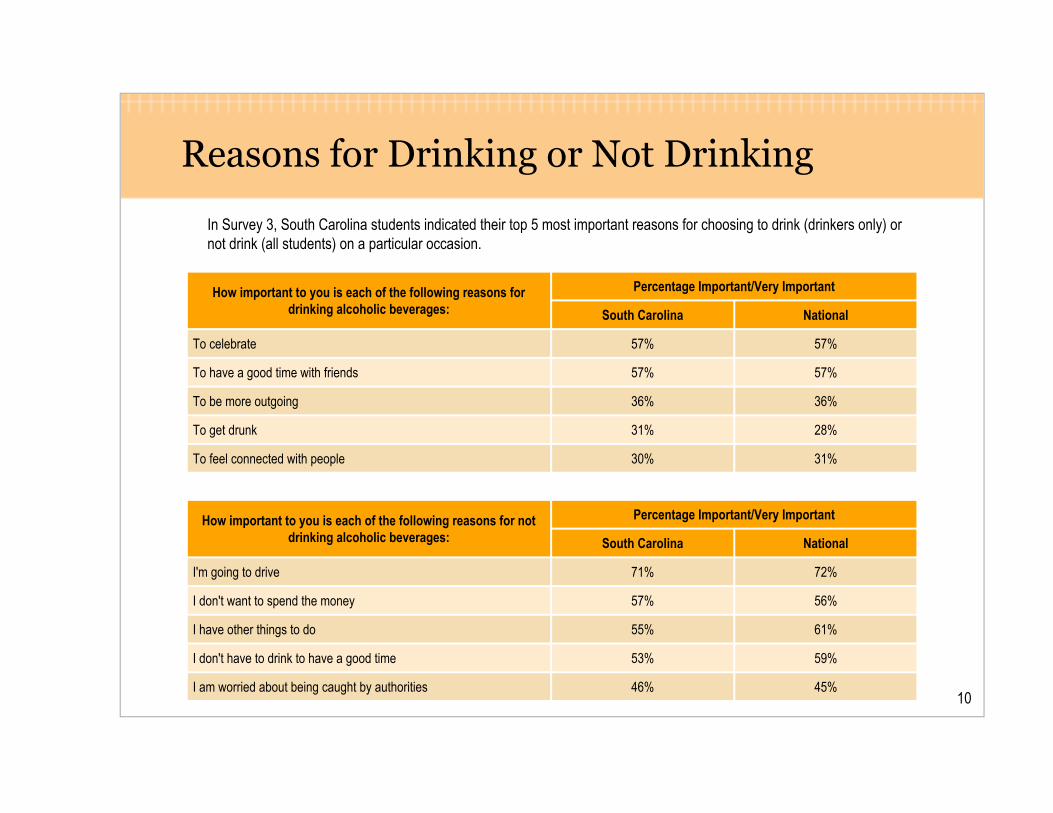
In Survey 3, South Carolina students indicated their top 5 most important reasons for choosing to drink (drinkers only) ornot drink (all students) on a particular occasion.
Percentage Important/Very ImportantHow important to you is each of the following reasons fordrinking alcoholic beverages: South Carolina National
To celebrate 57% 57%
To have a good time with friends 57% 57%
To be more outgoing 36% 36%
To get drunk 31% 28%
To feel connected with people 30% 31%
Percentage Important/Very ImportantHow important to you is each of the following reasons for notdrinking alcoholic beverages: South Carolina National
I'm going to drive 71% 72%
I don't want to spend the money 57% 56%
I have other things to do 55% 61%
I don't have to drink to have a good time 53% 59%
I am worried about being caught by authorities 46% 45%10

Prioritizing Student Engagement
Effective prevention includes actively engaging students to reinforce positive behavioral intentions ofdrinkers and non-drinkers alike. The data below can inform decisions around investments in planningand prioritizing alcohol-free activities.
This year, your students are most interested in the following activities:
#1 Movie Nights 2113 students
#2 Live Music 1979 students
#3 Fitness Classes (pilates, yoga, spinning) 1886 students
#4 Intramural Sports Tournaments 1788 students
#5 Outdoor Adventures 1554 students
#6 Community Service 1427 students
In addition, this year 732 students indicated an interest in planning alcohol-free events and activities.
To download the names and contact information of students interested in these activities and others, or to view data on any custom activities youmay have added to this exercise, please visit the Student Engagement section of the Hub. 11

Drinking-Related Risk Behaviors
The most common drinking-related risk behaviors that your students engage in are pregaming anddoing shots. South Carolina may consider dedicating educational efforts that highlight the risksassociated with these specific behaviors.
Note: Graph represents grouped responses of 5, 6, and 7 on a 7-point scale (1 = not at all; 7 = always) for drinkers only. 12
Negative Consequences of Drinking
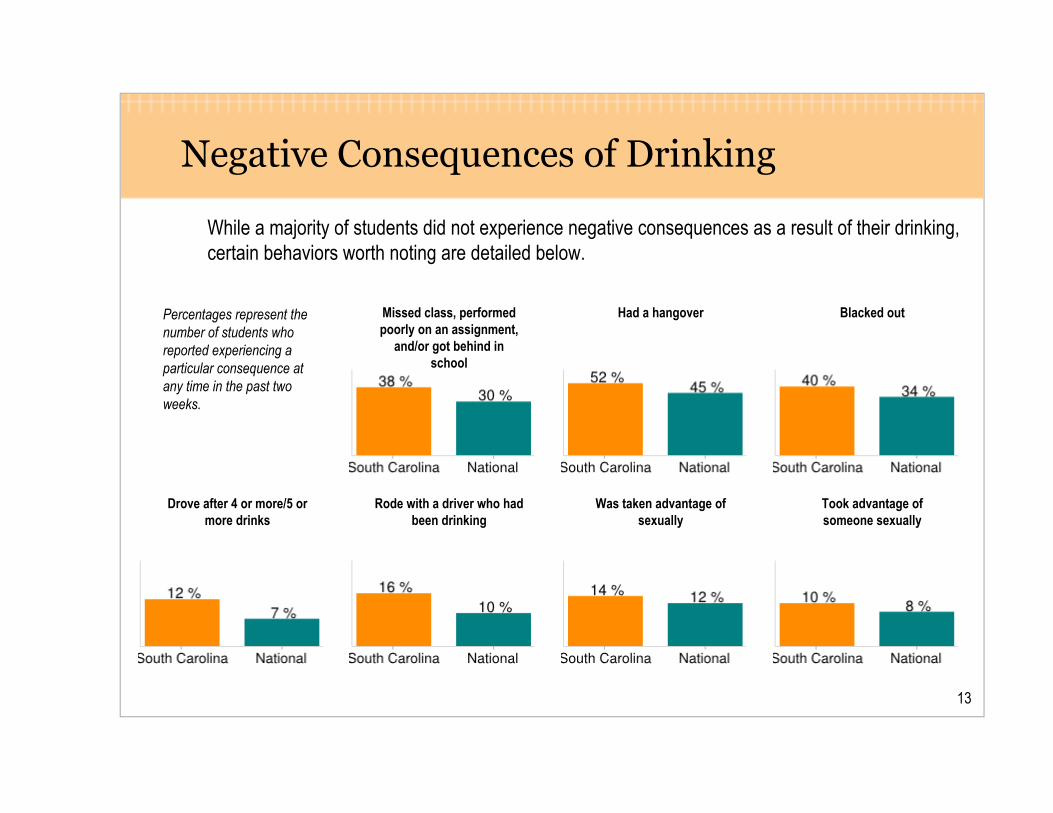
While a majority of students did not experience negative consequences as a result of their drinking,certain behaviors worth noting are detailed below.
Percentages represent thenumber of students whoreported experiencing aparticular consequence atany time in the past twoweeks.
Missed class, performedpoorly on an assignment,
and/or got behind inschool
Had a hangover Blacked out
Drove after 4 or more/5 ormore drinks
Rode with a driver who hadbeen drinking
Was taken advantage ofsexually
Took advantage ofsomeone sexually
13

Gains from AlcoholEdu
AlcoholEdu has enabled South Carolina to provide students with a baseline of knowledge anddecision-making strategies around alcohol use.
Exam Scores, Fall 2013 In Fall 2013, students reported that AlcoholEdu...
Helped me establish a plan forresponsible decisions around alcohol
Prepared me to identify and/or helpsomeone who has alcohol poisoning
Stimulated me to reflect on mypersonal attitudes and behaviors
Changed my perceptions of others'drinking-related behaviors
Data represents student responses collected in Survey 2, immediately following completion of Part 1 of AlcoholEdu.14

Course Impact on Those at Greatest Risk
Among the 55% of high risk drinkers (871 students) who saw "no need to change the way they drink"before taking AlcoholEdu, 41% (357 students) indicated their readiness to change after completingthe course.
High Risk DrinkersPre-Course
High Risk DrinkersPost-Course
I am currently trying to drinkin a healthier/safer way
I am ready to try drinking in ahealthier/safer way
I am thinking about drinkingin a healthier/safer way
I see no need to change theway I drink alcohol
Data represents student responses collected just before (Survey 1) and immediately following (Survey 2) Part 1 of AlcoholEdu for College.
15

Positive Behavioral Intentions
After completing AlcoholEdu, South Carolina students reported an increase in several positivebehavioral intentions. Programming efforts aimed at further promoting these behaviors can reinforcethe messages students received through AlcoholEdu.
Intention has beenshown to be the mostimportant variable inpredicting behavior
change (Ajzen, 1991).
16

Guiding Principles for Success
Beyond what the data reveals, there are a number of guiding principles that drive successfulprevention efforts.
1. Be intentional with efforts and gather data on whether they succeed.
2. Don't try to do it all - a few targeted interventions can be very effective.
3. Stay attuned to new research to inform your efforts.
4. Implement programs strategically to mitigate costs.
5. Test your messages and strategies against the research base, behavior theory, and your instincts.
6. Develop a comprehensive prevention program that includes complementary efforts.
7. Ground all strategies in data.
8. Make decisions based upon your unique culture, allies, and resources.
17

Additional Resources
You may also request reports that allow you to benchmark your data against that of specific peergroups such as athletic conferences, national affiliations, regional groups and others.
For assistance accessing your online reports, or to request peer benchmark reports, please contactyour Partner Service Director.
Lexie [email protected]
Abby [email protected]
Lisa [email protected]
Katie [email protected]
Linda [email protected]
Maggie [email protected]
C.W. [email protected]
18


![Food security and nutrition: building a global narrative ... · EXECUTIVE SUMMARY EXECUTIVE SUMMARY EXECUTIVE SUMMARY EXECUTIVE SUMMAR Y [ 2 ] This document contains the Summary and](https://img.pdfslide.us/doc/110x75/5ff5433612d22125fb06e6b5/food-security-and-nutrition-building-a-global-narrative-executive-summary-executive.jpg)