Embed Size (px)
DESCRIPTION
20130903 Morgan Stanley China Deleveraging
Citation preview
China DeleveragingShallow U, Deep U or W?
ASIA / PACIFIC RESEARCH 3 SEPtEmbER 2013
Helen QiaoChief Greater China Economist
Yuande ZHuChina Economics Research Team
Yin ZHangChina Economics Research Team
2
M O R G A N S T A N L E Y R E S E A R C H
September 3, 2013 China Deleveraging
Helen Qiao 1 +852 2848 6511 [email protected]
Yuande Zhu 1 +852 2239 7820 [email protected]
Yin Zhang 1 +852 2239 7818 [email protected]
1 Morgan Stanley Asia Limited+
China Deleveraging Series
Can China Achieve a ‘Beautiful’ Deleveraging?
Aug 27, 2013
Can Banks Ride Out a Financial Storm?
Aug 9, 2013
A Bumpy Ride Ahead
July 23, 2013
Morgan Stanley does and seeks to do business with companies covered in Morgan Stanley Research. As a result, investors should be aware that the firm may have a conflict of interest that could affect the objectivity of Morgan Stanley Research. Investors should consider Morgan Stanley Research as only a single factor in making their investment decision.
For analyst certification and other important disclosures, refer to the Disclosure Section, located at the end of this report. += Analysts employed by non-U.S. affiliates are not registered with FINRA, may not be associated persons of the member and may not be subject to NASD/NYSE restrictions on communications with a subject company, public appearances and trading securities held by a research analyst account.
M O R G A N S T A N L E Y R E S E A R C H
September 3, 2013 China Deleveraging
Contents
China Deleveraging: Shallow U, Deep U or W? .............................................................................................................................. 4
Summary............................................................................................................................................................................................ 4
Part I: How Did Leverage Accumulate?........................................................................................................................................... 5
1. Leverage has built up most significantly in the corporate sector ..................................................................................................... 5 2. Three-wave investment expansion since 2008 ............................................................................................................................... 6
Part II: This Time, It’s Different ........................................................................................................................................................ 8
1. Slower productivity gains failed to boost equity growth by as much as the rise in liabilities ............................................................ 8 2. Leverage is highly concentrated in a few sectors............................................................................................................................ 8
Part III: What Made It Worse?......................................................................................................................................................... 10
1. Easy financial conditions kept credit expanding for longer ............................................................................................................ 10 2. The absence of an appropriate risk-pricing mechanism worsened the distortion in resource allocation ....................................... 10 3. The uneven playing field favoring SOEs over private firms has discouraged competition and slowed productivity gains............. 11
Part IV: Lessons from Previous Deleveraging Periods................................................................................................................ 12
Box A: Deleveraging and reforms in the 1990s ................................................................................................................................. 13
Part V: How Is Deleveraging Likely to Unfold?............................................................................................................................. 14
1. Shallow U – Controlled deleveraging ............................................................................................................................................ 15 2. Deep U – Mismanaged deleveraging ............................................................................................................................................ 15 3. W – Disorderly deleveraging ......................................................................................................................................................... 16 4. What we think is the most likely shape.......................................................................................................................................... 17 5. Our proprietary indicator may show greater fluctuations ............................................................................................................... 18
Box B: Launching the MS China Economic Index (MS-CHEX) ......................................................................................................... 19
Conclusions..................................................................................................................................................................................... 20
3
M O R G A N S T A N L E Y R E S E A R C H
September 3, 2013 China Deleveraging
China Deleveraging: Shallow U, Deep U or W?
Summary
It seems our development is always achieved by some acceleration during a certain period, followed by revealing and solving the problems from that period, before we move on. Ultimately, we would be in a controlling position to resolve the conflicts and problems if there were more resources at hand. For a large emerging country like ours, it will unlikely be always peaceful and stable if economic development is rapid. … Development is the fundamental principal. We need to be clear about it.
-- Deng Xiaoping during his southern tour in 1992
We believe China is at a critical phase in a fundamental transition in its economic and social structure. An overleveraged corporate sector was the by-product of the policy stimulus program implemented in response to the global financial crisis in 2008. Easy financial conditions fueled a three-wave investment boom – in infrastructure (2009), real estate (2010) and mining and manufacturing (2011) – which ultimately gave rise to sectoral overcapacity and potential financial stability risks.
The root cause of the structural imbalance was the deceleration in productivity gains in the investment-fueled and state-led growth model. In contrast to previous credit booms, leverage in the latest cycle was concentrated in a few sectors where slower productivity gains failed to boost equity growth to match that for liabilities. Slowing productivity gains and increasing overcapacity should have served as early warning signs of a cyclical downturn, prompting the reining in of credit expansion. Instead, easy monetary conditions, the absence of appropriate risk-pricing mechanisms in the financial industry, and an uneven playing field that favored state-owned enterprises over private firms only worsened the problem.
The ultimate goal of the long-term transition is to achieve guo tui min jin (the private sector advances and the state retreats) without sacrificing short-term macro stability. Our analysis of past experience in deleveraging and reforms shows it is important to make room for private sector participation to raise productivity gains while using a policy cushion to prevent a hard landing in the economy. In our view, Chinese policy makers demonstrate a strong will for pushing forward reform and have started to deliver on structural adjustments. The recent shift towards a more pro-growth stance suggests the administration recognizes the importance of macro stability and will aim to prevent tail-risk events.
What is the likely shape of deleveraging? As deleveraging gets under way, we expect economic growth to slow. In this report, the fourth in our China Deleveraging Series (see box), we analyze the possible shapes and durations of the growth trajectories molded by the range of policy options available and external demand outcomes. We also summarize the triggers of the different growth trajectories from the external environment, domestic demand and government policy decisions. By illustrating the possible unfolding of events along various paths with important signposts, we draw a roadmap for China’s economy whereby we think a relatively smooth deleveraging process could be achieved. We believe that China will end up on a growth trajectory that is close to the Shallow U scenario.
In leading up to our conclusions, we also look at the origin and concentration of leverage by sector, why credit expansion in this cycle caused leverage to build more than in previous similar cycles and what we can learn from past deleveraging. Since volatility in the economy will likely rise further over time, we believe our proprietary indicator, MS-China Economic Index (MS-CHEX), offers an alternative gauge on the current state of the economy to better forecast the policy response. If China navigates this important transition smoothly in the next one to two years, we believe the economic structure will be more balanced, featuring greater private sector involvement and larger shares for services and consumption in GDP.
China Deleveraging Series The first report in the series, “A Bumpy Ride Ahead” (July 23), laid out the macro drivers behind the need for deleveraging and some of the long-run challenges facing China’s economic model. The second, “Can Banks Ride Out a Financial Storm?” (August 9), focused on the banking system, assessing in particular whether and how it can work through a high-risk loan portfolio that we estimate at around 10% of system assets. The third posed the question, “Can China Achieve a ‘Beautiful’ Deleveraging?” (August 27). This would mean that China’s period of excessive credit growth comes to a halt, and it achieves an economic rebalancing, without an overly pronounced or prolonged recession. The short answer to our question is “Yes,” but achieving a beautiful deleveraging will not be easy.
4
M O R G A N S T A N L E Y R E S E A R C H
September 3, 2013 China Deleveraging
Part I: How Did Leverage Accumulate?
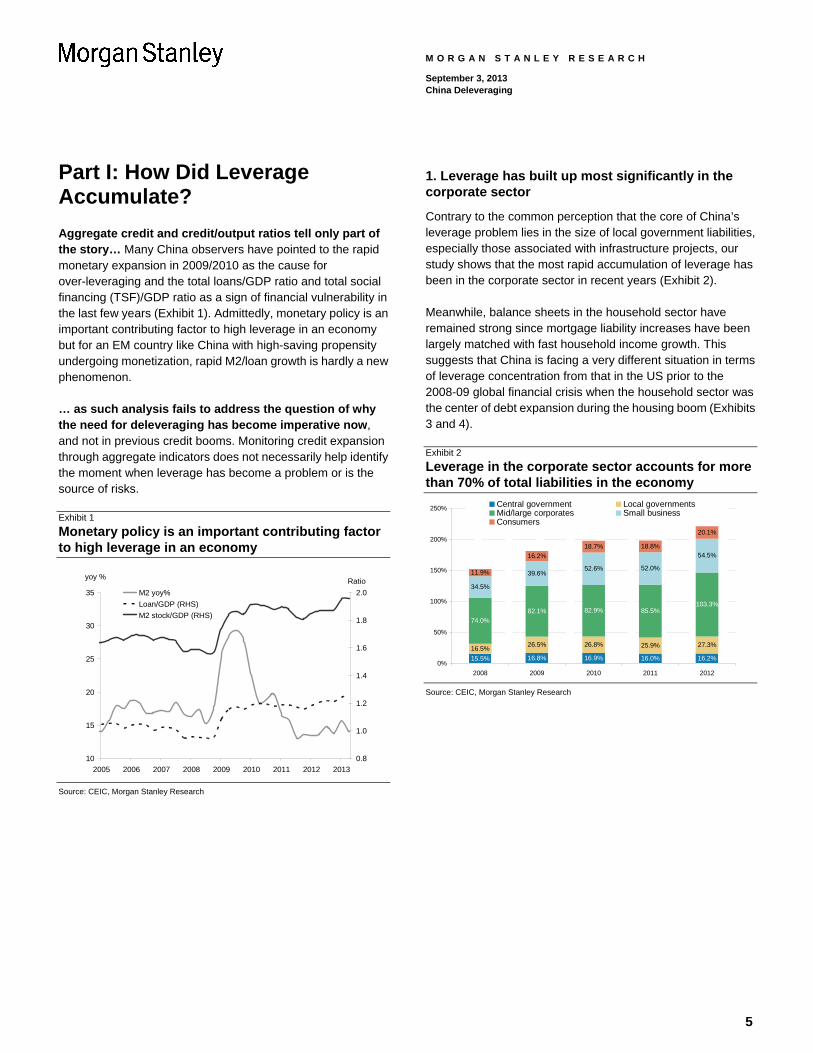
Aggregate credit and credit/output ratios tell only part of the story… Many China observers have pointed to the rapid monetary expansion in 2009/2010 as the cause for over-leveraging and the total loans/GDP ratio and total social financing (TSF)/GDP ratio as a sign of financial vulnerability in the last few years (Exhibit 1). Admittedly, monetary policy is an important contributing factor to high leverage in an economy but for an EM country like China with high-saving propensity undergoing monetization, rapid M2/loan growth is hardly a new phenomenon.
… as such analysis fails to address the question of why the need for deleveraging has become imperative now, and not in previous credit booms. Monitoring credit expansion through aggregate indicators does not necessarily help identify the moment when leverage has become a problem or is the source of risks.
Exhibit 1
Monetary policy is an important contributing factor to high leverage in an economy
10
15
20
25
30
35
2005 2006 2007 2008 2009 2010 2011 2012 2013
Ratio
0.8
1.0
1.2
1.4
1.6
1.8
2.0M2 yoy%
Loan/GDP (RHS)
M2 stock/GDP (RHS)
yoy %
Source: CEIC, Morgan Stanley Research
1. Leverage has built up most significantly in the corporate sector
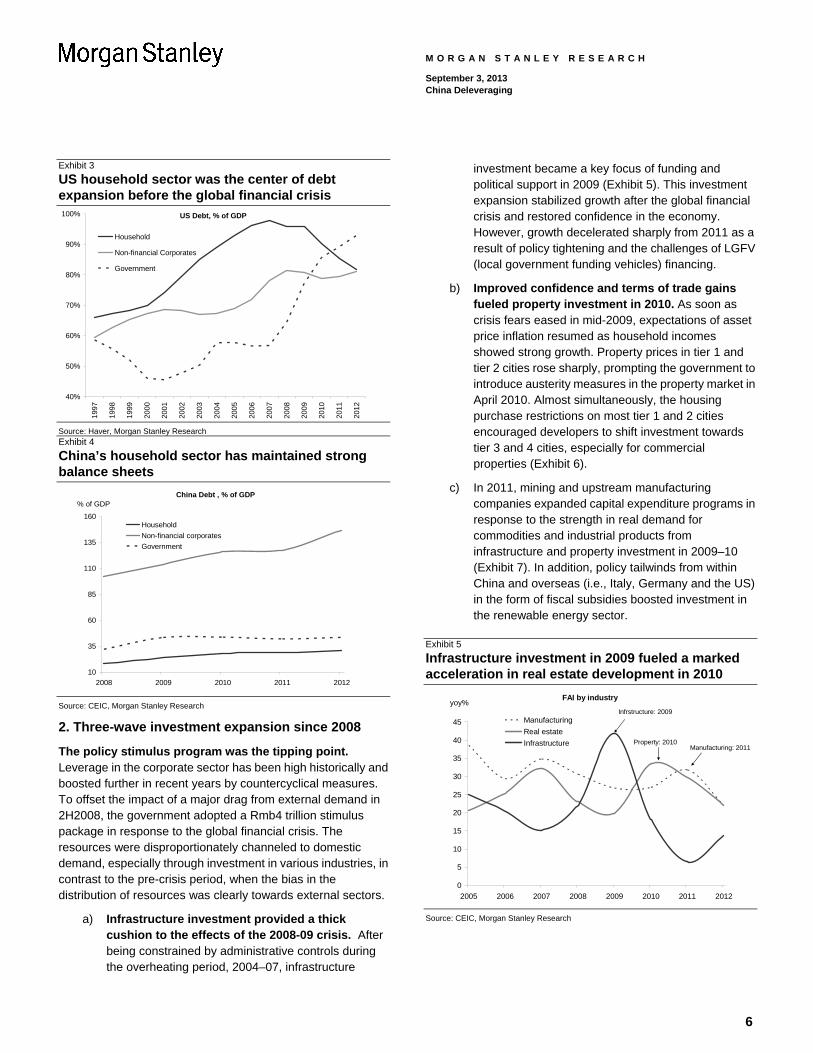
Contrary to the common perception that the core of China’s leverage problem lies in the size of local government liabilities, especially those associated with infrastructure projects, our study shows that the most rapid accumulation of leverage has been in the corporate sector in recent years (Exhibit 2).
Meanwhile, balance sheets in the household sector have remained strong since mortgage liability increases have been largely matched with fast household income growth. This suggests that China is facing a very different situation in terms of leverage concentration from that in the US prior to the 2008-09 global financial crisis when the household sector was the center of debt expansion during the housing boom (Exhibits 3 and 4).
Exhibit 2
Leverage in the corporate sector accounts for more than 70% of total liabilities in the economy
15.5% 16.8% 16.9% 16.0% 16.2%
16.5%26.5% 26.8% 25.9% 27.3%
74.0%
82.1% 82.9% 85.5%103.3%
34.5%
39.6%52.6% 52.0%
54.5%
11.9%
16.2%
18.7% 18.8%
20.1%
0%
50%
100%
150%
200%
250%
2008 2009 2010 2011 2012
Central government Local governmentsMid/large corporates Small businessConsumers
Source: CEIC, Morgan Stanley Research
5
M O R G A N S T A N L E Y R E S E A R C H
September 3, 2013 China Deleveraging
Exhibit 3
US household sector was the center of debt expansion before the global financial crisis
40%
50%
60%
70%
80%
90%
100%
199
7
199
8
199
9
200
0
200
1
200
2
200
3
200
4
200
5
200
6
200
7
200
8
200
9
201
0
201
1
201
2
Household
Non-financial Corporates
Government
US Debt, % of GDP
Source: Haver, Morgan Stanley Research Exhibit 4
China’s household sector has maintained strong balance sheets
China Debt , % of GDP
10
35
60
85
110
135
160
2008 2009 2010 2011 2012
% of GDP
Household
Non-financial corporates
Government
Source: CEIC, Morgan Stanley Research
2. Three-wave investment expansion since 2008
The policy stimulus program was the tipping point. Leverage in the corporate sector has been high historically and boosted further in recent years by countercyclical measures. To offset the impact of a major drag from external demand in 2H2008, the government adopted a Rmb4 trillion stimulus package in response to the global financial crisis. The resources were disproportionately channeled to domestic demand, especially through investment in various industries, in contrast to the pre-crisis period, when the bias in the distribution of resources was clearly towards external sectors.
a) Infrastructure investment provided a thick cushion to the effects of the 2008-09 crisis. After being constrained by administrative controls during the overheating period, 2004–07, infrastructure
investment became a key focus of funding and political support in 2009 (Exhibit 5). This investment expansion stabilized growth after the global financial crisis and restored confidence in the economy. However, growth decelerated sharply from 2011 as a result of policy tightening and the challenges of LGFV (local government funding vehicles) financing.
b) Improved confidence and terms of trade gains fueled property investment in 2010. As soon as crisis fears eased in mid-2009, expectations of asset price inflation resumed as household incomes showed strong growth. Property prices in tier 1 and tier 2 cities rose sharply, prompting the government to introduce austerity measures in the property market in April 2010. Almost simultaneously, the housing purchase restrictions on most tier 1 and 2 cities encouraged developers to shift investment towards tier 3 and 4 cities, especially for commercial properties (Exhibit 6).
c) In 2011, mining and upstream manufacturing companies expanded capital expenditure programs in response to the strength in real demand for commodities and industrial products from infrastructure and property investment in 2009–10 (Exhibit 7). In addition, policy tailwinds from within China and overseas (i.e., Italy, Germany and the US) in the form of fiscal subsidies boosted investment in the renewable energy sector.
Exhibit 5
Infrastructure investment in 2009 fueled a marked acceleration in real estate development in 2010
FAI by industry
0
5
10
15
20
25
30
35
40
45
2005 2006 2007 2008 2009 2010 2011 2012
yoy%
Manufacturing
Real estate
Infrastructure
Infrstructure: 2009
Property: 2010Manufacturing: 2011
Source: CEIC, Morgan Stanley Research
6
7
M O R G A N S T A N L E Y R E S E A R C H
September 3, 2013 China Deleveraging
Exhibit 6 Although each of the three waves of investment turned out to be short-lived, the impact on firms’ balance sheets lasted much longer. Infrastructure investment started to decelerate in 2010 as the policy stimulus dwindled. It slowed further in 2011 as the nuclear plant incident in Japan and the high-speed rail accident in China sparked concerns on quality implications of overly rapid infrastructure expansion. In 2H2011, monetary tightening in response to economic overheating and higher inflation lowered property and industrial investment (Exhibit 8). Nonetheless, none of the three waves of investment expansion bolstered the pace of equity increase to match the ever-rising leverage.
Developers shifted focus towards real estate investment in tier 3 and 4 cities
Floor area under construction
0
5
10
15
20
25
30
35
2005 2006 2007 2008 2009 2010 2011 2012
yoy%Tier 1&2 cities, residentialTier 3&4 cities, residentialTier 1&2 cities, commericalTier 3&4 cities, commercial
Exhibit 8
Policy tightening lowered property investment
-60
-40
-20
0
20
40
60
80
100
2005 2006 2007 2008 2009 2010 2011 2012 2013
yoy%
Land area purchased
Floor space started
Source: CEIC, Morgan Stanley Research Exhibit 7
Mining and upstream manufacturing sectors continued with capex expansion
8
10
12
14
16
18
20
22
24
26
28
Mining andupstream
manufacturing
Downstreammanufactuirng
Real estate Infrastructure
% share 2007
2009
2011
Source: CEIC, Morgan Stanley Research
Source: CEIC, Morgan Stanley Research
M O R G A N S T A N L E Y R E S E A R C H
September 3, 2013 China Deleveraging
Part II: This Time, It’s Different
1. Slower productivity gains failed to boost equity growth by as much as the rise in liabilities
The rapid credit expansion in 2003-07 did not lead to excessive leverage. What is different this time? The key is the pace of productivity growth in the industrial sector before and after the global financial crisis. Our analysis reveals a gradual slowdown in labor productivity in manufacturing since 2007, which ultimately reinforced leverage conditions as credit expansion continued (Exhibit 9).
Exhibit 9
Manufacturing labor productivity growth slowed while unit labor costs started to creep up
-15
-10
-5
0
5
10
15
20
25
30
35
2001 2002 2003 2004 2005 2006 2007 2008 2009 2010 2011 2012
yoy % Manufacturing nominal wage
Manufacturing labor productivity
Manufacturing unit labor cost
Source: CEIC, Morgan Stanley Research
Although infrastructure investment tends to improve efficiency in the long run (e.g. high-speed rail and subway promote a more productive use of time) and property development boosts consumption at the current household income level, neither can serve as a sustainable source of growth by itself or even combined.
For mining and upstream manufacturing sectors (e.g., raw materials, machinery and equipment), the precondition for further productivity gains has to originate in capex expansion through technology upgrades. However, an environment of sluggish global demand and a strong tightening bias in domestic policies from 2H2011 thwarted such advanced
technology-led productivity increases in the manufacturing sector.
2. Leverage is highly concentrated in a few sectors
Our bottom-up analysis reveals a more granular picture of a few areas in the secondary industry where deleveraging is perhaps unavoidable. In these sectors, capex expansion has translated into a marked increase in liability-asset ratios since 2009. We screened the sectors with high leverage with two criteria: i) sectors with the largest increase in liability/asset ratios since 2008 (Exhibit 10); and ii) sectors with the highest liability/asset ratios (Exhibit 11).
A closer look at these sectors suggests leverage is concentrated in areas dominated by large enterprises, especially SOEs. In these sectors, overcapacity appears to present a considerable challenge. In the absence of capacity utilization data for industrial sectors, we approximate the extent of overcapacity by comparing recent PPI changes in these sectors against those in 4Q2009 (Exhibit 12). When we examine both sets of price changes against an environment of weak global demand, the highly leveraged sectors seem to suffer from much weaker pricing power than other sectors do or they themselves did in the past, implying severe overcapacity issues in these areas.
Exhibit 10
Mining and metal smelting & pressing had highest incremental change in liability/asset ratios
Top 5 leverage-up industrial sectors
35 40 45 50 55 60 65 70
Water Production&Supply
Ferrous MetalSmelting and
Pressing
Non-Ferrous MetalSmelting and
Pressing
Petroleum & NaturalGas Mining
Ferrous Metal Mining
Liability/Asset ratio (%)
2012
2008
Source: CEIC, Morgan Stanley Research
8
M O R G A N S T A N L E Y R E S E A R C H
September 3, 2013 China Deleveraging
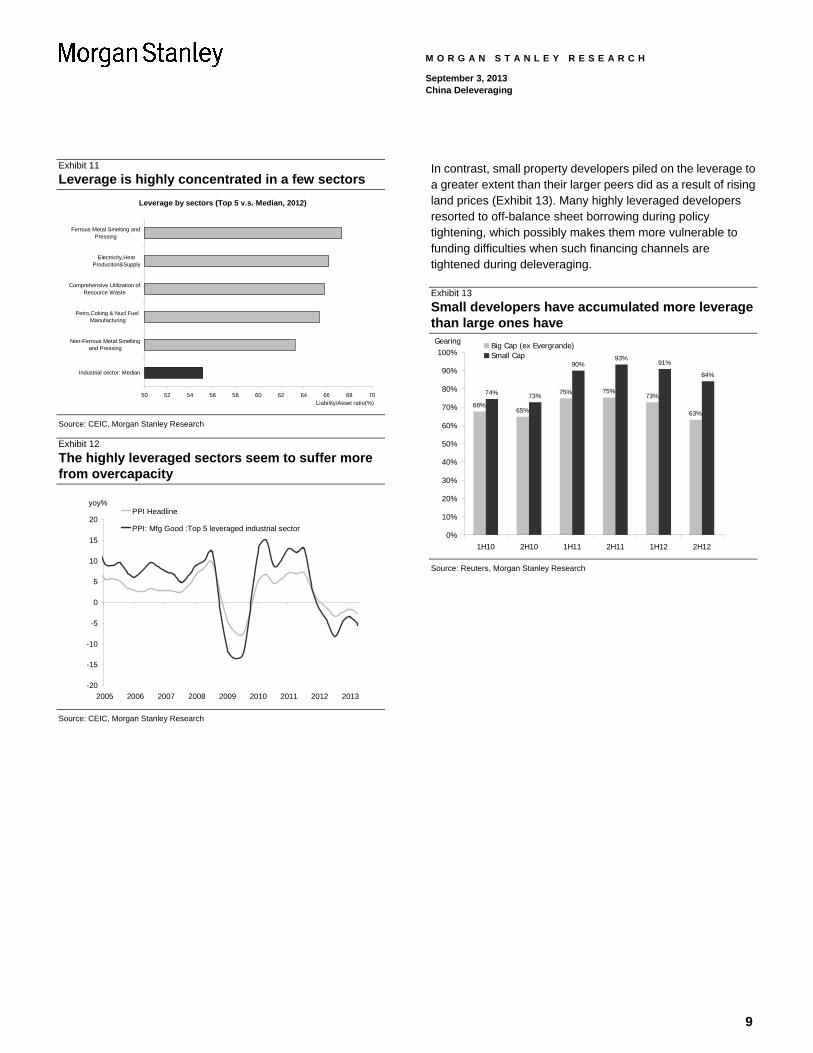
Exhibit 11
Leverage is highly concentrated in a few sectors
Leverage by sectors (Top 5 v.s. Median, 2012)
50 52 54 56 58 60 62 64 66 68 70
Industrial sector: Median
Non-Ferrous Metal Smeltingand Pressing
Petro,Coking & Nucl Fuel Manufacturing
Comprehensive Utilization ofResource Waste
Electricity,HeatProduciton&Supply
Ferrous Metal Smelting andPressing
Liability/Asset ratio(%)
Source: CEIC, Morgan Stanley Research Exhibit 12
The highly leveraged sectors seem to suffer more from overcapacity
-20
-15
-10
-5
0
5
10
15
20
2005 2006 2007 2008 2009 2010 2011 2012 2013
yoy%PPI Headline
PPI: Mfg Good :Top 5 leveraged industrial sector
Source: CEIC, Morgan Stanley Research
In contrast, small property developers piled on the leverage to a greater extent than their larger peers did as a result of rising land prices (Exhibit 13). Many highly leveraged developers resorted to off-balance sheet borrowing during policy tightening, which possibly makes them more vulnerable to funding difficulties when such financing channels are tightened during deleveraging.
Exhibit 13
Small developers have accumulated more leverage than large ones have
68%65%
75% 75%73%
63%
74% 73%
90%93%
91%
84%
0%
10%
20%
30%
40%
50%
60%
70%
80%
90%
100%
1H10 2H10 1H11 2H11 1H12 2H12
Big Cap (ex Evergrande)Small Cap
Gearing
Source: Reuters, Morgan Stanley Research
9
M O R G A N S T A N L E Y R E S E A R C H
September 3, 2013 China Deleveraging
Part III: What Made It Worse?
Slowing productivity gains and increasing overcapacity should have been early warning signs of a cyclical downturn, prompting the reining in of credit expansion. Instead, easy financial conditions, the absence of appropriate risk-pricing mechanisms in the financial sector, and an uneven playing field favoring SOEs over private companies only worsened the problem.
1. Easy financial conditions kept credit expanding for longer
After aggressively loosening monetary conditions in 2009, the government reversed its stance to a tightening bias but maintained accommodative financial conditions for most of 2010 and 1H2011 to prevent economic activities from suddenly grinding to a halt. In addition, the unconventional monetary stance adopted by major DM central banks made it difficult for China to tighten its monetary policy without attracting inflows of hot money. Against such a backdrop, financial conditions turned out to be more accommodative than warranted by the domestic environment, prolonging the credit expansion.
2. The absence of an appropriate risk-pricing mechanism worsened the distortion in resource allocation
i) SOEs have access to cheaper funding because of the perception that they present less risk
Traditional financial intermediation thorough commercial banks tends to favor applications for loans from companies that are relatively large and have a low-risk profile. Implicit credit guarantees from central or local governments tend to provide large SOEs and LGFVs with some differentiation when borrowing from Chinese commercial banks (Exhibit 14). Consequently, the potential financial imbalance from such a biased lending system may give rise to moral hazard and crowd out SMEs from low-cost loan financing.
Admittedly, SOEs have borrowed more than they need and lent out the excess funds to related small firms through entrusted loans. While this secondary borrowing market helps reduce the distortion in intermediation in resource distribution, funding mispricing still leaves SOEs with a low hurdle for capital misuse even in sectors with widespread overcapacity.
ii) Lack of financial solution for LGFVs
Since local governments cannot issue bonds or borrow loans1, they have relied upon LGFVs to finance long-term infrastructure projects. During the infrastructure investment boom in 2009, LGFVs enjoyed preferential credit access from banks largely because of implicit government guarantees. Although the scale of LGFV borrowing has been limited since early 2010, the central government has yet to propose a solution for financing local government–led infrastructure projects. After the sharp drop in receipts from land sales in 2011–1H2012, some local governments ventured into off-balance sheet borrowing to finance public investment despite the high funding costs when other financing avenues were blocked by macro prudential measures.
iii) Rapid financial innovation compounds the risk
Financial liberalization accelerated noticeably in response to monetary tightening in 2H2011. The central bank initially encouraged financial innovation through trust loans, wealth management products, and other forms of off-balance sheet borrowing as an important part of interest rate liberalization. However, without strict regulatory and supervisory oversight, rapid deregulation could potentially induce further risk-taking and lead to financial distress, especially if individual investors and banks were to rely upon the misperception of implicit guarantees on almost any financial instrument.
Financial repression has imposed a serious challenge to resource allocation and economic development. Ultimately, negative real interest rates and quantitative measures to reinforce monetary controls have placed the Chinese economy effectively under financial repression for a sustained period2. It amplified the imbalance in the system by tipping resource allocation more towards SOEs and leaving SMEs to access off-balance sheet (high-cost) borrowing, which induced the rapid expansion of a so-called “shadow banking” system. Financial repression reduced the efficiency of capital allocation through the banking system and led to a fast growing but under-regulated informal funding market, adding risks to the Chinese economy.
1 In a pilot program, Shanghai, Zhejiang, Guangdong and Shenzhen were the first to issue local government bonds in 4Q2011. This program was expanded to include Jiangsu and Shandong recently. 2 The Unloved Dollar Standard – from Bretton Woods to the Rise of China, by Ronald McKinnon, Oxford 2013.
10
11
M O R G A N S T A N L E Y R E S E A R C H
September 3, 2013 China Deleveraging
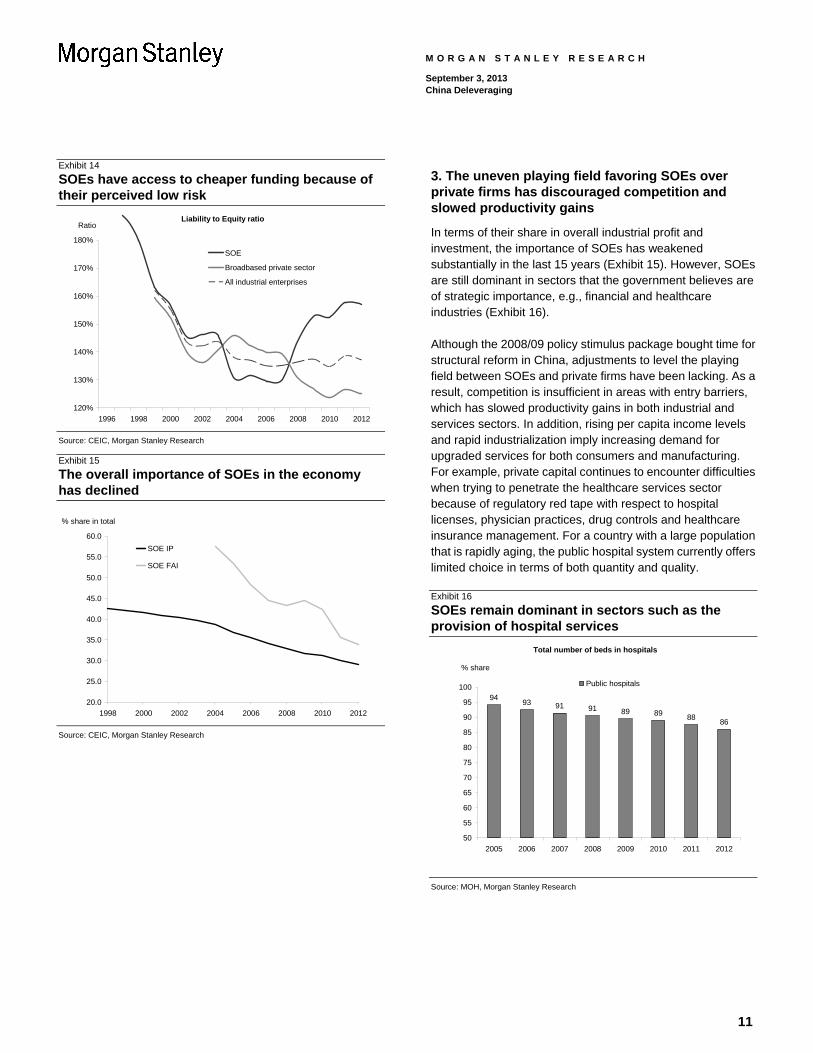
Exhibit 14 3. The uneven playing field favoring SOEs over private firms has discouraged competition and slowed productivity gains
SOEs have access to cheaper funding because of their perceived low risk
Liability to Equity ratio
120%
130%
140%
150%
160%
170%
180%
1996 1998 2000 2002 2004 2006 2008 2010 2012
Ratio
SOE
Broadbased private sector
All industrial enterprises
In terms of their share in overall industrial profit and investment, the importance of SOEs has weakened substantially in the last 15 years (Exhibit 15). However, SOEs are still dominant in sectors that the government believes are of strategic importance, e.g., financial and healthcare industries (Exhibit 16).
Although the 2008/09 policy stimulus package bought time for structural reform in China, adjustments to level the playing field between SOEs and private firms have been lacking. As a result, competition is insufficient in areas with entry barriers, which has slowed productivity gains in both industrial and services sectors. In addition, rising per capita income levels and rapid industrialization imply increasing demand for upgraded services for both consumers and manufacturing. For example, private capital continues to encounter difficulties when trying to penetrate the healthcare services sector because of regulatory red tape with respect to hospital licenses, physician practices, drug controls and healthcare insurance management. For a country with a large population that is rapidly aging, the public hospital system currently offers limited choice in terms of both quantity and quality.
Source: CEIC, Morgan Stanley Research Exhibit 15
The overall importance of SOEs in the economy has declined
20.0
25.0
30.0
35.0
40.0
45.0
50.0
55.0
60.0
1998 2000 2002 2004 2006 2008 2010 2012
% share in total
SOE IP
SOE FAI
Exhibit 16
SOEs remain dominant in sectors such as the provision of hospital services
Total number of beds in hospitals
9493 91 91 89 89 88
86
50
55
60
65
70
75
80
85
90
95
100
2005 2006 2007 2008 2009 2010 2011 2012
% share
Public hospitals
Source: CEIC, Morgan Stanley Research
Source: MOH, Morgan Stanley Research
M O R G A N S T A N L E Y R E S E A R C H
September 3, 2013 China Deleveraging
Part IV: Lessons from Previous Deleveraging Periods
The previous deleveraging experience in China is highly relevant to the upcoming debt-reduction process. The last time China underwent a meaningful deleveraging process can be traced back to 1993-98. (See Box A for details.) In the early 1990s, SOEs owned by central and local governments dominated economic activity. Soon after the tour in South China by Deng Xiaoping in 1992, aggressive easing in monetary and investment policies led to a substantial investment boom in 1993.
The government initiated the first round of deleveraging with Vice-Premier Zhu Rongji’s announcement on 16 Articles of Macroeconomic Adjustment in June 1993. While the policy tightening restored monetary control and reined in overheating pressures, Mr. Zhu also succeeded in promoting reform in two major areas in 1994: fiscal reform to help consolidate the power of central governments over local governments and foreign exchange reforms to eliminate dual-track practices in foreign exchange markets.
The second round of deleveraging peaked in 1998-99 after continuous SOE deleveraging had a significantly negative impact on the economy through a large accumulation of non-performing loans in commercial banks. In response, Mr. Zhu adopted aggressive fiscal stimulus and monetary easing to avoid a hard landing for the economy, especially in the aftermath of the 1997-98 Asian financial crisis, as well as introduced further reforms to clean up banks’ balance sheets through AMC acquisition and bank transformation (from policy banks to commercial banks).
China faces similar challenges in structural adjustment… As in the 1990s, the backdrop to the recent rise in public sector liabilities was a policy-induced investment boom a few years earlier. In view of the economic imbalances and challenges to growth sustainability that have emerged, China’s new leadership has signaled its clear intention to roll out more structural reforms, just as Mr. Zhu did in the 1990s. In addition, a similar set of policy adjustments needs to be considered and implemented, including SOE and LGFV deleveraging, the restoration of a risk-pricing system for the financial industry and the setting up of alternative funding channels for local government-led investment.
… at a more difficult time from a cyclical strength perspective. This time, it has taken much longer (it is almost five years since the start of the 2008/09 stimulus package) for China to come close to a reform agenda. Given that domestic demand has already weakened from peak levels in 2011, a similar program entailing public sector deleveraging and government cost cutting to that undertaken in the early 1990s could turn out to be too contractionary.
There is more to learn from 1998 than from 1993. The current cyclical strength in the economy would suggest that the government should emulate the Zhu Rongji administration in its second round of deleveraging from 1998 rather than the first from 1993. This would imply that policy makers are likely to consider undertaking a countercyclical policy adjustment (primarily easing) to help smooth the cycle when initiatives to promote deleveraging are introduced.
Implementing a managed deleveraging process in a more market-based environment with lower SOE reliance is not impossible. There are advantages in and drawbacks to deleveraging now versus in the 1990s (Exhibit 17). Admittedly, with the low-hanging fruit already picked (e.g., housing reform), there is less to gain today in the form of a reform dividend from a transition toward a market-based economy than there was 20 years ago. However, China has a much stronger industrial base now plus an emerging middle class in urban areas, which could provide a stronger cushion to the impact of potential SOE deleveraging.
Policy makers are clearly shifting towards a more balanced position for reforms as well as countercyclical policy adjustments. From remarks reiterated by President Xi Jinping and Premier Li Keqiang in early July that growth should not slip below the target level this year suggests policy makers will tackle the efficiency problem through structural reform as well as growth stabilization with short-term policy adjustment.
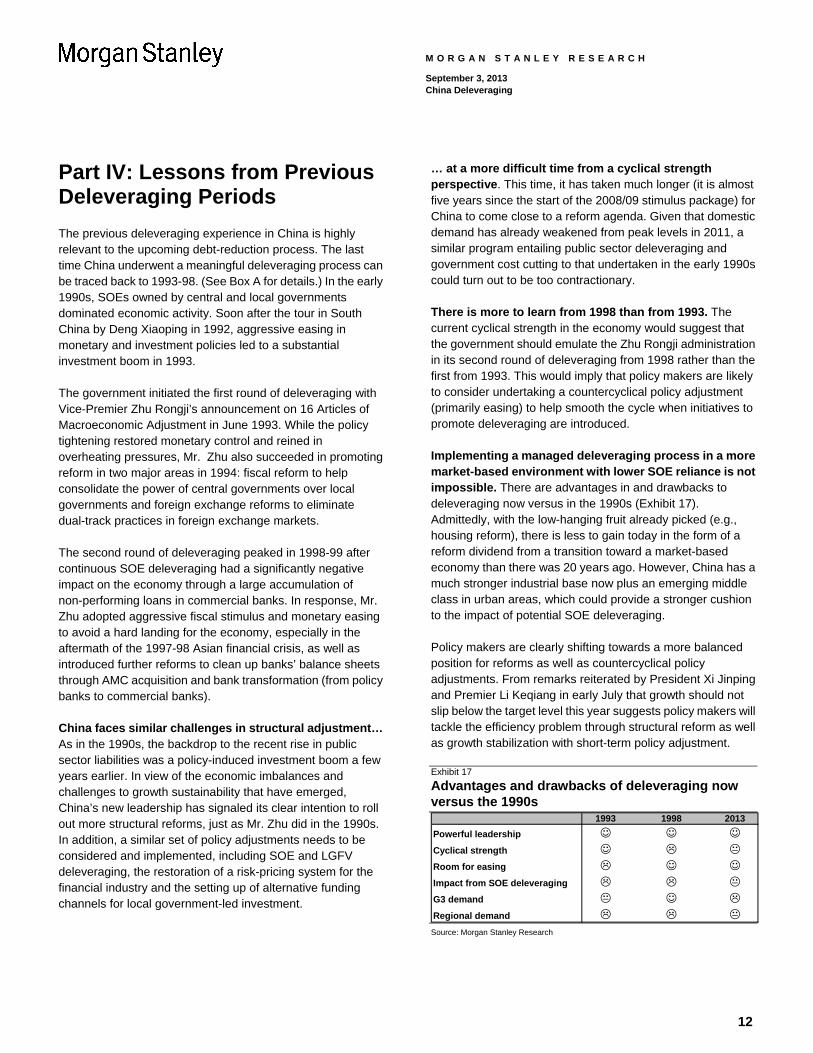
Exhibit 17
Advantages and drawbacks of deleveraging now versus the 1990s
1993 1998 2013
Powerful leadership Cyclical strength Room for easing Impact from SOE deleveraging G3 demand Regional demand
Source: Morgan Stanley Research
12
M O R G A N S T A N L E Y R E S E A R C H
September 3, 2013 China Deleveraging
Box A: Deleveraging and reforms in the 1990s
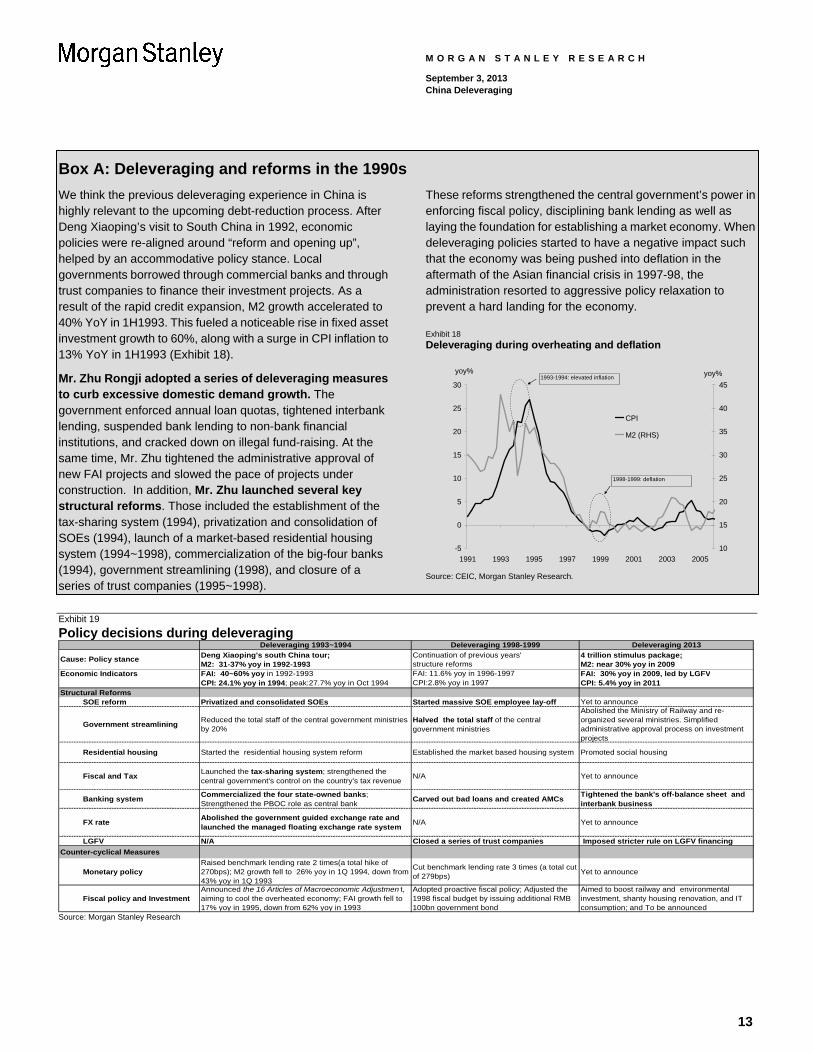
We think the previous deleveraging experience in China is highly relevant to the upcoming debt-reduction process. After Deng Xiaoping’s visit to South China in 1992, economic policies were re-aligned around “reform and opening up”, helped by an accommodative policy stance. Local governments borrowed through commercial banks and through trust companies to finance their investment projects. As a result of the rapid credit expansion, M2 growth accelerated to 40% YoY in 1H1993. This fueled a noticeable rise in fixed asset investment growth to 60%, along with a surge in CPI inflation to 13% YoY in 1H1993 (Exhibit 18).
Mr. Zhu Rongji adopted a series of deleveraging measures to curb excessive domestic demand growth. The government enforced annual loan quotas, tightened interbank lending, suspended bank lending to non-bank financial institutions, and cracked down on illegal fund-raising. At the same time, Mr. Zhu tightened the administrative approval of new FAI projects and slowed the pace of projects under construction. In addition, Mr. Zhu launched several key structural reforms. Those included the establishment of the tax-sharing system (1994), privatization and consolidation of SOEs (1994), launch of a market-based residential housing system (1994~1998), commercialization of the big-four banks (1994), government streamlining (1998), and closure of a series of trust companies (1995~1998).
These reforms strengthened the central government’s power in enforcing fiscal policy, disciplining bank lending as well as laying the foundation for establishing a market economy. When deleveraging policies started to have a negative impact such that the economy was being pushed into deflation in the aftermath of the Asian financial crisis in 1997-98, the administration resorted to aggressive policy relaxation to prevent a hard landing for the economy.
Exhibit 18
Deleveraging during overheating and deflation
-5
0
5
10
15
20
25
30
1991 1993 1995 1997 1999 2001 2003 2005
yoy%
10
15
20
25
30
35
40
45
yoy%
CPI
M2 (RHS)
1993-1994: elevated inflation
1998-1999: deflation
Source: CEIC, Morgan Stanley Research.
Exhibit 19
Policy decisions during deleveraging Deleveraging 1993~1994 Deleveraging 1998-1999 Deleveraging 2013
Deng Xiaoping's south China tour; Continuation of previous years' 4 trillion stimulus package; M2: 31-37% yoy in 1992-1993 structure reforms M2: near 30% yoy in 2009
Economic Indicators FAI: 40~60% yoy in 1992-1993 FAI: 11.6% yoy in 1996-1997 FAI: 30% yoy in 2009, led by LGFVCPI: 24.1% yoy in 1994; peak:27.7% yoy in Oct 1994 CPI:2.8% yoy in 1997 CPI: 5.4% yoy in 2011
Structural ReformsSOE reform Privatized and consolidated SOEs Started massive SOE employee lay-off Yet to announce
Government streamliningReduced the total staff of the central government ministries by 20%
Halved the total staff of the central government ministries
Abolished the Ministry of Railway and re-organized several ministries. Simplified administrative approval process on investment projects
Residential housing Started the residential housing system reform Established the market based housing system Promoted social housing
Fiscal and TaxLaunched the tax-sharing system; strengthened the central government's control on the country's tax revenue
N/A Yet to announce
Banking systemCommercialized the four state-owned banks; Strengthened the PBOC role as central bank
Carved out bad loans and created AMCsTightened the bank's off-balance sheet and interbank business
FX rateAbolished the government guided exchange rate and launched the managed floating exchange rate system
N/A Yet to announce
LGFV N/A Closed a series of trust companies Imposed stricter rule on LGFV financing
Counter-cyclical Measures
Monetary policyRaised benchmark lending rate 2 times(a total hike of 270bps); M2 growth fell to 26% yoy in 1Q 1994, down from 43% yoy in 1Q 1993
Cut benchmark lending rate 3 times (a total cut of 279bps)
Yet to announce
Fiscal policy and InvestmentAnnounced the 16 Articles of Macroeconomic Adjustmen t, aiming to cool the overheated economy; FAI growth fell to 17% yoy in 1995, down from 62% yoy in 1993
Adopted proactive fiscal policy; Adjusted the 1998 fiscal budget by issuing additional RMB 100bn government bond
Aimed to boost railway and environmental investment, shanty housing renovation, and IT consumption; and To be announced
Cause: Policy stance
Source: Morgan Stanley Research
13
M O R G A N S T A N L E Y R E S E A R C H
September 3, 2013 China Deleveraging
Part V: How Is Deleveraging Likely to Unfold?
The impact of debt reduction on economic growth will likely be negative, especially in an environment of weak aggregate demand. In the first report in our China Deleveraging Series, we argued that deleveraging would likely mean a bumpy ride. However, it is conceivable that the pain from deleveraging could be partly relieved if policy makers implement prompt policy responses, as Jonathan Garner argued in the report, “China Deleveraging: Can China Achieve a Beautiful Deleveraging?”, published on August 27.
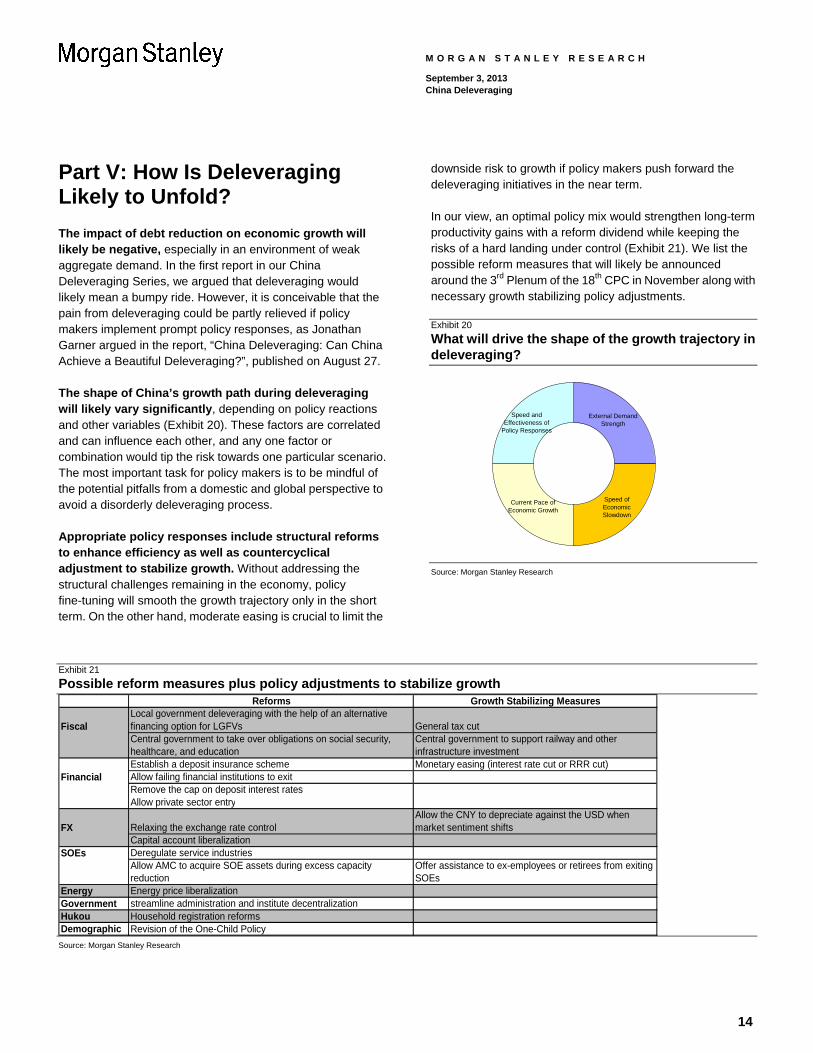
The shape of China’s growth path during deleveraging will likely vary significantly, depending on policy reactions and other variables (Exhibit 20). These factors are correlated and can influence each other, and any one factor or combination would tip the risk towards one particular scenario. The most important task for policy makers is to be mindful of the potential pitfalls from a domestic and global perspective to avoid a disorderly deleveraging process.
Appropriate policy responses include structural reforms to enhance efficiency as well as countercyclical adjustment to stabilize growth. Without addressing the structural challenges remaining in the economy, policy fine-tuning will smooth the growth trajectory only in the short term. On the other hand, moderate easing is crucial to limit the
downside risk to growth if policy makers push forward the deleveraging initiatives in the near term.
In our view, an optimal policy mix would strengthen long-term productivity gains with a reform dividend while keeping the risks of a hard landing under control (Exhibit 21). We list the possible reform measures that will likely be announced around the 3rd Plenum of the 18th CPC in November along with necessary growth stabilizing policy adjustments.
Exhibit 20 What will drive the shape of the growth trajectory in deleveraging?
Speed and Effectiveness of
Policy Responses
External Demand Strength
Current Pace of Economic Growth
Speed of Economic Slowdown
Source: Morgan Stanley Research
Exhibit 21
Possible reform measures plus policy adjustments to stabilize growth Reforms Growth Stabilizing Measures
FiscalLocal government deleveraging with the help of an alternative financing option for LGFVs General tax cutCentral government to take over obligations on social security, healthcare, and education
Central government to support railway and other infrastructure investment
Establish a deposit insurance scheme Monetary easing (interest rate cut or RRR cut)Financial Allow failing financial institutions to exit
Remove the cap on deposit interest ratesAllow private sector entry
FX Relaxing the exchange rate control Allow the CNY to depreciate against the USD when market sentiment shifts
Capital account liberalizationSOEs Deregulate service industries
Allow AMC to acquire SOE assets during excess capacity reduction
Offer assistance to ex-employees or retirees from exiting SOEs
Energy Energy price liberalizationGovernment streamline administration and institute decentralizationHukou Household registration reformsDemographic Revision of the One-Child Policy
Source: Morgan Stanley Research
14
M O R G A N S T A N L E Y R E S E A R C H
September 3, 2013 China Deleveraging
Possible shapes of deleveraging
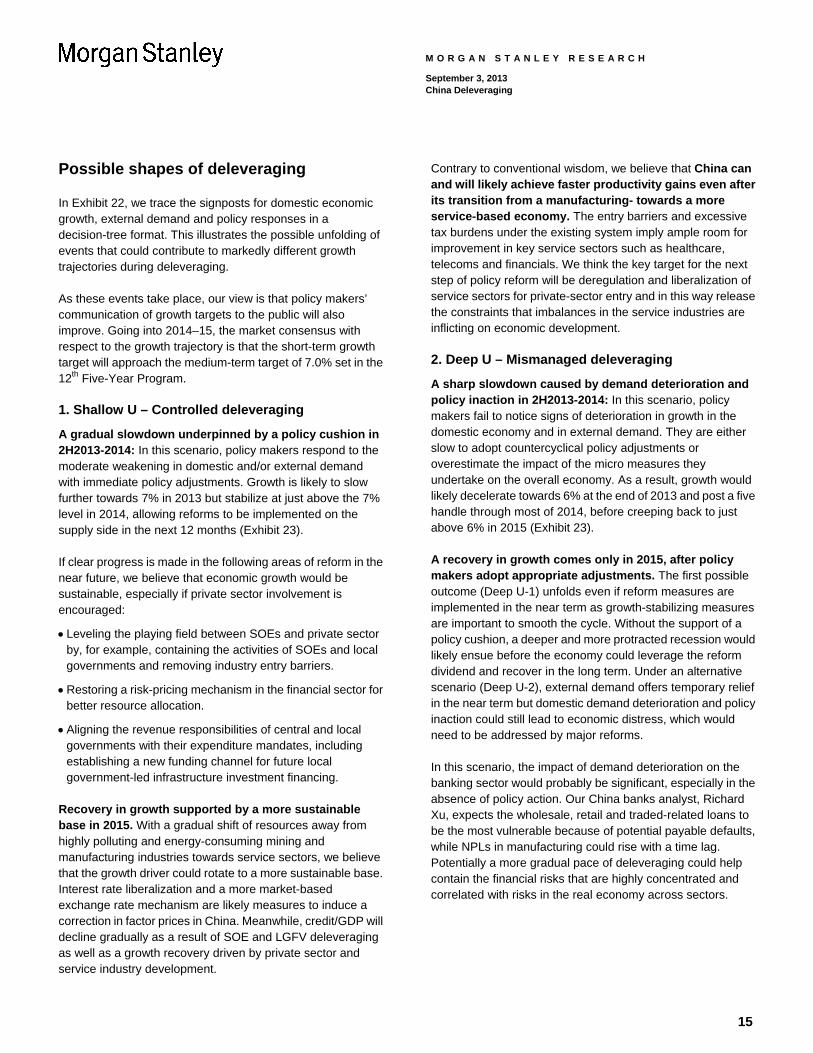
In Exhibit 22, we trace the signposts for domestic economic growth, external demand and policy responses in a decision-tree format. This illustrates the possible unfolding of events that could contribute to markedly different growth trajectories during deleveraging.
As these events take place, our view is that policy makers’ communication of growth targets to the public will also improve. Going into 2014–15, the market consensus with respect to the growth trajectory is that the short-term growth target will approach the medium-term target of 7.0% set in the 12th Five-Year Program.
1. Shallow U – Controlled deleveraging
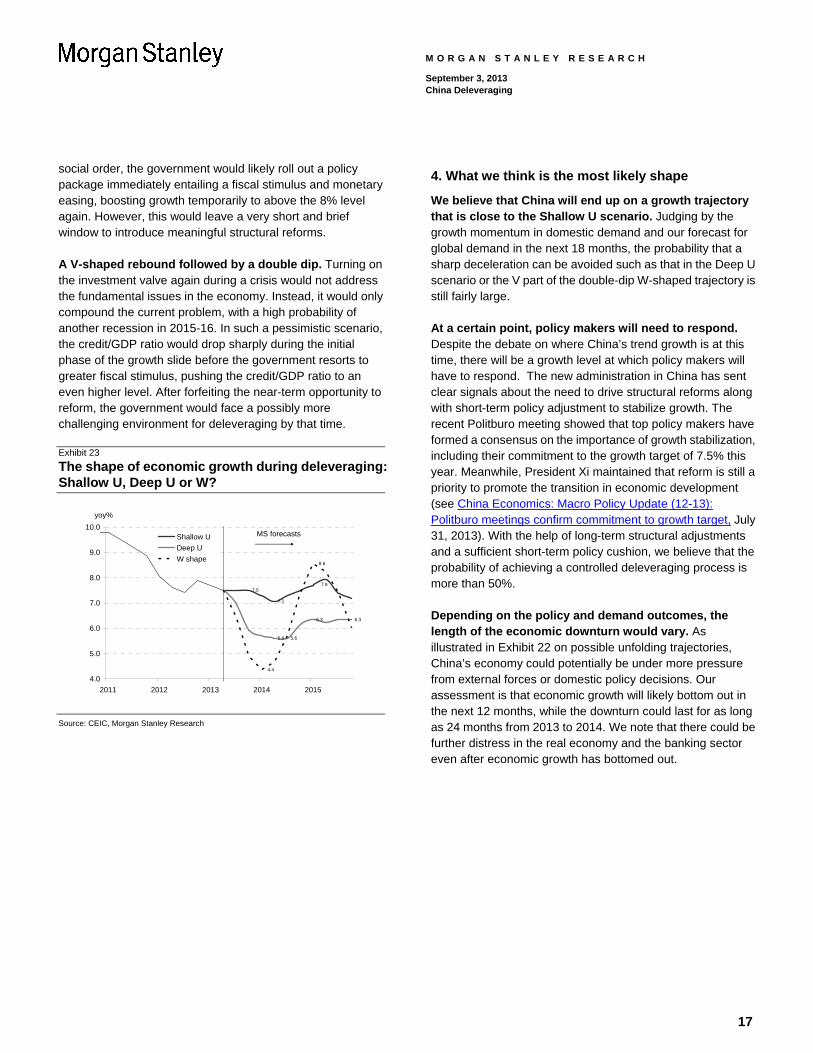
A gradual slowdown underpinned by a policy cushion in 2H2013-2014: In this scenario, policy makers respond to the moderate weakening in domestic and/or external demand with immediate policy adjustments. Growth is likely to slow further towards 7% in 2013 but stabilize at just above the 7% level in 2014, allowing reforms to be implemented on the supply side in the next 12 months (Exhibit 23).
If clear progress is made in the following areas of reform in the near future, we believe that economic growth would be sustainable, especially if private sector involvement is encouraged:
Leveling the playing field between SOEs and private sector by, for example, containing the activities of SOEs and local governments and removing industry entry barriers.
Restoring a risk-pricing mechanism in the financial sector for better resource allocation.
Aligning the revenue responsibilities of central and local governments with their expenditure mandates, including establishing a new funding channel for future local government-led infrastructure investment financing.
Recovery in growth supported by a more sustainable base in 2015. With a gradual shift of resources away from highly polluting and energy-consuming mining and manufacturing industries towards service sectors, we believe that the growth driver could rotate to a more sustainable base. Interest rate liberalization and a more market-based exchange rate mechanism are likely measures to induce a correction in factor prices in China. Meanwhile, credit/GDP will decline gradually as a result of SOE and LGFV deleveraging as well as a growth recovery driven by private sector and service industry development.
Contrary to conventional wisdom, we believe that China can and will likely achieve faster productivity gains even after its transition from a manufacturing- towards a more service-based economy. The entry barriers and excessive tax burdens under the existing system imply ample room for improvement in key service sectors such as healthcare, telecoms and financials. We think the key target for the next step of policy reform will be deregulation and liberalization of service sectors for private-sector entry and in this way release the constraints that imbalances in the service industries are inflicting on economic development.
2. Deep U – Mismanaged deleveraging
A sharp slowdown caused by demand deterioration and policy inaction in 2H2013-2014: In this scenario, policy makers fail to notice signs of deterioration in growth in the domestic economy and in external demand. They are either slow to adopt countercyclical policy adjustments or overestimate the impact of the micro measures they undertake on the overall economy. As a result, growth would likely decelerate towards 6% at the end of 2013 and post a five handle through most of 2014, before creeping back to just above 6% in 2015 (Exhibit 23).
A recovery in growth comes only in 2015, after policy makers adopt appropriate adjustments. The first possible outcome (Deep U-1) unfolds even if reform measures are implemented in the near term as growth-stabilizing measures are important to smooth the cycle. Without the support of a policy cushion, a deeper and more protracted recession would likely ensue before the economy could leverage the reform dividend and recover in the long term. Under an alternative scenario (Deep U-2), external demand offers temporary relief in the near term but domestic demand deterioration and policy inaction could still lead to economic distress, which would need to be addressed by major reforms.
In this scenario, the impact of demand deterioration on the banking sector would probably be significant, especially in the absence of policy action. Our China banks analyst, Richard Xu, expects the wholesale, retail and traded-related loans to be the most vulnerable because of potential payable defaults, while NPLs in manufacturing could rise with a time lag. Potentially a more gradual pace of deleveraging could help contain the financial risks that are highly concentrated and correlated with risks in the real economy across sectors.
15
M O R G A N S T A N L E Y R E S E A R C H
September 3, 2013 China Deleveraging
3. W – Disorderly deleveraging
A brief hard landing caused by an economic incident and/or external shock: In this scenario, a significant deterioration in both external and domestic demand tips the risks quickly to the downside. The real economy loses speed
to around 5% growth in late 2013, triggered by either an unplanned tightening in liquidity conditions (as part of the effort to bring about banking sector deleveraging) and or an external shock unfolding at a pace that no one envisaged (Exhibit 23).
Exhibit 22 Scenario Analysis: How events will possibly unfold and their likely triggers
Smooth deleveraging*Export growthstabilizes at single digit
IP around 9% Shallow UFAI around 20% Policy adjustment
Export growth<3%
Exprot growthstabilizes at single digit
IP growth<8% No policy adjustment
Reform immediately FAI growth<18% Muddling throughimplemented Policy adjustment
Export growth<3%
Third Plenary No policy adjustment
of 18th CPCOct-2013 Deep U-1
Cyclical recoveryExport growthstabilizes at single digit
No immediateimplementation of
reform IP around 9% Muddling throughFAI around 20% Policy adj
Export growth<3%
Export growth
stabilizes at single digit No policy adj Deep U-2IP growth<8%FAI growth<18%
Policy adj W-shapeExport growth<3%
No policy adj
Chaotic recession*
Reform Domestic demand External demand Countercyclical policy
Source: Morgan Stanley Research
The impact of the economic downturn would likely be amplified by loss of confidence in the initial stages and manifest in further downward pressure on growth. Meanwhile, an increase in the number of bankruptcies in the real economy and potentially forced consolidation of financial institutions could result in severe losses by equity holders and creditors. Since the economic shock would be severe but short-lived, commercial banks would be unlikely to see an immediate
impact on the NPLs in their books. However, signs of book value impairment would likely emerge after the initial impact of the policy boost dissipates.
The government’s automatic reaction would probably induce a sharp and significant snapback. The government has the resources and power needed to prevent an economic collapse. In view of the consequences for employment and
16
M O R G A N S T A N L E Y R E S E A R C H
September 3, 2013 China Deleveraging
social order, the government would likely roll out a policy package immediately entailing a fiscal stimulus and monetary easing, boosting growth temporarily to above the 8% level again. However, this would leave a very short and brief window to introduce meaningful structural reforms.
A V-shaped rebound followed by a double dip. Turning on the investment valve again during a crisis would not address the fundamental issues in the economy. Instead, it would only compound the current problem, with a high probability of another recession in 2015-16. In such a pessimistic scenario, the credit/GDP ratio would drop sharply during the initial phase of the growth slide before the government resorts to greater fiscal stimulus, pushing the credit/GDP ratio to an even higher level. After forfeiting the near-term opportunity to reform, the government would face a possibly more challenging environment for deleveraging by that time.
Exhibit 23 The shape of economic growth during deleveraging: Shallow U, Deep U or W?
7.5
7.1
5.6 5.6
6.3 6.3
4.4
8.6
7.9
4.0
5.0
6.0
7.0
8.0
9.0
10.0
2011 2012 2013 2014 2015
yoy%
Shallow U
Deep U
W shape
MS forecasts
Source: CEIC, Morgan Stanley Research
4. What we think is the most likely shape
We believe that China will end up on a growth trajectory that is close to the Shallow U scenario. Judging by the growth momentum in domestic demand and our forecast for global demand in the next 18 months, the probability that a sharp deceleration can be avoided such as that in the Deep U scenario or the V part of the double-dip W-shaped trajectory is still fairly large.
At a certain point, policy makers will need to respond. Despite the debate on where China’s trend growth is at this time, there will be a growth level at which policy makers will have to respond. The new administration in China has sent clear signals about the need to drive structural reforms along with short-term policy adjustment to stabilize growth. The recent Politburo meeting showed that top policy makers have formed a consensus on the importance of growth stabilization, including their commitment to the growth target of 7.5% this year. Meanwhile, President Xi maintained that reform is still a priority to promote the transition in economic development (see China Economics: Macro Policy Update (12-13): Politburo meetings confirm commitment to growth target, July 31, 2013). With the help of long-term structural adjustments and a sufficient short-term policy cushion, we believe that the probability of achieving a controlled deleveraging process is more than 50%.
Depending on the policy and demand outcomes, the length of the economic downturn would vary. As illustrated in Exhibit 22 on possible unfolding trajectories, China’s economy could potentially be under more pressure from external forces or domestic policy decisions. Our assessment is that economic growth will likely bottom out in the next 12 months, while the downturn could last for as long as 24 months from 2013 to 2014. We note that there could be further distress in the real economy and the banking sector even after economic growth has bottomed out.
17
18
M O R G A N S T A N L E Y R E S E A R C H
September 3, 2013 China Deleveraging
5. Our proprietary indicator may show greater fluctuations
As we navigate through the policy decisions and uncertainty concerning growth in the next few years, in such unchartered waters we can resort to an alternative measure of economic growth. In view of the limitations of frequently used economic activity indicators such as IP and GDP, we have developed a proprietary indicator, Morgan Stanley China Economic Index (MS-CHEX). (See Box B for details on the methodology we applied in compiling this index.)
MS-CHEX consists of six data series: electricity production, steel production, fiscal revenue, real exports, real imports and car sales. We use the growth rate cycle algorithm and assign the weight to each component in a reverse order scaled by their volatility (standard deviation), i.e., the most volatile data series is assigned the lowest weight.
A synthetic approach to gauge the current state of the economy. We believe the index gives a real-time reading on underlying growth momentum in economic activity by synthesizing information on investment, consumption and exports. The merit of this coincident indicator is that it helps investors synthesize information gleaned from activity growth data and offers an early peek into the monthly bean-counting towards the quarterly GDP. It differs from the Keqiang Index (by The Economist Group) in that it includes exports to reflect external sector activities, and enjoys a strong correlation with MSCI-China performance.
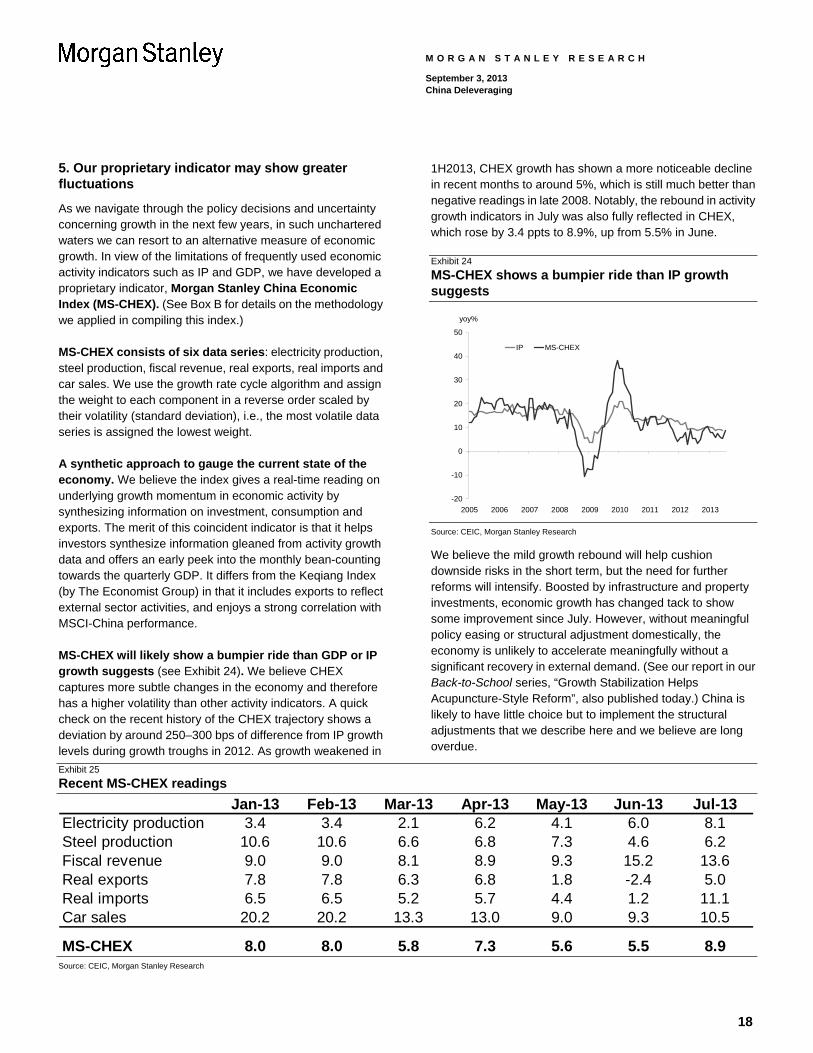
MS-CHEX will likely show a bumpier ride than GDP or IP growth suggests (see Exhibit 24). We believe CHEX captures more subtle changes in the economy and therefore has a higher volatility than other activity indicators. A quick check on the recent history of the CHEX trajectory shows a deviation by around 250–300 bps of difference from IP growth levels during growth troughs in 2012. As growth weakened in
1H2013, CHEX growth has shown a more noticeable decline in recent months to around 5%, which is still much better than negative readings in late 2008. Notably, the rebound in activity growth indicators in July was also fully reflected in CHEX, which rose by 3.4 ppts to 8.9%, up from 5.5% in June.
Exhibit 24 MS-CHEX shows a bumpier ride than IP growth suggests
-20
-10
0
10
20
30
40
50
2005 2006 2007 2008 2009 2010 2011 2012 2013
yoy%
IP MS-CHEX
Source: CEIC, Morgan Stanley Research
We believe the mild growth rebound will help cushion downside risks in the short term, but the need for further reforms will intensify. Boosted by infrastructure and property investments, economic growth has changed tack to show some improvement since July. However, without meaningful policy easing or structural adjustment domestically, the economy is unlikely to accelerate meaningfully without a significant recovery in external demand. (See our report in our Back-to-School series, “Growth Stabilization Helps Acupuncture-Style Reform”, also published today.) China is likely to have little choice but to implement the structural adjustments that we describe here and we believe are long overdue.
Exhibit 25
Recent MS-CHEX readings
Jan-13 Feb-13 Mar-13 Apr-13 May-13 Jun-13 Jul-13Electricity production 3.4 3.4 2.1 6.2 4.1 6.0 8.1Steel production 10.6 10.6 6.6 6.8 7.3 4.6 6.2Fiscal revenue 9.0 9.0 8.1 8.9 9.3 15.2 13.6Real exports 7.8 7.8 6.3 6.8 1.8 -2.4 5.0Real imports 6.5 6.5 5.2 5.7 4.4 1.2 11.1Car sales 20.2 20.2 13.3 13.0 9.0 9.3 10.5
MS-CHEX 8.0 8.0 5.8 7.3 5.6 5.5 8.9 Source: CEIC, Morgan Stanley Research
M O R G A N S T A N L E Y R E S E A R C H
September 3, 2013 China Deleveraging
Box B: Launching the MS China Economic Index (MS-CHEX)
To better assess the current state of the macro economy, we launch MS China Economic Index (MS-CHEX) by synthesizing several economic indicators from a bottom-up approach. We believe CHEX differs from the NBS (National Bureau of Statistics) industrial production data in gauging the strength of real economic activity in the following ways:
Less distortion from survey range and changes in statistics methodology: The NBS IP data is subject to periodic changes in its survey scope and statistics compilation methodology. For example, after the NBS raised the designated threshold of industrial enterprise annual sales revenue from Rmb5mn to Rmb20mn in 2011, YoY growth in IP has been hard to interpret and seasonal adjustment distorted. In addition, NBS adopted a new online reporting system to collect data directly from enterprises in January 2012. While NBS expects this change to improve the data accuracy and circumvent potential smoothing from local governments and local statistics bureaus, it also introduces a bias to the series.
Presumably subject to less smoothing from a single source: We select all the component indicators based on their relevance and impact on the overall economy to reflect both domestic and external economic activities. The six data series used as the final components of CHEX come from various sources, including the National Bureau of Statistics, Ministry of Finance, and General Administration of Customs.
Using more direct measures for output: IP monthly data is calculated by multiplying the product of gross industrial output in the current year with the value added ratio from the previous year. By using parameters from two consecutive years in the calculation, the IP series will inherently smooth the business cycle. In contrast, the “hard data” we add to the CHEX are based on output volume and could largely reduce this problem.
In 2011, we released our MS China Leading Indicator (MSCLI) and MS China Coincident Indicator (MSCCI), which served the purpose of identifying turning points in China’s business cycle (see “Launching Morgan Stanley Leading Indicator,” dated January 26, 2011). Thus, the metric is supposed to be a smooth series to reduce the distortion from short-term variations in each indicator. The components mainly include
traditional indicators, such as industrial sales, retail sales, exports, and other activity data. In the methodology, we adopt the standard OECD “growth cycle” procedure to compile MSCCI, including seasonal adjustment, trend-removal, data smoothing, normalization, and aggregation.
The CHEX differs in both data source and compilation methodology. The components in CHEX employ only hard data. A difference from MSCCI is that we use the “growth rate cycle” method to compile CHEX, by aggregating the component indicators’ growth rates with their respective weights. We assign the weight to each component in reverse order scaled by volatility (standard deviation), i.e., the most volatile data series is assigned the lowest weight.
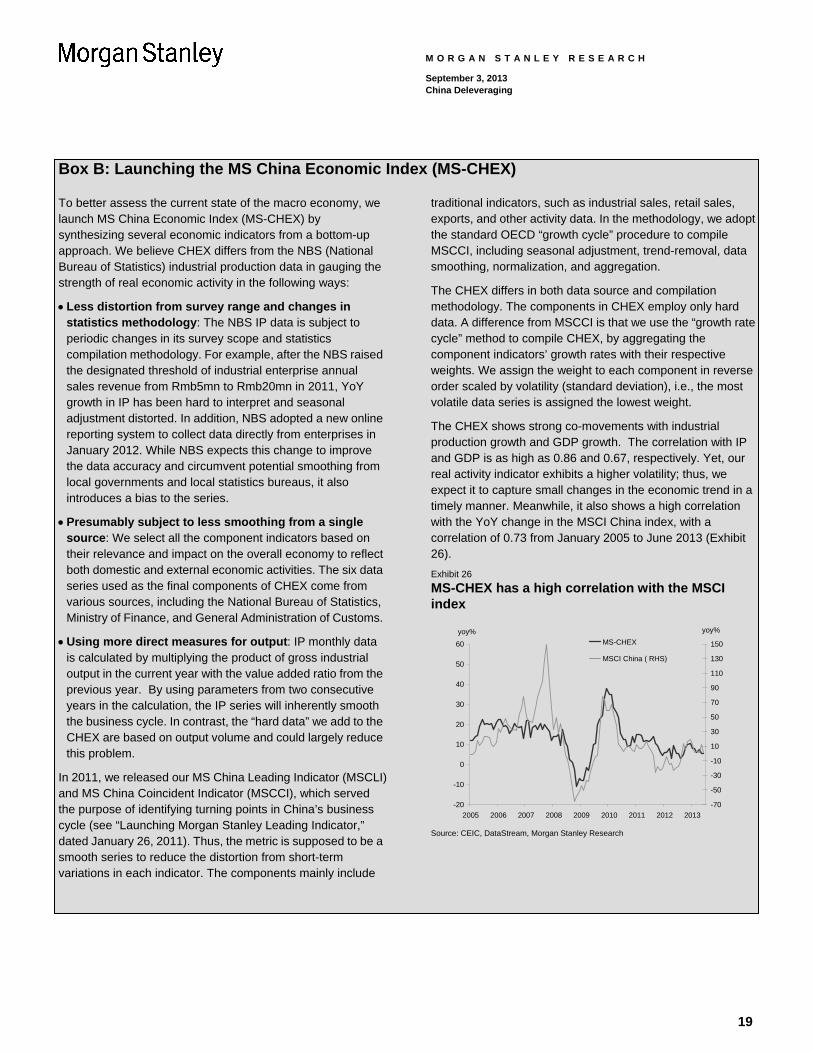
The CHEX shows strong co-movements with industrial production growth and GDP growth. The correlation with IP and GDP is as high as 0.86 and 0.67, respectively. Yet, our real activity indicator exhibits a higher volatility; thus, we expect it to capture small changes in the economic trend in a timely manner. Meanwhile, it also shows a high correlation with the YoY change in the MSCI China index, with a correlation of 0.73 from January 2005 to June 2013 (Exhibit 26).
Exhibit 26 MS-CHEX has a high correlation with the MSCI index
-20
-10
0
10
20
30
40
50
60
2005 2006 2007 2008 2009 2010 2011 2012 2013
yoy%
-70
-50
-30
-10
10
30
50
70
90
110
130
150
yoy%
MS-CHEX
MSCI China ( RHS)
Source: CEIC, DataStream, Morgan Stanley Research
19
M O R G A N S T A N L E Y R E S E A R C H
September 3, 2013 China Deleveraging
Conclusions
We believe the government’s ultimate goal should be to raise productivity in the economy in the next two years. Before households can change saving patterns to increase consumption (with the help of a strong social security safety net and healthcare benefits), China urgently needs to calibrate the direction of investment to increase its return. In an environment of sluggish global demand, the most likely channel to achieve efficiency gains is through the reform dividend.
We would become incrementally more positive if the government can reverse guo jin min tui (the state advances and the private sector retreats) to promote guo tui min jin (the private sector advances and the state retreats). A total-factor-productivity friendly environment requires a more even playing field between SOEs and the private sector in both industrial and service sectors as well as in social security responsibilities, an appropriate market-based financing option for government-led infrastructure investments, in addition to an appropriate risk-pricing mechanism in the financial sector to help improve resource allocation. It may be difficult for the new administration to achieve all these goals in the next two
years, but we think there is ample scope for regulatory changes that could reshape China’s economic prospects.
Short-term policy measures need to be introduced to limit downside risks. Our analysis of the previous deleveraging experience in the 1990s suggests greater caution should be used on the pace and intensity of major policy changes if aggregate demand is weak. In addition, an adequate policy cushion to supplement the reform measures is warranted to prevent a hard landing, in our view. The recent shift in the stance of top policy makers further towards pro-growth suggests the current administration recognizes the importance of macro stability and will work diligently to prevent tail-risk events.
Although deleveraging is unlikely to turn out to be a smooth or brief ride, we believe it could present an opportunity to release the reform dividend if the government manages to improve the economic structure as well as ease fluctuations in the lower part of a business cycle. By redirecting the government investment function of final consumption, the structural adjustment measures will likely make room for more private-sector investment and household consumption, which is the ultimate support for long-term sustainable growth in China, in our view.
20
21
M O R G A N S T A N L E Y R E S E A R C H
September 3, 2013 China Deleveraging
Disclosure Section Information and opinions in Morgan Stanley Research were prepared or are disseminated by one or more of the following, which accept responsibility for its contents: Morgan Stanley Asia Limited, and/or Morgan Stanley Asia (Singapore) Pte. (Registration number 199206298Z) and/or Morgan Stanley Asia (Singapore) Securities Pte Ltd (Registration number 200008434H), regulated by the Monetary Authority of Singapore (which accepts legal responsibility for its contents and should be contacted with respect to any matters arising from, or in connection with, Morgan Stanley Research), and/or Morgan Stanley Taiwan Limited and/or Morgan Stanley & Co International plc, Seoul Branch, and/or Morgan Stanley Australia Limited (A.B.N. 67 003 734 576, holder of Australian financial services license No. 233742), and/or Morgan Stanley Wealth Management Australia Pty Ltd (A.B.N. 19 009 145 555, holder of Australian financial services license No. 240813, and/or Morgan Stanley India Company Private Limited and their affiliates (collectively, "Morgan Stanley"). For important disclosures, stock price charts and equity rating histories regarding companies that are the subject of this report, please see the Morgan Stanley Research Disclosure Website at www.morganstanley.com/researchdisclosures, or contact your investment representative or Morgan Stanley Research at 1585 Broadway, (Attention: Research Management), New York, NY, 10036 USA. For valuation methodology and risks associated with any price targets referenced in this research report, please email [email protected] with a request for valuation methodology and risks on a particular stock or contact your investment representative or Morgan Stanley Research at 1585 Broadway, (Attention: Research Management), New York, NY 10036 USA.
Global Research Conflict Management Policy Morgan Stanley Research has been published in accordance with our conflict management policy, which is available at www.morganstanley.com/institutional/research/conflictpolicies.
Important Disclosure for Morgan Stanley Smith Barney LLC Customers The subject matter in this Morgan Stanley report may also be covered in a similar report from Citigroup Global Markets Inc. Ask your Financial Advisor or use Research Center to view any reports in addition to this report.
Important Disclosures Morgan Stanley is not acting as a municipal advisor and the opinions or views contained herein are not intended to be, and do not constitute, advice within the meaning of Section 975 of the Dodd-Frank Wall Street Reform and Consumer Protection Act. Morgan Stanley Research does not provide individually tailored investment advice. Morgan Stanley Research has been prepared without regard to the circumstances and objectives of those who receive it. Morgan Stanley recommends that investors independently evaluate particular investments and strategies, and encourages investors to seek the advice of a financial adviser. The appropriateness of an investment or strategy will depend on an investor's circumstances and objectives. The securities, instruments, or strategies discussed in Morgan Stanley Research may not be suitable for all investors, and certain investors may not be eligible to purchase or participate in some or all of them. Morgan Stanley Research is not an offer to buy or sell any security/instrument or to participate in any trading strategy. The value of and income from your investments may vary because of changes in interest rates, foreign exchange rates, default rates, prepayment rates, securities/instruments prices, market indexes, operational or financial conditions of companies or other factors. There may be time limitations on the exercise of options or other rights in securities/instruments transactions. Past performance is not necessarily a guide to future performance. Estimates of future performance are based on assumptions that may not be realized. If provided, and unless otherwise stated, the closing price on the cover page is that of the primary exchange for the subject company's securities/instruments. The fixed income research analysts, strategists or economists principally responsible for the preparation of Morgan Stanley Research have received compensation based upon various factors, including quality, accuracy and value of research, firm profitability or revenues (which include fixed income trading and capital markets profitability or revenues), client feedback and competitive factors. Fixed Income Research analysts', strategists' or economists' compensation is not linked to investment banking or capital markets transactions performed by Morgan Stanley or the profitability or revenues of particular trading desks. With the exception of information regarding Morgan Stanley, Morgan Stanley Research is based on public information. Morgan Stanley makes every effort to use reliable, comprehensive information, but we make no representation that it is accurate or complete. We have no obligation to tell you when opinions or information in Morgan Stanley Research change apart from when we intend to discontinue equity research coverage of a subject company. Facts and views presented in Morgan Stanley Research have not been reviewed by, and may not reflect information known to, professionals in other Morgan Stanley business areas, including investment banking personnel. Morgan Stanley may make investment decisions or take proprietary positions that are inconsistent with the recommendations or views in this report. To our readers in Taiwan: Information on securities/instruments that trade in Taiwan is distributed by Morgan Stanley Taiwan Limited ("MSTL"). Such information is for your reference only. The reader should independently evaluate the investment risks and is solely responsible for their investment decisions. Morgan Stanley Research may not be distributed to the public media or quoted or used by the public media without the express written consent of Morgan Stanley. Information on securities/instruments that do not trade in Taiwan is for informational purposes only and is not to be construed as a recommendation or a solicitation to trade in such securities/instruments. MSTL may not execute transactions for clients in these securities/instruments. To our readers in Hong Kong: Information is distributed in Hong Kong by and on behalf of, and is attributable to, Morgan Stanley Asia Limited as part of its regulated activities in Hong Kong. If you have any queries concerning Morgan Stanley Research, please contact our Hong Kong sales representatives. Morgan Stanley is not incorporated under PRC law and the research in relation to this report is conducted outside the PRC. Morgan Stanley Research does not constitute an offer to sell or the solicitation of an offer to buy any securities in the PRC. PRC investors shall have the relevant qualifications to invest in such securities and shall be responsible for obtaining all relevant approvals, licenses, verifications and/or registrations from the relevant governmental authorities themselves. Morgan Stanley Research is disseminated in Brazil by Morgan Stanley C.T.V.M. S.A.; in Japan by Morgan Stanley MUFG Securities Co., Ltd. and, for Commodities related research reports only, Morgan Stanley Capital Group Japan Co., Ltd; in Hong Kong by Morgan Stanley Asia Limited (which accepts responsibility for its contents); in Singapore by Morgan Stanley Asia (Singapore) Pte. (Registration number 199206298Z) and/or Morgan Stanley Asia (Singapore) Securities Pte Ltd (Registration number 200008434H), regulated by the Monetary Authority of Singapore (which accepts legal responsibility for its contents and should be contacted with respect to any matters arising from, or in connection with, Morgan Stanley Research); in Australia to "wholesale clients" within the meaning of the Australian Corporations Act by Morgan Stanley Australia Limited A.B.N. 67 003 734 576, holder of Australian financial services license No. 233742, which accepts responsibility for its contents; in Australia to "wholesale clients" and "retail clients" within the meaning of the Australian Corporations Act by Morgan Stanley Wealth Management Australia Pty Ltd (A.B.N. 19 009 145 555, holder of Australian financial services license No. 240813, which accepts responsibility for its contents; in Korea by Morgan Stanley & Co International plc, Seoul Branch; in India by Morgan Stanley India Company Private Limited; in Vietnam this report is issued by Morgan Stanley Singapore Holdings; in Canada by Morgan Stanley Canada Limited, which has approved of and takes responsibility for its contents in Canada; in Germany by Morgan Stanley Bank AG, Frankfurt am Main and Morgan Stanley Private Wealth Management Limited, Niederlassung Deutschland, regulated by Bundesanstalt fuer Finanzdienstleistungsaufsicht (BaFin); in Spain by Morgan Stanley, S.V., S.A., a Morgan Stanley group company, which is supervised by the Spanish Securities Markets Commission (CNMV) and states that Morgan Stanley Research has been written and distributed in accordance with the rules of conduct applicable to financial research as established under Spanish regulations; in the United States by Morgan Stanley & Co. LLC, which accepts responsibility for its contents. Morgan Stanley & Co. International plc, authorized by the Prudential Regulatory Authority and regulated by the Financial Conduct Authority and the Prudential Regulatory Authority, disseminates in the UK research that it has prepared, and approves solely for the purposes of section 21 of the Financial Services and Markets Act 2000, research which has been prepared by any of its affiliates. Morgan Stanley Private Wealth Management Limited, authorized and regulated by the Financial Conduct Authority, also disseminates Morgan Stanley Research in the UK. Private U.K. investors should obtain the advice of their Morgan Stanley & Co. International plc or Morgan Stanley Private Wealth Management representative about the investments concerned. RMB Morgan Stanley (Proprietary) Limited is a member of the JSE Limited and regulated by the Financial Services Board in South Africa. RMB Morgan Stanley (Proprietary) Limited is a joint venture owned equally by Morgan Stanley International Holdings Inc. and RMB Investment Advisory (Proprietary) Limited, which is wholly owned by FirstRand Limited. The trademarks and service marks contained in Morgan Stanley Research are the property of their respective owners. Third-party data providers make no warranties or representations relating to the accuracy, completeness, or timeliness of the data they provide and shall not have liability for any damages relating to such data. The Global Industry Classification Standard (GICS) was developed by and is the exclusive property of MSCI and S&P. Morgan Stanley bases projections, opinions, forecasts and trading strategies regarding the MSCI Country Index Series solely on public information. MSCI has not reviewed, approved or endorsed these projections, opinions, forecasts and trading strategies. Morgan Stanley has no influence on or control over MSCI's index compilation decisions. Morgan Stanley Research or portions of it may not be reprinted, sold or redistributed without the written consent of Morgan Stanley. Morgan Stanley research is disseminated and available primarily electronically, and, in some cases, in printed form. Additional information on recommended securities/instruments is available on request.
22
M O R G A N S T A N L E Y R E S E A R C H
September 3, 2013 China Deleveraging
The information in Morgan Stanley Research is being communicated by Morgan Stanley & Co. International plc (DIFC Branch), regulated by the Dubai Financial Services Authority (the DFSA), and is directed at Professional Clients only, as defined by the DFSA. The financial products or financial services to which this research relates will only be made available to a customer who we are satisfied meets the regulatory criteria to be a Professional Client. The information in Morgan Stanley Research is being communicated by Morgan Stanley & Co. International plc (QFC Branch), regulated by the Qatar Financial Centre Regulatory Authority (the QFCRA), and is directed at business customers and market counterparties only and is not intended for Retail Customers as defined by the QFCRA. As required by the Capital Markets Board of Turkey, investment information, comments and recommendations stated here, are not within the scope of investment advisory activity. Investment advisory service is provided in accordance with a contract of engagement on investment advisory concluded between brokerage houses, portfolio management companies, non-deposit banks and clients. Comments and recommendations stated here rely on the individual opinions of the ones providing these comments and recommendations. These opinions may not fit to your financial status, risk and return preferences. For this reason, to make an investment decision by relying solely to this information stated here may not bring about outcomes that fit your expectations.
© 2013 Morgan Stanley
M O R G A N S T A N L E Y R E S E A R C H
The Americas
1585 Broadway
New York, NY 10036-8293
United States
Tel: +1 (1) 212 761 4000
Europe
20 Bank Street, Canary Wharf
London E14 4AD
United Kingdom
Tel: +44 (0) 20 7 425 8000
Japan
4-20-3 Ebisu, Shibuya-ku
Tokyo 150-6008
Japan
Tel: +81 (0) 3 5424 5000
Asia/Pacific
1 Austin Road West
Kowloon
Hong Kong
Tel: +852 2848 5200


![20130903 what did you say? interculture communication [hamburg]](https://img.pdfslide.us/doc/110x75/554bd621b4c905706a8b5140/20130903-what-did-you-say-interculture-communication-hamburg.jpg)