Embed Size (px)
Citation preview
All Rights Reserved. 0
Housing Bubble and Macro-prudential supervision
- A case study from Japan in 1980’s and 90’s -
2013.06.06
All Rights Reserved.
Masahiro Kobayashi
Chief Economist, Global Market
Survey and Research Department
Japan Housing Finance Agency (JHF)
IUHF World Congress
All Rights Reserved. 1
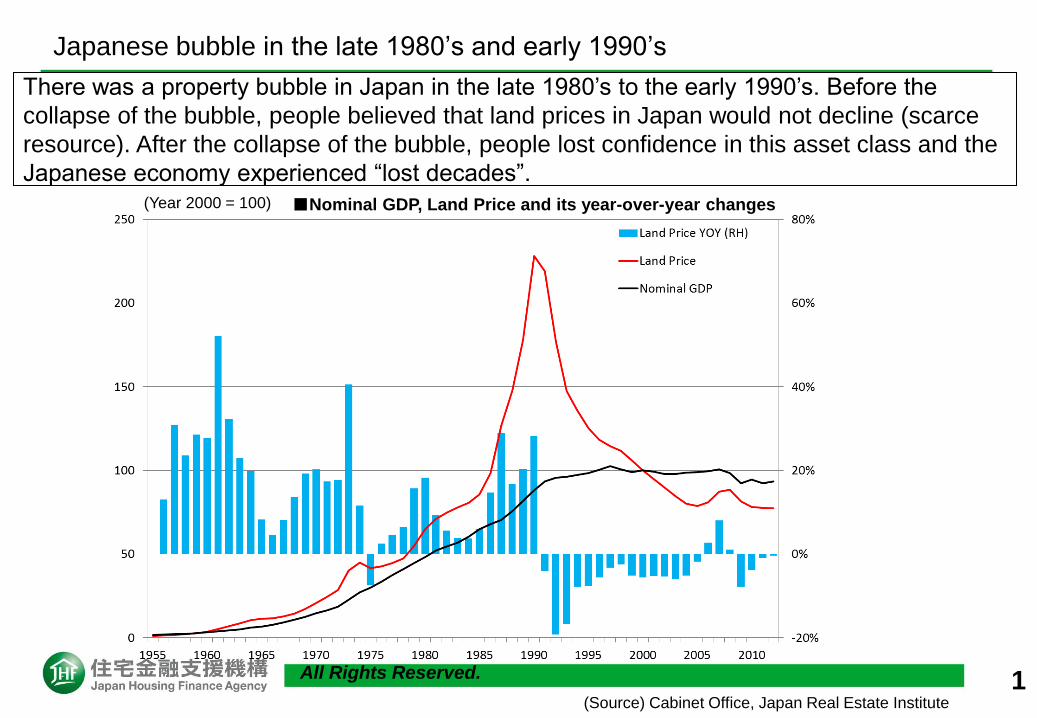
There was a property bubble in Japan in the late 1980’s to the early 1990’s. Before the
collapse of the bubble, people believed that land prices in Japan would not decline (scarce
resource). After the collapse of the bubble, people lost confidence in this asset class and the
Japanese economy experienced “lost decades”.
(Source) Cabinet Office, Japan Real Estate Institute
■Nominal GDP, Land Price and its year-over-year changes
Japanese bubble in the late 1980’s and early 1990’s
(Year 2000 = 100)
All Rights Reserved. 2
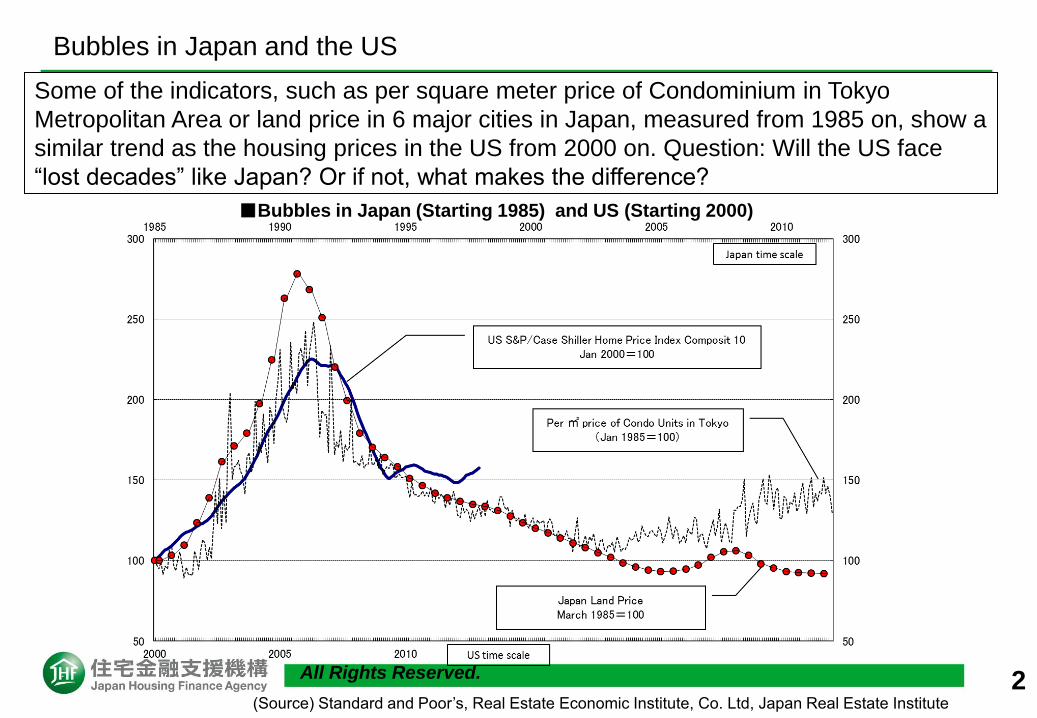
Some of the indicators, such as per square meter price of Condominium in Tokyo
Metropolitan Area or land price in 6 major cities in Japan, measured from 1985 on, show a
similar trend as the housing prices in the US from 2000 on. Question: Will the US face
“lost decades” like Japan? Or if not, what makes the difference?
(Source) Standard and Poor’s, Real Estate Economic Institute, Co. Ltd, Japan Real Estate Institute
■Bubbles in Japan (Starting 1985) and US (Starting 2000)
Bubbles in Japan and the US
All Rights Reserved. 3
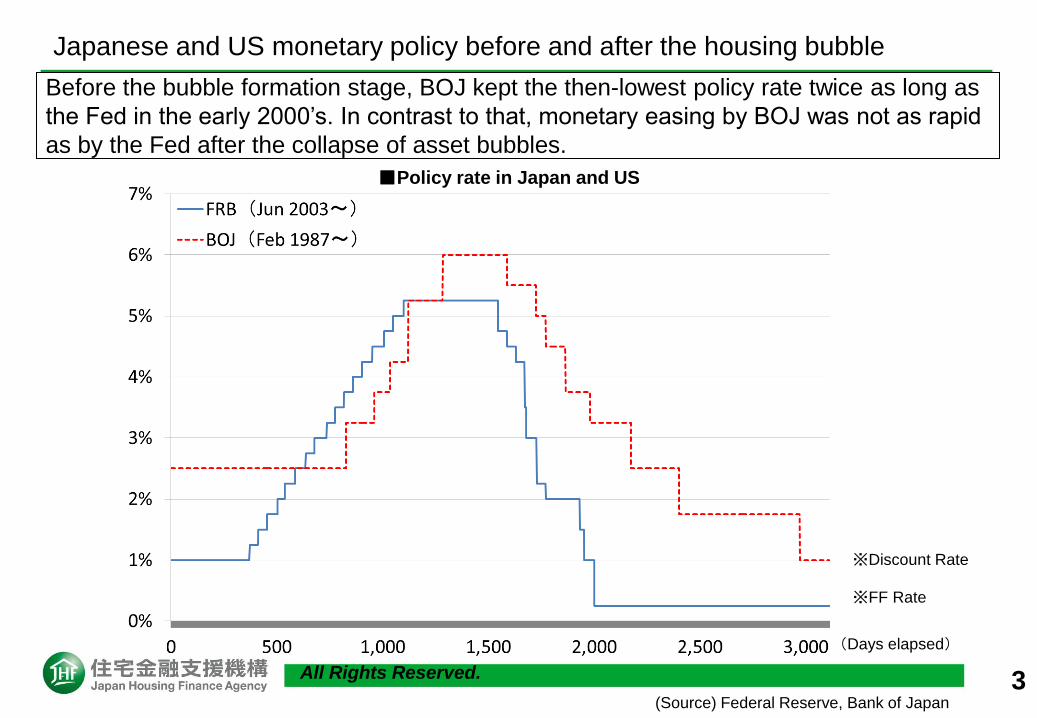
Before the bubble formation stage, BOJ kept the then-lowest policy rate twice as long as
the Fed in the early 2000’s. In contrast to that, monetary easing by BOJ was not as rapid
as by the Fed after the collapse of asset bubbles.
(Source) Federal Reserve, Bank of Japan
■Policy rate in Japan and US
※Discount Rate
Japanese and US monetary policy before and after the housing bubble
(Days elapsed)
※FF Rate

All Rights Reserved. 4
BOJ maintained discount rate at 2.50% from Feb 1987 to May 1989 because 1) there was a
need to take accommodative monetary policy after the rapid appreciation of Yen initiated by
Plaza Accord in 1985 and 2) Consumer Price Index (CPI) remained stable during that
period and there was no fear of inflation.
(Source) FRB, BOJ,
Ministry of Internal
Affairs and
Communications
■BOJ Discount Rate, CPI and Foreign Exchange Rate
BOJ Discount Rate, CPI and Foreign Exchange Rate
(JPY/USD)
All Rights Reserved. 5
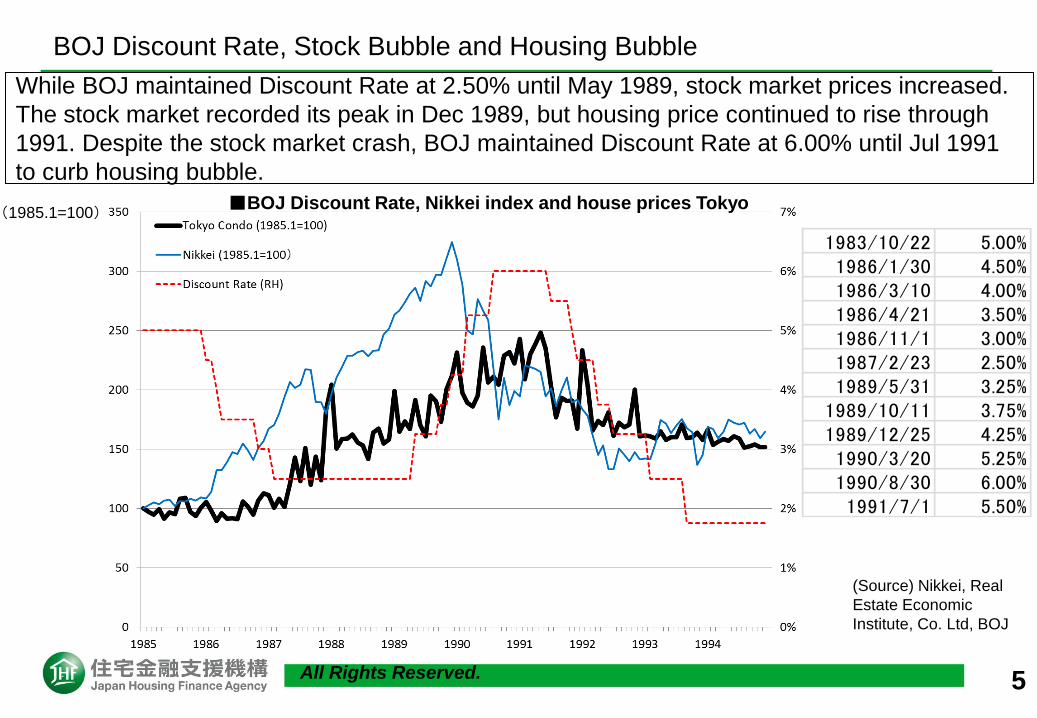
While BOJ maintained Discount Rate at 2.50% until May 1989, stock market prices increased.
The stock market recorded its peak in Dec 1989, but housing price continued to rise through
1991. Despite the stock market crash, BOJ maintained Discount Rate at 6.00% until Jul 1991
to curb housing bubble.
(Source) Nikkei, Real
Estate Economic
Institute, Co. Ltd, BOJ
■BOJ Discount Rate, Nikkei index and house prices Tokyo
BOJ Discount Rate, Stock Bubble and Housing Bubble
(1985.1=100)
1983/10/22 5.00%1986/1/30 4.50%1986/3/10 4.00%1986/4/21 3.50%1986/11/1 3.00%1987/2/23 2.50%1989/5/31 3.25%1989/10/11 3.75%1989/12/25 4.25%1990/3/20 5.25%1990/8/30 6.00%1991/7/1 5.50%
All Rights Reserved. 6
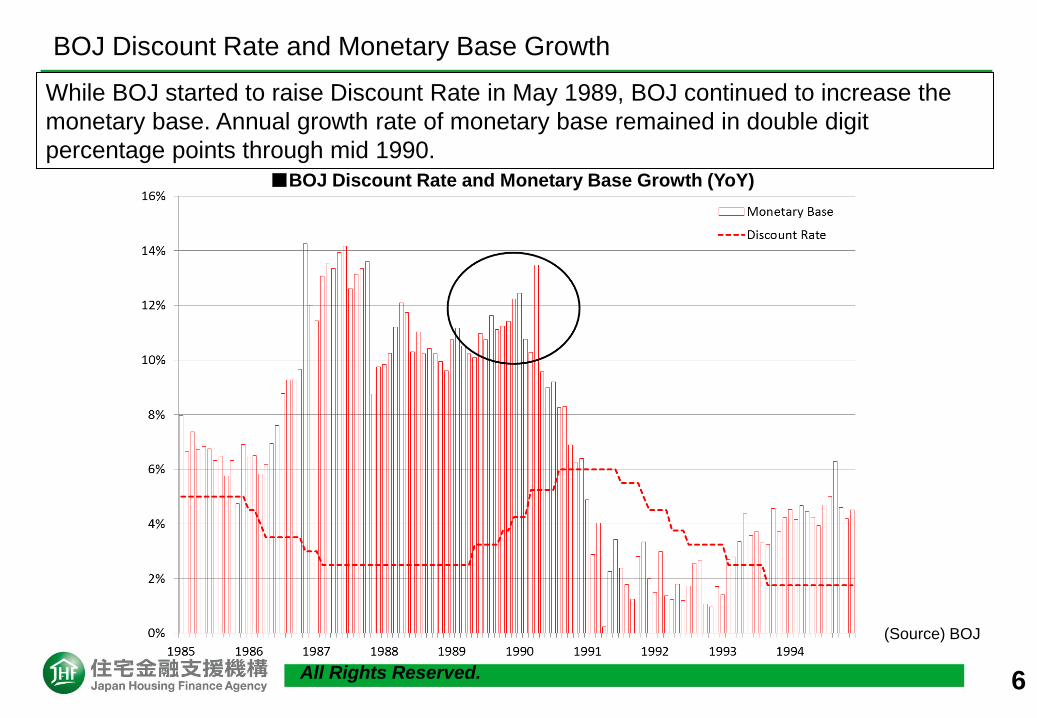
While BOJ started to raise Discount Rate in May 1989, BOJ continued to increase the
monetary base. Annual growth rate of monetary base remained in double digit
percentage points through mid 1990.
(Source) BOJ
■BOJ Discount Rate and Monetary Base Growth (YoY)
BOJ Discount Rate and Monetary Base Growth
All Rights Reserved. 7
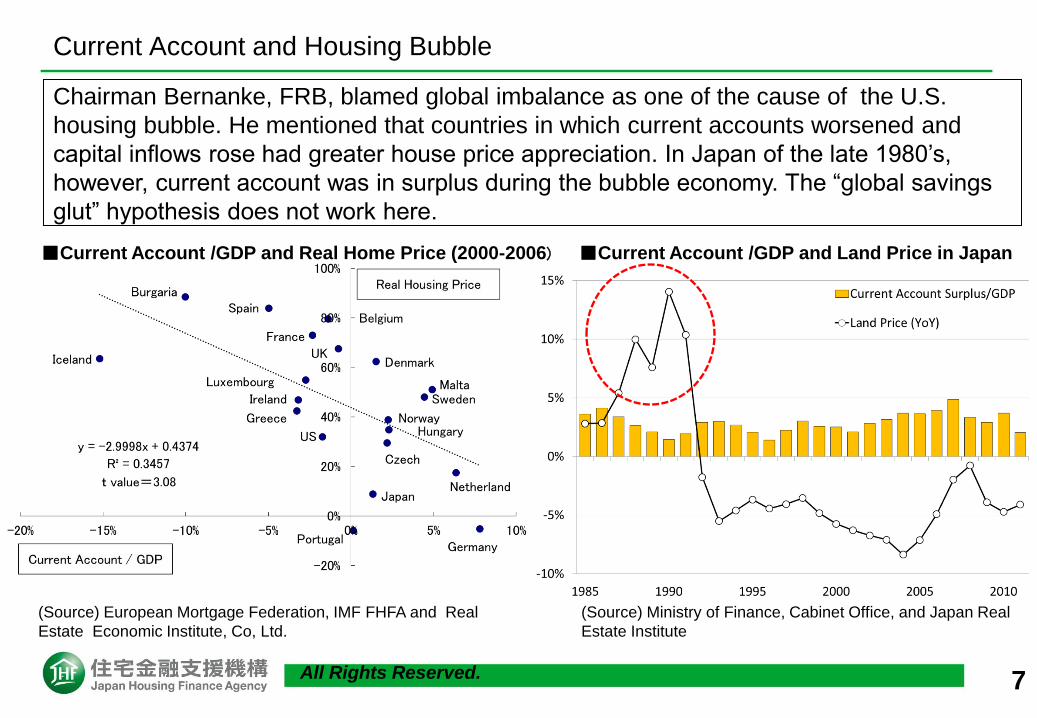
Chairman Bernanke, FRB, blamed global imbalance as one of the cause of the U.S.
housing bubble. He mentioned that countries in which current accounts worsened and
capital inflows rose had greater house price appreciation. In Japan of the late 1980’s,
however, current account was in surplus during the bubble economy. The “global savings
glut” hypothesis does not work here.
(Source) European Mortgage Federation, IMF FHFA and Real
Estate Economic Institute, Co, Ltd.
■Current Account /GDP and Real Home Price (2000-2006)
Current Account and Housing Bubble
■Current Account /GDP and Land Price in Japan
(Source) Ministry of Finance, Cabinet Office, and Japan Real
Estate Institute
All Rights Reserved. 8
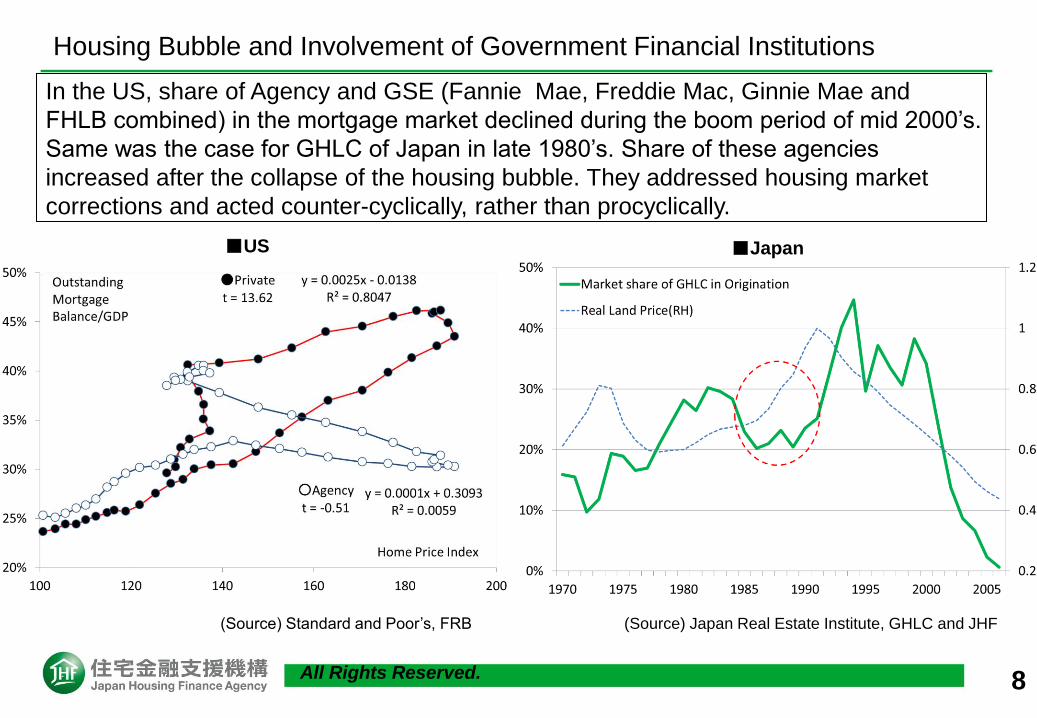
In the US, share of Agency and GSE (Fannie Mae, Freddie Mac, Ginnie Mae and
FHLB combined) in the mortgage market declined during the boom period of mid 2000’s.
Same was the case for GHLC of Japan in late 1980’s. Share of these agencies
increased after the collapse of the housing bubble. They addressed housing market
corrections and acted counter-cyclically, rather than procyclically.
(Source) Japan Real Estate Institute, GHLC and JHF
■Japan
Housing Bubble and Involvement of Government Financial Institutions
■US
(Source) Standard and Poor’s, FRB
All Rights Reserved. 9
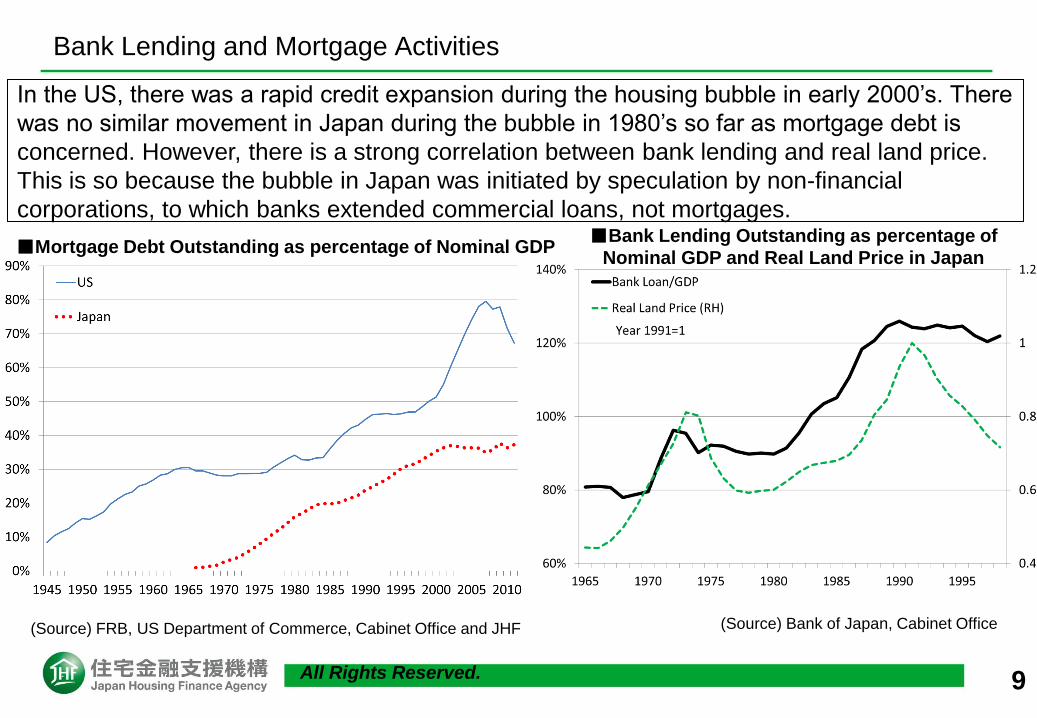
In the US, there was a rapid credit expansion during the housing bubble in early 2000’s. There
was no similar movement in Japan during the bubble in 1980’s so far as mortgage debt is
concerned. However, there is a strong correlation between bank lending and real land price.
This is so because the bubble in Japan was initiated by speculation by non-financial
corporations, to which banks extended commercial loans, not mortgages.
(Source) Bank of Japan, Cabinet Office
■Bank Lending Outstanding as percentage of
Nominal GDP and Real Land Price in Japan
Bank Lending and Mortgage Activities
■Mortgage Debt Outstanding as percentage of Nominal GDP
(Source) FRB, US Department of Commerce, Cabinet Office and JHF
All Rights Reserved. 10
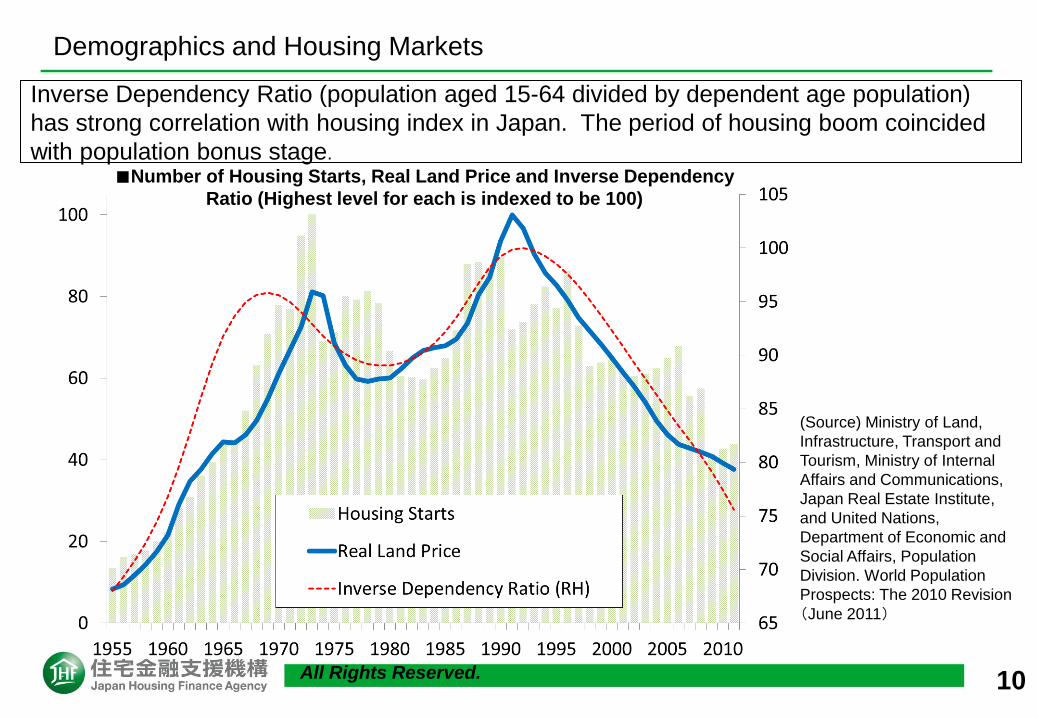
Inverse Dependency Ratio (population aged 15-64 divided by dependent age population)
has strong correlation with housing index in Japan. The period of housing boom coincided
with population bonus stage.
Demographics and Housing Markets
(Source) Ministry of Land,
Infrastructure, Transport and
Tourism, Ministry of Internal
Affairs and Communications,
Japan Real Estate Institute,
and United Nations,
Department of Economic and
Social Affairs, Population
Division. World Population
Prospects: The 2010 Revision
(June 2011)
■Number of Housing Starts, Real Land Price and Inverse Dependency
Ratio (Highest level for each is indexed to be 100)
All Rights Reserved. 11
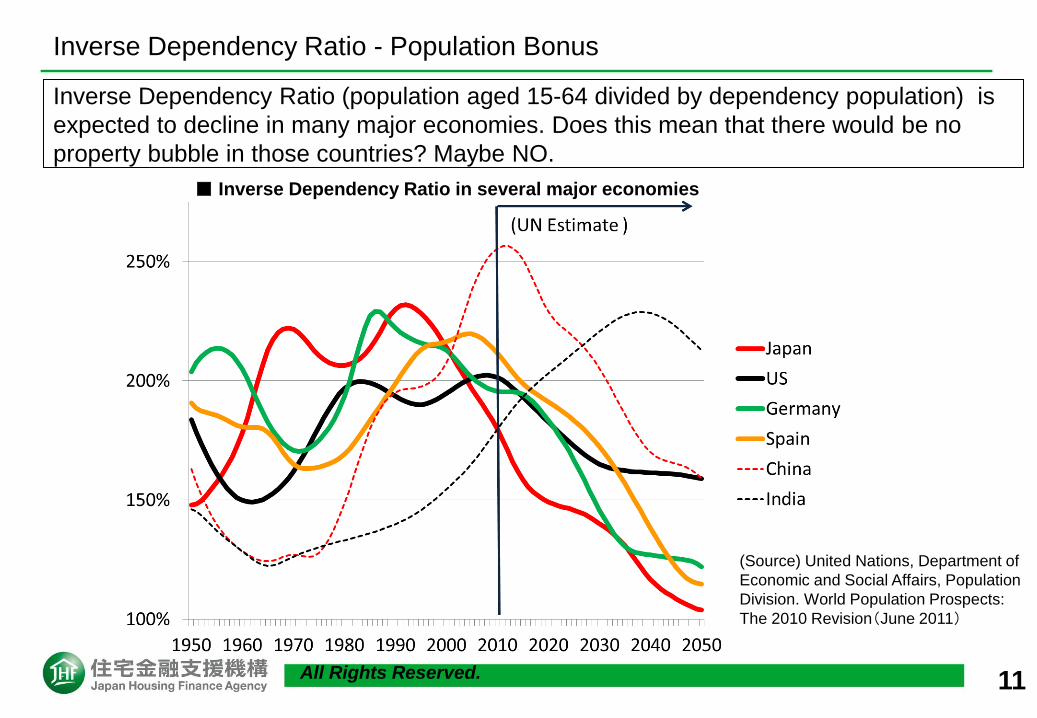
Inverse Dependency Ratio (population aged 15-64 divided by dependency population) is
expected to decline in many major economies. Does this mean that there would be no
property bubble in those countries? Maybe NO.
■ Inverse Dependency Ratio in several major economies
Inverse Dependency Ratio - Population Bonus
(Source) United Nations, Department of
Economic and Social Affairs, Population
Division. World Population Prospects:
The 2010 Revision(June 2011)
All Rights Reserved. 12
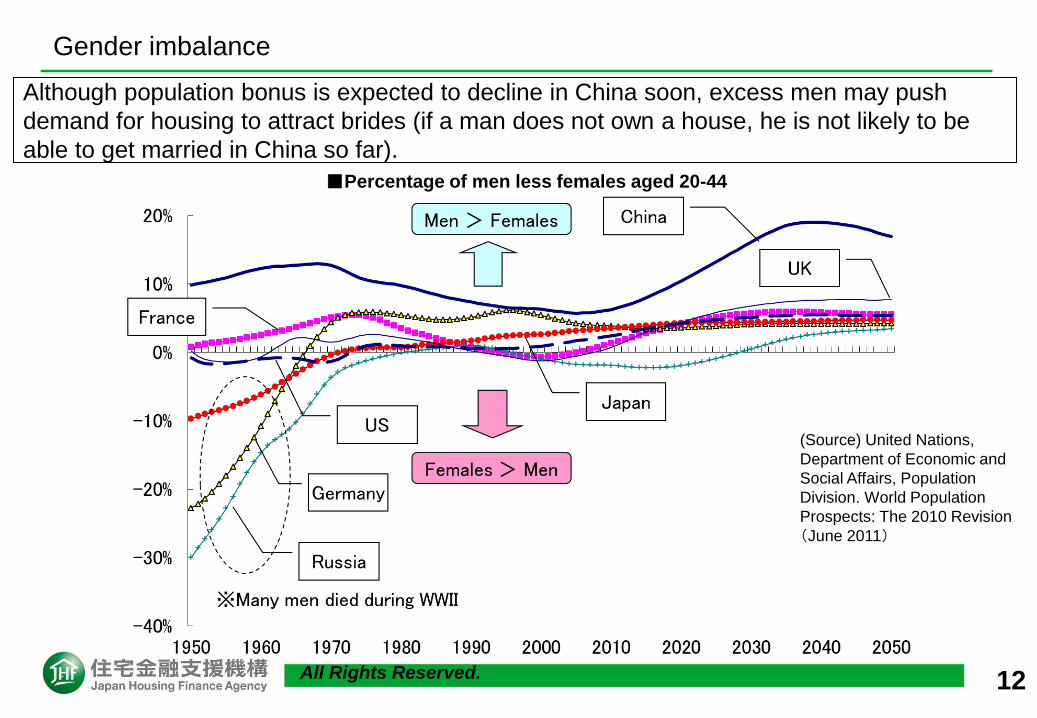
Although population bonus is expected to decline in China soon, excess men may push
demand for housing to attract brides (if a man does not own a house, he is not likely to be
able to get married in China so far).
■Percentage of men less females aged 20-44
Gender imbalance
(Source) United Nations,
Department of Economic and
Social Affairs, Population
Division. World Population
Prospects: The 2010 Revision
(June 2011)
All Rights Reserved. 13
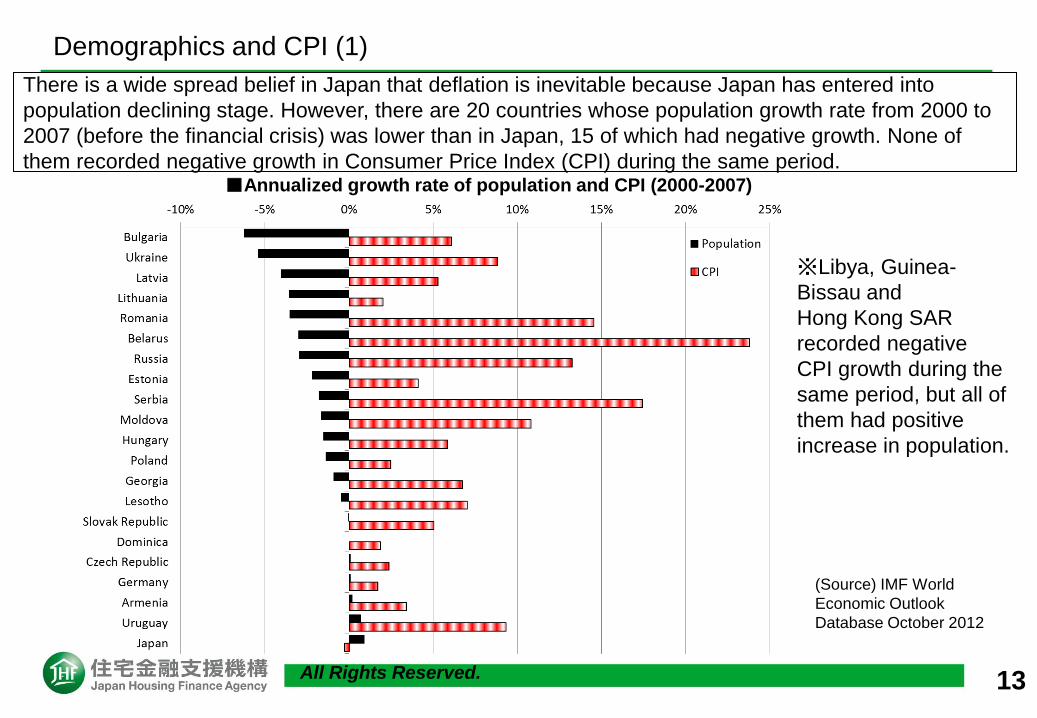
There is a wide spread belief in Japan that deflation is inevitable because Japan has entered into
population declining stage. However, there are 20 countries whose population growth rate from 2000 to
2007 (before the financial crisis) was lower than in Japan, 15 of which had negative growth. None of
them recorded negative growth in Consumer Price Index (CPI) during the same period.
(Source) IMF World
Economic Outlook
Database October 2012
■Annualized growth rate of population and CPI (2000-2007)
※Libya, Guinea-
Bissau and
Hong Kong SAR
recorded negative
CPI growth during the
same period, but all of
them had positive
increase in population.
Demographics and CPI (1)
All Rights Reserved. 14
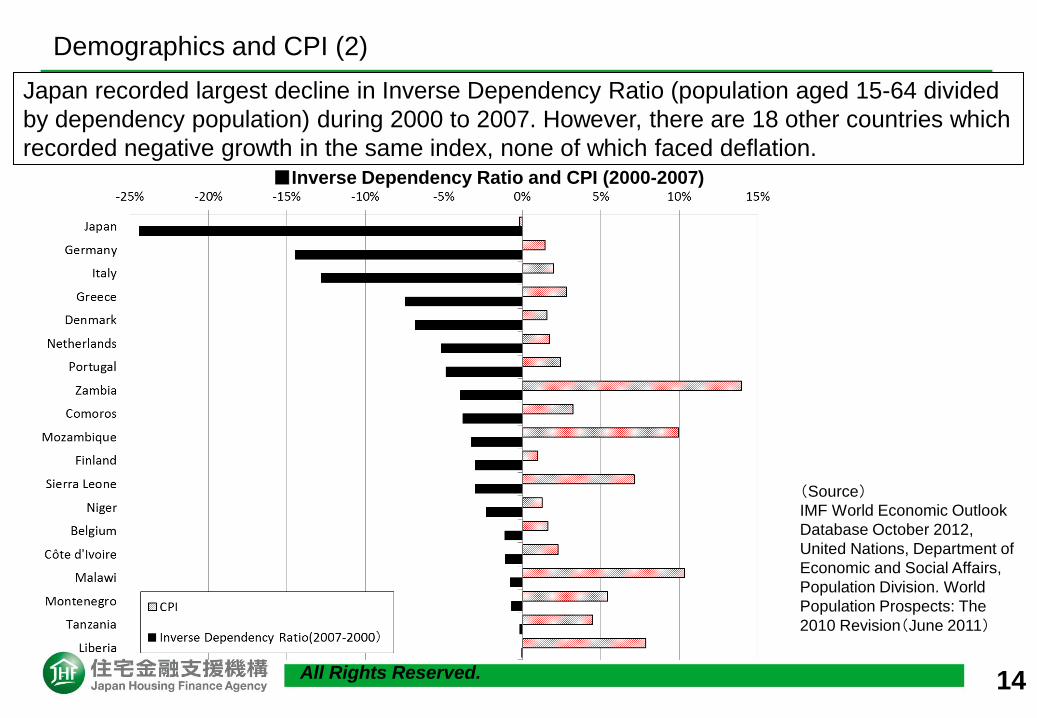
Japan recorded largest decline in Inverse Dependency Ratio (population aged 15-64 divided
by dependency population) during 2000 to 2007. However, there are 18 other countries which
recorded negative growth in the same index, none of which faced deflation.
(Source)
IMF World Economic Outlook
Database October 2012,
United Nations, Department of
Economic and Social Affairs,
Population Division. World
Population Prospects: The
2010 Revision(June 2011)
■Inverse Dependency Ratio and CPI (2000-2007)
Demographics and CPI (2)

All Rights Reserved. 15
On April 4, 2013, Bank of Japan (BOJ) announced the Introduction of the "Quantitative and
Qualitative Monetary Easing“ to double the monetary base as well as to double the average
remaining maturity of JGB purchases in two years. Compared to the level just before the
Lehman Collapse, BOJ is likely to catch up the pace of FRB.
(Source)BOJ, FRB
BOJ entering a new phase of monetary easing
■Monetary Base in the US and Japan after the Lehman Shock
All Rights Reserved. 16
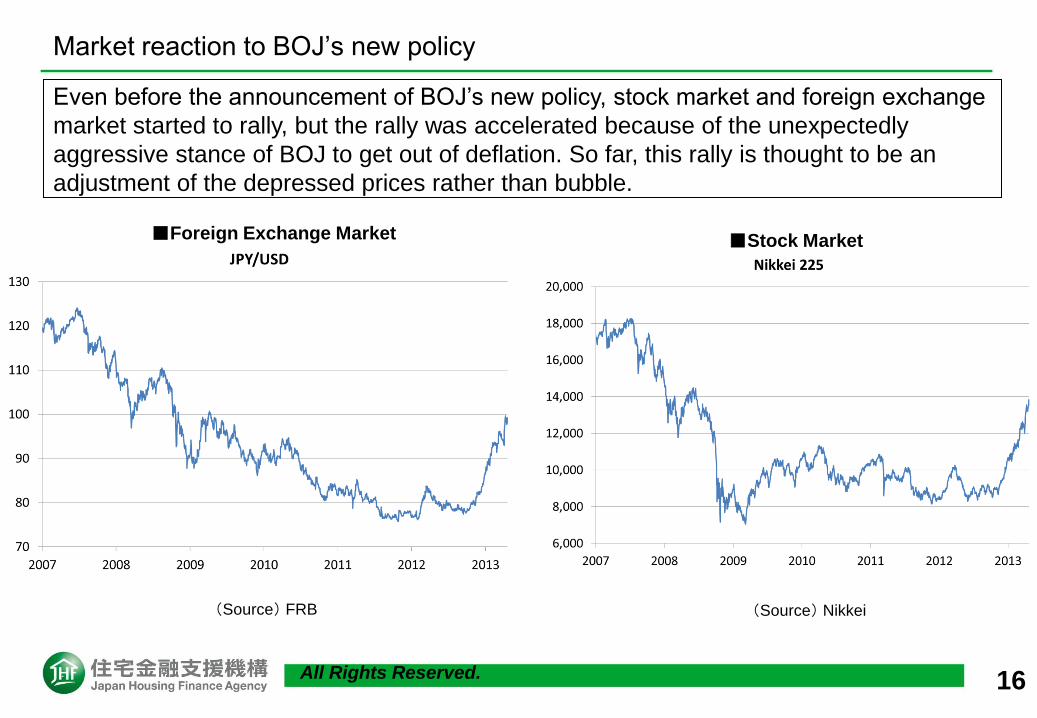
Even before the announcement of BOJ’s new policy, stock market and foreign exchange
market started to rally, but the rally was accelerated because of the unexpectedly
aggressive stance of BOJ to get out of deflation. So far, this rally is thought to be an
adjustment of the depressed prices rather than bubble.
(Source) FRB
■Foreign Exchange Market
Market reaction to BOJ’s new policy
(Source) Nikkei
■Stock Market
All Rights Reserved. 17
It is not easy to detect bubbles in real time. The development of a comparative housing
price database at an international level would be helpful, but local nature of housing
market makes it a challenging work.
Primary objective of monetary policy is price stability. However, considering the
aftermath of collapsing bubbles in property markets, more attention should be paid to
the property markets.
Policy reaction to property bubbles tends to be delayed. Policy makers should take
proactive approaches rather than retroactive approaches.
Housing bubbles may be accompanied with bubbles in other markets, including the
stock market. If there are separate movements in housing price and stock price, it
remains debatable which market the policy makers should focus on.
Monetary policy tools which address property bubbles need to be clearly identified. If
various tools move in different directions, it might confuse the market participants and
result in unintended consequences.
Lessons from Japanese Case

All Rights Reserved. 18
These materials have been prepared for the sole purpose of providing information and not as an offer, sale or inducement to buy or sell
bonds.
We urge investors when they are making investment decisions regarding bonds to carefully confirm details of the conditions, content, and
structure of the final products in the latest product prospectus prepared for the issuance of the relevant bonds as well as any other most
recent available information and accordingly assume personal responsibility for their decisions.


![28454918 Canadian Housing Bubble[1]](https://img.pdfslide.us/doc/110x75/577d2a481a28ab4e1ea8dfa0/28454918-canadian-housing-bubble1.jpg)