Embed Size (px)
DESCRIPTION
KNMI report on largest earthquake in Groningen, the Netherlands
Citation preview
Reassessment of the probability of higher magnitude earthquakes in the Groningen gas field
Including a position statement by KNMI
by
Mevr. Dr. A.G. Muntendam-Bos and Dr. J.A. de Waal
16 January 2013
State Supervision of Mines
Confidential Final Report, dd. 16-01-2013
2
Position Statement of KNMI with regard to the report: “Reassessment of the probability of future higher magnitude earthquakes in the Groningen gas field”, dated January 16, 2013, by the State Survey of Mines
In this Statement we declare our position with regard to the conclusions of the Report. It
should be mentioned that during the preparation of the Report, SSM has frequently consulted
and shared drafts with KNMI.
The Report presents the results of an SSM analysis of the seismicity in the Groningen field
(GF) based on the seismic catalogue data as provided by KNMI in the public domain.
Notable differences with earlier analyses by KNMI (e.g., Dost et al., 2012, which has a
broader scope) are the stronger focus on the GF in isolation, and the attempt to establish a
computational model for the relation between gas production and seismicity.
The SSM analysis addresses descriptive statistics of the past seismicity, as well as predictions
of (the statistics of) future seismicity. The predictions involve two kinds of extrapolation: (a)
extrapolation in time, and (b) extrapolation in magnitude.
The descriptive statistics primarily concern (i) the evaluation of the seismicity rate, the
number of events in a certain time window (say, a year) above a certain threshold magnitude,
and (ii) the characterization of the relative frequencies of events of different magnitudes
within a population of events.
The extrapolation in time concerns the seismicity rate. The Report suggests extrapolation --
or prediction --, using a computational model that expresses seismicity rates as a function of
cumulative and annual gas production (Equation 4). The proposed model gives a history
match according to the authors’ criteria and is subsequently used to predict seismicity rates
for several production scenarios.
The extrapolation in magnitude concerns higher, still scarce or unobserved magnitudes. The
Report suggests extrapolation using the assumption of the classical Gutenberg-Richter
relation bounded by an undetermined maximum magnitude. The extrapolated Gutenberg-
Richter relation is combined with the extrapolated seismicity rates to predict probabilities for
the occurrence of events exceeding certain magnitudes.
With regard to the descriptive statistics KNMI supports the conclusions (1-3) of the Report,
based on our own research, concerning (1) the increase in the annual number of earthquakes
in the GF, (2) the inability to estimate a Mmax for the GF using earthquake statistics and (3)
Mmax > 3.9 cannot be excluded based on seismicity data only.
We conclude that:
• The seismicity rate of the Groningen field has been increasing significantly since the
onset of seismicity
• The seismicity of the Groningen field has not been stationary over time
• The distribution of the current catalogue of past events in Groningen is well described
by a Gutenberg-Richter relation with a b-value of around 1.0, a typical value for
natural and induced earthquakes.
• The distribution of magnitudes does not show evidence for a maximum magnitude.
Confidential Final Report, dd. 16-01-2013
3
With regard to the extrapolation in time KNMI takes the position that the model proposed by
SSM is speculative and should be better motivated and tested. KNMI is therefore not able to
give full support to conclusions 5-8 of the Report, dealing with inferences of the proposed
preliminary model. However, as a first attempt the model gives some directions and both the
SSM and NAM model agree that the annual number of earthquakes depend on cumulative
production. Cumulative production is responsible for compaction and we agree that
differential compaction is most likely the driving force behind seismicity in the field.
With regard to the extrapolation in magnitude KNMI takes the position that the bounded
Gutenberg-Richter model is a reasonable model to predict the relative frequencies of higher,
unobserved magnitudes. However, it should be clear that this model is an assumption. Other
types of relative frequency-magnitude distributions may also be envisioned. KNMI supports
conclusion 4 of the Report with the additional qualifier that it is based on the assumption of a
bounded Gutenberg-Richter model for all magnitudes above the magnitude of completeness.
The percentages mentioned depend on that assumption. Since we do not know the Mmax,
these conclusions are only used as examples.
Confidential Final Report, dd. 16-01-2013
4
Nederlandstalige conclusies Dit rapport beschrijft een analyse van aardbevingsdata uit het Groningen veld door SodM waarin
het te verwachten jaarlijkse aantal aardbevingen (de seismiciteit) wordt gekoppeld aan productie
en productiesnelheid. Dat geeft een betere beschrijving van het seismische gedrag van Groningen
tot nu toe en andere voorspellingen voor de toekomst.
De belangrijkste conclusies op basis van de SodM analyse zijn:
1. Het jaarlijkse aantal aardbevingen en de energie die daarbij vrijkomt nemen toe en daarmee
voor Groningen ook de kans op het optreden van aardbevingen met hogere magnitude.
2. Een Monte Carlo analyse toont aan dat het niet mogelijk is om op basis van de seismische
data van het Groningen veld een waarde voor Mmax te bepalen, anders dan dat de waarde
daarvan boven de 3,6 ligt. Dat betekent niet dat er geen bovengrens is.
3. Hogere waarden voor Mmax kunnen op voorhand niet worden uitgesloten zonder
aanvullende schattingen op basis van niet-seismische methodes zoals geomechanische
berekeningen. Zulke data is momenteel niet beschikbaar voor Groningen.
4. Omdat op dit moment geen uitspraak kan worden gedaan over Mmax is de
verwachtingswaarde voor de kans op een aardbeving met een magnitude van 3,9 of hoger in
Groningen niet nauwkeurig te bepalen. Gedurende de komende 12 maanden is de
verwachtingswaarde voor die kans in het ongunstigste geval (uitgaande van een Mmax van
6,0) ongeveer 7,6%. Bij een Mmax van 5,0 is dat ongeveer 7 %, bij een Mmax van 4,5
ongeveer 5,8 %. Bij een Mmax van 3,9 wordt de verwachtingswaarde 0%. De
verwachtingswaarde voor de kans op een aardbeving met magnitude van 4.5 of hoger
gedurende de komende 12 maanden ligt tussen 0 en 2%.
5. Er is een voorlopige versie van een vergelijking gevonden die, binnen de te verwachten
intrinsieke statistische fluctuaties, het jaarlijkse aantal aardbevingen met magnitude M≥1,5 -
en de variaties daarin – voorspelt op basis van de cumulatieve productie en de
productiesnelheid. Die vergelijking is gerelateerd aan een (rate type) compactie model
waarmee het waargenomen niet-lineaire compactiegedrag van het Groningen veld goed
wordt beschreven. De gevonden vergelijking suggereert dat de mate van vertraging in de
bodemdaling de seismiciteit bepaalt.
6. SodM heeft op basis daarvan een aanpak ontwikkeld voor de beschrijving van het
waargenomen seismische gedrag van het Groningen veld. De b-waarde uit de Gutenberg-
Richter relatie voor Groningen wordt daarin gecombineerd met de bovengenoemde
vergelijking en een aanname voor de maximaal mogelijke magnitude Mmax. De op basis van
deze aanpak berekende (veranderingen in) de seismiciteit in Groningen zijn in
overeenstemming met de waarnemingen. Dezelfde aanpak kan worden gebruikt om de
waarschijnlijkheid te berekenen voor het optreden van een aardbeving boven een gegeven
magnitude voor een tijdsperiode in de toekomst.
7. De verwachtingswaarde voor de kans op een aardbeving met een grotere magnitude (M≥3,9)
kan op termijn van enkele jaren met ongeveer een factor twee worden verlaagd door de
jaarlijkse productie uit het Groningen veld in een keer te verlagen met een factor twee ten
opzichte van de huidige productiesnelheid van ca. 50 miljard normal kubieke meter gas per
jaar, gevolgd door een geleidelijke verdere afname. Een significante verwachtingswaarde
voor de kans op een aardbeving met een grotere magnitude blijft ook dan bestaan.
8. Op basis van de de gevonden relatie tussen het jaarlijks aantal aardbevingen, de productie en
de productiesnelheid zou de productiesnelheid tot ca. 12 normal BCM/jaar verlaagd moeten
worden om het risico op aardbevingen te minimaliseren. Het is daarom mogelijk dat bij die
productiesnelheid na enkele jaren vrijwel geen aardbevingen met een magnitude ≥ 1.5 meer
zouden optreden in het Groningen veld.
Confidential Final Report, dd. 16-01-2013
5
Executive summary A higher than predicted annual frequency of earthquakes with a magnitude equal or above 3.0
has led to an independent assessment by State Supervision of Mines (SSM) of the available
Groningen earthquake data and the applied analysis methods. The occurrence of the highest
magnitude earthquake thus far, near Huizinge in August 2012, with a moment magnitude of 3.6
gave further impetus. In the re-assessment SSM has limited the analysis to the earthquake data
from the Groningen field only.
The Groningen field shows an increasing number of earthquakes over time, as reported in [1]. As
a result, the expectation value for the probability for higher magnitude earthquakes has increased
significantly for Groningen. Firm conclusions on this could only be drawn recently given the
inherent statistical uncertainty resulting from the initially much more limited number of
earthquakes and the fact that a clear increase only started around 2003. Annual gas production
increased from 20 Billion normal cubic meter (normal BCM) in 2000 to a level around 50 billion
normal BCM in 2011. In the same period the annual number of registered earthquakes with a
magnitude of 1.5 or higher increased from on average 4 per year during the period 1991-2002 to
28 earthquakes in 2011. Superimposed on this longer term trend, increases and decreases in the
annual gas production are followed by increases and decreases in the annual number of
earthquakes with a delay of approximately a year.
The effect of the increasing cumulative production can be separated from the effect of the
changing annual production using a preliminary version of an equation related to a (rate type)
compaction model that can be used to describe the observed non-linear compaction behaviour of
the Groningen field [2,3,4]. The thus calculated annual number of earthquakes agrees, within the
intrinsic statistical uncertainty, with the historically observed variation in the Groningen
seismicity between 1964 and 2012. This suggests that the seismicity level is linked to the amount
of subsidence delay. Note that this is still work in progress.
The SSM analysis confirms previous preliminary analysis on Groningen data [1] on the fact that
earthquakes with a magnitude equal to or above 2.5 are approximately ten times less probable
then earthquakes with a magnitude equal to or above 1.5, independent of the total number of
earthquakes in a given period (e.g. in a given year)1. Earthquakes with a magnitude equal to or
above 3.5 are again approximately ten times less probable. This behaviour is expected to
continue for higher magnitude earthquakes that have not yet taken place in Groningen, although
bounded by the maximum magnitude that can occur. Based on the data from all fields in the
Netherlands for the full period since 1996, a maximum probable magnitude of 3.9 was calculated
during an earlier study [1]. An SSM Monte Carlo analysis on the seismicity data from Groningen
only now shows that little can be said about the maximum possible magnitude in Groningen
other than that it can have any value above 3.6. Perhaps that non-seismic methods can be applied
to obtain estimates for the maximum possible magnitude. This could include estimates based on
the maximum percentage of the stored elastic energy that can be released in a single earthquake.
Or an upper limit based on an analysis of the distribution and size of faults present in the field.
At the moment such results are not available for Groningen.
Using the total number of seismic events in a given period and making an assumption on the
maximum possible magnitude, the probability for earthquakes equal to or above a given other
1 Hence, for every 10 tremors with a magnitude equal to or above1.5 there is on average one tremor with
a magnitude equal to or above 2.5.
Confidential Final Report, dd. 16-01-2013
6
magnitude can be calculated for that given period. Doing so, the historic seismic behaviour of the
Groningen field is reproduced within the intrinsic statistical uncertainty. For the coming 20
earthquakes (approximately the number of earthquakes with M≥1.5 expected during the next 12
months) this approach results in a worst case expectation value for the probability for an
earthquake with a magnitude equal or above 3.9 of around 7.6 %. In this calculation a value of
6.0 is imposed for Mmax. If Mmax would be 5.0 the expectation value for the probability
becomes 7 % and 5.8 % for an Mmax of 4,5. For an Mmax of 3.9 the expectation value for the
probability becomes 0%. The expectation value for the probability of a magnitude 4.5 or larger
earthquake to occur within the next twelve months is between 0 and 2%.
Combining the derived (preliminary) relation to compute the annual number of earthquakes on
the basis of both cumulative and annual production with the above approach, the seismicity to
be expected under various Groningen production scenario’s can be calculated. Results suggest
that the expectation value for the annual number of earthquakes of magnitude M ≥ 1.5 might be
decreased by approximately a factor of two, by decreasing the annual production rate by a factor
two compared to the current production rate of some 50 billion normal cubic meter/year (normal
BCM) followed by further reductions. The expectation value for the number of larger magnitude
earthquakes then will also halve. However, under this scenario a significant expectation
probability for larger magnitude earthquakes will remain (typically 2-5 % for an M≥4.5 during
the next 4 years).
Based on the derived (preliminary) relation between annual number of earthquakes and
production, production rates would have to be lowered to values around 12 normal BCM/year in
order to achieve minimal risk. It is therefore possible that at this production rate almost no
earthquakes with magnitudes ≥1.5 would occur after a number of years.
Confidential Final Report, dd. 16-01-2013
7
Contents
Position Statement of KNMI with regard to the report: “Reassessment of the
probability of future higher magnitude earthquakes in the Groningen gas
field”, dated January 16, 2013, by the State Survey of Mines...........................2
Nederlandstalige conclusies...............................................................................4
Executive summary............................................................................................5
Contents .............................................................................................................7
Introduction........................................................................................................8
Induced Seismicity (variation) in Groningen...................................................10
General observations................................................................................... 10
Energy release............................................................................................. 11
Statistical analysis....................................................................................... 11
Seismicity and magnitudes for Groningen.......................................................14
The Gutenberg-Richter law......................................................................... 14
Implications for Groningen......................................................................... 15
Monte Carlo derivation of BGR parameters............................................... 15
Discussion ................................................................................................... 17
Relation between production and seismicity ...................................................18
Consequences for future earthquakes in Groningen ........................................23
Expectation probability for larger magnitude earthquakes due to already
realised production...................................................................................... 23
Predicted earthquakes in Groningen under different production scenarios 24
Conclusions......................................................................................................28
References........................................................................................................29
Appendix A: October 8th
SSM technical assement..........................................30
Appendix B: Summary of peer review workshop outcomes ...........................34
Confidential Final Report, dd. 16-01-2013
8
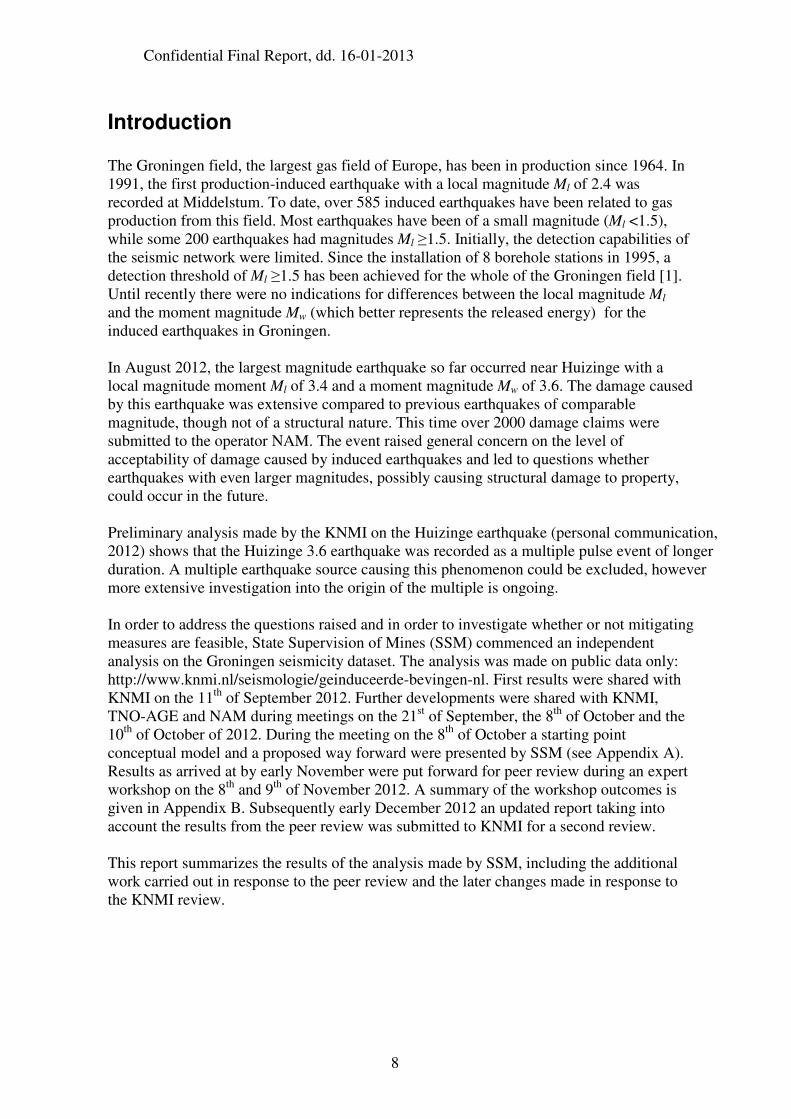
Introduction
The Groningen field, the largest gas field of Europe, has been in production since 1964. In
1991, the first production-induced earthquake with a local magnitude Ml of 2.4 was
recorded at Middelstum. To date, over 585 induced earthquakes have been related to gas
production from this field. Most earthquakes have been of a small magnitude (Ml <1.5),
while some 200 earthquakes had magnitudes Ml ≥1.5. Initially, the detection capabilities of
the seismic network were limited. Since the installation of 8 borehole stations in 1995, a
detection threshold of Ml ≥1.5 has been achieved for the whole of the Groningen field [1].
Until recently there were no indications for differences between the local magnitude Ml
and the moment magnitude Mw (which better represents the released energy) for the
induced earthquakes in Groningen.
In August 2012, the largest magnitude earthquake so far occurred near Huizinge with a
local magnitude moment Ml of 3.4 and a moment magnitude Mw of 3.6. The damage caused
by this earthquake was extensive compared to previous earthquakes of comparable
magnitude, though not of a structural nature. This time over 2000 damage claims were
submitted to the operator NAM. The event raised general concern on the level of
acceptability of damage caused by induced earthquakes and led to questions whether
earthquakes with even larger magnitudes, possibly causing structural damage to property,
could occur in the future.
Preliminary analysis made by the KNMI on the Huizinge earthquake (personal communication,
2012) shows that the Huizinge 3.6 earthquake was recorded as a multiple pulse event of longer
duration. A multiple earthquake source causing this phenomenon could be excluded, however
more extensive investigation into the origin of the multiple is ongoing.
In order to address the questions raised and in order to investigate whether or not mitigating
measures are feasible, State Supervision of Mines (SSM) commenced an independent
analysis on the Groningen seismicity dataset. The analysis was made on public data only:
http://www.knmi.nl/seismologie/geinduceerde-bevingen-nl. First results were shared with
KNMI on the 11th
of September 2012. Further developments were shared with KNMI,
TNO-AGE and NAM during meetings on the 21st of September, the 8
th of October and the
10th
of October of 2012. During the meeting on the 8th
of October a starting point
conceptual model and a proposed way forward were presented by SSM (see Appendix A).
Results as arrived at by early November were put forward for peer review during an expert
workshop on the 8th
and 9th
of November 2012. A summary of the workshop outcomes is
given in Appendix B. Subsequently early December 2012 an updated report taking into
account the results from the peer review was submitted to KNMI for a second review.
This report summarizes the results of the analysis made by SSM, including the additional
work carried out in response to the peer review and the later changes made in response to
the KNMI review.
Confidential Final Report, dd. 16-01-2013
9
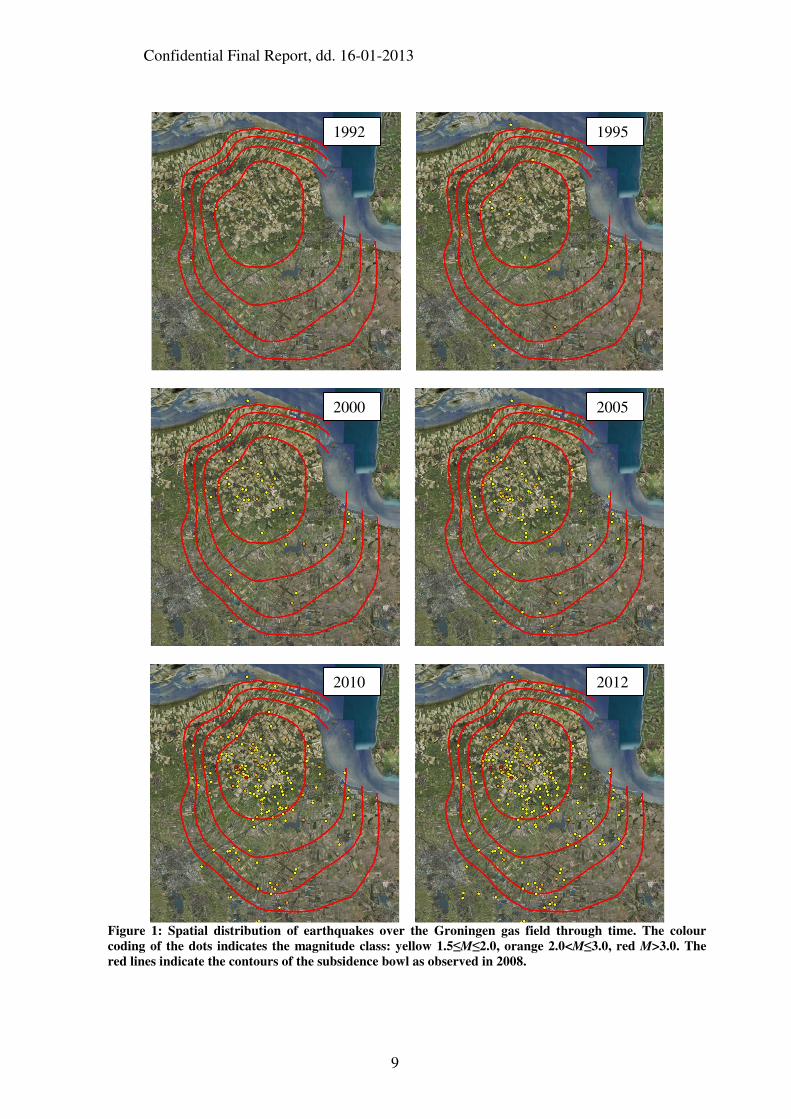
Figure 1: Spatial distribution of earthquakes over the Groningen gas field through time. The colour
coding of the dots indicates the magnitude class: yellow 1.5≤M≤2.0, orange 2.0<M≤3.0, red M>3.0. The
red lines indicate the contours of the subsidence bowl as observed in 2008.
1992 1995
2000 2005
2010 2012
Confidential Final Report, dd. 16-01-2013
10
Induced Seismicity (variation) in Groningen
General observations
Figure 1 shows the location of earthquakes of magnitudes 1.5 and larger through time in
roughly 5-year intervals. The area where the seismicity is occurring has been increasing,
with two distinct areas: the area around Middelstum and the area towards the south-west of
the field. The area around Middelstum coincides with the deepest part of the subsidence
bowl caused by the Groningen gas production. Both areas correspond with areas of higher
average porosity while lower porosity zones around the southern production clusters show
little seismicity. This suggests a link between seismicity and reservoir compaction (which
is higher in higher porosity zones).
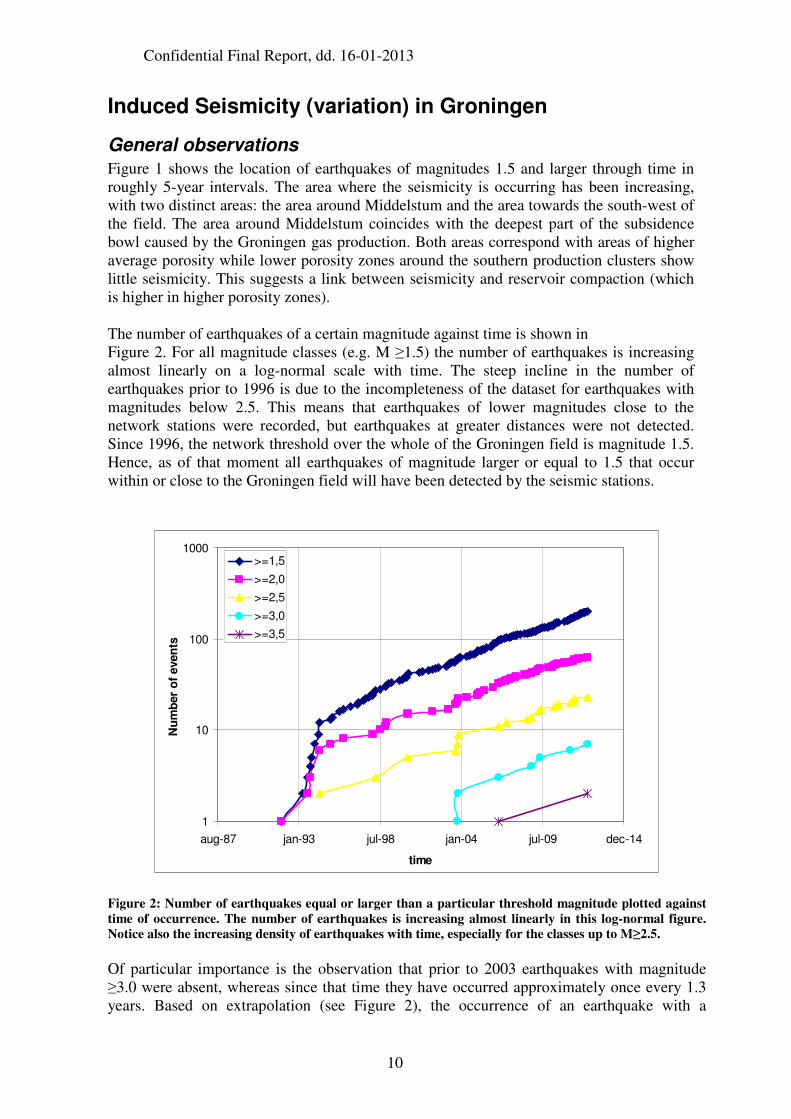
The number of earthquakes of a certain magnitude against time is shown in
Figure 2. For all magnitude classes (e.g. M ≥1.5) the number of earthquakes is increasing
almost linearly on a log-normal scale with time. The steep incline in the number of
earthquakes prior to 1996 is due to the incompleteness of the dataset for earthquakes with
magnitudes below 2.5. This means that earthquakes of lower magnitudes close to the
network stations were recorded, but earthquakes at greater distances were not detected.
Since 1996, the network threshold over the whole of the Groningen field is magnitude 1.5.
Hence, as of that moment all earthquakes of magnitude larger or equal to 1.5 that occur
within or close to the Groningen field will have been detected by the seismic stations.
1
10
100
1000
aug-87 jan-93 jul-98 jan-04 jul-09 dec-14
time
Nu
mb
er
of
even
ts
>=1,5
>=2,0
>=2,5
>=3,0
>=3,5
Figure 2: Number of earthquakes equal or larger than a particular threshold magnitude plotted against
time of occurrence. The number of earthquakes is increasing almost linearly in this log-normal figure.
Notice also the increasing density of earthquakes with time, especially for the classes up to M≥2.5.
Of particular importance is the observation that prior to 2003 earthquakes with magnitude
≥3.0 were absent, whereas since that time they have occurred approximately once every 1.3
years. Based on extrapolation (see Figure 2), the occurrence of an earthquake with a
Confidential Final Report, dd. 16-01-2013
11
magnitude 3.0 or greater would have been likely at least since 1998. Extrapolation of the
statistics also suggests that unnoticed earthquakes with magnitudes above 1.5 are likely to
have taken place prior to 1990. For the magnitude classes up to M ≥2.5 a clear increase in the
density of earthquakes through time can be observed. This implies that the frequency at
which an earthquake of this class occurs is increasing. A similar increase is plausible for the
higher magnitudes
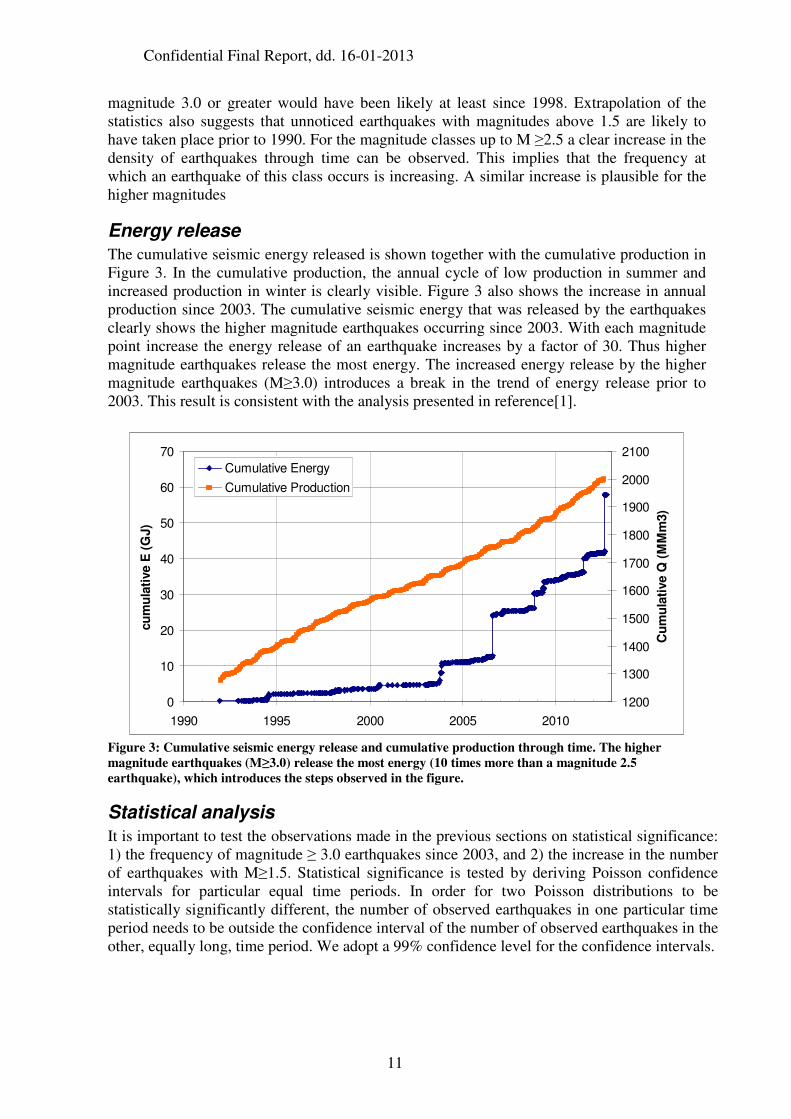
Energy release
The cumulative seismic energy released is shown together with the cumulative production in
Figure 3. In the cumulative production, the annual cycle of low production in summer and
increased production in winter is clearly visible. Figure 3 also shows the increase in annual
production since 2003. The cumulative seismic energy that was released by the earthquakes
clearly shows the higher magnitude earthquakes occurring since 2003. With each magnitude
point increase the energy release of an earthquake increases by a factor of 30. Thus higher
magnitude earthquakes release the most energy. The increased energy release by the higher
magnitude earthquakes (M≥3.0) introduces a break in the trend of energy release prior to
2003. This result is consistent with the analysis presented in reference[1].
0
10
20
30
40
50
60
70
1990 1995 2000 2005 2010
cu
mu
lati
ve E
(G
J)
1200
1300
1400
1500
1600
1700
1800
1900
2000
2100
Cu
mu
lati
ve Q
(M
Mm
3)
Cumulative Energy
Cumulative Production
Figure 3: Cumulative seismic energy release and cumulative production through time. The higher
magnitude earthquakes (M≥3.0) release the most energy (10 times more than a magnitude 2.5
earthquake), which introduces the steps observed in the figure.
Statistical analysis
It is important to test the observations made in the previous sections on statistical significance:
1) the frequency of magnitude ≥ 3.0 earthquakes since 2003, and 2) the increase in the number
of earthquakes with M≥1.5. Statistical significance is tested by deriving Poisson confidence
intervals for particular equal time periods. In order for two Poisson distributions to be
statistically significantly different, the number of observed earthquakes in one particular time
period needs to be outside the confidence interval of the number of observed earthquakes in the
other, equally long, time period. We adopt a 99% confidence level for the confidence intervals.
Confidential Final Report, dd. 16-01-2013
12
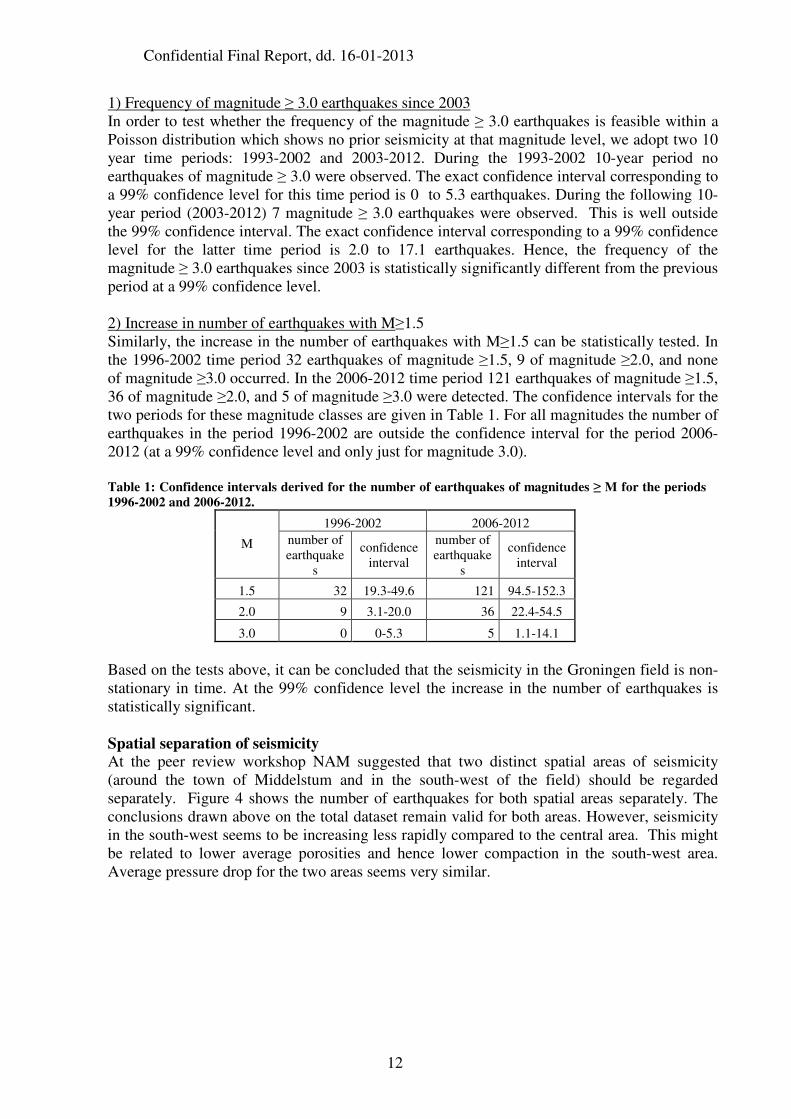
1) Frequency of magnitude ≥ 3.0 earthquakes since 2003
In order to test whether the frequency of the magnitude ≥ 3.0 earthquakes is feasible within a
Poisson distribution which shows no prior seismicity at that magnitude level, we adopt two 10
year time periods: 1993-2002 and 2003-2012. During the 1993-2002 10-year period no
earthquakes of magnitude ≥ 3.0 were observed. The exact confidence interval corresponding to
a 99% confidence level for this time period is 0 to 5.3 earthquakes. During the following 10-
year period (2003-2012) 7 magnitude ≥ 3.0 earthquakes were observed. This is well outside
the 99% confidence interval. The exact confidence interval corresponding to a 99% confidence
level for the latter time period is 2.0 to 17.1 earthquakes. Hence, the frequency of the
magnitude ≥ 3.0 earthquakes since 2003 is statistically significantly different from the previous
period at a 99% confidence level.
2) Increase in number of earthquakes with M≥1.5
Similarly, the increase in the number of earthquakes with M≥1.5 can be statistically tested. In
the 1996-2002 time period 32 earthquakes of magnitude ≥1.5, 9 of magnitude ≥2.0, and none
of magnitude ≥3.0 occurred. In the 2006-2012 time period 121 earthquakes of magnitude ≥1.5,
36 of magnitude ≥2.0, and 5 of magnitude ≥3.0 were detected. The confidence intervals for the
two periods for these magnitude classes are given in Table 1. For all magnitudes the number of
earthquakes in the period 1996-2002 are outside the confidence interval for the period 2006-
2012 (at a 99% confidence level and only just for magnitude 3.0).
Table 1: Confidence intervals derived for the number of earthquakes of magnitudes ≥ M for the periods
1996-2002 and 2006-2012.
1996-2002 2006-2012
M number of
earthquake
s
confidence
interval
number of
earthquake
s
confidence
interval
1.5 32 19.3-49.6 121 94.5-152.3
2.0 9 3.1-20.0 36 22.4-54.5
3.0 0 0-5.3 5 1.1-14.1
Based on the tests above, it can be concluded that the seismicity in the Groningen field is non-
stationary in time. At the 99% confidence level the increase in the number of earthquakes is
statistically significant.
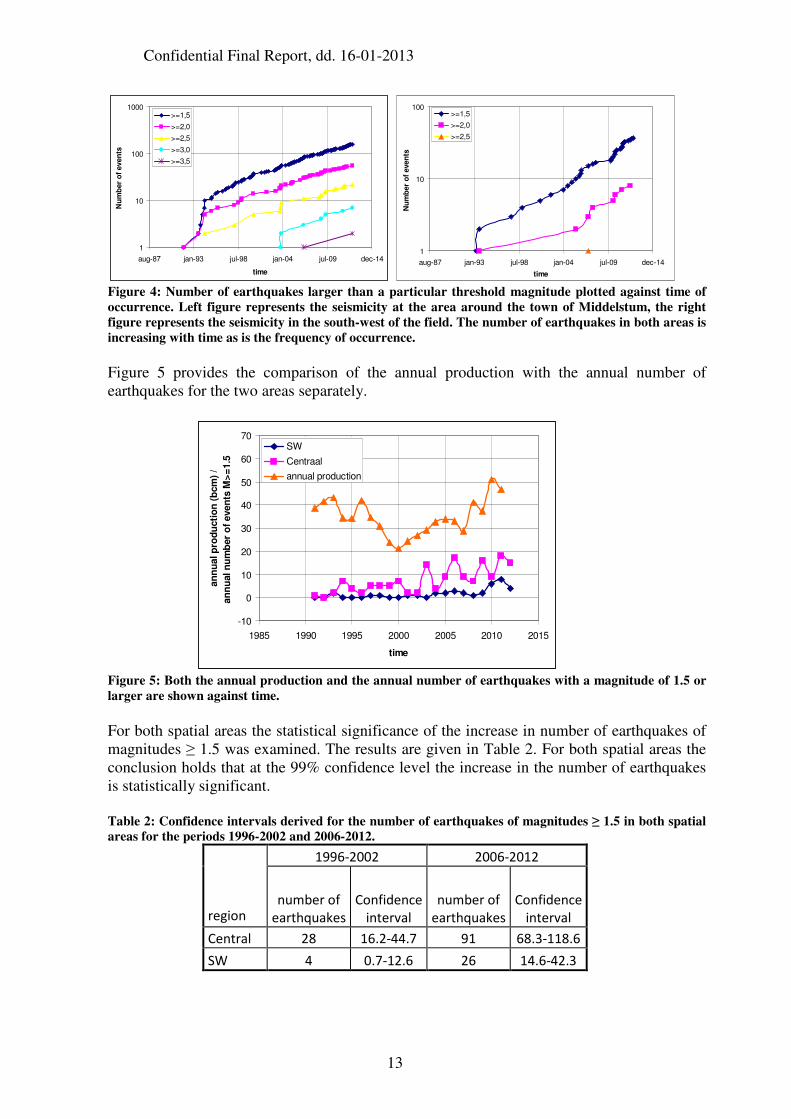
Spatial separation of seismicity
At the peer review workshop NAM suggested that two distinct spatial areas of seismicity
(around the town of Middelstum and in the south-west of the field) should be regarded
separately. Figure 4 shows the number of earthquakes for both spatial areas separately. The
conclusions drawn above on the total dataset remain valid for both areas. However, seismicity
in the south-west seems to be increasing less rapidly compared to the central area. This might
be related to lower average porosities and hence lower compaction in the south-west area.
Average pressure drop for the two areas seems very similar.
Confidential Final Report, dd. 16-01-2013
13
1
10
100
1000
aug-87 jan-93 jul-98 jan-04 jul-09 dec-14
time
Nu
mb
er
of
even
ts>=1,5
>=2,0
>=2,5
>=3,0
>=3,5
1
10
100
aug-87 jan-93 jul-98 jan-04 jul-09 dec-14
time
Nu
mb
er
of
even
ts
>=1,5
>=2,0
>=2,5
Figure 4: Number of earthquakes larger than a particular threshold magnitude plotted against time of
occurrence. Left figure represents the seismicity at the area around the town of Middelstum, the right
figure represents the seismicity in the south-west of the field. The number of earthquakes in both areas is
increasing with time as is the frequency of occurrence.
Figure 5 provides the comparison of the annual production with the annual number of
earthquakes for the two areas separately.
-10
0
10
20
30
40
50
60
70
1985 1990 1995 2000 2005 2010 2015
time
an
nu
al p
rod
ucti
on
(b
cm
) /
an
nu
al n
um
ber
of
even
ts M
>=
1.5
SW
Centraal
annual production
Figure 5: Both the annual production and the annual number of earthquakes with a magnitude of 1.5 or
larger are shown against time.
For both spatial areas the statistical significance of the increase in number of earthquakes of
magnitudes ≥ 1.5 was examined. The results are given in Table 2. For both spatial areas the
conclusion holds that at the 99% confidence level the increase in the number of earthquakes
is statistically significant.
Table 2: Confidence intervals derived for the number of earthquakes of magnitudes ≥ 1.5 in both spatial
areas for the periods 1996-2002 and 2006-2012.
1996-2002 2006-2012
region number of
earthquakes
Confidence
interval
number of
earthquakes
Confidence
interval
Central 28 16.2-44.7 91 68.3-118.6
SW 4 0.7-12.6 26 14.6-42.3
Confidential Final Report, dd. 16-01-2013
14
Seismicity and magnitudes for Groningen
The Gutenberg-Richter law
The Gutenberg-Richter law(GR) is an empirical relation between the magnitude M of some
seismic event, and N(M), the number of earthquakes with magnitudes higher than M. In 1944,
Beno Gutenberg and Charles Francis Richter [10,11] proposed the following linear
relationship:
log10 N(M) = -b M + a (1)
where N(M) is the number of earthquakes having a magnitude ≥ M, and a and b are constants
for a fixed data set. The constant, b, describes how the number of earthquakes in the zone
varies for different magnitudes (it is the negative of the slope of the GR relationship). Instead
of using the number of earthquakes it is common practice to use the frequency of occurrence,
also named Frequency-Magnitude Relation (FMR). The relation (1) stills holds, however
N(M) is now the number of earthquakes which occur in a given area and time period, with a
magnitude ≥ M. The constant a is subsequently a measure of the level of seismicity, while
the constant b remains the same for both relations.
The GR and FMR relations are consistent with earthquake sources having a constant stress
drop and thus being self-similar. There is a tendency for the slope of the FMR and GR to
decrease for smaller magnitude earthquakes. This effect is described as "roll-off" of the FMR
and GR. It was assumed that many low-magnitude earthquakes are missed because fewer
stations detect and record them [12] . However, some modern models of earthquake
dynamics have roll-off as a natural consequence of the model without the need for the feature
to be inserted arbitrarily [14,15]. In addition, if a system is finite in size this may impose a
maximum possible magnitude. If such a maximum possible magnitude exists, the self-
similarity will also break-down for the larger magnitude earthquakes. In order to account for
both these phenomena, a modification of the GR was derived, which accounts for both a
minimum (Mmin) and maximum (Mmax) magnitude.
The modified GR is often called the Bounded Gutenberg-Richter relationship (BGR) [16]:
e-β(M-Mmin)
-e-β(Mmax-Mmin)
N(M)=eα-βMmin _____________________________
(2)
1- e-β(Mmax-Mmin)
where α = aln (10 ) and β = bln (10 ). As for the GR, the BGR is valid for both the number
of earthquakes with magnitudes equal to or higher than M, as for the frequency of
earthquakes which occur in a given area and time period, with a magnitude ≥ M.
The main assumption in the derivation of the above relations is a constant level of seismicity
through time. If the level of seismicity would change over time, the a-value would no longer
be a constant but a function of time. The FMR is sensitive to non-stationarity since
frequencies computed over a long time period during which the level of seismicity changes
will deviate significantly from frequencies during smaller time periods. For instance, if
seismicity rates are decreasing during a 10 year-period, the frequency in the first few years
will be significantly higher than for the last few years, whereas the FMR for the complete
period will give the average frequency. This will cause a deviation in the a-value. The GR
and BGR can be normalised by the total number of earthquakes in the given area during any
time period:
Confidential Final Report, dd. 16-01-2013
15
N(M)=Ntot 10-bM
(3)
where Ntot=10a, the total number of earthquakes. The normalisation removes the time
dependent information and different GR curves and their b-values can be more easily
compared. For a given b-value the probability for the occurrence of an earthquake with a
particular magnitude will depend only on the total number of earthquakes in a period.
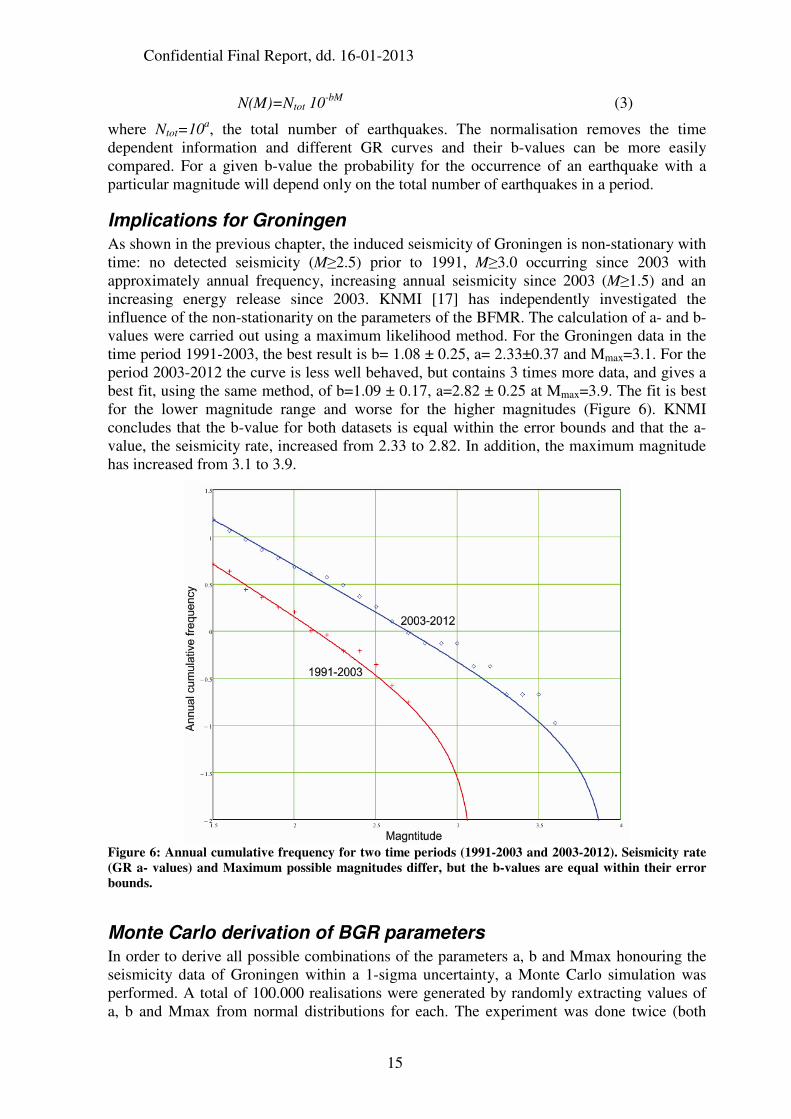
Implications for Groningen
As shown in the previous chapter, the induced seismicity of Groningen is non-stationary with
time: no detected seismicity (M≥2.5) prior to 1991, M≥3.0 occurring since 2003 with
approximately annual frequency, increasing annual seismicity since 2003 (M≥1.5) and an
increasing energy release since 2003. KNMI [17] has independently investigated the
influence of the non-stationarity on the parameters of the BFMR. The calculation of a- and b-
values were carried out using a maximum likelihood method. For the Groningen data in the
time period 1991-2003, the best result is b= 1.08 ± 0.25, a= 2.33±0.37 and Mmax=3.1. For the
period 2003-2012 the curve is less well behaved, but contains 3 times more data, and gives a
best fit, using the same method, of b=1.09 ± 0.17, a=2.82 ± 0.25 at Mmax=3.9. The fit is best
for the lower magnitude range and worse for the higher magnitudes (Figure 6). KNMI
concludes that the b-value for both datasets is equal within the error bounds and that the a-
value, the seismicity rate, increased from 2.33 to 2.82. In addition, the maximum magnitude
has increased from 3.1 to 3.9.
Figure 6: Annual cumulative frequency for two time periods (1991-2003 and 2003-2012). Seismicity rate
(GR a- values) and Maximum possible magnitudes differ, but the b-values are equal within their error
bounds.
Monte Carlo derivation of BGR parameters
In order to derive all possible combinations of the parameters a, b and Mmax honouring the
seismicity data of Groningen within a 1-sigma uncertainty, a Monte Carlo simulation was
performed. A total of 100.000 realisations were generated by randomly extracting values of
a, b and Mmax from normal distributions for each. The experiment was done twice (both
Confidential Final Report, dd. 16-01-2013
16
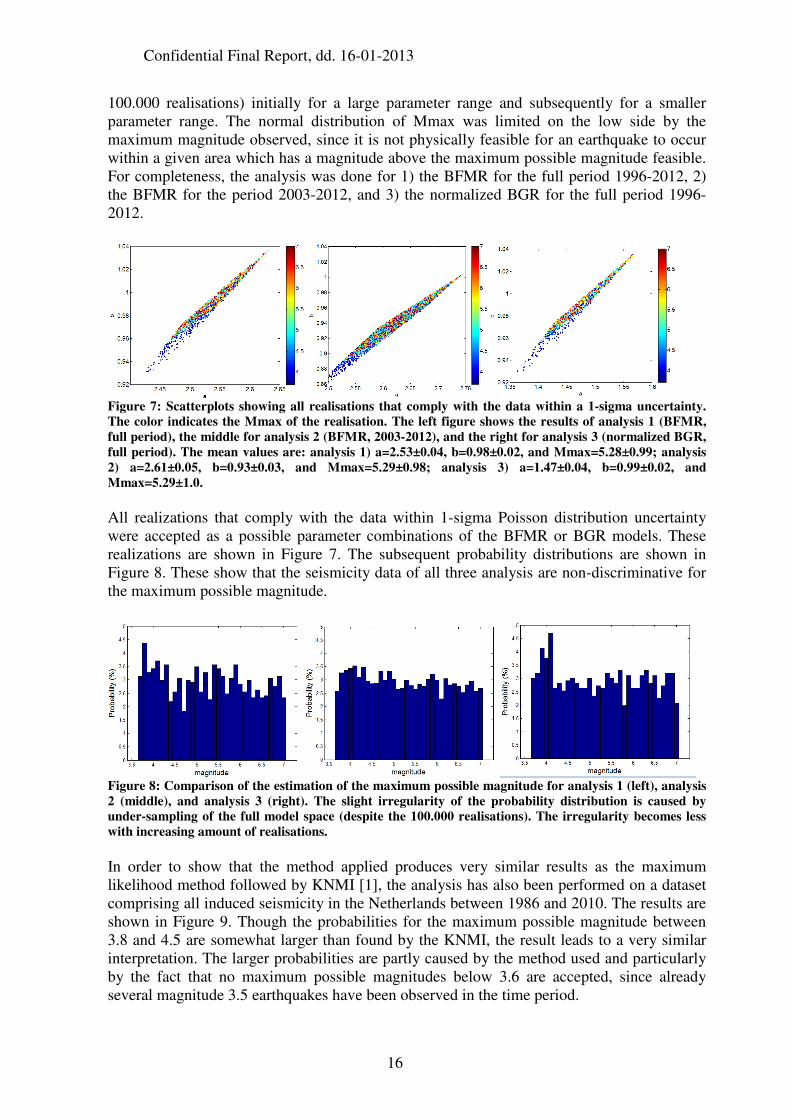
100.000 realisations) initially for a large parameter range and subsequently for a smaller
parameter range. The normal distribution of Mmax was limited on the low side by the
maximum magnitude observed, since it is not physically feasible for an earthquake to occur
within a given area which has a magnitude above the maximum possible magnitude feasible.
For completeness, the analysis was done for 1) the BFMR for the full period 1996-2012, 2)
the BFMR for the period 2003-2012, and 3) the normalized BGR for the full period 1996-
2012.
Figure 7: Scatterplots showing all realisations that comply with the data within a 1-sigma uncertainty.
The color indicates the Mmax of the realisation. The left figure shows the results of analysis 1 (BFMR,
full period), the middle for analysis 2 (BFMR, 2003-2012), and the right for analysis 3 (normalized BGR,
full period). The mean values are: analysis 1) a=2.53±0.04, b=0.98±0.02, and Mmax=5.28±0.99; analysis
2) a=2.61±0.05, b=0.93±0.03, and Mmax=5.29±0.98; analysis 3) a=1.47±0.04, b=0.99±0.02, and
Mmax=5.29±1.0.
All realizations that comply with the data within 1-sigma Poisson distribution uncertainty
were accepted as a possible parameter combinations of the BFMR or BGR models. These
realizations are shown in Figure 7. The subsequent probability distributions are shown in
Figure 8. These show that the seismicity data of all three analysis are non-discriminative for
the maximum possible magnitude.
Figure 8: Comparison of the estimation of the maximum possible magnitude for analysis 1 (left), analysis
2 (middle), and analysis 3 (right). The slight irregularity of the probability distribution is caused by
under-sampling of the full model space (despite the 100.000 realisations). The irregularity becomes less
with increasing amount of realisations.
In order to show that the method applied produces very similar results as the maximum
likelihood method followed by KNMI [1], the analysis has also been performed on a dataset
comprising all induced seismicity in the Netherlands between 1986 and 2010. The results are
shown in Figure 9. Though the probabilities for the maximum possible magnitude between
3.8 and 4.5 are somewhat larger than found by the KNMI, the result leads to a very similar
interpretation. The larger probabilities are partly caused by the method used and particularly
by the fact that no maximum possible magnitudes below 3.6 are accepted, since already
several magnitude 3.5 earthquakes have been observed in the time period.
Confidential Final Report, dd. 16-01-2013
17
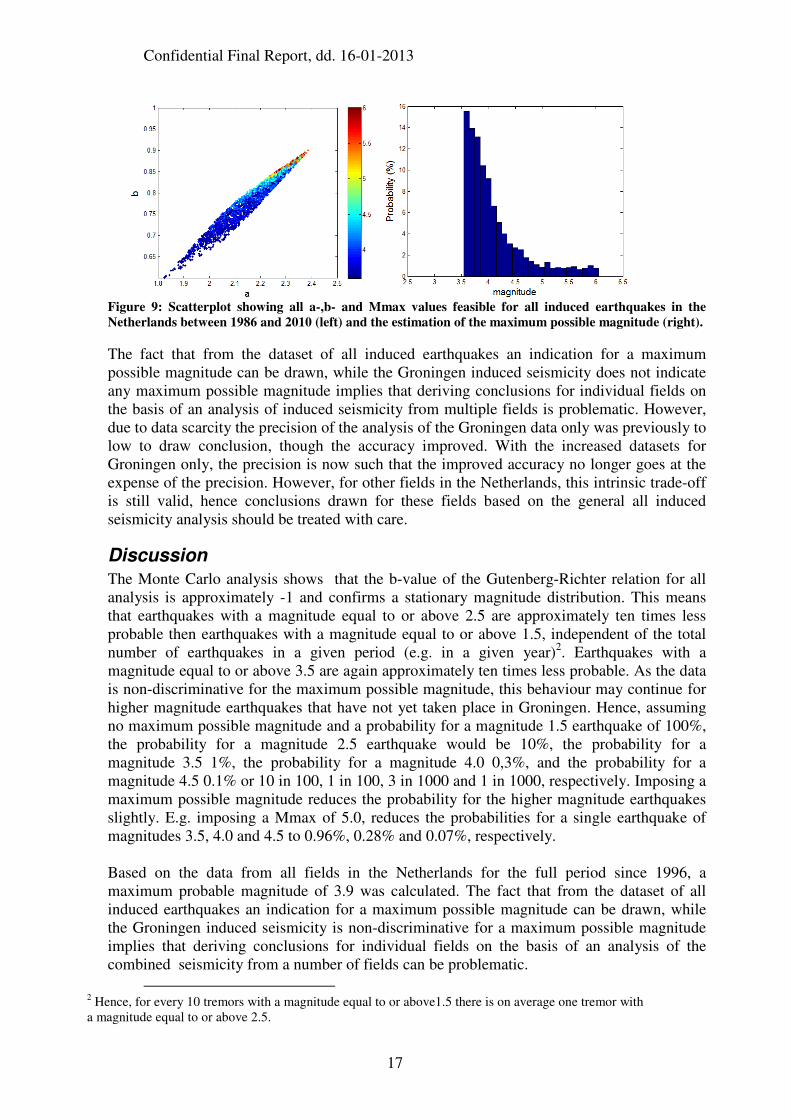
Figure 9: Scatterplot showing all a-,b- and Mmax values feasible for all induced earthquakes in the
Netherlands between 1986 and 2010 (left) and the estimation of the maximum possible magnitude (right).
The fact that from the dataset of all induced earthquakes an indication for a maximum
possible magnitude can be drawn, while the Groningen induced seismicity does not indicate
any maximum possible magnitude implies that deriving conclusions for individual fields on
the basis of an analysis of induced seismicity from multiple fields is problematic. However,
due to data scarcity the precision of the analysis of the Groningen data only was previously to
low to draw conclusion, though the accuracy improved. With the increased datasets for
Groningen only, the precision is now such that the improved accuracy no longer goes at the
expense of the precision. However, for other fields in the Netherlands, this intrinsic trade-off
is still valid, hence conclusions drawn for these fields based on the general all induced
seismicity analysis should be treated with care.
Discussion
The Monte Carlo analysis shows that the b-value of the Gutenberg-Richter relation for all
analysis is approximately -1 and confirms a stationary magnitude distribution. This means
that earthquakes with a magnitude equal to or above 2.5 are approximately ten times less
probable then earthquakes with a magnitude equal to or above 1.5, independent of the total
number of earthquakes in a given period (e.g. in a given year)2. Earthquakes with a
magnitude equal to or above 3.5 are again approximately ten times less probable. As the data
is non-discriminative for the maximum possible magnitude, this behaviour may continue for
higher magnitude earthquakes that have not yet taken place in Groningen. Hence, assuming
no maximum possible magnitude and a probability for a magnitude 1.5 earthquake of 100%,
the probability for a magnitude 2.5 earthquake would be 10%, the probability for a
magnitude 3.5 1%, the probability for a magnitude 4.0 0,3%, and the probability for a
magnitude 4.5 0.1% or 10 in 100, 1 in 100, 3 in 1000 and 1 in 1000, respectively. Imposing a
maximum possible magnitude reduces the probability for the higher magnitude earthquakes
slightly. E.g. imposing a Mmax of 5.0, reduces the probabilities for a single earthquake of
magnitudes 3.5, 4.0 and 4.5 to 0.96%, 0.28% and 0.07%, respectively.
Based on the data from all fields in the Netherlands for the full period since 1996, a
maximum probable magnitude of 3.9 was calculated. The fact that from the dataset of all
induced earthquakes an indication for a maximum possible magnitude can be drawn, while
the Groningen induced seismicity is non-discriminative for a maximum possible magnitude
implies that deriving conclusions for individual fields on the basis of an analysis of the
combined seismicity from a number of fields can be problematic.
2 Hence, for every 10 tremors with a magnitude equal to or above1.5 there is on average one tremor with
a magnitude equal to or above 2.5.
Confidential Final Report, dd. 16-01-2013
18
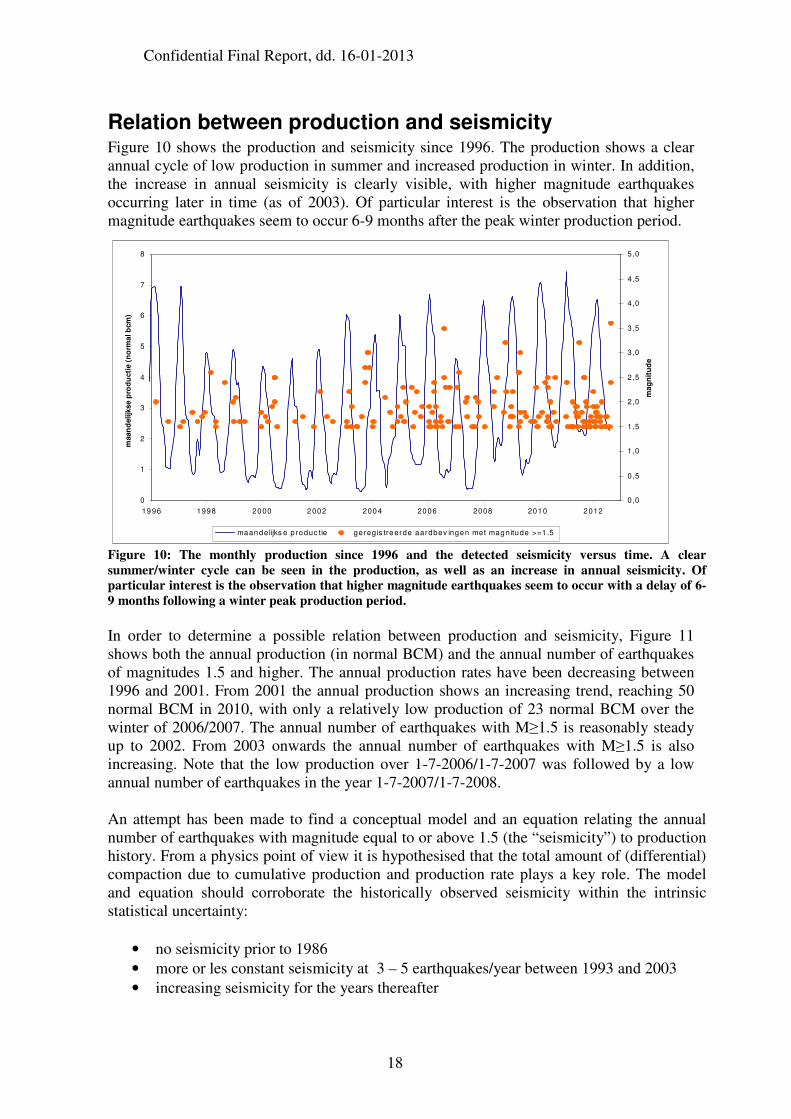
Relation between production and seismicity Figure 10 shows the production and seismicity since 1996. The production shows a clear
annual cycle of low production in summer and increased production in winter. In addition,
the increase in annual seismicity is clearly visible, with higher magnitude earthquakes
occurring later in time (as of 2003). Of particular interest is the observation that higher
magnitude earthquakes seem to occur 6-9 months after the peak winter production period.
0
1
2
3
4
5
6
7
8
1996 1998 2000 2002 2004 2006 2008 2010 2012
maan
delijk
se p
rod
ucti
e (
no
rma
l b
cm
)
0,0
0,5
1,0
1,5
2,0
2,5
3,0
3,5
4,0
4,5
5,0
ma
gn
itu
de
maandelijks e p roduc tie geregis treerde aardbev ingen met magnitude >=1 .5
Figure 10: The monthly production since 1996 and the detected seismicity versus time. A clear
summer/winter cycle can be seen in the production, as well as an increase in annual seismicity. Of
particular interest is the observation that higher magnitude earthquakes seem to occur with a delay of 6-
9 months following a winter peak production period.
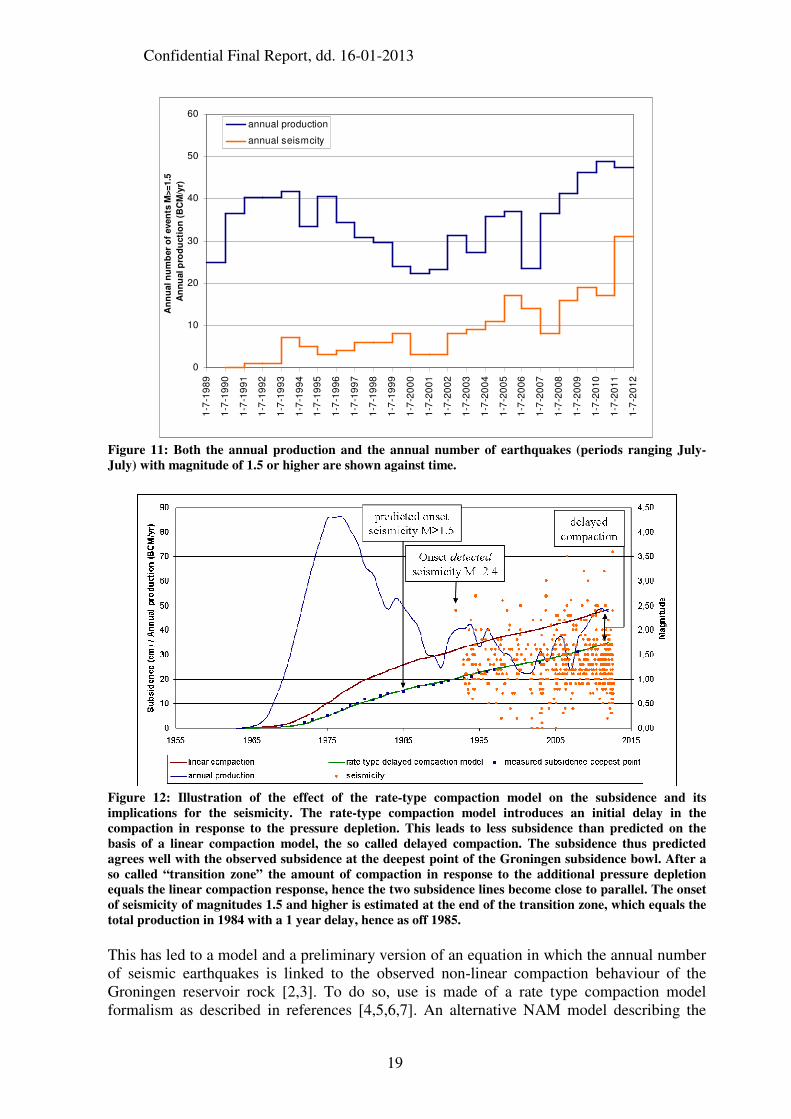
In order to determine a possible relation between production and seismicity, Figure 11
shows both the annual production (in normal BCM) and the annual number of earthquakes
of magnitudes 1.5 and higher. The annual production rates have been decreasing between
1996 and 2001. From 2001 the annual production shows an increasing trend, reaching 50
normal BCM in 2010, with only a relatively low production of 23 normal BCM over the
winter of 2006/2007. The annual number of earthquakes with M≥1.5 is reasonably steady
up to 2002. From 2003 onwards the annual number of earthquakes with M≥1.5 is also
increasing. Note that the low production over 1-7-2006/1-7-2007 was followed by a low
annual number of earthquakes in the year 1-7-2007/1-7-2008.
An attempt has been made to find a conceptual model and an equation relating the annual
number of earthquakes with magnitude equal to or above 1.5 (the “seismicity”) to production
history. From a physics point of view it is hypothesised that the total amount of (differential)
compaction due to cumulative production and production rate plays a key role. The model
and equation should corroborate the historically observed seismicity within the intrinsic
statistical uncertainty:
• no seismicity prior to 1986
• more or les constant seismicity at 3 – 5 earthquakes/year between 1993 and 2003
• increasing seismicity for the years thereafter
Confidential Final Report, dd. 16-01-2013
19
0
10
20
30
40
50
60
1-7
-19
89
1-7
-19
90
1-7
-19
91
1-7
-19
92
1-7
-19
93
1-7
-19
94
1-7
-19
95
1-7
-19
96
1-7
-19
97
1-7
-19
98
1-7
-19
99
1-7
-20
00
1-7
-20
01
1-7
-20
02
1-7
-20
03
1-7
-20
04
1-7
-20
05
1-7
-20
06
1-7
-20
07
1-7
-20
08
1-7
-20
09
1-7
-20
10
1-7
-20
11
1-7
-20
12
An
nu
al n
um
ber
of
even
ts M
>=1.5
An
nu
al p
rod
ucti
on
(B
CM
/yr)
annual production
annual seismcity
Figure 11: Both the annual production and the annual number of earthquakes (periods ranging July-
July) with magnitude of 1.5 or higher are shown against time.
Figure 12: Illustration of the effect of the rate-type compaction model on the subsidence and its
implications for the seismicity. The rate-type compaction model introduces an initial delay in the
compaction in response to the pressure depletion. This leads to less subsidence than predicted on the
basis of a linear compaction model, the so called delayed compaction. The subsidence thus predicted
agrees well with the observed subsidence at the deepest point of the Groningen subsidence bowl. After a
so called “transition zone” the amount of compaction in response to the additional pressure depletion
equals the linear compaction response, hence the two subsidence lines become close to parallel. The onset
of seismicity of magnitudes 1.5 and higher is estimated at the end of the transition zone, which equals the
total production in 1984 with a 1 year delay, hence as off 1985.
This has led to a model and a preliminary version of an equation in which the annual number
of seismic earthquakes is linked to the observed non-linear compaction behaviour of the
Groningen reservoir rock [2,3]. To do so, use is made of a rate type compaction model
formalism as described in references [4,5,6,7]. An alternative NAM model describing the
Confidential Final Report, dd. 16-01-2013
20
non-linear Groningen compaction/subsidence behaviour in terms of a characteristic response
time [3] is likely to predict similar behaviour. Increasing depletion and changes in depletion
rate (caused by changes in production rate) in both models lead to a delayed (strain) response
of the reservoir rock (Figure 12). Next the assumption is made that the seismicity is
proportional to the amount of delayed (inelastic) strain. On the basis of the rate type
compaction model formalism this then yields the following equation:
Nj (M≥1.5) = C x (Qcumj-1 - Qcumref) x [ (Qdotj-1/Qdotref)
b - 1] (4)
with
C proportionality constant (normal BCM
-1)
Nj (M≥1.5) annual number of earthquakes with M≥1.5 in year j
Qcumj-1 cumulative production in year j-1 (July to July) (normal BCM)
Qcumref cumulative production (normal BCM) at the start of seismiciteit
Qdotj-1 production rate in year j-1 (July to July) (normal BCM/year)
Qdotref production rate in (normal BCM/year) below which no earthquakes with
M≥1.5 occur b rate sensitivity constant (0.015 for Rotliegend sandstone [4])
Fitting equation (4) by adjusting Qdotref suggests that a production rate of 12 normal
BCM/year will result in 0 -1 earthquakes/year with a magnitude equal to or above magnitude
1.5. The first earthquake observed within the Groningen field was in December 1991 at a
reservoir depletion of 145 bar. The earthquake had a local magnitude of 2.4 (Figure 12). At
the time of the event, the seismic network was very sparse and its detection limit was
magnitude 2.5 and higher. At later stages during the Groningen seismicity history,
earthquakes of local magnitude 1.5 have occurred at depletions as low as approximately 122
bar (Figure 13). This threshold corresponds to the end of the transition zone predicted by the
rate-type compaction model. In addition, this depletion threshold also agrees reasonably with
the findings of [8], where a depletion threshold of 112 bar was found for all gas depletion
induced seismicity in the Netherlands. It is therefore reasonable to assume that earthquakes
with magnitudes of 1.5-2.5 have been occurring prior to the first earthquake detected and that
the depletion threshold equals this 122 bar. Hence, Qcumref for earthquakes of magnitude 1.5
or higher in the Groningen field corresponds to the cumulative production at 122 bar
depletion (~1000 BCM; Figure 12). The 1-year delay between production and seismicity was
derived from a statistical cross-correlation analysis on the data in Figure 11. The delay could
be related to the time it takes a pressure drop to travel from the production clusters to the
central area of the Groningen field where many of the earthquakes occur. The proportionality
constant C plays a similar role as the seismogenic index in [9]. For the Groningen field C
turns out to be approximately equal to one. The explanation for this is probably that Qdotref is
used to calibrate equation (4) to the observed seismicity rates. Hence, equation (4) effectively
contains only 1 free adjustable parameter for fitting to the data.
Applying equation (4) to the historical Groningen production gives calculated seismicity
rates that correspond to the observed numbers within the intrinsic statistical uncertainty as
shown in Figure 14.
Confidential Final Report, dd. 16-01-2013
21
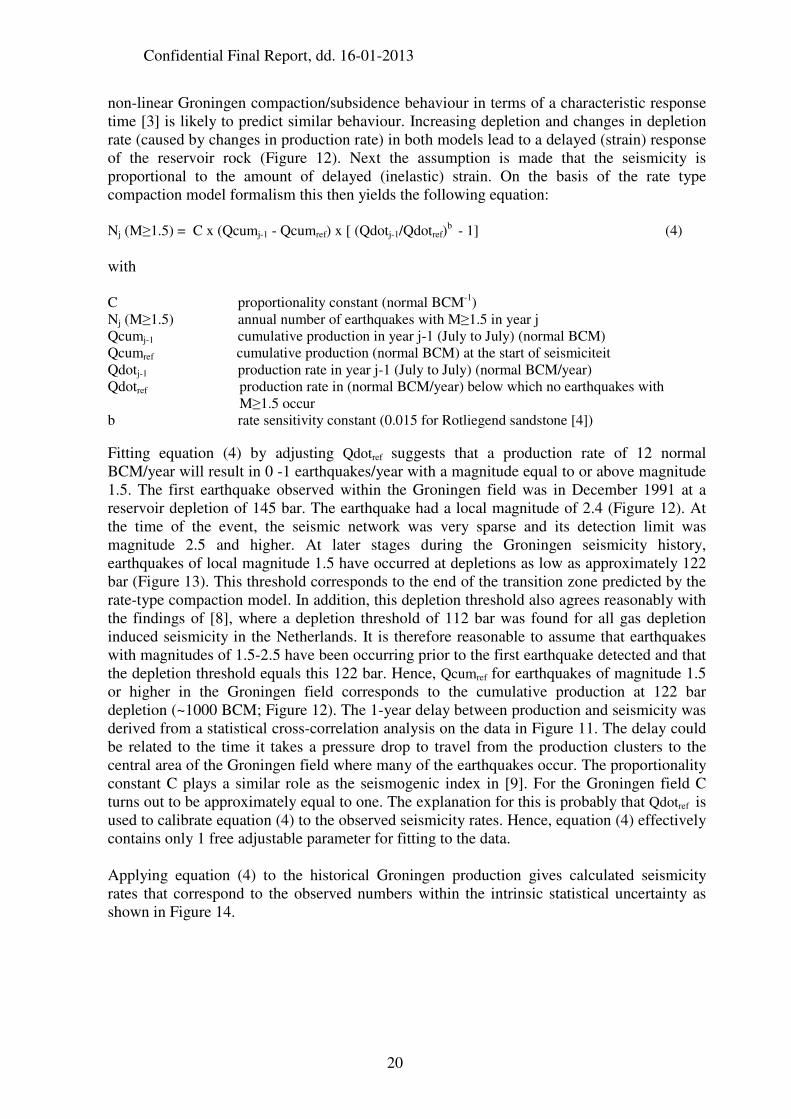
Figure 13: The earthquakes of local magnitude greater or equal to 1.5 commence to occur at effective
stresses of 422 bar corresponding to a depletion of 122 bar. This corresponds to the end of the transition
zone of the rate type compaction model.
0
5
10
15
20
25
30
35
7-5-1990 31-1-1993 28-10-1995 24-7-1998 19-4-2001 14-1-2004 10-10-2006 6-7-2009 1-4-2012 27-12-2014
Nm
> 1
,5
observed
predicted
predicted due to alreadyrealised production
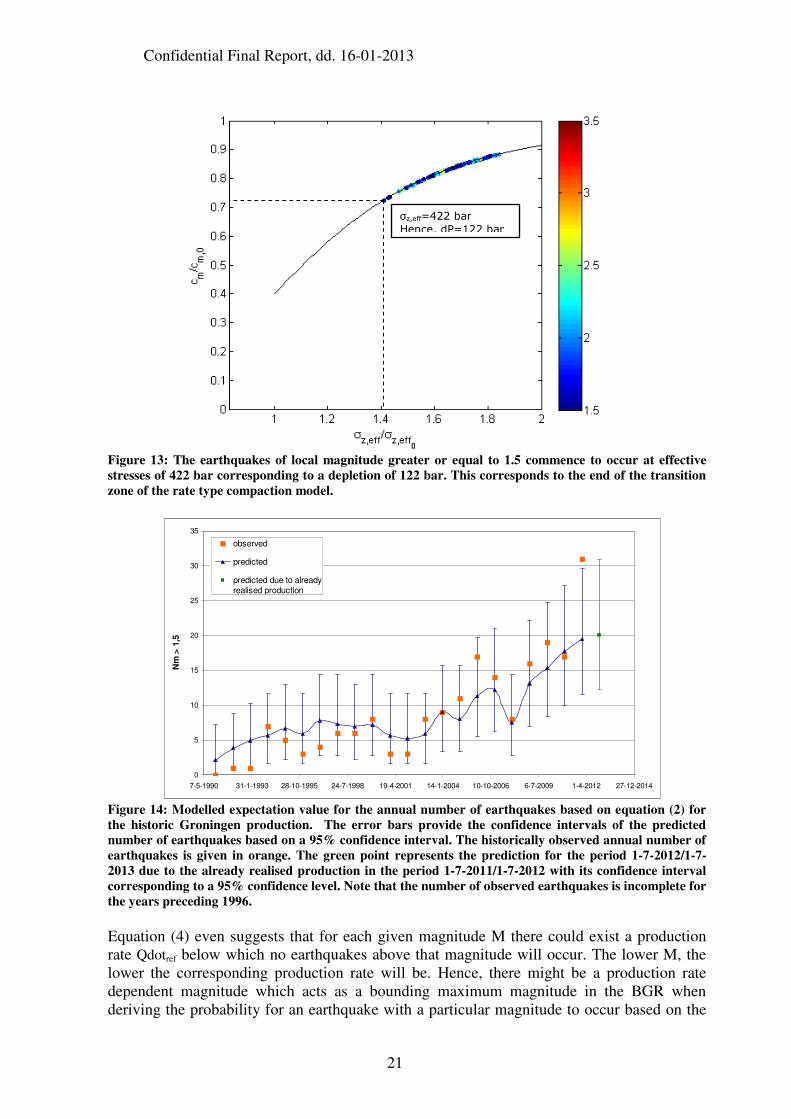
Figure 14: Modelled expectation value for the annual number of earthquakes based on equation (2) for
the historic Groningen production. The error bars provide the confidence intervals of the predicted
number of earthquakes based on a 95% confidence interval. The historically observed annual number of
earthquakes is given in orange. The green point represents the prediction for the period 1-7-2012/1-7-
2013 due to the already realised production in the period 1-7-2011/1-7-2012 with its confidence interval
corresponding to a 95% confidence level. Note that the number of observed earthquakes is incomplete for
the years preceding 1996.
Equation (4) even suggests that for each given magnitude M there could exist a production
rate Qdotref below which no earthquakes above that magnitude will occur. The lower M, the
lower the corresponding production rate will be. Hence, there might be a production rate
dependent magnitude which acts as a bounding maximum magnitude in the BGR when
deriving the probability for an earthquake with a particular magnitude to occur based on the
σz,eff=422 bar
Hence, dP=122 bar
Confidential Final Report, dd. 16-01-2013
22
computed expectation number of annual earthquakes with M≥1.5. Based on the seismicity
data, the following speculative relationship between such a bounding maximum magnitude
and the production rate is guestimated:
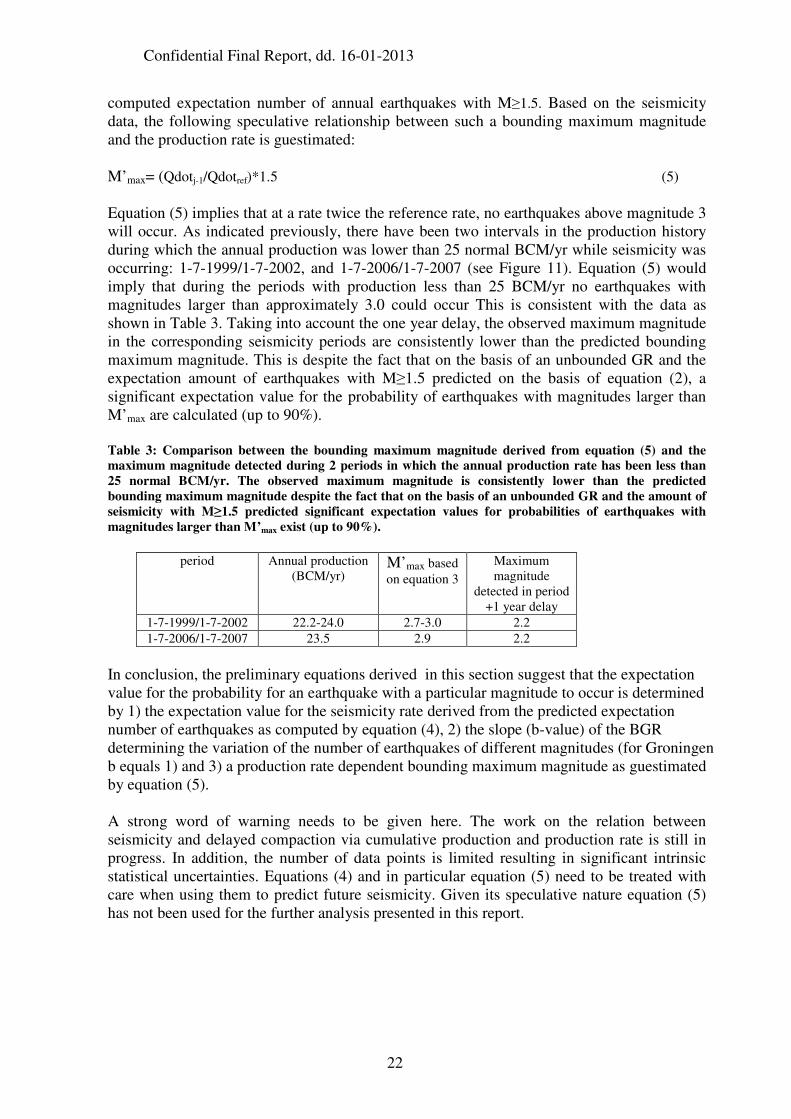
M’max= (Qdotj-1/Qdotref)*1.5 (5)
Equation (5) implies that at a rate twice the reference rate, no earthquakes above magnitude 3
will occur. As indicated previously, there have been two intervals in the production history
during which the annual production was lower than 25 normal BCM/yr while seismicity was
occurring: 1-7-1999/1-7-2002, and 1-7-2006/1-7-2007 (see Figure 11). Equation (5) would
imply that during the periods with production less than 25 BCM/yr no earthquakes with
magnitudes larger than approximately 3.0 could occur This is consistent with the data as
shown in Table 3. Taking into account the one year delay, the observed maximum magnitude
in the corresponding seismicity periods are consistently lower than the predicted bounding
maximum magnitude. This is despite the fact that on the basis of an unbounded GR and the
expectation amount of earthquakes with M≥1.5 predicted on the basis of equation (2), a
significant expectation value for the probability of earthquakes with magnitudes larger than
M’max are calculated (up to 90%).
Table 3: Comparison between the bounding maximum magnitude derived from equation (5) and the
maximum magnitude detected during 2 periods in which the annual production rate has been less than
25 normal BCM/yr. The observed maximum magnitude is consistently lower than the predicted
bounding maximum magnitude despite the fact that on the basis of an unbounded GR and the amount of
seismicity with M≥1.5 predicted significant expectation values for probabilities of earthquakes with
magnitudes larger than M’max exist (up to 90%).
period Annual production
(BCM/yr) M’max based
on equation 3
Maximum
magnitude
detected in period
+1 year delay
1-7-1999/1-7-2002 22.2-24.0 2.7-3.0 2.2
1-7-2006/1-7-2007 23.5 2.9 2.2
In conclusion, the preliminary equations derived in this section suggest that the expectation
value for the probability for an earthquake with a particular magnitude to occur is determined
by 1) the expectation value for the seismicity rate derived from the predicted expectation
number of earthquakes as computed by equation (4), 2) the slope (b-value) of the BGR
determining the variation of the number of earthquakes of different magnitudes (for Groningen
b equals 1) and 3) a production rate dependent bounding maximum magnitude as guestimated
by equation (5).
A strong word of warning needs to be given here. The work on the relation between
seismicity and delayed compaction via cumulative production and production rate is still in
progress. In addition, the number of data points is limited resulting in significant intrinsic
statistical uncertainties. Equations (4) and in particular equation (5) need to be treated with
care when using them to predict future seismicity. Given its speculative nature equation (5)
has not been used for the further analysis presented in this report.
Confidential Final Report, dd. 16-01-2013
23
Consequences for future earthquakes in Groningen The expectation probability for an earthquake of a particular magnitude to occur e.g. in the
next year depends on the derived b-value of the BGR relation, the assumed value for the
maximum possible magnitude and the expectation value of next year’s number of
earthquakes with magnitude 1.5 or higher. Predictions for the expectation value of the
number of earthquakes of M≥1.5 are derived from equation (4). The assumption is that future
seismicity follows a BGR, also for higher magnitudes but with an as yet unknown value of
Mmax. Given the recent production rates and the production level expected for the coming
years, equation (5) is not relevant in this analysis (a production rate of 50 normal BCM per
year would lead to a M’max of 6.3).
In a previous section, it was demonstrated that no maximum possible magnitude can be
derived on the basis of the Groningen seismicity data. This does not imply that such a
maximum value does not exist. In fact, it is highly likely that there is such a maximum,
despite the fact that it cannot be derived from the Groningen earthquake data. Perhaps that
non-seismic methods can be applied to obtain estimates for the maximum possible
magnitude. This could include estimates based on the maximum percentage of the stored
elastic energy that can be released in a single earthquake. Or an upper limit based on an
analysis of the distribution and size of faults present in the field. At the moment such results
are not available for Groningen. According to KNMI [17], a recent analysis of all known gas
production induced earthquakes globally, shows that no induced seismic earthquakes of
magnitudes larger than 5.0 have been reported so far. Based on the b value of 1 derived from
the Groningen dataset, the expectation value for the probability of earthquakes at such a
magnitude level in Groningen is low. This is because the expectation value of the total
number of earthquakes with M≥1.5 expected to occur during the total Groningen field life is
estimated to be well below a thousand.
Expectation probability for larger magnitude earthquakes due to already realised production
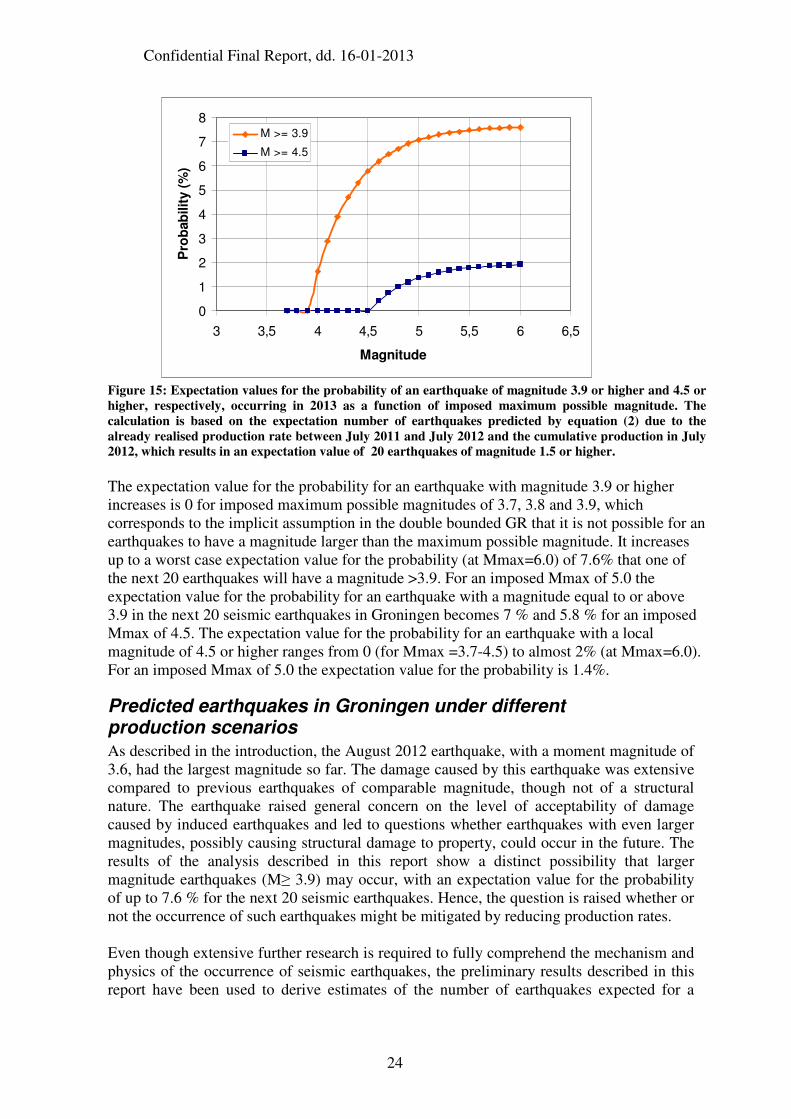
Figure 15 shows the relation between the expectation value for the probability and maximum
possible magnitude for an earthquake of magnitude of 3.9 or higher and 4.5 or higher,
respectively. The calculation is based on the expectation value for the number of earthquakes
as predicted by equation (4) due to the already realised production rate between July 2011
and July 2012 and the cumulative production in July 2012, which is 20 earthquakes of
magnitude 1.5 or higher (green dot in Figure 14).
Confidential Final Report, dd. 16-01-2013
24
0
1
2
3
4
5
6
7
8
3 3,5 4 4,5 5 5,5 6 6,5
Magnitude
Pro
bab
ilit
y (
%)
M >= 3.9
M >= 4.5
Figure 15: Expectation values for the probability of an earthquake of magnitude 3.9 or higher and 4.5 or
higher, respectively, occurring in 2013 as a function of imposed maximum possible magnitude. The
calculation is based on the expectation number of earthquakes predicted by equation (2) due to the
already realised production rate between July 2011 and July 2012 and the cumulative production in July
2012, which results in an expectation value of 20 earthquakes of magnitude 1.5 or higher.
The expectation value for the probability for an earthquake with magnitude 3.9 or higher
increases is 0 for imposed maximum possible magnitudes of 3.7, 3.8 and 3.9, which
corresponds to the implicit assumption in the double bounded GR that it is not possible for an
earthquakes to have a magnitude larger than the maximum possible magnitude. It increases
up to a worst case expectation value for the probability (at Mmax=6.0) of 7.6% that one of
the next 20 earthquakes will have a magnitude >3.9. For an imposed Mmax of 5.0 the
expectation value for the probability for an earthquake with a magnitude equal to or above
3.9 in the next 20 seismic earthquakes in Groningen becomes 7 % and 5.8 % for an imposed
Mmax of 4.5. The expectation value for the probability for an earthquake with a local
magnitude of 4.5 or higher ranges from 0 (for Mmax =3.7-4.5) to almost 2% (at Mmax=6.0).
For an imposed Mmax of 5.0 the expectation value for the probability is 1.4%.
Predicted earthquakes in Groningen under different production scenarios
As described in the introduction, the August 2012 earthquake, with a moment magnitude of
3.6, had the largest magnitude so far. The damage caused by this earthquake was extensive
compared to previous earthquakes of comparable magnitude, though not of a structural
nature. The earthquake raised general concern on the level of acceptability of damage
caused by induced earthquakes and led to questions whether earthquakes with even larger
magnitudes, possibly causing structural damage to property, could occur in the future. The
results of the analysis described in this report show a distinct possibility that larger
magnitude earthquakes (M≥ 3.9) may occur, with an expectation value for the probability
of up to 7.6 % for the next 20 seismic earthquakes. Hence, the question is raised whether or
not the occurrence of such earthquakes might be mitigated by reducing production rates.
Even though extensive further research is required to fully comprehend the mechanism and
physics of the occurrence of seismic earthquakes, the preliminary results described in this
report have been used to derive estimates of the number of earthquakes expected for a
Confidential Final Report, dd. 16-01-2013
25
number of different production scenarios which may be used to justify precautionary
measures (under the precautionary principle) while further research is executed.
0
5
10
15
20
25
30
35
1-1-2004 31-12-
2004
1-1-2006 1-1-2007 2-1-2008 1-1-2009 2-1-2010 2-1-2011 3-1-2012 2-1-2013 3-1-2014 3-1-2015 4-1-2016
history predicted prediction 50 bcm
Prediction 40 bcm Prediction 30 bcm
Prediction 20 bcm Observed
Prediction 10 bcm already realised production
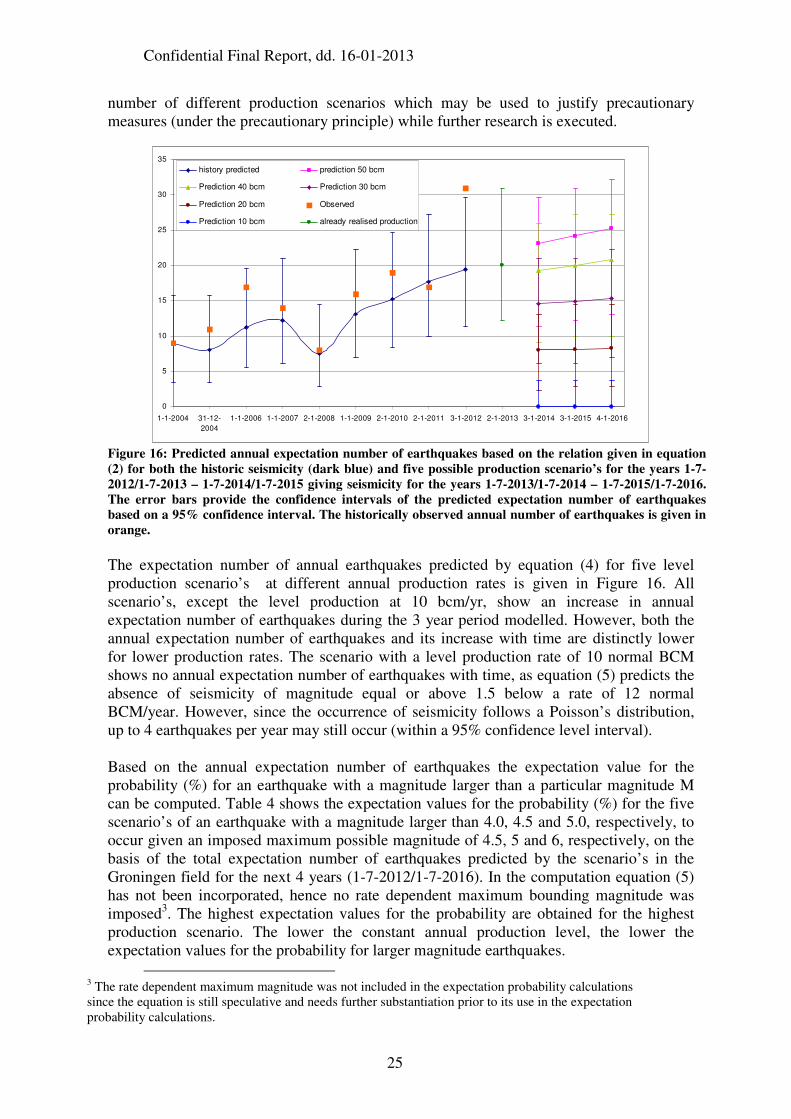
Figure 16: Predicted annual expectation number of earthquakes based on the relation given in equation
(2) for both the historic seismicity (dark blue) and five possible production scenario’s for the years 1-7-
2012/1-7-2013 – 1-7-2014/1-7-2015 giving seismicity for the years 1-7-2013/1-7-2014 – 1-7-2015/1-7-2016.
The error bars provide the confidence intervals of the predicted expectation number of earthquakes
based on a 95% confidence interval. The historically observed annual number of earthquakes is given in
orange.
The expectation number of annual earthquakes predicted by equation (4) for five level
production scenario’s at different annual production rates is given in Figure 16. All
scenario’s, except the level production at 10 bcm/yr, show an increase in annual
expectation number of earthquakes during the 3 year period modelled. However, both the
annual expectation number of earthquakes and its increase with time are distinctly lower
for lower production rates. The scenario with a level production rate of 10 normal BCM
shows no annual expectation number of earthquakes with time, as equation (5) predicts the
absence of seismicity of magnitude equal or above 1.5 below a rate of 12 normal
BCM/year. However, since the occurrence of seismicity follows a Poisson’s distribution,
up to 4 earthquakes per year may still occur (within a 95% confidence level interval).
Based on the annual expectation number of earthquakes the expectation value for the
probability (%) for an earthquake with a magnitude larger than a particular magnitude M
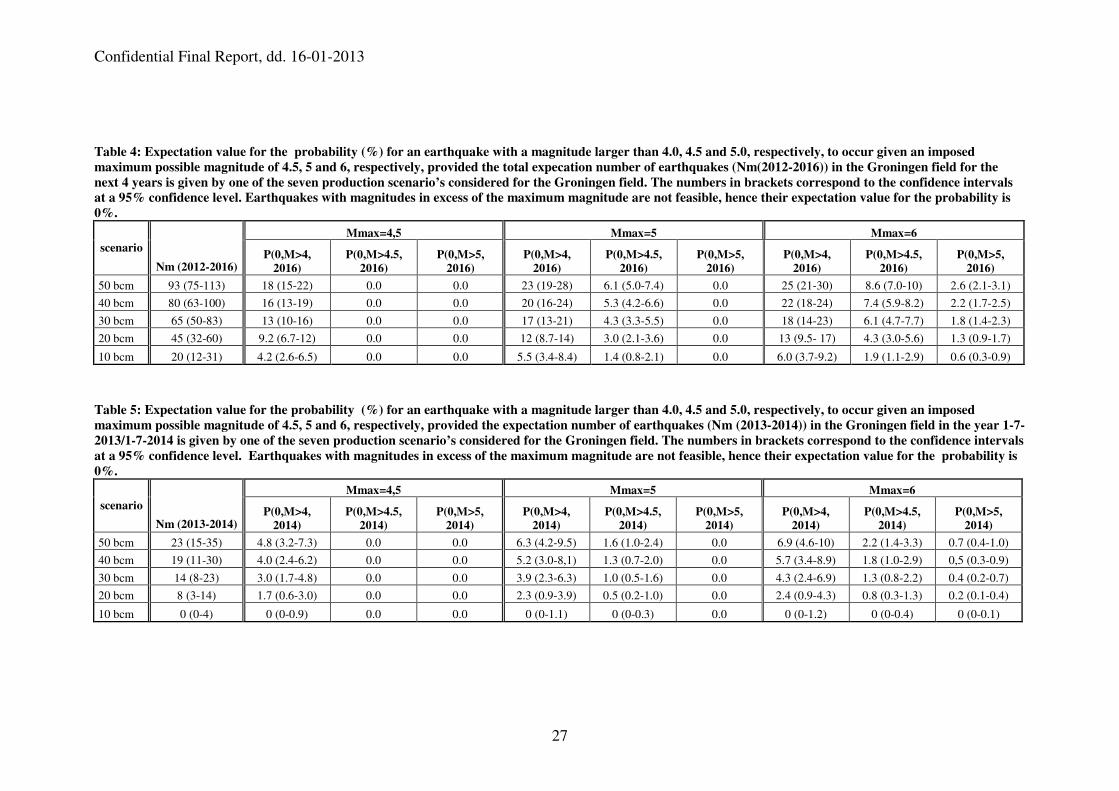
can be computed. Table 4 shows the expectation values for the probability (%) for the five
scenario’s of an earthquake with a magnitude larger than 4.0, 4.5 and 5.0, respectively, to
occur given an imposed maximum possible magnitude of 4.5, 5 and 6, respectively, on the
basis of the total expectation number of earthquakes predicted by the scenario’s in the
Groningen field for the next 4 years (1-7-2012/1-7-2016). In the computation equation (5)
has not been incorporated, hence no rate dependent maximum bounding magnitude was
imposed3. The highest expectation values for the probability are obtained for the highest
production scenario. The lower the constant annual production level, the lower the
expectation values for the probability for larger magnitude earthquakes.
3 The rate dependent maximum magnitude was not included in the expectation probability calculations
since the equation is still speculative and needs further substantiation prior to its use in the expectation
probability calculations.
Confidential Final Report, dd. 16-01-2013
26
Table 5 shows the same expectation values for the probability (%) for the year 1-7-2013/1-
7-2014. As for the total annual expectation number of earthquakes, the expectation value
for the probability for a larger magnitude earthquake to occur next year decreases by a
factor of two, after the annual production rate is decreased by a factor of two for a twelve
month period including a full winter period. As in Table 4 no rate dependent maximum
bounding magnitude was applied
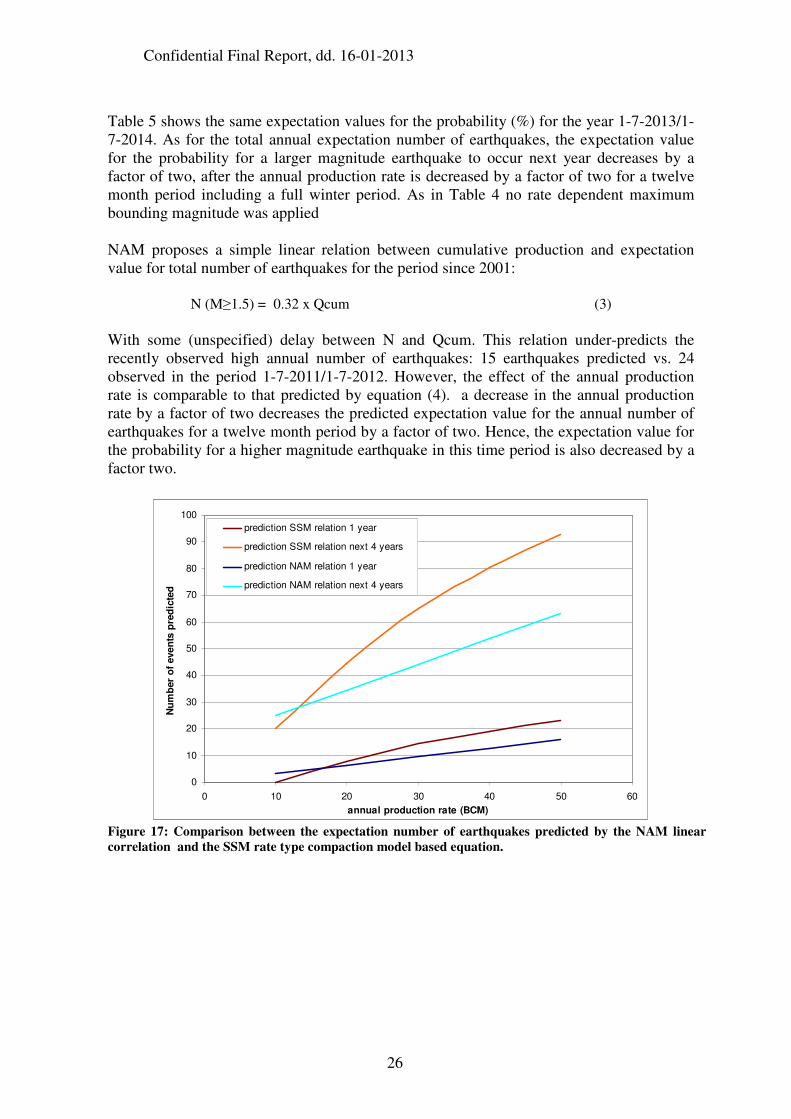
NAM proposes a simple linear relation between cumulative production and expectation
value for total number of earthquakes for the period since 2001:
N (M≥1.5) = 0.32 x Qcum (3)
With some (unspecified) delay between N and Qcum. This relation under-predicts the
recently observed high annual number of earthquakes: 15 earthquakes predicted vs. 24
observed in the period 1-7-2011/1-7-2012. However, the effect of the annual production
rate is comparable to that predicted by equation (4). a decrease in the annual production
rate by a factor of two decreases the predicted expectation value for the annual number of
earthquakes for a twelve month period by a factor of two. Hence, the expectation value for
the probability for a higher magnitude earthquake in this time period is also decreased by a
factor two.
0
10
20
30
40
50
60
70
80
90
100
0 10 20 30 40 50 60
annual production rate (BCM)
Nu
mb
er
of
even
ts p
red
icte
d
prediction SSM relation 1 year
prediction SSM relation next 4 years
prediction NAM relation 1 year
prediction NAM relation next 4 years
Figure 17: Comparison between the expectation number of earthquakes predicted by the NAM linear
correlation and the SSM rate type compaction model based equation.
Confidential Final Report, dd. 16-01-2013
27
Table 4: Expectation value for the probability (%) for an earthquake with a magnitude larger than 4.0, 4.5 and 5.0, respectively, to occur given an imposed
maximum possible magnitude of 4.5, 5 and 6, respectively, provided the total expecation number of earthquakes (Nm(2012-2016)) in the Groningen field for the
next 4 years is given by one of the seven production scenario’s considered for the Groningen field. The numbers in brackets correspond to the confidence intervals
at a 95% confidence level. Earthquakes with magnitudes in excess of the maximum magnitude are not feasible, hence their expectation value for the probability is
0%.
Mmax=4,5 Mmax=5 Mmax=6
scenario
Nm (2012-2016) P(0,M>4,
2016)
P(0,M>4.5,
2016)
P(0,M>5,
2016)
P(0,M>4,
2016)
P(0,M>4.5,
2016)
P(0,M>5,
2016)
P(0,M>4,
2016)
P(0,M>4.5,
2016)
P(0,M>5,
2016)
50 bcm 93 (75-113) 18 (15-22) 0.0 0.0 23 (19-28) 6.1 (5.0-7.4) 0.0 25 (21-30) 8.6 (7.0-10) 2.6 (2.1-3.1)
40 bcm 80 (63-100) 16 (13-19) 0.0 0.0 20 (16-24) 5.3 (4.2-6.6) 0.0 22 (18-24) 7.4 (5.9-8.2) 2.2 (1.7-2.5)
30 bcm 65 (50-83) 13 (10-16) 0.0 0.0 17 (13-21) 4.3 (3.3-5.5) 0.0 18 (14-23) 6.1 (4.7-7.7) 1.8 (1.4-2.3)
20 bcm 45 (32-60) 9.2 (6.7-12) 0.0 0.0 12 (8.7-14) 3.0 (2.1-3.6) 0.0 13 (9.5- 17) 4.3 (3.0-5.6) 1.3 (0.9-1.7)
10 bcm 20 (12-31) 4.2 (2.6-6.5) 0.0 0.0 5.5 (3.4-8.4) 1.4 (0.8-2.1) 0.0 6.0 (3.7-9.2) 1.9 (1.1-2.9) 0.6 (0.3-0.9)
Table 5: Expectation value for the probability (%) for an earthquake with a magnitude larger than 4.0, 4.5 and 5.0, respectively, to occur given an imposed
maximum possible magnitude of 4.5, 5 and 6, respectively, provided the expectation number of earthquakes (Nm (2013-2014)) in the Groningen field in the year 1-7-
2013/1-7-2014 is given by one of the seven production scenario’s considered for the Groningen field. The numbers in brackets correspond to the confidence intervals
at a 95% confidence level. Earthquakes with magnitudes in excess of the maximum magnitude are not feasible, hence their expectation value for the probability is
0%.
Mmax=4,5 Mmax=5 Mmax=6
scenario
Nm (2013-2014) P(0,M>4,
2014)
P(0,M>4.5,
2014)
P(0,M>5,
2014)
P(0,M>4,
2014)
P(0,M>4.5,
2014)
P(0,M>5,
2014)
P(0,M>4,
2014)
P(0,M>4.5,
2014)
P(0,M>5,
2014)
50 bcm 23 (15-35) 4.8 (3.2-7.3) 0.0 0.0 6.3 (4.2-9.5) 1.6 (1.0-2.4) 0.0 6.9 (4.6-10) 2.2 (1.4-3.3) 0.7 (0.4-1.0)
40 bcm 19 (11-30) 4.0 (2.4-6.2) 0.0 0.0 5.2 (3.0-8,1) 1.3 (0.7-2.0) 0.0 5.7 (3.4-8.9) 1.8 (1.0-2.9) 0,5 (0.3-0.9)
30 bcm 14 (8-23) 3.0 (1.7-4.8) 0.0 0.0 3.9 (2.3-6.3) 1.0 (0.5-1.6) 0.0 4.3 (2.4-6.9) 1.3 (0.8-2.2) 0.4 (0.2-0.7)
20 bcm 8 (3-14) 1.7 (0.6-3.0) 0.0 0.0 2.3 (0.9-3.9) 0.5 (0.2-1.0) 0.0 2.4 (0.9-4.3) 0.8 (0.3-1.3) 0.2 (0.1-0.4)
10 bcm 0 (0-4) 0 (0-0.9) 0.0 0.0 0 (0-1.1) 0 (0-0.3) 0.0 0 (0-1.2) 0 (0-0.4) 0 (0-0.1)
Confidential Final Report, dd. 16-01-2013
28
Conclusions 1. In the Groningen field the annual number of gas production induced
earthquakes and their released energy are increasing with time. For Groningen
this leads to a higher expectation value for the probability for the occurrence
of higher magnitude earthquakes.
2. A Monte Carlo analysis shows that it is not possible to determine a value for
Mmax on the basis of the Groningen seismicity data other then that its value is
above 3.6. This does not imply that an upper bound does not exist.
3. Mmax values above 3.9 cannot be excluded without additional estimates
based on non-seismic methods. These are not available for Groningen.
4. As Mmax for Groningen cannot be determined at the moment, the probability
for an earthquake with magnitude 3.9 or higher to occur during the next
twelve months is poorly defined. The worst case expectation value for the
probability imposing an Mmax of 6.0 is approximately 7.6%. For an imposed
Mmax of 5.0 this becomes 7 %, 5.8 % for an imposed Mmax of 4.5 and 0 %
for an imposed Mmax of 3.9. The expectation value for the probability for an
earthquake with magnitude 4.5 or higher during the next 12 months is
between 0 and 2%.
5. A preliminary version of an equation has been found that predicts the
expectation number of annual earthquakes with a magnitude equal to or above
1.5 - and its variation over time - in terms of cumulative production and
production rate. The equation is related to a (rate type) compaction model that
can be used to properly describe the observed non-linear compaction
behaviour of the Groningen field.
6. On this basis SSM has developed an approach that predicts the observed
seismic behaviour of the Groningen field within the intrinsic statistical
fluctuations. The b-value derived from the Gutenberg Richter relationship for
the Groningen field (b = -1) is combined with the above equation and an
assumption on the value of the maximum possible magnitude Mmax in
Groningen. The same approach can be used to calculate the expectation value
for the probability for the occurrence of an earthquake above a given
magnitude during a given time period in the future.
7. The expectation value for the probability for a larger magnitude earthquake
(M>3.9) might be decreased by approximately a factor of two, by decreasing the
annual production rate by a factor of two compared to the current production
rate of around 50 normal BCM per year, followed by a gradual decline. Even
then a significant expectation value for the probability for a larger magnitude
earthquake remains.
8. Based on the derived preliminary version of the relation between the annual
expectation number of earthquakes and the production, the production rate
would have to be lowered to values around 12 BCM/year in order to achieve
minimal risk. It is therefore possible that at this production rate almost no
earthquakes with magnitudes ≥1.5 would occur after a number of years.
Confidential Final Report, dd. 16-01-2013
29
References [1] Dost, B., Goutbeek, F., van Eck, T., Kraaijpoel, D., 2012. Monitoring induced
seismicity in the North of the Netherlands: status report 2010, KNMI scientific
report; WR 2012-03
[2] NAM, 2010. Bodemdaling door Aardgaswinning, NAM velden in Groningen,
Friesland en het noorden van Drenthe, NAM B.V. EP201006302236: 43 pp
[3] NAM, 2012, Ketelaar, V.B.H., Van der Veen, W. & Doornhof, D., 2011.
Monitoring effecten van bodemdaling op Ameland-Oost, evaluatie na 23 jaar
gaswinning. In: Publicatie Begeleidingscommissie Monitoring Bodemdaling
Ameland, oktober 2011: 9-29
[4] De Waal, J.A., 1986. On the rate type compaction behaviour of sandstone reservoir
rock. PhD dissertation, Delft University of Technology, The Netherlands: 166 pp.
[5] Bjerrum, L., 1967. Engineering geology of Norwegian normally consolidated
marine clays as related to the settlements of buildings. Geotechnique 17: 81-118
[6] Kolymbas, D., 1977. A rate-dependent constitutive equation for soils. Mechanical
Research Communications, 4: 367-372
[7] Den Haan, E.J., 1994. Vertical compression of soils. PhD dissertation, Delft
University Press: 96 pp.
[8] Van Thienen-Visser, K., Nepveu, M. en Hettelaar, J., 2012. Deterministische hazard
analyse voor geïnduceerde seismiciteit in Nederland, TNO-rapport 2012 R10198,
[9] Shapiro, A.A., 2010. Seismogenic index and magnitude probability of earthquakes
induced during reservoir fluid stimulations, The Leading Edge, 29(3):304
[10] Gutenberg, R., and C.F. Richter, 1944. Frequency of earthquakes in California,
Bulletin of the Seismological Society of America, 34, 185-188
[11] Gutenberg, B and C.F. Richter, 1954. Seismicity of the Earth and Associated
Phenomena, 2nd ed. (Princeton, N.J.: Princeton University Press, 1954).
[12] Abercrombie, R.E., and J.N. Brune, 1994. Evidence for a constant b-value above
magnitude 0 in the southern San Andreas, San Jacinto, and San Miguel fault zones
and at the Long Valley caldera, California, Geophys. Res. Lett., 21 (15), 1647-1650
[14] Bhattacharya, P., Chakrabarti, B.K., Kamal, and Samanta, D., 2009. "Fractal
models of earthquake dynamics", Heinz Georg Schuster (ed), Reviews of Nonlinear
Dynamics and Complexity, pp. 107–150 V.2, Wiley-VCH, ISBN 3-527-40850-9
[15] Pelletier, J.D., 2000. "Spring-block models of seismicity: review and analysis of a
structurally heterogeneous model coupled to the viscous asthenosphere"
Geocomplexity and the Physics of Earthquakes, American Geophysical Union,
ISBN 0-87590-978-7
[16] Kramer, S. L., 1996. Geotechnical earthquake engineering, Prentice-Hall
[17] Dost, B. en Kraaijpoel, D., 2013. The august 16, 2012 earthquake near Huizinge
(Groningen), KNMI scientific report.
[18] Presentation: “Induced Seismicity”, NAM, presented 18th
December 2012, shared 21st
December 2012.
Confidential Final Report, dd. 16-01-2013
30
Appendix A: October 8th SSM technical assement
Summary of technical assessment as presented by SSM on the 8th of October to KNMI, TNO-
AGE and the NAM
SSM observations:
1. Gas production induced tremors in the Groningen field have been observed since the early
nineties. Since 1996 completeness of the recording network has been achieved for
magnitudes above 1.5 (be it with limited redundancy).
2. No tremors have been observed in the Groningen gas field prior to 1991, at that time the
average reservoir pressure had dropped by some 150 bar.
3. Lower magnitude tremors (e.g. below 2.0) might well have occurred prior to 1991.
4. On the 16th of august 2012, the highest magnitude Groningen gas production induced
tremor to date took place near Huizinge. It had a moment magnitude of 3.6.
5. Pressure differences within the field were significant during the early production period,
subsequently they were strongly reduced, recently they are increasing again.
6. Pressure differences in the field are calculated using subsurface models and production
data. Experience (e.g. 4D seismic elsewhere) demonstrates that uncertainties are usually
way larger then initially considered possible (we start to believe our own models beyond
reason). In particular the effects of faults not seen on seismic, fault transmissibility,
barriers, baffles and thief zones can be large.
7. The Frequency Magnitude analysis applied by KNMI assumes an underlying stationary
process. This is usually valid for tectonically driven seismicity but questionable for gas
production induced seismicity.
8. Differential compaction over faults with unfavourable geometries is the likely engine
behind the induced seismicity in Groningen. The induced stresses build up as a result of
differential compaction and are locally (partially?) released when tremors occur.
9. As cumulative production from the Groningen field increases, the strength of the engine
behind the induced seismicity increases in strength over time until a steady state situation is
realised with more or less equal amounts of build-up and release of differential stresses.
10. It is not clear that such a pseudo steady state has been arrived at, the tremor data suggests
this in not yet the case.
11. There has been a steady non-linear increase in the annual number of tremors since 1991.
This is true for the total number of tremors and also for the different magnitude classes.
12. There has been an increase in the released seismic energy over time with a break around
2003 and possibly another break around 2012.
13. Production rates in Groningen have varied considerably over time.
14. So far these non-stationary aspects have not been taken into account in the seismic risk
analysis. This could have a significant effect and needs to be sorted out. An example of not
accounting for such effects is seen when cumulative annual frequencies are derived for two
different time windows during the Groningen field life.
15. Not accounting for non-stationary effects could explain the observed curvature at higher
magnitudes in the Frequency-Magnitude plot for the full Groningen production history. The
curvature would then not be related to a maximum possible tremor magnitude.
16. There has been a marked increase in the frequency of tremors with a magnitude above 3.0.
Before 2003 tremors of such magnitude were not observed. Since 2003 they have occurred
almost annually.
17. There are clear indications that variations in the production rate have an large influence on
the number of tremors observed in the following year. The data suggest that there is a delay
of between one and two years between a change in production rate and its impact on the
tremor frequency. In particular acceleration and deceleration seem to play a significant role.
18. Based on the data available to date it cannot be excluded that tremors with magnitudes
higher than the previously estimated maximum of 3.7/3.9 can occur in the future.
Confidential Final Report, dd. 16-01-2013
31
What needs to be solved / can possibly be solved / cannot be solved: 1. Full deterministic prediction of the induced seismicity based on modelling or monitoring is
not considered possible. Any predictions will remain of a statistical nature, at best
providing the probability/frequency of tremors of a given magnitude as a function of time.
2. It might be possible to incorporate the effects of increasing seismicity over time as
cumulative production increases. Possibly a model can be developed to calculate the impact
of production, production rate, pressure differences etc. on these probabilities. Potentially
this could include the effects on the likely maximum magnitude to be expected during the
field life and the period shortly thereafter.
3. Will the frequency of tremors continue to increase as production of the Groningen field
continues? This seems likely given the observations. It also suggests similar increases for
the different magnitude classes.
4. What is the maximum magnitude that could occur in the future? A clear answer cannot be
provided at the moment. Such a maximum could be linked to the maximum energy
available if the tremors are fully induced without impact of local tectonics. The magnitude
can also be limited by the maximum size of the largest fault present in the ensemble of
affected faults. The maximum ride slip could be different for compaction-induced tremors
compared to tectonically driven events. The tremor data cannot be used to exclude the
possibility of future tremors with magnitudes above 3.7 / 3.9.
5. Is the apparent effect of production rate changes on seismic frequencies not of a statistical
nature? If not, can it be quantified and captured in a model?
SSM proposed starting point conceptual model: Based on the data available and preliminary analysis carried out on this data SSM propose a
starting point conceptual model for the induced seismicity in Groningen. It goes as follows:
1. Differential compaction over faults with unfavourable geometries provides the engine for
the induced seismicity.
2. The (traditional) Gutenberg Richter relationship/model remains valid throughout field life
to describe the relative probability of tremors as a function of magnitude at any given
moment in time (for the relative probabilities at each particular moment in time).
Background is the fact that the number of faults and their (assumed log-normal Gaussian)
distribution does not change over the production time period. And that all faults
simultaneously feel the effects of the increasing production -> increasing pressure drop ->
increasing (differential) compaction.
3. No tremors are initially observed, simply because there is not enough differential
compaction during the early production period to generate observable events. This effect is
further enhanced by the non-linear compaction behaviour of the Groningen reservoir,
further reducing compaction during early field life (De Waal et al, 2012). Given the very
low number of low magnitude tremors at this stage (if any), the probability for higher
magnitude events at the time was virtually zero (and none were actually observed).
4. The increasing strength of the engine over time implies that faults that slip at later stages
occurs when more differential compaction has accumulated. This is enhanced by the time
dependent compaction behaviour resulting in larger amounts of (differential) compaction
per unit of production during later field life. This explains why magnitudes increase over
time. Or actually why the total number of annual tremors increases and therefore via
Gutenberg Richter also the absolute probability for higher magnitude events.
5. In that respect the observation that boundary faults have not yet generated observable
tremors could be a concern. Alternatively it could be that induced stresses from differential
compaction can relax non-seismically at boundary faults e.g. due to the presence of salt.
6. The total number of tremors in a given year (the seismicity level) varies over time. This is
firstly caused by the increasing differential compaction over unfavourable fault geometries
as cumulative production and hence compaction increase over time. Using the Gutenberg
Richter model to calculate/predict annual frequencies is not valid if not correcting for this
effect.
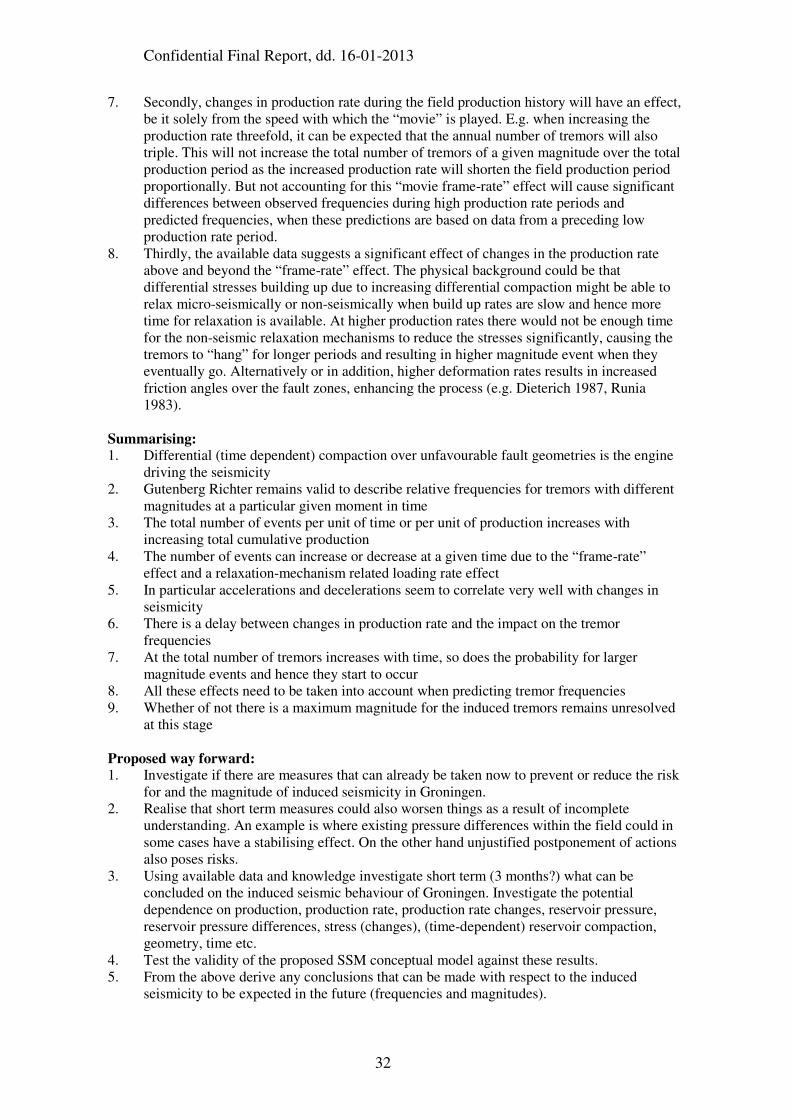
Confidential Final Report, dd. 16-01-2013
32
7. Secondly, changes in production rate during the field production history will have an effect,
be it solely from the speed with which the “movie” is played. E.g. when increasing the
production rate threefold, it can be expected that the annual number of tremors will also
triple. This will not increase the total number of tremors of a given magnitude over the total
production period as the increased production rate will shorten the field production period
proportionally. But not accounting for this “movie frame-rate” effect will cause significant
differences between observed frequencies during high production rate periods and
predicted frequencies, when these predictions are based on data from a preceding low
production rate period.
8. Thirdly, the available data suggests a significant effect of changes in the production rate
above and beyond the “frame-rate” effect. The physical background could be that
differential stresses building up due to increasing differential compaction might be able to
relax micro-seismically or non-seismically when build up rates are slow and hence more
time for relaxation is available. At higher production rates there would not be enough time
for the non-seismic relaxation mechanisms to reduce the stresses significantly, causing the
tremors to “hang” for longer periods and resulting in higher magnitude event when they
eventually go. Alternatively or in addition, higher deformation rates results in increased
friction angles over the fault zones, enhancing the process (e.g. Dieterich 1987, Runia
1983).
Summarising: 1. Differential (time dependent) compaction over unfavourable fault geometries is the engine
driving the seismicity
2. Gutenberg Richter remains valid to describe relative frequencies for tremors with different
magnitudes at a particular given moment in time
3. The total number of events per unit of time or per unit of production increases with
increasing total cumulative production
4. The number of events can increase or decrease at a given time due to the “frame-rate”
effect and a relaxation-mechanism related loading rate effect
5. In particular accelerations and decelerations seem to correlate very well with changes in
seismicity
6. There is a delay between changes in production rate and the impact on the tremor
frequencies
7. At the total number of tremors increases with time, so does the probability for larger
magnitude events and hence they start to occur
8. All these effects need to be taken into account when predicting tremor frequencies
9. Whether of not there is a maximum magnitude for the induced tremors remains unresolved
at this stage
Proposed way forward: 1. Investigate if there are measures that can already be taken now to prevent or reduce the risk
for and the magnitude of induced seismicity in Groningen.
2. Realise that short term measures could also worsen things as a result of incomplete
understanding. An example is where existing pressure differences within the field could in
some cases have a stabilising effect. On the other hand unjustified postponement of actions
also poses risks.
3. Using available data and knowledge investigate short term (3 months?) what can be
concluded on the induced seismic behaviour of Groningen. Investigate the potential
dependence on production, production rate, production rate changes, reservoir pressure,
reservoir pressure differences, stress (changes), (time-dependent) reservoir compaction,
geometry, time etc.
4. Test the validity of the proposed SSM conceptual model against these results.
5. From the above derive any conclusions that can be made with respect to the induced
seismicity to be expected in the future (frequencies and magnitudes).
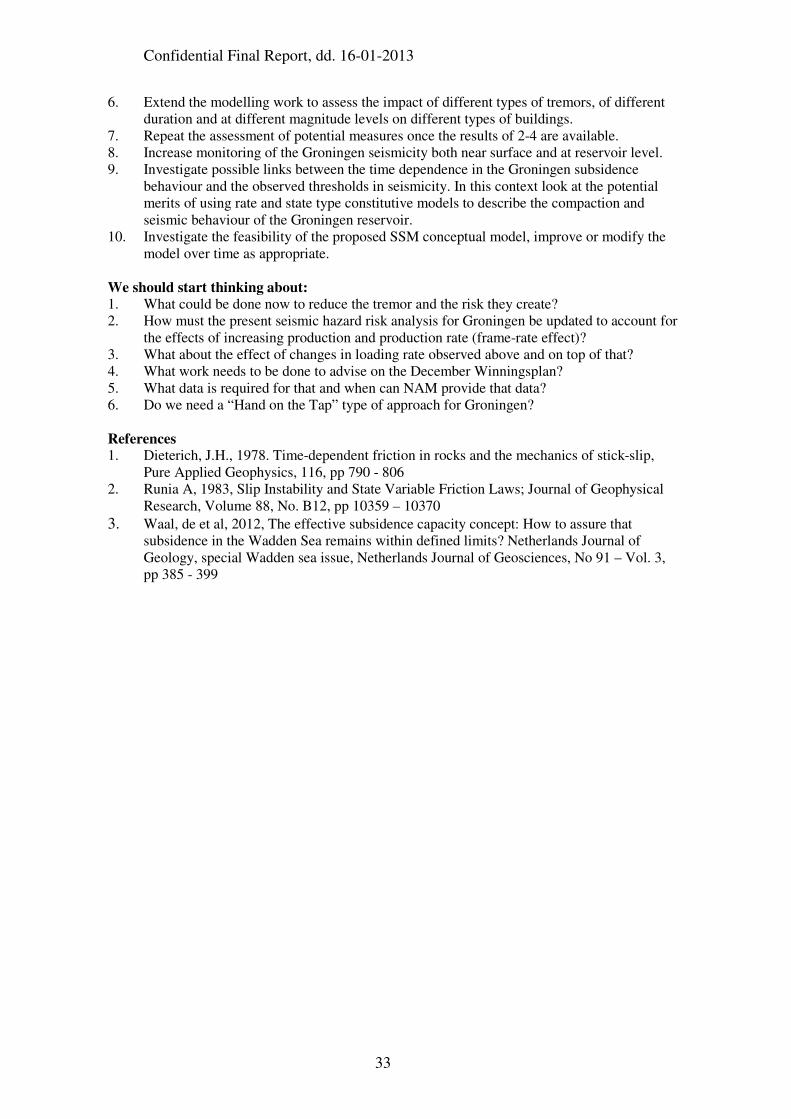
Confidential Final Report, dd. 16-01-2013
33
6. Extend the modelling work to assess the impact of different types of tremors, of different
duration and at different magnitude levels on different types of buildings.
7. Repeat the assessment of potential measures once the results of 2-4 are available.
8. Increase monitoring of the Groningen seismicity both near surface and at reservoir level.
9. Investigate possible links between the time dependence in the Groningen subsidence
behaviour and the observed thresholds in seismicity. In this context look at the potential
merits of using rate and state type constitutive models to describe the compaction and
seismic behaviour of the Groningen reservoir.
10. Investigate the feasibility of the proposed SSM conceptual model, improve or modify the
model over time as appropriate.
We should start thinking about:
1. What could be done now to reduce the tremor and the risk they create?
2. How must the present seismic hazard risk analysis for Groningen be updated to account for
the effects of increasing production and production rate (frame-rate effect)?
3. What about the effect of changes in loading rate observed above and on top of that?
4. What work needs to be done to advise on the December Winningsplan?
5. What data is required for that and when can NAM provide that data?
6. Do we need a “Hand on the Tap” type of approach for Groningen?
References 1. Dieterich, J.H., 1978. Time-dependent friction in rocks and the mechanics of stick-slip,
Pure Applied Geophysics, 116, pp 790 - 806
2. Runia A, 1983, Slip Instability and State Variable Friction Laws; Journal of Geophysical
Research, Volume 88, No. B12, pp 10359 – 10370
3. Waal, de et al, 2012, The effective subsidence capacity concept: How to assure that
subsidence in the Wadden Sea remains within defined limits? Netherlands Journal of
Geology, special Wadden sea issue, Netherlands Journal of Geosciences, No 91 – Vol. 3,
pp 385 - 399

Confidential Final Report, dd. 16-01-2013
34
Appendix B: Summary of peer review workshop outcomes A peer review workshop was held on the 8
th and 9
th of November 2012 with experts from Shell, NAM, TNO-AGE, KNMI and SSM. The objective
was to review the work presented in the first few chapters of this report. The outcome of the peer review is presented in the table below. SodM position prior to workshop Workshop outcomes SodM position after the workshop
1 Both the annual rate and the maximum magnitude of
tremors in Groningen are increasing.
No agreement could be reached. Further statistical testing was
recommended.
Both the annual rate and the maximum magnitude of tremors in Groningen are
increasing.
SodM supports statistical testing. In our opinion it is unlikely that the results
will change our position.
2 The area where most of the tremors occur is expanding
and corresponds to the area where the largest subsidence
occurs.
The area in the Groningen field where most of the seismicity
occurred corresponds to the area where the largest pressure drop
and-or pressure gradients occurred.
The area where most of the tremors occur corresponds to the area with the
largest compaction/subsidence.
The largest pressure drop corresponds in general with the largest subsidence. In
hindsight the area around the southern production clusters is a clear exception
with large pressure drops and few tremors. Also there seem to be two maximum
compaction areas, both reflected in the seismicity. Hence the move back to our
original position.
3 Seismicity in Groningen increases with increasing
cumulative production.
Most experts agree that the Groningen seismicity is not a
stationary process in time. Some feel it needs to be statistically
tested
Seismicity in Groningen increases with increasing cumulative production.
No change in position, most experts agreed.
4 The data suggests a probable relation between production
rate and seismicity (at a 20% significance level).
The data suggests a probable relation between annual production
and annual number of events (at a 14% significance level with a
0-3 year timelag-window).
The data suggests a probable relation between annual production and annual
number of events.
No change in our position as it was agreed at the workshop that there is only a
one-in-seven chance that the relationship found is coincidental. There is a 75%
chance that the timelag is one year.
5 Groningen seismicity is not a stationary process. Most experts agree that the Groningen seismicity is not a
stationary process in time. Some feel it needs to be statistically
tested.
Groningen seismicity is not a stationary process.
No change in position, most experts agreed.
6 The varying Groningen seismicity is not taken into
account in a (Gutenberg Richter) annual frequency
analysis which only applies to stationary seismicity
processes.
An analysis for the maximum probable magnitude based purely
on the Groningen seismicity data has so far not been done due to
the small number of earthquakes.
The varying Groningen seismicity cannot be taken into account in the KNMI
annual frequency-magnitude relationship which only applies for a stationary
seismicity process.
KNMI prefers to use the term “annual frequency-magnitude relationship”.
Minor changes, no analysis refuting the SodM position was presented.
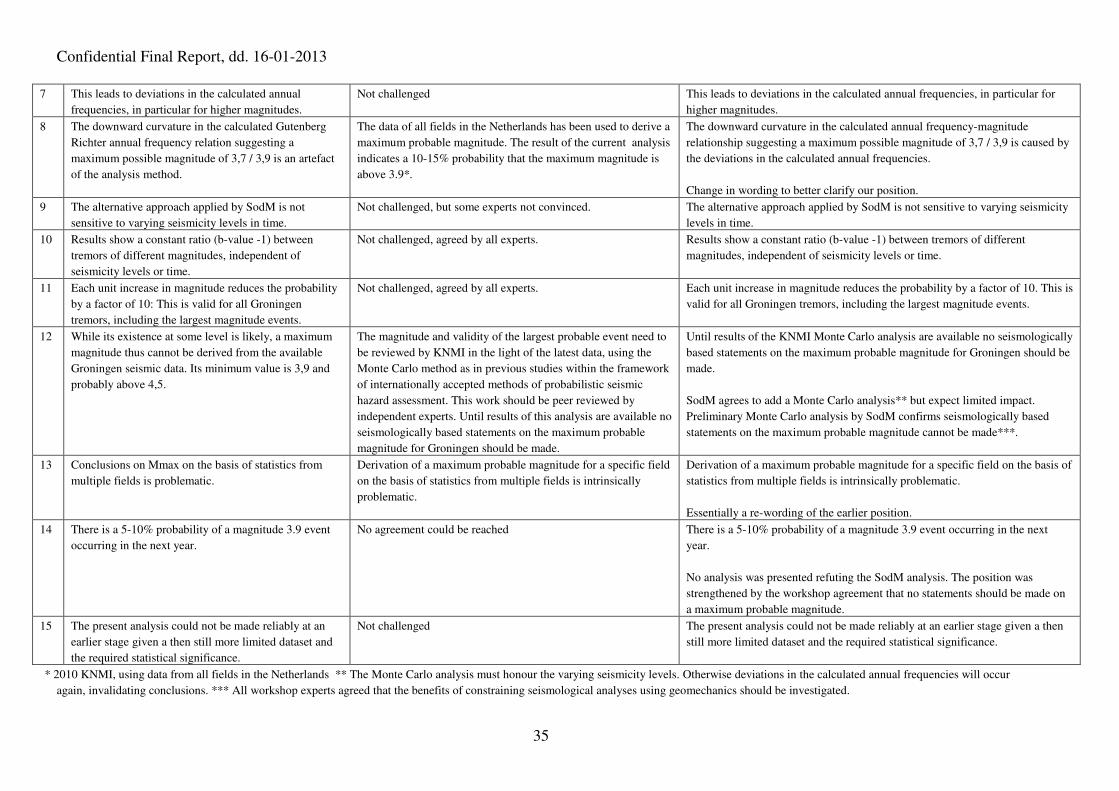
Confidential Final Report, dd. 16-01-2013
35
7 This leads to deviations in the calculated annual
frequencies, in particular for higher magnitudes.
Not challenged This leads to deviations in the calculated annual frequencies, in particular for
higher magnitudes.
8 The downward curvature in the calculated Gutenberg
Richter annual frequency relation suggesting a
maximum possible magnitude of 3,7 / 3,9 is an artefact
of the analysis method.
The data of all fields in the Netherlands has been used to derive a
maximum probable magnitude. The result of the current analysis
indicates a 10-15% probability that the maximum magnitude is
above 3.9*.
The downward curvature in the calculated annual frequency-magnitude
relationship suggesting a maximum possible magnitude of 3,7 / 3,9 is caused by
the deviations in the calculated annual frequencies.
Change in wording to better clarify our position.
9
The alternative approach applied by SodM is not
sensitive to varying seismicity levels in time.
Not challenged, but some experts not convinced. The alternative approach applied by SodM is not sensitive to varying seismicity
levels in time.
10 Results show a constant ratio (b-value -1) between
tremors of different magnitudes, independent of
seismicity levels or time.
Not challenged, agreed by all experts. Results show a constant ratio (b-value -1) between tremors of different
magnitudes, independent of seismicity levels or time.
11 Each unit increase in magnitude reduces the probability
by a factor of 10: This is valid for all Groningen
tremors, including the largest magnitude events.
Not challenged, agreed by all experts. Each unit increase in magnitude reduces the probability by a factor of 10. This is
valid for all Groningen tremors, including the largest magnitude events.
12 While its existence at some level is likely, a maximum
magnitude thus cannot be derived from the available
Groningen seismic data. Its minimum value is 3,9 and
probably above 4,5.
The magnitude and validity of the largest probable event need to
be reviewed by KNMI in the light of the latest data, using the
Monte Carlo method as in previous studies within the framework
of internationally accepted methods of probabilistic seismic
hazard assessment. This work should be peer reviewed by
independent experts. Until results of this analysis are available no
seismologically based statements on the maximum probable
magnitude for Groningen should be made.
Until results of the KNMI Monte Carlo analysis are available no seismologically
based statements on the maximum probable magnitude for Groningen should be
made.
SodM agrees to add a Monte Carlo analysis** but expect limited impact.
Preliminary Monte Carlo analysis by SodM confirms seismologically based
statements on the maximum probable magnitude cannot be made***.
13 Conclusions on Mmax on the basis of statistics from
multiple fields is problematic.
Derivation of a maximum probable magnitude for a specific field
on the basis of statistics from multiple fields is intrinsically
problematic.
Derivation of a maximum probable magnitude for a specific field on the basis of
statistics from multiple fields is intrinsically problematic.
Essentially a re-wording of the earlier position.
14 There is a 5-10% probability of a magnitude 3.9 event
occurring in the next year.
No agreement could be reached There is a 5-10% probability of a magnitude 3.9 event occurring in the next
year.
No analysis was presented refuting the SodM analysis. The position was
strengthened by the workshop agreement that no statements should be made on
a maximum probable magnitude.
15 The present analysis could not be made reliably at an
earlier stage given a then still more limited dataset and
the required statistical significance.
Not challenged The present analysis could not be made reliably at an earlier stage given a then
still more limited dataset and the required statistical significance.
* 2010 KNMI, using data from all fields in the Netherlands ** The Monte Carlo analysis must honour the varying seismicity levels. Otherwise deviations in the calculated annual frequencies will occur
again, invalidating conclusions. *** All workshop experts agreed that the benefits of constraining seismological analyses using geomechanics should be investigated.