Embed Size (px)
DESCRIPTION
2013 Texas Accountability System. Timeline:. 2013 Rating Labels:. Met Standard – met all performance index targets Met Alternative Standard – met all modified performance index targets for alternative education campuses and districts - PowerPoint PPT Presentation
Citation preview

2013 Texas Accountability
System
Timeline:
August 1, 2013
Preview Data Tables. Superintendents are given access to confidential preview accountability data tables for their district and campuses showing all accountability indicator data. Principals and superintendents can use these data tables to anticipate their campus and district accountability ratings.
August 8, 2013 Ratings Release. Data tables and ratings are publically available.
August 9 through September 9, 2013
2013 Appeals Window. Appeals may be submitted by the superintendent after receipt of the preview data tables.Districts register their district and campus appeals using the TEASE Accountability website then submit the appeal with supporting documentation via the mail.
November 2013Decisions Released and Ratings Updated. Commissioner’s decisions are mailed in the form of response letters to each appellant. Letters are posted to the TEASE site.

2013 Rating Labels:
– Met Standard – met all performance index targets
– Met Alternative Standard – met all modified performance index targets for alternative education campuses and districts
– Improvement Required – did not meet one or more performance index targets
• 2013 Transition Year: The 2013 ratings criteria and targets will stand alone because the performance index framework cannot be fully implemented in 2013.

Sample Campus Accountability Report


WHO:-All Students-All Test Versions-All Subject Areas
WHAT:Credit given for students reaching Level II (satisfactory) performance.
WHO:-10 Student Groups-STAAR Reading, Math, & Writing
WHAT:Credit based on growth expectations:
1 credit for Meeting Expectations
2 credits for Exceeding Expectations
WHO:-Only the Eco. Dis. group and the two lowest performing race/ethnicity groups from last year.-All subject areas
WHAT:Credit given for students reaching Level II (satisfactory) performance.
WHO:-10 Student Groups
WHAT:4-year or 5-year Graduation rate (whichever is higher)
AND
Percentage of Recommended and Distinguished Grad Plans
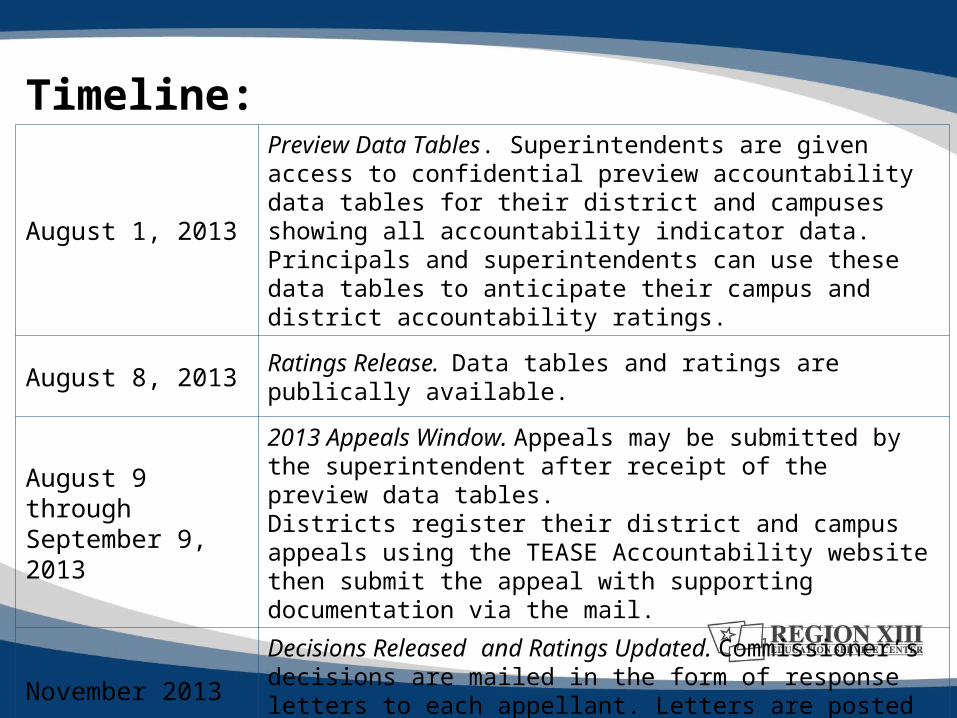
• To receive a Met Standard rating, all campuses and districts must meet the following accountability targets on all indexes for which they have performance data in 2013.
Performance Index TargetsNon-AEA
Campuses and Districts
AEA Campuses and Districts
Index 1: Student Achievement 50 25
Index 2: Student Progress 5th percentile* 5th percentile*
Index 3: Closing Performance Gaps 55 30
Index 4: Postsecondary Readiness 75 45
* Target will be set at about the fifth percentile of campus performance and will be applied to both campuses and districts.
Performance Index Criteria

• Disaggregated performance rates based on the target for student achievement in Index 1
• Participation, graduation rates, and limits on use of STAAR Alternate and STAAR Modified are calculated to meet federal requirements.
• Results reported for any cell that meets minimum size requirements
• If a campus or district does not meet the safeguard target on any measure, this must be incorporated into the Campus and/or District Improvement Plan(s) and the Texas Accountability Intervention System (TAIS).
• These missed measures will not automatically result in an unsatisfactory accountability rating
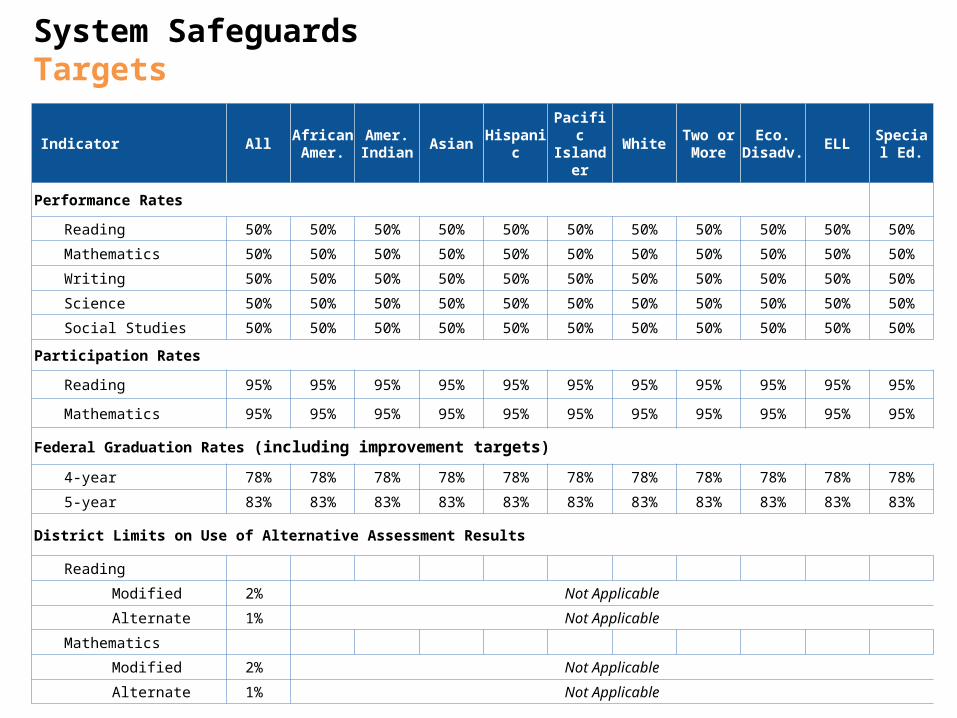
System Safeguards
Indicator All African Amer.
Amer. Indian Asian Hispanic Pacific
Islander White Two or More
Eco.Disadv. ELL Special
Ed.
Performance Rates
Reading 50% 50% 50% 50% 50% 50% 50% 50% 50% 50% 50%
Mathematics 50% 50% 50% 50% 50% 50% 50% 50% 50% 50% 50%
Writing 50% 50% 50% 50% 50% 50% 50% 50% 50% 50% 50%
Science 50% 50% 50% 50% 50% 50% 50% 50% 50% 50% 50%
Social Studies 50% 50% 50% 50% 50% 50% 50% 50% 50% 50% 50%
Participation Rates
Reading 95% 95% 95% 95% 95% 95% 95% 95% 95% 95% 95%
Mathematics 95% 95% 95% 95% 95% 95% 95% 95% 95% 95% 95%
Federal Graduation Rates (including improvement targets)
4-year 78% 78% 78% 78% 78% 78% 78% 78% 78% 78% 78%
5-year 83% 83% 83% 83% 83% 83% 83% 83% 83% 83% 83%
District Limits on Use of Alternative Assessment Results
Reading
Modified 2% Not Applicable
Alternate 1% Not Applicable
Mathematics
Modified 2% Not Applicable
Alternate 1% Not Applicable
System SafeguardsTargets


System Safeguards Sample Report
Indicator All African Amer.
Amer. Indian Asian Hispanic Pacific
Islander White Two or More
Eco.Disadv. ELL Special
Ed.Indicators
Missed
Performance Rates*
Reading 50% 100% n/a n/a 50% n/a n/a n/a 100% 36% n/a 1 of 5
Mathematics 50% 50% n/a n/a 100% n/a n/a n/a 50% 50% n/a 0 of 5
Writing 50% n/a n/a n/a 50% n/a n/a n/a 48% n/a n/a 1 of 3
Science 50% 100% n/a n/a 50% n/a n/a n/a 50% 50% n/a 0 of 5
Social Studies 50% 50% n/a n/a 50% n/a n/a n/a 100% 50% n/a 0 of 5

Distinction Designations
• Campuses must have “Met Standard” rating
• AEA campuses not eligible
• Utilization of comparison group (40)
• 2013 Designations:
– Top 25% Student Progress (Index #2)
– Academic Achievement in Reading/ELA
– Academic Achievement in Math

Data Currently Available:
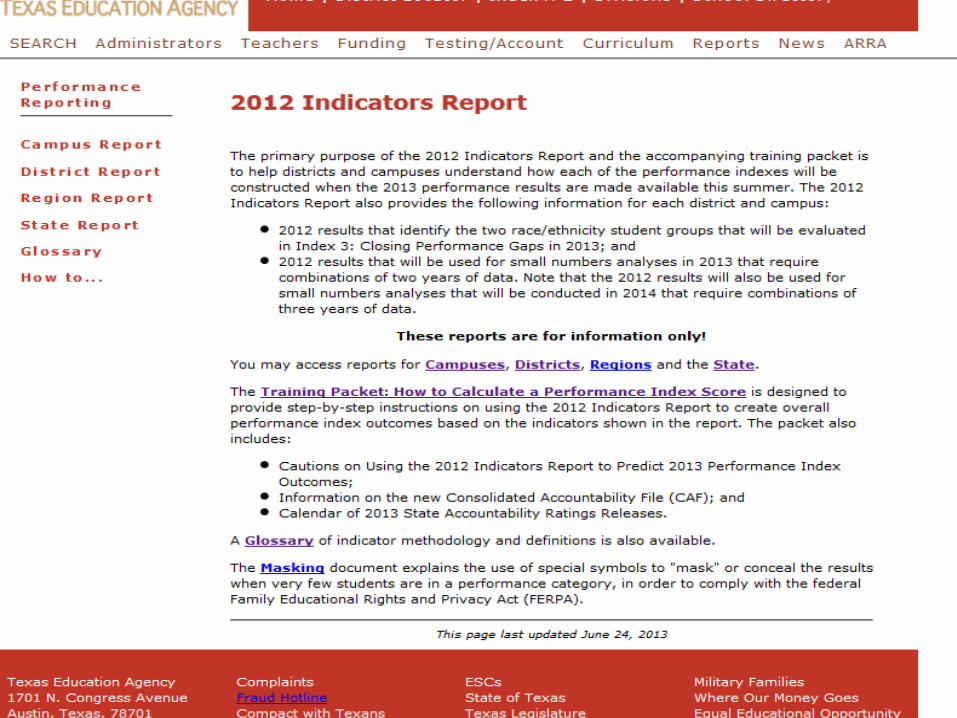
• 2012 Indicators Report – Identifies the two race/ethnicity student groups that will be
evaluated in Index 3: Closing Performance Gaps in 2013
– 2012 results that will be used for small numbers analyses in 2013
– Understand how each of the performance indexes (good practice)
– Includes Graduation and Dropout Rates for Index 4
– Currently available on TEASE


Jennifer WomackSystem Support
Region XIII512.919.5308
Jonathan Delgado System Support
Region XIII512.919.5131