Embed Size (px)
Citation preview
2013 Sustainability Report

Air Products | 2013 Sustainability Report
Forward-looking statements
This report contains “forward-looking statements” within the safe harbor pro-visions of the Private Securities Litigation Reform Act of 1995. These forward-looking statements are based on our current expectations, estimates and pro-jections about our business and industry, management’s beliefs, and certain assumptions made by us, all of which are subject to change. Forward-looking statements can often be identified by words such as “anticipates,” “expects,” “may,” “will,” “should,” “would,” “could,” “potential,” “continue,” “ongoing,” simi-lar expressions and variations or negatives of these words. Actual performance and financial results may differ materially from projections and estimates expressed in the forward-looking statements because of many factors not an-ticipated by management. Important risk factors that could contribute to such differences or otherwise affect our business, results of operations and financial condition include the risk factors discussed in our Annual Report on Form 10-K for the fiscal year ended September 30, 2013. The forward-looking statements in this report speak only as of the date of this filing. We undertake no obliga-tion to revise or update publicly any forward-looking statement, except as required by law.

3
4 Message from John McGlade
6 Our Operations, Businesses and Stakeholders
14 Our Sustainability Commitment
16 Delivering Business Value
24 Environmental Stewardship
38 Socially Responsible Business
50 Governance
63 Appendix: Detailed Reporting
70 Performance Data
72 GRI Index
Contents
29
32REACH Resiliency Education: Advocacy, Collaboration & Hope
July 2013 Summer Camp Team Building & Leadership
48
53
60
4Air Products | 2013 Sustainability Report
During the year, Air Products commissioned a study to better understand the major sustainability trends shaping our world. The implications to our business and future operations are profound.
Global issues are increasingly becoming local concerns. The world is experiencing unprecedented levels of change, driven by emerging economies, innovation and technology advances. With this growth comes challenges that can only be addressed through new collaboration models. A few of the trends are particularly relevant as context for our 2012 sustainability focus and performance:
Population and Urbanization: Emerging economies will fuel world population growth to an estimated 9 billion people by 2050. The burgeoning population will expand markets and increase demand for industrial gases. Demographics will also shift from disperse rural regions to urban megacities, requiring significant investments in infrastructure. Meanwhile, retiring populations in developed countries will lead to a “brain drain,” creating a global competition for talent.
Resource Management: There will be a significant shift in the availability of food, water and energy as demographics change. With only 0.5 percent of the earth’s water being drinkable, the availability and quality of water for industrial purposes will be limited, perhaps fundamentally altered. As a result, raw material and energy costs will increase, sparking demand for greater efficiency and innovation.
Environmental Degradation: As a global issue, addressing climate change will require international and cross-sector cooperation. We are focused on a diverse mix of solutions that can help society make substantial progress while sustaining economic growth.
Reviewing the external trends made me even more excited about the work we’re doing at Air Products. I’m proud to report that our company is well positioned to address these challenges and is already seizing the opportunities that sustainability affords.
Running through stats alone does not give you a true picture of Air Products’ sustainability story. The following pages share stories and results that demonstrate our commitment in action.
CEO Message
5
We are committed to driving real business value for our customers and investors through product innovations, efficiency and increased productivity. In 2012, more than half of our R&D spend was related to environmental and energy efficiency offerings. As you’ll see from the story of our helium recovery efforts, we are finding new ways to work closely with customers and co-create solutions to their particular sustainability challenges.
We are committed to our environmental stewardship as a global corporate citizen. We have met or are on track to meet all of our 2015 Environmental Sustainability Goals. The story highlighting our Tees Valley advanced plasma gasification facility—which will turn 350,000 tonnes of waste into enough electricity to power 50,000 homes—is just one example of our leadership.
We are committed to our social responsibility as an employer and productive community member. This year, we contributed more than $5.6 million in cash, volunteer hours and in-kind donations to not-for-profit organizations. Our leadership and investment in employee development was recognized by E-Learning naming us one of 2012’s top learning organizations. Stories such as our work with the SkillsUSA program demonstrate how our commitment to development extends beyond company walls.
And we are committed to building sustainability into the governance of our global operations. Sustainability is being integrated into the core processes we use to run our business—from forecasting and strategy setting, to product development and design, to assessing and managing our risk, to managing our supplier relations. As you’ll see from the story highlighting our partnership with Indura S.A., we made significant updates to our Code of Conduct, making it available in 21 different languages, and rolled it out to our new Indura colleagues.
These commitments come from the fact that sustainability is not just something we report on, it’s embedded in who we are. It’s inherent to our business strategy, our governance structure, our value proposition to customers, our opera-tions model, and our values as an organization.
I’m confident that you’ll share my excitement and enthusiasm for the great work that’s being done across our organiza-tion as you explore the following report. Thank you for your continued support of Air Products.
John E. McGladeChairman, President and Chief Executive Officer of Air Products

6Air Products | 2013 Sustainability Report
Citizens of the WorldOur work touches millions of lives around the world. Air Products supplies industrial and specialty gases, performance materials, equipment and technology that make customers’ products better and, in many cases, make them possible.
1. In September 2012, Air Products acquired an air separation unit (ASU) and integrated liquefier in Guiyang, China, producing approximately 2,000 tons of gaseous oxygen and nitrogen to Guizhou Kaiyang Chemical’s coal-to-ammonia facility under long-term contract.
2. In June 2012, Air Products acquired a majority stake in Indura S.A., making us the second- largest industrial gas producer in Latin America. (See story on pages 50–51)
3. In April 2012, Air Products acquired DuPont’s interest in DuPont Air Products NanoMaterials LLC, strengthening our position in the high-growth global semiconductor and wafer polishing markets.
Corporate HeadquartersAllentown, Pennsylvania
Hersham UK
Tees Valley will convert more than 350,000 tonnes of nonrecyclable waste into
50 MW of electricity. (See story on pages 24–25)
Port Arthur is the world’s largest carbon capture and storage demonstration project, increasing
oil production while capturing up to 1 million tons of CO2 every year.
(See story on page 29)
2
3
45
Netherlands
Corporate Headquarters
Regional Head Offices
Acquisitions in 2012
Countries of Operation

7
Shanghai
Hong Kong
Singapore
4. In March 2012, Air Products acquired innovative, patent-protected technology from Xebec Adsorption, Inc, which will allow for smaller- footprint plants and higher process efficiencies for customers.
5. In February 2012, Air Products acquired ROVI Cosmetics International GmbH, an established leader in the development of cosmetic actives and delivery systems for the European personal care industry.
Our Rotterdam hydrogen facility is designed to improve
the energy efficiency of ExxonMobil’s refinery by
15 percent and reduce related CO2 emissions by
200,000 tons per year.
1
8Air Products | 2013 Sustainability Report
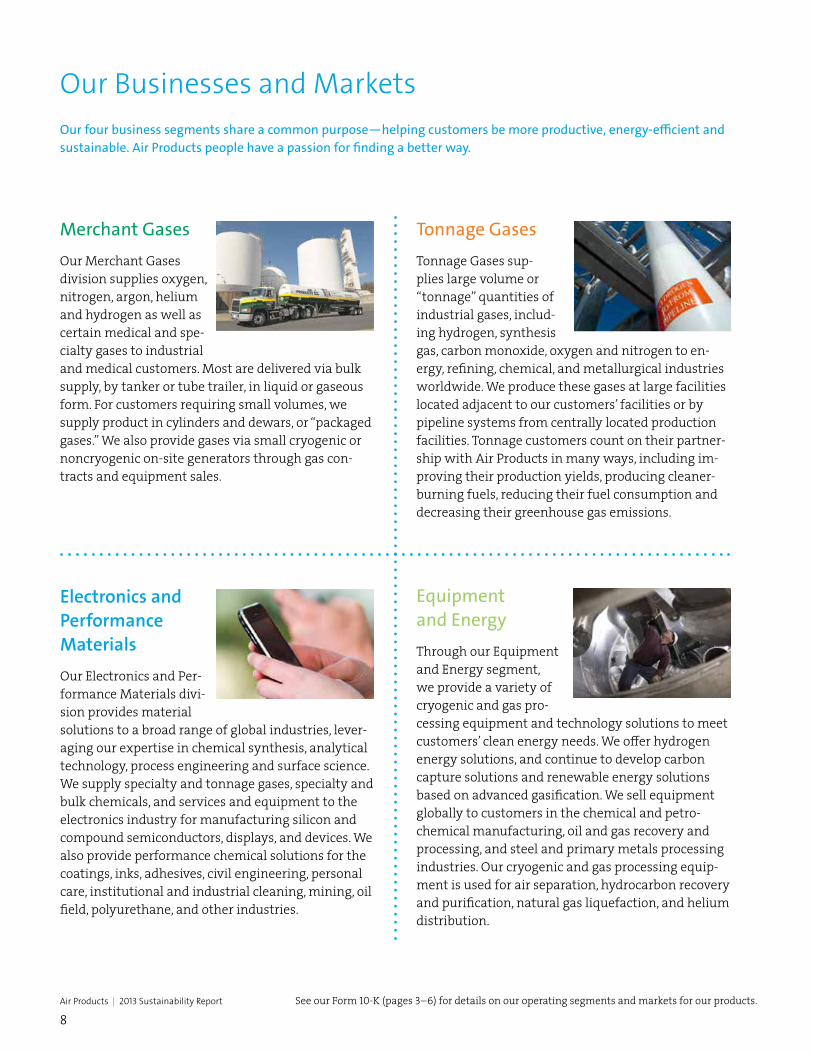
Our Businesses and MarketsOur four business segments share a common purpose—helping customers be more productive, energy-efficient and sustainable. Air Products people have a passion for finding a better way.
Merchant GasesOur Merchant Gases division supplies oxygen, nitrogen, argon, helium and hydrogen as well as certain medical and spe-cialty gases to industrial and medical customers. Most are delivered via bulk supply, by tanker or tube trailer, in liquid or gaseous form. For customers requiring small volumes, we supply product in cylinders and dewars, or “packaged gases.” We also provide gases via small cryogenic or noncryogenic on-site generators through gas con-tracts and equipment sales.
Tonnage GasesTonnage Gases sup-plies large volume or “tonnage” quantities of industrial gases, includ-ing hydrogen, synthesis gas, carbon monoxide, oxygen and nitrogen to en-ergy, refining, chemical, and metallurgical industries worldwide. We produce these gases at large facilities located adjacent to our customers’ facilities or by pipeline systems from centrally located production facilities. Tonnage customers count on their partner-ship with Air Products in many ways, including im-proving their production yields, producing cleaner- burning fuels, reducing their fuel consumption and decreasing their greenhouse gas emissions.
Electronics and Performance MaterialsOur Electronics and Per-formance Materials divi-sion provides material solutions to a broad range of global industries, lever-aging our expertise in chemical synthesis, analytical technology, process engineering and surface science. We supply specialty and tonnage gases, specialty and bulk chemicals, and services and equipment to the electronics industry for manufacturing silicon and compound semiconductors, displays, and devices. We also provide performance chemical solutions for the coatings, inks, adhesives, civil engineering, personal care, institutional and industrial cleaning, mining, oil field, polyurethane, and other industries.
Equipment and EnergyThrough our Equipment and Energy segment, we provide a variety of cryogenic and gas pro-cessing equipment and technology solutions to meet customers’ clean energy needs. We offer hydrogen energy solutions, and continue to develop carbon capture solutions and renewable energy solutions based on advanced gasification. We sell equipment globally to customers in the chemical and petro-chemical manufacturing, oil and gas recovery and processing, and steel and primary metals processing industries. Our cryogenic and gas processing equip-ment is used for air separation, hydrocarbon recovery and purification, natural gas liquefaction, and helium distribution.
See our Form 10-K (pages 3–6) for details on our operating segments and markets for our products.
9
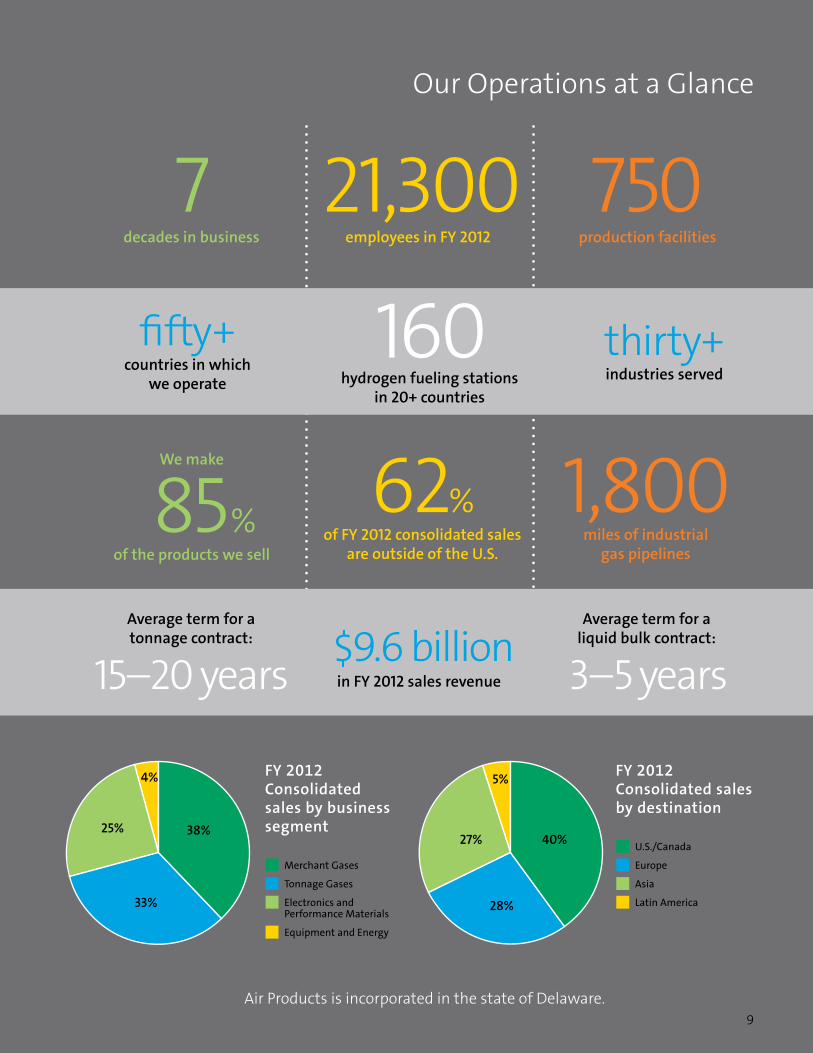
Our Operations at a Glance
FY 2012Consolidated sales by business segment
n Merchant Gases
n Tonnage Gases
n Electronics and Performance Materials
n Equipment and Energy
FY 2012Consolidated sales by destination
n U.S./Canada
n Europe
n Asia
n Latin America
decades in business
7employees in FY 2012
21,300
of the products we sell
85%
We make
of FY 2012 consolidated sales are outside of the U.S.
miles of industrial gas pipelines
1,800
Air Products is incorporated in the state of Delaware.
160hydrogen fueling stations
in 20+ countries
thirty+ industries served
fifty+ countries in which
we operate
Average term for a tonnage contract:
Average term for a liquid bulk contract:
15–20 years 3–5 yearsin FY 2012 sales revenue$9.6 billion
production facilities
750
62%
38%
33%
25%
4%
27%
28%
40%
5%
10Air Products | 2013 Sustainability Report
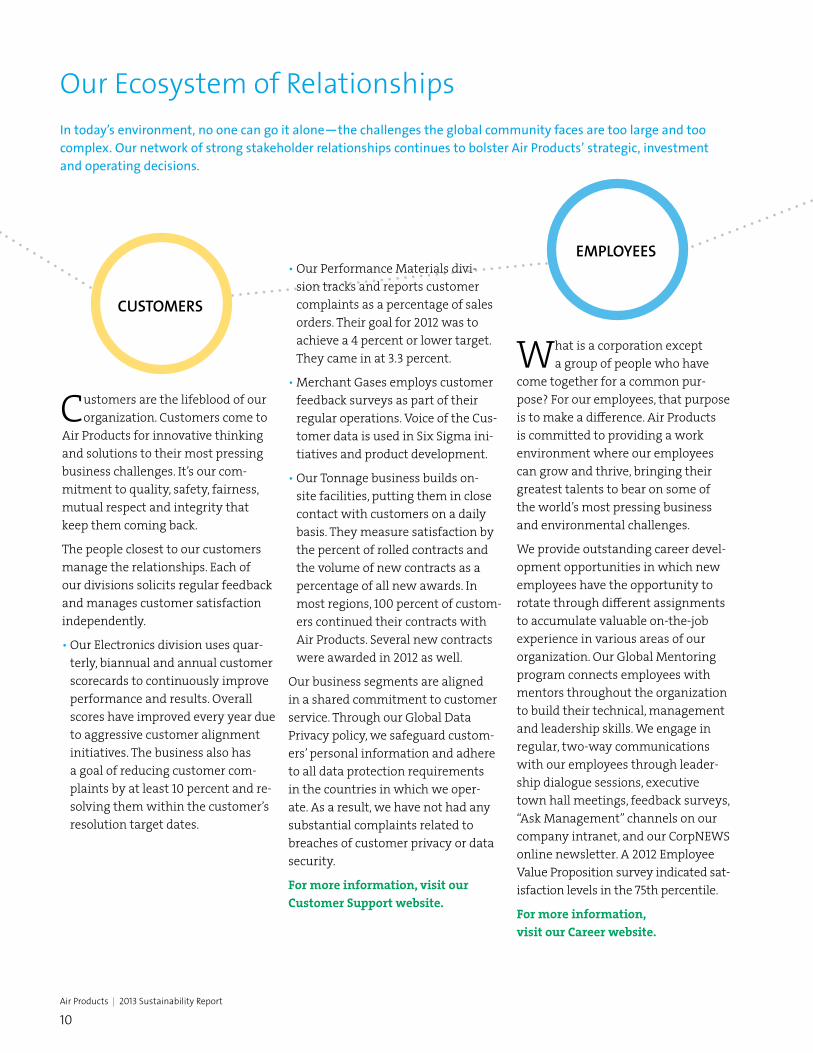
Our Ecosystem of Relationships In today’s environment, no one can go it alone—the challenges the global community faces are too large and too complex. Our network of strong stakeholder relationships continues to bolster Air Products’ strategic, investment and operating decisions.
What is a corporation except a group of people who have
come together for a common pur-pose? For our employees, that purpose is to make a difference. Air Products is committed to providing a work environment where our employees can grow and thrive, bringing their greatest talents to bear on some of the world’s most pressing business and environmental challenges.
We provide outstanding career devel-opment opportunities in which new employees have the opportunity to rotate through different assignments to accumulate valuable on-the-job experience in various areas of our organization. Our Global Mentoring program connects employees with mentors throughout the organization to build their technical, management and leadership skills. We engage in regular, two-way communications with our employees through leader-ship dialogue sessions, executive town hall meetings, feedback surveys, “Ask Management” channels on our company intranet, and our CorpNEWS online newsletter. A 2012 Employee Value Proposition survey indicated sat-isfaction levels in the 75th percentile.
For more information, visit our Career website.
Customers are the lifeblood of our organization. Customers come to
Air Products for innovative thinking and solutions to their most pressing business challenges. It’s our com-mitment to quality, safety, fairness, mutual respect and integrity that keep them coming back.
The people closest to our customers manage the relationships. Each of our divisions solicits regular feedback and manages customer satisfaction independently.
• Our Electronics division uses quar-terly, biannual and annual customer scorecards to continuously improve performance and results. Overall scores have improved every year due to aggressive customer alignment initiatives. The business also has a goal of reducing customer com-plaints by at least 10 percent and re-solving them within the customer’s resolution target dates.
• Our Performance Materials divi-sion tracks and reports customer complaints as a percentage of sales orders. Their goal for 2012 was to achieve a 4 percent or lower target. They came in at 3.3 percent.
• Merchant Gases employs customer feedback surveys as part of their regular operations. Voice of the Cus-tomer data is used in Six Sigma ini-tiatives and product development.
• Our Tonnage business builds on-site facilities, putting them in close contact with customers on a daily basis. They measure satisfaction by the percent of rolled contracts and the volume of new contracts as a percentage of all new awards. In most regions, 100 percent of custom-ers continued their contracts with Air Products. Several new contracts were awarded in 2012 as well.
Our business segments are aligned in a shared commitment to customer service. Through our Global Data Privacy policy, we safeguard custom-ers’ personal information and adhere to all data protection requirements in the countries in which we oper-ate. As a result, we have not had any substantial complaints related to breaches of customer privacy or data security.
For more information, visit our Customer Support website.
EMPLOYEES
CUSTOMERS
11
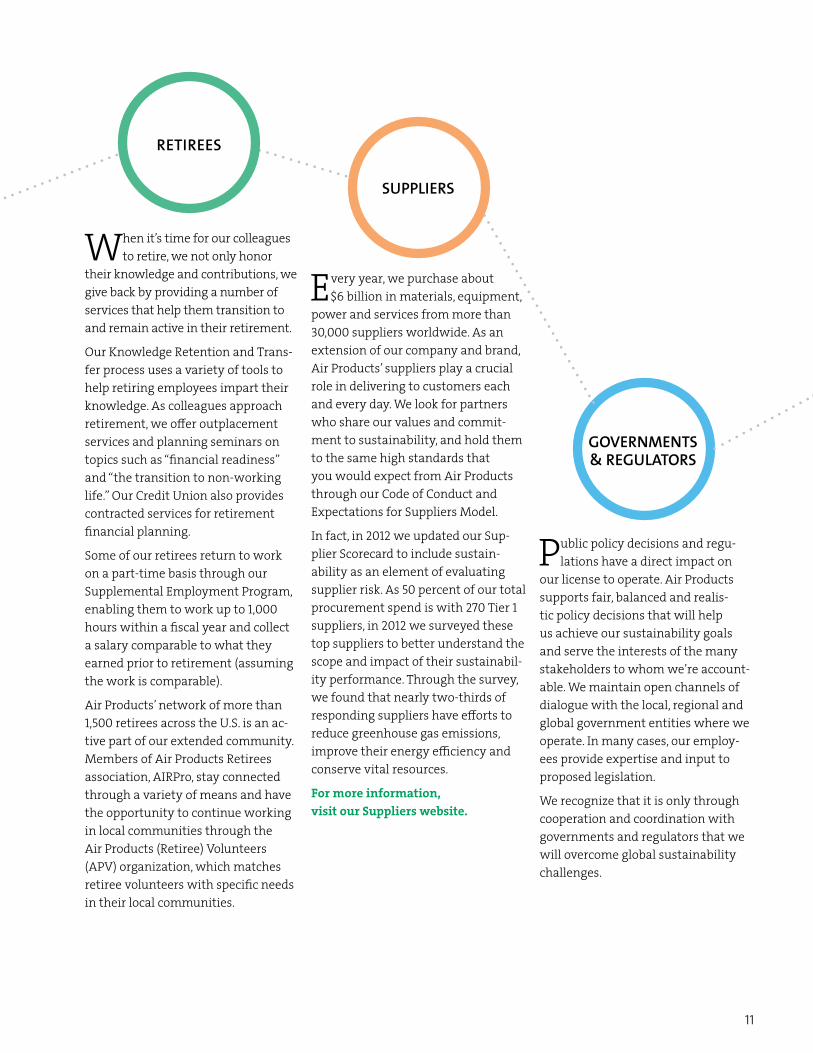
Every year, we purchase about $6 billion in materials, equipment,
power and services from more than 30,000 suppliers worldwide. As an extension of our company and brand, Air Products’ suppliers play a crucial role in delivering to customers each and every day. We look for partners who share our values and commit-ment to sustainability, and hold them to the same high standards that you would expect from Air Products through our Code of Conduct and Expectations for Suppliers Model.
In fact, in 2012 we updated our Sup-plier Scorecard to include sustain-ability as an element of evaluating supplier risk. As 50 percent of our total procurement spend is with 270 Tier 1 suppliers, in 2012 we surveyed these top suppliers to better understand the scope and impact of their sustainabil-ity performance. Through the survey, we found that nearly two-thirds of responding suppliers have efforts to reduce greenhouse gas emissions, improve their energy efficiency and conserve vital resources.
For more information, visit our Suppliers website.
When it’s time for our colleagues to retire, we not only honor
their knowledge and contributions, we give back by providing a number of services that help them transition to and remain active in their retirement.
Our Knowledge Retention and Trans-fer process uses a variety of tools to help retiring employees impart their knowledge. As colleagues approach retirement, we offer outplacement services and planning seminars on topics such as “financial readiness” and “the transition to non-working life.” Our Credit Union also provides contracted services for retirement financial planning.
Some of our retirees return to work on a part-time basis through our Supplemental Employment Program, enabling them to work up to 1,000 hours within a fiscal year and collect a salary comparable to what they earned prior to retirement (assuming the work is comparable).
Air Products’ network of more than 1,500 retirees across the U.S. is an ac-tive part of our extended community. Members of Air Products Retirees association, AIRPro, stay connected through a variety of means and have the opportunity to continue working in local communities through the Air Products (Retiree) Volunteers (APV) organization, which matches retiree volunteers with specific needs in their local communities.
SUPPLIERS
RETIREES
Public policy decisions and regu-lations have a direct impact on
our license to operate. Air Products supports fair, balanced and realis-tic policy decisions that will help us achieve our sustainability goals and serve the interests of the many stakeholders to whom we’re account-able. We maintain open channels of dialogue with the local, regional and global government entities where we operate. In many cases, our employ-ees provide expertise and input to proposed legislation.
We recognize that it is only through cooperation and coordination with governments and regulators that we will overcome global sustainability challenges.
GOVERNMENTS & REGULATORS

12Air Products | 2013 Sustainability Report
The stronger the local community, the stronger and more stable plat-form from which we can run our business. We continue to act as a good neighbor, demonstrating our commit-ment to the health and vitality of the local communities in which we work and live.
As an employer, we look to partner with local commerce boards to sup-port economic development and jobs creation. Air Products also gives back to local communities through philanthropic endeavors totaling $5.6 million in cash, volunteer and in-kind donations in 2012 as well as through our ongoing involvement in workforce development through our investments in science, technology, engineering and mathematics (STEM) education.
For more information, visit our Corporate Citizenship website.
Investors infuse our business with the capital we need to fund our growth, develop new innovations, improve our operations and explore new mar-kets. To retain and attract investors to Air Products, it’s essential that we demonstrate strong strategic vision, a keen understanding of the broader global issues shaping our industry, sound business management and responsible business practices.
We hold quarterly investor calls. We also participate in numerous sell-side conferences and one-on-one meetings to ensure the investment community’s perspectives are fully understood as an input to our strat-egy. Air Products is publicly traded as APD on the New York Stock Exchange, where 85 percent of common shares are held by institutional investors. As of December 31, 2012, 207,624,669 shares of Air Products common stock were outstanding.
For more information, visit our Investor Relations website.
Air Products is a leader in the industrial gases industry. Our leadership is defined by an insatiable curiosity and desire to learn from others and embrace good ideas. We remain active in a number of sustainability-related industry and advocacy associations, such as:
• AIChE Center for Sustainable Technology Practices
• Alternative Fuels Renewable Energies Council
• American Chemistry Council’s Responsible Care Initiative and Value Chain Outreach Committee
• Association of International Chemical Manufacturers (China)
• C2ES—The Center for Climate and Energy Solutions (formerly the Pew Center on Global Climate Change)
• Compressed Gas Association
• European Industrial Gases Association
• Sustainability 50
• US Business Council for Sustainable Development
For more information and associations, see page 66 in the detailed appendix of this report.
BUSINESS COMMUNITY
INVESTMENT COMMUNITY
LOCAL COMMUNITIES

13
Our Contributions Recognized
Environmental StewardGlobal and S&P 500 Disclosure Leadership Indexes, Carbon Disclosure Project
Leadership in Energy Management, Keystone State Energy Conservation Award
Leader for Climate-Related Innovation & Carbon Management Programs, Maplecroft Climate Innovation Indexes
Norges Bank Investment Management’s Climate Change Reporting Banking Award
Strong, Sustainable BusinessDow Jones Sustainability World and North America Indexes
FTSE4Good Index
Company of the Year, Ejecutivos Magazine, Spain
Ethibel PIONEER Investment Register
Ethibel EXCELLENCE Investment Register
Learning OrganizationTop 100 Learning Organization—Corporate Enterprise, e-learning Magazine
Program Excellence Among Companies with U.S. Operations, e-learning Magazine
Most Admired Knowledge Enterprise, MAKE
Socially Responsible EmployerChina’s Top 100 IDEAL™ Employers by Future Natural Sciences Talents
Korea’s President’s Award for Safety
100 Best Corporate Citizens List, Corporate Responsibility Magazine
Top 10 Best Corporate Citizens for the Materials Sector, Corporate Responsibility Magazine
MSCI World ESG Index
MSCI World Socially Responsible Index
KLD 400 Social Index
Global Corporate Leader, United Way Worldwide
Gold Level Employer, American Heart Association

14Air Products | 2013 Sustainability Report
Our Sustainability CommitmentSustainability is at the heart of what we do. As a global leader, Air Products is well positioned to understand many of the world’s most pressing social and environmental challenges. We are committed to protect the environment and enhance the lives of our fellow human beings and strive to:
Governance Be accountable to our stakeholders and run our business with integrity honesty,
fairness and transparency.
Social Responsibility Provide a work environment where
employees can grow and thrive, and strengthen the vitality and vibrance of the
communities in which we live and work.
Business ValueProvide solutions and applications expertise that drive value for our
customers and our investors.
Environmental Stewardship Responsibly manage our business and
continuously improve our operations to reduce our environmental footprint.
15
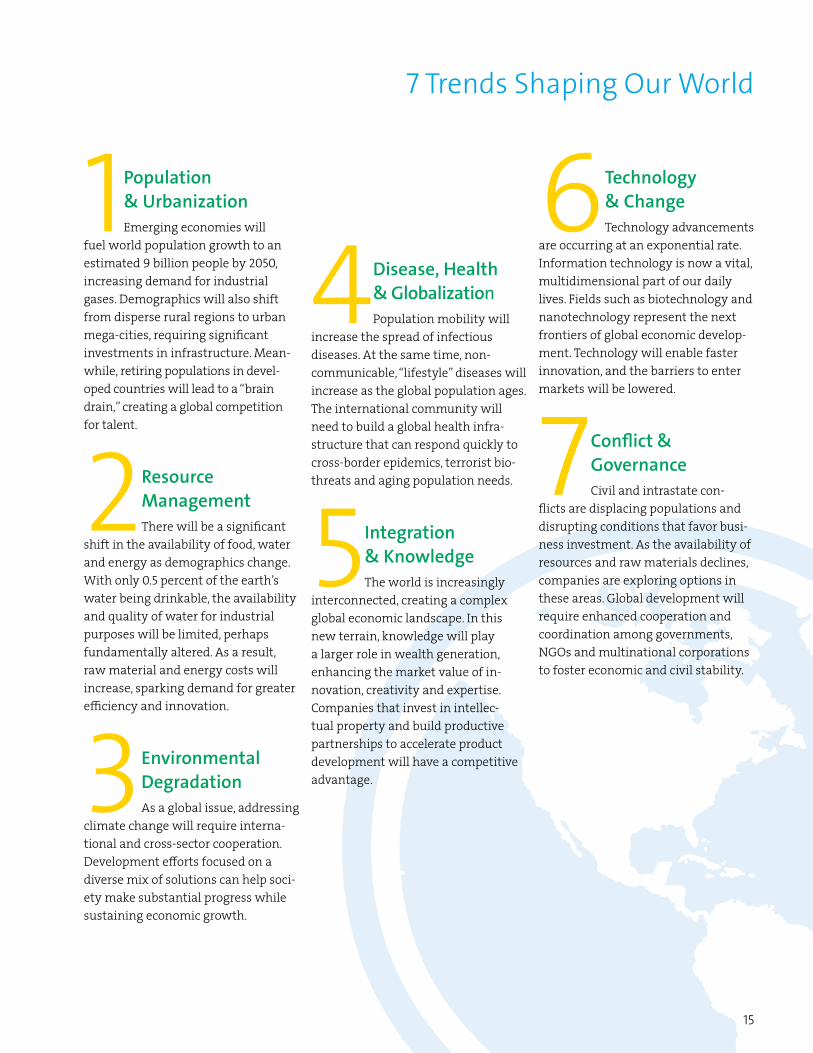
7 Trends Shaping Our World
1 Population & UrbanizationEmerging economies will
fuel world population growth to an estimated 9 billion people by 2050, increasing demand for industrial gases. Demographics will also shift from disperse rural regions to urban mega-cities, requiring significant investments in infrastructure. Mean-while, retiring populations in devel-oped countries will lead to a “brain drain,” creating a global competition for talent.
2 Resource ManagementThere will be a significant
shift in the availability of food, water and energy as demographics change. With only 0.5 percent of the earth’s water being drinkable, the availability and quality of water for industrial purposes will be limited, perhaps fundamentally altered. As a result, raw material and energy costs will increase, sparking demand for greater efficiency and innovation.
3 Environmental DegradationAs a global issue, addressing
climate change will require interna-tional and cross-sector cooperation. Development efforts focused on a diverse mix of solutions can help soci-ety make substantial progress while sustaining economic growth.
4 Disease, Health & GlobalizationPopulation mobility will
increase the spread of infectious diseases. At the same time, non-communicable, “lifestyle” diseases will increase as the global population ages. The international community will need to build a global health infra-structure that can respond quickly to cross-border epidemics, terrorist bio-threats and aging population needs.
5 Integration & KnowledgeThe world is increasingly
interconnected, creating a complex global economic landscape. In this new terrain, knowledge will play a larger role in wealth generation, enhancing the market value of in-novation, creativity and expertise. Companies that invest in intellec-tual property and build productive partnerships to accelerate product development will have a competitive advantage.
6 Technology & Change Technology advancements
are occurring at an exponential rate. Information technology is now a vital, multidimensional part of our daily lives. Fields such as biotechnology and nanotechnology represent the next frontiers of global economic develop-ment. Technology will enable faster innovation, and the barriers to enter markets will be lowered.
7 Conflict & GovernanceCivil and intrastate con-
flicts are displacing populations and disrupting conditions that favor busi-ness investment. As the availability of resources and raw materials declines, companies are exploring options in these areas. Global development will require enhanced cooperation and coordination among governments, NGOs and multinational corporations to foster economic and civil stability.

16Air Products | 2013 Sustainability Report
Customers value working with Air Products not only because of the innovative solutions we provide, but more importantly, because we show up as a true partner, ready to listen and work alongside them to find a better way.
If you’re like most people, helium reminds you of being a kid—it’s the gas that makes balloons float. But the world uses helium for much more than children’s birthday parties. It’s critical to MRI imaging and telecom-munication over fiber-optic cables. It’s needed to make our iPhones and Androids. Welders use it to cut met-als, and it’s a component of breathing mixtures for deep-sea divers.
It’s also a finite resource. Helium demand is rapidly outpacing sup-ply, making conservation essential. Preserving this vital resource and others like it is one of the driving forces behind Air Products’ Materi-als Recovery business, which works with customers to recover, recycle and reuse industrial gases.
“Thinking about the broader challenge has helped us shake up the standard customer-supplier relationship,” said Andy Johnson, Global Market Man-ager, Electronics Sustainability. “We’re deepening our customer relationships, working with them to better under-stand how our materials are used in their manufacturing processes and co-designing solutions to recover and recycle unused materials.”
Business Value
For many of our electronics manufac-turing customers, materials manage-ment is a top product sustainability challenge. “Electronics is a hyper-competitive market,” said Pat Lough-lin, Vice President, Electronics–Asset Management and Supply Chain. “Cus-tomers want the best functionality available. They want it fast, and they want it at a reasonable price. That puts the pressure on our electronics customers to continually innovate to enhance their product performance and lower their production costs. Air Products has been a key partner for many customers in this regard, helping conserve helium and reduc-ing material costs.”
This year, Air Products brought to-gether a development team to help one such Electronics customer cap-ture helium with high efficiency and then resupply it with the purity levels required for reuse.
“Getting the right people in the room to hear what the customer has to say is critical,” said Johnson. “You have to bring the right knowledge set and expertise to the table; people who can really understand the implications from different angles.”
The development team working with this customer includes representa-tives from Air Products’ Electronics and Merchant Gases Divisions and engineering staff from our Instru-ment and Equipment Technology team. They work hand in glove with customers. The mix of talent ensures we surround our customer with a breadth of expertise that comple-ments their own.
The team is virtual: It’s not a for-mal work group. The team taps into people’s know-how to expedite the entire development process: The busi-ness leads help to quickly understand potential problems and opportunities;
I really believe that if you get good people together with different points
of view and experiences, you’re going to come up with a better solution. Our helium recovery effort is proof.”
17
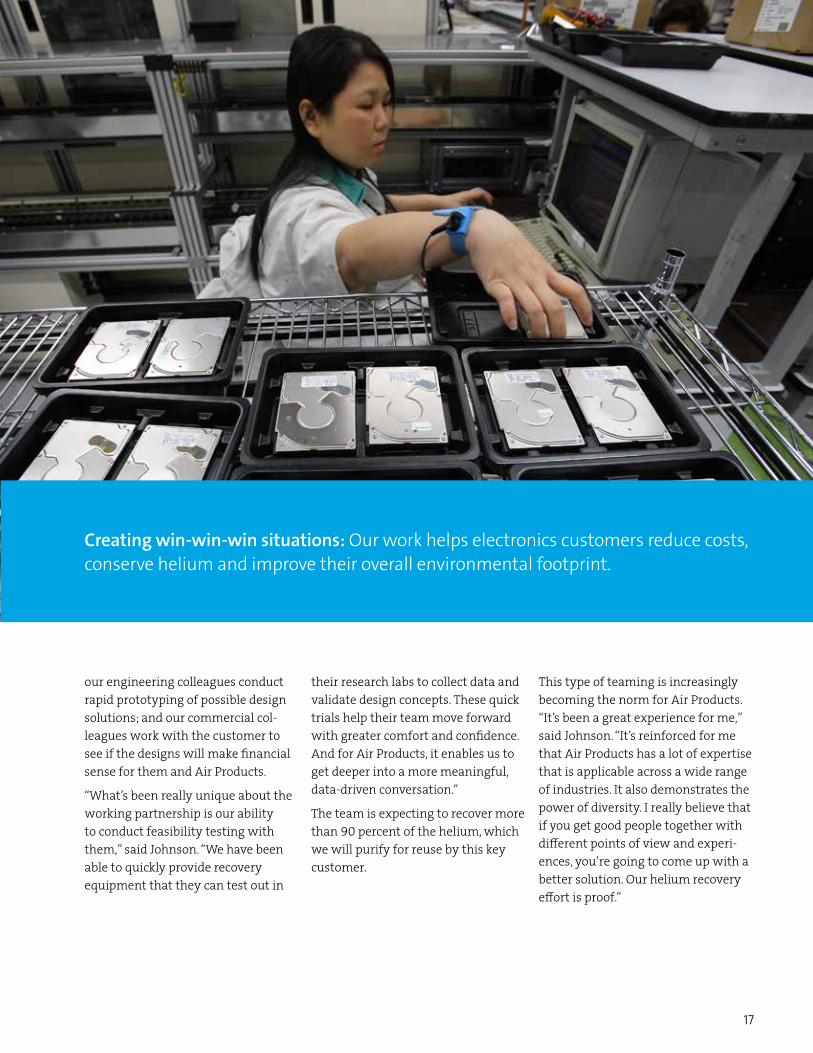
our engineering colleagues conduct rapid prototyping of possible design solutions; and our commercial col-leagues work with the customer to see if the designs will make financial sense for them and Air Products.
“What’s been really unique about the working partnership is our ability to conduct feasibility testing with them,” said Johnson. “We have been able to quickly provide recovery equipment that they can test out in
their research labs to collect data and validate design concepts. These quick trials help their team move forward with greater comfort and confidence. And for Air Products, it enables us to get deeper into a more meaningful, data-driven conversation.”
The team is expecting to recover more than 90 percent of the helium, which we will purify for reuse by this key customer.
This type of teaming is increasingly becoming the norm for Air Products. “It’s been a great experience for me,” said Johnson. “It’s reinforced for me that Air Products has a lot of expertise that is applicable across a wide range of industries. It also demonstrates the power of diversity. I really believe that if you get good people together with different points of view and experi-ences, you’re going to come up with a better solution. Our helium recovery effort is proof.”
Creating win-win-win situations: Our work helps electronics customers reduce costs, conserve helium and improve their overall environmental footprint.
18Air Products | 2013 Sustainability Report
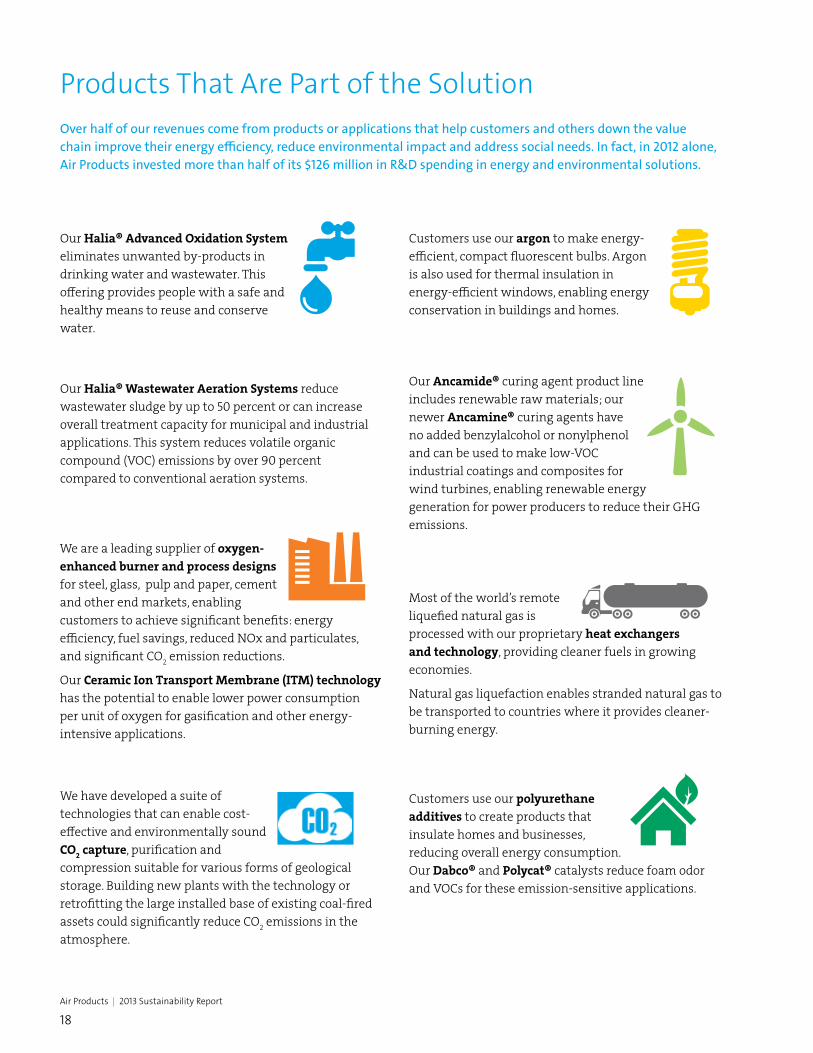
Products That Are Part of the SolutionOver half of our revenues come from products or applications that help customers and others down the value chain improve their energy efficiency, reduce environmental impact and address social needs. In fact, in 2012 alone, Air Products invested more than half of its $126 million in R&D spending in energy and environmental solutions.
Our Halia® Advanced Oxidation System eliminates unwanted by-products in drinking water and wastewater. This offering provides people with a safe and healthy means to reuse and conserve water.
We are a leading supplier of oxygen-enhanced burner and process designs for steel, glass, pulp and paper, cement and other end markets, enabling customers to achieve significant benefits: energy efficiency, fuel savings, reduced NOx and particulates, and significant CO2 emission reductions.
Our Ceramic Ion Transport Membrane (ITM) technology has the potential to enable lower power consumption per unit of oxygen for gasification and other energy-intensive applications.
We have developed a suite of technologies that can enable cost-effective and environmentally sound CO2 capture, purification and compression suitable for various forms of geological storage. Building new plants with the technology or retrofitting the large installed base of existing coal-fired assets could significantly reduce CO2 emissions in the atmosphere.
Customers use our argon to make energy-efficient, compact fluorescent bulbs. Argon is also used for thermal insulation in energy-efficient windows, enabling energy conservation in buildings and homes.
Our Ancamide® curing agent product line includes renewable raw materials; our newer Ancamine® curing agents have no added benzylalcohol or nonylphenol and can be used to make low-VOC industrial coatings and composites for wind turbines, enabling renewable energy generation for power producers to reduce their GHG emissions.
Most of the world’s remote liquefied natural gas is processed with our proprietary heat exchangers and technology, providing cleaner fuels in growing economies.
Natural gas liquefaction enables stranded natural gas to be transported to countries where it provides cleaner- burning energy.
Customers use our polyurethane additives to create products that insulate homes and businesses, reducing overall energy consumption. Our Dabco® and Polycat® catalysts reduce foam odor and VOCs for these emission-sensitive applications.
Our Halia® Wastewater Aeration Systems reduce wastewater sludge by up to 50 percent or can increase overall treatment capacity for municipal and industrial applications. This system reduces volatile organic compound (VOC) emissions by over 90 percent compared to conventional aeration systems.
19
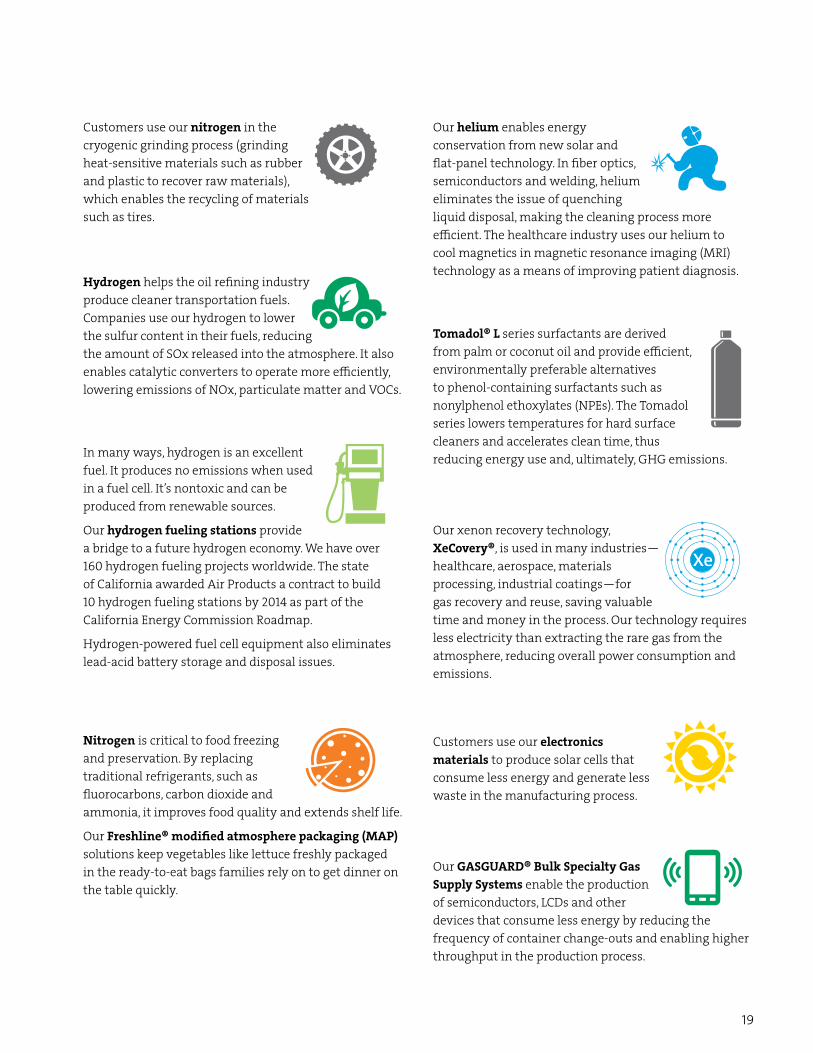
Customers use our nitrogen in the cryogenic grinding process (grinding heat-sensitive materials such as rubber and plastic to recover raw materials), which enables the recycling of materials such as tires.
Hydrogen helps the oil refining industry produce cleaner transportation fuels. Companies use our hydrogen to lower the sulfur content in their fuels, reducing the amount of SOx released into the atmosphere. It also enables catalytic converters to operate more efficiently, lowering emissions of NOx, particulate matter and VOCs.
In many ways, hydrogen is an excellent fuel. It produces no emissions when used in a fuel cell. It’s nontoxic and can be produced from renewable sources.
Our hydrogen fueling stations provide a bridge to a future hydrogen economy. We have over 160 hydrogen fueling projects worldwide. The state of California awarded Air Products a contract to build 10 hydrogen fueling stations by 2014 as part of the California Energy Commission Roadmap.
Hydrogen-powered fuel cell equipment also eliminates lead-acid battery storage and disposal issues.
Nitrogen is critical to food freezing and preservation. By replacing traditional refrigerants, such as fluorocarbons, carbon dioxide and ammonia, it improves food quality and extends shelf life.
Our Freshline® modified atmosphere packaging (MAP) solutions keep vegetables like lettuce freshly packaged in the ready-to-eat bags families rely on to get dinner on the table quickly.
Our helium enables energy conservation from new solar and flat-panel technology. In fiber optics, semiconductors and welding, helium eliminates the issue of quenching liquid disposal, making the cleaning process more efficient. The healthcare industry uses our helium to cool magnetics in magnetic resonance imaging (MRI) technology as a means of improving patient diagnosis.
Tomadol® L series surfactants are derived from palm or coconut oil and provide efficient, environmentally preferable alternatives to phenol-containing surfactants such as nonylphenol ethoxylates (NPEs). The Tomadol series lowers temperatures for hard surface cleaners and accelerates clean time, thus reducing energy use and, ultimately, GHG emissions.
Our xenon recovery technology, XeCovery®, is used in many industries—healthcare, aerospace, materials processing, industrial coatings—for gas recovery and reuse, saving valuable time and money in the process. Our technology requires less electricity than extracting the rare gas from the atmosphere, reducing overall power consumption and emissions.
Customers use our electronics materials to produce solar cells that consume less energy and generate less waste in the manufacturing process.
Our GASGUARD® Bulk Specialty Gas Supply Systems enable the production of semiconductors, LCDs and other devices that consume less energy by reducing the frequency of container change-outs and enabling higher throughput in the production process.

Tailpipe CO2 footprint from fuels
20Air Products | 2013 Sustainability Report
Oxyfuel Lowers CO2 Every YearThe kiln is at the heart of the cement plant. Combustion is the process needed to transform the chemical energy locked up within the fuel into the heat needed to make cement. The more efficient the process, the more heat that is unlocked, the less fuel that is wasted, and the less ash that is produced.
Cement manufacturers count on our oxygen to improve the efficiency of their com-bustion. In 2012, we installed O2 systems on several cement kilns to enable increased alternative fuel substitution that has decreased the rate that customers burn coal and petcoke fuel by an average of 29 percent, with some kilns conserving up to 60 percent of energy used.
Our work is going to help customers save an estimated 99,900 tons of CO2e every year.
Producing Hydrogen Responsibly for Today’s WorldHydrogen is used in the refining process to improve transportation fuel quality. Lowering the sulfur content in the fuel opens the door for advanced emissions control technology and improved fuel economy. It lowers SOx, which causes acid rain, and enables catalytic converters to remove other pollutants such as NOx, particulate matter, and volatile organic compounds (VOCs) for cleaner, clearer air.
The most practical, commercially viable way to produce the volume of pure hydrogen needed for cleaner transportation fuels is to extract it from natural gas. This process releases CO2, a greenhouse gas. Comparatively, the CO2 directly released from refinery hydrogen production is less than 1.5 percent of the total CO2 released from the tailpipes of vehicles driven throughout the world each year.
U.S. H2 production footprint for refinery fuels
21
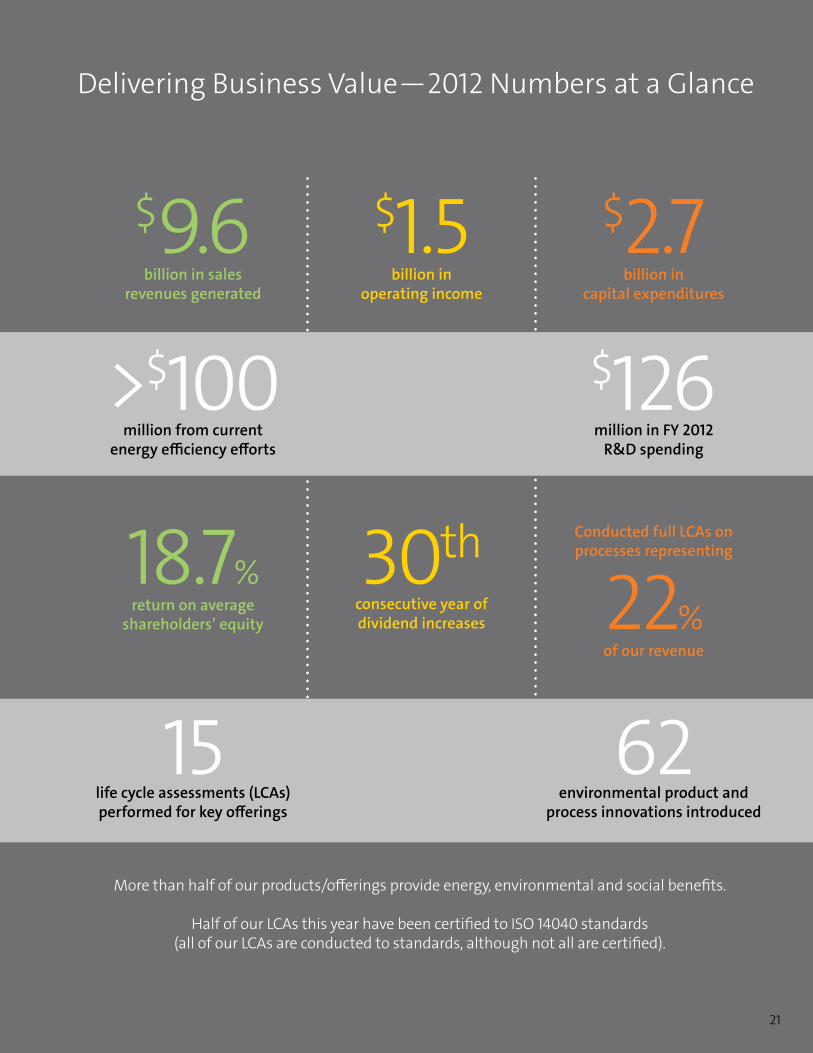
Delivering Business Value—2012 Numbers at a Glance
billion in sales revenues generated
$9.6billion in
operating income
$1.5
return on average shareholders’ equity
18.7%Conducted full LCAs on processes representing
of our revenue
>$100 $126million from current
energy efficiency effortsmillion in FY 2012
R&D spending
consecutive year of dividend increases
life cycle assessments (LCAs) performed for key offerings
environmental product and process innovations introduced
billion in capital expenditures
$2.7
22%
15 62More than half of our products/offerings provide energy, environmental and social benefits.
Half of our LCAs this year have been certified to ISO 14040 standards (all of our LCAs are conducted to standards, although not all are certified).
30th

22Air Products | 2013 Sustainability Report
Value Delivered over the Full Life Cycle
Q What does a life cycle assessment (LCA) approach
enable you to do?
A The better, more meaning-ful data you have, the better
equipped you are to make smart, environmentally sound business deci-sions. That’s essentially what an LCA gives us: knowledge. It’s a tool to un-derstand the environmental impacts of our offerings, from design through sourcing, production, distribution, use and disposal.
Q So it’s a tool for continuous improvement?
A Yes, but that’s not all. That defi-nition is too limiting. The work
we do in the Sustainable Technolo-gies Center is not just about making our existing products and processes more sustainable, it gives us a whole new canvas when it comes to R&D. At every stage of product and process development, from concept through commercialization, we consider envi-ronmental, health and safety impacts. Any concern identified must be ad-dressed before the product can move to the next gate. That means sustain-ability is built into the fabric of how Air Products operates.
An interview with Dr. Martha Collins, Director, Global Technology Center
Sustainability is about looking forward way beyond ourselves and beyond
our customers today. It’s about taking the long view, seven generations out, and making choices that are far-reaching. For me, it’s really a story of hope and innovation. We are creating a better world.”
Q When did we start this type of work?
A Our story started in Spain, with our MATGAS joint venture.
They had been conducting LCAs for some time, working in a research context. We saw the opportunity to apply their expertise across our global operations. So we went for it.
We started by creating a baseline: documenting and modeling the core processes that our company is built on—the offerings it took us nearly 75 years to build. We then conducted comparative LCAs, testing different scenarios to identify opportunities to do things better. I liken it to keeping a household budget. You have a base budget and adjust your spending if you want to save up for a vacation or need to send your kids to college. It’s the same concept with an LCA.
You run your base processes through different scenarios to see if you can come up with a better, more sustain-able way. We expanded on this work when we integrated the process into our Offering Development and Intro-duction process a couple years ago. So far, we’ve completed LCAs covering 22 percent of our revenues.
Q Who conducts the LCAs?
A We have a team of six engi-neers and scientists dedicated
to LCAs. They work with a variety of people across the organization, tap-ping into expertise as needed. These people are energized by sustainability. It’s a value that spans generations. Longer-tenured colleagues are think-ing about the legacy they’re leaving to the younger generations. And Mil-lennials are making career decisions based on it: sustainability practices are a deciding factor in where they choose to build their careers.
23
Q Conducting an LCA is a bit like pulling the yarn from a
sweater . . . the further you investi-gate, the further you see how things are interwoven. An improvement in one area could transfer its impact to another downstream. How do you manage this process?
A The concept that drives us is not just “do no harm”; we actu-
ally want to do good. So the first step is the most critical step, and that’s choosing the parameters, the bound-ary conditions for the LCA. And as they say, “eighty percent of a problem is asking the right question”—this initial work is probably the toughest part. It involves bringing people to the table—such as colleagues from our business divisions, including market managers—to identify the scope of the assessment, when to stop pulling at the yarn, as you say. It definitely takes commitment; not only to con-duct the assessment, but to act on the information that comes out of it.
Q What do you consider when weighing tradeoffs?
A We consider a lot of things, but I think there are two main points
that we always think about right off of the bat. The first relates to environ-mental impact—are we doing good? Did our new product or process create problems in our sustainability? The second relates to economics. Anything we do has to be economically viable. We must be able to sustain the new process financially over the long term.
Q Can we quantify the value that LCAs have contributed to
Air Products?
A It’s hard to measure the value of knowledge. We’ve gotten
so much value from the actionable insights we’ve pulled from these LCAs. It’s of strategic value to our business, making us stronger and more com-petitive. It’s of value to our customers, improving their performance through our partnership. And it’s been a huge benefit to our reputation as a respon-sible company. We haven’t found one measure that could answer that ques-tion, and I think that speaks to the multidimensional value that comes from this work.
Understanding downstream impacts: A decision in one area of the supply chain can often have an impact later down the line. We use LCAs to understand and make sustainable decisions based on the full environmental impacts of our products and processes.
24Air Products | 2013 Sustainability Report
Environmental StewardshipInnovation is key to unlocking today’s complex global issues. Air Products has applied its creativity and expertise to generate an innovative solution to help address the U.K.’s waste management challenge with the Tees Valley advanced plasma gasification project.
Out of sight, out of mind—isn’t that how it usually goes? When you throw something away, it’s easy to forget about it. But skyrocketing global populations and increasing con-sumer consumption are prompting the global community to think again about how we manage waste. A large percentage of the world’s waste ends up in landfills, and this is where the challenge heats up.
Methane is one of the leading culprits in heating the earth’s atmosphere (it’s 20 times more powerful than CO2, according to scientists). Landfills emit “landfill gas,” which comprises about 60 percent methane and 40 percent carbon dioxide (CO2), making landfills the largest methane producers in the world.
The international community is mobilizing to address the challenge, putting particular pressure on the developed world’s waste disposal and landfill policies. In 1999, the European Union issued a Landfill Directive requiring its Member States to enact policies to reduce the amount of bio-degradable municipal waste that they landfill to 35 percent of 1995 levels by 2016. The Directive provided guidance, but did not prescribe specific treat-ment options for the Member States’ diverted waste.
“The U.K. was quick to adopt EU requirements,” said Ian Brass, Air Products’ European Director of Public Affairs. “The country’s high population density had already limited the amount of land available for landfill, requiring officials to think about alternative options early. They put into place a regulatory framework that is supportive of using advanced technology to generate energy from waste—and that is precisely what our Tees Valley facility will do.”
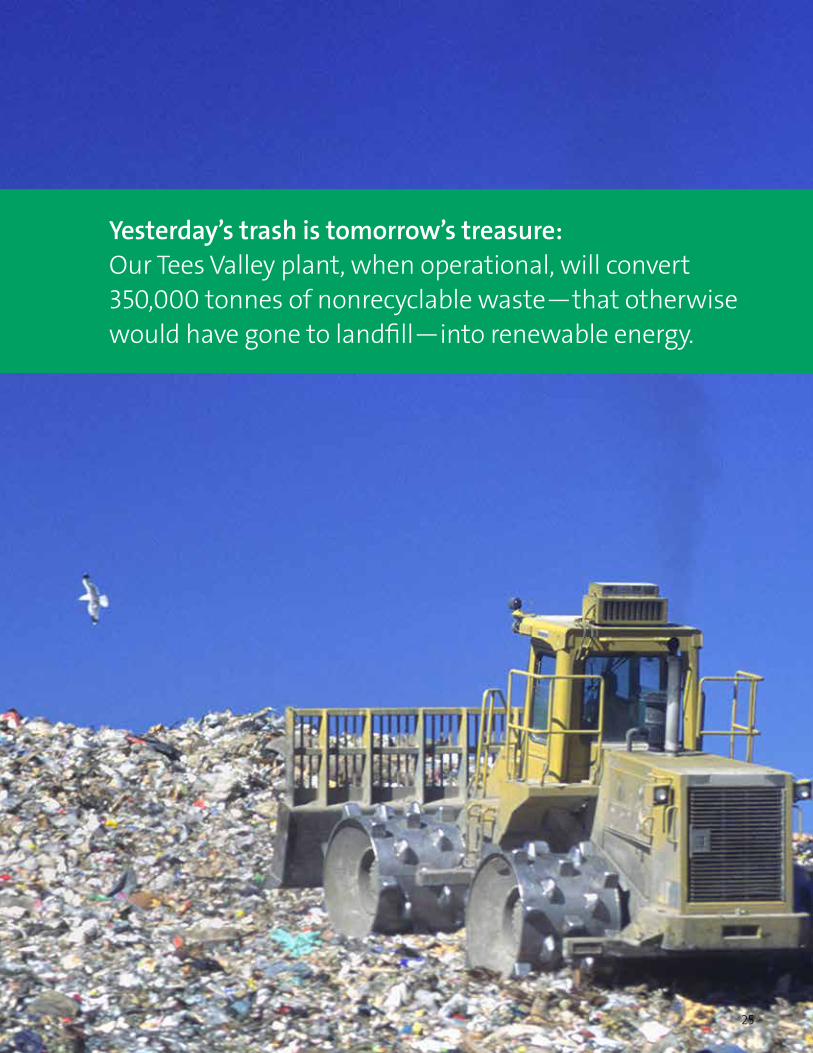
Air Products is building the world’s largest advanced plasma gasification facility in Teesside, U.K. The plant will convert nonrecyclable waste into renewable energy, diverting 350,000 tonnes of nonrecyclable waste from landfill to generate around 50MW of electricity. That’s enough energy to power 50,000 homes in the region.
“Tees Valley is a great example of the innovations that can result from Air Products’ keeping current on evolving regulations and listening to local community interests,” said, Andrew Connolly, Facility Manager.
Our work started by getting smart on the U.K.’s developing regulatory
frameworks for waste management and energy. Air Products spent several years reviewing the evolving legisla-tive and regulatory requirements to understand how advanced plasma gasification technology might repre-sent a realistic and appropriate option for the U.K.
“It was essential that any solution we proposed fit into the U.K.‘s existing regulatory framework,” said Brass. “Large capital investments such as this represent a long-term relation-ship between a company and a local community. Many things are consid-ered in the process to ensure there’s a ‘fit’ on both sides. For Air Products, we wanted to find a location where we could build on existing skills and in-frastructure. Teesside quickly became the logical choice.”
Tees Valley will reduce the environ-mental impact of landfill. It will help address the U.K.’s waste management challenge. It will help improve the country’s energy security by reducing reliance on fossil fuels. It is projected to bring 700 construction jobs and 50 permanent positions to Teesside.
Currently under construction, our Tees Valley facility is scheduled to go into commercial operation in 2014.
Large capital investments such as this represent a long-term relationship
between a company and a local community. Many things are considered to ensure there’s a ‘fit’ on both sides.”
25
Yesterday’s trash is tomorrow’s treasure: Our Tees Valley plant, when operational, will convert 350,000 tonnes of nonrecyclable waste—that otherwise would have gone to landfill—into renewable energy.
26Air Products | 2013 Sustainability Report
Accountable PerformanceAn interview with Joe Pietrantonio, Vice President of EHS&Q and Corporate Chief Engineer
From the large-scale projects, to the daily actions of our employees . . .
wherever you turn in Air Products, you’ll feel that incredible commitment to our environmental responsibility.”
This year we had 65,000 individual entries in the system. Each entry rep-resented a task that had to be done for compliance. We were able to flag 1,000 items for investigation: not because there was a problem, but because we saw the opportunity to further improve and proactively manage our compliance process. As a result of this effort, we’ve halved our KPIs since 2006.
Q What are our biggest challenges in meeting our environmental
goals?
A From a footprint perspective, our challenge comes down to
this: taking what we have and mak-ing it better while simultaneously growing our capacity in a responsible way. If we can do that, we can grow our business without proportionally expanding our environmental foot-print. Finding opportunities to do so is tough, but it’s something we work toward every day.
Q How would you characterize Air Products’ 2012 environmen-
tal performance?
A It was consistent with last year, in the face of a growing asset
base and regulatory requirements. So given those two factors, I’d say our per-formance is improving year over year. The other thing I’d mention is that we had no significant environmental incidents. It’s strange defining your success in terms of an absence, but it’s a good thing.
Q What successes are you most proud of?
A I’m proud of all of the projects featured in this report. But I’d
like to briefly mention the work of one of our teams that has been working at our Reserve, Louisiana, facility for the last two years to reduce the annual hazardous waste generated by its sur-factant production process. The project has cut the plant’s annual hazardous waste in half, by 440,000 pounds. It also saved about 14,000 miles of over-the-road transportation each year that was necessary to move the waste from the plant to the disposal location. Two years is a long time to be focused on a challenge, and I’d like to commend the Reserve team for their tenacity and diligence. We should all be proud of their results.
Q What’s behind our success?
A How we tightly manage our op-erations. What’s really exciting is
that we’re starting to see the results of previous work come to full fruition. For example, in 2007 we put a Compliance Management Tool in place that our worldwide teams use to extract data, leading indicators, on their environ-mental compliance.
The data helps us get ahead of poten-tial issues before they become prob-lems. Let’s say that we’re looking at our compliance in filing permits. We can look at the total number of permits filed in a given time period—when we missed deadlines and when we came close to missing them (within a day or two). That data allows us to flag for investigation those instances where we came close to missing the deadline. And that puts us in a better position for ensuring compliance in the future.
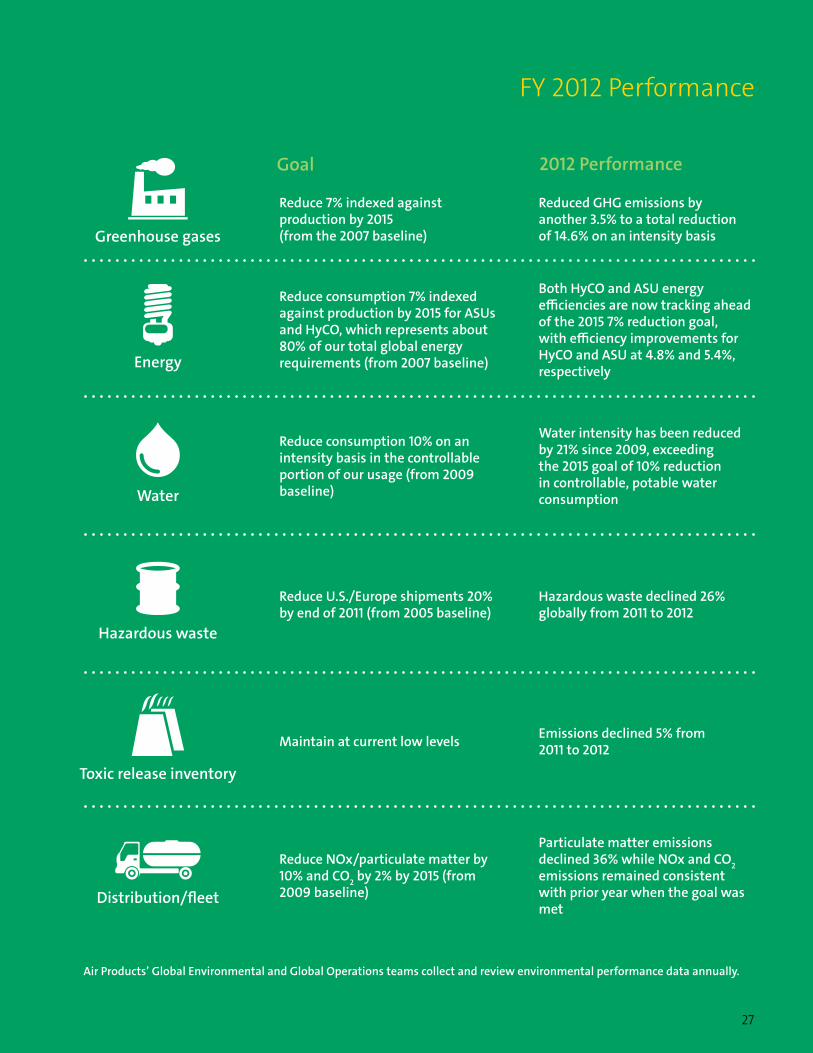
Reduce 7% indexed against production by 2015 (from the 2007 baseline)
Reduced GHG emissions by another 3.5% to a total reduction of 14.6% on an intensity basisGreenhouse gases
Reduce consumption 7% indexed against production by 2015 for ASUs and HyCO, which represents about 80% of our total global energy requirements (from 2007 baseline)
Both HyCO and ASU energy efficiencies are now tracking ahead of the 2015 7% reduction goal, with efficiency improvements for HyCO and ASU at 4.8% and 5.4%, respectivelyEnergy
Reduce consumption 10% on an intensity basis in the controllable portion of our usage (from 2009 baseline)
Water intensity has been reduced by 21% since 2009, exceeding the 2015 goal of 10% reduction in controllable, potable water consumptionWater
Reduce U.S./Europe shipments 20% by end of 2011 (from 2005 baseline)
Hazardous waste declined 26% globally from 2011 to 2012
Hazardous waste
Maintain at current low levels Emissions declined 5% from 2011 to 2012
Toxic release inventory
Reduce NOx/particulate matter by 10% and CO2 by 2% by 2015 (from 2009 baseline)
Particulate matter emissions declined 36% while NOx and CO2 emissions remained consistent with prior year when the goal was met
Distribution/fleet
Goal
FY 2012 Performance
27
2012 Performance
Air Products’ Global Environmental and Global Operations teams collect and review environmental performance data annually.

28Air Products | 2013 Sustainability Report
2012 Energy Conservation and EfficiencyEvery year, nearly 40 percent of our total operational spend goes toward powering production. In FY 2012, our energy consumption was down slightly from the previous year, despite increased production due to improved energy efficiency. Our total energy consumption, primarily consisting of natural gas and electric power, was equivalent to nearly 98 million MWh in 2012. The energy we consume is converted into products and services that help our customers improve their energy efficiency and reduce environmental impact, be it in the creation of cleaner-burning fuels or making water potable and available for more people to enjoy.
Improving our efficiency and conserving energy makes sense for the environment and our finances. If we remain on track to achieve our 2015 goal of reducing our energy consumption in our ASUs and HyCOs by 7 percent, it could be worth more than $100 million.
• Recycled: . . . 191 tons of scrap metal . . . 211 tons of office paper . . . 35 tons of wood pallets . . 30 tons of scrap wood . . . 57 tons of cardboard . . . 2.6 tons of fluorescent lamps
• Achieved: . . . a total recycling rate of 60%
• Composted: . . . over 6 tons of food waste, a 50% increase from the prior year
At our corporate headquarters, we . . .
• Reduced: . . . energy consumption at our IT data centers by 24%
• Generated 2MW of electricity from our solar farm: . . . reducing CO2 emissions by 2,000 tons, the emissions equivalent of taking 400 cars off the road for a year
Fuel MWh GJ
Natural Gas (and Refinery off-gas)
77,976,637 280,715,893
Electricity 19,415,027 69,894,097
Coal 370 1,332
Pet-coke 368 1,324.8
Diesel Fuel 69,015 248,454
Gasoline 24,142 86,911.2
Jet Fuel 13,160 47,376
Biomass 353 1,270.8
Steam 284,513 1,024,246.8
heavy-duty trucks consumed nearly 8 million gallons of
diesel fuel and traveled more than 54 million miles in the U.S.
730
Our Orange County, California, hydrogen fueling station
generated 7,383 kilograms of hydrogen from the municipal wastewater treatment plant,
generating 1.3 million kilowatt hours of electricity from this
renewable source.
7,383
29
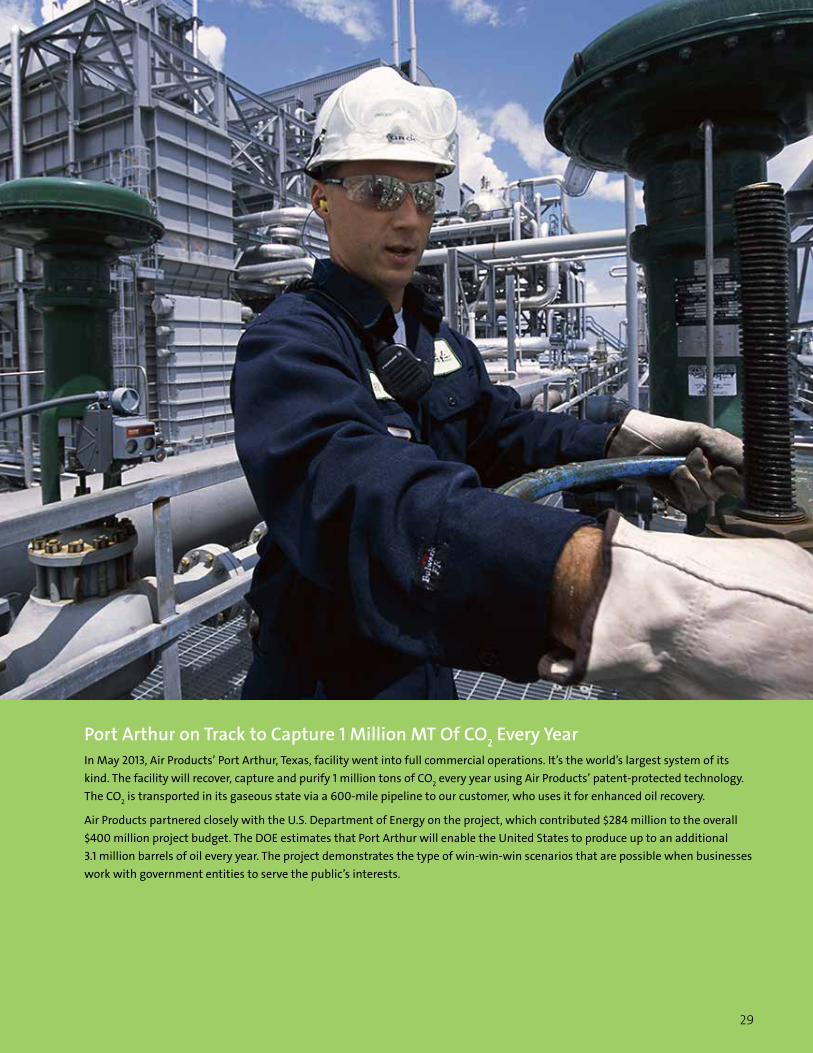
Port Arthur on Track to Capture 1 Million MT Of CO2 Every YearIn May 2013, Air Products’ Port Arthur, Texas, facility went into full commercial operations. It’s the world’s largest system of its kind. The facility will recover, capture and purify 1 million tons of CO2 every year using Air Products’ patent-protected technology. The CO2 is transported in its gaseous state via a 600-mile pipeline to our customer, who uses it for enhanced oil recovery.
Air Products partnered closely with the U.S. Department of Energy on the project, which contributed $284 million to the overall $400 million project budget. The DOE estimates that Port Arthur will enable the United States to produce up to an additional 3.1 million barrels of oil every year. The project demonstrates the type of win-win-win scenarios that are possible when businesses work with government entities to serve the public’s interests.

30Air Products | 2013 Sustainability Report
Direct emissions (Scope 1) of 14,767,209 MTCO2 (metric tons CO2 equivalent) for CY 2012 was 2.6% higher than the previous year.
Indirect emissions (Scope 2) of 10,563,030 MTCO2e for CY 2012 was 2.7% higher than the previous year.
2012 Emissions ReductionsThe molecules that make up air provide the building blocks for our current products and future innovations. Clearly, we take air quality seriously and recognize we are responsible to the broader public when it comes to reducing our emissions.
In 2012, our overall greenhouse gas emissions increased slightly from last year due to increased production. Despite the increase, Air Products is ahead of schedule and we have met our goal of reducing greenhouse gas emissions by 7 percent indexed to production by 2015 from a 2007 baseline. We also achieved significant decreases in NOx and SOx emissions, down 15 percent and 30 percent respectively.
2012 Direct Emissions: 14.76 million MTCO2e n North American Europe/EMEAn South American Asia
2012 Indirect Emissions: 10.56 million MTCO2en North America n Europe/EMEAn South American Asia
1%
45%
17%
37%
WSP Environment & Energy conducted a limited assurance review of Air Products’ 2012 Scope 1, Scope 2 and Scope 3 greenhouse gas inventory (selected elements) in accordance with ISO 14064-3. WSP issued an Assurance Statement, attesting to Air Products’ adherence to the Greenhouse Gas Protocol and the absence of any material inaccuracy in the representation of the inventory data.
1%
88%
8%3%
31
CY 2012 CY 2011 CY 2010Scope 1 Direct Emissions (MTCO2e)
14.77 million 14.1 million* 14.4 million
Scope 2 Indirect Emissions (MTCO2e)
10.56 million 10.28 million* 9.32 million
Scope 3 GHG ** Emissions (MTCO2e)
10.05 million 0.13 million 0.10 million
* Restated in CY 2012 consistent with Inventory Management Plan.** Prior to CY 2012, we estimated two categories of Scope 3 emissions. In CY 2012, we estimated 12 categories
of Scope 3 emissions.
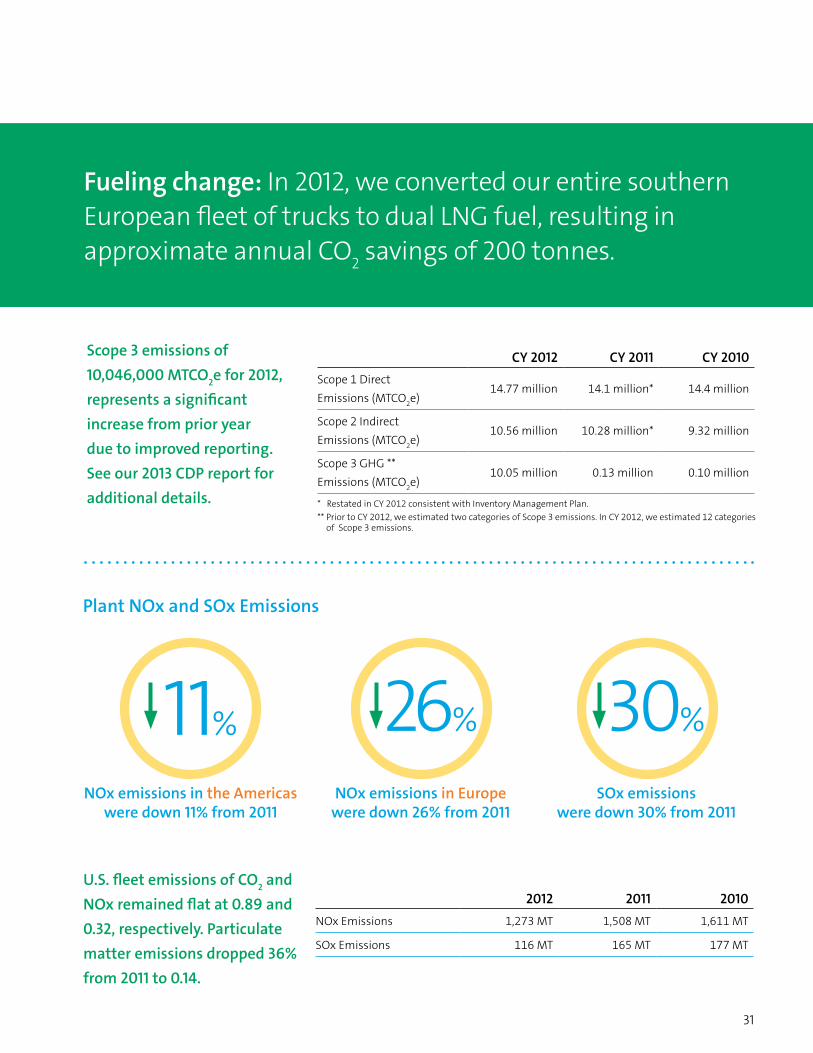
Scope 3 emissions of 10,046,000 MTCO2e for 2012, represents a significant increase from prior year due to improved reporting. See our 2013 CDP report for additional details.
Fueling change: In 2012, we converted our entire southern European fleet of trucks to dual LNG fuel, resulting in approximate annual CO2 savings of 200 tonnes.
NOx emissions in the Americas were down 11% from 2011
NOx emissions in Europe were down 26% from 2011
SOx emissions were down 30% from 2011
11% 26% 30%
2012 2011 2010NOx Emissions 1,273 MT 1,508 MT 1,611 MT
SOx Emissions 116 MT 165 MT 177 MT
U.S. fleet emissions of CO2 and NOx remained flat at 0.89 and 0.32, respectively. Particulate matter emissions dropped 36% from 2011 to 0.14.
Plant NOx and SOx Emissions
32Air Products | 2013 Sustainability Report
Proving Once Again, Green Is GreenAir Products and GE Water are working together to improve productivity, conserve water usage and reduce the operating costs of our facilities worldwide. Through the partnership, we are conducting assessments to evaluate water usage and identify ways to reduce overall consumption. Much of our results to date have come from increasing cooling cycles and converting to recycled gray water in our hydrogen plants and ASUs. Part of the effort involves delivering training to plant operators to equip them to use the system more efficiently and safely. By improving their productivity and efficiency, operators will use less power, requiring less water use and discharge.
To date, Air Products’ water conservation efforts with GE have achieved 15 percent savings—reducing water consumption by 1.2 billion gallons. Over the course of our 10-year agreement with GE, we anticipate saving $33 million in operating improvements, proving once again that green is green.
33
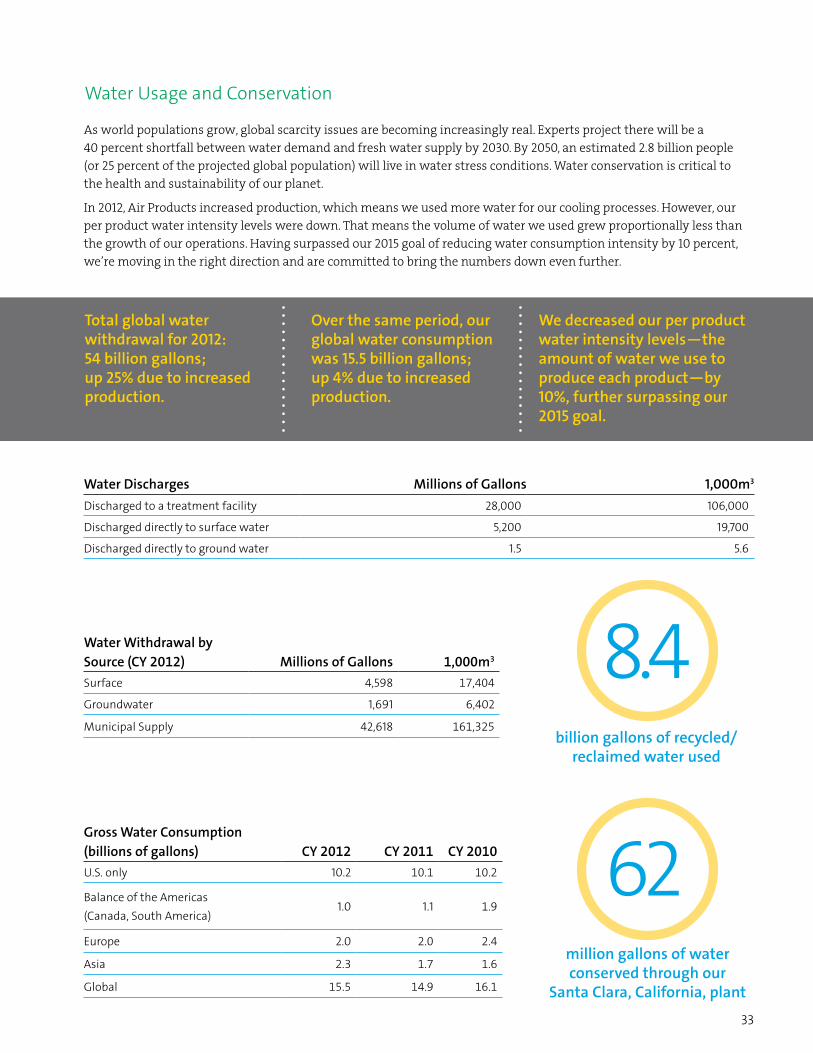
As world populations grow, global scarcity issues are becoming increasingly real. Experts project there will be a 40 percent shortfall between water demand and fresh water supply by 2030. By 2050, an estimated 2.8 billion people (or 25 percent of the projected global population) will live in water stress conditions. Water conservation is critical to the health and sustainability of our planet.
In 2012, Air Products increased production, which means we used more water for our cooling processes. However, our per product water intensity levels were down. That means the volume of water we used grew proportionally less than the growth of our operations. Having surpassed our 2015 goal of reducing water consumption intensity by 10 percent, we’re moving in the right direction and are committed to bring the numbers down even further.
Water Withdrawal by Source (CY 2012) Millions of Gallons 1,000m3
Surface 4,598 17,404
Groundwater 1,691 6,402
Municipal Supply 42,618 161,325
Gross Water Consumption (billions of gallons) CY 2012 CY 2011 CY 2010U.S. only 10.2 10.1 10.2
Balance of the Americas (Canada, South America)
1.0 1.1 1.9
Europe 2.0 2.0 2.4
Asia 2.3 1.7 1.6
Global 15.5 14.9 16.1
Water Usage and Conservation
We decreased our per product water intensity levels—the amount of water we use to produce each product—by 10%, further surpassing our 2015 goal.
Over the same period, our global water consumption was 15.5 billion gallons; up 4% due to increased production.
billion gallons of recycled/ reclaimed water used
Total global water withdrawal for 2012: 54 billion gallons; up 25% due to increased production.
million gallons of water conserved through our
Santa Clara, California, plant
8.4
62
Water Discharges Millions of Gallons 1,000m3
Discharged to a treatment facility 28,000 106,000
Discharged directly to surface water 5,200 19,700
Discharged directly to ground water 1.5 5.6
34Air Products | 2013 Sustainability Report
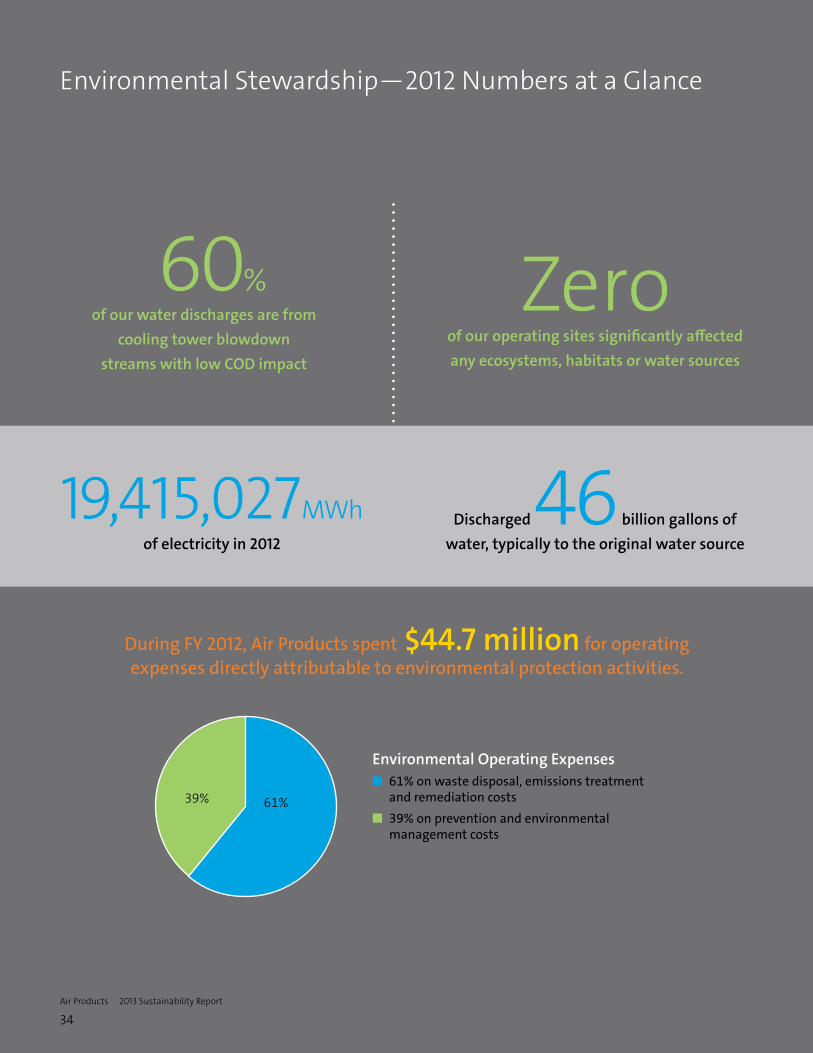
Environmental Stewardship—2012 Numbers at a Glance
Zeroof our operating sites significantly affected any ecosystems, habitats or water sources
Discharged 46 billion gallons of water, typically to the original water source
of our water discharges are from cooling tower blowdown
streams with low COD impact
Environmental Operating Expensesn 61% on waste disposal, emissions treatment
and remediation costsn 39% on prevention and environmental
management costs
61%39%
19,415,027MWh of electricity in 2012
60%
During FY 2012, Air Products spent $44.7 million for operating expenses directly attributable to environmental protection activities.

35
Year Environmental Fines ($USD)2012 $167,844
2011 $1.64M
2010 $15,000
2009 $31,000
2008 $39,000
TRI Releases* (millions of pounds)
CY 2011 CY 2010 CY 2009Air 0.74 0.69 0.72
HAPs* 0.33 0.34 0.36
Water 0.03 0.05 0.08
Land 0.36 0.44 0.18
Total 1.13 1.18 0.98*Hazardous Air Pollutants as defined by EPA and reported to ACC. Subset of total releases to air.
Hazardous Waste Disposal Method
Millions of Pounds 2012
Millions of Pounds 2011
Millions of Pounds 2010
Landfill 0.3 1.8 2.1
Incineration 8.1 12.8 12.5
Recycling 11.4 10.3 8.6
Treatment/disposal 13.0 19.5 23.6
Total 32.8 44.4 46.8
Disposed of 32.8 million pounds of hazardous waste,
a more than 26% reduction in hazardous waste over 2011
32.8
Air Products had no significant spills in 2012.
We spent $6 million in 2012 for capital improvements in our facilities to control emissions and reduce waste.
We recycled nearly 5,000 drums and reused/recycled nearly 190,000 lbs of steel and over 14,000 lbs of plastic through our participation in the EarthMinded® Life Cycle Services Sustainability in Packaging* program.
*EarthMinded is a trademark of EarthMinded LLC, registered in the U.S. and other countries and licensed to Container Life Cycle Management LLC.
Equipment & Energy: steel, aluminum, capital equipment
subcomponents
Primary Materials Used in Each Business
Tonnage: air, natural gas
Merchant Gases: air
Electronics & Performance Materials: alcohols, ethylene amines,
cyclohexylamine, acrylonitriles, glycols

36Air Products | 2013 Sustainability Report
Creative Thinking in the WetlandsWhile our Gulf Coast Connection Program—a 183-mile hydrogen pipeline in Texas and Louisiana—has been a significant accomplishment, it involved many challenges, including having to cross large sections of wetlands. Air Products worked closely with the U.S. Army Corps of Engineers and other stakeholders to understand the potential environmental impacts and find creative solutions to mitigate the impacts.
As a result, Air Products constructed a 150-acre wetland habitat and made a long-term commitment to ensure that the habitat is sustained. The team worked countless hours to involve various stakeholders in the planning. The team’s efforts paid off. Today over 37,500 wetland trees, including highly valued cypress tupelo species, thrive on this 150-acre property, providing newly created wetlands that cleanse water runoff and provide habitat for many species of wildlife. The team’s efforts allowed the Gulf Coast Connection project to be built and saved the company more than $1.6 million in mitigation costs. Their creativity sets the bar for future Air Products projects.
37
2012 BiodiversityBiodiversity cannot be separated from the concerns of our global society. We work diligently to understand the potential impacts of our operations on local ecosystems.
Based on information from the WBCSD Water Tool, Air Products discharges into six Conservation International Biodiversity Hotspots, including Atlantic Forest (Brazil), California Floristic Province (U.S.), Indo-Burma (tropical Asia east of the Ganges-Brahmapurtra lowlands), Japan, the Mediterranean Basin, and Sundaland (western half of the Indo-Malayan archipelago). The water discharged into these hotspots is insignificant, averaging <0.01 percent of the total volume of water contained in the associated water body.
Early in the planning stages of any new plant or pipeline, we conduct thorough assessments that look at land use, vegetation and wildlife. We frequently communicate and work with external stakeholders to design creative solutions that mitigate negative impacts on the surrounding environment.
Some examples of Air Products’ sponsorships of local ecosystems include:
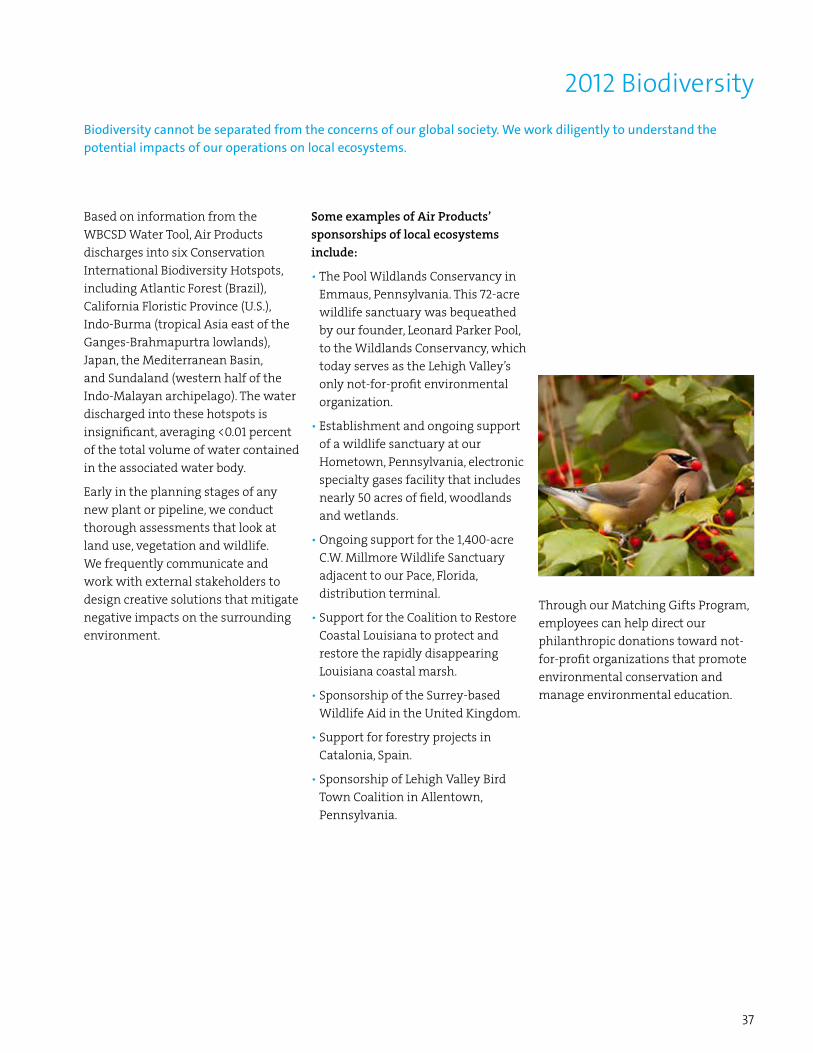
• The Pool Wildlands Conservancy in Emmaus, Pennsylvania. This 72-acre wildlife sanctuary was bequeathed by our founder, Leonard Parker Pool, to the Wildlands Conservancy, which today serves as the Lehigh Valley’s only not-for-profit environmental organization.
• Establishment and ongoing support of a wildlife sanctuary at our Hometown, Pennsylvania, electronic specialty gases facility that includes nearly 50 acres of field, woodlands and wetlands.
• Ongoing support for the 1,400-acre C.W. Millmore Wildlife Sanctuary adjacent to our Pace, Florida, distribution terminal.
• Support for the Coalition to Restore Coastal Louisiana to protect and restore the rapidly disappearing Louisiana coastal marsh.
• Sponsorship of the Surrey-based Wildlife Aid in the United Kingdom.
• Support for forestry projects in Catalonia, Spain.
• Sponsorship of Lehigh Valley Bird Town Coalition in Allentown, Pennsylvania.
Through our Matching Gifts Program, employees can help direct our philanthropic donations toward not-for-profit organizations that promote environmental conservation and manage environmental education.

38Air Products | 2013 Sustainability Report
Social Responsibility
Air Products continues to invest in the long-term health and vibrancy of the communities in which we live and work, preparing tomorrow’s workforce with the education and training needed to fill technical jobs.
As millions of Americans remain unemployed, U.S. manufacturers are having trouble filling jobs. In fact, the National Association of Manufactur-ers estimates about 600,000 jobs remain open because employers can’t find workers with the right skills. What’s behind the disconnect? The answer can be found at the intersec-tion between perception and reality.
Today’s manufacturing facility is not the same plant your grandfather walked into. It’s cleaner. It’s leaner. It’s safer. And it’s more technologi-cally advanced. Companies trying to attract talent find themselves bat-tling often outdated and inaccurate perceptions about the manufactur-ing sector as a whole. But getting to the root issue will take more than an image makeover. Today’s advanced manufacturing requires a techni-cal workforce with advanced skills. About 40 years ago, only one in four jobs required more than a high school education; now two out of every three jobs require more training.
The reality is keenly felt at Air Products. Of our 7,500 U.S.-based employees, over half are skilled workers. Every year, we post around 360 technically skilled positions—jobs for electron-ics experts, instrument technicians, mechanics—that require two years of college or advanced certification. These positions can often go unfilled for 12 months.
“Closing the gap between education and today’s employment opportuni-ties is critical to the future success of our sector and our company,” said,
Mike de Castro, Global Operations Director, Strategic Development for Air Products and Skills USA board member. “Through our partnership with SkillsUSA, we’re investing in the future and making a real difference in people’s lives. Air Products is helping thousands of students gain the skills and training they need to become productive, contributing members to our economy.”
SkillsUSA is a partnership of students, teachers and industry leaders work-ing together to ensure America has a skilled workforce. The national organi-zation serves more than 300,000 high school, college and post-secondary students in training programs in tech-nical, skilled and service occupations. The program also offers complemen-tary coursework in leadership, citizen-ship and character development.
Air Products’ partnership with SkillsUSA started in 2006, and over the past seven years, we’ve become part of the fabric of the organization.
Air Products employees around the country are volunteering at schools near our facilities, serving on tech-nical committees for the SkillsUSA Championships, and participating on task forces and boards of state and local SkillsUSA chapters. These deep relationships at the local level are complemented by Air Products’ financial support at the corporate level, as we contribute to SkillsUSA’s Professional Development Program and Alumni & Friends Association.
“I believe we’re going to see more of this type of cooperation between the private and public sectors,” said, de Castro. “It’s a symbiotic relation-ship. More and more, companies are recognizing that their success is tied to the health and strength of the local communities in which they operate. And vice versa. It goes back to that saying, ‘a rising tide carries all ships’—the work Air Products is doing today is creating a big wave of benefits that carry far into the future.”
More and more, companies are recognizing that their success is
tied to the health and strength of the local communities in which they operate. And vice versa. It goes back to that saying, ‘a rising tide carries all ships’—the work Air Products is doing today is creating a big wave of benefits that carry far into the future.”
39
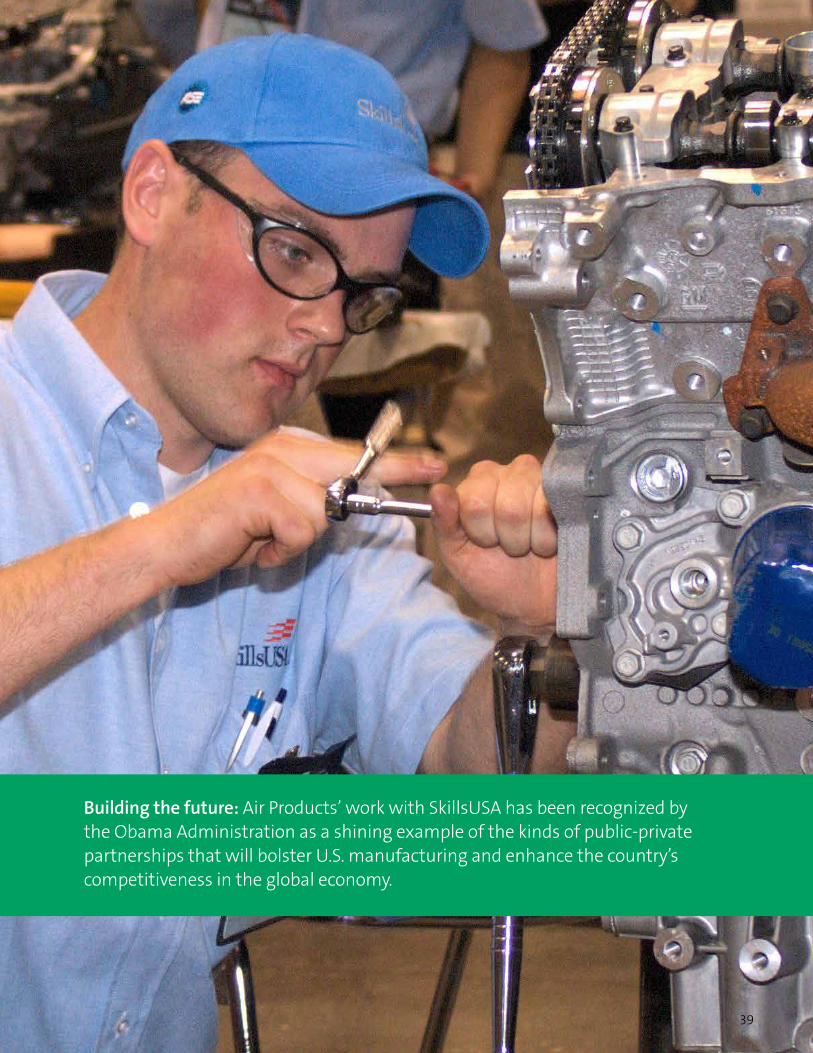
Building the future: Air Products’ work with SkillsUSA has been recognized by the Obama Administration as a shining example of the kinds of public-private partnerships that will bolster U.S. manufacturing and enhance the country’s competitiveness in the global economy.
40Air Products | 2013 Sustainability Report
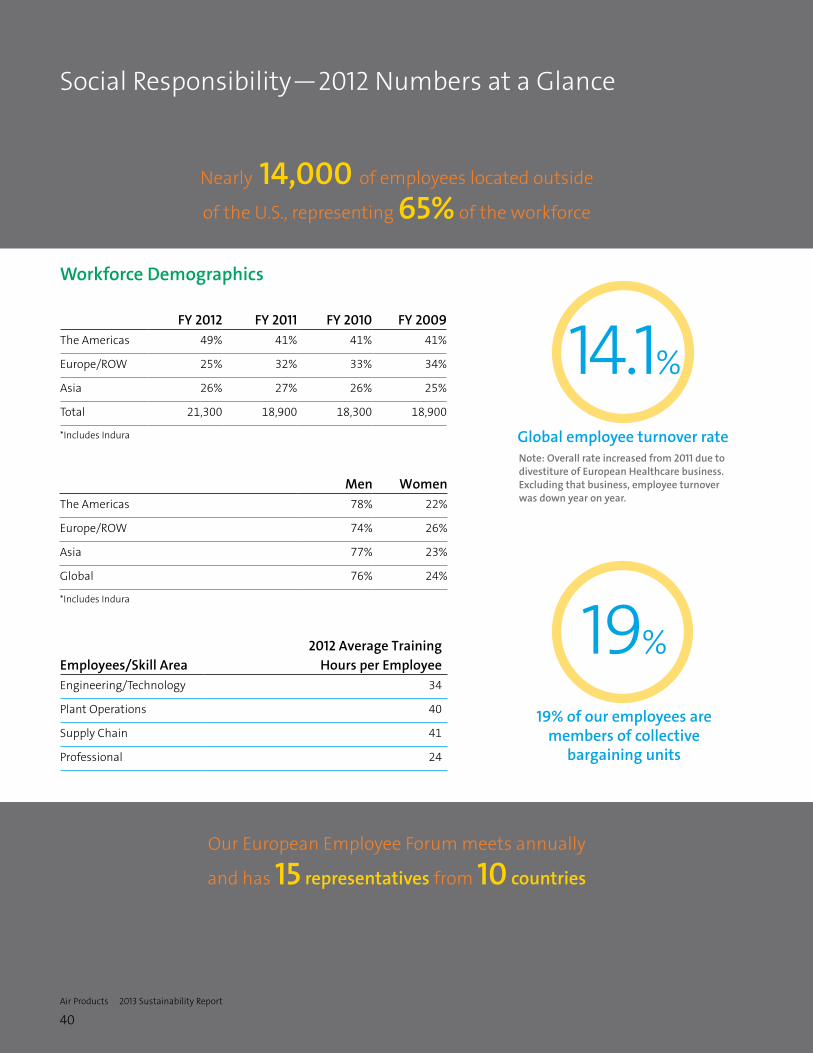
Social Responsibility—2012 Numbers at a Glance
Nearly 14,000 of employees located outside
of the U.S., representing 65% of the workforce
Our European Employee Forum meets annually
and has 15 representatives from 10 countries
FY 2012 FY 2011 FY 2010 FY 2009 The Americas 49% 41% 41% 41%
Europe/ROW 25% 32% 33% 34%
Asia 26% 27% 26% 25%
Total 21,300 18,900 18,300 18,900
*Includes Indura
Men WomenThe Americas 78% 22%
Europe/ROW 74% 26%
Asia 77% 23%
Global 76% 24%
*Includes Indura
Employees/Skill Area2012 Average Training
Hours per EmployeeEngineering/Technology 34
Plant Operations 40
Supply Chain 41
Professional 24
Global employee turnover rate
14.1%
Note: Overall rate increased from 2011 due to divestiture of European Healthcare business. Excluding that business, employee turnover was down year on year.
19% of our employees are members of collective
bargaining units
19%
Workforce Demographics
41
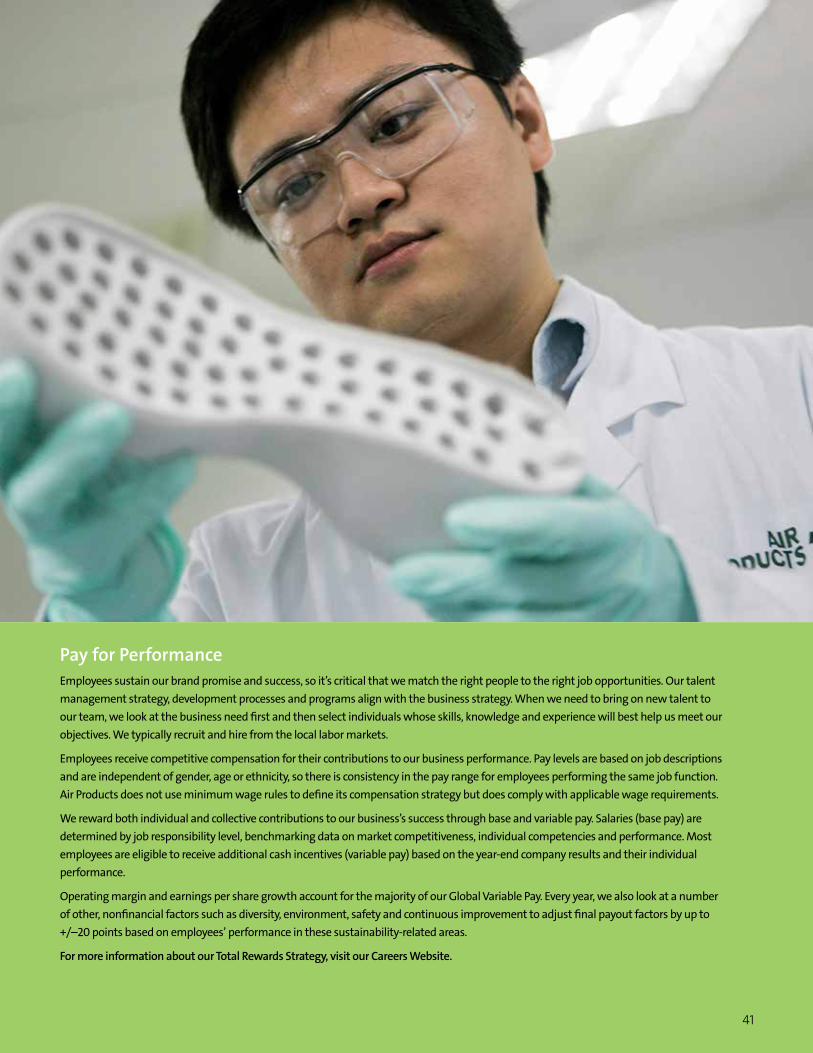
Pay for PerformanceEmployees sustain our brand promise and success, so it’s critical that we match the right people to the right job opportunities. Our talent management strategy, development processes and programs align with the business strategy. When we need to bring on new talent to our team, we look at the business need first and then select individuals whose skills, knowledge and experience will best help us meet our objectives. We typically recruit and hire from the local labor markets.
Employees receive competitive compensation for their contributions to our business performance. Pay levels are based on job descriptions and are independent of gender, age or ethnicity, so there is consistency in the pay range for employees performing the same job function. Air Products does not use minimum wage rules to define its compensation strategy but does comply with applicable wage requirements.
We reward both individual and collective contributions to our business’s success through base and variable pay. Salaries (base pay) are determined by job responsibility level, benchmarking data on market competitiveness, individual competencies and performance. Most employees are eligible to receive additional cash incentives (variable pay) based on the year-end company results and their individual performance.
Operating margin and earnings per share growth account for the majority of our Global Variable Pay. Every year, we also look at a number of other, nonfinancial factors such as diversity, environment, safety and continuous improvement to adjust final payout factors by up to +/–20 points based on employees’ performance in these sustainability-related areas.
For more information about our Total Rewards Strategy, visit our Careers Website.

42Air Products | 2013 Sustainability Report
We don’t just want people to succeed at Air Products, we want them to thrive. We’ve listened to people across our worldwide operations to strengthen what makes Air Products an attractive place to build a career.
A Great Place to Work
Work-Life Balance We’re passionate about our work, but we nurture other interests too. Our policies and practices give employees flexibility to balance their work with the other demands in their lives, including:
• Flexible schedules, telecommuting and compressed workweeks
• Reduced hours (including part-time and job sharing)
• Parental and adoption leave
• Personal, education, medical, military and bereavement leave
• Employee and relocation assistance services
• Eldercare referrals
• Leave of absence programs for sabbaticals
Learning and DevelopmentWe love learning. It’s a shared value among our global employees. Through our Learning and Development organization and Air Products University, we offer exciting opportunities for people to develop their skills and talents, including:
• 4,500 classroom and Web-based course offerings
• Personalized development tracks
• A Learning and Knowledge Management Center of Excellence
• More than 100 Learning Communities and action teams
• A consistent, annual Performance Enhancement and Development process
• Employee education assistance
• Web-based Sustainability Training
Compensation and Benefits We want to attract the best people. And once they’re here, we want to keep them. In addition to the benefits already mentioned, our total rewards approach makes Air Products a great place to build a career, which includes:
• Market-based pay and merit-based incentives
• Stock options and purchase plans
• Savings plan match and profit sharing plans
• Medical and dental
• Flexible spending accounts for healthcare and childcare
• Healthcare insurance for same-sex domestic partners
• Paid vacation, holidays and sick days
• Life, accident, short-term and long-term disability insurance for eligible employees
• Retirement healthcare benefits and plans

43
Health and Wellness A healthy culture starts with healthy, safe employees. We provide a number of options for employees to take charge of their personal health, including:
• On-site gym facilities and health centers at select locations
• Education, training and counseling services
• Health assessments and coaching
• Travel medicine and travel safety services
• Health awareness campaigns and fitness challenges
• Emergency preparedness and crisis response teams
Diversity and Inclusion We are curious by nature. We welcome different perspectives and want people to challenge and improve our thinking. In addition to our Global and Regional D&I Councils and our 19 D&I Leadership Teams, we have eight Employee Resource Groups:
• 4AP (All Asian Americans at Air Products)
• ABCD (AnyBody Concerned about Disabilities)
• EDEN (Ethnically Diverse Employee Network)
• EDGE (Ethnically Diverse Gulf Employees)
• Spectrum (LGBT Resource Group)
• HOLA (Hispanic Organization of Latinos and Amigos)
• Parents Association
• Women in Business
Culture and Work Environment We really like working together. You can tell by how we treat each other. Part of what makes us click is that we are committed to a common purpose of making the world more productive, energy-efficient and sustainable. In this pursuit, we live by six core values:
• Accountability: We are responsible for our own actions and company performance.
• Customer Focus: We deliver value for our customers.
• Innovation: We cultivate ideas to improve and grow our business.
• Integrity: We do what’s right and stay true to our words.
• Respect: We treat all people with dignity and value teamwork.
• Sustainability: We are responsible, safe, and care for each other, our local communities and the world around us.

44Air Products | 2013 Sustainability Report
Our Culture of Diversity and Inclusion
An interview with Darlene MacKinnon, Director, Global Diversity & Inclusion
Diversity drives innovation. And that’s because when you bring different
perspectives to bear on a problem, you push beyond that space of cozy consensus to break through to the truly unexpected.”
Q How does Air Products define diversity and inclusion?
A Diversity is about bringing a variety of voices and perspec-
tives to the table. Inclusion is about making sure that they are heard and that ideas are pursued collaboratively.
Q Why is diversity important to our business? What’s the busi-
ness case for it?
A Today’s challenges are complex and multifaceted. Our future
success depends on our ability to continue to innovate—diversity and inclusion play a huge role in that. We need everyone in the game—the best talent from around the world, fully engaged. We need to harness the collective energy, passion and talent of our organization and channel it toward the challenges we are solving for our customers and the markets we serve.
Q What is diversity’s relationship to innovation?
A There’s this great expression that comes to my mind: “stir-
ring the pot.” Innovation is about getting fresh thinking and cooking up new ideas. There’s a huge body of research showing that diversity drives innovation. And that’s because when you bring different perspectives to bear on a problem, you push beyond that space of cozy consensus to break through to the truly unexpected.
Q What advice do you have for managers who need to build
teams that can innovate?
A Focus on getting two things right: First, bake in diversity
by getting the right talent into the conversation. It’s important to step back from your personal lens and see the problem you are trying to solve through the eyes of your key stake-holders. Your team should reflect your market, and that may require bringing in different functional, regional, or perhaps generational perspectives. I’ve found that if you’re thoughtful about who you invite up front, it speeds the innovation process; the different perspectives and areas of expertise act as catalysts for one another.
Second, foster a healthy team cul-ture. It starts with your own leader-ship—actively seek out different perspectives and be open to contrary suggestions. Leading in this way can be delicate, especially when people care about their work and have strong points of view. The key to success is aligning around a common vision. If you have that, you can always return to it as a touchstone for the team to work through differences of opinion.
Q Debate can be tough, especially if you like and want to respect
the people you work with. How do you encourage healthy debate among teams?
A Disagreeing with someone’s point of view does not mean
that you disrespect them. Similarly, in-clusion does not mean just being nice and agreeable. It’s okay to disagree. It’s natural and it’s something that we should welcome, so long as it’s done respectfully. Disrespect comes into the equation when you close your ears and mind to what people have to say, or denigrate their opinion. Another way to think about it is that it’s dis-respectful to stay quiet and passively resist someone’s idea rather than giving that idea its fair due. One of the greatest ways you can show respect is by engaging in healthy debate.
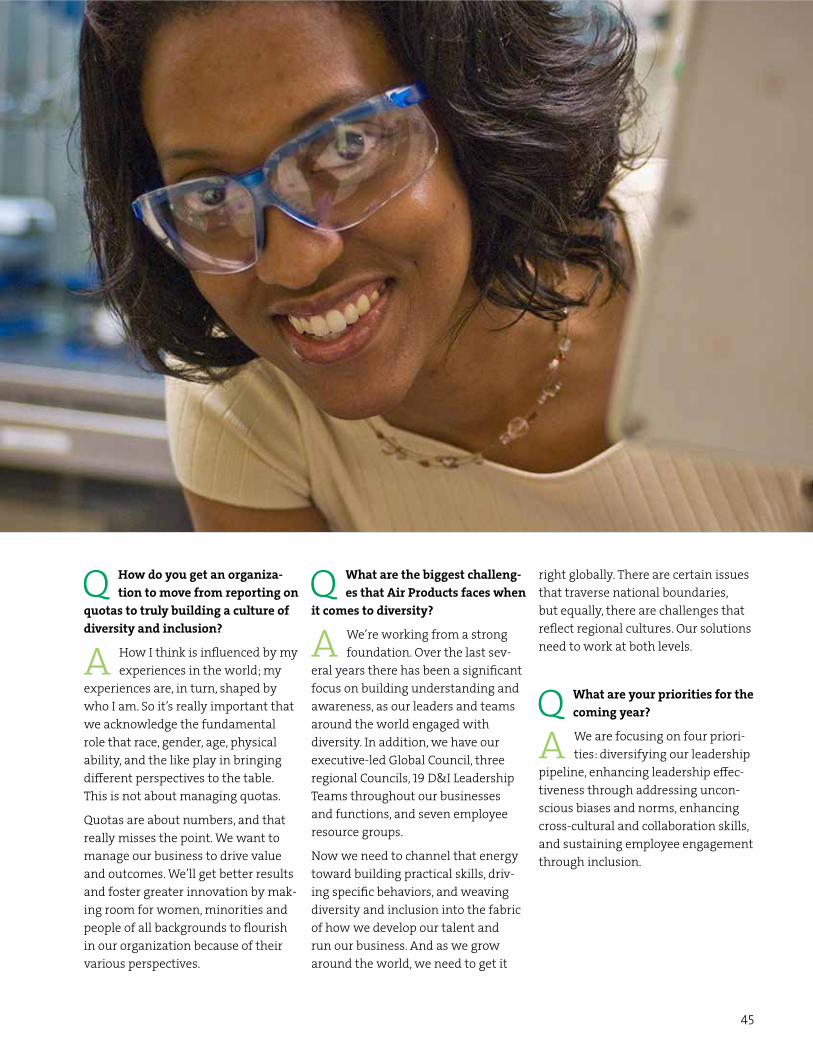
45
Q How do you get an organiza-tion to move from reporting on
quotas to truly building a culture of diversity and inclusion?
A How I think is influenced by my experiences in the world; my
experiences are, in turn, shaped by who I am. So it’s really important that we acknowledge the fundamental role that race, gender, age, physical ability, and the like play in bringing different perspectives to the table. This is not about managing quotas.
Quotas are about numbers, and that really misses the point. We want to manage our business to drive value and outcomes. We’ll get better results and foster greater innovation by mak-ing room for women, minorities and people of all backgrounds to flourish in our organization because of their various perspectives.
Q What are the biggest challeng-es that Air Products faces when
it comes to diversity?
A We’re working from a strong foundation. Over the last sev-
eral years there has been a significant focus on building understanding and awareness, as our leaders and teams around the world engaged with diversity. In addition, we have our executive-led Global Council, three regional Councils, 19 D&I Leadership Teams throughout our businesses and functions, and seven employee resource groups.
Now we need to channel that energy toward building practical skills, driv-ing specific behaviors, and weaving diversity and inclusion into the fabric of how we develop our talent and run our business. And as we grow around the world, we need to get it
right globally. There are certain issues that traverse national boundaries, but equally, there are challenges that reflect regional cultures. Our solutions need to work at both levels.
Q What are your priorities for the coming year?
A We are focusing on four priori-ties: diversifying our leadership
pipeline, enhancing leadership effec-tiveness through addressing uncon-scious biases and norms, enhancing cross-cultural and collaboration skills, and sustaining employee engagement through inclusion.

46Air Products | 2013 Sustainability Report
employee recordables (up from 89 in 2011)
117employee recordable
injury rate (per 200,000 hours worked)
(up from 0.44 in 2011)
0.54
contractor recordable injury rate
(per 200,000 hours worked) (down from 0.96 in 2011)
0.74
0.18
69
employee lost-time incident rate
(per 200,000 hours worked) (down from 0.19 in 2011)
contractor recordables (down from 84 in 2011)
Preventable accidents per one million kilometers
were down 8% across our global operations
employee lost-time incidents (no change from 2011)
39
0.30 28
2012 Safety PerformanceVisit any construction site in the world, and chances are you’ll see a banner that says safety is our #1 priority. But safety is not just about what you say, it’s about what you do: how you prioritize and make decisions, how you evalu-ate choices, how you develop people and hold them accountable for performance. Building a culture of safety takes a deliberate focus and investment.
We continue to make that investment willingly at Air Products. That’s because safety is a shared valued. You can feel people’s commitment and see it demonstrated in many ways every day. Our industry-leading safety performance is proof of it. This year, we achieved a 20 percent improvement in our contractor safety measures. Unfortunately, our employee recordables increased over 2011, which represented a record-breaking year for us. We are evaluating our core safety processes to help take our performance to the next level across the board, striving for zero injuries.
contractor lost-time incidents (down from 36 in 2011)
Zeroemployee fatalities
Zerocontractor fatalities
contractor lost-time incident rate
(per 200,000 hours worked) (down from 0.41 in 2011)

47
The Preemptive StrikeWe’re not sitting back waiting for injuries to happen before we act. Air Products is taking a preemptive stance on workplace safety, using state-of-the-art data analytics and good old elbow grease to get ahead of potential safety hazards.
Our global EH&S tools allow us to look across our entire operations, see trends and flag potential safety issues before they become prob-lems. This year alone, we evaluated over 3,600 “near misses”—situations that could have resulted in an injury but didn’t—to understand how we could reduce potentially hazardous situations. That’s the difference between managing your business with data and managing your business with leading indicators. With our SAP platform, we can get ahead of issues before they become problems because we know where to look.
In 2012, we improved our contractor selection and on-boarding processes to ensure our partners share our value of and high standards for safety performance. Our safety teams made more than 220 visits to contractor sites—that averages to more than four site visits a week—to help them improve their safety performance.
The preemptive strike is paying off: We achieved a 20 percent improvement in our contractor safety measures in 2012 alone.
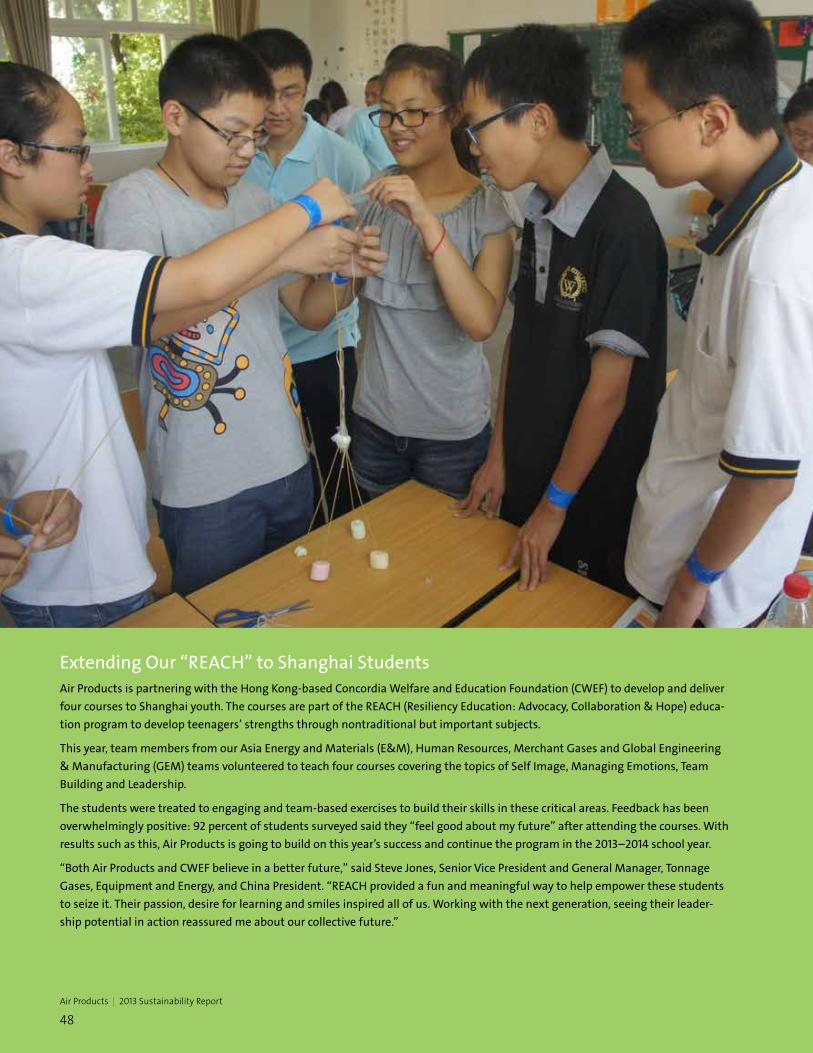
REACH Resiliency Education: Advocacy, Collaboration & Hope
July 2013 Summer Camp Team Building & Leadership
48Air Products | 2013 Sustainability Report
Extending Our “REACH” to Shanghai StudentsAir Products is partnering with the Hong Kong-based Concordia Welfare and Education Foundation (CWEF) to develop and deliver four courses to Shanghai youth. The courses are part of the REACH (Resiliency Education: Advocacy, Collaboration & Hope) educa-tion program to develop teenagers’ strengths through nontraditional but important subjects.
This year, team members from our Asia Energy and Materials (E&M), Human Resources, Merchant Gases and Global Engineering & Manufacturing (GEM) teams volunteered to teach four courses covering the topics of Self Image, Managing Emotions, Team Building and Leadership.
The students were treated to engaging and team-based exercises to build their skills in these critical areas. Feedback has been overwhelmingly positive: 92 percent of students surveyed said they “feel good about my future” after attending the courses. With results such as this, Air Products is going to build on this year’s success and continue the program in the 2013–2014 school year.
“Both Air Products and CWEF believe in a better future,” said Steve Jones, Senior Vice President and General Manager, Tonnage Gases, Equipment and Energy, and China President. “REACH provided a fun and meaningful way to help empower these students to seize it. Their passion, desire for learning and smiles inspired all of us. Working with the next generation, seeing their leader-ship potential in action reassured me about our collective future.”

REACH Resiliency Education: Advocacy, Collaboration & Hope
July 2013 Summer Camp Team Building & Leadership
49
2012 Philanthropy
In 2012, we continued to build on our long and proud tradition of giving back to the broader community. The United Way recognized Air Products as one of only 126 global corporate leaders worldwide. Our leadership was evident not only in the company’s contribution of $1.9 million, but in the level of engagement from our employ-ees in this year’s United Way Cam-paign: 51 percent of our employees participated in the campaign, almost double the national average. We also piloted a “day of volunteering” in our IT organization with much success and expect to roll out a Global Day of Volunteering across our worldwide operations in 2014.
Our size and scale gives us the opportunity to contribute to the world around us in many ways. So it’s important that we focus our support of community and nonprofit organizations in areas where we can make the greatest difference. At Air Products, we use three criteria to evaluate such opportunities. We look to see:
Total Philanthropy Costsn Charitable Contributionsn Community Investmentsn Commercial Initiatives
Foundation Funding n Educationn Health and Human Servicesn Civic and Environmentn Arts and Culturen Fieldn Disaster Response
Cash, In-kind & Time Philanthropic Contributions n Cashn Timen In-kind
40%
35%
25%
Third, if we can contribute to work that our employees are already doing through their personal volunteerism and community service.
Second, if the organization’s work aligns with our business strategy and goals.
First, if our participation will address a true unmet need in the community.
• Donated $5.6M to nonprofit agencies
• United Way Campaign national average for employee participation = 24%; Air Products employee participation in 2012 = 51%
• Employees designated over $1 million of Foundation giving to agencies of their choice
• Employee volunteerism at corporate headquarters rose to 43% due to increased volunteerism opportunities and interest along with improved accounting
43%
22%
11%
10%9%
5%
91%
8%1%
50Air Products | 2013 Sustainability Report
Governance
Sustainability is a key consideration in how we invest capital. Before entering new geographies, we examine environmental and employment practices and consider them as part of any potential acquisition or partnership. In 2012, we found a great fit with Indura S.A.
More than mere compliance, gover-nance is also about making the best decisions to meet our goals and com-mitments to stakeholders.
In 2012, we purchased a 67 percent majority stake in Indura S.A. The joint venture (JV) makes Air Products the second-largest industrial gas produc-er in Latin America. It both deepens and broadens Air Products’ offerings and extends our reach with packaged gases into a region with faster-growing economies.
“Anytime a company makes an investment of this scale, governance is cast into the spotlight,” said, Pedro Riveros, Deputy General Manager, Indura. “People may not think of it this way, but governance can help you capitalize on the strengths of both companies. Good governance, then, can make a difference between realizing the full potential of your in-vestment and missed opportunities.”
Indura brings many strengths to the partnership. Their business model is somewhat of an extension of our own: Our businesses complement each other in a way that makes opportunities leverageable. A large portion of Indura’s business is built around supplying equipment, personal protective equipment and materials to construction and weld-ing customers. They excel in retail packaged gases operations, with around 100 retail outlets across South America. Prior to this JV, Air Products had a limited presence in this high-growth market.
“When you look across our organiza-tions, you’ll see more similarities than differences,” said Riveros. “People are passionate about what they do. They’re committed to the company. They value safety and sustainability. Where there are differences, they result from the different markets we serve, and that’s something we want to capitalize on in our governance policies, processes and practices.”
One only has to look at the “why” behind how decisions are made in both organizations to see Riveros’ larger point. Air Products pioneered large on-site projects with customers. These large projects require significant up-front investment and generally have customer agreements that span 15–20 years. So decision making in this instance takes more time and requires
more review points because the stakes are so high. Indura plays in the smaller end of the market, where custom-ers make quick, point-of-purchase decisions. Speed and flexibility are paramount to serving their needs.
“It’s really important to know when to use the right decision model,” said Riveros. “Sometimes the cost of making a bad decision is less than not making one at all. This is where governance comes into play: setting guidelines for how we make decisions based on the size of the potential implications.”
To make the best decisions, a large part of the companies’ work during this first year has been to integrate operational practices and procedures by sharing best practices. The integra-tion approach has been to take ele-
When you look across our organizations, you’ll see more
similarities than differences. People are passionate about what they do. They’re committed to the company. They value safety and sustainability. Where there are differences, they result from the different markets we serve, and that’s something we want to capitalize on in our governance policies, processes and practices.”
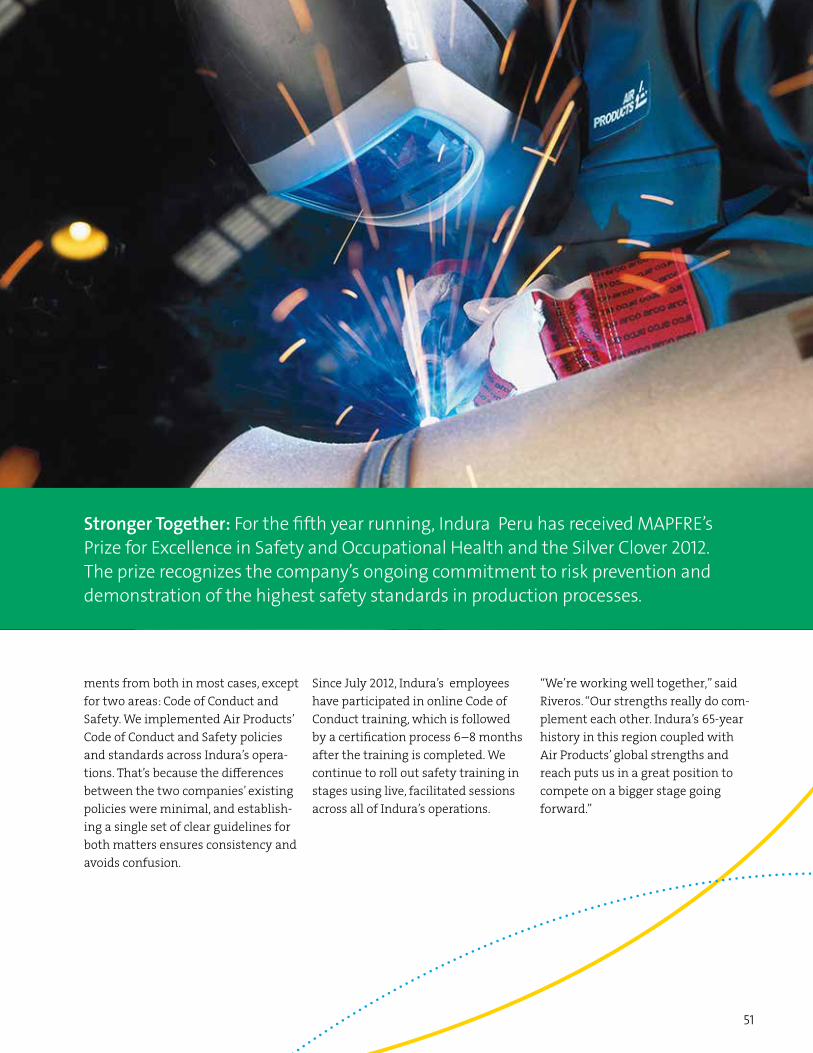
51
ments from both in most cases, except for two areas: Code of Conduct and Safety. We implemented Air Products’ Code of Conduct and Safety policies and standards across Indura’s opera-tions. That’s because the differences between the two companies’ existing policies were minimal, and establish-ing a single set of clear guidelines for both matters ensures consistency and avoids confusion.
Since July 2012, Indura’s employees have participated in online Code of Conduct training, which is followed by a certification process 6–8 months after the training is completed. We continue to roll out safety training in stages using live, facilitated sessions across all of Indura’s operations.
“We’re working well together,” said Riveros. “Our strengths really do com-plement each other. Indura’s 65-year history in this region coupled with Air Products’ global strengths and reach puts us in a great position to compete on a bigger stage going forward.”
Stronger Together: For the fifth year running, Indura Peru has received MAPFRE’s Prize for Excellence in Safety and Occupational Health and the Silver Clover 2012. The prize recognizes the company’s ongoing commitment to risk prevention and demonstration of the highest safety standards in production processes.

52Air Products | 2013 Sustainability Report
2012 Human Rights Performance
We’re proud that once again, we had no incidents of human rights violations across our global operations in 2012:
• There were no judicial or administrative decisions of discrimination made against us on the grounds of race, color, sex, religion, political opinion, national extraction or social origin.
• None of our operations were identified as having freedom of association rights at risk.
• Employees in all of our operations are older than the legal minimum ages in those jurisdictions. None of our operations were identified as being at risk for incidents of child labor and/or young workers exposed to hazardous work.
• None of our operations were identified as being at risk for incidents of forced or compulsory labor.
• There were no incidents of violations involving the rights of indigenous peoples.
To manage our human rights performance, we use a formal Country Risk Assessment process and rely on external research to better understand the regions that may be more prone to human rights issues. We use this information to develop meaningful risk assessments and mitigation plans.
In 2012, we updated our global Human Rights Policy to align with the UN Global Compact’s 10 universally accepted principles in the areas of human rights, labor, environment and anti-corruption. Our Human Rights Policy is a core component of our Code of Conduct, to which every Air Products employee and supplier is required to abide and receives training. In the coming year, key leaders and select functional groups will participate in human rights training. The new policy will be communicated to the broader employee population in our electronic newsletter and public website.
When it comes to human rights, Air Products has a simple standard: We do not condone child labor, forced labor or discrimination of any kind. We follow all labor and employment laws in the countries where we operate, including upholding employee rights such as freedom of association, privacy and equal-opportunity employment.
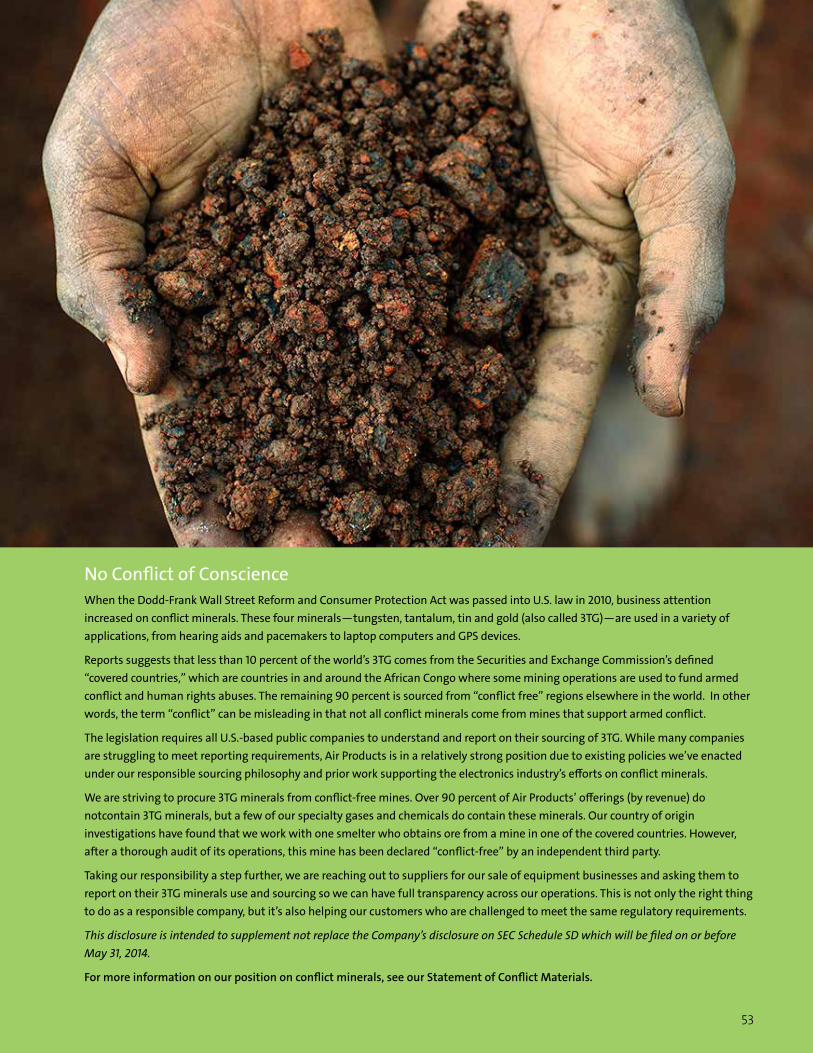
53
No Conflict of ConscienceWhen the Dodd-Frank Wall Street Reform and Consumer Protection Act was passed into U.S. law in 2010, business attention increased on conflict minerals. These four minerals—tungsten, tantalum, tin and gold (also called 3TG)—are used in a variety of applications, from hearing aids and pacemakers to laptop computers and GPS devices.
Reports suggests that less than 10 percent of the world’s 3TG comes from the Securities and Exchange Commission’s defined “covered countries,” which are countries in and around the African Congo where some mining operations are used to fund armed conflict and human rights abuses. The remaining 90 percent is sourced from “conflict free” regions elsewhere in the world. In other words, the term “conflict” can be misleading in that not all conflict minerals come from mines that support armed conflict.
The legislation requires all U.S.-based public companies to understand and report on their sourcing of 3TG. While many companies are struggling to meet reporting requirements, Air Products is in a relatively strong position due to existing policies we’ve enacted under our responsible sourcing philosophy and prior work supporting the electronics industry’s efforts on conflict minerals.
We are striving to procure 3TG minerals from conflict-free mines. Over 90 percent of Air Products’ offerings (by revenue) do notcontain 3TG minerals, but a few of our specialty gases and chemicals do contain these minerals. Our country of origin investigations have found that we work with one smelter who obtains ore from a mine in one of the covered countries. However, after a thorough audit of its operations, this mine has been declared “conflict-free” by an independent third party.
Taking our responsibility a step further, we are reaching out to suppliers for our sale of equipment businesses and asking them to report on their 3TG minerals use and sourcing so we can have full transparency across our operations. This is not only the right thing to do as a responsible company, but it’s also helping our customers who are challenged to meet the same regulatory requirements.
This disclosure is intended to supplement not replace the Company’s disclosure on SEC Schedule SD which will be filed on or before May 31, 2014.
For more information on our position on conflict minerals, see our Statement of Conflict Materials.
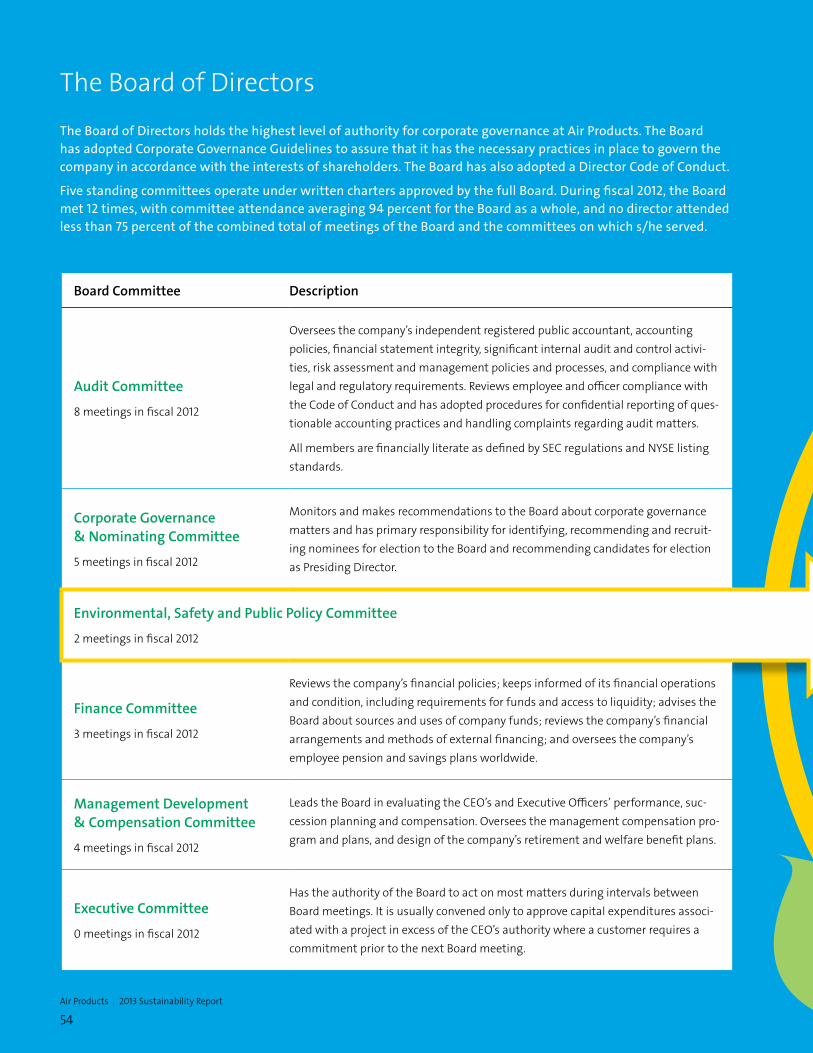
54Air Products | 2013 Sustainability Report
The Board of Directors
The Board of Directors holds the highest level of authority for corporate governance at Air Products. The Board has adopted Corporate Governance Guidelines to assure that it has the necessary practices in place to govern the company in accordance with the interests of shareholders. The Board has also adopted a Director Code of Conduct.
Five standing committees operate under written charters approved by the full Board. During fiscal 2012, the Board met 12 times, with committee attendance averaging 94 percent for the Board as a whole, and no director attended less than 75 percent of the combined total of meetings of the Board and the committees on which s/he served.
Board Committee Description
Audit Committee
8 meetings in fiscal 2012
Oversees the company’s independent registered public accountant, accounting policies, financial statement integrity, significant internal audit and control activi-ties, risk assessment and management policies and processes, and compliance with legal and regulatory requirements. Reviews employee and officer compliance with the Code of Conduct and has adopted procedures for confidential reporting of ques-tionable accounting practices and handling complaints regarding audit matters.
All members are financially literate as defined by SEC regulations and NYSE listing standards.
Corporate Governance & Nominating Committee
5 meetings in fiscal 2012
Monitors and makes recommendations to the Board about corporate governance matters and has primary responsibility for identifying, recommending and recruit-ing nominees for election to the Board and recommending candidates for election as Presiding Director.
Environmental, Safety and Public Policy Committee
2 meetings in fiscal 2012
Finance Committee
3 meetings in fiscal 2012
Reviews the company’s financial policies; keeps informed of its financial operations and condition, including requirements for funds and access to liquidity; advises the Board about sources and uses of company funds; reviews the company’s financial arrangements and methods of external financing; and oversees the company’s employee pension and savings plans worldwide.
Management Development & Compensation Committee
4 meetings in fiscal 2012
Leads the Board in evaluating the CEO’s and Executive Officers’ performance, suc-cession planning and compensation. Oversees the management compensation pro-gram and plans, and design of the company’s retirement and welfare benefit plans.
Executive Committee
0 meetings in fiscal 2012
Has the authority of the Board to act on most matters during intervals between Board meetings. It is usually convened only to approve capital expenditures associ-ated with a project in excess of the CEO’s authority where a customer requires a commitment prior to the next Board meeting.
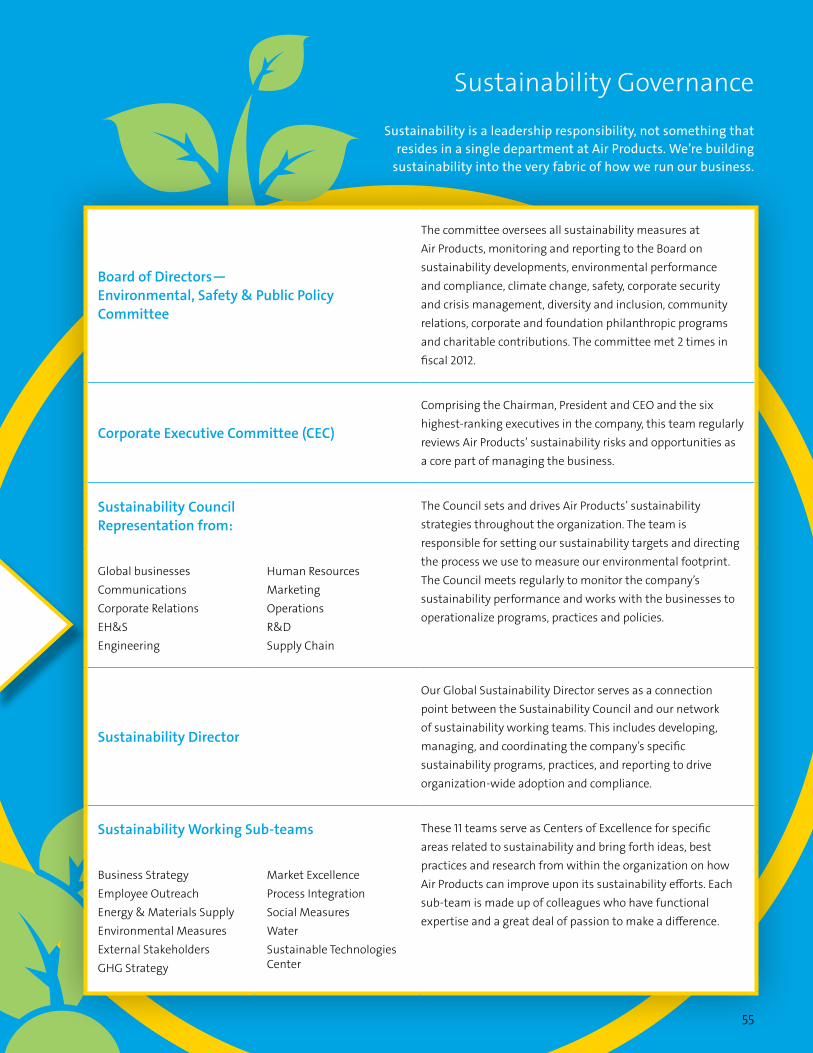
55
Sustainability Governance
Sustainability is a leadership responsibility, not something that resides in a single department at Air Products. We’re building
sustainability into the very fabric of how we run our business.
Board of Directors— Environmental, Safety & Public Policy Committee
The committee oversees all sustainability measures at Air Products, monitoring and reporting to the Board on sustainability developments, environmental performance and compliance, climate change, safety, corporate security and crisis management, diversity and inclusion, community relations, corporate and foundation philanthropic programs and charitable contributions. The committee met 2 times in fiscal 2012.
Corporate Executive Committee (CEC)
Comprising the Chairman, President and CEO and the six highest-ranking executives in the company, this team regularly reviews Air Products’ sustainability risks and opportunities as a core part of managing the business.
Sustainability Council Representation from:
The Council sets and drives Air Products’ sustainability strategies throughout the organization. The team is responsible for setting our sustainability targets and directing the process we use to measure our environmental footprint. The Council meets regularly to monitor the company’s sustainability performance and works with the businesses to operationalize programs, practices and policies.
Global businessesCommunicationsCorporate RelationsEH&SEngineering
Human ResourcesMarketingOperationsR&DSupply Chain
Sustainability Director
Our Global Sustainability Director serves as a connection point between the Sustainability Council and our network of sustainability working teams. This includes developing, managing, and coordinating the company’s specific sustainability programs, practices, and reporting to drive organization-wide adoption and compliance.
Sustainability Working Sub-teams These 11 teams serve as Centers of Excellence for specific areas related to sustainability and bring forth ideas, best practices and research from within the organization on how Air Products can improve upon its sustainability efforts. Each sub-team is made up of colleagues who have functional expertise and a great deal of passion to make a difference.
Business StrategyEmployee OutreachEnergy & Materials SupplyEnvironmental MeasuresExternal StakeholdersGHG Strategy
Market ExcellenceProcess IntegrationSocial MeasuresWaterSustainable Technologies Center

56Air Products | 2013 Sustainability Report
Responsible Sourcing
An interview with Mark Connar, Director, Source Process Enablement
Responsible sourcing lowers total cost, impacting our bottom line. It
reduces energy consumption, making a difference to the environment. It reduces risks to business disruption, enhancing our brand and reputation. And, it sparks product innovations, growing our top line. It’s just good business.”
Q How do we define “responsible sourcing”?
A Air Products’ supply strategy aligns with our business strat-
egy. We evaluate our sourcing practices against the four pillars of our sustain-ability model and look for supply part-nerships with companies that share our commitment to environmental stewardship, social responsibility, ethi-cal governance practices, and deliver-ing business value.
Q Why does responsible sourcing matter?
A This is not just a “nice to do,” it’s a “must have.” Responsible
sourcing lowers total cost, impacting our bottom line. It reduces energy con-sumption, making a difference to our environment. It reduces risk of busi-ness disruption, enhancing our brand and reputation. And, through produc-tive collaboration, it sparks product in-novations, growing our top line. Stated another way: Responsible sourcing is just good business.
Q Why is diversity among our supply base important?
A The mix of our business portfolio and global reach means that we
operate in diverse markets and serve diverse customer segments. Diversity in our supply base helps bring forward ideas and offerings that reflect the needs of the global communities in which operate. Our goal is to develop mutually beneficial business relation-ships with a diverse slate of compa-nies, irrespective of their ownership,
business size, or home location. We never compromise our standards with respect to qualifications, and seek from our suppliers the best quality, value and service at the best price.
Q How much of our annual pro-curement spend is allocated to
“local suppliers”?
A Every year, we purchase in excess of $6 billion in materials,
equipment, power and services from more than 30,000 suppliers worldwide. We break these suppliers down into three classifications: global, regional and local. Whether a supplier is local varies by country and region, so it is difficult to provide a quantitative an-swer to this question. Let me say that in the U.S., where we track suppliers based on specific business classifica-tion, almost 20 percent of our spend is with companies that the U.S. govern-
ment defines as small businesses (≤ 500 employees). Given the physi-cal structure of our company, these suppliers provide critical, cost-effective services and are often important em-ployers within the community.
Q How do we ensure that our sup-pliers comply with our policies?
A All suppliers and contractors are expected to comply with
our Global Code of Conduct (which includes updated human rights provi-sions), and our standard terms and conditions of purchase include respon-sible sourcing requirements. We have a robust supplier audit process that we use to assess performance of our direct material suppliers. When it comes to indirect procurement—capital pur-chases and indirect services—we use a performance scorecard approach that considers responsible sourcing factors, including sustainability, among other measures.

57
We back up our policies with action. 2012 was also a big year for contractor safety. We conducted over 220 site visits this year with top suppliers. In each of these visits, we audited safety performance to identify potential risks and then develop mitigation plans to address them. As a result, our contractor safety performance has improved by 20 percent year-over-year.
Q What about Air Products’ engagement with suppliers is
unique or especially well done?
A Air Products has established supplier sustainability expecta-
tions that include encouraging sup-pliers to reduce their GHG emissions and more. These expectations have been communicated via the company’s website and discussed during supplier meetings. Approximately 270 of our suppliers represent about half of Air Products’ annual procurement spend. We surveyed these suppliers in
2012 to understand their sustainability practices. More than 45 percent of the suppliers responded, and we found that nearly two-thirds of them have programs and/or goals aimed at reduc-ing greenhouse gas emissions, conserv-ing energy and improving efficiency. We are going to engage these suppliers in further dialogue to identify op-portunities to improve sustainability through our partnerships.

58Air Products | 2013 Sustainability Report
Product Life Cycle Assessments Before any product can go to market, we put it through the rigorous Offering Development and Introduction (ODI) process, which looks at EH&S considerations at each stage of product development, from concept through commercialization. We have integrated Green Chemistry concepts into this process and implemented a Green Product Analyzer to assess potential environmental, human and property impacts as well.
When there’s a major regulatory change or an acquisition expands our product portfolio, we use our Product Risk Review process to assess the life cycle of existing commercial products, from manufacturing through ultimate use and disposal.
We have a passion for safety—it’s core to who we are as a company. Part of our commitment is helping customers safely use and handle our products.
Responsible Care® is a chemical industry initiative to improve EH&S performance and respond to community concern. In 2012, Air Products supported the development of the new Process Safety and Product Safety Codes.
Product Safety
Product Transportation When it’s time for some of our higher-hazard materials to leave the manufacturing facility, we use our Transportation Risk Assessment (TRA) process to evaluate potential transit risks. This analysis includes a Process Safety review, evaluating package specifications and sizes, shipment frequency, route, carriers, emergency response capability, and elements of Responsible Care in the supply chain.
Our product security commitments include customer verification and transportation tracking. We use a Web-based travel tool that enables us to identify, locate and communicate with employees traveling with our products anywhere in the world.
During 2012, we had minor transportation-related fines totaling $17,200.
Product LabelingOnce our products get to our customers, we provide clear and easy-to-understand directions for their safe use and handling. All of our products comply with company requirements and governmental regulations for hazard communication information, specifically data sheets and labels. We are in the process of implementing the Globally Harmonized System (GHS) to define, classify and consistently communicate chemical hazards and safety information. We have converted many of our products to the GHS scheme in China, the EU, Singapore, Brazil, Korea, Japan and Taiwan, and we continue to prepare GHS in Canada and the U.S.
We did not receive any fines or citations related to product compliance issues during 2012.
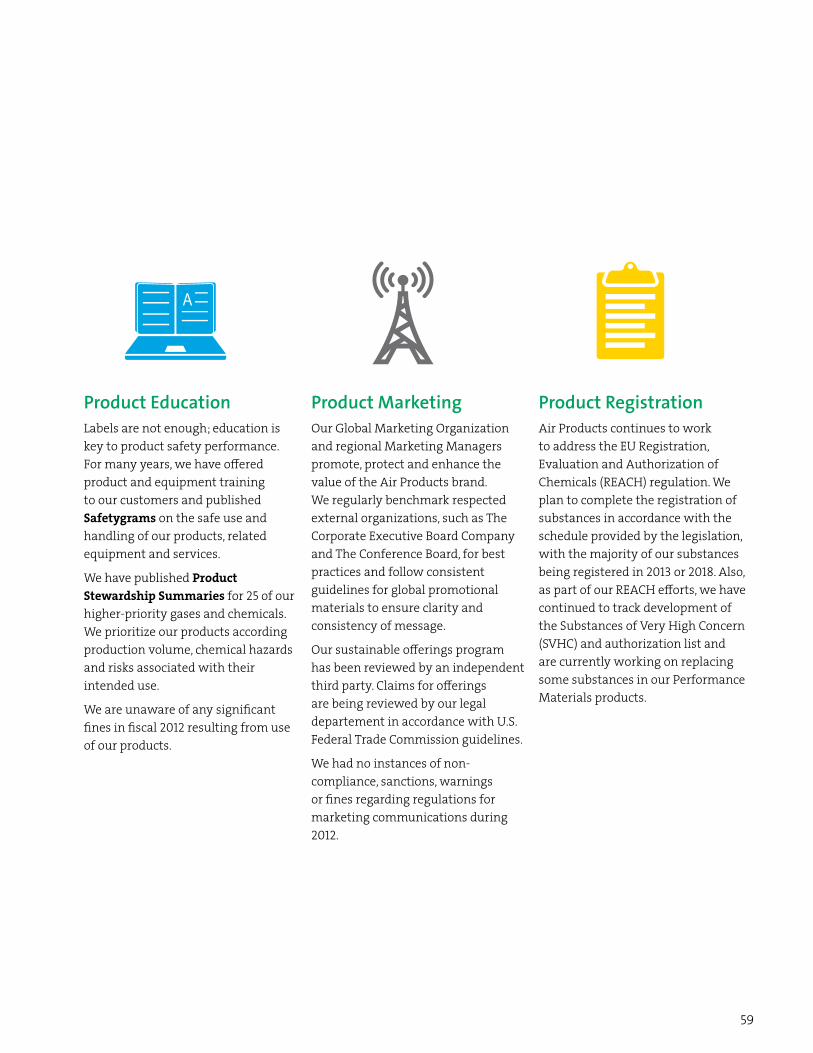
59
Product EducationLabels are not enough; education is key to product safety performance. For many years, we have offered product and equipment training to our customers and published Safetygrams on the safe use and handling of our products, related equipment and services.
We have published Product Stewardship Summaries for 25 of our higher-priority gases and chemicals. We prioritize our products according production volume, chemical hazards and risks associated with their intended use.
We are unaware of any significant fines in fiscal 2012 resulting from use of our products.
Product MarketingOur Global Marketing Organization and regional Marketing Managers promote, protect and enhance the value of the Air Products brand. We regularly benchmark respected external organizations, such as The Corporate Executive Board Company and The Conference Board, for best practices and follow consistent guidelines for global promotional materials to ensure clarity and consistency of message.
Our sustainable offerings program has been reviewed by an independent third party. Claims for offerings are being reviewed by our legal departement in accordance with U.S. Federal Trade Commission guidelines.
We had no instances of non-compliance, sanctions, warnings or fines regarding regulations for marketing communications during 2012.
Product RegistrationAir Products continues to work to address the EU Registration, Evaluation and Authorization of Chemicals (REACH) regulation. We plan to complete the registration of substances in accordance with the schedule provided by the legislation, with the majority of our substances being registered in 2013 or 2018. Also, as part of our REACH efforts, we have continued to track development of the Substances of Very High Concern (SVHC) and authorization list and are currently working on replacing some substances in our Performance Materials products.

60Air Products | 2013 Sustainability Report
A Calm in the Storm Sandy collided with the shores of New Jersey in October of 2012. In its wake, the hurricane left an estimated $68 billion in damage and more than 8.5 million people without power across 17 states. The potential for disruption to our business was significant, but thanks to Air Products’ emergency preparedness efforts, our operations safely continued through the storm.
Operating under a Global Crisis Management Plan, all of Air Products’ facilities have emergency response plans in place and con-duct mandatory training with employees. Our global and regional crisis management teams meet regularly and oversee annual and site-specific drills. This work is complemented by our 24/7 Global Security Operations Center and Employee Emergency Line.
Our response to Hurricane Sandy was enabled by a Response Plan that was developed based on our past experiences with hur-ricanes in the U.S. Gulf Coast. The plan outlines response processes to follow and captures organizational learning so our people on the ground can act fast.
“Our first priority in a storm of this magnitude is securing the safety of our employees and the communities in which we oper-ate,” said Jerry Hartman, Logistics Manager, Global Business Support Services. “We perform regular safety checks and monitor performance to anticipate possible disruptions. That way, if a part of our operations goes offline, we are ready to bring it back up safely and reliably.”
If supply is disrupted, we also prioritize our customer accounts, focusing on customers with critical needs, such as hospitals who rely on our medical gases to treat patients. Over the last few years, Air Products has also developed a new offering, supplying hy-drogen for hydrogen fuel cells, which are used as power backup in cell towers, providing a critical fueling service when the power grid goes down.
“The best offense is a good defense,” said Hartman. “As hurricane season starts, we proactively communicate with our employees and customers to educate them on ways we can work together to prepare for potential emergencies.”
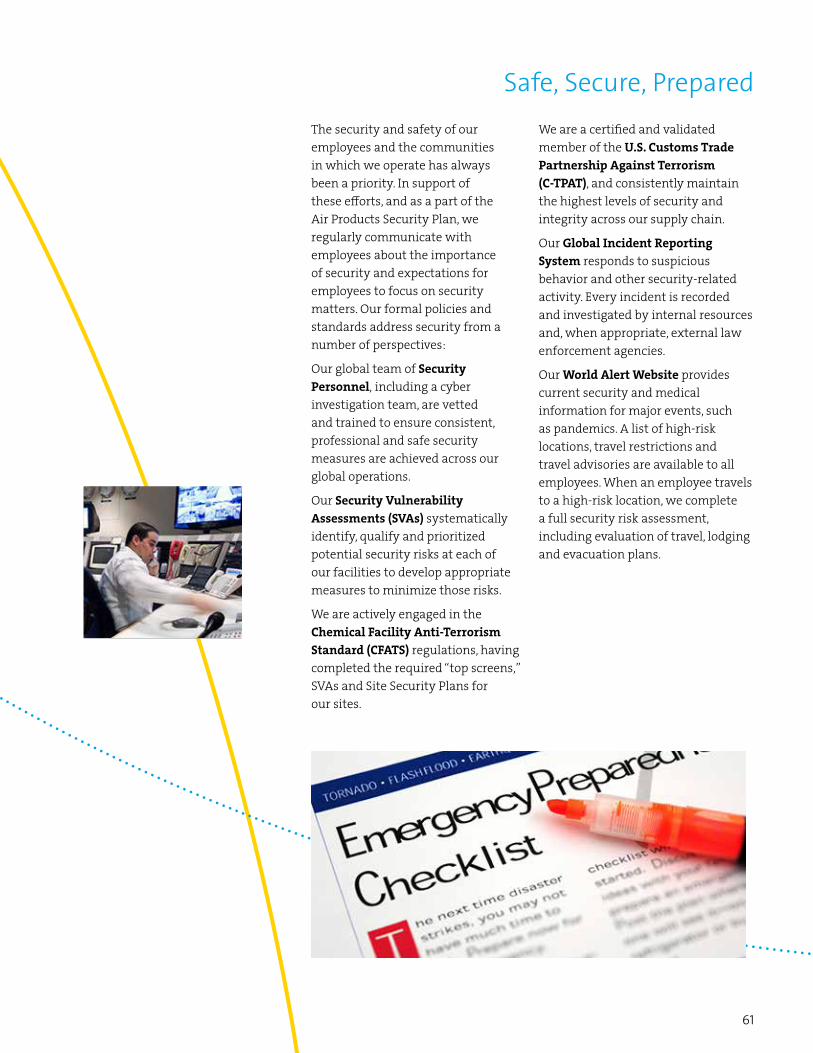
61
The security and safety of our employees and the communities in which we operate has always been a priority. In support of these efforts, and as a part of the Air Products Security Plan, we regularly communicate with employees about the importance of security and expectations for employees to focus on security matters. Our formal policies and standards address security from a number of perspectives:
Our global team of Security Personnel, including a cyber investigation team, are vetted and trained to ensure consistent, professional and safe security measures are achieved across our global operations.
Our Security Vulnerability Assessments (SVAs) systematically identify, qualify and prioritized potential security risks at each of our facilities to develop appropriate measures to minimize those risks.
We are actively engaged in the Chemical Facility Anti-Terrorism Standard (CFATS) regulations, having completed the required “top screens,” SVAs and Site Security Plans for our sites.
Safe, Secure, Prepared We are a certified and validated member of the U.S. Customs Trade Partnership Against Terrorism (C-TPAT), and consistently maintain the highest levels of security and integrity across our supply chain.
Our Global Incident Reporting System responds to suspicious behavior and other security-related activity. Every incident is recorded and investigated by internal resources and, when appropriate, external law enforcement agencies.
Our World Alert Website provides current security and medical information for major events, such as pandemics. A list of high-risk locations, travel restrictions and travel advisories are available to all employees. When an employee travels to a high-risk location, we complete a full security risk assessment, including evaluation of travel, lodging and evacuation plans.

62Air Products | 2013 Sustainability Report
Governance—2012 Numbers at a Glance
of employees have completed our Code of Conduct training
95% 86%
Board committee attendance averaged
of employees have been trained on Global Export Controls
94%
of employees have completed Global Competition Law training
90% 9,200employees have taken Information
Security training
More than
The Board of Directors met
12
322allegations of Code of Conduct violations were submitted in 2012, a significant
increase from 2011 due to better education and awareness training
confirmed incidents of corrupt behavior in our global organization in 2012
Zero
times in 2012
63
About This Sustainability ReportReport PeriodJanuary 1, 2012 to December 31, 2012 (except for fiscal year financials, as noted).
Most Recent Report2012 (covering data for 2011)
ContactFor questions about the data contained in this report, you may contact Air Products’ Corporate Sustainability Director, Julie O’Brien, at [email protected].
About This ReportWe have reported our sustainability performance for the past nine years, building on a previous decade of environmental, health and safety disclosures and reporting. The scope of this report is global, including assets over which financial control is exercised per the consolidated audited financial statements. We exclude less-than-controlling interests in joint ventures or equity affiliates. In 2012, Air Products’ largest acquisition was a majority stake in Indura S.A. Indura is reflected in the reporting of our number of employees, our CO2 data and the number of allegations of Code of Conduct violations. Additional acquisitions during the year are shown on pages 6–7.
We measure and report certain environmental measures on a calendar year basis, including greenhouse gases (GHGs), Toxic Release Inventory (U.S.) on- and off-site releases, nitrogen oxides (NOx) and sulfur oxides (SOx) emissions, hazardous waste shipments, and water and energy consumption.
As much as possible, we have guided readers to additional information, including our Sustainability site on airproducts.com, as well as other reports such as our annual financial reports on Form 10-K.
We are committed to transparency in our reporting and continuous improvement in our sustainability management and performance. The Corporate Sustainability Director was accountable for overseeing the preparation of this report, with significant data contributions provided by our Greenhouse Gases Strategy, Environmental Measures and Social Measures teams, as well as other business and functional groups throughout the company. No GRI sector standard exists for our industry (industrial gases/materials); however, we have attempted to provide the best possible disclosures based on the nature of our global business and the related risks and opportunities.
Our sustainability materiality matrix enables us to prioritize reporting topics within this report according to the various information needs of our stakeholders. Developed in 2010, this matrix shows the relationship of stakeholder interests rela-tive to our company’s sustainability risks and opportunities and encompasses all four pillars of Air Products’ sustainability framework. The company’s Sustainability Council reviews the materiality matrix at least once each year, and all elements identified in the matrix are covered in this report.
Data MeasurementWe use our single-instance SAP system for environmental and social data management and to drive performance improve-ments. We report key financial indicators in accordance with U.S. generally accepted accounting principles, disclosed in our financial filings. We report, classify, investigate and communicate safety (employee and contractor injuries and near misses) and environmental incidents via our Global Environmental, Health and Safety (EH&S) Incident Tracking system. We also use a Compliance Management SAP-compatible tool for environmental compliance management. We track and report esti-mated calendar-year GHG emissions on an aggregated, global basis in accordance with the WRI/WBCSD GHG Protocol using Financial Control reporting boundaries. Human resource (workforce) data are managed within SAP.
Appendix: Detailed Reporting
64Air Products | 2013 Sustainability Report
RestatementsGreenhouse Gas Emissions: We restated Scope 1 and Scope 2 GHG emissions for CY 2011, consistent with our Inventory Management Plan. In addition, prior to CY 2012, we estimated two categories of Scope 3 emissions; in CY 2012, we estimated 12 categories of Scope 3 emissions. See page 31 of this Report for details.
During 2012, we announced that we are exiting the polyurethane intermediates business (part of the Tonnage Gases seg-ment) and restructuring the photovoltaic business to reflect changing market conditions. See our 2012 Annual Report for more information.
Changes from Prior ReportingThere are no material changes to our 2013 sustainability reporting. Although the narrative structure of the report has changed to enable easier readability and access for various stakeholder groups, our 2013 Sustainability Report follows GRI G3.1 guidelines. We are in process of evaluating G4 guidelines for future reporting.
Profile and PerformanceSignificant Changes (2.9)In 2012, we took actions to rebalance our portfolio, exiting businesses that no longer fit our strategy and adding ones that do, particularly in emerging markets. Our acquisitions are highlighted in the main body of this report (see pages 6–7, 52–53).
We sold our Continental European homecare business due to the trends toward concentrator and non-oxygen therapies. We also announced the exit of our polyurethane intermediates business (PUI), including closure of a facility in Pasadena, Texas, and are restructuring our photovoltaic business to reflect changing market conditions.
Governance, Standards and EngagementAs one of the four pillars of our sustainability focus, much of our governance practices and performance is highlighted in the main body of this report (see pages 50–62).
Chair of the Board Of Directors (4.2)Mr. John E. McGlade is Chairman, President and CEO. The Board does not have a policy on whether the roles of Chairman of the Board and CEO should be separate or independent, and determines which structure is in the best interests of the com-pany at any given time. For more information, see “Board Leadership Structure” in Air Products’ Proxy Statement.
Independent Directors, Including Presiding Director (4.3)All of the company’s directors, including the Presiding Director, qualify as independent under the NYSE corporate governance listing standards. The Board has adopted guidelines to assist in determining each director’s independence which meet or exceed the NYSE independence requirements. For more information, see “Director Independence” in Air Products’ Proxy Statement.
Contacting the Board Of Directors (4.4)Available through the Corporate Secretary’s Office, the Board has a written procedure for collecting, organizing, and forward-ing direct communications from shareholders and other interested parties to the independent directors.
Compensation and Performance Alignment (4.5)The majority of our Named Executive Officers’ direct compensation in 2012 was variable, based on company and stock per-formance. Executive incentive compensation (annual and long-term incentive awards) is structured to reward performance that will increase the value of our shareholders’ long-term investment through disciplined capital investment, sustainable growth and superior returns. The compensation program balances financial results with other company values such as sus-tainability, continuous improvement, safety, diversity and ethical conduct. Accordingly, some components of the program provide flexibility to recognize non-financial achievements or to reduce or recoup compensation where insufficient atten-tion is paid to non-financial company objectives.
Detailed information about director and Executive Officer compensation is available in our most recent Proxy Statement.

65
Avoiding Conflicts of Interest (4.6)The Board has a formal process for reviewing related party transactions, which is articulated in the Proxy Statement. In addition, the Board has adopted its own Code of Conduct, which specifically focuses on areas of potential ethical risk and conflicts of interest relevant to directors.
The company also has a Code of Conduct for officers and employees accompanied by certification and mandatory training requirements. We enforce a strict non-retaliation policy and make a variety of options available, where permitted by local regulations, to anonymously report suspected violations, including our toll-free IntegrityLine and online reporting in local language. The reporting lines and web pages also address European Data Privacy concerns.
Determining Qualifications and Expertise of Directors (4.7)See page 33 of the Proxy Statement. The Corporate Governance and Nominating Committee has primary responsibility for identifying, recommending, and recruiting nominees for election and recommending candidates for election as Presiding Director. The Board follows practices outlined in the Corporate Governance Guidelines with respect to these matters.
Procedures for Overseeing Sustainability Performance (4.9)Sustainability-related topics are frequently discussed at Board meetings, with an annual review of the complete sustainabil-ity program by the Environmental, Safety and Public Policy Committee.
Process for Evaluating Board Directors’ Performance (4.10)Led by the Corporate Governance and Nominating Committee, the full Board assesses its performance annually, affording an opportunity to identify process improvements and increase directors’ engagement. In addition, a Board member’s attendance, diligence and contributions are considered each time s/he is recommended for re-election by shareholders.
The Governance Committee also establishes and oversees processes by which Board committees evaluate their performance vis-à-vis their charter responsibilities.
Precautionary Principle (4.11)We support the intent of the Precautionary Principle with respect to risk management. It is one consideration of our risk management program to identify potential impacts and develop action plans to mitigate those impacts.
Our risk assessment programs were successfully audited and validated in the U.S. by a third party under the American Chemistry Council’s Responsible Care Management System certification program. We have continued to implement these codes in our product development and operations. During 2012, our work continued on the International Council of Chemi-cal Association’s (ICCA) Global Product Strategy, which is aligned with the United Nations Strategic Approach to Interna-tional Chemicals Management as well as the American Chemistry Council’s Responsible Care.
External Standards (4.12)Air Products has incorporated the Responsible Care requirements of the American Chemistry Council (ACC) into the com-pany’s global Environmental, Health and Safety (EH&S) Management System. This has enabled us to meet ACC’s mandatory third-party certification requirements and certify 27 of our plants.
With RCMS requirements built into our EH&S Management System, we believe our system is consistent with the require-ments of ISO 140001. However, based on customers’ needs, we also have obtained ISO 140001 certification at nine facilities. We have also obtained ISO 15001 certifications for our facilities in Germany and Spain.
Because improving product quality, service and overall value to customers is at the heart of our strategy, we have adopted ISO 9000 as our model for quality assurance and obtained multiple ISO 9001 certifications. These certificates are available on our website.
66Air Products | 2013 Sustainability Report
Associations (4.13)In addition to the associations listed on page 12 in the main body of this report, Air Products maintains relationships with the following business and trade associations:
• AIChE Center for Sustainable Technology Practices
• Alternative Fuels Renewable Energies Council
• Carbon Disclosure Project
• Chemical Industries Association (U.K.)
• The Chlorine Institute, Inc. (U.S.)
• Conference Board
• Corporate EcoForum
• EPA and Department of Energy (DOE) ENERGY STAR program
• Initiative for Global Environmental Leadership
• Integrated CO2 Network (Canada)
• Lehigh Valley Bird Town Coalition
• Lehigh Valley Economic Development Corporation Sustainability Committee
• Lehigh Valley Sustainability Network
• MATGAS 2000 A.I.E.
• MAPI Sustainability Council
• National Hydrogen Association
• National Petrochemical and Refiners Association
• Red Española de Anállsis de Ciclo de Vida
• SEMI
• UK Renewable Energy Association
Economic DisclosureFinancial Implications Due to Climate Change (EC2)
See our Form 10-K (pages 10, 37) and most recent Carbon Disclosure Project submission for comprehensive disclosures on the risks and opportunities related to climate change.
Coverage of Defined Benefit Plan Obligations (EC3)Our talent strategy, which includes a total rewards approach to compensation, is highlighted in the Social Responsibility section of this report (see pages 41–42).
We sponsor defined benefit pension plans and defined contribution plans that cover a substantial portion of our global employees, with the largest plans being in the U.S. and the U.K. The U.S. Salaried Pension Plan and the U.K. Pension Plans are closed to new entrants. The largest plans are funded through a pension trust that is separate from the company’s assets; some of the other plans are insured through insurance contracts. We also maintain a non-qualified pension plan in the U.S. where benefits are paid from the company’s general assets. Pension liabilities related to the defined benefit plans are deter-mined using actuarial models.
In 2012, we used a measurement date of 30 September for all defined benefit plans. For 2012, the fair market value of pension plan assets for our defined benefit plans as of the measurement date increased to $3,239.1 million from $2,823.7 million in 2011. The projected benefit obligation for these plans as of the measurement date was $4,486.5 million and $3,765.5 million in 2012 and 2011, respectively. Note 15, Retirement Benefits, in the consolidated financial statements pro-vides detailed disclosures for post-retirement benefits.
67
Pension FundingPension funding includes both contributions to funded plans and benefit payments under unfunded plans. With respect to funded plans, our funding policy is that contributions, combined with appreciation and earnings, will be sufficient to pay benefits without creating unnecessary surpluses.
In addition, we make contributions to satisfy all legal funding requirements while managing our ability to benefit from tax deductions attributable to plan contributions. We analyze the liabilities and demographics of each plan, which helps to guide the level of contributions. During 2012 and 2011, our cash contributions to funded plans and benefit payments for unfunded plans were $76.4 million and $241.0 million, respectively. The majority of the cash contributions were voluntary.
Significant Financial Assistance from Government (EC4)We disclose this information in accordance with U.S. generally accepted accounting principles. See our Form 10-K (pages 87–90), which includes significant detail about our income tax liability.
Indirect Economic Impacts (EC9)While we have indirect impacts on local markets through wages, taxes, hiring, procurement, community involvement, finan-cial contributions and the like, we do not attempt to aggregate indirect economic impacts for our 750 production locations throughout the world.
Environmental DisclosureAs one of the four pillars of our sustainability focus, our environmental stewardship is highlighted in the main body of this report (see pages 24–39).
Recycled Input Materials (EN2)The vast majority of our products are based on air, which is considered by many to be a renewable resource. For our opera-tions that use material resources, the amount of recycled input is very small.
Scope 3 GHG Emissions (EN17)We expanded our reporting of Scope 3 emissions from three categories in 2011 to 12 categories in 2012. Two of the remain-ing categories within Scope 3 are not applicable to our business, and the final category cannot be reliably calculated due to the number of products we sell and their uses. Most emissions are calculated by members of our Sustainable Technologies Center using our LCA tool, SimaPro (see pages 22–23). The seemingly disproportionate increase in Scope 3 emissions is due to this expanded reporting.
Ozone Depleting Substances (EN19)Air Products does not manufacture or sell pure chlorofluorocarbons (CFCs) or methyl bromide. We also do not manufacture hydrochlorofluorocarbons (HCRCs); we sell different gas mixtures that contain small quantities of HCFCs and CFCs in cylin-ders for calibration of detection instruments, as allowed under the Montreal Protocol. In Poland and Spain, we are a refrig-erant distributor but also recover, recycle and reclaim for destruction. We are phasing out HCFCs. We have already phased out the use of CFCs in our own plant refrigeration systems, while eliminating the use of HCFCs completely in Europe and at other plants when refrigerant systems are replaced.
Products and Packaging Materials Reclaimed (EN27)Most of our products are consumed either through combustion or reaction or are atmospheric gases that can be safely vented after use. We supply the majority of materials in two-way bulk or semi-bulk containers or via pipelines, so packaging materials are not required.
For small-scale supply, cylinders are returned and reused. In our Electronics business, for example, 99 percent of the contain-ers we use are returnable, requiring little or no packaging materials. In 2012, we launched a steel drum recycling program at our U.S. Performance Materials facilities using EarthMinded® Life Cycle Services, a network of industrial drum and IBC reconditioners. In one year, we recycled nearly 5,000 drums and reused/recycled nearly 190,000 pounds of steel and over 14,000 pounds of plastic.
68Air Products | 2013 Sustainability Report
Labor Practice DisclosureHealthy, productive and respectful labor relations fall squarely under our commitment to Social Responsibility. Our perfor-mance in this area is highlighted in the Social Responsibility section of this report (see pages 38–49).
Operational Changes (LA5)Air Products addresses labor relations in our Human Rights Policy Statement. We have maintained good relationships with employees when significant change has occurred through timely, respectful, and compliant communications. We comply with all regulations regarding notice to employees in the countries where we do business. Remaining mindful of regulatory requirements, we communicate through a number of channels, including messages from leaders, our corporate intranet, webcasts, town talks, Ask Management online forums, and newsletters, among others.
Human Rights DisclosureWe follow the laws and regulations of every country in which we operate and strive to maintain positive relations with our employees and the communities in which we live and work. Our performance in this area is highlighted on pages 52–53 of this report.
Human Rights Grievances (HR11)Our Employee Code of Conduct specifically addresses our commitment to Human Rights and adherence to all relevant local laws pertaining to child labor and employee rights. Stakeholders may submit any grievances or concerns via our Integrity-Line or IntegrityOnline Web service. Employees are trained to take advantage of local resources to address any concerns and to use our formal reporting systems if they feel their concern cannot be adequately addressed at the local level. Additional internal reporting systems augment our IntegrityLine resources.
All of these systems are constantly monitored, and allegations are reviewed, referred to appropriate investigative resources, and then entered into a case management system where the progress of the investigation is monitored by an independent observer. During 2012, no allegations related to Human Rights as defined in Section HR 4-7 and 9 of this report were submit-ted via any of the reporting systems.
Society DisclosureAs one of the four pillars of our sustainability focus, our social responsibility is highlighted in the main body of this report (see pages 38–49).
Risk Assessment for Corruption (SO2)Our Corporate Risk Office gathers input from subject matter experts in all of our businesses and functional areas on risk ele-ments of our corporate activities to compile our Corporate Risk Matrix. Each group is asked to provide information about any risk elements in their area, including corruption. In addition, risk analyses are done to support entry into new geographies or markets, including assessments of the climate for corruption where an Air Products business unit is looking to engage in new business activity. Due diligence on potential private venture partners includes background information on any activi-ties that might fall under the category of corrupt business practices. We also perform an annual risk assessment for each of our existing Joint Ventures, and one of the risk factors that we evaluate is country risk as it relates to corruption and enforcement of rule of law. These activities collectively cover all of our core businesses. We reinforce our expectations for employee and supplier behavior via our Code of Conduct.
Anti-corruption Training (SO3)Employees are identified as candidates for Foreign Corrupt Practices Act (FCPA)/Anti-bribery training based upon the posi-tion they hold and where they are located. Of the required employees targeted globally for FCPA training, we have achieved a 98 percent completion rate. Training is available in 16 languages to facilitate understanding of this important topic. We also require all employees to complete a multiunit course on our Code of Conduct and Competition Law.

69
Anti-corruption Governance and Actions (SO4)Air Products takes a strong position on all violations of its Code of Conduct. We maintain telephone and Web-based allega-tion systems designed to be compliant with all local regulations and rulings. Stakeholders who wish to make allegations of violations in accordance with the Sarbanes-Oxley Act or our Code of Conduct can report their allegations, consistent with local regulations, to their local management, functional specialist or to our allegation system. All reported incidents and the related investigations are reviewed quarterly with our Corporate Investigation Council and annually with the Compli-ance and Risk Committee, which comprises senior executives, and with the Audit Committees of our Board of Directors. Air Products has had no confirmed incidents of corrupt behavior as defined under FCPA, and as a result, no employees were terminated or disciplined for incidents of corruption in the reporting period.
Public Policy Positions and Contributions to Political Parties (SO5-SO6)In accordance with our Policy on Political Contributions and Expenditures for Lobbying, Gifts and Travel for Government Officials, we will not use corporate funds to make direct or indirect political disbursements to candidates in any country or region, even where allowed by law. However, we do use our resources to advance matters of public policy by educating public officials about our business. We also use our resources to facilitate employee contributions.
Air Products uses a political action committee (PAC), whose membership comprises certain eligible Air Products employees who donate to it on a purely voluntary basis. The PAC makes contributions—reported to the Federal Election Commission and applicable state agencies—to U.S. candidates who support the company’s business interests. In 2012, Air Products’ PAC disbursements totaled $94,250.
The Environmental, Safety and Public Policy Committee of the Board of Directors monitors the company’s political activities through annual reports from members of management responsible for the activities.
Anti-competitive Behavior (SO7)Legal actions for anti-competitive behavior, antitrust and monopoly practices which are deemed to be material are reported as required in our Form 10-K (pages 14–15), Item 3, Legal Proceedings, for our fiscal year ending 30 September 2012.
Fines and Sanctions for Noncompliance (SO8)The value of fines for any environmental or safety issues are reported separately. Although there were no significant fines during the reporting period, incidents which could result in fines are pending. Any sanctions for noncompliance with laws and regulations which are deemed to be significant are reported as required in our Form 10-K (pages 14–15), Item 3, Legal Proceedings, for our fiscal year ending 30 September 2012.
Negative Impacts on Local Communities (SO9)We had no reports of significant potential or actual negative impacts on local communities.
Prevention and Mitigation (SO10)We have not needed to implement prevention and mitigation measures in local communities.

70Air Products | 2013 Sustainability Report
2012 2011 2010
Business ValueEconomic Performance
Sales (millions of dollars) $9,612 $9,674 $8,616
Operating income(A) (millions of dollars) $1,534 $1,557 $1,364
Net income attributable to Air Products(A) (millions of dollars) $1,159 $1,166 $1,002
Capital expenditures(A) (millions of dollars) $2,778 $1,539 $1,256
Return on average shareholders’ equity(A) (B) (millions of dollars) 18.70% 20.00% 19.40%
Operating margin(A) (millions of dollars) 16.00% 16.10% 15.80%
Per Share Dollars
Diluted earnings(A) 5.4 5.36 4.62
Dividends 2.5 2.23 1.92
Book value 30.48 27.57 25.94
Shareholders’ equity (millions of dollars) $6,477 $5,796 $5,547
Shares outstanding (in millions) 212 210 214
Shareholders 7,500 7,900 8,300
R&D spending (millions of dollars) $126.4 $118.8 $114.7
# Life cycle assessments (LCAs) performed for key offerings 15 9 2
Environmental product and process innovations introduced 62 84 44
Environmental StewardshipEnergy Consumption (MWh)
Total (MWh) 97,783,226 97,900,000 95,400,000
Natural gas (and refinery off-gas) 77,976,637 77,100,000 76,400,000
Electricity 19,415,027 18,900,000 17,300,000
Other 391,562 1,780,000 1,740,000
Energy Intensity
Air separation units 0.946 0.969 0.986
Hydrogen/carbon monoxide units 0.952 0.963 0.981
Greenhouse Gas Emissions
Scope 1 (MT CO2-e emitted) 14,767,209 14,100,000 14,400,000
Scope 2 (MT CO2-e emitted) 10,563,030 10,280,000 9,320,000
Scope 3 (MT CO2-e emitted) 10,046,000 132,000 97,200
GHG Intensity
Indexed GHG performance 0.854 0.885 0.944
Nitrogen oxides (NOx) (metric tons) 1273 1508 1611
Sulfur oxides (SOx) (metric tons) 116 165 177
TRI releases (millions of pounds) Not yet reported 1.12 1.18
US Fleet Emissions (2009 baseline = 1)
Carbon dioxide 0.89 0.89 0.98
Nitrogen oxides (NOx) 0.32 0.32 0.70
Particulate matter 0.14 0.22 0.64
Performance Data
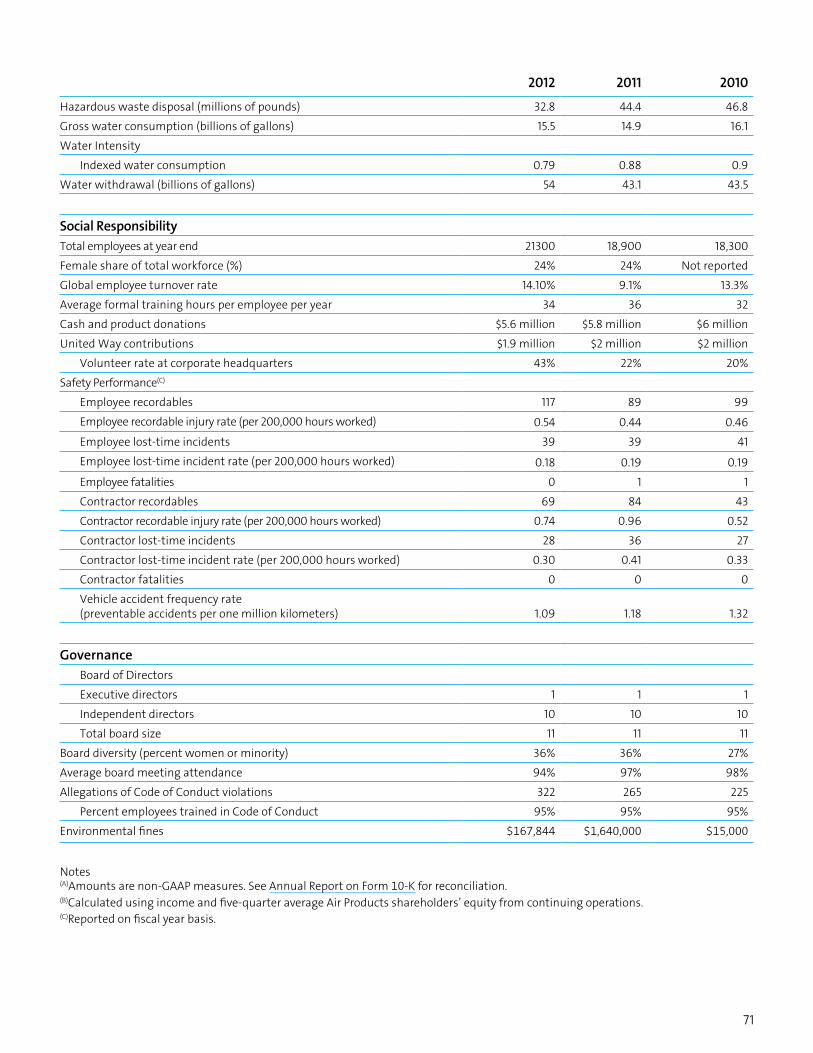
71
2012 2011 2010
Hazardous waste disposal (millions of pounds) 32.8 44.4 46.8
Gross water consumption (billions of gallons) 15.5 14.9 16.1
Water Intensity
Indexed water consumption 0.79 0.88 0.9
Water withdrawal (billions of gallons) 54 43.1 43.5
Social ResponsibilityTotal employees at year end 21300 18,900 18,300
Female share of total workforce (%) 24% 24% Not reported
Global employee turnover rate 14.10% 9.1% 13.3%
Average formal training hours per employee per year 34 36 32
Cash and product donations $5.6 million $5.8 million $6 million
United Way contributions $1.9 million $2 million $2 million
Volunteer rate at corporate headquarters 43% 22% 20%
Safety Performance(C)
Employee recordables 117 89 99
Employee recordable injury rate (per 200,000 hours worked) 0.54 0.44 0.46
Employee lost-time incidents 39 39 41
Employee lost-time incident rate (per 200,000 hours worked) 0.18 0.19 0.19
Employee fatalities 0 1 1
Contractor recordables 69 84 43
Contractor recordable injury rate (per 200,000 hours worked) 0.74 0.96 0.52
Contractor lost-time incidents 28 36 27
Contractor lost-time incident rate (per 200,000 hours worked) 0.30 0.41 0.33
Contractor fatalities 0 0 0
Vehicle accident frequency rate (preventable accidents per one million kilometers) 1.09 1.18 1.32
GovernanceBoard of Directors
Executive directors 1 1 1
Independent directors 10 10 10
Total board size 11 11 11
Board diversity (percent women or minority) 36% 36% 27%
Average board meeting attendance 94% 97% 98%
Allegations of Code of Conduct violations 322 265 225
Percent employees trained in Code of Conduct 95% 95% 95%
Environmental fines $167,844 $1,640,000 $15,000
Notes(A)Amounts are non-GAAP measures. See Annual Report on Form 10-K for reconciliation. (B)Calculated using income and five-quarter average Air Products shareholders’ equity from continuing operations.(C)Reported on fiscal year basis.

72Air Products | 2013 Sustainability Report
GRI Index
Report Line Content Where Is It? Notes/Comments Reported
1.1 CEO Message Pages 4–5 Fully reported—standard format Fully
1.2 Impacts, Risks, Opportunities Pages 4–5Pages 14–15
Pages 26–27
CEO letterOur Sustainability Commitment and 7 Trends Shaping Our WorldAccountable Performance, FY 2012 Performance
Fully
2.1 About Air Products Pages 6–7Page 9Page 21
Citizens of the WorldOperations at a GlanceDelivering Business Value—2012 Numbers at a Glance
Fully
2.2 Brands, Products, Services Pages 18–19Page 20
Products That Are Part of the SolutionOxyfuel Lowers CO2 Every Year
Fully
2.3 Operating Structure Pages 6–7Page 9
Citizen of the WorldOperations at a Glance
Fully
2.4 Corporate & Regional HQ locations Pages 6–7 Citizens of the World Fully
2.5 Countries of Operation Pages 6–7Page 9
Citizens of the WorldOperations at a Glance
Fully
2.6 Ownership Page 12 Ecosystem of Relationships—Investment Community Fully
2.7 Business Segments and Markets Page 8Page 9
Our Businesses and MarketsOperations at a Glance
Fully
2.8 Organizational Scale Pages 6–7Page 9Page 21
Citizen of the WorldOperations at a GlanceDelivering Business Value—2012 Numbers at a Glance
Fully
2.9 Significant Changes Pages 6–7Pages 50–51Page 64
Citizens of the WorldGovernance Detailed Appendix
Fully
2.10 Awards and Recognitions Page 13 Fully reported—standard format Fully
3.1 Report Period Page 63 Detailed Appendix—Report Period Fully
3.2 Most Recent Report Page 63 Detailed Appendix—Most Recent Report Fully
3.3 Reporting Cycle Page 63 Detailed Appendix—About This Report Fully
3.4 Report Questions Page 63 Detailed Appendix—About This Report Fully
3.5 Process for Defining Report Content Page 63 Detailed Appendix—About This Report Fully
3.6 Boundary of the Report Page 63 Detailed Appendix—About This Report Fully
3.7 Limitations on Report Scope Page 63 Detailed Appendix—About This Report Fully
3.8 Basis for Reporting That Can Significantly Affect Variability
Page 63 Detailed Appendix—About This Report Fully
3.9 Data Measurement Page 63 Detailed Appendix—Data Measurement Fully
3.10 Restatements Page 64 Detailed Appendix—Restatements Fully
3.11 Changes from Prior Reporting Page 64 Detailed Appendix—Changes from Prior Reporting Fully
3.12 GRI Index Pages 72–77 Detailed Appendix—GRI Index Fully
3.13 Assurance Page 78 Detailed Appendix Fully
4.1 Governance Structure Pages 54–55 Sustainability Governance Fully
4.2 Chair of Board of Directors Page 64 Detailed Appendix Fully
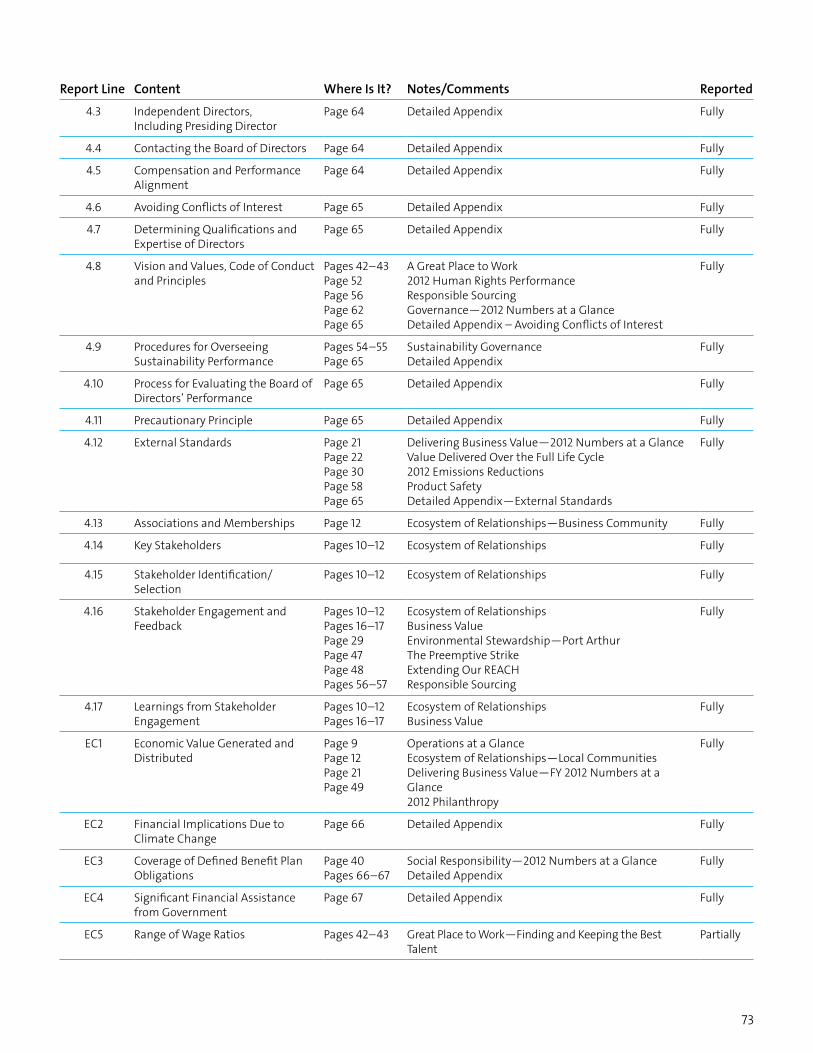
73
Report Line Content Where Is It? Notes/Comments Reported
4.3 Independent Directors, Including Presiding Director
Page 64 Detailed Appendix Fully
4.4 Contacting the Board of Directors Page 64 Detailed Appendix Fully
4.5 Compensation and Performance Alignment
Page 64 Detailed Appendix Fully
4.6 Avoiding Conflicts of Interest Page 65 Detailed Appendix Fully
4.7 Determining Qualifications and Expertise of Directors
Page 65 Detailed Appendix Fully
4.8 Vision and Values, Code of Conduct and Principles
Pages 42–43Page 52Page 56Page 62Page 65
A Great Place to Work2012 Human Rights PerformanceResponsible SourcingGovernance—2012 Numbers at a GlanceDetailed Appendix – Avoiding Conflicts of Interest
Fully
4.9 Procedures for Overseeing Sustainability Performance
Pages 54–55Page 65
Sustainability GovernanceDetailed Appendix
Fully
4.10 Process for Evaluating the Board of Directors’ Performance
Page 65 Detailed Appendix Fully
4.11 Precautionary Principle Page 65 Detailed Appendix Fully
4.12 External Standards Page 21Page 22Page 30Page 58Page 65
Delivering Business Value—2012 Numbers at a GlanceValue Delivered Over the Full Life Cycle2012 Emissions ReductionsProduct SafetyDetailed Appendix—External Standards
Fully
4.13 Associations and Memberships Page 12 Ecosystem of Relationships—Business Community Fully
4.14 Key Stakeholders Pages 10–12 Ecosystem of Relationships Fully
4.15 Stakeholder Identification/Selection
Pages 10–12 Ecosystem of Relationships Fully
4.16 Stakeholder Engagement and Feedback
Pages 10–12Pages 16–17Page 29Page 47Page 48Pages 56–57
Ecosystem of RelationshipsBusiness ValueEnvironmental Stewardship—Port ArthurThe Preemptive StrikeExtending Our REACHResponsible Sourcing
Fully
4.17 Learnings from Stakeholder Engagement
Pages 10–12Pages 16–17
Ecosystem of Relationships Business Value
Fully
EC1 Economic Value Generated and Distributed
Page 9Page 12Page 21Page 49
Operations at a GlanceEcosystem of Relationships—Local CommunitiesDelivering Business Value—FY 2012 Numbers at a Glance2012 Philanthropy
Fully
EC2 Financial Implications Due to Climate Change
Page 66 Detailed Appendix Fully
EC3 Coverage of Defined Benefit Plan Obligations
Page 40Pages 66–67
Social Responsibility—2012 Numbers at a GlanceDetailed Appendix
Fully
EC4 Significant Financial Assistance from Government
Page 67 Detailed Appendix Fully
EC5 Range of Wage Ratios Pages 42–43 Great Place to Work—Finding and Keeping the Best Talent
Partially
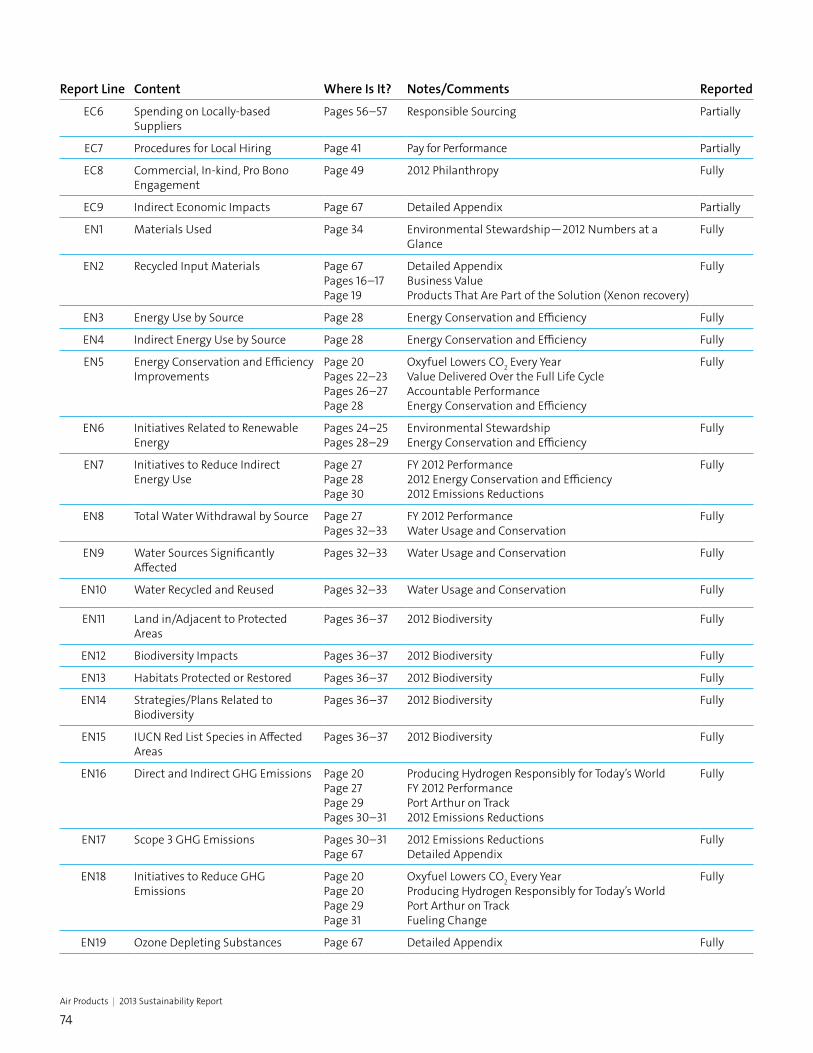
74Air Products | 2013 Sustainability Report
Report Line Content Where Is It? Notes/Comments Reported
EC6 Spending on Locally-based Suppliers
Pages 56–57 Responsible Sourcing Partially
EC7 Procedures for Local Hiring Page 41 Pay for Performance Partially
EC8 Commercial, In-kind, Pro Bono Engagement
Page 49 2012 Philanthropy Fully
EC9 Indirect Economic Impacts Page 67 Detailed Appendix Partially
EN1 Materials Used Page 34 Environmental Stewardship—2012 Numbers at a Glance
Fully
EN2 Recycled Input Materials Page 67Pages 16–17Page 19
Detailed AppendixBusiness ValueProducts That Are Part of the Solution (Xenon recovery)
Fully
EN3 Energy Use by Source Page 28 Energy Conservation and Efficiency Fully
EN4 Indirect Energy Use by Source Page 28 Energy Conservation and Efficiency Fully
EN5 Energy Conservation and Efficiency Improvements
Page 20Pages 22–23Pages 26–27Page 28
Oxyfuel Lowers CO2 Every YearValue Delivered Over the Full Life CycleAccountable PerformanceEnergy Conservation and Efficiency
Fully
EN6 Initiatives Related to Renewable Energy
Pages 24–25Pages 28–29
Environmental StewardshipEnergy Conservation and Efficiency
Fully
EN7 Initiatives to Reduce Indirect Energy Use
Page 27Page 28Page 30
FY 2012 Performance2012 Energy Conservation and Efficiency2012 Emissions Reductions
Fully
EN8 Total Water Withdrawal by Source Page 27Pages 32–33
FY 2012 PerformanceWater Usage and Conservation
Fully
EN9 Water Sources Significantly Affected
Pages 32–33 Water Usage and Conservation Fully
EN10 Water Recycled and Reused Pages 32–33 Water Usage and Conservation Fully
EN11 Land in/Adjacent to Protected Areas
Pages 36–37 2012 Biodiversity Fully
EN12 Biodiversity Impacts Pages 36–37 2012 Biodiversity Fully
EN13 Habitats Protected or Restored Pages 36–37 2012 Biodiversity Fully
EN14 Strategies/Plans Related to Biodiversity
Pages 36–37 2012 Biodiversity Fully
EN15 IUCN Red List Species in Affected Areas
Pages 36–37 2012 Biodiversity Fully
EN16 Direct and Indirect GHG Emissions Page 20Page 27Page 29Pages 30–31
Producing Hydrogen Responsibly for Today’s WorldFY 2012 PerformancePort Arthur on Track2012 Emissions Reductions
Fully
EN17 Scope 3 GHG Emissions Pages 30–31Page 67
2012 Emissions ReductionsDetailed Appendix
Fully
EN18 Initiatives to Reduce GHG Emissions
Page 20Page 20Page 29Page 31
Oxyfuel Lowers CO2 Every YearProducing Hydrogen Responsibly for Today’s WorldPort Arthur on TrackFueling Change
Fully
EN19 Ozone Depleting Substances Page 67 Detailed Appendix Fully
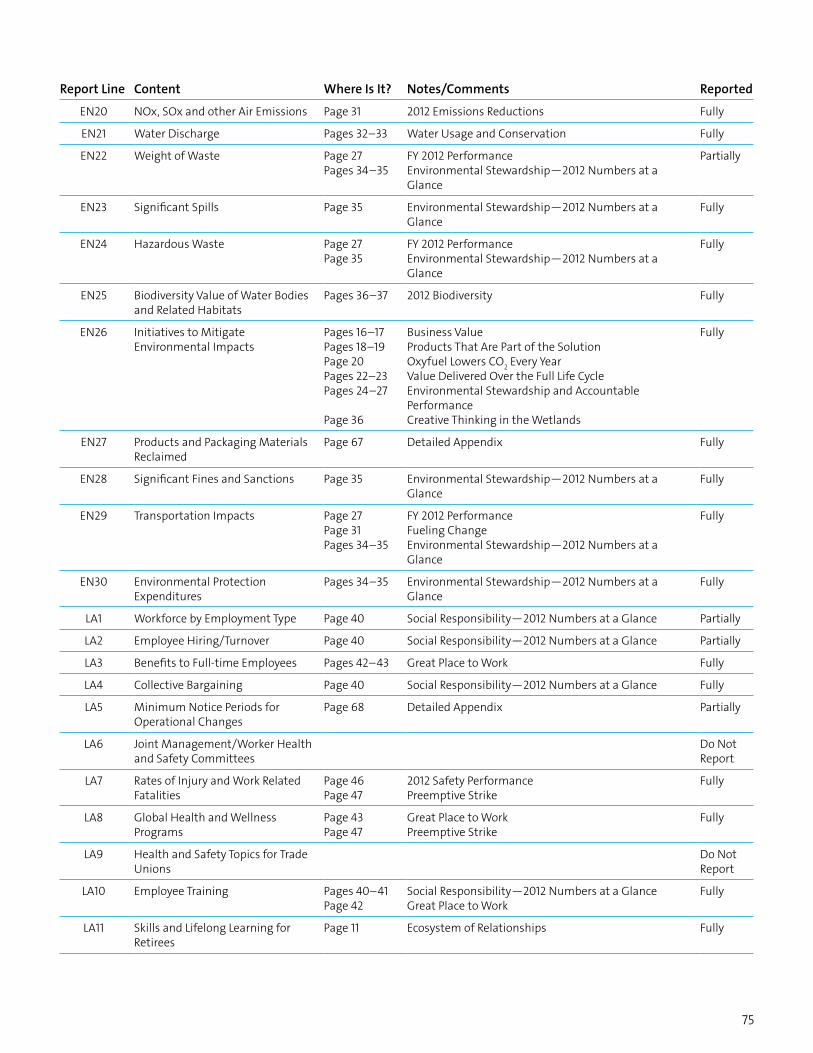
75
Report Line Content Where Is It? Notes/Comments Reported
EN20 NOx, SOx and other Air Emissions Page 31 2012 Emissions Reductions Fully
EN21 Water Discharge Pages 32–33 Water Usage and Conservation Fully
EN22 Weight of Waste Page 27Pages 34–35
FY 2012 PerformanceEnvironmental Stewardship—2012 Numbers at a Glance
Partially
EN23 Significant Spills Page 35 Environmental Stewardship—2012 Numbers at a Glance
Fully
EN24 Hazardous Waste Page 27Page 35
FY 2012 Performance Environmental Stewardship—2012 Numbers at a Glance
Fully
EN25 Biodiversity Value of Water Bodies and Related Habitats
Pages 36–37 2012 Biodiversity Fully
EN26 Initiatives to Mitigate Environmental Impacts
Pages 16–17Pages 18–19Page 20Pages 22–23Pages 24–27
Page 36
Business ValueProducts That Are Part of the SolutionOxyfuel Lowers CO2 Every YearValue Delivered Over the Full Life CycleEnvironmental Stewardship and Accountable PerformanceCreative Thinking in the Wetlands
Fully
EN27 Products and Packaging Materials Reclaimed
Page 67 Detailed Appendix Fully
EN28 Significant Fines and Sanctions Page 35 Environmental Stewardship—2012 Numbers at a Glance
Fully
EN29 Transportation Impacts Page 27Page 31Pages 34–35
FY 2012 PerformanceFueling ChangeEnvironmental Stewardship—2012 Numbers at a Glance
Fully
EN30 Environmental Protection Expenditures
Pages 34–35 Environmental Stewardship—2012 Numbers at a Glance
Fully
LA1 Workforce by Employment Type Page 40 Social Responsibility—2012 Numbers at a Glance Partially
LA2 Employee Hiring/Turnover Page 40 Social Responsibility—2012 Numbers at a Glance Partially
LA3 Benefits to Full-time Employees Pages 42–43 Great Place to Work Fully
LA4 Collective Bargaining Page 40 Social Responsibility—2012 Numbers at a Glance Fully
LA5 Minimum Notice Periods for Operational Changes
Page 68 Detailed Appendix Partially
LA6 Joint Management/Worker Health and Safety Committees
Do Not Report
LA7 Rates of Injury and Work Related Fatalities
Page 46Page 47
2012 Safety PerformancePreemptive Strike
Fully
LA8 Global Health and Wellness Programs
Page 43 Page 47
Great Place to Work Preemptive Strike
Fully
LA9 Health and Safety Topics for Trade Unions
Do Not Report
LA10 Employee Training Pages 40–41 Page 42
Social Responsibility—2012 Numbers at a Glance Great Place to Work
Fully
LA11 Skills and Lifelong Learning for Retirees
Page 11 Ecosystem of Relationships Fully

76Air Products | 2013 Sustainability Report
Report Line Content Where Is It? Notes/Comments Reported
LA12 Performance and Career Development Reviews
Pages 42–43 Great Place to Work Fully
LA13 Diversity and Inclusion Page 43Pages 44–45
Great Place to WorkOur Culture of Diversity and Inclusion
Partially
LA14 Equal Remuneration Page 41 Pay for Performance Partially
LA15 Parental Leave by Gender Page 42 Great Place to Work Partially
HR1 Investments/Contract Screening Pages 50–51 Governance Fully
HR2 Screening of Suppliers and Contractors
Pages 56–57 Responsible Sourcing Partially
HR3 Employee Training Page 52 2012 Human Rights Performance Fully
HR4 Incidents of Discrimination and Actions Taken
Page 52 2012 Human Rights Performance Fully
HR5 Right to Exercise Freedom of Association
Page 52 2012 Human Rights Performance Fully
HR6 Incidents of Child Labor Page 52 2012 Human Rights Performance Fully
HR7 Risk for Incidents of Forced Labor Page 52 2012 Human Rights Performance Fully
HR8 Security Training Page 58 Page 61
Responsible Care—Transportation Safety Safe, Secure, Prepared
Fully
HR9 Violations Involving Right of Indigenous People
Page 52 2012 Human Rights Performance Fully
HR10 Operations Subject to Human Rights Assessments
Page 52 2012 Human Rights Performance Partially
HR11 Grievances and Resolution Page 68 Detailed Appendix—Human Rights Grievances Fully
SO1 Community Engagement and Development
Page 12Pages 38–39Page 48Page 49
Ecosystem of RelationshipsSocial ResponsibilityExtending Our “REACH”2012 Philanthropy
Fully
SO2 Risk Assessment for Corruption Page 68 Detailed Appendix Fully
SO3 Anti-corruption Training Page 62Page 68
2012 Governance—Numbers at a GlanceDetailed Appendix
Fully
SO4 Anti-corruption Governance and Actions
Page 69 Detailed Appendix Fully
SO5 Public Policy Positions Page 69 Detailed Appendix Fully
SO6 Value of Contributions to Political Parties
Page 69 Detailed Appendix Partially
SO7 Anti-competitive Behavior Page 69 Detailed Appendix Fully
SO8 Fines and Sanctions for Noncompliance
Page 69 Detailed Appendix Fully
SO9 Negative Impacts on Local Communities
Page 69 Detailed Appendix Fully
SO10 Prevention and Mitigation Measures for Community Impacts
Page 69 Detailed Appendix Fully
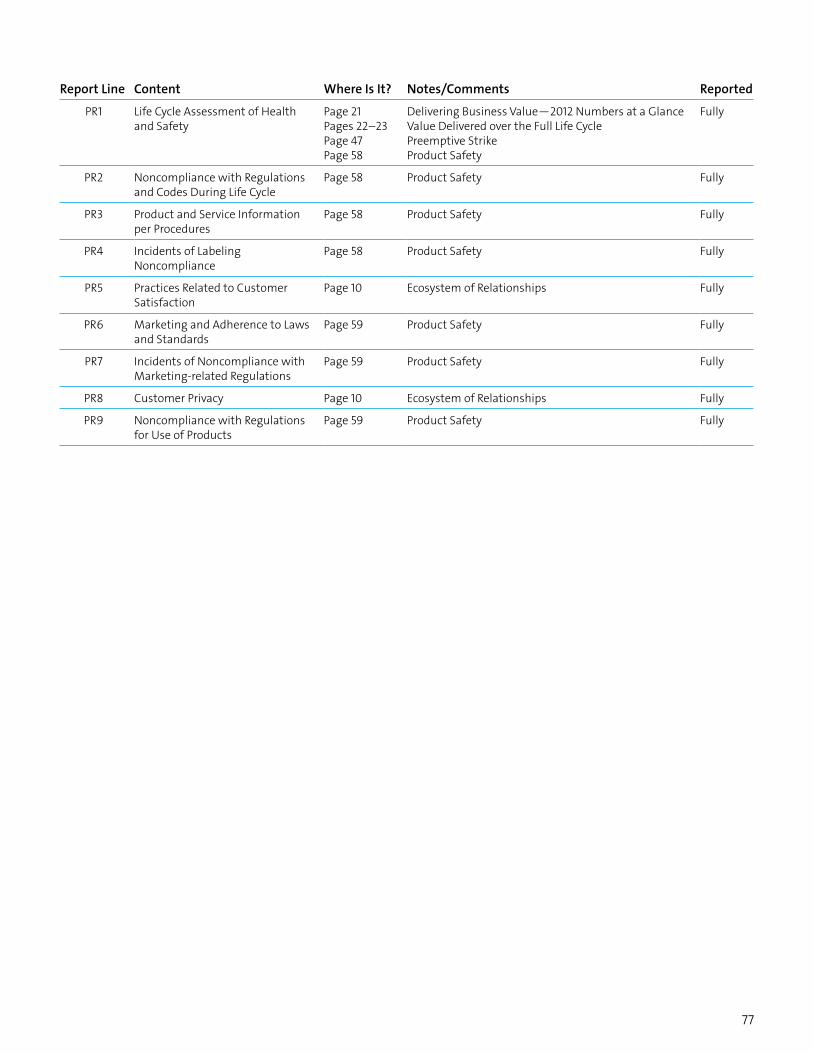
77
Report Line Content Where Is It? Notes/Comments Reported
PR1 Life Cycle Assessment of Health and Safety
Page 21 Pages 22–23Page 47Page 58
Delivering Business Value—2012 Numbers at a GlanceValue Delivered over the Full Life CyclePreemptive StrikeProduct Safety
Fully
PR2 Noncompliance with Regulations and Codes During Life Cycle
Page 58 Product Safety Fully
PR3 Product and Service Information per Procedures
Page 58 Product Safety Fully
PR4 Incidents of Labeling Noncompliance
Page 58 Product Safety Fully
PR5 Practices Related to Customer Satisfaction
Page 10 Ecosystem of Relationships Fully
PR6 Marketing and Adherence to Laws and Standards
Page 59 Product Safety Fully
PR7 Incidents of Noncompliance with Marketing-related Regulations
Page 59 Product Safety Fully
PR8 Customer Privacy Page 10 Ecosystem of Relationships Fully
PR9 Noncompliance with Regulations for Use of Products
Page 59 Product Safety Fully

78Air Products | 2013 Sustainability Report
AssuranceThis Sustainability Report was GRI-checked and affirmed as Application Level A+, with select financial and environmental data submitted for external assurance.
tell me moreairproducts.com
© Air Products and Chemicals, Inc., 2013 (36412) 900-12-123-US
The information contained herein is offered without charge for use by technically qualified personnel at their discretion and risk. All statements, technical information and recommendations contained herein are based on tests and data which we believe to be reliable, but the accuracy or completeness thereof is not guaranteed and no warranty of any kind is made with respect thereto.
For more information , please contact us at:
Corporate Headquarters Air Products and Chemicals, Inc. 7201 Hamilton Boulevard Allentown, PA 18195-1501 T 610-481-4911 (Outside the U.S. and Canada +1-610-481-6799) F 610-481-5900
Regional Head Offices Air Products PLC Hersham Place Technology Park Molesey Road Walton-on-Thames Surrey KT12 4RZ UK T +44-1932-249200 F +44-1932-249565
Air Products Chemicals Europe B.V. Kanaalweg 15, P.O. Box 3193 3502 GD Utrecht Netherlands T +31-30-2857100 F +31-30-2857111
Air Products Asia, Inc. 2503-5, 25/F 148 Electric Road, North Point Hong Kong T +852-2527-1922 F +852-2527-1827
Air Products Asia, Inc. 2 International Business Park #03-32 The Strategy Singapore 609930 T +65-6494-2240 F +65-6334-1005
Air Products and Chemicals (China) Investment Co. Ltd. East Wing, Floor 1 Building #88, Lane 887 Zu Chongzhi Road Zhangjiang Hi-Tech Park Shanghai, 201203 P.R. China T +86-21-38962000 F +86-21-50805555