Embed Size (px)
Citation preview

Count Place County Population
Total Year-
Round Units
Total
Affordable
Units
Affordable
Housing
Share
1 Abingdon KNOX 3394 1362 1139 83.6%
2 Addieville WASHINGTON 303 109 91 83.7%
3 Addison DUPAGE 36810 11980 3110 26.0%
4 Adeline OGLE 95 38 38 100.0%
5 Albany WHITESIDE 819 336 243 72.3%
6 Albers CLINTON 1084 360 224 62.3%
7 Albion EDWARDS 2251 896 756 84.4%
8 Aledo MERCER 3740 1460 1204 82.4%
9 Alexis WARREN 964 408 362 88.8%
10 Algonquin MCHENRY 29731 10103 784 7.8%
11 Alhambra MADISON 755 292 267 91.4%
12 Allendale WABASH 473 170 162 95.6%
13 Allenville MOULTRIE 131 68 65 95.4%
14 Allerton VERMILION 201 85 64 75.1%
15 Alma MARION 348 144 124 86.0%
16 Alorton ST. CLAIR 1690 620 526 84.9%
17 Alpha HENRY 554 263 224 85.1%
18 Alsey SCOTT 353 106 104 98.2%
19 Alsip COOK 19192 7580 4154 54.8%
20 Altamont EFFINGHAM 2151 813 741 91.1%
21 Alto Pass UNION 390 123 105 85.0%
22 Alton MADISON 28159 11303 9354 82.8%
23 Altona KNOX 455 199 173 86.9%
24 Alvan VERMILION 269 91 75 81.9%
25 Amboy LEE 2596 999 861 86.2%
26 Anchor MCLEAN 136 59 58 97.8%
27 Andalusia ROCK ISLAND 1252 452 375 83.0%
28 Andover HENRY 662 237 197 83.0%
29 Anna UNION 4530 1770 1366 77.2%
30 Annawan town HENRY 1017 423 351 82.9%
31 Antioch LAKE 13919 4845 1740 35.9%
32 Apple River JO DAVIESS 384 157 146 92.8%
33 Arcola DOUGLAS 2766 1011 852 84.3%
34 Arenzville CASS 380 149 124 83.3%
35 Argenta MACON 904 373 309 82.8%
36 Arlington Heights COOK 75094 29767 3896 13.1%
37 Arlington BUREAU 180 69 57 83.1%
38 Armington TAZEWELL 373 136 124 90.9%
39 Aroma Park KANKAKEE 757 286 232 81.1%
40 Arrowsmith MCLEAN 412 143 137 96.0%
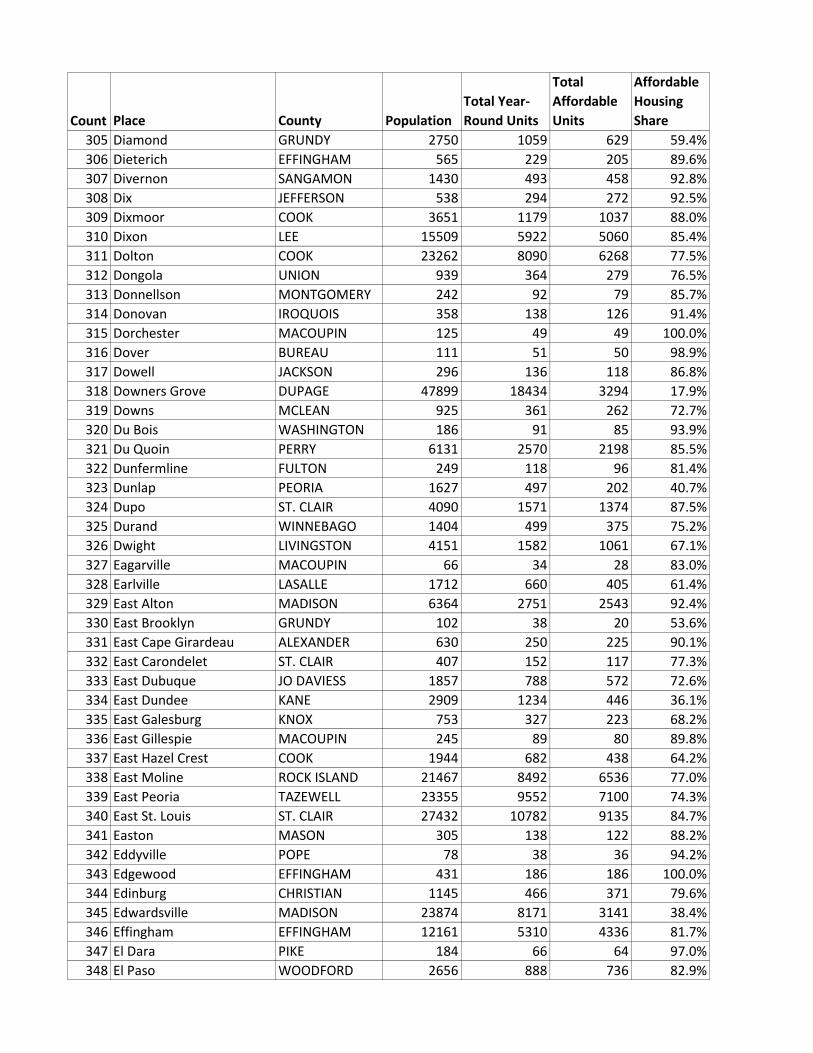
Affordable Housing Planning and Appeal Act:
2013 Report on Statewide Local Government Affordability
Alphabetical
(determination based on 2011 American Community Survey, 5-year Estimate)

Count Place County Population
Total Year-
Round Units
Total
Affordable
Units
Affordable
Housing
Share
41 Arthur DOUGLAS 2478 988 816 82.6%
42 Ashkum IROQUOIS 650 258 162 62.8%
43 Ashland CASS 1411 497 359 72.3%
44 Ashley WASHINGTON 518 237 232 97.9%
45 Ashmore COLES 822 322 278 86.4%
46 Ashton LEE 976 394 332 84.3%
47 Assumption CHRISTIAN 1152 536 495 92.4%
48 Astoria town FULTON 1216 483 428 88.6%
49 Athens MENARD 2185 815 733 90.0%
50 Atkinson town HENRY 1078 478 425 88.8%
51 Atlanta LOGAN 1360 594 523 88.1%
52 Atwood PIATT 1161 493 447 90.6%
53 Auburn SANGAMON 4665 1770 1482 83.7%
54 Augusta HANCOCK 826 342 299 87.4%
55 Aurora KANE 194053 62127 22984 37.0%
56 Ava JACKSON 644 297 208 70.2%
57 Aviston CLINTON 1862 632 387 61.2%
58 Avon FULTON 713 283 239 84.6%
59 Baldwin RANDOLPH 436 148 136 91.6%
60 Banner FULTON 156 89 70 78.2%
61 Bannockburn LAKE 1549 269 18 6.7%
62 Bardolph MCDONOUGH 241 87 69 79.4%
63 Barrington Hills COOK 3847 1424 9 0.7%
64 Barrington COOK 10636 3969 327 8.2%
65 Barry PIKE 1583 577 518 89.8%
66 Bartelso CLINTON 640 204 167 81.8%
67 Bartlett DUPAGE 40583 13566 1209 8.9%
68 Bartonville PEORIA 6433 2627 2284 87.0%
69 Basco HANCOCK 120 57 57 100.0%
70 Batavia KANE 25828 9180 1042 11.4%
71 Batchtown CALHOUN 227 86 70 80.9%
72 Bath MASON 328 147 136 92.3%
73 Bay View Gardens WOODFORD 436 176 168 95.3%
74 Baylis PIKE 179 63 61 97.3%
75 Beach Park LAKE 13461 4516 2853 63.2%
76 Beardstown CASS 6199 2271 1636 72.0%
77 Beaverville IROQUOIS 408 154 129 83.5%
78 Beckemeyer CLINTON 1034 424 401 94.5%
79 Bedford Park COOK 640 222 55 24.8%
80 Beecher EFFINGHAM 438 170 169 99.4%
81 Beecher WILL 4790 1629 269 16.5%
82 Belgium VERMILION 471 179 160 89.5%
83 Belknap JOHNSON 81 30 27 90.0%
84 Belle Prairie town HAMILTON 128 46 18 39.9%

Count Place County Population
Total Year-
Round Units
Total
Affordable
Units
Affordable
Housing
Share
85 Belle Rive JEFFERSON 418 156 145 92.9%
86 Belleville ST. CLAIR 44170 17799 13257 74.5%
87 Bellevue PEORIA 2046 811 671 82.7%
88 Bellflower MCLEAN 311 115 111 96.4%
89 Bellmont WABASH 249 106 96 90.3%
90 Bellwood COOK 19096 5849 3213 54.9%
91 Belvidere BOONE 25603 8473 5578 65.8%
92 Bement PIATT 1939 684 615 89.9%
93 Benld MACOUPIN 1721 710 667 94.0%
94 Bensenville DUPAGE 18537 6366 2104 33.0%
95 Benson WOODFORD 398 164 151 92.1%
96 Bentley town HANCOCK 22 12 11 88.9%
97 Benton FRANKLIN 7150 2850 2190 76.8%
98 Berkeley COOK 5186 1847 744 40.3%
99 Berlin SANGAMON 172 67 67 100.0%
100 Berwyn COOK 56027 18377 6812 37.1%
101 Bethalto MADISON 9525 3685 2595 70.4%
102 Bethany MOULTRIE 1315 527 485 92.1%
103 Big Rock KANE 1113 428 49 11.4%
104 Biggsville HENDERSON 342 152 147 97.0%
105 Bingham FAYETTE 107 26 16 60.8%
106 Bishop Hill HENRY 91 46 37 80.2%
107 Bismarck VERMILION 596 242 154 63.5%
108 Blandinsville MCDONOUGH 642 323 267 82.7%
109 Bloomingdale DUPAGE 21952 8782 983 11.2%
110 Bloomington MCLEAN 75757 30126 19775 65.6%
111 Blue Island COOK 23520 7698 5293 68.8%
112 Blue Mound MACON 1452 519 454 87.4%
113 Bluffs SCOTT 727 258 233 90.2%
114 Bluford JEFFERSON 608 240 212 88.5%
115 Bolingbrook WILL 73223 21962 4661 21.2%
116 Bondville CHAMPAIGN 561 235 159 67.5%
117 Bone Gap EDWARDS 206 78 72 92.6%
118 Bonfield KANKAKEE 272 113 50 44.1%
119 Bonnie JEFFERSON 441 217 191 88.0%
120 Bourbonnais KANKAKEE 18431 6077 1654 27.2%
121 Bowen HANCOCK 547 198 164 83.0%
122 Braceville GRUNDY 887 323 271 83.9%
123 Bradford STARK 763 261 248 94.9%
124 Bradley KANKAKEE 15644 6195 3280 53.0%
125 Braidwood WILL 5848 2231 1516 67.9%
126 Breese CLINTON 4764 1743 1271 72.9%
127 Bridgeport LAWRENCE 2010 948 812 85.7%
128 Bridgeview COOK 16282 5581 2773 49.7%

Count Place County Population
Total Year-
Round Units
Total
Affordable
Units
Affordable
Housing
Share
129 Brighton MACOUPIN 2030 787 700 88.9%
130 Brimfield PEORIA 828 310 277 89.2%
131 Broadlands CHAMPAIGN 300 118 97 81.9%
132 Broadview COOK 7928 3052 1678 55.0%
133 Broadwell LOGAN 194 84 69 82.1%
134 Brocton EDGAR 424 162 153 94.4%
135 Brookfield COOK 18775 7232 1413 19.5%
136 Brooklyn ST. CLAIR 495 198 179 90.5%
137 Brookport MASSAC 902 385 347 90.2%
138 Broughton HAMILTON 302 105 93 89.0%
139 Browning SCHUYLER 152 57 57 100.0%
140 Browns EDWARDS 105 52 52 100.0%
141 Brownstown FAYETTE 781 298 263 88.3%
142 Brussels CALHOUN 185 57 57 100.0%
143 Bryant FULTON 207 80 65 81.7%
144 Buckingham KANKAKEE 262 92 72 78.0%
145 Buckley IROQUOIS 607 223 193 86.7%
146 Buckner FRANKLIN 432 192 155 80.6%
147 Buda BUREAU 631 260 252 96.7%
148 Buffalo Grove LAKE 41735 16270 2969 18.2%
149 Buffalo SANGAMON 403 164 152 92.7%
150 Bull Valley MCHENRY 1082 427 22 5.0%
151 Bulpitt CHRISTIAN 364 126 113 89.7%
152 Buncombe JOHNSON 153 64 52 81.5%
153 Bunker Hill MACOUPIN 1874 723 640 88.5%
154 Burbank COOK 28655 8822 3066 34.8%
155 Bureau Junction BUREAU 281 124 109 87.9%
156 Burlington KANE 634 244 56 22.9%
157 Burnham COOK 4192 1529 1137 74.4%
158 Burnt Prairie WHITE 58 27 26 95.8%
159 Burr Ridge DUPAGE 10539 3803 82 2.2%
160 Bush WILLIAMSON 266 101 92 91.0%
161 Bushnell MCDONOUGH 3111 1442 1179 81.7%
162 Butler MONTGOMERY 163 68 58 85.3%
163 Byron OGLE 3678 1326 933 70.3%
164 Cabery FORD 268 110 93 84.2%
165 Cahokia ST. CLAIR 15332 4960 4009 80.8%
166 Cairo ALEXANDER 2893 1258 1059 84.2%
167 Caledonia BOONE 223 62 28 45.3%
168 Calhoun RICHLAND 171 68 64 93.7%
169 Calumet COOK 36997 14184 11038 77.8%
170 Calumet Park COOK 7893 3047 2356 77.3%
171 Camargo DOUGLAS 501 176 136 77.2%
172 Cambria WILLIAMSON 1189 439 341 77.6%

Count Place County Population
Total Year-
Round Units
Total
Affordable
Units
Affordable
Housing
Share
173 Cambridge HENRY 2300 935 800 85.6%
174 Camden SCHUYLER 140 64 64 100.0%
175 Camp Point ADAMS 1431 555 494 89.0%
176 Campbell Hill JACKSON 353 163 133 81.5%
177 Campton Hills KANE 10920 3358 139 4.1%
178 Campus LIVINGSTON 157 47 43 90.9%
179 Canton FULTON 14810 5594 4194 75.0%
180 Cantrall SANGAMON 161 71 66 93.2%
181 Capron BOONE 1271 424 260 61.2%
182 Carbon Cliff ROCK ISLAND 2055 779 589 75.6%
183 Carbon Hill GRUNDY 439 146 128 87.4%
184 Carbondale JACKSON 25747 9253 3209 34.7%
185 Carlinville MACOUPIN 5550 2207 1961 88.8%
186 Carlock MCLEAN 605 233 210 90.3%
187 Carlyle CLINTON 3097 1356 1123 82.8%
188 Carmi WHITE 5412 2299 2066 89.9%
189 Carol Stream DUPAGE 39729 14040 2607 18.6%
190 Carpentersville KANE 37480 10892 5565 51.1%
191 Carrier Mills SALINE 1596 737 620 84.1%
192 Carrollton GREENE 2646 1220 966 79.2%
193 Carterville WILLIAMSON 5423 2228 1108 49.7%
194 Carthage HANCOCK 2599 1109 900 81.2%
195 Cary MCHENRY 18236 5886 407 6.9%
196 Casey CLARK 2678 1075 965 89.8%
197 Caseyville ST. CLAIR 4125 1632 1459 89.4%
198 Catlin VERMILION 2046 722 531 73.5%
199 Cave-In-Rock HARDIN 311 131 106 81.0%
200 Cedar Point LASALLE 204 86 74 85.9%
201 Cedarville STEPHENSON 679 263 202 76.9%
202 Central MARION 1197 469 380 80.9%
203 Centralia MARION 13133 5337 4147 77.7%
204 Centreville ST. CLAIR 5373 2031 1699 83.6%
205 Cerro Gordo PIATT 1322 498 415 83.4%
206 Chadwick CARROLL 408 195 176 90.2%
207 Champaign CHAMPAIGN 80223 31476 12437 39.5%
208 Chandlerville CASS 631 245 223 91.0%
209 Channahon WILL 12489 4007 684 17.1%
210 Chapin MORGAN 550 223 210 94.1%
211 Charleston COLES 21861 7632 3945 51.7%
212 Chatham SANGAMON 11299 4150 2228 53.7%
213 Chatsworth town LIVINGSTON 1205 499 449 89.9%
214 Chebanse KANKAKEE 1173 451 237 52.5%
215 Chenoa MCLEAN 1900 736 678 92.1%
216 Cherry Valley WINNEBAGO 3285 1393 503 36.1%

Count Place County Population
Total Year-
Round Units
Total
Affordable
Units
Affordable
Housing
Share
217 Cherry BUREAU 343 156 122 78.4%
218 Chester RANDOLPH 8540 1970 1617 82.1%
219 Chesterfield MACOUPIN 143 70 69 98.6%
220 Chicago COOK 2700741 1017194 427428 42.0%
221 Chicago Heights COOK 30381 9492 7234 76.2%
222 Chicago Ridge COOK 14227 5630 3502 62.2%
223 Chillicothe PEORIA 6116 2426 2107 86.8%
224 Chrisman EDGAR 1286 510 443 86.9%
225 Christopher FRANKLIN 2792 1089 946 86.8%
226 Cicero town COOK 83598 21263 11318 53.2%
227 Cisco PIATT 271 96 77 80.0%
228 Cisne WAYNE 814 327 287 87.8%
229 Cissna Park IROQUOIS 886 410 358 87.4%
230 Claremont RICHLAND 213 111 99 88.8%
231 Clarendon Hills DUPAGE 8343 3084 340 11.0%
232 Clay CLAY 962 407 384 94.3%
233 Clayton ADAMS 707 238 232 97.6%
234 Clear Lake SANGAMON 195 85 79 93.2%
235 Cleveland HENRY 194 77 69 89.9%
236 Clifton IROQUOIS 1434 550 321 58.3%
237 Clinton DEWITT 7282 3111 2688 86.4%
238 Coal GRUNDY 5193 1922 1252 65.1%
239 Coal Valley ROCK ISLAND 3576 1380 699 50.6%
240 Coalton MONTGOMERY 295 133 122 91.9%
241 Coatsburg ADAMS 159 60 55 91.7%
242 Cobden UNION 1171 428 373 87.2%
243 Coffeen MONTGOMERY 476 225 201 89.4%
244 Colchester MCDONOUGH 1221 557 446 80.1%
245 Coleta WHITESIDE 187 66 64 96.4%
246 Colfax MCLEAN 1023 391 367 93.8%
247 Collinsville MADISON 25433 11165 8132 72.8%
248 Colona HENRY 4953 1989 1643 82.6%
249 Colp WILLIAMSON 235 70 57 82.0%
250 Columbia MONROE 9588 3587 1398 39.0%
251 Columbus ADAMS 120 38 37 97.0%
252 Compton LEE 309 123 101 82.5%
253 Concord MORGAN 123 67 63 93.5%
254 Congerville WOODFORD 494 175 109 62.4%
255 Cooksville MCLEAN 147 76 72 94.4%
256 Cordova ROCK ISLAND 704 274 182 66.5%
257 Cornell LIVINGSTON 507 187 176 94.2%
258 Cortland town DEKALB 4107 1250 481 38.5%
259 Coulterville RANDOLPH 932 377 336 89.2%
260 Country Club Hills COOK 16401 5741 3321 57.9%

Count Place County Population
Total Year-
Round Units
Total
Affordable
Units
Affordable
Housing
Share
261 Countryside COOK 5852 2138 912 42.6%
262 Cowden SHELBY 620 221 203 91.6%
263 Crainville WILLIAMSON 1220 517 350 67.6%
264 Creal Springs WILLIAMSON 702 290 274 94.5%
265 Crescent IROQUOIS 595 265 222 83.8%
266 Crest Hill WILL 20472 7843 4203 53.6%
267 Creston OGLE 655 214 134 62.8%
268 Crestwood COOK 10915 4556 2872 63.0%
269 Crete WILL 8397 3282 974 29.7%
270 Creve Coeur TAZEWELL 5282 2259 1974 87.4%
271 Crossville WHITE 759 332 301 90.6%
272 Crystal Lake MCHENRY 41027 14301 2966 20.7%
273 Cuba FULTON 1594 600 460 76.6%
274 Cullom LIVINGSTON 537 252 228 90.3%
275 Curran SANGAMON 181 78 73 93.9%
276 Cutler PERRY 445 158 146 92.2%
277 Cypress JOHNSON 280 100 93 92.5%
278 Dahlgren HAMILTON 447 189 174 92.0%
279 Dakota STEPHENSON 671 217 183 84.1%
280 Dallas HANCOCK 1158 516 426 82.6%
281 Dalton MOULTRIE 482 177 159 89.6%
282 Dalzell BUREAU 758 307 182 59.4%
283 Damiansville CLINTON 560 215 160 74.5%
284 Dana LASALLE 265 92 89 96.7%
285 Danforth IROQUOIS 661 205 170 82.7%
286 Danvers MCLEAN 881 370 329 88.9%
287 Danville VERMILION 33044 12821 9411 73.4%
288 Darien DUPAGE 22142 8829 1224 13.9%
289 Davis Junction OGLE 2644 871 606 69.6%
290 Davis STEPHENSON 853 271 156 57.6%
291 Dawson SANGAMON 524 197 190 96.4%
292 De Land PIATT 556 196 175 89.0%
293 De Pue BUREAU 1951 660 550 83.3%
294 De Soto JACKSON 1488 640 437 68.3%
295 De Witt DEWITT 189 70 68 97.5%
296 Decatur MACON 76286 30944 23834 77.0%
297 Deer Creek TAZEWELL 614 259 204 78.7%
298 Deer Grove WHITESIDE 80 27 19 70.6%
299 Deer Park LAKE 3225 1158 37 3.2%
300 Deerfield LAKE 18458 6445 259 4.0%
301 DeKalb DEKALB 44273 14811 8323 56.2%
302 Delavan TAZEWELL 1572 643 569 88.6%
303 Des Plaines COOK 57909 21670 4919 22.7%
304 Detroit PIKE 109 41 27 66.6%
Count Place County Population
Total Year-
Round Units
Total
Affordable
Units
Affordable
Housing
Share
305 Diamond GRUNDY 2750 1059 629 59.4%
306 Dieterich EFFINGHAM 565 229 205 89.6%
307 Divernon SANGAMON 1430 493 458 92.8%
308 Dix JEFFERSON 538 294 272 92.5%
309 Dixmoor COOK 3651 1179 1037 88.0%
310 Dixon LEE 15509 5922 5060 85.4%
311 Dolton COOK 23262 8090 6268 77.5%
312 Dongola UNION 939 364 279 76.5%
313 Donnellson MONTGOMERY 242 92 79 85.7%
314 Donovan IROQUOIS 358 138 126 91.4%
315 Dorchester MACOUPIN 125 49 49 100.0%
316 Dover BUREAU 111 51 50 98.9%
317 Dowell JACKSON 296 136 118 86.8%
318 Downers Grove DUPAGE 47899 18434 3294 17.9%
319 Downs MCLEAN 925 361 262 72.7%
320 Du Bois WASHINGTON 186 91 85 93.9%
321 Du Quoin PERRY 6131 2570 2198 85.5%
322 Dunfermline FULTON 249 118 96 81.4%
323 Dunlap PEORIA 1627 497 202 40.7%
324 Dupo ST. CLAIR 4090 1571 1374 87.5%
325 Durand WINNEBAGO 1404 499 375 75.2%
326 Dwight LIVINGSTON 4151 1582 1061 67.1%
327 Eagarville MACOUPIN 66 34 28 83.0%
328 Earlville LASALLE 1712 660 405 61.4%
329 East Alton MADISON 6364 2751 2543 92.4%
330 East Brooklyn GRUNDY 102 38 20 53.6%
331 East Cape Girardeau ALEXANDER 630 250 225 90.1%
332 East Carondelet ST. CLAIR 407 152 117 77.3%
333 East Dubuque JO DAVIESS 1857 788 572 72.6%
334 East Dundee KANE 2909 1234 446 36.1%
335 East Galesburg KNOX 753 327 223 68.2%
336 East Gillespie MACOUPIN 245 89 80 89.8%
337 East Hazel Crest COOK 1944 682 438 64.2%
338 East Moline ROCK ISLAND 21467 8492 6536 77.0%
339 East Peoria TAZEWELL 23355 9552 7100 74.3%
340 East St. Louis ST. CLAIR 27432 10782 9135 84.7%
341 Easton MASON 305 138 122 88.2%
342 Eddyville POPE 78 38 36 94.2%
343 Edgewood EFFINGHAM 431 186 186 100.0%
344 Edinburg CHRISTIAN 1145 466 371 79.6%
345 Edwardsville MADISON 23874 8171 3141 38.4%
346 Effingham EFFINGHAM 12161 5310 4336 81.7%
347 El Dara PIKE 184 66 64 97.0%
348 El Paso WOODFORD 2656 888 736 82.9%

Count Place County Population
Total Year-
Round Units
Total
Affordable
Units
Affordable
Housing
Share
349 Elburn KANE 5461 1659 161 9.7%
350 Eldorado SALINE 4273 1738 1405 80.9%
351 Eldred GREENE 160 74 70 95.0%
352 Elgin KANE 108681 35624 13682 38.4%
353 Elizabeth JO DAVIESS 817 307 253 82.4%
354 Elizabethtown HARDIN 348 187 159 84.9%
355 Elk Grove COOK 33080 12898 2978 23.1%
356 Elkhart LOGAN 294 130 107 82.6%
357 Elkville JACKSON 993 373 270 72.4%
358 Elliott FORD 318 117 104 89.2%
359 Ellis Grove RANDOLPH 361 138 120 87.1%
360 Ellisville FULTON 109 40 31 77.5%
361 Ellsworth MCLEAN 242 80 78 97.5%
362 Elmhurst DUPAGE 43934 15505 1447 9.3%
363 Elmwood PEORIA 2333 836 740 88.5%
364 Elmwood Park COOK 24784 9200 2788 30.3%
365 Elsah JERSEY 630 76 29 37.8%
366 Elvaston HANCOCK 112 58 55 94.0%
367 Elwood WILL 2278 844 436 51.7%
368 Emden LOGAN 332 146 135 92.2%
369 Emington LIVINGSTON 128 55 53 97.0%
370 Energy WILLIAMSON 753 352 279 79.3%
371 Enfield WHITE 635 241 221 91.6%
372 Equality GALLATIN 697 303 281 92.9%
373 Erie WHITESIDE 1593 662 517 78.1%
374 Essex KANKAKEE 695 229 60 26.0%
375 Eureka WOODFORD 5265 1713 1314 76.7%
376 Evanston COOK 74149 28671 4426 15.4%
377 Evansville RANDOLPH 685 251 222 88.5%
378 Evergreen Park COOK 19832 6817 2217 32.5%
379 Ewing FRANKLIN 261 117 95 81.3%
380 Exeter SCOTT 116 37 34 92.4%
381 Fairbury LIVINGSTON 3830 1539 1286 83.6%
382 Fairfield WAYNE 5418 2502 2028 81.0%
383 Fairmont ST. CLAIR 2592 791 646 81.7%
384 Fairmount VERMILION 601 216 193 89.2%
385 Fairview Heights ST. CLAIR 16757 6600 4035 61.1%
386 Fairview FULTON 432 163 152 93.0%
387 Farina FAYETTE 524 182 164 90.0%
388 Farmer DEWITT 1838 694 558 80.4%
389 Farmersville MONTGOMERY 858 376 290 77.1%
390 Farmington FULTON 2360 903 684 75.8%
391 Fayetteville ST. CLAIR 390 118 109 92.0%
392 Ferris HANCOCK 167 63 56 88.3%
Count Place County Population
Total Year-
Round Units
Total
Affordable
Units
Affordable
Housing
Share
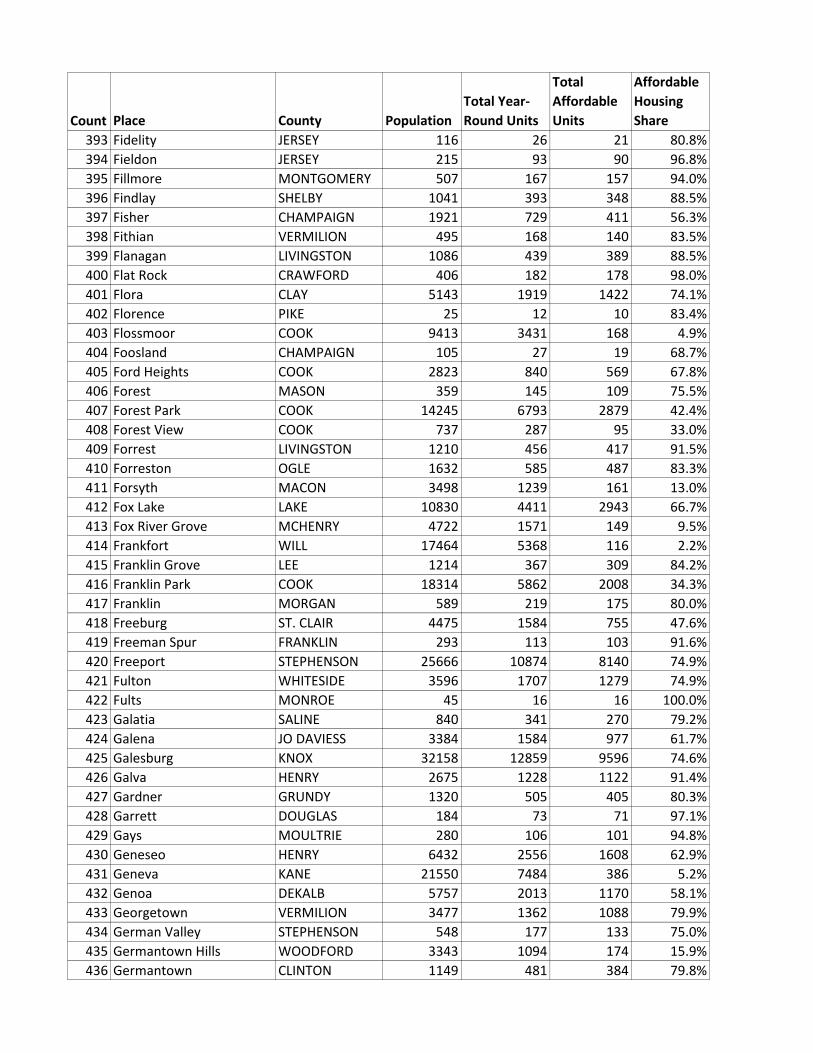
393 Fidelity JERSEY 116 26 21 80.8%
394 Fieldon JERSEY 215 93 90 96.8%
395 Fillmore MONTGOMERY 507 167 157 94.0%
396 Findlay SHELBY 1041 393 348 88.5%
397 Fisher CHAMPAIGN 1921 729 411 56.3%
398 Fithian VERMILION 495 168 140 83.5%
399 Flanagan LIVINGSTON 1086 439 389 88.5%
400 Flat Rock CRAWFORD 406 182 178 98.0%
401 Flora CLAY 5143 1919 1422 74.1%
402 Florence PIKE 25 12 10 83.4%
403 Flossmoor COOK 9413 3431 168 4.9%
404 Foosland CHAMPAIGN 105 27 19 68.7%
405 Ford Heights COOK 2823 840 569 67.8%
406 Forest MASON 359 145 109 75.5%
407 Forest Park COOK 14245 6793 2879 42.4%
408 Forest View COOK 737 287 95 33.0%
409 Forrest LIVINGSTON 1210 456 417 91.5%
410 Forreston OGLE 1632 585 487 83.3%
411 Forsyth MACON 3498 1239 161 13.0%
412 Fox Lake LAKE 10830 4411 2943 66.7%
413 Fox River Grove MCHENRY 4722 1571 149 9.5%
414 Frankfort WILL 17464 5368 116 2.2%
415 Franklin Grove LEE 1214 367 309 84.2%
416 Franklin Park COOK 18314 5862 2008 34.3%
417 Franklin MORGAN 589 219 175 80.0%
418 Freeburg ST. CLAIR 4475 1584 755 47.6%
419 Freeman Spur FRANKLIN 293 113 103 91.6%
420 Freeport STEPHENSON 25666 10874 8140 74.9%
421 Fulton WHITESIDE 3596 1707 1279 74.9%
422 Fults MONROE 45 16 16 100.0%
423 Galatia SALINE 840 341 270 79.2%
424 Galena JO DAVIESS 3384 1584 977 61.7%
425 Galesburg KNOX 32158 12859 9596 74.6%
426 Galva HENRY 2675 1228 1122 91.4%
427 Gardner GRUNDY 1320 505 405 80.3%
428 Garrett DOUGLAS 184 73 71 97.1%
429 Gays MOULTRIE 280 106 101 94.8%
430 Geneseo HENRY 6432 2556 1608 62.9%
431 Geneva KANE 21550 7484 386 5.2%
432 Genoa DEKALB 5757 2013 1170 58.1%
433 Georgetown VERMILION 3477 1362 1088 79.9%
434 German Valley STEPHENSON 548 177 133 75.0%
435 Germantown Hills WOODFORD 3343 1094 174 15.9%
436 Germantown CLINTON 1149 481 384 79.8%

Count Place County Population
Total Year-
Round Units
Total
Affordable
Units
Affordable
Housing
Share
437 Gibson FORD 3394 1490 1221 81.9%
438 Gifford CHAMPAIGN 907 325 233 71.7%
439 Gilberts KANE 6303 2062 81 3.9%
440 Gillespie MACOUPIN 3231 1353 1209 89.3%
441 Gilman IROQUOIS 1914 710 578 81.5%
442 Girard MACOUPIN 2279 823 754 91.7%
443 Gladstone HENDERSON 317 136 132 97.2%
444 Glasford PEORIA 1068 420 375 89.3%
445 Glasgow SCOTT 154 65 65 100.0%
446 Glen Carbon MADISON 12778 4871 1272 26.1%
447 Glen Ellyn DUPAGE 27610 10464 1532 14.6%
448 Glencoe COOK 8666 2960 40 1.4%
449 Glendale Heights DUPAGE 33898 11291 3021 26.8%
450 Glenview COOK 44134 16002 1183 7.4%
451 Glenwood COOK 8875 3296 2066 62.7%
452 Godfrey MADISON 17893 7413 4818 65.0%
453 Godley WILL 931 264 217 82.3%
454 Golconda POPE 886 377 306 81.3%
455 Golden Gate WAYNE 55 36 32 88.9%
456 Golden ADAMS 740 301 274 91.0%
457 Golf COOK 566 162 1 0.8%
458 Good Hope MCDONOUGH 459 197 133 67.4%
459 Goodfield WOODFORD 979 341 141 41.5%
460 Goreville JOHNSON 1177 494 377 76.2%
461 Gorham JACKSON 318 109 100 91.6%
462 Grafton JERSEY 881 314 178 56.8%
463 Grand Ridge LASALLE 535 193 165 85.5%
464 Grand Tower JACKSON 497 186 163 87.7%
465 Grandview SANGAMON 1385 589 526 89.3%
466 Granite MADISON 30548 12489 11123 89.1%
467 Grant Park KANKAKEE 1573 564 136 24.2%
468 Grantfork MADISON 356 130 113 87.2%
469 Granville PUTNAM 1589 711 658 92.5%
470 Grayslake LAKE 20847 7576 2168 28.6%
471 Grayville WHITE 1841 831 782 94.1%
472 Green Oaks LAKE 3867 1189 28 2.3%
473 Green Valley TAZEWELL 714 230 221 96.2%
474 Greenfield GREENE 1491 631 548 86.9%
475 Greenup CUMBERLAND 1703 703 616 87.6%
476 Greenview MENARD 872 328 317 96.5%
477 Greenville BOND 7136 2239 1886 84.2%
478 Greenwood MCHENRY 195 72 18 25.5%
479 Gridley MCLEAN 1508 554 508 91.6%
480 Griggsville PIKE 1200 447 415 92.9%

Count Place County Population
Total Year-
Round Units
Total
Affordable
Units
Affordable
Housing
Share
481 Gulf Port HENDERSON 38 26 17 66.9%
482 Gurnee LAKE 31192 11303 3384 29.9%
483 Hainesville LAKE 3447 1194 557 46.6%
484 Hamburg CALHOUN 224 84 77 91.7%
485 Hamel MADISON 563 249 158 63.6%
486 Hamilton HANCOCK 2872 1129 933 82.6%
487 Hammond PIATT 451 227 220 96.9%
488 Hampshire KANE 5837 1902 376 19.8%
489 Hampton ROCK ISLAND 2253 785 452 57.6%
490 Hanaford FRANKLIN 270 108 94 86.9%
491 Hanna PEORIA 1321 518 425 82.1%
492 Hanover Park DUPAGE 37847 10775 3613 33.5%
493 Hanover JO DAVIESS 804 417 385 92.4%
494 Hardin CALHOUN 1142 428 384 89.7%
495 Harmon LEE 165 68 67 98.2%
496 Harrisburg SALINE 9050 3665 2715 74.1%
497 Harristown MACON 1347 502 446 88.8%
498 Hartford MADISON 1608 628 602 95.9%
499 Hartsburg LOGAN 233 92 92 99.8%
500 Harvard MCHENRY 8799 2835 2031 71.6%
501 Harvel MONTGOMERY 223 88 78 88.4%
502 Harvey COOK 25189 7527 5578 74.1%
503 Harwood Heights COOK 8519 3464 1105 31.9%
504 Havana MASON 3344 1420 1253 88.2%
505 Hawthorn Woods LAKE 7528 2513 40 1.6%
506 Hazel Crest COOK 14353 4944 2839 57.4%
507 Hebron MCHENRY 1090 400 303 75.7%
508 Hecker MONROE 468 188 165 87.8%
509 Henderson KNOX 391 150 112 74.9%
510 Hennepin PUTNAM 757 315 242 77.0%
511 Henning VERMILION 359 104 97 93.3%
512 Henry MARSHALL 2486 1007 924 91.8%
513 Herrick SHELBY 352 129 123 95.5%
514 Herrin WILLIAMSON 12408 5129 3809 74.3%
515 Herscher KANKAKEE 1692 573 337 58.8%
516 Hettick MACOUPIN 380 122 121 99.3%
517 Heyworth MCLEAN 2614 968 692 71.5%
518 Hickory Hills COOK 14002 4965 1575 31.7%
519 Hidalgo JASPER 109 38 38 98.9%
520 Highland MADISON 9543 3962 2605 65.8%
521 Highland Park LAKE 29983 11473 773 6.7%
522 Highwood LAKE 5440 1818 545 30.0%
523 Hillcrest OGLE 1154 396 336 84.9%
524 Hillsboro MONTGOMERY 7129 1788 1328 74.3%

Count Place County Population
Total Year-
Round Units
Total
Affordable
Units
Affordable
Housing
Share
525 Hillsdale ROCK ISLAND 528 229 210 91.8%
526 Hillside COOK 8106 2987 1301 43.6%
527 Hillview GREENE 171 41 39 94.3%
528 Hinckley DEKALB 2164 873 292 33.4%
529 Hindsboro DOUGLAS 360 122 117 95.7%
530 Hinsdale DUPAGE 16545 5373 226 4.2%
531 Hodgkins COOK 2696 806 611 75.8%
532 Hoffman Estates COOK 51608 18029 3703 20.5%
533 Hoffman CLINTON 544 186 183 98.2%
534 Holiday Hills MCHENRY 676 250 160 64.0%
535 Hollowayville BUREAU 44 20 19 95.8%
536 Homer Glen WILL 24534 7717 255 3.3%
537 Homer CHAMPAIGN 1042 441 380 86.1%
538 Hometown COOK 4337 1741 1630 93.6%
539 Homewood COOK 19463 7399 3296 44.5%
540 Hoopeston VERMILION 5627 1975 1603 81.2%
541 Hooppole HENRY 285 89 86 96.9%
542 Hopedale TAZEWELL 1024 387 332 85.7%
543 Hopewell MARSHALL 435 160 66 41.6%
544 Hopkins Park KANKAKEE 810 331 238 71.8%
545 Hoyleton WASHINGTON 557 187 175 93.3%
546 Hudson MCLEAN 1917 595 394 66.3%
547 Huey CLINTON 178 70 62 89.3%
548 Hull PIKE 435 179 152 85.1%
549 Humboldt COLES 333 144 108 74.8%
550 Hume EDGAR 443 197 176 89.3%
551 Huntley MCHENRY 22676 9318 1061 11.4%
552 Hurst WILLIAMSON 784 323 290 89.7%
553 Hutsonville CRAWFORD 590 197 188 95.6%
554 Illiopolis SANGAMON 854 353 337 95.5%
555 Ina JEFFERSON 2275 244 206 84.4%
556 Indian Creek LAKE 511 178 12 6.9%
557 Indian Head Park COOK 3799 1891 316 16.7%
558 Indianola VERMILION 258 100 94 93.9%
559 Industry MCDONOUGH 539 243 181 74.4%
560 Inverness COOK 7417 2754 48 1.7%
561 Iola CLAY 128 32 28 87.5%
562 Ipava FULTON 527 206 197 95.7%
563 Iroquois IROQUOIS 140 55 52 95.4%
564 Irving MONTGOMERY 371 152 146 95.8%
565 Irvington WASHINGTON 557 225 202 89.7%
566 Irwin KANKAKEE 89 28 20 72.4%
567 Island Lake MCHENRY 8173 2887 1000 34.6%
568 Itasca DUPAGE 8375 3221 422 13.1%

Count Place County Population
Total Year-
Round Units
Total
Affordable
Units
Affordable
Housing
Share
569 Iuka MARION 459 190 173 91.3%
570 Ivesdale CHAMPAIGN 273 110 101 92.3%
571 Jacksonville MORGAN 19423 7370 5337 72.4%
572 Jeffersonville WAYNE 470 192 172 89.4%
573 Jeisyville CHRISTIAN 136 59 58 99.1%
574 Jerome SANGAMON 1529 778 704 90.5%
575 Jerseyville JERSEY 8299 3352 3004 89.6%
576 Jewett CUMBERLAND 269 107 99 92.6%
577 Johnsburg MCHENRY 6328 2267 188 8.3%
578 Johnsonville WAYNE 59 19 19 100.0%
579 Johnston WILLIAMSON 3565 1323 1165 88.1%
580 Joliet WILL 146820 46486 22822 49.1%
581 Jonesboro UNION 1859 705 596 84.6%
582 Joppa MASSAC 378 128 112 87.1%
583 Joy MERCER 470 178 158 88.8%
584 Junction MARION 505 193 180 93.2%
585 Junction GALLATIN 154 60 54 90.0%
586 Justice COOK 12761 4630 1968 42.5%
587 Kampsville CALHOUN 348 158 158 100.0%
588 Kane GREENE 369 141 133 94.4%
589 Kaneville KANE 441 182 29 16.0%
590 Kangley LASALLE 372 114 102 89.1%
591 Kankakee KANKAKEE 27735 9432 6679 70.8%
592 Kansas EDGAR 987 360 328 91.2%
593 Kappa WOODFORD 353 113 79 69.6%
594 Karnak PULASKI 569 196 169 86.3%
595 Keenes WAYNE 81 39 32 81.8%
596 Keensburg WABASH 207 72 68 94.3%
597 Keithsburg MERCER 596 288 271 94.1%
598 Kell MARION 232 82 74 90.1%
599 Kempton FORD 227 90 81 90.2%
600 Kenilworth COOK 2565 785 4 0.5%
601 Kenney DEWITT 354 146 138 94.6%
602 Kewanee HENRY 12930 5085 4165 81.9%
603 Keyesport BOND 436 230 224 97.2%
604 Kilbourne MASON 238 109 94 86.1%
605 Kildeer LAKE 3933 1183 18 1.5%
606 Kincaid CHRISTIAN 1499 614 537 87.4%
607 Kinderhook PIKE 233 93 87 93.5%
608 Kingston Mines PEORIA 238 90 87 96.2%
609 Kingston DEKALB 1181 387 172 44.5%
610 Kinmundy MARION 961 379 360 95.0%
611 Kinsman GRUNDY 146 55 45 81.1%
612 Kirkland DEKALB 1748 601 415 69.0%
Count Place County Population
Total Year-
Round Units
Total
Affordable
Units
Affordable
Housing
Share
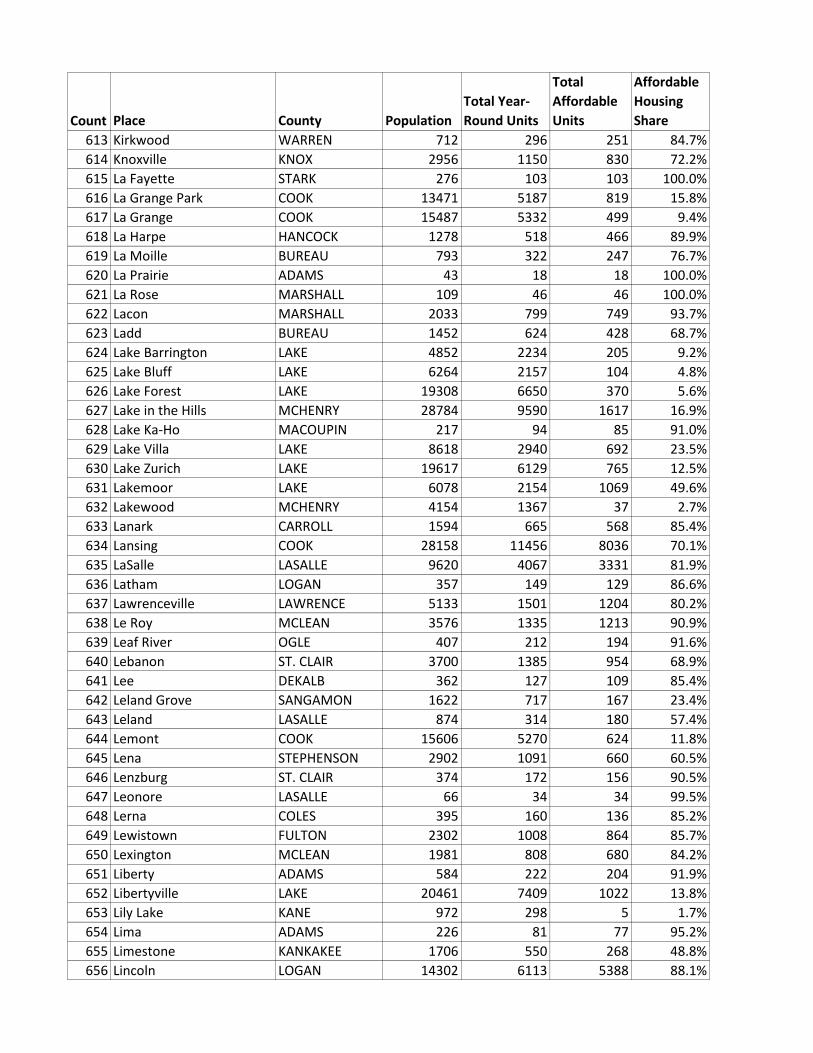
613 Kirkwood WARREN 712 296 251 84.7%
614 Knoxville KNOX 2956 1150 830 72.2%
615 La Fayette STARK 276 103 103 100.0%
616 La Grange Park COOK 13471 5187 819 15.8%
617 La Grange COOK 15487 5332 499 9.4%
618 La Harpe HANCOCK 1278 518 466 89.9%
619 La Moille BUREAU 793 322 247 76.7%
620 La Prairie ADAMS 43 18 18 100.0%
621 La Rose MARSHALL 109 46 46 100.0%
622 Lacon MARSHALL 2033 799 749 93.7%
623 Ladd BUREAU 1452 624 428 68.7%
624 Lake Barrington LAKE 4852 2234 205 9.2%
625 Lake Bluff LAKE 6264 2157 104 4.8%
626 Lake Forest LAKE 19308 6650 370 5.6%
627 Lake in the Hills MCHENRY 28784 9590 1617 16.9%
628 Lake Ka-Ho MACOUPIN 217 94 85 91.0%
629 Lake Villa LAKE 8618 2940 692 23.5%
630 Lake Zurich LAKE 19617 6129 765 12.5%
631 Lakemoor LAKE 6078 2154 1069 49.6%
632 Lakewood MCHENRY 4154 1367 37 2.7%
633 Lanark CARROLL 1594 665 568 85.4%
634 Lansing COOK 28158 11456 8036 70.1%
635 LaSalle LASALLE 9620 4067 3331 81.9%
636 Latham LOGAN 357 149 129 86.6%
637 Lawrenceville LAWRENCE 5133 1501 1204 80.2%
638 Le Roy MCLEAN 3576 1335 1213 90.9%
639 Leaf River OGLE 407 212 194 91.6%
640 Lebanon ST. CLAIR 3700 1385 954 68.9%
641 Lee DEKALB 362 127 109 85.4%
642 Leland Grove SANGAMON 1622 717 167 23.4%
643 Leland LASALLE 874 314 180 57.4%
644 Lemont COOK 15606 5270 624 11.8%
645 Lena STEPHENSON 2902 1091 660 60.5%
646 Lenzburg ST. CLAIR 374 172 156 90.5%
647 Leonore LASALLE 66 34 34 99.5%
648 Lerna COLES 395 160 136 85.2%
649 Lewistown FULTON 2302 1008 864 85.7%
650 Lexington MCLEAN 1981 808 680 84.2%
651 Liberty ADAMS 584 222 204 91.9%
652 Libertyville LAKE 20461 7409 1022 13.8%
653 Lily Lake KANE 972 298 5 1.7%
654 Lima ADAMS 226 81 77 95.2%
655 Limestone KANKAKEE 1706 550 268 48.8%
656 Lincoln LOGAN 14302 6113 5388 88.1%
Count Place County Population
Total Year-
Round Units
Total
Affordable
Units
Affordable
Housing
Share
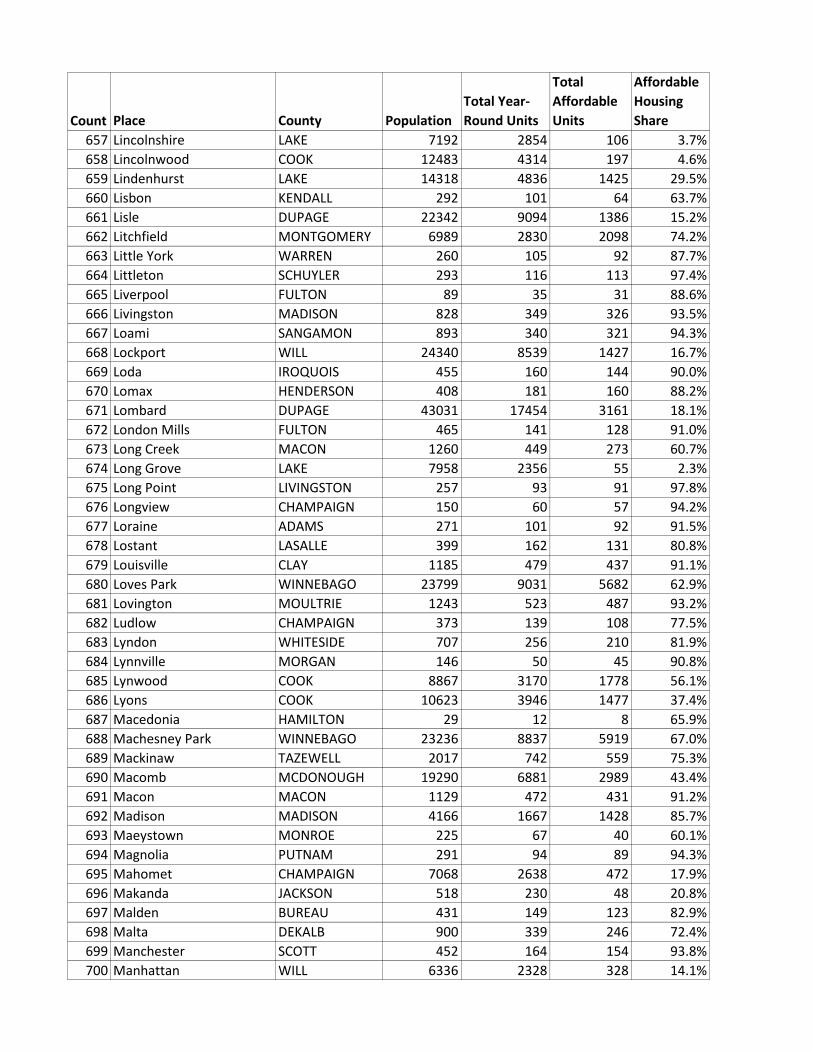
657 Lincolnshire LAKE 7192 2854 106 3.7%
658 Lincolnwood COOK 12483 4314 197 4.6%
659 Lindenhurst LAKE 14318 4836 1425 29.5%
660 Lisbon KENDALL 292 101 64 63.7%
661 Lisle DUPAGE 22342 9094 1386 15.2%
662 Litchfield MONTGOMERY 6989 2830 2098 74.2%
663 Little York WARREN 260 105 92 87.7%
664 Littleton SCHUYLER 293 116 113 97.4%
665 Liverpool FULTON 89 35 31 88.6%
666 Livingston MADISON 828 349 326 93.5%
667 Loami SANGAMON 893 340 321 94.3%
668 Lockport WILL 24340 8539 1427 16.7%
669 Loda IROQUOIS 455 160 144 90.0%
670 Lomax HENDERSON 408 181 160 88.2%
671 Lombard DUPAGE 43031 17454 3161 18.1%
672 London Mills FULTON 465 141 128 91.0%
673 Long Creek MACON 1260 449 273 60.7%
674 Long Grove LAKE 7958 2356 55 2.3%
675 Long Point LIVINGSTON 257 93 91 97.8%
676 Longview CHAMPAIGN 150 60 57 94.2%
677 Loraine ADAMS 271 101 92 91.5%
678 Lostant LASALLE 399 162 131 80.8%
679 Louisville CLAY 1185 479 437 91.1%
680 Loves Park WINNEBAGO 23799 9031 5682 62.9%
681 Lovington MOULTRIE 1243 523 487 93.2%
682 Ludlow CHAMPAIGN 373 139 108 77.5%
683 Lyndon WHITESIDE 707 256 210 81.9%
684 Lynnville MORGAN 146 50 45 90.8%
685 Lynwood COOK 8867 3170 1778 56.1%
686 Lyons COOK 10623 3946 1477 37.4%
687 Macedonia HAMILTON 29 12 8 65.9%
688 Machesney Park WINNEBAGO 23236 8837 5919 67.0%
689 Mackinaw TAZEWELL 2017 742 559 75.3%
690 Macomb MCDONOUGH 19290 6881 2989 43.4%
691 Macon MACON 1129 472 431 91.2%
692 Madison MADISON 4166 1667 1428 85.7%
693 Maeystown MONROE 225 67 40 60.1%
694 Magnolia PUTNAM 291 94 89 94.3%
695 Mahomet CHAMPAIGN 7068 2638 472 17.9%
696 Makanda JACKSON 518 230 48 20.8%
697 Malden BUREAU 431 149 123 82.9%
698 Malta DEKALB 900 339 246 72.4%
699 Manchester SCOTT 452 164 154 93.8%
700 Manhattan WILL 6336 2328 328 14.1%

Count Place County Population
Total Year-
Round Units
Total
Affordable
Units
Affordable
Housing
Share
701 Manito MASON 1948 827 605 73.2%
702 Manlius BUREAU 392 170 163 95.9%
703 Mansfield PIATT 1054 401 307 76.6%
704 Manteno KANKAKEE 8839 3502 1089 31.1%
705 Maple Park DEKALB 1453 534 154 28.8%
706 Mapleton PEORIA 283 115 87 75.7%
707 Maquon KNOX 363 137 113 82.4%
708 Marengo MCHENRY 7794 2729 1280 46.9%
709 Marietta FULTON 210 81 74 91.4%
710 Marine MADISON 1073 416 329 79.2%
711 Marion WILLIAMSON 17101 7370 4618 62.7%
712 Marissa ST. CLAIR 2359 881 787 89.4%
713 Mark PUTNAM 631 224 146 65.4%
714 Markham COOK 12472 3994 3001 75.1%
715 Maroa MACON 1975 694 538 77.5%
716 Marquette Heights TAZEWELL 2678 1004 891 88.8%
717 Marseilles LASALLE 5029 1936 1520 78.5%
718 Marshall CLARK 4065 1626 1204 74.1%
719 Martinsville CLARK 1047 461 443 96.2%
720 Martinton IROQUOIS 316 116 96 82.8%
721 Maryville MADISON 7232 2926 766 26.2%
722 Mascoutah ST. CLAIR 7309 2620 1687 64.4%
723 Mason MASON 2345 976 804 82.3%
724 Mason town EFFINGHAM 411 137 129 94.2%
725 Matherville MERCER 823 343 272 79.4%
726 Matteson COOK 18270 6673 2487 37.3%
727 Mattoon COLES 18055 7672 5312 69.2%
728 Maunie WHITE 125 51 45 89.2%
729 Maywood COOK 24234 7757 4436 57.2%
730 Mazon GRUNDY 867 371 269 72.4%
731 McClure ALEXANDER 377 145 140 96.7%
732 McCook COOK 334 113 33 28.9%
733 McCullom Lake MCHENRY 1034 402 282 70.2%
734 McHenry MCHENRY 26760 9860 3072 31.2%
735 McLean MCLEAN 893 353 329 93.3%
736 McLeansboro HAMILTON 2640 1126 942 83.7%
737 McNabb PUTNAM 366 124 108 86.7%
738 Mechanicsburg SANGAMON 670 235 197 83.8%
739 Media HENDERSON 146 60 55 91.3%
740 Medora MACOUPIN 406 169 151 89.3%
741 Melrose Park COOK 24993 7435 3326 44.7%
742 Melvin FORD 599 244 236 96.8%
743 Mendon ADAMS 740 299 249 83.3%
744 Mendota LASALLE 7177 2542 1916 75.4%

Count Place County Population
Total Year-
Round Units
Total
Affordable
Units
Affordable
Housing
Share
745 Menominee JO DAVIESS 134 63 39 61.9%
746 Meredosia MORGAN 916 412 388 94.1%
747 Merrionette Park COOK 2213 979 799 81.6%
748 Metamora WOODFORD 3549 1368 955 69.8%
749 Metcalf EDGAR 217 79 77 97.9%
750 Metropolis MASSAC 6570 2754 2147 78.0%
751 Mettawa LAKE 596 215 16 7.5%
752 Middletown LOGAN 273 116 113 97.2%
753 Midlothian COOK 14678 5063 3092 61.1%
754 Milan ROCK ISLAND 5119 2312 1888 81.6%
755 Milford IROQUOIS 1474 593 554 93.4%
756 Mill Creek UNION 113 36 29 81.4%
757 Mill Shoals WHITE 200 83 77 93.0%
758 Millbrook KENDALL 269 102 14 14.1%
759 Milledgeville CARROLL 1110 500 415 83.1%
760 Millington LASALLE 838 237 105 44.4%
761 Millstadt ST. CLAIR 3875 1606 643 40.0%
762 Milton PIKE 415 117 109 92.8%
763 Mineral BUREAU 292 133 111 83.8%
764 Minier TAZEWELL 1119 472 424 89.8%
765 Minonk WOODFORD 2499 1000 872 87.2%
766 Minooka GRUNDY 9978 3173 544 17.1%
767 Modesto MACOUPIN 246 77 68 88.5%
768 Mokena WILL 18456 6038 616 10.2%
769 Moline ROCK ISLAND 43440 17915 12889 71.9%
770 Momence KANKAKEE 3565 1163 787 67.7%
771 Monee WILL 5020 1940 813 41.9%
772 Monmouth WARREN 9615 3490 2659 76.2%
773 Monroe Center OGLE 586 194 144 74.2%
774 Montgomery KANE 17178 5670 1523 26.9%
775 Monticello PIATT 5236 2157 1092 50.6%
776 Montrose EFFINGHAM 210 84 83 98.8%
777 Morris GRUNDY 13814 5427 2380 43.9%
778 Morrison WHITESIDE 4185 1674 1352 80.8%
779 Morrisonville CHRISTIAN 1051 378 346 91.6%
780 Morton Grove COOK 23070 8277 651 7.9%
781 Morton TAZEWELL 16052 6390 2794 43.7%
782 Mound PULASKI 787 273 216 79.1%
783 Mound Station BROWN 124 47 42 89.4%
784 Mounds PULASKI 863 367 301 82.1%
785 Mount Auburn CHRISTIAN 382 187 180 96.2%
786 Mount Carmel WABASH 7362 2888 2447 84.7%
787 Mount Carroll CARROLL 1868 804 664 82.5%
788 Mount Clare MACOUPIN 395 114 102 89.9%

Count Place County Population
Total Year-
Round Units
Total
Affordable
Units
Affordable
Housing
Share
789 Mount Erie WAYNE 144 48 39 81.3%
790 Mount Morris OGLE 3165 1233 1107 89.8%
791 Mount Olive MACOUPIN 2236 952 890 93.5%
792 Mount Prospect COOK 53980 20464 4052 19.8%
793 Mount Pulaski LOGAN 1399 578 509 88.0%
794 Mount Sterling BROWN 2206 948 831 87.7%
795 Mount Vernon JEFFERSON 15222 6403 4648 72.6%
796 Mount Zion MACON 5510 2083 1133 54.4%
797 Moweaqua SHELBY 1762 697 581 83.4%
798 Muddy SALINE 52 24 16 68.3%
799 Mulberry Grove BOND 804 269 248 92.1%
800 Muncie VERMILION 102 43 37 85.8%
801 Mundelein LAKE 31555 10459 3462 33.1%
802 Murphysboro JACKSON 8189 3468 2117 61.0%
803 Murrayville MORGAN 572 209 191 91.6%
804 Naperville DUPAGE 141401 48021 3011 6.3%
805 Naplate LASALLE 581 231 212 91.8%
806 Naples town SCOTT 85 27 22 81.5%
807 Nashville WASHINGTON 3280 1321 1057 80.0%
808 Nason JEFFERSON 179 78 77 98.5%
809 Nauvoo HANCOCK 1058 425 251 59.2%
810 Nebo PIKE 490 179 173 96.8%
811 Nelson LEE 250 65 63 96.2%
812 Neoga CUMBERLAND 1923 662 535 80.8%
813 Neponset BUREAU 523 222 205 92.3%
814 New Athens ST. CLAIR 2130 769 589 76.6%
815 New Baden CLINTON 3287 1222 877 71.8%
816 New Bedford BUREAU 67 29 29 100.0%
817 New Berlin SANGAMON 1305 563 473 84.0%
818 New Boston MERCER 852 332 302 91.1%
819 New Burnside JOHNSON 312 88 85 96.6%
820 New Canton town PIKE 338 133 122 91.6%
821 New Douglas MADISON 358 114 101 88.2%
822 New Grand Chain PULASKI 249 92 76 83.0%
823 New Haven GALLATIN 489 198 190 96.0%
824 New Holland LOGAN 183 86 80 93.1%
825 New Lenox WILL 24190 8012 778 9.7%
826 New Milford WINNEBAGO 847 306 194 63.5%
827 New Minden WASHINGTON 156 72 65 90.2%
828 New Salem PIKE 137 52 45 87.1%
829 Newark KENDALL 926 352 147 41.8%
830 Newman DOUGLAS 877 354 337 95.1%
831 Newton JASPER 2808 1220 1103 90.4%
832 Niantic MACON 761 302 272 90.0%
Count Place County Population
Total Year-
Round Units
Total
Affordable
Units
Affordable
Housing
Share
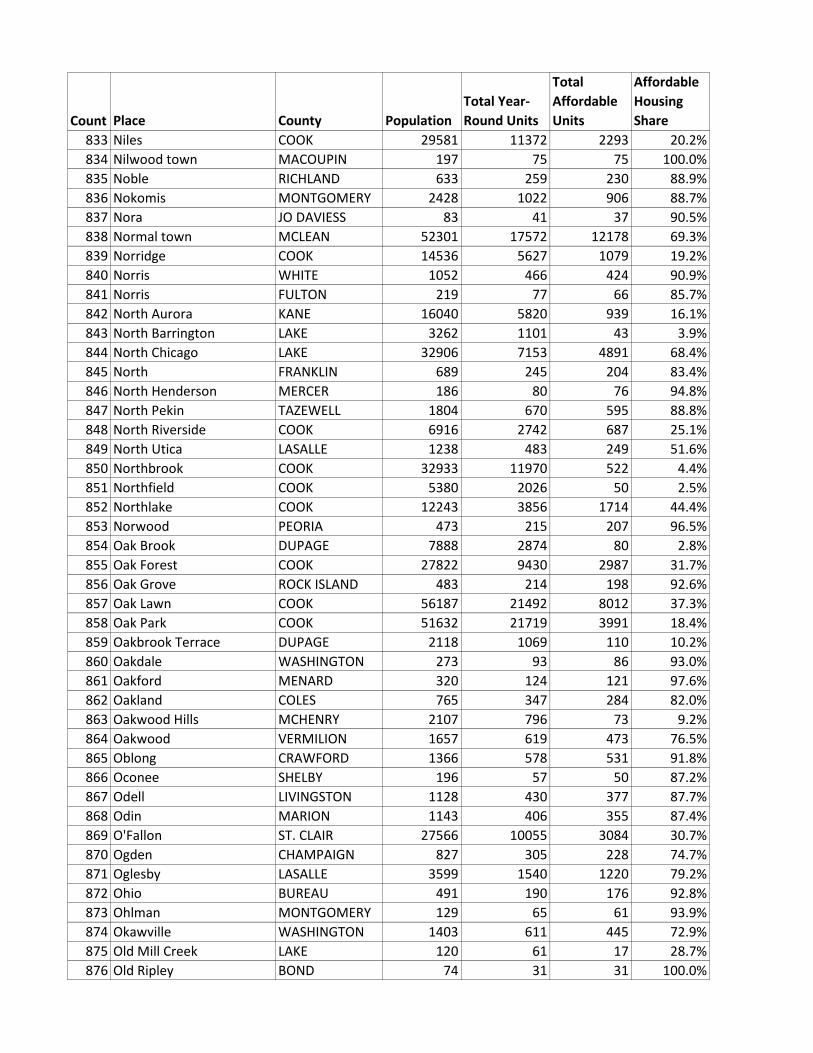
833 Niles COOK 29581 11372 2293 20.2%
834 Nilwood town MACOUPIN 197 75 75 100.0%
835 Noble RICHLAND 633 259 230 88.9%
836 Nokomis MONTGOMERY 2428 1022 906 88.7%
837 Nora JO DAVIESS 83 41 37 90.5%
838 Normal town MCLEAN 52301 17572 12178 69.3%
839 Norridge COOK 14536 5627 1079 19.2%
840 Norris WHITE 1052 466 424 90.9%
841 Norris FULTON 219 77 66 85.7%
842 North Aurora KANE 16040 5820 939 16.1%
843 North Barrington LAKE 3262 1101 43 3.9%
844 North Chicago LAKE 32906 7153 4891 68.4%
845 North FRANKLIN 689 245 204 83.4%
846 North Henderson MERCER 186 80 76 94.8%
847 North Pekin TAZEWELL 1804 670 595 88.8%
848 North Riverside COOK 6916 2742 687 25.1%
849 North Utica LASALLE 1238 483 249 51.6%
850 Northbrook COOK 32933 11970 522 4.4%
851 Northfield COOK 5380 2026 50 2.5%
852 Northlake COOK 12243 3856 1714 44.4%
853 Norwood PEORIA 473 215 207 96.5%
854 Oak Brook DUPAGE 7888 2874 80 2.8%
855 Oak Forest COOK 27822 9430 2987 31.7%
856 Oak Grove ROCK ISLAND 483 214 198 92.6%
857 Oak Lawn COOK 56187 21492 8012 37.3%
858 Oak Park COOK 51632 21719 3991 18.4%
859 Oakbrook Terrace DUPAGE 2118 1069 110 10.2%
860 Oakdale WASHINGTON 273 93 86 93.0%
861 Oakford MENARD 320 124 121 97.6%
862 Oakland COLES 765 347 284 82.0%
863 Oakwood Hills MCHENRY 2107 796 73 9.2%
864 Oakwood VERMILION 1657 619 473 76.5%
865 Oblong CRAWFORD 1366 578 531 91.8%
866 Oconee SHELBY 196 57 50 87.2%
867 Odell LIVINGSTON 1128 430 377 87.7%
868 Odin MARION 1143 406 355 87.4%
869 O'Fallon ST. CLAIR 27566 10055 3084 30.7%
870 Ogden CHAMPAIGN 827 305 228 74.7%
871 Oglesby LASALLE 3599 1540 1220 79.2%
872 Ohio BUREAU 491 190 176 92.8%
873 Ohlman MONTGOMERY 129 65 61 93.9%
874 Okawville WASHINGTON 1403 611 445 72.9%
875 Old Mill Creek LAKE 120 61 17 28.7%
876 Old Ripley BOND 74 31 31 100.0%
Count Place County Population
Total Year-
Round Units
Total
Affordable
Units
Affordable
Housing
Share
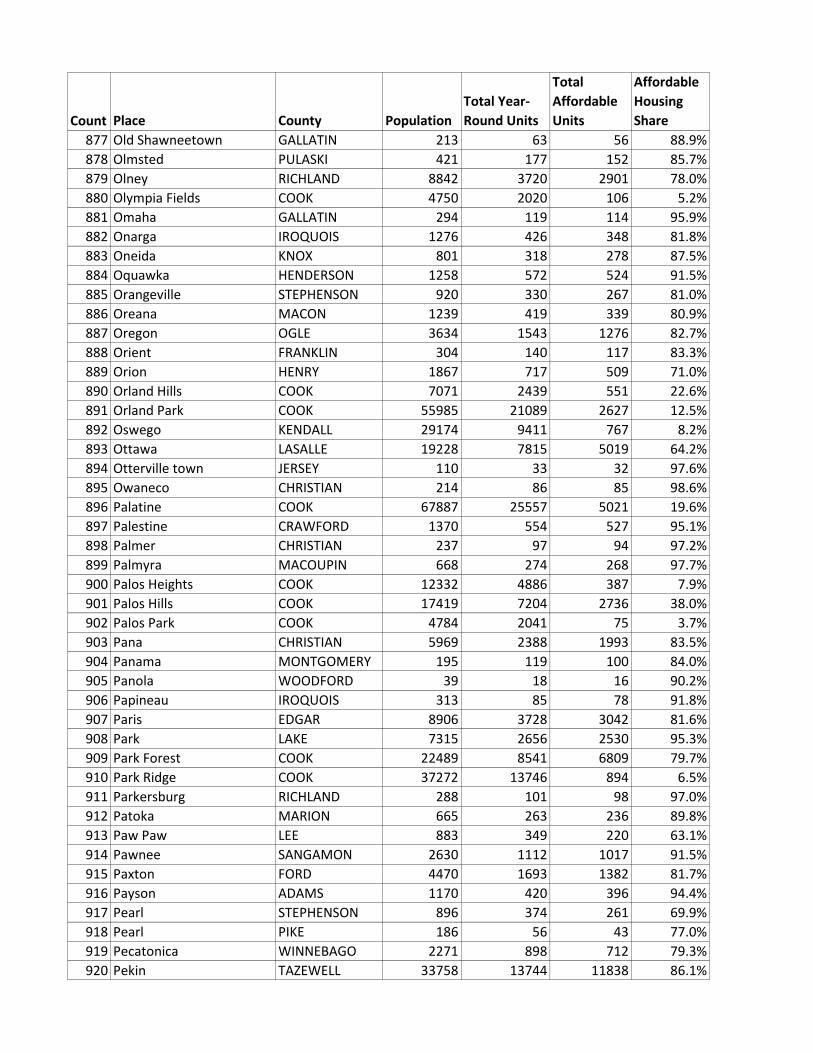
877 Old Shawneetown GALLATIN 213 63 56 88.9%
878 Olmsted PULASKI 421 177 152 85.7%
879 Olney RICHLAND 8842 3720 2901 78.0%
880 Olympia Fields COOK 4750 2020 106 5.2%
881 Omaha GALLATIN 294 119 114 95.9%
882 Onarga IROQUOIS 1276 426 348 81.8%
883 Oneida KNOX 801 318 278 87.5%
884 Oquawka HENDERSON 1258 572 524 91.5%
885 Orangeville STEPHENSON 920 330 267 81.0%
886 Oreana MACON 1239 419 339 80.9%
887 Oregon OGLE 3634 1543 1276 82.7%
888 Orient FRANKLIN 304 140 117 83.3%
889 Orion HENRY 1867 717 509 71.0%
890 Orland Hills COOK 7071 2439 551 22.6%
891 Orland Park COOK 55985 21089 2627 12.5%
892 Oswego KENDALL 29174 9411 767 8.2%
893 Ottawa LASALLE 19228 7815 5019 64.2%
894 Otterville town JERSEY 110 33 32 97.6%
895 Owaneco CHRISTIAN 214 86 85 98.6%
896 Palatine COOK 67887 25557 5021 19.6%
897 Palestine CRAWFORD 1370 554 527 95.1%
898 Palmer CHRISTIAN 237 97 94 97.2%
899 Palmyra MACOUPIN 668 274 268 97.7%
900 Palos Heights COOK 12332 4886 387 7.9%
901 Palos Hills COOK 17419 7204 2736 38.0%
902 Palos Park COOK 4784 2041 75 3.7%
903 Pana CHRISTIAN 5969 2388 1993 83.5%
904 Panama MONTGOMERY 195 119 100 84.0%
905 Panola WOODFORD 39 18 16 90.2%
906 Papineau IROQUOIS 313 85 78 91.8%
907 Paris EDGAR 8906 3728 3042 81.6%
908 Park LAKE 7315 2656 2530 95.3%
909 Park Forest COOK 22489 8541 6809 79.7%
910 Park Ridge COOK 37272 13746 894 6.5%
911 Parkersburg RICHLAND 288 101 98 97.0%
912 Patoka MARION 665 263 236 89.8%
913 Paw Paw LEE 883 349 220 63.1%
914 Pawnee SANGAMON 2630 1112 1017 91.5%
915 Paxton FORD 4470 1693 1382 81.7%
916 Payson ADAMS 1170 420 396 94.4%
917 Pearl STEPHENSON 896 374 261 69.9%
918 Pearl PIKE 186 56 43 77.0%
919 Pecatonica WINNEBAGO 2271 898 712 79.3%
920 Pekin TAZEWELL 33758 13744 11838 86.1%

Count Place County Population
Total Year-
Round Units
Total
Affordable
Units
Affordable
Housing
Share
921 Peoria PEORIA 114315 46394 32354 69.7%
922 Peoria Heights PEORIA 6271 2946 2511 85.2%
923 Peotone WILL 4670 1717 697 40.6%
924 Percy RANDOLPH 930 349 317 90.8%
925 Perry PIKE 435 192 178 92.7%
926 Peru LASALLE 10268 4417 3404 77.1%
927 Pesotum CHAMPAIGN 514 245 204 83.3%
928 Petersburg MENARD 2206 907 768 84.6%
929 Phillipstown WHITE 67 17 15 89.0%
930 Philo CHAMPAIGN 1571 625 319 51.0%
931 Phoenix COOK 1898 815 637 78.1%
932 Pierron BOND 512 219 214 97.9%
933 Pinckneyville PERRY 5637 1476 1203 81.5%
934 Pingree Grove KANE 4085 1103 15 1.4%
935 Piper FORD 701 271 256 94.6%
936 Pittsburg WILLIAMSON 707 297 269 90.7%
937 Pittsfield PIKE 4875 1895 1488 78.5%
938 Plainfield WILL 37447 11092 447 4.0%
939 Plainville ADAMS 323 127 120 94.4%
940 Plano KENDALL 10189 3554 1885 53.0%
941 Plattville KENDALL 219 86 31 35.8%
942 Pleasant Hill PIKE 1392 571 496 86.9%
943 Pleasant Plains SANGAMON 778 290 248 85.6%
944 Plymouth HANCOCK 471 210 197 94.0%
945 Pocahontas BOND 733 301 266 88.5%
946 Polo OGLE 2327 993 920 92.7%
947 Pontiac LIVINGSTON 12306 4275 3656 85.5%
948 Pontoon Beach MADISON 6066 2154 1592 73.9%
949 Pontoosuc HANCOCK 141 61 50 82.0%
950 Poplar Grove BOONE 5964 1873 426 22.8%
951 Port Barrington LAKE 1675 591 53 8.9%
952 Port Byron ROCK ISLAND 1751 745 366 49.1%
953 Posen COOK 5872 1704 1264 74.2%
954 Potomac VERMILION 861 295 247 83.7%
955 Prairie MCDONOUGH 508 184 165 89.5%
956 Prairie du Rocher RANDOLPH 495 206 197 95.7%
957 Prairie Grove MCHENRY 1823 585 21 3.6%
958 Princeton BUREAU 7820 3367 2454 72.9%
959 Princeville PEORIA 1998 716 551 76.9%
960 Prophetstown WHITESIDE 1993 793 618 78.0%
961 Prospect Heights COOK 16258 6203 2018 32.5%
962 Pulaski PULASKI 233 88 68 77.1%
963 Quincy ADAMS 40544 16385 12480 76.2%
964 Radom WASHINGTON 208 91 87 95.5%

Count Place County Population
Total Year-
Round Units
Total
Affordable
Units
Affordable
Housing
Share
965 Raleigh SALINE 319 115 100 86.9%
966 Ramsey FAYETTE 1058 455 419 92.2%
967 Rankin VERMILION 503 204 165 80.7%
968 Ransom LASALLE 392 134 119 89.0%
969 Rantoul CHAMPAIGN 12801 5145 3756 73.0%
970 Rapids ROCK ISLAND 819 323 193 59.8%
971 Raritan HENDERSON 147 51 42 83.1%
972 Raymond MONTGOMERY 1038 435 329 75.7%
973 Red Bud RANDOLPH 3674 1420 851 59.9%
974 Reddick KANKAKEE 271 105 79 75.3%
975 Redmon EDGAR 212 93 73 78.2%
976 Reynolds ROCK ISLAND 576 210 190 90.3%
977 Richmond MCHENRY 2050 1002 465 46.4%
978 Richton Park COOK 13472 5177 2767 53.4%
979 Richview WASHINGTON 251 105 104 99.0%
980 Ridge Farm VERMILION 1003 351 314 89.5%
981 Ridgway GALLATIN 917 370 348 94.0%
982 Ridott STEPHENSON 102 42 36 85.2%
983 Ringwood MCHENRY 905 299 19 6.5%
984 Rio KNOX 219 94 79 84.1%
985 Ripley BROWN 57 28 22 78.3%
986 River Forest COOK 11164 3886 172 4.4%
987 River Grove COOK 10219 4026 1868 46.4%
988 Riverdale COOK 13597 4568 3272 71.6%
989 Riverside COOK 8783 3274 389 11.9%
990 Riverton SANGAMON 3414 1423 1233 86.7%
991 Riverwoods LAKE 3817 1281 22 1.7%
992 Roanoke WOODFORD 2071 840 694 82.6%
993 Robbins COOK 5222 1889 1527 80.8%
994 Roberts FORD 375 173 156 90.2%
995 Robinson CRAWFORD 8106 3014 2439 80.9%
996 Rochelle OGLE 9598 3813 2886 75.7%
997 Rochester SANGAMON 3723 1353 689 50.9%
998 Rock STEPHENSON 329 119 92 77.0%
999 Rock Falls WHITESIDE 9237 3923 3102 79.1%
1000 Rock Island ROCK ISLAND 39018 15514 12074 77.8%
1001 Rockbridge GREENE 197 83 76 91.3%
1002 Rockdale WILL 1748 786 650 82.7%
1003 Rockford WINNEBAGO 153509 58806 40414 68.7%
1004 Rockton WINNEBAGO 7260 2578 938 36.4%
1005 Rockwood RANDOLPH 52 19 19 100.0%
1006 Rolling Meadows COOK 23391 8886 2405 27.1%
1007 Romeoville WILL 38539 11560 3779 32.7%
1008 Roodhouse GREENE 1830 819 712 86.9%

Count Place County Population
Total Year-
Round Units
Total
Affordable
Units
Affordable
Housing
Share
1009 Roscoe WINNEBAGO 10286 3559 942 26.5%
1010 Rose Hill JASPER 96 49 44 89.4%
1011 Roselle DUPAGE 22753 8305 1264 15.2%
1012 Rosemont COOK 3638 1627 843 51.8%
1013 Roseville WARREN 1058 463 392 84.7%
1014 Rosiclare HARDIN 1376 507 431 85.0%
1015 Rossville VERMILION 1295 463 367 79.3%
1016 Round Lake Beach LAKE 28099 7869 5798 73.7%
1017 Round Lake Heights LAKE 2673 762 492 64.6%
1018 Round Lake Park LAKE 7362 2755 2317 84.1%
1019 Round Lake LAKE 17054 5344 2250 42.1%
1020 Roxana MADISON 1597 631 560 88.7%
1021 Royal Lakes MACOUPIN 220 75 71 94.5%
1022 Royal CHAMPAIGN 273 125 89 71.3%
1023 Royalton FRANKLIN 1044 405 357 88.0%
1024 Ruma RANDOLPH 335 111 85 76.9%
1025 Rushville SCHUYLER 3371 1420 1231 86.7%
1026 Russellville LAWRENCE 67 41 41 100.0%
1027 Rutland LASALLE 341 154 141 91.4%
1028 Sadorus CHAMPAIGN 588 208 183 88.0%
1029 Sailor Springs CLAY 115 42 42 100.0%
1030 Salem MARION 7475 3114 2431 78.1%
1031 Sammons Point KANKAKEE 293 131 76 57.9%
1032 San Jose MASON 696 243 216 88.9%
1033 Sandoval MARION 1097 422 364 86.2%
1034 Sandwich DEKALB 7653 2789 1476 52.9%
1035 Sauget ST. CLAIR 193 77 63 82.1%
1036 Sauk COOK 10419 2883 2044 70.9%
1037 Saunemin LIVINGSTON 312 127 125 98.6%
1038 Savanna CARROLL 2958 1482 1306 88.1%
1039 Savoy CHAMPAIGN 6632 2742 560 20.4%
1040 Sawyerville MACOUPIN 240 87 58 67.0%
1041 Saybrook MCLEAN 716 275 267 97.2%
1042 Scales Mound JO DAVIESS 426 162 152 93.6%
1043 Schaumburg COOK 73771 31204 7409 23.7%
1044 Schiller Park COOK 11736 4225 1622 38.4%
1045 Schram MONTGOMERY 335 143 121 84.7%
1046 Sciota MCDONOUGH 65 25 16 63.0%
1047 Scottville MACOUPIN 120 37 34 92.7%
1048 Seaton MERCER 293 131 128 97.9%
1049 Seatonville BUREAU 284 119 101 84.7%
1050 Secor WOODFORD 461 169 162 96.1%
1051 Seneca LASALLE 2440 851 517 60.7%
1052 Sesser FRANKLIN 1956 789 680 86.2%

Count Place County Population
Total Year-
Round Units
Total
Affordable
Units
Affordable
Housing
Share
1053 Shabbona DEKALB 841 334 230 68.8%
1054 Shannon CARROLL 855 375 316 84.2%
1055 Shawneetown GALLATIN 1109 480 435 90.7%
1056 Sheffield BUREAU 959 388 316 81.6%
1057 Shelbyville SHELBY 5200 2279 1842 80.8%
1058 Sheldon IROQUOIS 971 376 311 82.7%
1059 Sheridan LASALLE 1664 342 183 53.5%
1060 Sherman SANGAMON 3911 1473 540 36.7%
1061 Sherrard MERCER 787 321 260 80.9%
1062 Shiloh ST. CLAIR 12362 4486 1320 29.4%
1063 Shipman town MACOUPIN 863 259 228 87.9%
1064 Shorewood WILL 15145 5099 550 10.8%
1065 Shumway EFFINGHAM 132 51 46 90.6%
1066 Sibley FORD 328 161 150 92.9%
1067 Sidell VERMILION 638 209 200 95.7%
1068 Sidney CHAMPAIGN 1310 497 260 52.3%
1069 Sigel town SHELBY 323 134 107 79.6%
1070 Silvis ROCK ISLAND 7452 3294 2445 74.2%
1071 Simpson JOHNSON 68 20 16 79.4%
1072 Sims WAYNE 243 101 97 95.9%
1073 Skokie COOK 64233 22700 3337 14.7%
1074 Sleepy Hollow KANE 3378 1143 28 2.5%
1075 Smithboro BOND 143 64 64 100.0%
1076 Smithfield FULTON 345 127 107 84.4%
1077 Smithton ST. CLAIR 3443 1292 646 50.0%
1078 Somonauk DEKALB 2207 778 426 54.8%
1079 Sorento BOND 480 190 182 95.8%
1080 South Barrington COOK 4670 1349 18 1.3%
1081 South Beloit WINNEBAGO 7847 2759 2035 73.7%
1082 South Chicago Heights COOK 4103 1451 1204 83.0%
1083 South Elgin KANE 21600 6914 1057 15.3%
1084 South Holland COOK 21949 7198 3581 49.8%
1085 South Jacksonville MORGAN 3340 1544 1306 84.6%
1086 South Pekin TAZEWELL 1115 427 392 91.7%
1087 South Roxana MADISON 2252 861 723 84.0%
1088 South Wilmington GRUNDY 579 241 220 91.3%
1089 Southern View SANGAMON 1814 738 642 87.0%
1090 Sparland MARSHALL 464 163 145 88.8%
1091 Sparta RANDOLPH 4334 1913 1507 78.8%
1092 Spaulding SANGAMON 932 335 179 53.3%
1093 Spillertown WILLIAMSON 181 77 69 89.9%
1094 Spring Bay WOODFORD 542 203 183 90.3%
1095 Spring Grove MCHENRY 5437 1759 71 4.0%
1096 Spring Valley BUREAU 5540 2261 1681 74.4%

Count Place County Population
Total Year-
Round Units
Total
Affordable
Units
Affordable
Housing
Share
1097 Springerton WHITE 99 30 30 100.0%
1098 Springfield SANGAMON 115658 49604 35642 71.9%
1099 St. Anne KANKAKEE 1378 515 449 87.3%
1100 St. Augustine KNOX 97 45 45 100.0%
1101 St. Charles KANE 32792 12008 1342 11.2%
1102 St. David FULTON 470 199 185 92.7%
1103 St. Elmo FAYETTE 1743 659 590 89.5%
1104 St. Francisville LAWRENCE 793 365 321 88.1%
1105 St. Jacob MADISON 1321 507 344 67.8%
1106 St. Johns PERRY 154 68 58 85.2%
1107 St. Joseph CHAMPAIGN 3795 1499 484 32.3%
1108 St. Libory ST. CLAIR 518 239 210 87.7%
1109 St. Peter FAYETTE 380 159 153 96.2%
1110 Standard MACOUPIN 165 63 57 90.1%
1111 Standard PUTNAM 214 96 85 88.8%
1112 Stanford MCLEAN 892 272 241 88.5%
1113 Staunton MACOUPIN 4858 2266 1991 87.8%
1114 Ste. Marie JASPER 246 107 104 97.6%
1115 Steeleville RANDOLPH 1907 811 682 84.1%
1116 Steger COOK 9677 3887 2938 75.6%
1117 Sterling WHITESIDE 15443 5874 4742 80.7%
1118 Steward LEE 248 90 74 82.5%
1119 Stewardson SHELBY 770 311 273 87.7%
1120 Stickney COOK 6687 2301 1009 43.8%
1121 Stillman Valley OGLE 1068 405 311 76.8%
1122 Stockton JO DAVIESS 1946 855 804 94.1%
1123 Stone Park COOK 4934 1240 670 54.0%
1124 Stonefort SALINE 254 110 97 88.0%
1125 Stonington CHRISTIAN 861 342 317 92.6%
1126 Stoy CRAWFORD 119 63 59 93.7%
1127 Strasburg SHELBY 628 208 188 90.6%
1128 Strawn LIVINGSTON 142 59 54 92.3%
1129 Streamwood COOK 39816 12775 3810 29.8%
1130 Streator LASALLE 13590 5471 4926 90.0%
1131 Stronghurst HENDERSON 1188 433 381 88.0%
1132 Sublette LEE 465 193 170 87.9%
1133 Sugar Grove KANE 8567 2974 68 2.3%
1134 Sullivan MOULTRIE 4522 1841 1492 81.0%
1135 Summerfield ST. CLAIR 431 170 151 88.7%
1136 Summit COOK 10937 3143 1568 49.9%
1137 Sumner LAWRENCE 3113 499 451 90.5%
1138 Sun River Terrace KANKAKEE 436 161 110 68.5%
1139 Swansea ST. CLAIR 13293 5126 2701 52.7%
1140 Sycamore DEKALB 17179 6914 3354 48.5%

Count Place County Population
Total Year-
Round Units
Total
Affordable
Units
Affordable
Housing
Share
1141 Symerton WILL 153 46 43 93.3%
1142 Table Grove FULTON 539 187 169 90.1%
1143 Tallula MENARD 736 219 200 91.4%
1144 Tamaroa PERRY 870 281 260 92.6%
1145 Tamms ALEXANDER 605 205 188 91.9%
1146 Tampico WHITESIDE 858 310 256 82.6%
1147 Taylor Springs MONTGOMERY 599 227 200 88.0%
1148 Taylorville CHRISTIAN 11695 4899 3869 79.0%
1149 Tennessee MCDONOUGH 168 68 53 77.9%
1150 Teutopolis EFFINGHAM 1652 584 396 67.9%
1151 Thawville IROQUOIS 196 81 69 85.5%
1152 Thayer SANGAMON 583 219 208 95.1%
1153 Thebes ALEXANDER 476 168 152 90.3%
1154 Third Lake LAKE 1367 447 33 7.4%
1155 Thomasboro CHAMPAIGN 1118 487 429 88.0%
1156 Thompsonville FRANKLIN 658 228 178 78.2%
1157 Thomson CARROLL 670 223 155 69.6%
1158 Thornton COOK 2516 965 839 86.9%
1159 Tilden RANDOLPH 788 276 222 80.4%
1160 Tilton VERMILION 2751 1207 1036 85.8%
1161 Timberlane BOONE 1160 335 3 1.0%
1162 Time PIKE 19 7 7 100.0%
1163 Tinley Park COOK 55694 20563 3995 19.4%
1164 Tiskilwa BUREAU 964 380 334 87.8%
1165 Toledo CUMBERLAND 1333 512 442 86.2%
1166 Tolono CHAMPAIGN 3485 1363 707 51.9%
1167 Toluca MARSHALL 1468 602 548 91.1%
1168 Tonica LASALLE 745 278 231 83.1%
1169 Topeka MASON 45 22 18 82.4%
1170 Toulon STARK 1287 470 452 96.2%
1171 Tovey CHRISTIAN 548 223 200 89.9%
1172 Towanda MCLEAN 653 234 225 96.0%
1173 Tower Hill SHELBY 711 259 223 86.0%
1174 Tower Lakes LAKE 1494 506 17 3.3%
1175 Tremont TAZEWELL 2148 859 569 66.3%
1176 Trenton CLINTON 2703 1127 778 69.0%
1177 Trout Valley MCHENRY 586 208 2 1.2%
1178 Troy MADISON 9805 3120 1566 50.2%
1179 Troy Grove LASALLE 217 89 68 76.5%
1180 Tuscola DOUGLAS 4234 1807 1451 80.3%
1181 Ullin PULASKI 633 203 160 78.9%
1182 Union Hill KANKAKEE 76 23 20 87.0%
1183 Union MCHENRY 720 230 140 60.8%
1184 University Park WILL 7037 2415 1357 56.2%

Count Place County Population
Total Year-
Round Units
Total
Affordable
Units
Affordable
Housing
Share
1185 Urbana CHAMPAIGN 41089 15606 6425 41.2%
1186 Ursa ADAMS 684 285 224 78.7%
1187 Valier FRANKLIN 553 241 225 93.3%
1188 Valmeyer MONROE 1720 560 257 45.8%
1189 Vandalia FAYETTE 6060 2085 1633 78.3%
1190 Varna MARSHALL 351 141 137 97.0%
1191 Venedy WASHINGTON 107 54 52 96.5%
1192 Venice MADISON 1709 629 545 86.6%
1193 Vergennes JACKSON 358 117 98 83.6%
1194 Vermilion EDGAR 225 92 89 96.3%
1195 Vermont FULTON 809 340 299 87.8%
1196 Vernon Hills LAKE 24710 9217 1990 21.6%
1197 Vernon MARION 106 46 43 93.5%
1198 Verona GRUNDY 213 81 75 92.6%
1199 Versailles BROWN 417 204 176 86.1%
1200 Victoria KNOX 309 126 112 88.8%
1201 Vienna JOHNSON 1467 627 517 82.5%
1202 Villa Grove DOUGLAS 2649 1063 876 82.4%
1203 Villa Park DUPAGE 22374 8158 1569 19.2%
1204 Viola MERCER 1020 436 356 81.7%
1205 Virden MACOUPIN 3513 1395 1331 95.4%
1206 Virgil KANE 339 108 13 12.3%
1207 Virginia CASS 1674 632 513 81.2%
1208 Volo LAKE 2363 949 403 42.4%
1209 Wadsworth LAKE 3876 1248 60 4.8%
1210 Waggoner MONTGOMERY 214 81 72 89.1%
1211 Walnut Hill MARION 106 46 32 70.6%
1212 Walnut BUREAU 1382 521 455 87.4%
1213 Walshville MONTGOMERY 57 21 21 100.0%
1214 Waltonville JEFFERSON 407 152 133 87.4%
1215 Wamac WASHINGTON 1574 614 575 93.7%
1216 Wapella DEWITT 611 210 203 96.6%
1217 Warren JO DAVIESS 1596 682 636 93.3%
1218 Warrensburg MACON 1134 442 388 87.9%
1219 Warrenville DUPAGE 13159 4728 1124 23.8%
1220 Warsaw HANCOCK 1769 751 637 84.9%
1221 Washburn WOODFORD 1142 448 415 92.5%
1222 Washington TAZEWELL 14755 5679 3196 56.3%
1223 Washington Park ST. CLAIR 4370 1324 1024 77.3%
1224 Wataga KNOX 842 372 315 84.6%
1225 Waterloo MONROE 9749 3952 1734 43.9%
1226 Waterman DEKALB 1476 535 349 65.3%
1227 Watseka IROQUOIS 5673 2497 1992 79.8%
1228 Watson EFFINGHAM 809 277 267 96.5%

Count Place County Population
Total Year-
Round Units
Total
Affordable
Units
Affordable
Housing
Share
1229 Wauconda LAKE 12998 4743 2243 47.3%
1230 Waukegan LAKE 89345 28918 22472 77.7%
1231 Waverly MORGAN 1340 558 493 88.3%
1232 Wayne City WAYNE 1200 450 391 86.9%
1233 Wayne Village DUPAGE 2938 948 5 0.5%
1234 Waynesville DEWITT 515 183 159 86.9%
1235 Weldon DEWITT 321 130 125 96.0%
1236 Wellington IROQUOIS 301 107 90 83.9%
1237 Wenona MARSHALL 1055 457 416 91.0%
1238 Wenonah MONTGOMERY 18 4 4 100.0%
1239 West Brooklyn LEE 122 57 45 79.7%
1240 West Chicago DUPAGE 26663 7533 1923 25.5%
1241 West FRANKLIN 805 335 277 82.7%
1242 West Dundee KANE 7208 2748 378 13.7%
1243 West Frankfort FRANKLIN 8479 3559 2818 79.2%
1244 West Peoria PEORIA 4490 1847 1618 87.6%
1245 West Point HANCOCK 161 66 61 92.8%
1246 West Salem EDWARDS 1019 373 355 95.2%
1247 Westchester COOK 16637 6251 803 12.8%
1248 Western Springs COOK 12747 4125 50 1.2%
1249 Westfield CLARK 676 327 317 96.8%
1250 Westmont DUPAGE 24865 10700 3229 30.2%
1251 Westville VERMILION 3180 1340 1112 83.0%
1252 Wheaton DUPAGE 53082 18717 2206 11.8%
1253 Wheeler JASPER 160 51 48 94.5%
1254 Wheeling COOK 37257 14134 4888 34.6%
1255 White MACOUPIN 238 97 83 85.1%
1256 White Hall GREENE 2630 1001 928 92.7%
1257 Whiteash WILLIAMSON 224 93 67 72.1%
1258 Williamsfield KNOX 585 259 223 86.3%
1259 Williamson MADISON 270 107 98 91.8%
1260 Williamsville SANGAMON 1542 584 398 68.2%
1261 Willisville PERRY 584 207 188 91.0%
1262 Willow Hill JASPER 259 99 91 92.4%
1263 Willow Springs COOK 5316 2242 389 17.3%
1264 Willowbrook DUPAGE 8562 4152 1252 30.2%
1265 Wilmette COOK 27010 9432 388 4.1%
1266 Wilmington City WILL 5914 2265 1416 62.5%
1267 Wilmington Village GREENE 166 62 55 88.7%
1268 Wilsonville MACOUPIN 472 190 159 83.6%
1269 Winchester SCOTT 1581 700 659 94.2%
1270 Windsor City SHELBY 1216 478 405 84.7%
1271 Windsor Village MERCER 770 300 275 91.7%
1272 Winfield DUPAGE 9012 3508 377 10.7%

Count Place County Population
Total Year-
Round Units
Total
Affordable
Units
Affordable
Housing
Share
1273 Winnebago WINNEBAGO 3360 1101 465 42.2%
1274 Winnetka COOK 12155 3919 100 2.5%
1275 Winslow STEPHENSON 230 112 95 85.3%
1276 Winthrop Harbor LAKE 6785 2553 1293 50.6%
1277 Witt MONTGOMERY 891 395 375 94.8%
1278 Wonder Lake MCHENRY 3798 1362 436 32.0%
1279 Wood Dale DUPAGE 13718 5007 877 17.5%
1280 Wood River MADISON 10712 4366 3844 88.0%
1281 Woodhull HENRY 806 328 259 79.0%
1282 Woodland IROQUOIS 311 128 117 91.2%
1283 Woodlawn JEFFERSON 656 258 216 83.9%
1284 Woodridge WILL 32699 12605 2551 20.2%
1285 Woodson MORGAN 637 264 212 80.3%
1286 Woodstock MCHENRY 24512 8917 3218 36.1%
1287 Worden MADISON 1101 418 349 83.6%
1288 Worth COOK 10735 4571 2346 51.3%
1289 Wyanet BUREAU 1232 456 385 84.5%
1290 Wyoming STARK 1408 601 548 91.2%
1291 Xenia CLAY 581 191 177 92.5%
1292 Yale JASPER 61 24 21 87.5%
1293 Yates KNOX 831 299 216 72.4%
1294 Yorkville KENDALL 16023 5672 1001 17.6%
1295 Zeigler FRANKLIN 1928 658 564 85.8%
1296 Zion LAKE 24410 7941 6031 75.9%Data: U.S. Census Bureu, 2011 American Community Survey (5-Year Estimates)
Please note: the list does not include Census Designated Places (which are not incorporated as municipalities), or
places reporting no ("0") population.