Embed Size (px)
Citation preview

© 2013 Pearson

© 2013 Pearson
Should price gouging be illegal?

© 2013 Pearson
6When you have completed your study of this chapter, you will be able to
1 Describe the alternative methods of allocating scare resources and define and explain the features of an efficient allocation.
2 Distinguish between value and price and define consumer surplus.
3 Distinguish between cost and price and define producer surplus.
CHAPTER CHECKLIST
Efficiency and Fairness of Markets

© 2013 Pearson
When you have completed your study of this chapter, you will be able to
4 Evaluate the efficiency of the alternative methods of allocating scare resources.
5 Explain the main ideas about fairness and evaluate the fairness of alternative methods of allocating scarce resources.
© 2013 Pearson
6.1 ALLOCATION METHODS AND EFFICIENCY
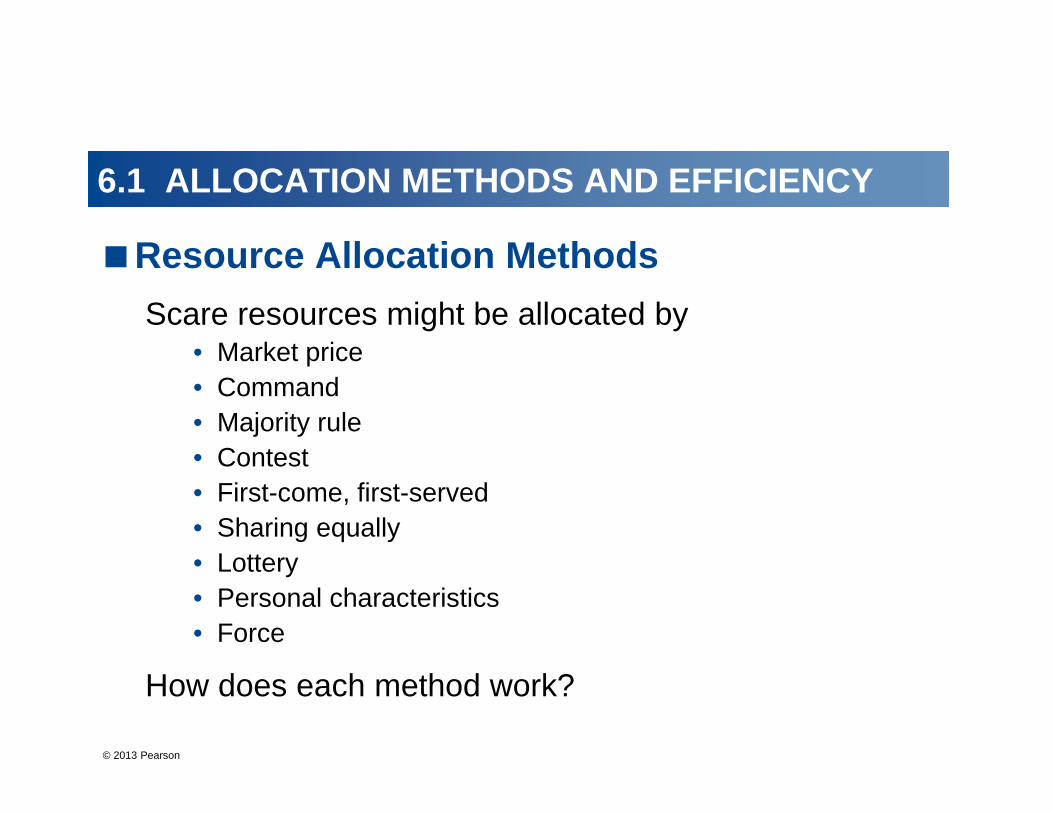
Resource Allocation MethodsScare resources might be allocated by
• Market price• Command• Majority rule• Contest• First-come, first-served• Sharing equally• Lottery• Personal characteristics• Force
How does each method work?

© 2013 Pearson
6.1 ALLOCATION METHODS AND EFFICIENCY
Market PriceWhen a market allocates a scarce resource, the people who get the resource are those who are willing to pay the market price.
Most of the scarce resources that you supply get allocated by market price.
You sell your labor services in a market, and you buy most of what you consume in markets.
For most goods and services, the market turns out to do a good job.
© 2013 Pearson
6.1 ALLOCATION METHODS AND EFFICIENCY
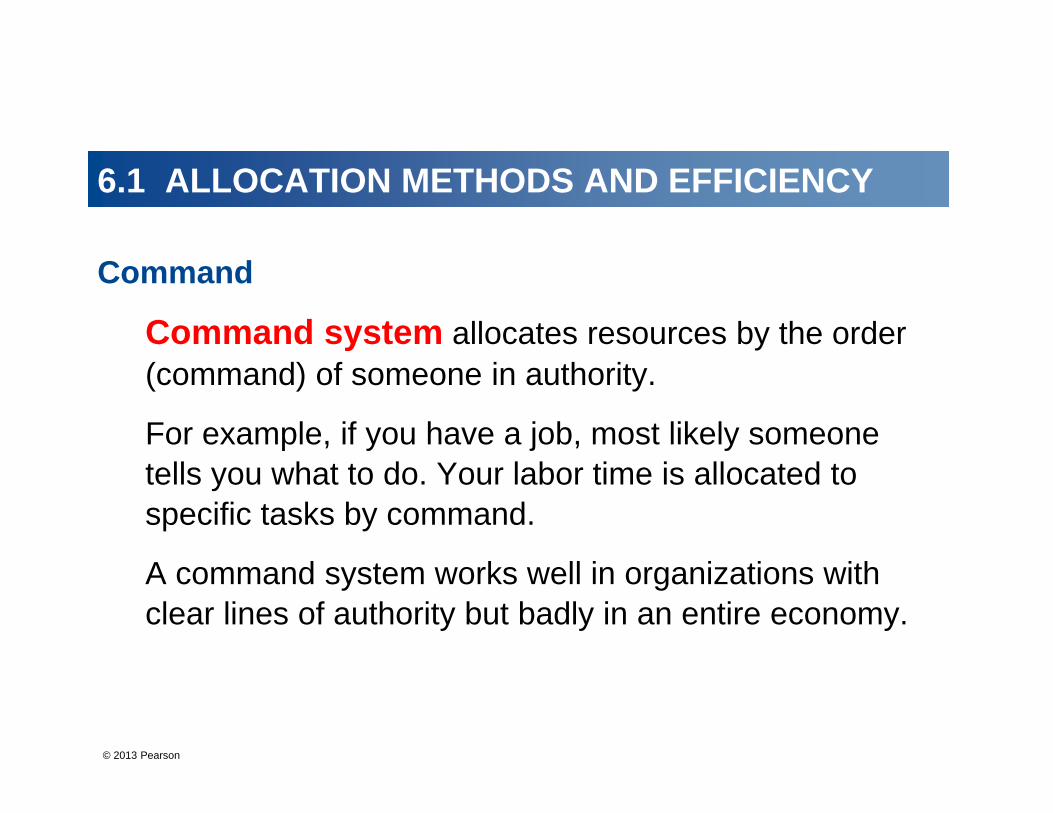
Command
Command system allocates resources by the order (command) of someone in authority.
For example, if you have a job, most likely someone tells you what to do. Your labor time is allocated to specific tasks by command.
A command system works well in organizations with clear lines of authority but badly in an entire economy.
© 2013 Pearson
6.1 ALLOCATION METHODS AND EFFICIENCY
Majority RuleMajority rule allocates resources in the way that a majority of voters choose.
Societies use majority rule for decisions about tax rates that allocate resources between private and public use and tax dollars between competing uses such as defense and health care.
Majority rule works well when the decision affects lots of people and self-interest must be suppressed to use resources efficiently.

© 2013 Pearson
6.1 ALLOCATION METHODS AND EFFICIENCY
Contest
A contest allocates resources to a winner (or group of winners).
The most obvious contests are sporting events but they occur in other arenas:
For example, The Oscars are a type of contest.
Contest works well when the efforts of the “players” are hard to monitor and reward directly.

© 2013 Pearson
6.1 ALLOCATION METHODS AND EFFICIENCY
First-Come, First-ServedA first-come, first-served allocates resources to those who are first in line.
Casual restaurants use first-come, first served to allocate tables. Supermarkets use first-come, first-served at checkout. Airlines use first-come, first-served to allocate standby seats.
First-come, first-served works best when scarce resources can serve just one person at a time in a sequence.

© 2013 Pearson
6.1 ALLOCATION METHODS AND EFFICIENCY
Sharing Equally
When a resource is shared equally, everyone gets the same amount of it.
You might use this method to share a dessert in a restaurant.
To make sharing equally work, people must be in agreement about its use and implementation.
It works best for small groups who share common goals and ideals.

© 2013 Pearson
6.1 ALLOCATION METHODS AND EFFICIENCY
LotteryLotteries allocate resources to those with the winning number, draw the lucky cards, or come up lucky.
State lotteries and casinos reallocate millions of dollars worth of goods and services each year, but lotteries are more widespread.
For example, tickets to Michael Jackson’s memorial service were allocated by lottery.
Lotteries work well when there is no effective way to distinguish among potential users of a scarce resource.
© 2013 Pearson
6.1 ALLOCATION METHODS AND EFFICIENCY
Personal Characteristics
Personal characteristics allocate resources to those with the “right” characteristics.
For example, people choose marriage partners on the basis of personal characteristics.
But this method gets used in unacceptable ways: allocating the best jobs to white males and discriminating against minorities and women.
© 2013 Pearson
6.1 ALLOCATION METHODS AND EFFICIENCY
ForceForce plays a role in allocating resources.
For example, war has played an enormous role historically in allocating resources.
Theft, taking property of others without their consent, also plays a large role.
But force provides an effective way of allocating resources—for the state to transfer wealth from the rich to the poor and establish the legal framework in which voluntary exchange can take place in markets.

© 2013 Pearson
6.1 ALLOCATION METHODS AND EFFICIENCY
Using Resources EfficientlyProduction efficiency - It is not possible to produce more of one good or service without producing less of something else. Every point on the PPF satisfies production efficiency.
C
B
A
Prod
uctio
n Po
ssib
ilitie
s Fr
ontie
r
X
Y
© 2013 Pearson
6.1 ALLOCATION METHODS AND EFFICIENCY
Using Resources EfficientlyWhich point on the production possibilities frontier should the society choose, is a question of allocative efficiency.
Allocative efficiency - It is not possible to produce more of one good or service without decreasing the total net benefit to society. Allocative efficiency is achieved when all goods and services are produced at such quantities, at which
marginal (social) benefit = marginal (social) cost
© 2013 Pearson
6.1 ALLOCATION METHODS AND EFFICIENCY
Marginal Benefit
Marginal benefit from consuming n units of a good is the benefit from the nth unit of the good.
People’s preferences determine marginal benefit.
The marginal benefit from a good is what people are willing to forgo to get the extra unit of the good. Measured in units of other goods, or in money.
Marginal benefit decreases as the quantity of the good increases—the principle of decreasing marginal benefit.

© 2013 Pearson
Possibility A and point A tell us that if we produce 2,000 pizzas a day,
people are willing to give up 15 units of other goods and services up to get one more pizza.
6.1 ALLOCATION METHODS AND EFFICIENCY

© 2013 Pearson
© 2013 Pearson
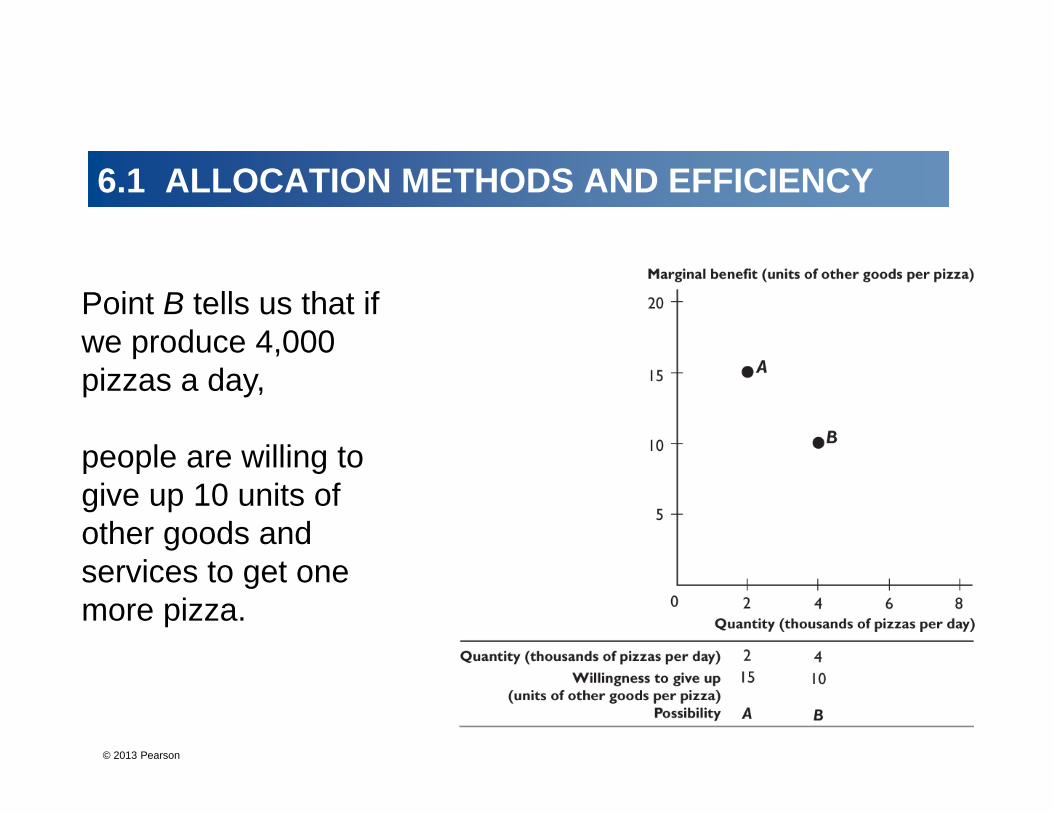
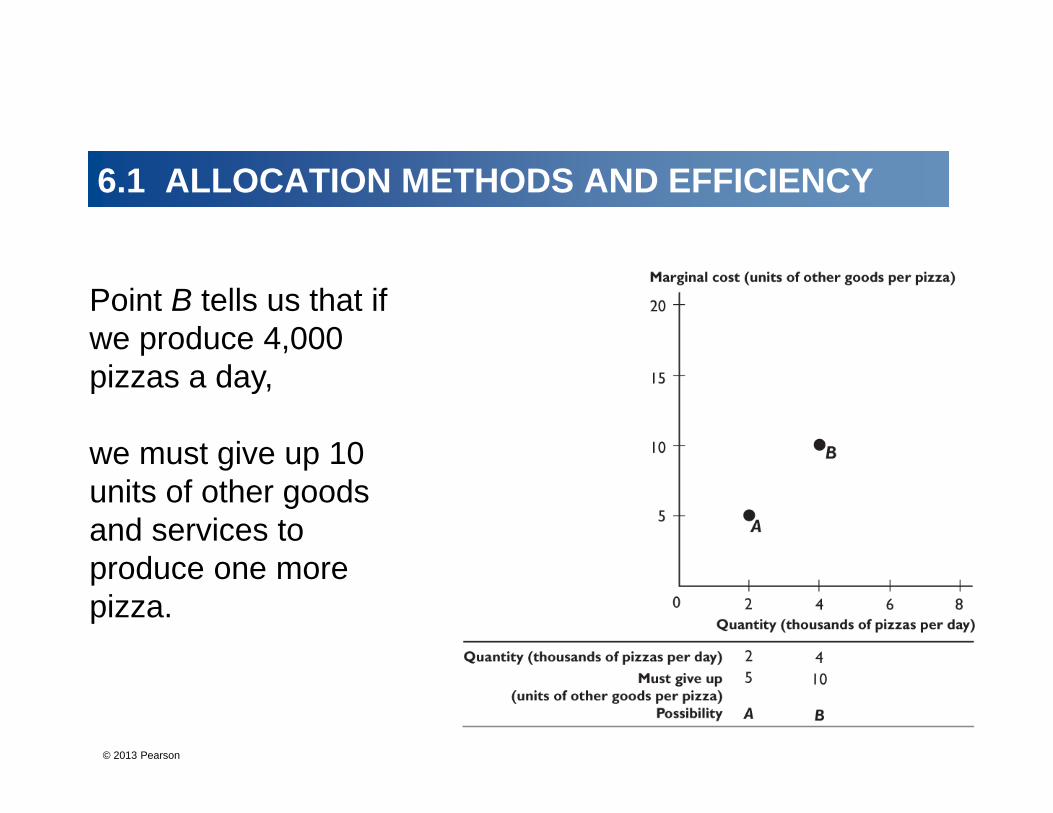
Point B tells us that if we produce 4,000 pizzas a day,
people are willing to give up 10 units of other goods and services to get one more pizza.
6.1 ALLOCATION METHODS AND EFFICIENCY
© 2013 Pearson
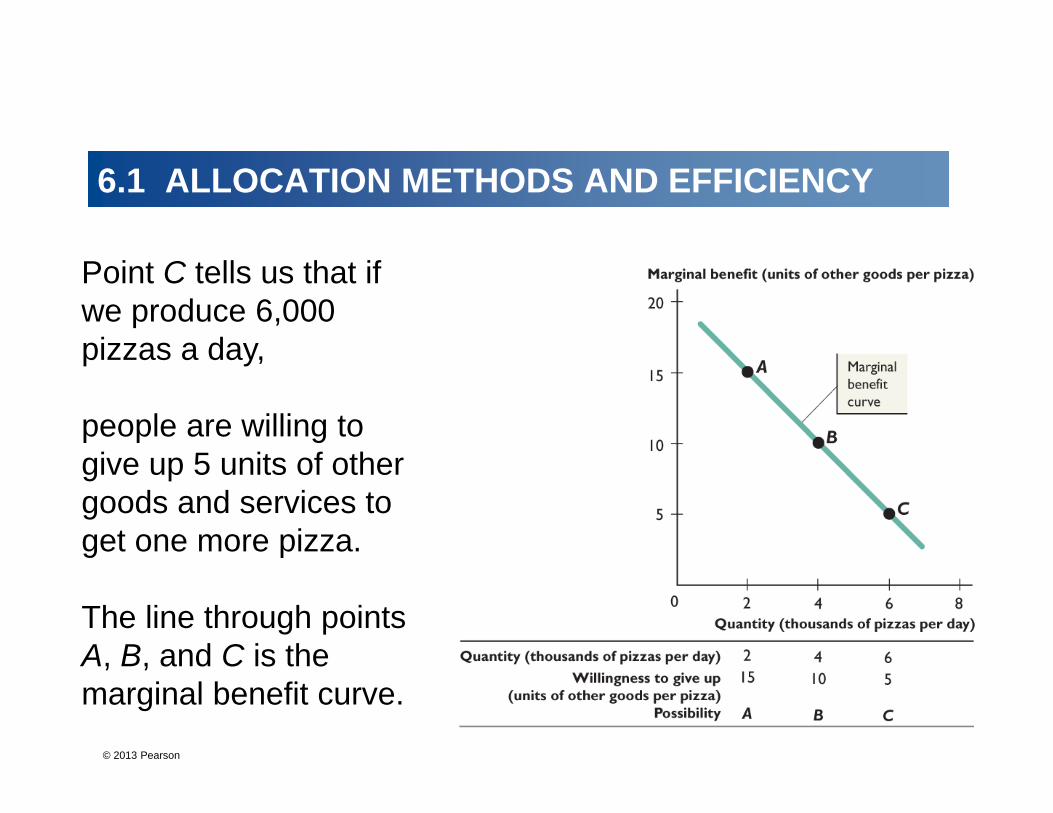
Point C tells us that if we produce 6,000 pizzas a day,
people are willing to give up 5 units of other goods and services to get one more pizza.
The line through points A, B, and C is the marginal benefit curve.
6.1 ALLOCATION METHODS AND EFFICIENCY
© 2013 Pearson
6.1 ALLOCATION METHODS AND EFFICIENCY
Marginal Cost
Marginal cost of producing n units of a good is the cost of producing the nth unit of the good.
It is measured in terms of the amount of other goods and services that we must give up to produce that unit (opportunity cost), or in money.
The marginal cost of producing a good increases as more of the good is produced.

© 2013 Pearson
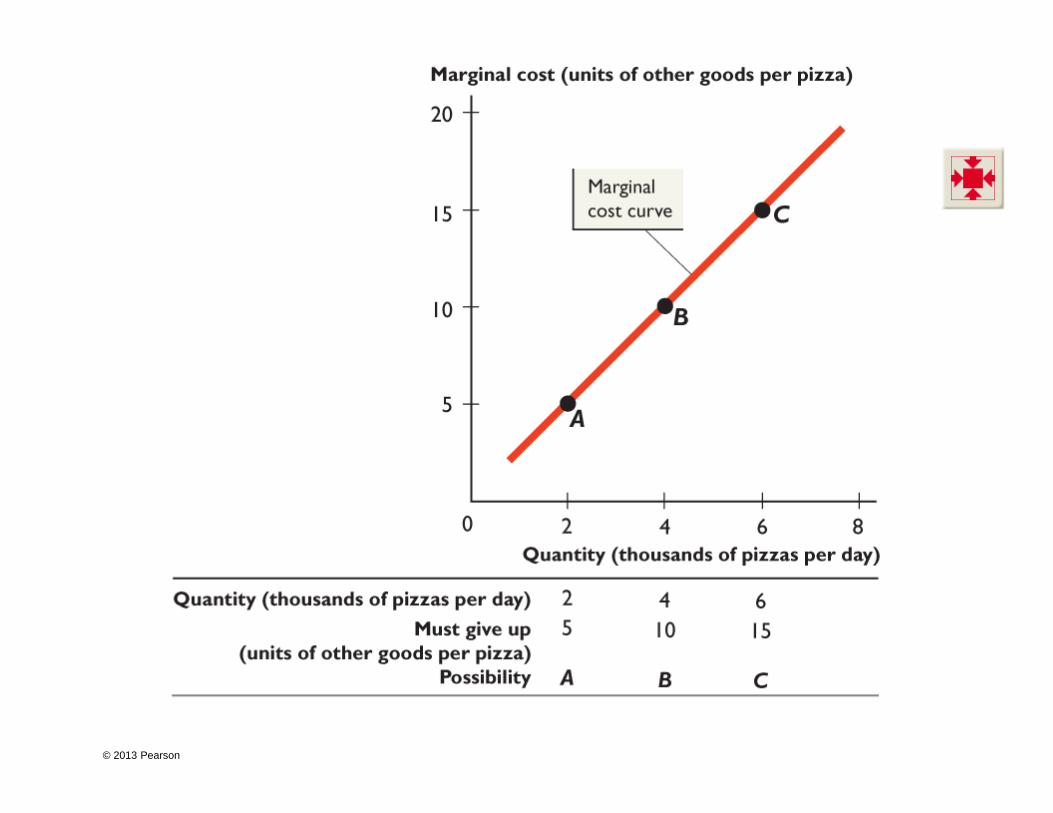
Possibility A and point A tell us that if we produce 2,000 pizzas a day,
we must give up 5 units of other goods and services to produce one more pizza.
6.1 ALLOCATION METHODS AND EFFICIENCY
© 2013 Pearson
© 2013 Pearson
6.1 ALLOCATION METHODS AND EFFICIENCY
Point B tells us that if we produce 4,000 pizzas a day,
we must give up 10 units of other goods and services to produce one more pizza.
© 2013 Pearson
6.1 ALLOCATION METHODS AND EFFICIENCY
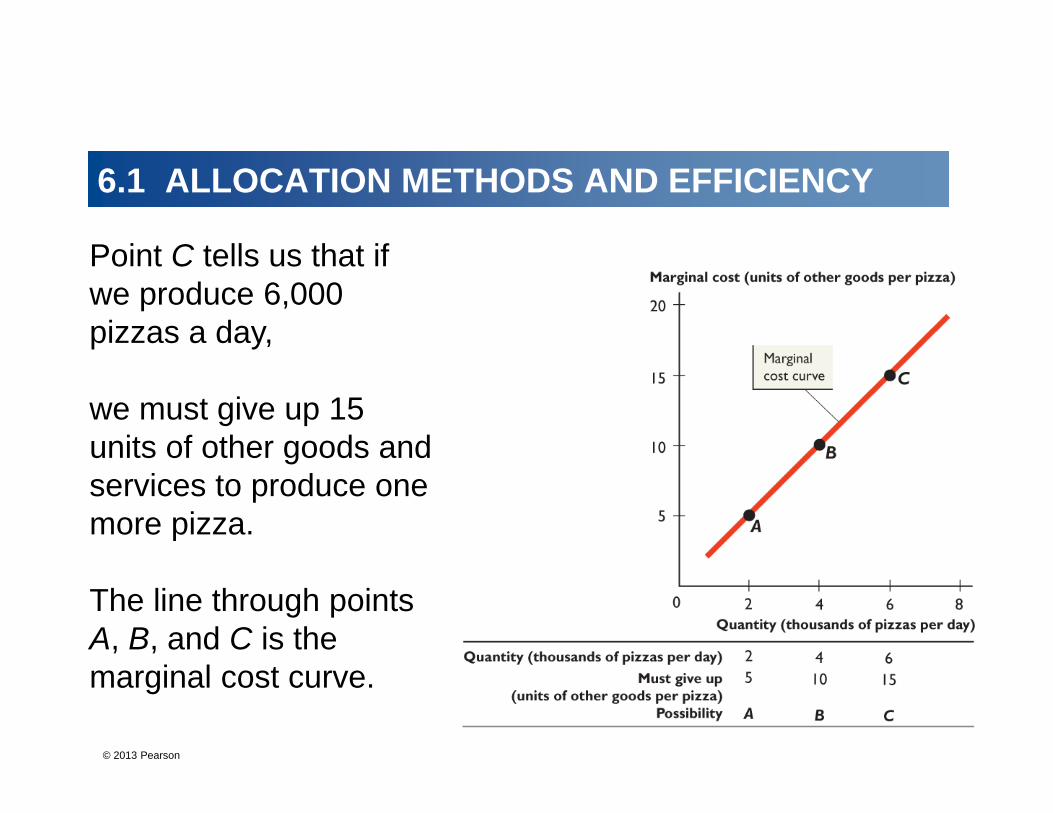
Point C tells us that if we produce 6,000 pizzas a day,
we must give up 15 units of other goods and services to produce one more pizza.
The line through points A, B, and C is the marginal cost curve.
© 2013 Pearson
6.1 ALLOCATION METHODS AND EFFICIENCY
Efficient Allocation
The efficient allocation is the highest-valued allocation.
That is, it is impossible to produce more of one good or service without decreasing the total net benefit to society.
To find the efficient allocation, we compare marginal benefit and marginal cost.
The next figure illustrates efficient allocation of resources between goods X and Y.
© 2013 Pearson
Y
E
Y*
Prod
uctio
n Po
ssib
ilitie
s Fr
ontie
r M
argi
nal c
ost a
nd b
enef
it to
so
ciet
y
X
X
Y
MC
MB
X*
X*
Y*
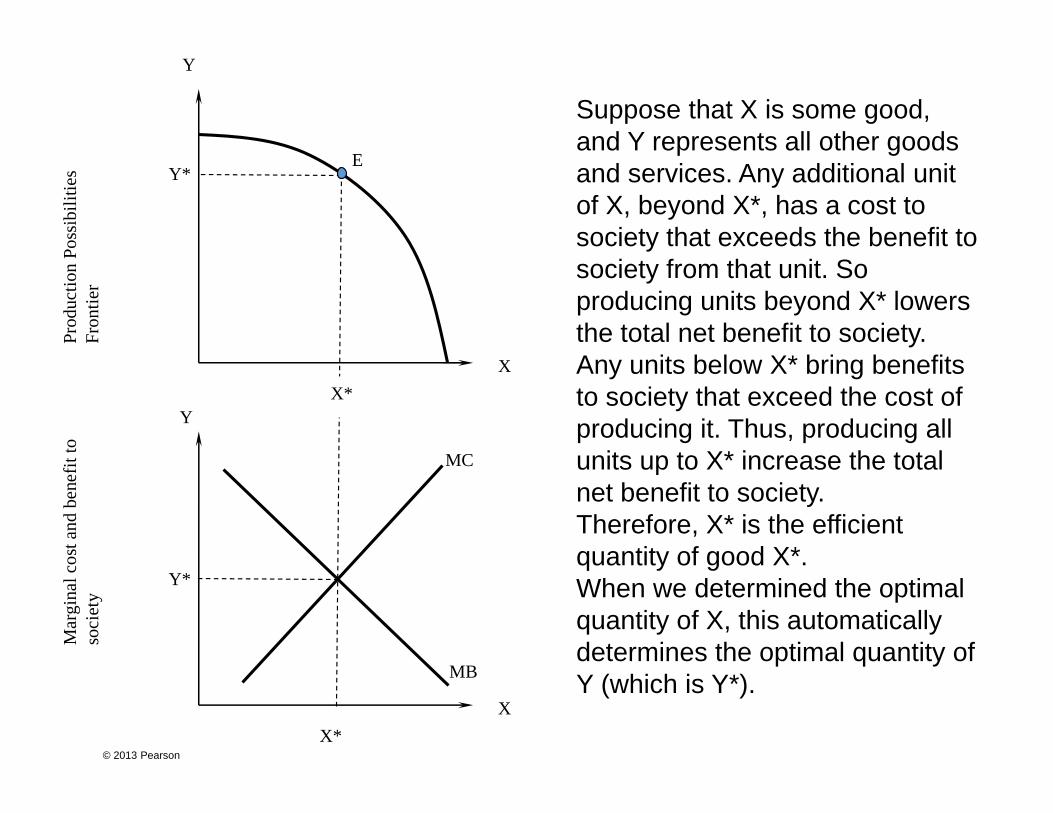
Suppose that X is some good, and Y represents all other goods and services. Any additional unit of X, beyond X*, has a cost to society that exceeds the benefit to society from that unit. So producing units beyond X* lowers the total net benefit to society.Any units below X* bring benefits to society that exceed the cost of producing it. Thus, producing all units up to X* increase the total net benefit to society. Therefore, X* is the efficient quantity of good X*. When we determined the optimal quantity of X, this automatically determines the optimal quantity of Y (which is Y*).
© 2013 Pearson
6.2 VALUE, PRICE, AND CONSUMER SURPLUS
Demand and Marginal BenefitBuyers distinguish between value and price.
• Value is what the buyer gets.• Price is what the buyer pays.
The value of one more unit of a good or service is its marginal benefit.
Marginal benefit can be measured as the maximum price that people are willing to pay for another unit of the good or service.
© 2013 Pearson
6.2 VALUE, PRICE, AND CONSUMER SURPLUS
The consumer will buy one more unit of a good or service if its price is less than or equal to the value the consumer places on it.
A demand curve is a marginal benefit curve.
For example, the demand curve for pizzas tells us the dollars worth of other goods and services that people are willing to forgo to consume one more pizza.
That is, the demand curve for pizzas shows the value the consumer places on each pizza.

© 2013 Pearson
6.2 VALUE, PRICE, AND CONSUMER SURPLUS
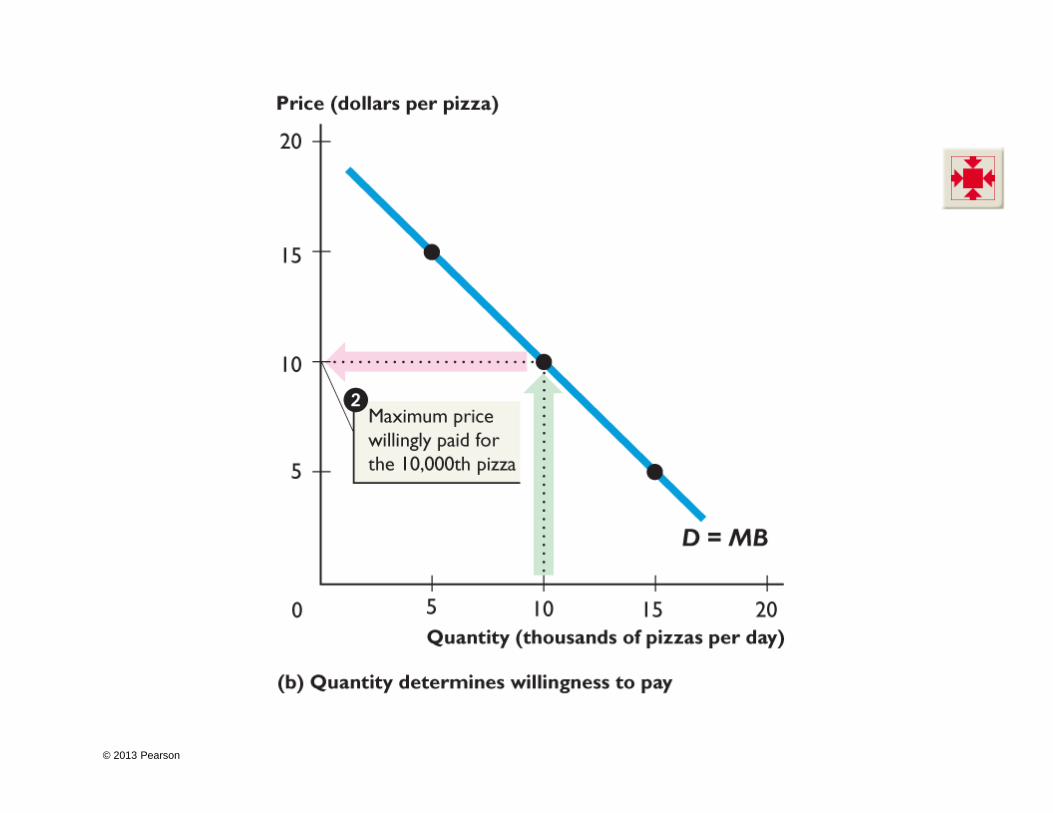
The demand curve shows:
1. The quantity demanded at each price, other things remaining the same.
Figure 6.4 shows demand, willingness to pay, and marginal benefit.

© 2013 Pearson
© 2013 Pearson
6.2 VALUE, PRICE, AND CONSUMER SURPLUS
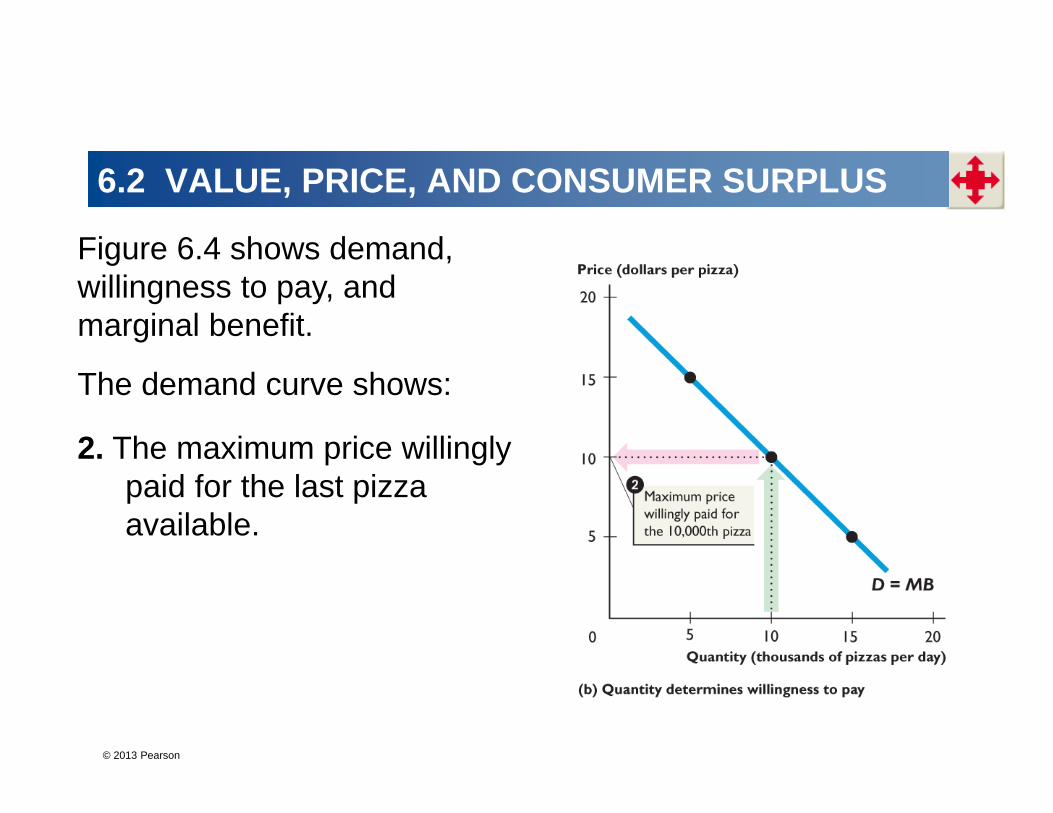
The demand curve shows:
2. The maximum price willingly paid for the last pizza available.
Figure 6.4 shows demand, willingness to pay, and marginal benefit.
© 2013 Pearson
© 2013 Pearson
6.2 VALUE, PRICE, AND CONSUMER SURPLUS
Consumer SurplusConsumer surplus is the marginal benefit from a good or service minus the price paid for it, summed over the quantity consumed.
Figure 6.5 on the next slide shows the consumer surplus from pizzas.

© 2013 Pearson
6.2 VALUE, PRICE, AND CONSUMER SURPLUS
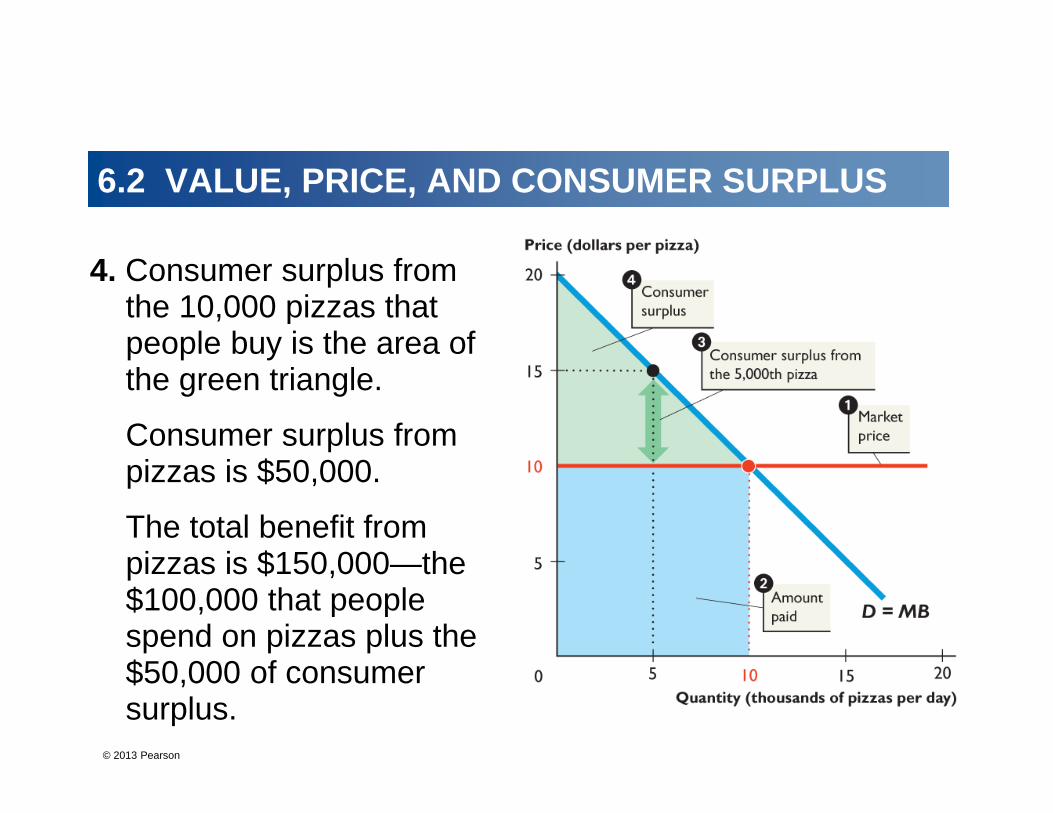
1. The market price of a pizza is $10.
2. People buy 10,000 pizzas and spend $100,000 a day on pizzas.
3. But people are willing to pay $15 for the 5,000th
pizza, so consumer surplus from that pizza is $5.

© 2013 Pearson
© 2013 Pearson
6.2 VALUE, PRICE, AND CONSUMER SURPLUS
4. Consumer surplus from the 10,000 pizzas that people buy is the area of the green triangle.
Consumer surplus from pizzas is $50,000.
The total benefit from pizzas is $150,000—the $100,000 that people spend on pizzas plus the $50,000 of consumer surplus.

© 2013 Pearson
6.3 COST, PRICE, AND PRODUCER SURPLUS
Supply and Marginal CostSellers distinguish between cost and price.
• Cost is what a seller must give up to produce the good.
• Price is what a seller receives when the good is sold.
The cost of producing one more unit of a good or service is its marginal cost.

© 2013 Pearson
6.3 COST, PRICE, AND PRODUCER SURPLUS
The seller will produce one more unit of a good or service if the price for which it can be sold exceeds or equals its marginal cost.
A supply curve is a marginal cost curve.
For example, the supply curve of pizzas tells us the dollars worth of other goods and services that firms must forgo to produce one more pizza.
That is, the supply curve of pizzas shows the seller’s cost of producing each unit of pizza.

© 2013 Pearson
6.3 COST, PRICE, AND PRODUCER SURPLUS
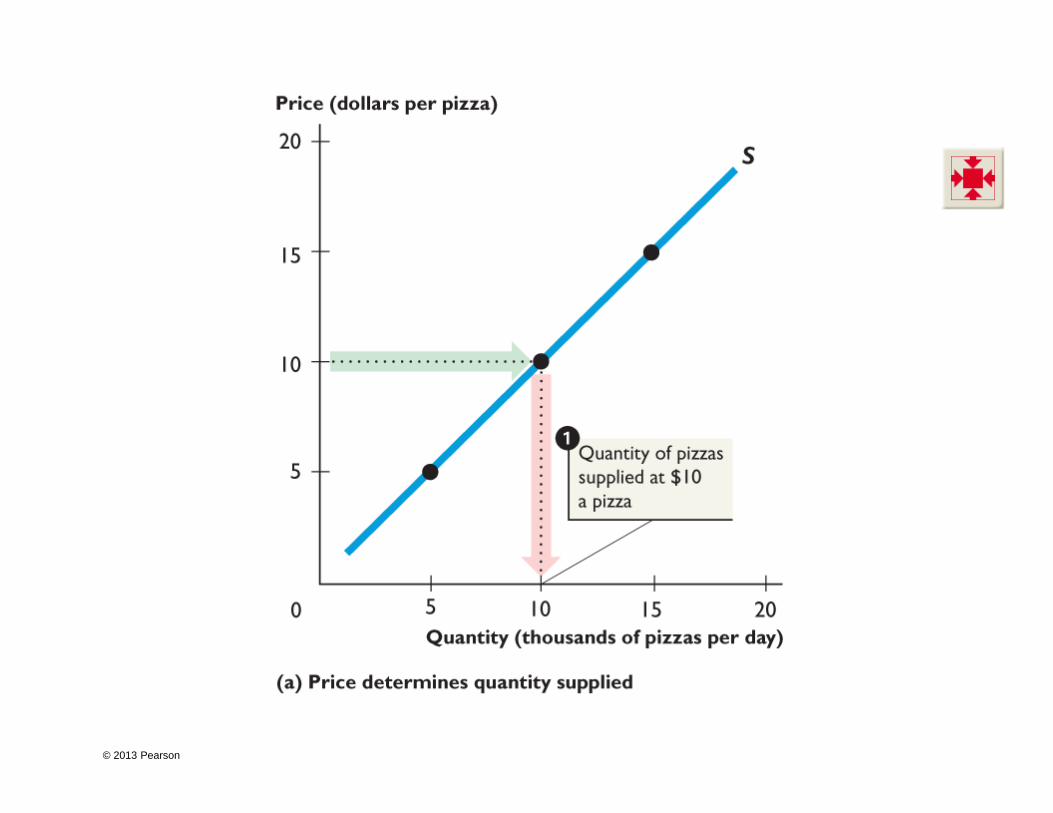
The supply curve shows:
1. The quantity supplied at each price, other things remaining the same.
Figure 6.6 shows supply, minimum supply price, and marginal cost.
© 2013 Pearson

© 2013 Pearson
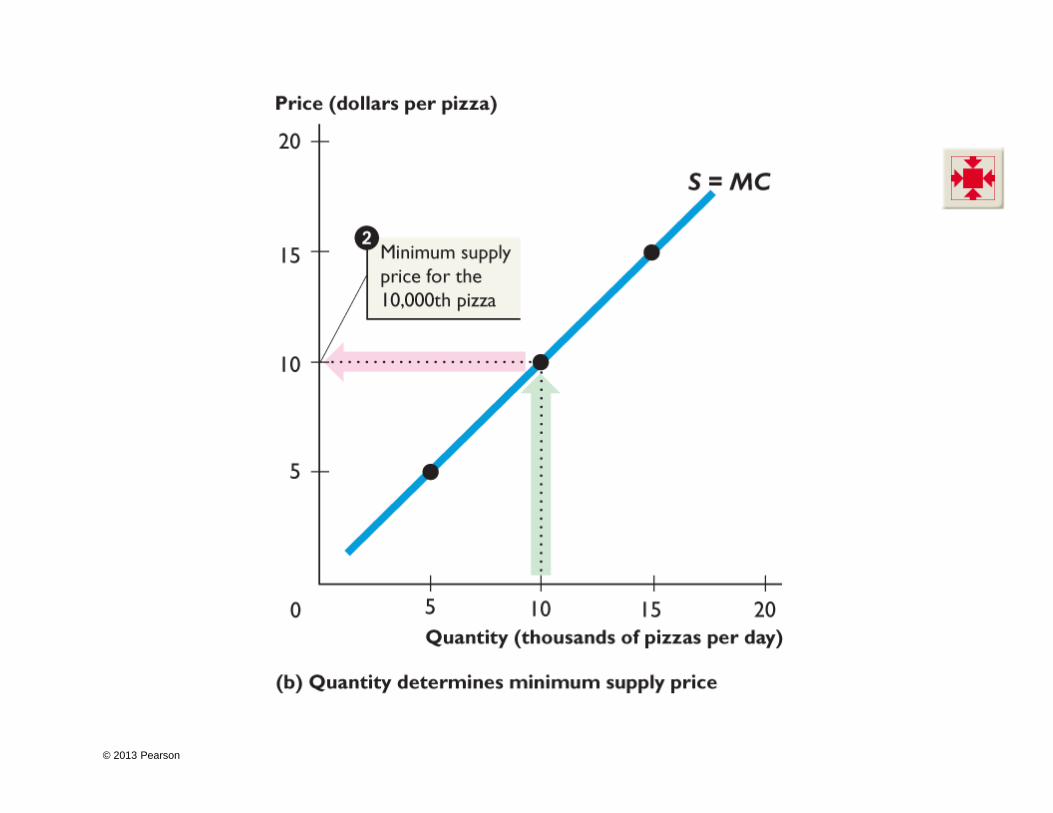
6.3 COST, PRICE, AND PRODUCER SURPLUS
The supply curve shows:
2. The minimum price that firms must be offered to supply a given quantity of pizzas.
1. The quantity supplied at each price, other things remaining the same.
Figure 6.6 shows supply, minimum supply price, and marginal cost.
© 2013 Pearson
© 2013 Pearson
6.3 COST, PRICE, AND PRODUCER SURPLUS
Producer SurplusProducer surplus is the price of a good minus the opportunity cost of producing it, summed over the quantity produced.
Figure 6.7 shows the producer surplus for pizza producers.
© 2013 Pearson
6.3 COST, PRICE, AND PRODUCER SURPLUS
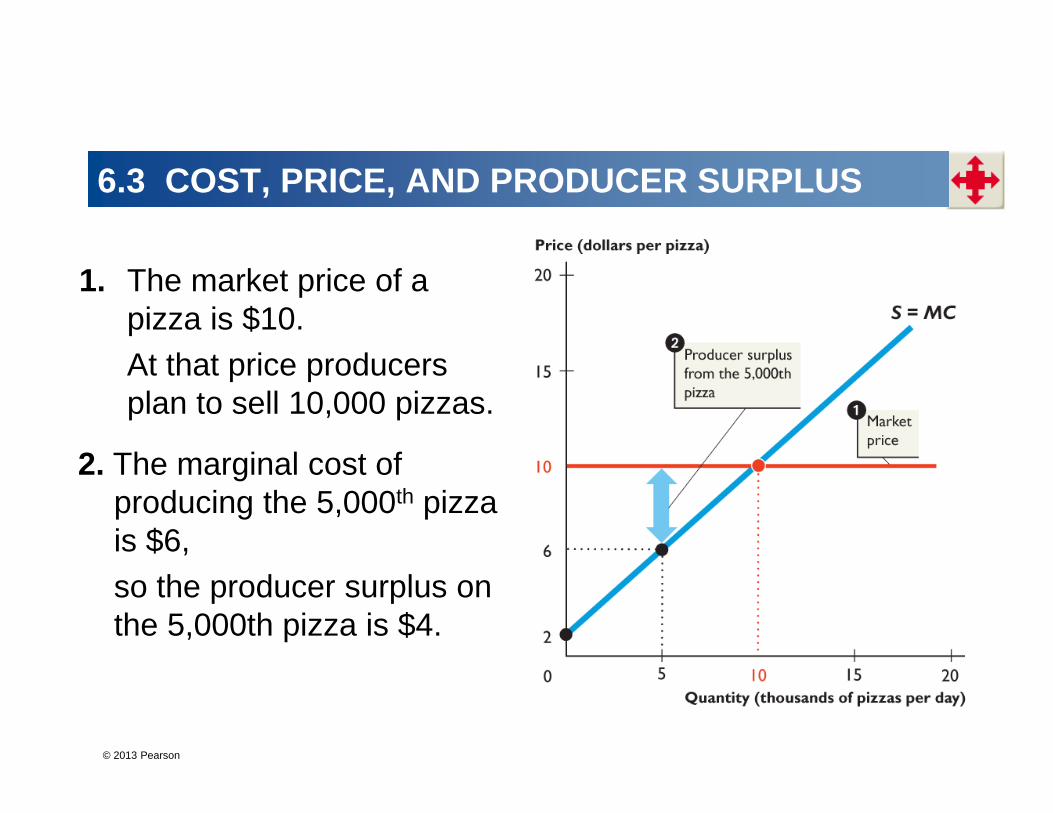
1. The market price of a pizza is $10.At that price producers plan to sell 10,000 pizzas.
2. The marginal cost of producing the 5,000th pizza is $6, so the producer surplus on the 5,000th pizza is $4.

© 2013 Pearson

© 2013 Pearson
6.3 COST, PRICE, AND PRODUCER SURPLUS
3. Producer surplus from the 10,000 pizzas sold is $40,000 a day—the area of the blue triangle.
4. The cost of 10,000 pizzas is $60,000 a day—the red area under the marginal cost curve.The cost equals total revenue of $100,000 minus the producer surplus of $40,000.
© 2013 Pearson
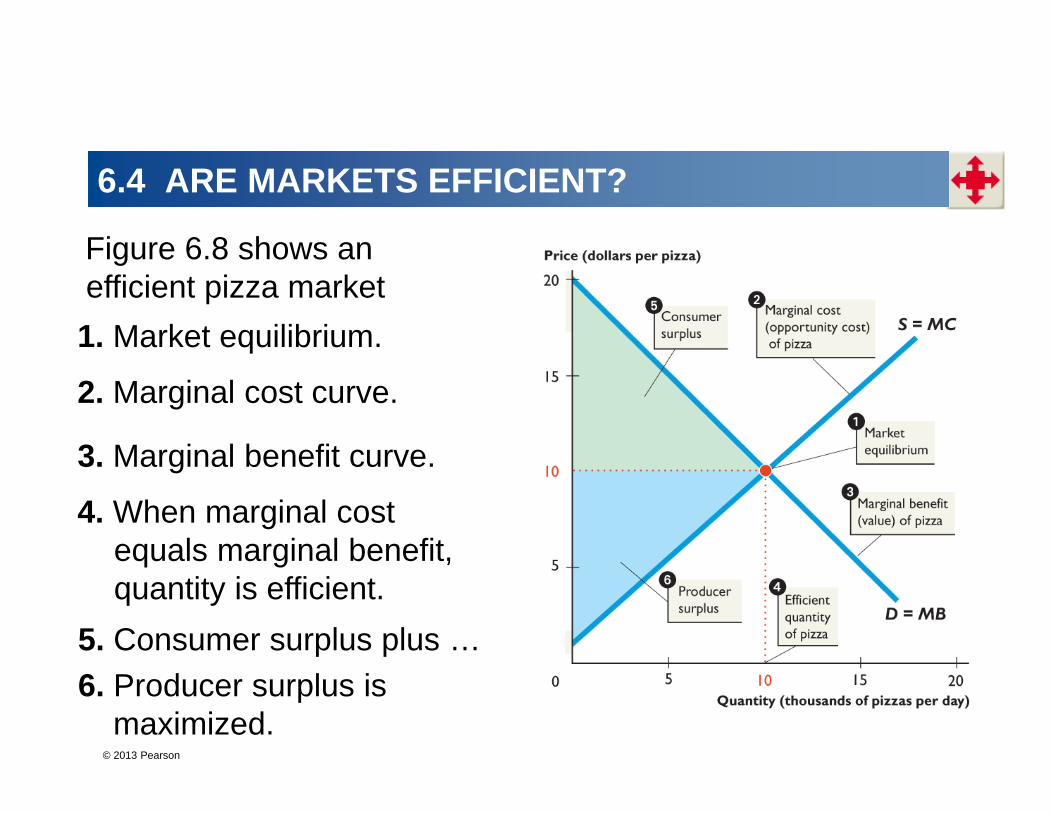
6.4 ARE MARKETS EFFICIENT?
5. Consumer surplus plus …6. Producer surplus is
maximized.
3. Marginal benefit curve.
4. When marginal cost equals marginal benefit, quantity is efficient.
2. Marginal cost curve.
Figure 6.8 shows an efficient pizza market1. Market equilibrium.

© 2013 Pearson
© 2013 Pearson
6.4 ARE MARKETS EFFICIENT?
In a competitive market:• The demand curve shows buyers’ marginal benefit. • The supply curve shows the sellers’ marginal cost.
So at the equilibrium in a competitive market, marginal benefit equals marginal cost.
Resources allocation is efficient.
So the competitive market delivers the efficient quantity.
© 2013 Pearson
6.4 ARE MARKETS EFFICIENT?
Total Surplus Is MaximizedTotal surplus is the sum of consumer surplus and producer surplus.
The competitive equilibrium maximizes total surplus.
Buyers seek the lowest possible price and sellers seek the highest possible price.
But as buyers and sellers pursue their self-interest, the social interest is served.
© 2013 Pearson
6.4 ARE MARKETS EFFICIENT?
The Invisible HandAdam Smith in the Wealth of Nations (1776) suggested that competitive markets send resources to the uses in which they have the highest value.
Smith believed that each participant in a competitive market is “led by an invisible hand to promote an end which was no part of his intention.”

© 2013 Pearson
6.4 ARE MARKETS EFFICIENT?
Market FailureMarket failure is a situation in which the market delivers an inefficient outcome.
Inefficiency can occur because:•Too little is produced—underproduction.•Too much is produced—overproduction.
© 2013 Pearson
6.4 ARE MARKETS EFFICIENT?
Underproduction
When a firm cuts production to less than the efficient quantity, a deadweight loss is created.
Deadweight loss is the decrease in total surplus and that results from an inefficient underproduction or overproduction.
The deadweight loss is borne by the entire society. It is a social loss.
© 2013 Pearson
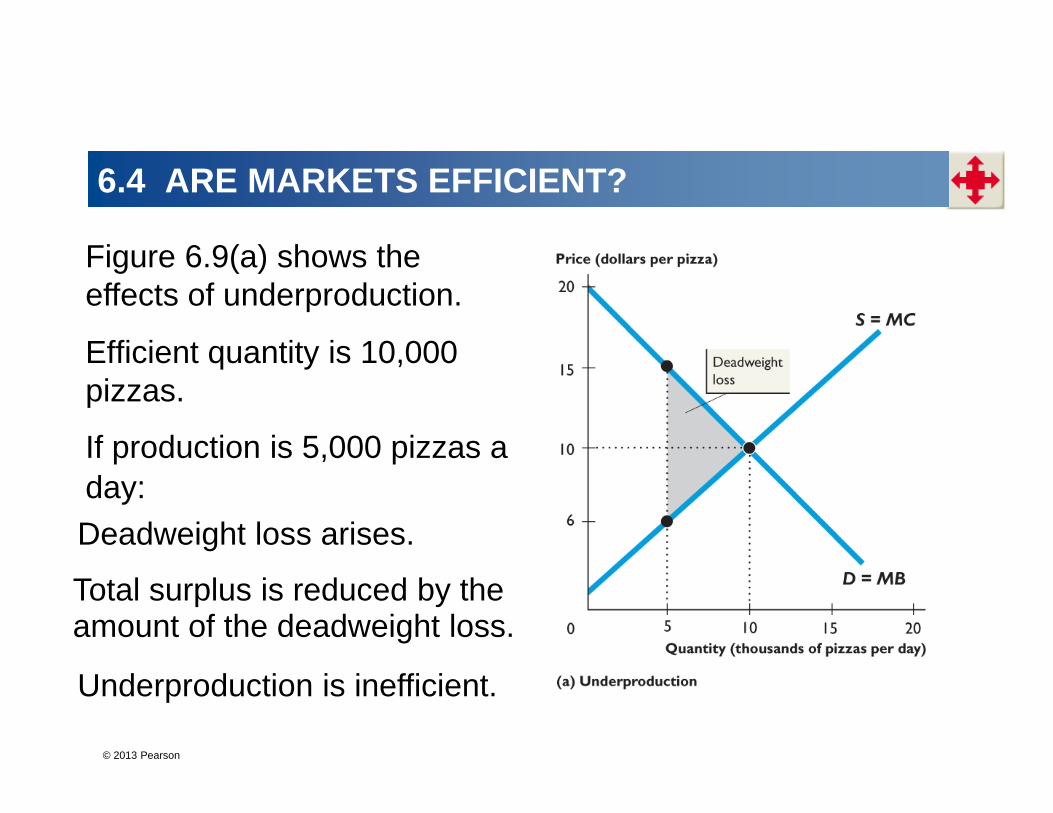
Efficient quantity is 10,000 pizzas.
If production is 5,000 pizzas a day:
Figure 6.9(a) shows the effects of underproduction.
Total surplus is reduced by the amount of the deadweight loss.
Deadweight loss arises.
6.4 ARE MARKETS EFFICIENT?
Underproduction is inefficient.

© 2013 Pearson

© 2013 Pearson
6.4 ARE MARKETS EFFICIENT?
Overproduction
When the government pays producers a subsidy, the quantity produced exceeds the efficient quantity.
A deadweight loss arises than reduces total surplus to less than its maximum.
© 2013 Pearson
6.4 ARE MARKETS EFFICIENT?
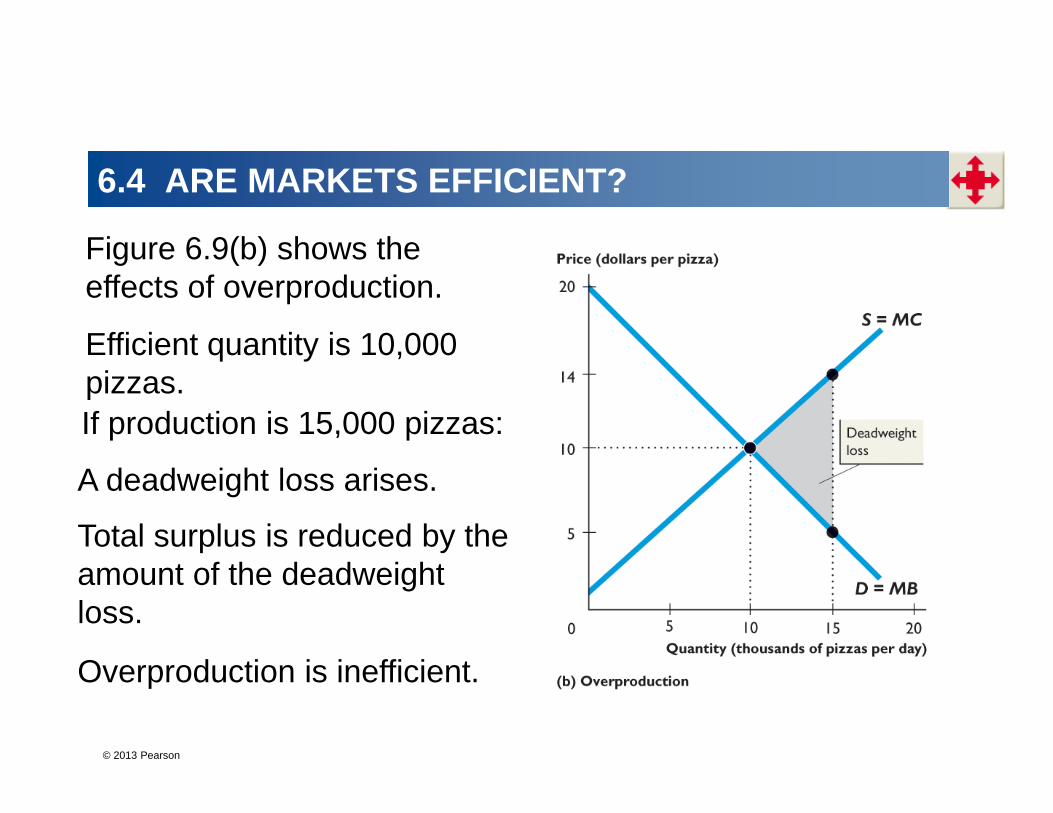
If production is 15,000 pizzas:
Figure 6.9(b) shows the effects of overproduction.
Efficient quantity is 10,000 pizzas.
A deadweight loss arises.
Total surplus is reduced by the amount of the deadweight loss.
Overproduction is inefficient.

© 2013 Pearson

© 2013 Pearson
6.4 ARE MARKETS EFFICIENT?
Sources of Market Failure
Markets generally do a good job of sending resources to where they are most highly valued.
But obstacles to efficient that bring market failure are:• Price and quantity regulations• Taxes and subsidies• Externalities• Public goods and common resources• Monopoly• High transactions costs

© 2013 Pearson
6.4 ARE MARKETS EFFICIENT?
Price and Quantity Regulations
Price regulations sometimes put a block on the price adjustments and lead to underproduction.
Quantity regulations that limit the amount that a farm is permitted to produce also leads to underproduction.

© 2013 Pearson
6.4 ARE MARKETS EFFICIENT?
Taxes and SubsidiesTaxes increase the prices paid by buyers and lower the prices received by sellers.So taxes decrease the quantity produced and lead to underproduction.Subsidies lower the prices paid by buyers and increase the prices received by sellers.So subsidies increase the quantity produced and lead to overproduction.
© 2013 Pearson
6.4 ARE MARKETS EFFICIENT?
Externalities
An externality is a cost or benefit that affects someone other than the seller or the buyer of a good.
An electric utility creates an external cost by burning coal that creates acid rain.
The utility doesn’t consider this cost when it chooses the quantity of power to produce. Overproduction results.

© 2013 Pearson
6.4 ARE MARKETS EFFICIENT?
An apartment owner would provide an external benefit if she installed an smoke detector. But she doesn’t consider her neighbor’s marginal benefit and decides not to install the smoke detector.
The result is underproduction.

© 2013 Pearson
6.4 ARE MARKETS EFFICIENT?
Public Goods and Common Resources
A public good benefits everyone and no one can be excluded from its benefits.
It is in everyone’s self-interest to avoid paying for a public good (called the free-rider problem), which leads to underproduction.
© 2013 Pearson
6.4 ARE MARKETS EFFICIENT?
A common resource is owned by no one but used by everyone.
It is in everyone’s self interest to ignore the costs of their own use of a common resource that fall on others (called tragedy of the commons), which leads to overproduction.

© 2013 Pearson
6.4 ARE MARKETS EFFICIENT?
Monopoly
A monopoly is a firm that is sole provider of a good or service.
The self-interest of a monopoly is to maximize its profit. To do so, a monopoly sets a price to achieve its self-interested goal.
As a result, a monopoly produces too little and underproduction results.

© 2013 Pearson
6.4 ARE MARKETS EFFICIENT?
High Transactions Costs
Transactions costs are the opportunity costs of making trades in a market.
To use market prices as the allocators of scarce resources, it must be worth bearing the opportunity cost of establishing a market.
Some markets are just too costly to operate.
When transactions costs are high, the market might underproduce.

© 2013 Pearson
6.4 ARE MARKETS EFFICIENT?
Alternatives to the Market
No one method allocates resources efficiently. But supplemented by other methods, markets do an amazingly good job.
Table 6.1 on the next slide shows some possible remedies for market inefficiencies.

© 2013 Pearson
6.4 ARE MARKETS EFFICIENT?

© 2013 Pearson
6.5 ARE MARKETS FAIR?
Two broad and generally conflicting views of fairness are:
• It’s not fair if the rules aren’t fair• It’s not fair if the result isn’t fair.
© 2013 Pearson
6.5 ARE MARKETS FAIR?
It’s Not Fair if the Rules Aren’t FairThis idea translates into “equality of opportunity.”
Harvard philosopher, Robert Nozick, in Anarchy, State, and Utopia (1974), argues that the rules must be fair and must respect two principles:
• The state must enforce laws that establish and protect private property.
• Private property may be transferred from one person to another only by voluntary exchange.

© 2013 Pearson
6.5 ARE MARKETS FAIR?
It’s Not Fair if the Result Isn’t FairThe fair rules approach is consistent with allocative efficiency, but the distribution might be “too unequal.”
Most people recognize that there is no easy answer or principle to guide the amount of equality.
The fair results approach conflicts with efficiency and leads to what is called the “big tradeoff.”
© 2013 Pearson
6.5 ARE MARKETS FAIR?
The big tradeoff is a tradeoff between efficiency and fairness that recognizes the cost of making income transfers.
The tradeoff is between the size of the economic pie and the degree of equality with which it is shared.
The greater the amount of income redistribution through income taxes, the greater is the inefficiency —the smaller is the economic pie.
© 2013 Pearson
6.5 ARE MARKETS FAIR?
Taking all the costs of income transfers into account, the fair distribution of the economic pie is the one that makes the poorest person as well off as possible.
The “fair results” ideas require a change in the results after the game is over. Some say that this in itself is unfair.
© 2013 Pearson
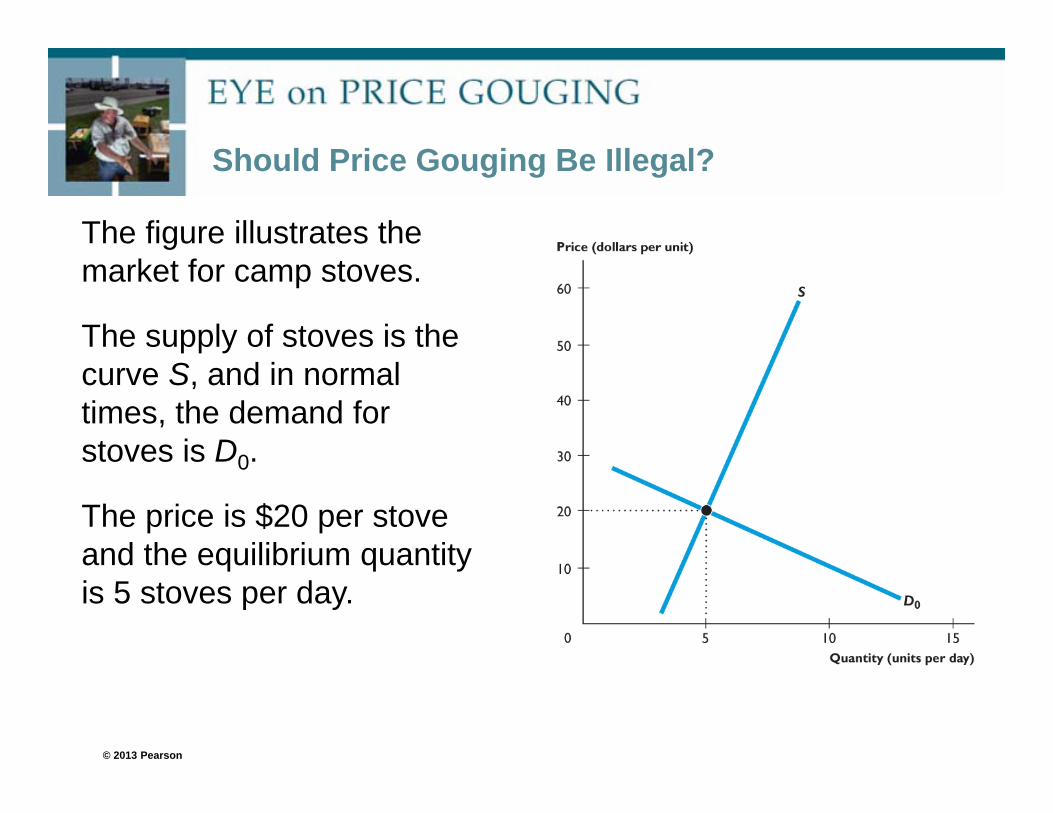
Should Price Gouging Be Illegal?
The figure illustrates the market for camp stoves.
The supply of stoves is the curve S, and in normal times, the demand for stoves is D0.
The price is $20 per stove and the equilibrium quantity is 5 stoves per day.

© 2013 Pearson
Should Price Gouging Be Illegal?
Following a hurricane, the demand for camp stoves increases to D1.
With no price gouging law, the price jumps to $40 and the quantity increases to 7 stoves per day.
This outcome is efficient because the marginal cost of a stove equals the marginal benefit from a stove.

© 2013 Pearson
Should Price Gouging Be Illegal?
If a strict price gouging law required the price after the hurricane to be $20 a stove, ...
Then the quantity of stoves supplied would remain at 5 per day.
A deadweight loss shown by the gray triangle arises.
The price gouging law is inefficient, but is it fair?