Embed Size (px)
Citation preview

2013 Oregon State University Extension Annual Report ofAccomplishments and Results
Status: Accepted
Date Accepted: 06/16/2014
I. Report Overview1. Executive Summary
The 2013 Report of Accomplishments reflects our ongoing commitment to the vision, values andgoals of the Oregon State University Extension Service. The report reflects the continual improvementprocess of responding to the needs and issues facing Oregon communities and people. The report is alsoconsistent with Oregon State University's strategic plan that identifies three areas of excellence . . .Healthy People, Healthy Planet, Healthy Economy. The 2013-17 Plan of Work was the second year of a major re-write from previous plans andrepresents a change in philosophy about reporting as well. The new Plan of Work focuses on the fivehigh-priority areas defined by NIFA as OSU Extension planned programs but does not represent thefull breadth and depth of programs conducted by OSU Extension. The 2013 Report ofAccomplishments speaks only to approximately 55% of the 2013 programs developed, delivered andevaluated as well as reports only 66% of the total dollars utilized in program delivery . . . but the reportdoes account for 80% actual formula dollars allocated plus the matching funds. The remaining 20% offormula dollars and matching funds, in addition to other funding sources, were invested in supportingOregon's nationally renowned 4-H youth development program, which reaches one in five K-12 youthwithin the state. This Report of Accomplishments reflects a slight increase in OSU Extension faculty with 183.5employed on state and federal appropriated funds during 2013. Nine additional FTE were hired since theprevious year. However, this increase still amounts to 35.5 fewer FTE, or a 16% decrease, than when therecession began in 2008. Meanwhile the overall Extension budget is approximately 23% larger todaythan it was in 2008. One significant difference is the number of grants and contracts OSU Extensionfaculty have brought into the university to keep programs at quality delivery levels. While this is good forOregon residents, the funds from other sources often re-focus Extension's work on issues other than thepriorities defined by NIFA. OSU Extension is serving the state from corner to corner and reaching more than 1.4 millionOregonians. These numbers include contacts made in group educational events or via phone,interactive video, mail, e-mail, newsletters, site or office visits. They do not include web hits or massmedia. We are able to continue this high level of outreach thanks to over 14,000 volunteers whocontributed 1.7 million hours during the past year.
Total Actual Amount of professional FTEs/SYs for this State
Research
1862 1890 18901862
Extension
Actual
Year: 2013
183.5 0.0 0.0 0.0Plan 175.0 0.0 0.0 0.0
1 59Page ofReport Date 06/16/2014
2013 Oregon State University Extension Annual Report of Accomplishments and Results
II. Merit Review Process
1. The Merit Review Process that was Employed for this year
Internal University Panel●
Expert Peer Review●
2. Brief Explanation The 2013 report of accomplishments is the result of experts within the four colleges with activeExtension programs working closely with the Extension program leaders to identify the unique intellectualcontribution Oregon State University can make to the identified state priorities and to determine how OSUExtension can operationalize the knowledge for community outreach, engagement and adoption. Theannual plan of work was reviewed internally by the OSU Provost and the four Deans leading Extensionprograms within their colleges. Extension faculty members file their individual and team reports ofaccomplishment which are reviewed by Extension program leaders, department heads and regionaladministrators for quality and impact.
III. Stakeholder Input1. Actions taken to seek stakeholder input that encouraged their participation
● Targeted invitation to traditional stakeholder individuals● Targeted invitation to non-traditional stakeholder individuals● Targeted invitation to selected individuals from general public● Survey of traditional stakeholder individuals● Survey of the general public● Survey of selected individuals from the general public
Brief explanation.
Input was solicited through a statewide advisory network that directly advises the Vice Provostfor Outreach and Engagement and Director of Extension. This advisory committee is made up ofindividuals representing production agriculture and forestry, environmental groups, countygovernment, youth and family-serving organizations, organizations representing coastal issues, andbusiness and industry. The committee meets twice annually for two days. Additionally, thecommittee is connected with the Vice Provost and Director's office via email, conference calls andwebinars throughout the year. The Extension Citizen's Advisory Network (ECAN) provides adviceregarding future trends and priorities, current and emerging issues, program emphasis and direction,organization and relationships, and funding partnerships. ECAN members also serve as the primaryliaison with people in their community, including local government and key Extension constituencies,to seek and coordinate advice regarding current and future direction for OSU Extension Serviceprogram emphasis. Every county in the state maintains an advisory structure. These include both general broad-based advisory systems and those that are more specific to programming areas. These advisorygroups generally meet 4-12 times per year to actively review programming and to provide input tocounty faculty and Extension leadership. Each academic college with Extension programming maintains advisory structures at thecollege and departmental level. These inform Extension programming within each of these units.
2 59Page ofReport Date 06/16/2014

2013 Oregon State University Extension Annual Report of Accomplishments and Results
2(A). A brief statement of the process that was used by the recipient institution to identifyindividuals and groups stakeholders and to collect input from them1. Method to identify individuals and groups
● Use Advisory Committees
● Use Internal Focus Groups
● Use External Focus Groups
● Open Listening Sessions
● Needs Assessments
● Use Surveys
● Other (Web searches of potential participants, Organizational Transformation faculty panel,Extension Demographer, Visioning Project and Strategic Planning)
Many mechanisms are used to identify individuals, groups and organizations that areExtension stakeholders. Some specific efforts are cited below:
• We conduct internet searches to identify organizations with stakes in various programs. • We confer with partnering organizations to identify and engage appropriate stakeholders. • We confer with existing advisors about other groups and individuals that should provide input. • We actively solicit internal input about appropriate stakeholders to add to advisory structures orto survey about need and effectiveness of Extension programming. • We utilize demographic data to ensure that all segments of society are adequately representedamong identified stakeholder groups and especially among those groups providing input to thedecision-making processes.
Brief explanation.
2(B). A brief statement of the process that was used by the recipient institution to identifyindividuals and groups who are stakeholders and to collect input from them1. Methods for collecting Stakeholder Input
Meeting with traditional Stakeholder groups●Meeting with traditional Stakeholder individuals●Survey of the general public●Meeting specifically with non-traditional groups●Meeting specifically with non-traditional individuals●Survey of selected individuals from the general public●
In 2006, Extension added a full-time demographer to the faculty in order to access, interpretand respond to Oregon's changing demographics more effectively. In 2007 we collaborated withWSU and their Center for Bridging the Digital Divide in a visioning project that helped define thepossibilities for OSU in the year 2017. This project, a series of in-depth interviews with keystakeholders, yielded both formative and summative data for planning purposes. In 2009-2010 afaculty panel for organizational transformation was charged to develop a holistic framework toengage stakeholders in identifying and exploring issues and needs facing Oregon communities and
Brief explanation.
3 59Page ofReport Date 06/16/2014

2013 Oregon State University Extension Annual Report of Accomplishments and Results
people. From data collected a menu of opportunities were developed and shaped the Plan of Workfor 2013-2017.
3. A statement of how the input will be considered
● In the Budget Process
● To Identify Emerging Issues
● Redirect Extension Programs
● In the Staff Hiring Process
● To Set Priorities
Stakeholder input is widely used to set priorities at all levels of the organization. Thisinfluences budgetary outlays for various programs and subsequently affects the program delivery. Stakeholders serve on all faculty search committees and thus directly affect hiring decisions. Theprocess of involving stakeholders in the hiring process works well, with stakeholders feeling agreater commitment to helping new hires be successful in their Extension assignments. Stakeholders who have a vested interest in the program and/or community are the most effective. Each Extension program area is expected to develop an annual program plan of work thatrequires a description of how stakeholder input was gathered and used to determine the prioritywork areas and their associated program outcomes.
Brief explanation.
Brief Explanation of what you learned from your Stakeholders Stakeholders encouraged us to build on existing strengths and expertise that have earnedOSU Extension national stature. Stakeholders rated OSU Extension high in response to the rapidlychanging needs of society within an increasingly competitive education and information environmentby creating and providing access to innovation and relevant research, program, intellectualresources and information that meet a broad range of individual, organizational and societal needs. Through the use of existing and emerging technologies, OSU Extension should provide learnerswith access to education where, when and how learners want. For many stakeholders there is agreater need for blending of university missions (learning, discovery and engagement) than fundingstreams often allow. Three new (or revised) program priorities emerged as future directions forExtension: 1. economic prosperity, supporting jobs and the economy through expanded work withnatural resources and the workforce; 2. food systems and many dimensions of food safety andsecurity; and 3. increasing access to credit and noncredit programs.
4 59Page ofReport Date 06/16/2014

2013 Oregon State University Extension Annual Report of Accomplishments and Results
IV. Expenditure Summary
Extension
Hatch
03360325 0
Evans-Allen
Research
1890 ExtensionSmith-Lever 3b & 3c
0
1. Total Actual Formula dollars Allocated (prepopulated from C-REEMS)
Extension
Hatch Evans-Allen
Research
1890 ExtensionSmith-Lever 3b & 3c
2. Totaled Actual dollars from Planned Programs Inputs
ActualFormulaActualMatchingActual AllOtherTotal ActualExpended
2671459 0 0 0
2671459 0 0 0
8660307 0 0 0
14003225 000
3. Amount of Above Actual Formula Dollars Expended which comes from Carryover funds from previous
Carryover 0 0 0 0
5 59Page ofReport Date 06/16/2014

2013 Oregon State University Extension Annual Report of Accomplishments and Results
V. Planned Program Table of Content
S. No. PROGRAM NAME
1 Climate Change
2 Food Safety
3 Global Food Security and Hunger
4 Reducing Childhood Obesity
5 Sustainable Energy
6 59Page ofReport Date 06/16/2014

2013 Oregon State University Extension Annual Report of Accomplishments and Results
V(A). Planned Program (Summary)
1. Name of the Planned ProgramProgram # 1
Climate Change
Reporting on this Program
V(B). Program Knowledge Area(s)
1. Program Knowledge Areas and Percentage
KACode
Knowledge Area %1862Extension
%1890Extension
%1862Research
%1890Research
101 Appraisal of Soil Resources 5%102 Soil, Plant, Water, Nutrient Relationships 6%
103 Management of Saline and Sodic Soilsand Salinity 2%
112 Watershed Protection and Management 4%121 Management of Range Resources 10%
122 Management and Control of Forest andRange Fires 5%
123 Management and Sustainability of ForestResources 10%
136 Conservation of Biological Diversity 3%
201 Plant Genome, Genetics, and GeneticMechanisms 2%
212 Pathogens and Nematodes AffectingPlants 6%
215 Biological Control of Pests Affecting Plants 4%302 Nutrient Utilization in Animals 4%303 Genetic Improvement of Animals 7%311 Animal Diseases 3%604 Marketing and Distribution Practices 3%
605 Natural Resource and EnvironmentalEconomics 3%
712Protect Food from Contamination byPathogenic Microorganisms, Parasites,and Naturally Occurring Toxins
2%
723 Hazards to Human Health and Safety 7%
804Human Environmental Issues ConcerningApparel, Textiles, and Residential andCommercial Structures
8%
902 Administration of Projects and Programs 6%Total 100%
7 59Page ofReport Date 06/16/2014

2013 Oregon State University Extension Annual Report of Accomplishments and Results
V(C). Planned Program (Inputs)1. Actual amount of FTE/SYs expended this Program
1862 1862
Extension
1890
Research
1890
Plan 10.0 0.00.00.0
Year: 2013
0.0 0.0 0.09.4Actual Paid ProfessionalActual Volunteer 37.0 0.0 0.0 0.0
2. Actual dollars expended in this Program (includes Carryover Funds from previous years)
ResearchExtension
Smith-Lever 3b & 3c 1890 Extension Hatch Evans-Allen
1890 Matching
1890 All Other
1862 Matching
1862 All Other
1890 Matching
1890 All Other
1862 Matching
1862 All Other
243623
243623
787301 0
0
0 0 0
0 0
0 0
V(D). Planned Program (Activity)1. Brief description of the Activity
Our approach to climate change outreach will involve both traditional and non-traditional methods. We will integrate climate change content into our existing educational programs, and address climate-related impacts such as drought and adverse storm damage response. This "stealth" approach to climatechange education is less likely to turn off potentially hostile audiences and has worked well in other states. We will also develop and deliver educational programs, based on current research, that shows mitigationstrategies and adaptations that can be accomplished now. For example, our forest geneticists are nowdeveloping revised seed zone maps that account for changing climate. This can assist forest owners andmanagers who are making planting decisions today for forests that will grow for over 50 years, and arelikely to be under the effects of a different climate 50 years from now. Other activities will include volunteer-based programs such as Climate Masters and MasterNaturalists, workshops and seminars, consultations and facilitations, web-based instructional programs,web sites, stand alone and web-based videos, publications of all types, mass media, and socialnetworking. 2. Brief description of the target audience
Audiences for the Oregon Extension Service are quite diverse. They include the agricultural sector,including farmers and ranchers, as well as small farms. This includes vineyards, orchards, row crops,animal livestock, nurseries, Christmas trees, and a host of others. Oregon is the second largest forested
8 59Page ofReport Date 06/16/2014

2013 Oregon State University Extension Annual Report of Accomplishments and Results
state in the nation. Timber production is a large industry and forest owners and managers constitute alarge client group. Along the Coast the fishing and tourism industries represent the main economicengines, with the possibility of ocean energy coming on line in the near future. Policy makers such ascounty commissioners and judges, elected officials, and state and federal agency personnel representanother important client group. Finally, family and youth, communities, and individual homeowners andcitizens are reached everyday through various educational programs. 3. How was eXtension used?
In 2013, Oregon's use of Ask an Expert continued to grow across the 36 counties, with 3032questions answered in the system. Oregon remains among the top five participants in the nation for Askan Expert activity. Question response time remains the best of any state at 38 hours, well below the 48hour target suggested nationally. Over 200 Extension faculty and staff and some thirty Master Gardenervolunteers are actively answering questions from Oregon and beyond.
V(E). Planned Program (Outputs)
1. Standard output measures
Direct ContactsYouth
Direct ContactsAdults
Indirect ContactsAdults
Indirect ContactsYouth2013
5168 6877 6169 8740Actual
20130
2. Number of Patent Applications Submitted (Standard Research Output)Patent Applications Submitted
Actual:Year:
Patents listed
3. Publications (Standard General Output Measure)
Number of Peer Reviewed Publications
Extension Research Total2013
8 0 0Actual
V(F). State Defined Outputs
Output Target
Output #1
● Number of educational classes
Output Measure
Year Actual
9 59Page ofReport Date 06/16/2014

2013 Oregon State University Extension Annual Report of Accomplishments and Results
2013 19Output #2
● Number of workshops
Output Measure
Year Actual2013 12
Output #3
● Number of demonstrations
Output Measure
Year Actual2013 7
Output #4
● Number of recurring newsletters published
Output Measure
Year Actual2013 25
Output #5
● Number of web sites maintained
Output Measure
Year Actual2013 7
10 59Page ofReport Date 06/16/2014

2013 Oregon State University Extension Annual Report of Accomplishments and Results
V(G). State Defined Outcomes
V. State Defined Outcomes Table of Content
O. No. OUTCOME NAME
Percentage of participants who increase their knowledge of management practices andunderstanding of climate variability and change.1
Percentage of participants in educational programs who improve mitigation strategies forclimate, such as reducing greenhouse gas emissions and increasing carbon sequestration inagricultural production and natural resource management systems.
2
Percentage of clients who employ climate adaptation strategies or incorporate climate-basedmanagement practices.3
11 59Page ofReport Date 06/16/2014

2013 Oregon State University Extension Annual Report of Accomplishments and Results
1. Outcome Measures
Percentage of participants who increase their knowledge of management practices andunderstanding of climate variability and change.
Outcome #1
2. Associated Institution Types
● 1862 Extension
3a. Outcome Type:
Change in Action Outcome Measure
3b. Quantitative Outcome
Year Actual
2013 81
3c. Qualitative Outcome or Impact Statement
Issue (Who cares and Why)Western Oregon, including Douglas County, is being invaded by several new destructive insectspecies. These insects are a threat to many if not all of our horticultural crops. These insect pestsinclude the Spotted Wing Drosophila, Grape and Vine mealybugs, and the Brown MarmoratedStink Bug. These insects need to be monitored to learn about their life cycle, favorite host plants,the time when they do the most damage, and how best to control them.
What has been doneMonitoring of the Spotted Wing Drosophila (SWD) and the Grape (GMB) and Vine mealybugs(VMB) began in 2009. Monitoring these insect pests was done by placing vinegar traps instrawberry, raspberry, blueberry, cherry, and grape crops on 12 farms for the SWD, and byplacing pheromone traps in wine grape crops on 6 farms. Traps were visited on a weekly basis tocount catches and to relay this information on to other OSU researchers at the state level. Thecollected data allowed us to understand how many generations of each insect were beingproduced, how many insects and what type survived the winter, when peak insect countsoccurred, and when crop damage was most likely to occur. We also evaluated the timing of insectpest controls and how effective they were.
ResultsDuring the first year of our insect pest monitoring program in 2009 we advised producers to trapand monitor fields we were not covering, and if pests were present, to apply controls. Manygrowers did not understand the inherent risks to their crops that these insect pests brought withthem. During the first year many growers lost entire fields of strawberries, raspberries, andcherries. Crop losses were over $50,000 for several growers. During the second crop season in2010 all commercial fruit and vegetable growers attended our outreach classes that informedgrowers how to monitor and control these pests. From 2010 to 2013 no commercial berry or treecrop grower has had fruit losses due to the SWD. In each of the last three years the value of all
12 59Page ofReport Date 06/16/2014

2013 Oregon State University Extension Annual Report of Accomplishments and Results
berry crops produced in Douglas County surpassed $4,000,000. Extension educational programs,farm visits and trapping, and OSU publications have all contributed to the financial success of ourorchard and berry growers.
4. Associated Knowledge Areas
KA Code Knowledge Area101 Appraisal of Soil Resources102 Soil, Plant, Water, Nutrient Relationships103 Management of Saline and Sodic Soils and Salinity112 Watershed Protection and Management121 Management of Range Resources122 Management and Control of Forest and Range Fires123 Management and Sustainability of Forest Resources136 Conservation of Biological Diversity201 Plant Genome, Genetics, and Genetic Mechanisms212 Pathogens and Nematodes Affecting Plants215 Biological Control of Pests Affecting Plants302 Nutrient Utilization in Animals303 Genetic Improvement of Animals311 Animal Diseases604 Marketing and Distribution Practices605 Natural Resource and Environmental Economics723 Hazards to Human Health and Safety
804 Human Environmental Issues Concerning Apparel, Textiles, and Residential andCommercial Structures
902 Administration of Projects and Programs
1. Outcome Measures
Percentage of participants in educational programs who improve mitigation strategies for climate,such as reducing greenhouse gas emissions and increasing carbon sequestration in agriculturalproduction and natural resource management systems.
Outcome #2
Not Reporting on this Outcome Measure
13 59Page ofReport Date 06/16/2014
2013 Oregon State University Extension Annual Report of Accomplishments and Results
1. Outcome Measures
Percentage of clients who employ climate adaptation strategies or incorporate climate-basedmanagement practices.
Outcome #3
2. Associated Institution Types
● 1862 Extension
3a. Outcome Type:
Change in Action Outcome Measure
3b. Quantitative Outcome
Year Actual
2013 37
3c. Qualitative Outcome or Impact Statement
Issue (Who cares and Why)Oregon State University scientists have recorded more erosion along Oregon's 363-mile coast inrecent decades because of more frequent storms and higher waves crashing into beaches. Sucherosion threatens highly valuable beachfront property and local tourism, which is a majorcomponent of the Oregon coastal economy. Visitors spent $1.5 billion on the Oregon coast in2011, resulting in the employment of nearly 20,000 people and the generation of $60 million inlocal and state tax receipts.
What has been doneOSU's Sea Grant Extension is helping coastal communities develop strategies to addresserosion, flooding and landslides. Additionally, it's connecting local elected leaders and citizenswith university researchers and agency personnel so they can exchange information, hearconcerns and make plans to protect human life and property - all of which aim to preserve andpromote economic vitality on the coast.
ResultsOSU Extension contributed to the development of ground breaking proposals and provided policydirection regarding coastal hazards in the context of economic and residential development in thecoastal zone. A few examples include:
*Tillamook Adaptation plan is the first county level hazards plan proposed in Oregon.
*The Neskowin Sub Plan is the first such plan to be drafted by a local coastal community inOregon.
*OSU's consultation with DLCD/Cogan contributed to the development of Oregon's first Land UseGuide for Oregon coastal communities preparing for a subduction zone earthquake, tsunamis and
14 59Page ofReport Date 06/16/2014

2013 Oregon State University Extension Annual Report of Accomplishments and Results
extreme weather.
4. Associated Knowledge Areas
KA Code Knowledge Area101 Appraisal of Soil Resources102 Soil, Plant, Water, Nutrient Relationships103 Management of Saline and Sodic Soils and Salinity112 Watershed Protection and Management121 Management of Range Resources122 Management and Control of Forest and Range Fires123 Management and Sustainability of Forest Resources136 Conservation of Biological Diversity201 Plant Genome, Genetics, and Genetic Mechanisms212 Pathogens and Nematodes Affecting Plants215 Biological Control of Pests Affecting Plants302 Nutrient Utilization in Animals303 Genetic Improvement of Animals311 Animal Diseases604 Marketing and Distribution Practices605 Natural Resource and Environmental Economics
712 Protect Food from Contamination by Pathogenic Microorganisms, Parasites, andNaturally Occurring Toxins
723 Hazards to Human Health and Safety
804 Human Environmental Issues Concerning Apparel, Textiles, and Residential andCommercial Structures
902 Administration of Projects and Programs
V(H). Planned Program (External Factors)
External factors which affected outcomes●Natural Disasters (drought, weather extremes, etc.)
●Economy
●Appropriations changes
●Public Policy changes
●Government Regulations
●Competing Public priorities
●Competing Programmatic Challenges
●Populations changes (immigration, new cultural groupings, etc.)
Brief Explanation
Clientele's understanding and perceptions of climate change is wide-ranging, and is
15 59Page ofReport Date 06/16/2014

2013 Oregon State University Extension Annual Report of Accomplishments and Results
complicated by mistrust in source information, lack of certainty, and anxiety regarding potentialregulatory impacts. Extension is regarded by many as a source of less-biased information and ispoised to engage the public on the topic of climate change, potential impacts to our naturalresources, and adaptation strategies. Effective Extension programming should embrace relevant andsound climate science and develop information and tools that are most applicable to learners' needsin the context of their decision making processes. Maintaining trust with stakeholders is often critical to being an effective educator at the locallevel; therefore some Extension educators may be reluctant to address climate change because thetopic has become so politicized. As a result there is some extra work necessary to help Extensioneducators and researchers develop programming around climate in a way that maintains or evenbuilds on those trusting relationships. Programs built around transparency, local relevance, andassessment of risk should resonate well with the intended audience.
V(I). Planned Program (Evaluation Studies)
Evaluation Results
OSU Extension contributed to the development of ground breaking proposals and policyadoption regarding coastal hazards in the context of economic and residential development in thecoastal zone. In each of the last three years the value of all berry crops produced in one Oregon countysurpassed $4,000,000 because Extension's educational programs helped orchard and berry growersimprove their knowledge of management practices for mitigating the affects of climate change.
Key Items of Evaluation
16 59Page ofReport Date 06/16/2014

2013 Oregon State University Extension Annual Report of Accomplishments and Results
V(A). Planned Program (Summary)
1. Name of the Planned ProgramProgram # 2
Food Safety
Reporting on this Program
V(B). Program Knowledge Area(s)
1. Program Knowledge Areas and Percentage
KACode
Knowledge Area %1862Extension
%1890Extension
%1862Research
%1890Research
501 New and Improved Food ProcessingTechnologies 7%
502 New and Improved Food Products 9%701 Nutrient Composition of Food 9%703 Nutrition Education and Behavior 15%
711Ensure Food Products Free of HarmfulChemicals, Including Residues fromAgricultural and Other Sources
2%
712Protect Food from Contamination byPathogenic Microorganisms, Parasites,and Naturally Occurring Toxins
8%
722 Zoonotic Diseases and Parasites AffectingHumans 7%
723 Hazards to Human Health and Safety 16%
901 Program and Project Design, andStatistics 12%
902 Administration of Projects and Programs 7%
903 Communication, Education, andInformation Delivery 8%
Total 100%
V(C). Planned Program (Inputs)1. Actual amount of FTE/SYs expended this Program
1862 1862
Extension
1890
Research
1890
Plan 6.2 0.00.00.0
Year: 2013
0.0 0.0 0.06.6Actual Paid ProfessionalActual Volunteer 447.0 0.0 0.0 0.0
2. Actual dollars expended in this Program (includes Carryover Funds from previous years)
17 59Page ofReport Date 06/16/2014

2013 Oregon State University Extension Annual Report of Accomplishments and Results
ResearchExtension
Smith-Lever 3b & 3c 1890 Extension Hatch Evans-Allen
1890 Matching
1890 All Other
1862 Matching
1862 All Other
1890 Matching
1890 All Other
1862 Matching
1862 All Other
193219
193219
629840 0
0
0 0 0
0 0
0 0
V(D). Planned Program (Activity)1. Brief description of the Activity
• Developing and applying new technology of food processing systems • Developing products, curriculum, resources • Developing services • Presenting seminars and professional talks • Conducting workshops and training sessions • Publishing scientific findings • Partnering • Providing community education classes • Maintaining a statewide food safety hotline • Working with and supervising volunteers to deliver high quality information and programming aboutfood safety topics
2. Brief description of the target audience
There are diverse audiences for information this program generates. They can be classified into fivegeneral groups: (1) the general public and food consumers; (2) state and federal food regulatory agencies;(3) the research community including scientists working in government, industry, and academic sectors;(4) the commercial food processing industry and commodity groups; and (5) professional food handlers inorganizations such as schools and other institutions, as well as restaurants. 3. How was eXtension used?
In 2013, Oregon's use of Ask an Expert continued to grow across the 36 counties, with 3032questions answered in the system. Oregon remains among the top five participant in the nation for Ask anExpert activity. Question response time remains the best of any state at 38 hours, well below the 48 hourtarget suggested nationally. Over 200 Extension faculty and staff and some thirty Master Gardenervolunteers are actively answering questions from Oregon and beyond.V(E). Planned Program (Outputs)
1. Standard output measures
18 59Page ofReport Date 06/16/2014

2013 Oregon State University Extension Annual Report of Accomplishments and Results
Direct ContactsYouth
Direct ContactsAdults
Indirect ContactsAdults
Indirect ContactsYouth2013
6218 25270 1445 4760Actual
20130
2. Number of Patent Applications Submitted (Standard Research Output)Patent Applications Submitted
Actual:Year:
Patents listed
3. Publications (Standard General Output Measure)
Number of Peer Reviewed Publications
Extension Research Total2013
7 0 0Actual
V(F). State Defined Outputs
Output Target
Output #1
● Number of educational classes
Output Measure
Year Actual2013 86
Output #2
● Number of workshops
Output Measure
Year Actual2013 56
Output #3
● Number of demonstrations
Output Measure
Year Actual
19 59Page ofReport Date 06/16/2014

2013 Oregon State University Extension Annual Report of Accomplishments and Results
2013 114Output #4
● Number of recurring newsletter published
Output Measure
Year Actual2013 25
Output #5
● Number of web sites maintained
Output Measure
Year Actual2013 20
20 59Page ofReport Date 06/16/2014

2013 Oregon State University Extension Annual Report of Accomplishments and Results
V(G). State Defined Outcomes
V. State Defined Outcomes Table of Content
O. No. OUTCOME NAME
Number of specialty food and mainstream food processors accessing and applying sciencebased information to produce and distribute safe, nutritious, high-quality foods.1
Number of individuals improving their practices of safe food handling, food preparation, andfood preservation.2
21 59Page ofReport Date 06/16/2014

2013 Oregon State University Extension Annual Report of Accomplishments and Results
1. Outcome Measures
Number of specialty food and mainstream food processors accessing and applying science basedinformation to produce and distribute safe, nutritious, high-quality foods.
Outcome #1
2. Associated Institution Types
● 1862 Extension
3a. Outcome Type:
Change in Action Outcome Measure
3b. Quantitative Outcome
Year Actual
2013 71
3c. Qualitative Outcome or Impact Statement
Issue (Who cares and Why)Oregon Seafoods is a new processor (<5 years) with considerable startup and capitalizationcosts. An increase in sales volume and profit was needed to continue its economic viability andemployment opportunities. Without a product development component, the company neededassistance identifying and developing a new product line to support their existing canning andflexible pouch processing business.
What has been doneWith assistance from OSU Extension a line of six new soups and sauce products was identifiedfor production in 9 oz. microwaveable flexible retort pouches. OSU conducted all the product andprocess development for the new Smoked Salmon Chowder, Seafood Bisque, Ciopino, Red,Green, and Yellow Albacore Curries at its Coastal Oregon Seafood Lab. Oregon Seafoods wasalso provided technical support for the value added processing equipment selection needed toproduce the products. All of the product was in commercial production by March of 2013.
ResultsOregon Seafoods had sold around 40,000 pouches by the end of 2013 with total sales volumefrom the new products in excess of $140,000. The Seafood Bisque was a Sofi Award finalist atthe New York Fancy Food show spurring additional sales. Employment at the company hascontinued in the 6-10 employee range throughout the entire season with economic benefits to theCoos Bay area. The company has acquired several new distributors with the value addedproduct launch which should boost further sales and stimulate new introductions.
4. Associated Knowledge Areas
KA Code Knowledge Area712 Protect Food from Contamination by Pathogenic Microorganisms, Parasites, and
22 59Page ofReport Date 06/16/2014

2013 Oregon State University Extension Annual Report of Accomplishments and Results
Naturally Occurring Toxins723 Hazards to Human Health and Safety901 Program and Project Design, and Statistics902 Administration of Projects and Programs903 Communication, Education, and Information Delivery
1. Outcome Measures
Number of individuals improving their practices of safe food handling, food preparation, and foodpreservation.
Outcome #2
2. Associated Institution Types
● 1862 Extension
3a. Outcome Type:
Change in Action Outcome Measure
3b. Quantitative Outcome
Year Actual
2013 447
3c. Qualitative Outcome or Impact Statement
Issue (Who cares and Why)OSU Extension Service maintains its reputation of disseminating current, reliable research-basedfood preservation information by maintaining a knowledgeable and experienced faculty and byskillfully selecting, training and supervising volunteers to assist with reaching communityaudiences. There has been a remarkable increase of interest in home food preservation recently.To address this growing trend, it is necessary to effectively recruit and train appropriatevolunteers for involvement. Retaining volunteers increases the effectiveness of the programmingand provides assistance in the training and mentoring of more recent recruits.
What has been doneA survey was developed to assist OSU Extension Service in determining the reasons peoplepreserve their own food, the motivations they have for volunteering as a Master Food Preserver,and the factors that enhance their experience and encourage their continued involvement in theprogram. Having an understanding of this information will improve the ability of Extension facultyto apply best practices for recruiting and retaining volunteer Master Food Preservers and toincorporate these features into future programming and training.
Surveys were conducted during the 2012 Food Preservation season. Data analysis and reportingwas completed in 2013. The sample included multiple ethnic groups and both genders. Thesurvey was repeated in 6 counties in 2013. Results were available in early 2014.
23 59Page ofReport Date 06/16/2014

2013 Oregon State University Extension Annual Report of Accomplishments and Results
ResultsThe results indicate what people want to learn in the Master Food Preservers training (fermenting,drying, pressure canning, quick pickling, freezing, and how to teach), what they feel they havegained from participating (knowledge, skills and confidence) and what areas may need morefocus during the training to make volunteers competent and confident to fulfill their role ofdisseminating information to Oregonians. Curriculum for training Master Food Preservers in 2014is currently being revised to reflect the survey results.
4. Associated Knowledge Areas
KA Code Knowledge Area703 Nutrition Education and Behavior
712 Protect Food from Contamination by Pathogenic Microorganisms, Parasites, andNaturally Occurring Toxins
722 Zoonotic Diseases and Parasites Affecting Humans723 Hazards to Human Health and Safety901 Program and Project Design, and Statistics902 Administration of Projects and Programs903 Communication, Education, and Information Delivery
V(H). Planned Program (External Factors)
External factors which affected outcomes●Natural Disasters (drought, weather extremes, etc.)
●Economy
●Appropriations changes
●Public Policy changes
●Government Regulations
●Competing Public priorities
●Competing Programmatic Challenges
●Populations changes (immigration, new cultural groupings, etc.)
Brief Explanation
The 2012 illness and death of OSU Extension's food safety specialist had an impact on theoverall program; however, many stepped forward to fill the leadership gap and the programmaintained momentum, focusing on disseminating knowledge of food product development andincreasing understanding about transfer, fate and effects of environmental contaminants. In 2013focus was given to learn about the program's success and growth oppotunities from the volunteerperspective and revise curriculum based on findings. Food start-ups . . . from farmer's market stands to food carts to specialty products . . . havenever been more popular in the Pacific Northwest, but starting a food product business from scratchtakes planning and a thorough understanding of the small food start-up challenges in the industry. Food product start-up has been a growth area for OSU Extension's educational programs withdocmumented successes. In order to reach more potential entrepreneurs, we're taking the programonline in Spring 2014.
24 59Page ofReport Date 06/16/2014

2013 Oregon State University Extension Annual Report of Accomplishments and Results
V(I). Planned Program (Evaluation Studies)
Evaluation Results
Oregon Seafoods, a food business start-up wanting to expand its market, sold around 40,000soup pouches by the end of 2013 with total sales volume from the new products in excess of$140,000, kept employees working full time through the entire season, and earned a Sofi Award atthe New York FAncy Food show spurring additional sales. Data gathered through surveying Master Food Preservers will help formulate updates andrevisions for Oregon's successful volunteer training, helping volunteers be competent and confidentas they fulfill their role of disseminating food safety information to Oregonians.
Key Items of Evaluation
25 59Page ofReport Date 06/16/2014
2013 Oregon State University Extension Annual Report of Accomplishments and Results
V(A). Planned Program (Summary)
1. Name of the Planned ProgramProgram # 3
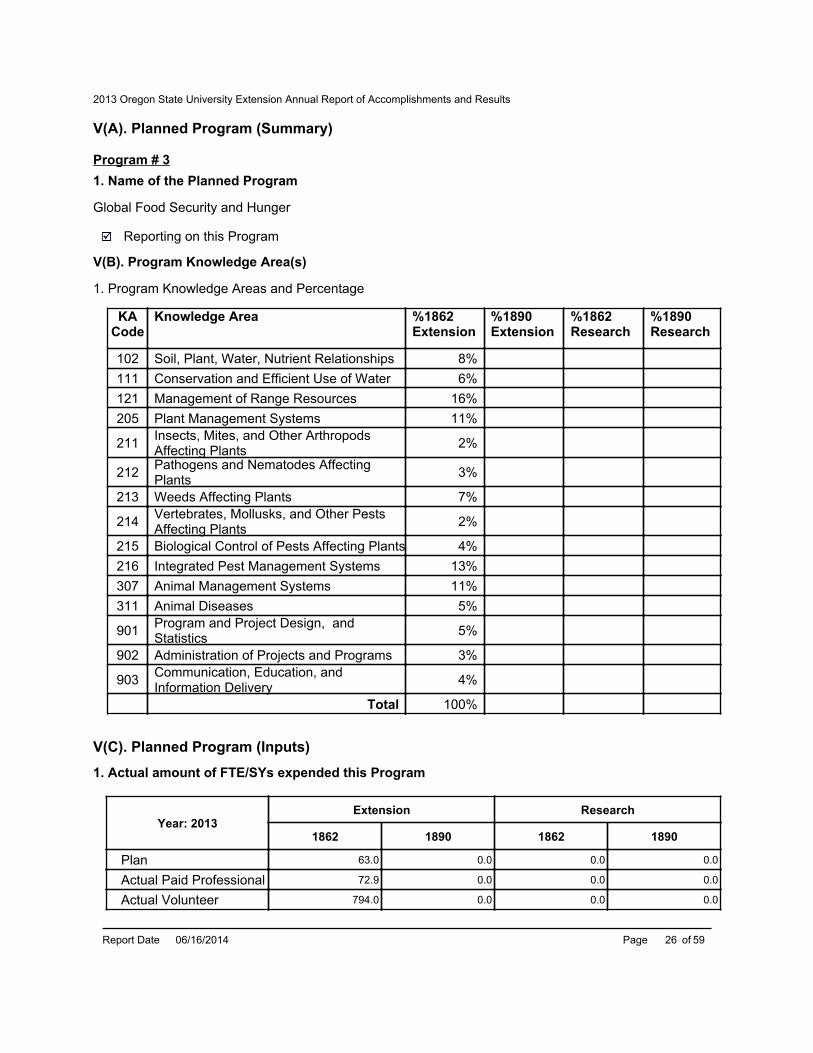
Global Food Security and Hunger
Reporting on this Program
V(B). Program Knowledge Area(s)
1. Program Knowledge Areas and Percentage
KACode
Knowledge Area %1862Extension
%1890Extension
%1862Research
%1890Research
102 Soil, Plant, Water, Nutrient Relationships 8%111 Conservation and Efficient Use of Water 6%121 Management of Range Resources 16%205 Plant Management Systems 11%
211 Insects, Mites, and Other ArthropodsAffecting Plants 2%
212 Pathogens and Nematodes AffectingPlants 3%
213 Weeds Affecting Plants 7%
214 Vertebrates, Mollusks, and Other PestsAffecting Plants 2%
215 Biological Control of Pests Affecting Plants 4%216 Integrated Pest Management Systems 13%307 Animal Management Systems 11%311 Animal Diseases 5%
901 Program and Project Design, andStatistics 5%
902 Administration of Projects and Programs 3%
903 Communication, Education, andInformation Delivery 4%
Total 100%
V(C). Planned Program (Inputs)1. Actual amount of FTE/SYs expended this Program
1862 1862
Extension
1890
Research
1890
Plan 63.0 0.00.00.0
Year: 2013
0.0 0.0 0.072.9Actual Paid ProfessionalActual Volunteer 794.0 0.0 0.0 0.0
26 59Page ofReport Date 06/16/2014

2013 Oregon State University Extension Annual Report of Accomplishments and Results
2. Actual dollars expended in this Program (includes Carryover Funds from previous years)
ResearchExtension
Smith-Lever 3b & 3c 1890 Extension Hatch Evans-Allen
1890 Matching
1890 All Other
1862 Matching
1862 All Other
1890 Matching
1890 All Other
1862 Matching
1862 All Other
1940588
1940588
6298406 0
0
0 0 0
0 0
0 0
V(D). Planned Program (Activity)1. Brief description of the Activity
Organic, value-added, and technological approaches complement conventional agriculture. By utilizingcontemporary tools in agronomy, animal or soil science, plant nutrition, pest management, and pesticidesafety, this program will disseminate improved practices and enhance the potential use of alternativecrops, reduce soil erosion, reduce the economic, social, and environmental costs of crop pests, andmaintain or increase soil health. Animal systems will reduce wastes and discharges while improvingproductivity and management techniques. Extension agriculture also will look at key areas of various social changes in the marketplace impactingproducers, retailers and consumers. We aim to disseminate information on (1) how technology impacts themarket place, with a special emphasis on rural markets in Oregon; (2) improving the well-being ofconsumers; and (3) development of economic linkages at every level of the supply chain for communitydevelopment.
2. Brief description of the target audience
• Professional peers and scientific communities, Extension faculty, veterinarians, vaccine producers; • State commodity commissions, grower groups, packers, crop consultants; • Wholesale and retail suppliers to the agricultural sector, seed producers and distributers • Natural resource industry clientele - growers, farm workers, field representatives, grower co-ops andpartnerships; • Processors and handlers, export - import sectors; • County, state and federal agencies - USDA-ARS, Oregon Department of Agriculture, NaturalResources, others; • Conservation Service, Bureau of Indian Affairs, Confederated Tribes of the Umatilla IndianReservation, US Forest Service; and Bureau of Land Management; • Policy makers, public health officials, and community leaders; • Teachers and students, Extension personnel and other educators; • Genetic companies; • Nutritional consultants; • Nonprofit conservation groups and ecologists;
27 59Page ofReport Date 06/16/2014

2013 Oregon State University Extension Annual Report of Accomplishments and Results
• Food system participants, the general public and consumers. 3. How was eXtension used?
In 2013, Oregon's use of Ask an Expert continued to grow across the 36 counties, with 3032questions answered in the system. Oregon remains among the top five participants in the nation for Askan Expert activity. Question response time remains the best of any state at 38 hours, well below the 48hour target suggested nationally. Over 200 Extension faculty and staff and some thirty Master Gardenervolunteers are actively answering questions from Oregon and beyond.V(E). Planned Program (Outputs)
1. Standard output measures
Direct ContactsYouth
Direct ContactsAdults
Indirect ContactsAdults
Indirect ContactsYouth2013
26807 62297 6992 14449Actual
20130
2. Number of Patent Applications Submitted (Standard Research Output)Patent Applications Submitted
Actual:Year:
Patents listed
3. Publications (Standard General Output Measure)
Number of Peer Reviewed Publications
Extension Research Total2013
69 0 0Actual
V(F). State Defined Outputs
Output Target
Output #1
● Number of Educational Classes Delivered
Output Measure
Year Actual2013 31
28 59Page ofReport Date 06/16/2014

2013 Oregon State University Extension Annual Report of Accomplishments and Results
Output #2
● Number of Workshops Delivered
Output Measure
Year Actual2013 543
Output #3
● Number of One-on-one Interventions
Output Measure
Year Actual2013 616
Output #4
● Number of Demonstrations
Output Measure
Year Actual2013 150
Output #5
● Number of Web Sites Maintained
Output Measure
Year Actual2013 80
29 59Page ofReport Date 06/16/2014

2013 Oregon State University Extension Annual Report of Accomplishments and Results
V(G). State Defined Outcomes
V. State Defined Outcomes Table of Content
O. No. OUTCOME NAME
Crop Production Systems -- Berry, Viticulture, Tree Fruit & Nut, Vegetable, Field Crops,Nursery, IPM, Organic Production Systems: number of farmers, field reps, and othersaccessing and applying information or knowledge resources originating from educationalprograms, publications, websites, or other events to improve production efficiencies; pestmanagement; pesticide safety, including better, linguistically appropriate information aboutpesticide safety; organic and conventional production practices; post-harvest quality;improved cultivars; and to remain competitive in global and local markets.
1
Small Farms: number of small-scale farmers accessing and applying information orknowledge resources originating from educational programs, publications, websites, or otherevents about appropriate management of nutrients and soil runoff; utilization of IPM,biological, or conventional production practices, or selection of new crops; implementation ofprofitable and diverse scale-appropriate production and value-added processing systems;farmers accessing markets.
2
Gardens, Turf, Landscape: number of farmers, field reps, and others accessing and applyinginformation or knowledge resources originating from educational programs, publications,websites, or other events to improve production efficiencies; pest management; pesticidesafety, including better, linguistically appropriate information about pesticide safety; organicand conventional production practices; post-harvest quality; improved cultivars; and to remaincompetitive in global and local markets.
3
Livestock, Rangeland and Watershed Management, Dairy: number of farmers, ranchers andland managers, accessing or applying prescribed feeding methods; practices that increasebirth weights and survival of offspring; specific management techniques such as earlyweaning, improved herd or flock health; improved production efficiency and beef qualityparameters; practices with the intent to enhance water and soil quality or practices that favorappropriate plant communities and do not allow for accelerated erosion.
4
Number of public policy makers and other interested stakeholders will be better informedabout the science basis of policy options when crafting policy related to land use, productionagriculture, alternative marketing channels, public and private recreational lands, rangelandand other public lands, urbanized watersheds, and other agricultural policy issues.
5
30 59Page ofReport Date 06/16/2014

2013 Oregon State University Extension Annual Report of Accomplishments and Results
1. Outcome Measures
Crop Production Systems -- Berry, Viticulture, Tree Fruit & Nut, Vegetable, Field Crops, Nursery,IPM, Organic Production Systems: number of farmers, field reps, and others accessing andapplying information or knowledge resources originating from educational programs, publications,websites, or other events to improve production efficiencies; pest management; pesticide safety,including better, linguistically appropriate information about pesticide safety; organic andconventional production practices; post-harvest quality; improved cultivars; and to remaincompetitive in global and local markets.
Outcome #1
2. Associated Institution Types
● 1862 Extension
3a. Outcome Type:
Change in Action Outcome Measure
3b. Quantitative Outcome
Year Actual
2013 2322
3c. Qualitative Outcome or Impact Statement
Issue (Who cares and Why)Increasing vineyard production efficiency and decreasing inputs (labor and chemical inputs) is animportant goal for Oregon wine grape producers. They have the highest production costs per acrein the nation due to small production size and a premium-tier production market. It is critical forgrowers to have a sustainable and efficient vineyard system while also keeping their productiongoals in mind. The reduction in chemical inputs (fertilizers, pesticides, and fuel) is botheconomically and environmentally beneficial.
What has been doneA research trial was conducted from 2009 to 2012 in a commercial vineyard in the WillametteValley of Oregon. A winter annual cover crop of cereal rye and crimson clover was grownbetween the vine rows of a young vineyard. The cover crop was allowed to grow through thewinter to provide protection from soil erosion and increased water infiltration during the wet winter.In spring, the cover crop was mowed and managed in different ways during spring to provide soilmoisture retention and allow for organic amendments (nutrition) addition to the soil. Thetreatments included using the biomass as a mulch in the vine row at two different rates, removingthe cover crop biomass, or tilling the biomass into the area between the vine row. All covercropped treatments were compared to a treatment where no cover crop was grown for theduration of the 4-year study.
With use of the cover crop mulch, there was a significant reduction in weeds present compared toother treatments. Even having the residue from the cover crop in the alleys between vine rows
31 59Page ofReport Date 06/16/2014

2013 Oregon State University Extension Annual Report of Accomplishments and Results
resulted in reduced weed development. The mulch layer also helped to conserve soil moisture.No irrigation was used for the duration of the study, and vines were not found to be stressed forwater, indicating that irrigation was not required. The combined effect of the mulch in providingsoil moisture conservation, reduced weeds, and increased nutrition availability resulted in vinesbeing larger and having more fruit within the first few years of the study. This has greatimplications for the effectiveness of these alternative practices to enhance development ofvineyards with both economic and environmental considerations. This study indicates that covercrops can be grown and managed in different ways to reduce inputs of herbicide, fertilizers andirrigation.
ResultsWe estimate a potential cost savings of $3,180 per acre during the establishment years for thosevineyards that use these mulching methods. One of the biggest savings was in water; no irrigationwas required during establishment. Most growers in the Willamette Valley install drip irrigationsystems into vineyards for only the establishment years, and this is a considerable cost to thegrower that is not utilized during production years. Water resources can be conserved using thesemanagement practices, an important consideration for those who may have limited or no waterrights. Based on the amount of new acreage going in over the last 4 years, we estimate that thismethod could save Oregon grape growers $5.4 million in inputs and establishment costs.
4. Associated Knowledge Areas
KA Code Knowledge Area102 Soil, Plant, Water, Nutrient Relationships111 Conservation and Efficient Use of Water205 Plant Management Systems211 Insects, Mites, and Other Arthropods Affecting Plants212 Pathogens and Nematodes Affecting Plants213 Weeds Affecting Plants214 Vertebrates, Mollusks, and Other Pests Affecting Plants215 Biological Control of Pests Affecting Plants216 Integrated Pest Management Systems901 Program and Project Design, and Statistics902 Administration of Projects and Programs903 Communication, Education, and Information Delivery
1. Outcome Measures
Small Farms: number of small-scale farmers accessing and applying information or knowledgeresources originating from educational programs, publications, websites, or other events aboutappropriate management of nutrients and soil runoff; utilization of IPM, biological, or conventionalproduction practices, or selection of new crops; implementation of profitable and diverse scale-appropriate production and value-added processing systems; farmers accessing markets.
Outcome #2
2. Associated Institution Types
32 59Page ofReport Date 06/16/2014
2013 Oregon State University Extension Annual Report of Accomplishments and Results
● 1862 Extension
3a. Outcome Type:
Change in Action Outcome Measure
3b. Quantitative Outcome
Year Actual
2013 2530
3c. Qualitative Outcome or Impact Statement
Issue (Who cares and Why)Many small farms and ranches struggle to stay viable. One way to manage economic risk is todiversify marketing channels by initiating new revenue streams. An emerging enterprise that isgenerating interest from livestock and specialty crop producers is agritourism. Agritourism islinked to economic and cultural trends: local food sales are on the rise and nearly 44 milliontravelers visit Oregon each year, bringing an estimated 8.3 billion dollars to the economy throughtourism. Agritourism offers an opportunity for farmers and ranchers to capture tourism dollars andcontribute to rural economic vitality. Creative agriculture entrepreneurs can produce considerablerevenue by encouraging visitors to their farms and ranches to purchase vegetables, meat, flowerbulbs, fruit and value added products grown and raised locally.
What has been doneTo address the educational needs of farmers interested in establishing an agritourism enterprise,the OSU Extension Service Small Farms Program convened two statewide summits. The OregonAgritourism Summit was offered in two parts. Part 1: Getting to YES for Agritourism BusinessDevelopment was intended for farmers and agri-business owners who were currently operating orinterested in agritourism opportunities to diversify economic stability. Goals of the summitincluded strengthening businesses through education, providing inspiration and networkingopportunities, and collaboratively developing a path for the future of agritourism in Oregon.
The Oregon Agritourism Summit Part 2 focused specifically on public policy and regulatoryissues. This summit was intended to reach policy makers, economic development andcommunity organizations, and agri-business owners who are interested in working togetheraround issues of agritourism as it relates to current interpretation of laws and farm sustainability.Goals of the summit included exploring regulatory issues affecting agritourism opportunities,collaborative problem solving, and identifying stakeholders interested in providing leadership forOregon agritourism.
ResultsAs a result of the OSU Extension Service Small Farms Program efforts in agritourism education,there has been movement in Oregon policy. In 2104 a working group has been assigned underthe Senate Judiciary Committee to review SB 815. This bill provides that an agri-tourism provideris not liable for injury to or death of an agritourism participant arising out of inherent risks of agri-tourism activities if the agri-tourism provider posts certain notices, eliminating one of the manyrisks and a significant barrier, fear of being sued, for agritourism owners.
33 59Page ofReport Date 06/16/2014

2013 Oregon State University Extension Annual Report of Accomplishments and Results
4. Associated Knowledge Areas
KA Code Knowledge Area102 Soil, Plant, Water, Nutrient Relationships111 Conservation and Efficient Use of Water205 Plant Management Systems211 Insects, Mites, and Other Arthropods Affecting Plants212 Pathogens and Nematodes Affecting Plants213 Weeds Affecting Plants214 Vertebrates, Mollusks, and Other Pests Affecting Plants215 Biological Control of Pests Affecting Plants216 Integrated Pest Management Systems307 Animal Management Systems311 Animal Diseases901 Program and Project Design, and Statistics902 Administration of Projects and Programs903 Communication, Education, and Information Delivery
1. Outcome Measures
Gardens, Turf, Landscape: number of farmers, field reps, and others accessing and applyinginformation or knowledge resources originating from educational programs, publications, websites,or other events to improve production efficiencies; pest management; pesticide safety, includingbetter, linguistically appropriate information about pesticide safety; organic and conventionalproduction practices; post-harvest quality; improved cultivars; and to remain competitive in globaland local markets.
Outcome #3
2. Associated Institution Types
● 1862 Extension
3a. Outcome Type:
Change in Action Outcome Measure
3b. Quantitative Outcome
Year Actual
2013 4205
3c. Qualitative Outcome or Impact Statement
Issue (Who cares and Why)
34 59Page ofReport Date 06/16/2014
2013 Oregon State University Extension Annual Report of Accomplishments and Results
Oregon has an incredibly high number of families who are food insecure, and Linn and Bentoncounties are no exception. Food insecurity refers to individuals who experience a reduced quality,variety, or desirability of diet, disrupted eating patterns or reduced food intake. When money isscarce due to other household costs (rent, childcare, transportation, health care, utilities), the foodbudget is often trimmed to free up dollars needed for these other costs. According toFeedingAmerica.org, in 2010 Benton County had a food insecurity rate of 14.8%, which equatesto 12,480 individuals. Furthermore, the Linus Pauling Institute at Oregon State Universityestimates that every month over 230 families visit the South Corvallis Food Bank to receive a six-day food box; these 230 food boxes provide food for over 1,000 people.
What has been doneThe national Plant a Row for the Hungry effort started in 1995 by the Garden Writers Associationand the OSU Benton and Linn County Master Gardeners became a member in 2008. Plant a Rowfor the Hungry (PAR) is currently a committee of enthusiastic Master Gardeners representing bothLinn and Benton counties. PAR is an effort that encourages those who grow vegetables, fruit andnuts in excess of their own needs to donate that excess to food distribution centers or soupkitchens. Gardeners are encouraged to plant an extra row of produce in their gardens for thepurpose of donation. Volunteers with PAR also staff booths at farmers' markets and other festivalevents to educate people about food insecurity and encourage them to become involved in effortsto help mitigate it.
ResultsPAR has created an impressive network of gardeners and organizations that work together tobring garden fresh produce to those in need. There are now twenty established produce drop offsites in Linn and Benton counties. In 2013, PAR recorded 5667 pounds of produce donatedthrough the program. PAR has pledges for over 300 gardeners in Linn and Benton counties forthe 2014 growing season. Through these activities and educational booths, PAR has increasedfood insecurity awareness in Linn and Benton counties while distributing much needed fresh andhealthy food.
4. Associated Knowledge Areas
KA Code Knowledge Area102 Soil, Plant, Water, Nutrient Relationships111 Conservation and Efficient Use of Water205 Plant Management Systems211 Insects, Mites, and Other Arthropods Affecting Plants212 Pathogens and Nematodes Affecting Plants213 Weeds Affecting Plants214 Vertebrates, Mollusks, and Other Pests Affecting Plants215 Biological Control of Pests Affecting Plants216 Integrated Pest Management Systems901 Program and Project Design, and Statistics902 Administration of Projects and Programs903 Communication, Education, and Information Delivery
35 59Page ofReport Date 06/16/2014

2013 Oregon State University Extension Annual Report of Accomplishments and Results
1. Outcome Measures
Livestock, Rangeland and Watershed Management, Dairy: number of farmers, ranchers and landmanagers, accessing or applying prescribed feeding methods; practices that increase birth weightsand survival of offspring; specific management techniques such as early weaning, improved herd orflock health; improved production efficiency and beef quality parameters; practices with the intent toenhance water and soil quality or practices that favor appropriate plant communities and do notallow for accelerated erosion.
Outcome #4
2. Associated Institution Types
● 1862 Extension
3a. Outcome Type:
Change in Action Outcome Measure
3b. Quantitative Outcome
Year Actual
2013 619
3c. Qualitative Outcome or Impact Statement
Issue (Who cares and Why)One of the fundamental challenges to sustaining rangeland health and productivity is broad scalevegetation change resulting from the expansion of invasive plant species. Major concerns inEastern Oregon include western juniper expansion, invasive forbs (e.g.; perennial pepperweed,Canada thistle, Russian knapweed, African rue), and exotic annual grasses (e.g., medusahead,ventenata, and cheatgrass). An increase in these invaders degrades the productivity,biodiversity, and watershed function of rangelands. These negative impacts threaten thesustainability of the cow/calf industry, which is heavily reliant on the ability of rangelands toproduce forage.
What has been doneTwo medusahead control and revegetation research/demonstration projects were implemented ineastern Harney County and western Malheur County. Both projects investigated anddemonstrated novel approaches to restoring medusahead-invaded sagebrush rangeland.
ResultsPreliminary results of these projects have important implications for private landowners and publicland managers who implement medusahead control and revegetation projects on rangeland.Results of the projects have been incorporated into a medusahead management guide for theIntermountain West that is currently being used by the Natural Resources Conservation Serviceto guide their medusahead control and revegetation projects in Harney County. In addition, theintegrated control and revegetation strategies revealed in the study were adopted by the HarneyCounty Cooperative Weed Management Area to secure a $152k Oregon Watershed
36 59Page ofReport Date 06/16/2014

2013 Oregon State University Extension Annual Report of Accomplishments and Results
Enhancement Board Grant to restore 20,000-acre area of medusahead-invaded rangeland inwestern Harney County. In addition, results of the study have also been adopted by the BakerCounty Soil and Water Conservation District in a major sage-grouse habitat restoration projectaimed at controlling and revegetating medusahead-invaded sagebrush rangeland.
4. Associated Knowledge Areas
KA Code Knowledge Area102 Soil, Plant, Water, Nutrient Relationships111 Conservation and Efficient Use of Water121 Management of Range Resources205 Plant Management Systems213 Weeds Affecting Plants307 Animal Management Systems311 Animal Diseases901 Program and Project Design, and Statistics902 Administration of Projects and Programs903 Communication, Education, and Information Delivery
1. Outcome Measures
Number of public policy makers and other interested stakeholders will be better informed about thescience basis of policy options when crafting policy related to land use, production agriculture,alternative marketing channels, public and private recreational lands, rangeland and other publiclands, urbanized watersheds, and other agricultural policy issues.
Outcome #5
2. Associated Institution Types
● 1862 Extension
3a. Outcome Type:
Change in Knowledge Outcome Measure
3b. Quantitative Outcome
Year Actual
2013 3291
3c. Qualitative Outcome or Impact Statement
Issue (Who cares and Why)Asthma is the #1 reason for school absenteeism in the nation. The house mouse is the mostsuccessful mammal on the planet second only to humans. A protein content of mouse urine is anasthma trigger. Like rats, mice are vectors for many diseases. Anaphylactic shock is rare from
37 59Page ofReport Date 06/16/2014

2013 Oregon State University Extension Annual Report of Accomplishments and Results
flying insect stings, but it does happen making pests like yellow jackets a concern. In a 2010online survey by the School IPM Program, Integrated Plant Protection Center at Oregon StateUniversity, to which 93% of Oregon school districts responded, one of the top reported indoorpest problems was mice (53% of respondents) while the top outdoor pest problem was yellowjackets (73%). Since 2008, concerns about pesticide use in schools have grown. Activist andadvocacy groups have brought the issue into the national spotlight. Pesticides, especially aerosolsprays used indoors, can trigger asthma and have long-term unknown health effects. Pest controlcompanies that do routine monthly applications scheduled by the calendar rather than by theneed for services often increase long-term costs for school districts. Applications by non-licensedapplicators can lead to exposure and injury.
What has been doneBuilding on the OSU School IPM Program's past efforts which led to passage of ORS 634.700 -750 (requiring IPM in all private and public K-12 schools, community colleges, and federal HeadStart programs), development of model IPM plans by the OSU School IPM Program, grants forpilot projects in schools, statewide school IPM coalition building, and curriculum development forschool IPM coordinator training, the OSU School IPM Program provided extensive training andsupport throughout Oregon in 2012 and 2013. The Program provided full-day, hands-on intensivetraining at 14 different locations around the state in 2012, and 10 in 2013. The IPM Coordinatorsfrom 189 school districts (representing over 98% of K-12 students), 14 Head Start Programs, 53private schools, and all 17 of Oregon's Community Colleges were trained.
ResultsFull impacts on human health and the environments within and around Oregon's public schoolscannot be known at this time, but impacts to date are reflected in the results of a 2010 (93%response rate) and 2013 (84% response rate) online survey of all 197 of Oregon school districts.
75% reported using IPM plans and materials created by the OSU School IPM Program
90% reported using non-chemical methods in 2013 compared with 67% in 2010
65% reported having a monitoring schedule and action thresholds in 2013, 36% in 2010
71% reported having a low-impact pesticides list in 2013, 38% in 2010
The model IPM plans were also used as templates by EPA region 9 in their work with tribalschools, and by the Boise, Idaho school district.
4. Associated Knowledge Areas
KA Code Knowledge Area111 Conservation and Efficient Use of Water121 Management of Range Resources205 Plant Management Systems215 Biological Control of Pests Affecting Plants216 Integrated Pest Management Systems307 Animal Management Systems311 Animal Diseases903 Communication, Education, and Information Delivery
38 59Page ofReport Date 06/16/2014
2013 Oregon State University Extension Annual Report of Accomplishments and Results
V(H). Planned Program (External Factors)
External factors which affected outcomes●Natural Disasters (drought, weather extremes, etc.)
●Economy
●Appropriations changes
●Public Policy changes
●Government Regulations
●Competing Public priorities
●Competing Programmatic Challenges
Brief Explanation
Oregon's economic recovery is slow and the demands are great. The impact of too few facultyis felt greatest in the Global Food Security and Hunger program work area because of the number ofhighly experineced and long-tenured faculty working in this planned program at the start of therecession have now retired. Because of subject matter gaps across the state where faculty retiredwe have identified priority staffing needs in order to fill key positions. We are moving to a regionalprogram model, higher level of expertise (PhD preferred) with a larger geographic assignment, tobetter address some of the pressing issues. In 2013, we began the turn around with new positionsand new resources. Staffing numbers have improved and impact will follow. Stay tuned.
V(I). Planned Program (Evaluation Studies)
Evaluation Results
Based on the amount of new vineyard acreage going in over the last 4 years, Oregon grapegrowers will save an estimated $5.4 million in inputs and establishment costs by applying OSU-testedmulching methods during the vineyards' establishment years. As a result of the OSU Extension Service Small Farms Program efforts in agritourismeducation, a working group was assigned under the Oregon Senate Judiciary Committee to reviewSB 815. This bill provides that an agri-tourism provider is not liable for injury to or death of anagritourism participant arising out of inherent risks of agri-tourism activities if the agri-tourism providerposts certain notices. At the time of this report SB 815 is still in review. A two-county, Extension Master Gardener effort to feed the hungry recorded 5667 pounds offresh produce was donated last year to assist the Linn-Benton Food Share, with pledges from over300 gardeners to support Plant a Row for the Hungry in 2014 As a result of OSU Extension efforts to halt invasive plant expansion and to sustain rangelandhealth and productivity in Eastern Oregon, private landowners and public land managers areadopting integrated control and revegetation practices. Building on the OSU School IPM Program's past efforts which led to passage of ORS
39 59Page ofReport Date 06/16/2014
2013 Oregon State University Extension Annual Report of Accomplishments and Results
634.700 - 750 (requiring IPM in all private and public K-12 schools, community colleges, and federalHead Start programs), Oregon school districts report Extension's educational effort resulted in: *90% using non-chemical methods in 2013 compared with 67% in 2010 *65% having a monitoring schedule and action thresholds in 2013, 36% in 2010 *71% having a low-impact pesticides list in 2013, 38% in 2010
Key Items of Evaluation
40 59Page ofReport Date 06/16/2014

2013 Oregon State University Extension Annual Report of Accomplishments and Results
V(A). Planned Program (Summary)
1. Name of the Planned ProgramProgram # 4
Reducing Childhood Obesity
Reporting on this Program
V(B). Program Knowledge Area(s)
1. Program Knowledge Areas and Percentage
KACode
Knowledge Area %1862Extension
%1890Extension
%1862Research
%1890Research
703 Nutrition Education and Behavior 14%704 Nutrition and Hunger in the Population 14%724 Healthy Lifestyle 17%
802 Human Development and Family Well-Being 13%
806 Youth Development 30%
901 Program and Project Design, andStatistics 5%
902 Administration of Projects and Programs 6%
903 Communication, Education, andInformation Delivery 1%
Total 100%
V(C). Planned Program (Inputs)1. Actual amount of FTE/SYs expended this Program
1862 1862
Extension
1890
Research
1890
Plan 4.0 0.00.00.0
Year: 2013
0.0 0.0 0.04.3Actual Paid ProfessionalActual Volunteer 36.0 0.0 0.0 0.0
2. Actual dollars expended in this Program (includes Carryover Funds from previous years)
41 59Page ofReport Date 06/16/2014

2013 Oregon State University Extension Annual Report of Accomplishments and Results
ResearchExtension
Smith-Lever 3b & 3c 1890 Extension Hatch Evans-Allen
1890 Matching
1890 All Other
1862 Matching
1862 All Other
1890 Matching
1890 All Other
1862 Matching
1862 All Other
100810
100810
314920 0
0
0 0 0
0 0
0 0
V(D). Planned Program (Activity)1. Brief description of the Activity
• Evidence-based educational programs and activities that are directed at parents, children,professionals, partner agencies, and other audiences. These efforts will address the stated goals (seesection V-D-2) in creative, innovative, and effective ways. • Research on new strategies through which Extension can address issues affecting childhood obesity. • Develop or select new 4-H foods curricula that focus on the youth learning to prepare healthy, localfoods. • Develop a curriculum designed to help older youth become local advocates for healthy eating andphysical activity in their communities. The curriculum will help young people learn how to conductcommunity assessments and lead community change efforts that focus on education, system building, andpolicy development.
2. Brief description of the target audience
• Children, youth, and families across Oregon • Youth professionals • Agency personnel who work with children and families
3. How was eXtension used?
In 2013, Oregon's use of Ask an Expert continued to grow across the 36 counties, with 3032questions answered in the system. Oregon remains among the top five participant in the nation for Ask anExpert activity. Question response time remains the best of any state at 38 hours, well below the 48 hourtarget suggested nationally. Over 200 Extension faculty and staff and some thirty Master Gardenervolunteers are actively answering questions from Oregon and beyond.
V(E). Planned Program (Outputs)
1. Standard output measures
42 59Page ofReport Date 06/16/2014
2013 Oregon State University Extension Annual Report of Accomplishments and Results
Direct ContactsYouth
Direct ContactsAdults
Indirect ContactsAdults
Indirect ContactsYouth2013
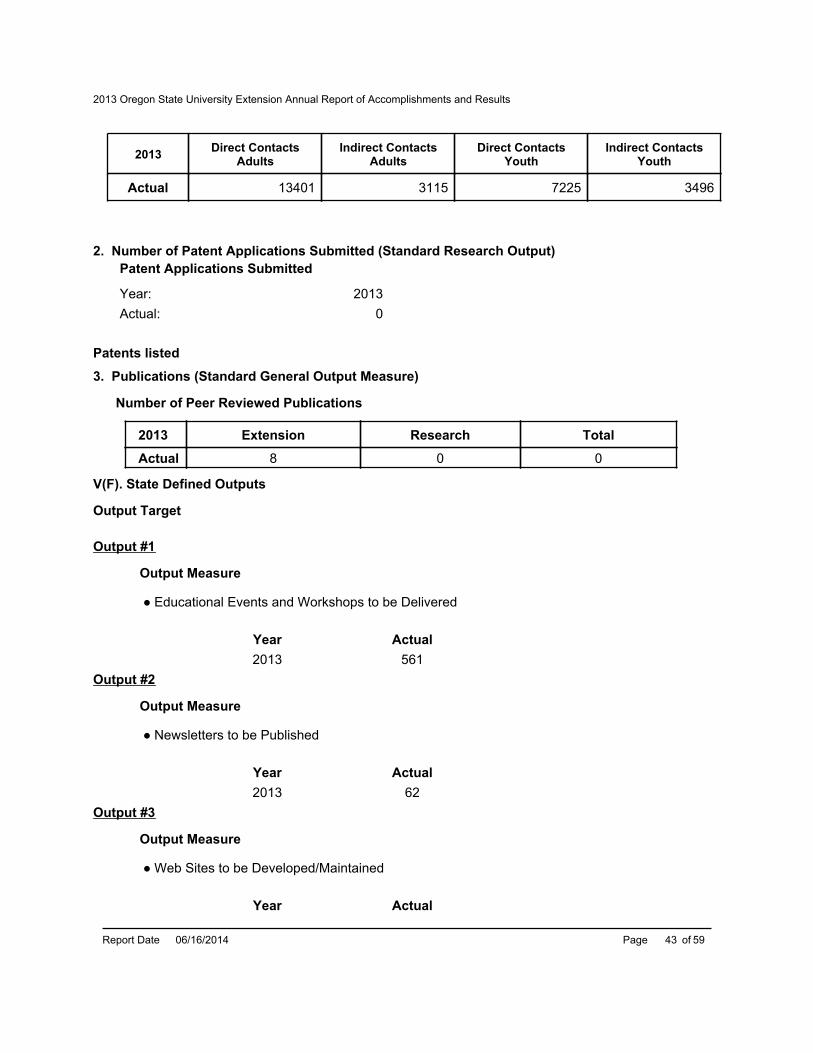
13401 3115 7225 3496Actual
20130
2. Number of Patent Applications Submitted (Standard Research Output)Patent Applications Submitted
Actual:Year:
Patents listed
3. Publications (Standard General Output Measure)
Number of Peer Reviewed Publications
Extension Research Total2013
8 0 0Actual
V(F). State Defined Outputs
Output Target
Output #1
● Educational Events and Workshops to be Delivered
Output Measure
Year Actual2013 561
Output #2
● Newsletters to be Published
Output Measure
Year Actual2013 62
Output #3
● Web Sites to be Developed/Maintained
Output Measure
Year Actual
43 59Page ofReport Date 06/16/2014

2013 Oregon State University Extension Annual Report of Accomplishments and Results
2013 42
44 59Page ofReport Date 06/16/2014

2013 Oregon State University Extension Annual Report of Accomplishments and Results
V(G). State Defined Outcomes
V. State Defined Outcomes Table of Content
O. No. OUTCOME NAME
Children practice healthy eating as defined by the current U.S. Dietary Guidelines forAmericans. (Percentage of target audience indicating positive change in measured outcome.)1
Children engage in healthy levels of physical activity as defined by national physical activityguidelines. (Percent of target audience indicating positive change in measured outcome.)2
Increases in positive levels of Knowledge, Attitude, Skill and Aspiration (KASA) outcomes (asper Bennett & Rockwell, 1995) related to goals of reducing obesity. (Percent of targetaudience indicating positive change in measured outcomes.)
3
45 59Page ofReport Date 06/16/2014

2013 Oregon State University Extension Annual Report of Accomplishments and Results
1. Outcome Measures
Children practice healthy eating as defined by the current U.S. Dietary Guidelines for Americans.(Percentage of target audience indicating positive change in measured outcome.)
Outcome #1
2. Associated Institution Types
● 1862 Extension
3a. Outcome Type:
Change in Action Outcome Measure
3b. Quantitative Outcome
Year Actual
2013 81
3c. Qualitative Outcome or Impact Statement
Issue (Who cares and Why)Childhood obesity is a national epidemic and has increased significantly in recent decades, andthe problem is significant in Oregon as well. Research has demonstrated that childhood obesityis linked to numerous factors including low availability and high cost of healthy foods, low levels ofphysical activity, extensive advertising of high-calorie, high-fat foods, and lack of awareness onthe part of families about multiple aspects of a healthy diet.
What has been doneProgramming with limited resource families consisted of a series of four, 2-hour classes offeredduring July and September 2013. Lessons included: Plan, Shop, and Save/Get Moving; VaryYour Veggies/Focus on Fruit; Make Half Your Grains Whole; Build Strong Bones. Each lessonwas supported by hands-on food preparation/ tasting and multiple opportunities to gain/practiceskills in food budgeting, meal planning, label reading, recipe modification, and food safety. 5thand 6th graders who participated in the classes with adult family members completed a 4-pointscale behavioral checklist administered as a pre- and post-test as well as a pre- and post-surveymeasuring knowledge gained.
ResultsThe 831 participating youth reported significant improvements in the frequency of practices in thefollowing behaviors:47% Watched portion size to avoid eating too much79% Chose fat-free or low fat dairy/milk products78% Ate breakfast more often81% Ate at least 2 kind of fruits each day
4. Associated Knowledge Areas
46 59Page ofReport Date 06/16/2014

2013 Oregon State University Extension Annual Report of Accomplishments and Results
KA Code Knowledge Area703 Nutrition Education and Behavior704 Nutrition and Hunger in the Population724 Healthy Lifestyle802 Human Development and Family Well-Being806 Youth Development
1. Outcome Measures
Children engage in healthy levels of physical activity as defined by national physical activityguidelines. (Percent of target audience indicating positive change in measured outcome.)
Outcome #2
2. Associated Institution Types
● 1862 Extension
3a. Outcome Type:
Change in Action Outcome Measure
3b. Quantitative Outcome
Year Actual
2013 75
3c. Qualitative Outcome or Impact Statement
Issue (Who cares and Why)Childhood obesity is a national epidemic and has increased significantly in recent decades, andthe problem is significant in Oregon as well. Research has demonstrated that childhood obesityis linked to numerous factors including low availability and high cost of healthy foods, low levels ofphysical activity, extensive advertising of high-calorie, high-fat foods, and lack of awareness onthe part of families about multiple aspects of a healthy diet.
What has been doneProgramming with limited resource families consisted of a series of four, 2-hour classes offeredduring July and September 2013. Lessons included: Plan, Shop, and Save/Get Moving; VaryYour Veggies/Focus on Fruit; Make Half Your Grains Whole; Build Strong Bones. Each lessonwas supported by hands-on food preparation/ tasting and multiple opportunities to gain/practiceskills in food budgeting, meal planning, label reading, recipe modification, and food safety. 5thand 6th graders who participated in the classes with adult family members completed a 4-pointscale behavioral checklist administered as a pre- and post-test as well as a pre- and post-surveymeasuring knowledge gained.
Results
47 59Page ofReport Date 06/16/2014
2013 Oregon State University Extension Annual Report of Accomplishments and Results
The participating youth reported significant improvements in the frequency of practices in thefollowing behaviors:48% Are physically active for at least 30 minutes a day (n=831);27% Are physically active for at least 60 minutes a day (n=831)
4. Associated Knowledge Areas
KA Code Knowledge Area703 Nutrition Education and Behavior704 Nutrition and Hunger in the Population724 Healthy Lifestyle802 Human Development and Family Well-Being806 Youth Development
1. Outcome Measures
Increases in positive levels of Knowledge, Attitude, Skill and Aspiration (KASA) outcomes (as perBennett & Rockwell, 1995) related to goals of reducing obesity. (Percent of target audienceindicating positive change in measured outcomes.)
Outcome #3
2. Associated Institution Types
● 1862 Extension
3a. Outcome Type:
Change in Knowledge Outcome Measure
3b. Quantitative Outcome
Year Actual
2013 43
3c. Qualitative Outcome or Impact Statement
Issue (Who cares and Why)Childhood obesity is a national epidemic and has increased significantly in recent decades, andthe problem is significant in Oregon as well. Research has demonstrated that childhood obesityis linked to numerous factors including low availability and high cost of healthy foods, low levels ofphysical activity, extensive advertising of high-calorie, high-fat foods, and lack of awareness onthe part of families about multiple aspects of a healthy diet.
What has been doneActivities conducted in 2013 include train-the-trainer workshops and HEAL MAPPS (HealthyEating, Active Living, Mapping Attributes through Participatory Photographic Strategies)
48 59Page ofReport Date 06/16/2014

2013 Oregon State University Extension Annual Report of Accomplishments and Results
community events. Trained faculty conducted HEAL MAPPS community-based trainings. EachHEAL MAPPS training included three distinct events: MAPPS training, focus group, andcommunity conversation. To date these activities took place in seven Oregon communities.
Activities also conducted in 2013 include trainings to conduct field-based height and weightassessments of children in order to collect BMI data. Trained Extension faculty (n=9) collectedwhole school height and weight data in all six Oregon elementary schools participating in theobesity intervention program. Height and weight data were collected on 1,920 children inkindergarten through grade 6 (n=1061 boys; n=859 girls). Baseline data was collected on theschool nutrition and physical activity environments of the intervention schools using the SchoolNutrition and Physical Activity (SNPA) Environmental Assessment Tool.
ResultsThe primary goal in the obesity intervention program is to change the children's environment.Significant environment-based impacts resulting from the HEAL MAPPS community activityinclude three grants that were submitted by communities with support from Extension and basedon information gained in the HEAL MAPPS processes and/or the SNPA assessment. Clatskanie,OR, secured a $5,000 Youth Advocates for Health grant to promote youth involvement in HealthyEating, Active Living (HEAL) through community gardens. Bonanza, OR, received $500 tosupplement healthy foods at the elementary school food services, and Molalla, OR, was therecipient of an $8,000 HEAL grant from Clackamas County DHHS to support the development ofa walking/running trail on Molalla Elementary School property. The project includes a joint useagreement to allow community access to the trail.
Outcomes of the height and wight assessments include an understanding of the overweight andobesity prevalence in the elementary schools enrolled in the intervention programs. Of the 1920children assessed in grades K-6, 36% were overweight (having BMI values for their age andgender > the 85th percentile); 19% were obese (having BMI values for their age and gender > the95th percentile). Prevalence did not differ by age, but a greater proportion of children in oldergrades (3rd-6th) were classified as overweight and obese. This baseline data will be used to trackthe obesity intervention program's progress over time.
4. Associated Knowledge Areas
KA Code Knowledge Area703 Nutrition Education and Behavior704 Nutrition and Hunger in the Population724 Healthy Lifestyle802 Human Development and Family Well-Being806 Youth Development
49 59Page ofReport Date 06/16/2014

2013 Oregon State University Extension Annual Report of Accomplishments and Results
V(H). Planned Program (External Factors)
External factors which affected outcomes●Economy
●Appropriations changes
●Public Policy changes
●Government Regulations
●Competing Public priorities
●Competing Programmatic Challenges
●Populations changes (immigration, new cultural groupings, etc.)
Brief Explanation
Childhood obesity is a multi-component, complex issue with prevalence in Oregon's ruralcommunities. Because of the growing number of children at risk for obesity, additional state andfederal appropriated funds were devoted to this planned program during 2012. OSU Extensionreceived three large grants in 2011-12 and we began paying expenses of this planned program fromthese new resources. State and federal dollars were shifted to other high priority needs. We plan tocontinue this resource model in 2014, keeping the PIs and managing faculty on state and federalappropriated dollars with the primary workforce being paid through grant dollars.
V(I). Planned Program (Evaluation Studies)
Evaluation Results
Participating youth reported significant improvements in the frequency of healthy eatingpractices including controlling portion size, choosing fat-free or low fat dairy/milk products, eatingbreakfast, and increasing the amount of fruit and vegetables eaten daily. 75% of participating youth reported increased daily physical active. Three rural Oregon communities changed policies and practices to create a healthierenvironment for children at risk for obesity. The changes were a result of increased knowledge andunderstanding about community factors contributing to childhood obesity gained through OSUExtension engagement.
Key Items of Evaluation
50 59Page ofReport Date 06/16/2014

2013 Oregon State University Extension Annual Report of Accomplishments and Results
V(A). Planned Program (Summary)
1. Name of the Planned ProgramProgram # 5
Sustainable Energy
Reporting on this Program
V(B). Program Knowledge Area(s)
1. Program Knowledge Areas and Percentage
KACode
Knowledge Area %1862Extension
%1890Extension
%1862Research
%1890Research
125 Agroforestry 17%403 Waste Disposal, Recycling, and Reuse 8%
601 Economics of Agricultural Production andFarm Management 25%
608 Community Resource Planning andDevelopment 25%
902 Administration of Projects and Programs 12%
903 Communication, Education, andInformation Delivery 13%
Total 100%
V(C). Planned Program (Inputs)1. Actual amount of FTE/SYs expended this Program
1862 1862
Extension
1890
Research
1890
Plan 6.0 0.00.00.0
Year: 2013
0.0 0.0 0.06.9Actual Paid ProfessionalActual Volunteer 35.0 0.0 0.0 0.0
2. Actual dollars expended in this Program (includes Carryover Funds from previous years)
51 59Page ofReport Date 06/16/2014

2013 Oregon State University Extension Annual Report of Accomplishments and Results
ResearchExtension
Smith-Lever 3b & 3c 1890 Extension Hatch Evans-Allen
1890 Matching
1890 All Other
1862 Matching
1862 All Other
1890 Matching
1890 All Other
1862 Matching
1862 All Other
193219
193219
629840 0
0
0 0 0
0 0
0 0
V(D). Planned Program (Activity)1. Brief description of the Activity
• Lead short course and training seminars for industry personnel and growers; • Conduct basic and applied research in alternative fuel sources, energy saving techniques andrecycling of green waste products; • Engage with community and environmental organizations; • Contribute to trade and peer reviewed journal publications. 2. Brief description of the target audience
• Forest owners and managers; • Agricultural managers; • Community members; • Environmental organizations; • Livestock growers and managers; • Energy (and bio-energy) industry; • Research community at large
3. How was eXtension used?
In 2013, Oregon's use of Ask an Expert continued to grow across the 36 counties, with 3032questions answered in the system. Oregon remains among the top five participants in the nation for Askan Expert activity. Question response time remains the best of any state at 38 hours, well below the 48hour target suggested nationally. Over 200 Extension faculty and staff and some 30 Master Gardenervolunteers are actively answering questions from Oregon and beyond.V(E). Planned Program (Outputs)
1. Standard output measures
52 59Page ofReport Date 06/16/2014

2013 Oregon State University Extension Annual Report of Accomplishments and Results
Direct ContactsYouth
Direct ContactsAdults
Indirect ContactsAdults
Indirect ContactsYouth2013
3353 7786 18062 6992Actual
20130
2. Number of Patent Applications Submitted (Standard Research Output)Patent Applications Submitted
Actual:Year:
Patents listed
3. Publications (Standard General Output Measure)
Number of Peer Reviewed Publications
Extension Research Total2013
3 0 0Actual
V(F). State Defined Outputs
Output Target
Output #1
● Number of Educational Classes to be Conducted
Output Measure
Year Actual2013 28
Output #2
● Number of Workshops to be Conducted
Output Measure
Year Actual2013 26
Output #3
● Number of Group Discussions to be Conducted
Output Measure
Not reporting on this Output for this Annual Report
53 59Page ofReport Date 06/16/2014

2013 Oregon State University Extension Annual Report of Accomplishments and Results
Output #4
● Number of Demonstrations to be Conducted
Output Measure
Year Actual2013 3
Output #5
● Number of Newsletters to be Published
Output Measure
Year Actual2013 36
Output #6
● Number of Web Sites to be Developed and Maintained
Output Measure
Year Actual2013 12
54 59Page ofReport Date 06/16/2014

2013 Oregon State University Extension Annual Report of Accomplishments and Results
V(G). State Defined Outcomes
V. State Defined Outcomes Table of Content
O. No. OUTCOME NAME
Agricultural producers increase their knowledge regarding the use of agricultural crops forenergy production. (Percent increase of attendees to workshops, field days anddemonstrations.)
1
Forest owners and managers increase their knowledge regarding the use of forest biomassas an energy source. (Percentage increase in knowledge of attendes to workshops, fielddays, and demonstrations.)
2
Coastal stakeholders increase their knowledge of wave energy. (Percentage increase inknowledge of attendees to workshops, field days, and demonstrations.)3
55 59Page ofReport Date 06/16/2014

2013 Oregon State University Extension Annual Report of Accomplishments and Results
1. Outcome Measures
Agricultural producers increase their knowledge regarding the use of agricultural crops for energyproduction. (Percent increase of attendees to workshops, field days and demonstrations.)
Outcome #1
2. Associated Institution Types
● 1862 Extension
3a. Outcome Type:
Change in Knowledge Outcome Measure
3b. Quantitative Outcome
Year Actual
2013 36
3c. Qualitative Outcome or Impact Statement
Issue (Who cares and Why)Aviation uses a lot of fuel. According to John Talbott, director of the Western Region Sun Grantbased at Oregon State, the industry's biggest uncertainty is not ridership, but fuel prices. Of all thefactors impacting fuel prices, many are unpredictable, such as Middle East politics or hurricanesin the Gulf. One way to stabilize long-term prices would be to find alternative fuel sources that canbe produced renewably and domestically.
What has been doneCamelina is a particularly promising source for producing jet fuel. Because its oil is relatively highin omega-3 fatty acids and low in saturated fatty acids, camelina is considered a high-qualityedible oil as well as a source for jet fuel. OSU agronomists have put camelina to the test andfound that it can be grown with few input costs and under marginal conditions, so it has potentialboth as a dryland crop in Eastern Oregon and as a rotation crop with grass seed in the WillametteValley.
ResultsAlthough adoption of camelina is not yet a common practice among growers, workshops, fielddays, and demonstrations are increasing their knowledge regarding the use of this agriculturalcrop for energy production and its economy return to the producer. Post-event interviews indicatea growing interest in camelina with expressed interest in on-farm field trials for the 2013 growingseason.
4. Associated Knowledge Areas
KA Code Knowledge Area403 Waste Disposal, Recycling, and Reuse601 Economics of Agricultural Production and Farm Management
56 59Page ofReport Date 06/16/2014

2013 Oregon State University Extension Annual Report of Accomplishments and Results
608 Community Resource Planning and Development902 Administration of Projects and Programs903 Communication, Education, and Information Delivery
1. Outcome Measures
Forest owners and managers increase their knowledge regarding the use of forest biomass as anenergy source. (Percentage increase in knowledge of attendes to workshops, field days, anddemonstrations.)
Outcome #2
2. Associated Institution Types
● 1862 Extension
3a. Outcome Type:
Change in Knowledge Outcome Measure
3b. Quantitative Outcome
Year Actual
2013 33
3c. Qualitative Outcome or Impact Statement
Issue (Who cares and Why)Forest harvest residues (slash) left after harvesting, are normally put into a roadside grinder toincrease their bulk density before shipping to a plant because branches and tops occupy about 4-5 times the volume of solid wood. This process is known as bundling. Although density isincreased significantly by grinding there are several disadvantages. First, the grinding takes placein the field using diesel. Diesel, in the Pacific Northwest, is about three times the cost per unit ofenergy as electricity. Second, the ground materials are transported in large chip vans that do nothave the mobility that stinger-steered log trucks have. Chip vans are restricted to flatter grades,require wider roads, and must have a larger area to turn around. Third, forest residues, onceground, do not continue to dry, and under some conditions are subject to spontaneouscombustion.
What has been doneOregon's Wood Innovation Center is investigating all opportunities to reduce feedstock suppliesincluding bundling and baling. Activities include grinding tests of residues and slash bales tocompare energy requirements for comminution, examine opportunities to increase bale density,and to measure moisture content reduction over time for baled residues. A variety of workshops,field days, webinars and conferences have been conducted for forest owners and managers.
ResultsEvidence collected to date shows an increase in knowledge among forest owners and managersregarding the use of forest biomass as an energy source; however, early feedback suggests that
57 59Page ofReport Date 06/16/2014

2013 Oregon State University Extension Annual Report of Accomplishments and Results
bioenergy in general is really a large-scale industrial topic not well-suited to the small, privatelandowner. Until practical, affordable solutions to issues like transporting residues and bundlingare proven, interest to embrace forest biomass as a viable economic option is low.
4. Associated Knowledge Areas
KA Code Knowledge Area125 Agroforestry403 Waste Disposal, Recycling, and Reuse608 Community Resource Planning and Development902 Administration of Projects and Programs903 Communication, Education, and Information Delivery
1. Outcome Measures
Coastal stakeholders increase their knowledge of wave energy. (Percentage increase in knowledgeof attendees to workshops, field days, and demonstrations.)
Outcome #3
Not Reporting on this Outcome Measure
V(H). Planned Program (External Factors)
External factors which affected outcomes●Natural Disasters (drought, weather extremes, etc.)
●Economy
●Appropriations changes
●Public Policy changes
●Government Regulations
●Competing Public priorities
Brief Explanation
This planned program in the second year of the Plan of Work continues to move forward as astart-up effort. For community outreach to be most effective research outcomes are required. Untilgrowers and producers have practical, affordable solutions to their concerns, bio-processing plantsare accessible, and there are greater demands from consumers for bio-based fuels, adoption will beslow. Meanwhile, Extension educators continue to promote biomass as an option for growers andproducers to consider. After the 2012 report about Sea Grant Extension's role in securing one of the nation's firstpublic wave energy testing sites for the Oregon Coast, most of the 2013 efforts have focused onproject management and operations. In fall 2013 outreach and engagement activities began whichwill lead to better understanding of the political and regulatory processes surrounding wave energyand its environmental, social and economic sustainability. Stay tune for an update in the 2014 report.
V(I). Planned Program (Evaluation Studies)
58 59Page ofReport Date 06/16/2014

2013 Oregon State University Extension Annual Report of Accomplishments and Results
Evaluation Results
Although adoption of camelina is not yet a common practice among growers, workshops, fielddays, and demonstrations are increasing their knowledge regarding the use of this agricultural cropfor energy production and its economy return to the producer. Evidence collected to date shows an increase in knowledge among forest owners andmanagers regarding the use of forest biomass as an energy source; however, early feedbacksuggests that bioenergy in general is really a large-scale industrial topic not well-suited to the small,private landowner.
Key Items of Evaluation
59 59Page ofReport Date 06/16/2014