Embed Size (px)
Citation preview

2013 NACME Data BookDeck 2: Pre-College Educational Challenges

2 © Copyright 2013 The National Action Council for Minorities in Engineering, Inc. (NACME)
Overview/Purpose• The slides in this deck provide data on the educational preparation of students prior to college. Slides show
the different types of curricula, the extent to which students complete key courses in mathematics and science in high school, and standardized test scores in key subject areas.
• Many slides have two versions: one with and one without data labels. The graphics are “cleaner” without the labels, yet there are some audiences for which such labeling might be important.
• As with other decks, the set is not necessarily meant to be a self-contained, sequential presentation but, rather, a deck from which users may select slides for any number of presentations. The repetition, therefore, provides users with many choices to present data.
• Attribution: please indicate that the source of these slides is the National Action Council for Minorities in Engineering, Inc. (NACME), Department of Research and Program Evaluation. The NACME web address is: www.nacme.org, where the slides can be accessed and downloaded. Updated slides and additional decks covering new themes will be made available on an on-going basis.
• Terminology notes: URM = underrepresented minority, which includes African Americans, American Indians and Alaska Natives, and Latinos. When the term “American Indian” is used, it references “American Indians and Alaska Natives,” consistent with U.S. Census Bureau definitions. Asian/Pac. Isl. = Asian and Pacific Islanders are people of these descents who are U.S. citizens and permanent residents and do not include people of Asian origin who are in the United States predominantly for educational purposes. “Foreign” is used to refer to “temporary residents.” Latinos can be any race: the category in most data sources includes people of all racial backgrounds who indicated that they were “Hispanic.” “Non-Latino White” refers to people who did not indicate a Latino background and did indicate “White” as a racial category.

3 © Copyright 2013 The National Action Council for Minorities in Engineering, Inc. (NACME)3 © Copyright 2013 The National Action Council for Minorities in Engineering, Inc. (NACME)
High School Math Course Completion, by Race/Ethnicity
Deck 2.1

4 © Copyright 2013 The National Action Council for Minorities in Engineering, Inc. (NACME)
Percentage of Public and Private High School Graduates Taking Algebra I Courses in High School, 2009
Source: National Center for Education Statistics, 2012. Digest of Education Statistics, 2011.

5 © Copyright 2013 The National Action Council for Minorities in Engineering, Inc. (NACME)
Percentage of Public and Private High School Graduates Taking Algebra I Courses in High School, 2009
Source: National Center for Education Statistics, 2012. Digest of Education Statistics, 2011.
6 © Copyright 2013 The National Action Council for Minorities in Engineering, Inc. (NACME)
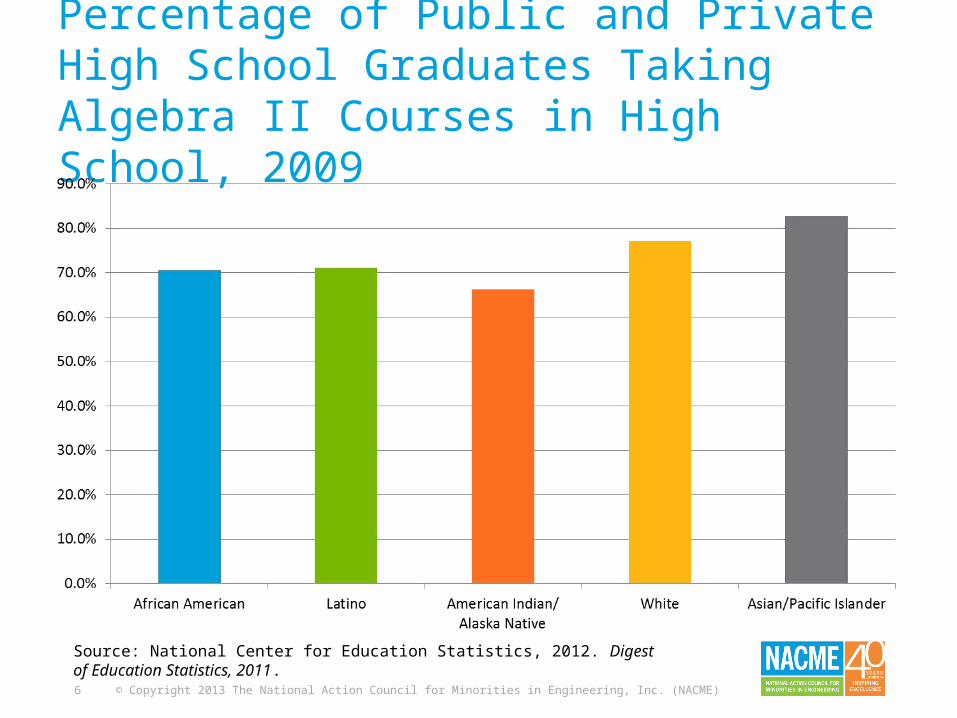
Percentage of Public and Private High School Graduates Taking Algebra II Courses in High School, 2009
Source: National Center for Education Statistics, 2012. Digest of Education Statistics, 2011.

7 © Copyright 2013 The National Action Council for Minorities in Engineering, Inc. (NACME)
Percentage of Public and Private High School Graduates Taking Algebra II Courses in High School, 2009
Source: National Center for Education Statistics, 2012. Digest of Education Statistics, 2011.

8 © Copyright 2013 The National Action Council for Minorities in Engineering, Inc. (NACME)
Percentage of Public and Private High School Graduates Taking Analysis/Pre-Calculus Courses in High School, 2009
Source: National Center for Education Statistics, 2012. Digest of Education Statistics, 2011.

9 © Copyright 2013 The National Action Council for Minorities in Engineering, Inc. (NACME)
Percentage of Public and Private High School Graduates Taking Analysis/Pre-Calculus Courses in High School, 2009
Source: National Center for Education Statistics, 2012. Digest of Education Statistics, 2011.

10 © Copyright 2013 The National Action Council for Minorities in Engineering, Inc. (NACME)
Percentage of Public and Private High School Graduates Taking Statistics/Probability Courses in High School, 2009
Source: National Center for Education Statistics, 2012. Digest of Education Statistics, 2011.
* Data should be interpreted with caution due to low n values

11 © Copyright 2013 The National Action Council for Minorities in Engineering, Inc. (NACME)
Percentage of Public and Private High School Graduates Taking Statistics/Probability Courses in High School, 2009
Source: National Center for Education Statistics, 2012. Digest of Education Statistics, 2011.
* Data should be interpreted with caution due to low n values

12 © Copyright 2013 The National Action Council for Minorities in Engineering, Inc. (NACME)
Percentage of Public and Private High School Graduates Taking Calculus Courses in High School, 2009
Source: National Center for Education Statistics, 2012. Digest of Education Statistics, 2011.

13 © Copyright 2013 The National Action Council for Minorities in Engineering, Inc. (NACME)
Percentage of Public and Private High School Graduates Taking Calculus Courses in High School, 2009
Source: National Center for Education Statistics, 2012. Digest of Education Statistics, 2011.
14 © Copyright 2013 The National Action Council for Minorities in Engineering, Inc. (NACME)
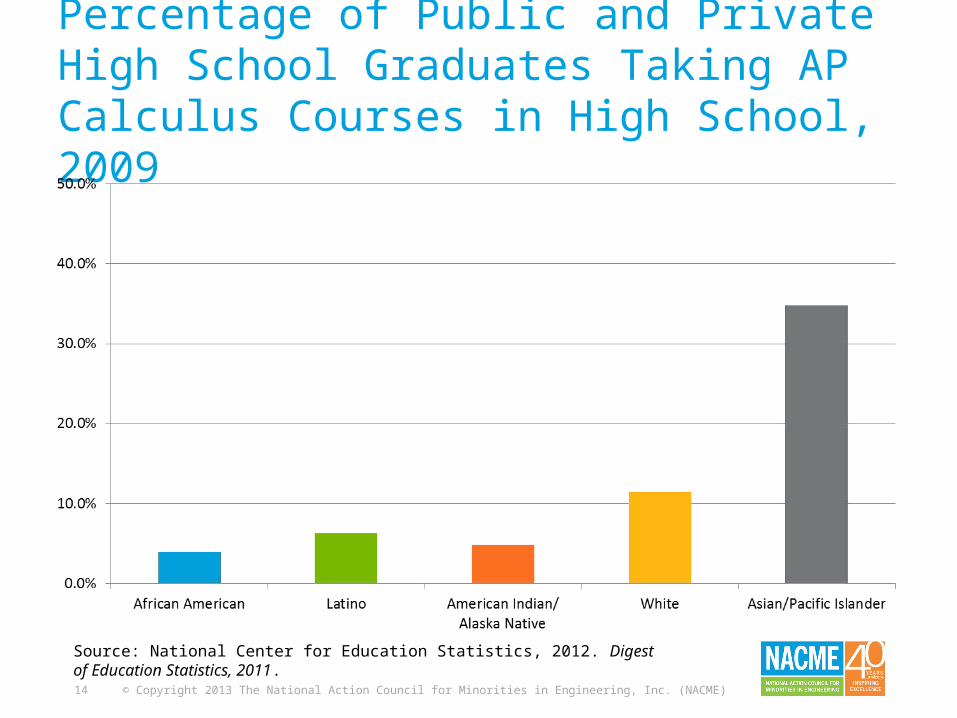
Percentage of Public and Private High School Graduates Taking AP Calculus Courses in High School, 2009
Source: National Center for Education Statistics, 2012. Digest of Education Statistics, 2011.

15 © Copyright 2013 The National Action Council for Minorities in Engineering, Inc. (NACME)
Percentage of Public and Private High School Graduates Taking AP Calculus Courses in High School, 2009
Source: National Center for Education Statistics, 2012. Digest of Education Statistics, 2011.
16 © Copyright 2013 The National Action Council for Minorities in Engineering, Inc. (NACME)16 © Copyright 2013 The National Action Council for Minorities in Engineering, Inc. (NACME)
High School Completion,by Race/Ethnicity
Deck 2.2

17 © Copyright 2013 The National Action Council for Minorities in Engineering, Inc. (NACME)
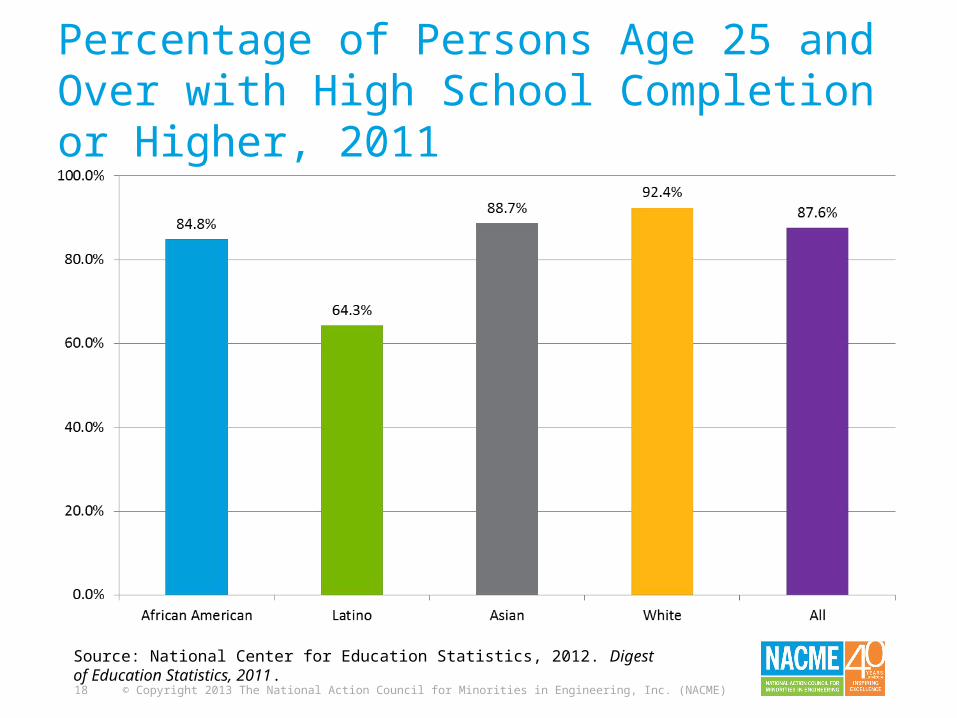
Percentage of Persons Age 25 and Over with High School Completion or Higher, 2011
Source: National Center for Education Statistics, 2012. Digest of Education Statistics, 2011.
18 © Copyright 2013 The National Action Council for Minorities in Engineering, Inc. (NACME)
Percentage of Persons Age 25 and Over with High School Completion or Higher, 2011
Source: National Center for Education Statistics, 2012. Digest of Education Statistics, 2011.

19 © Copyright 2013 The National Action Council for Minorities in Engineering, Inc. (NACME)
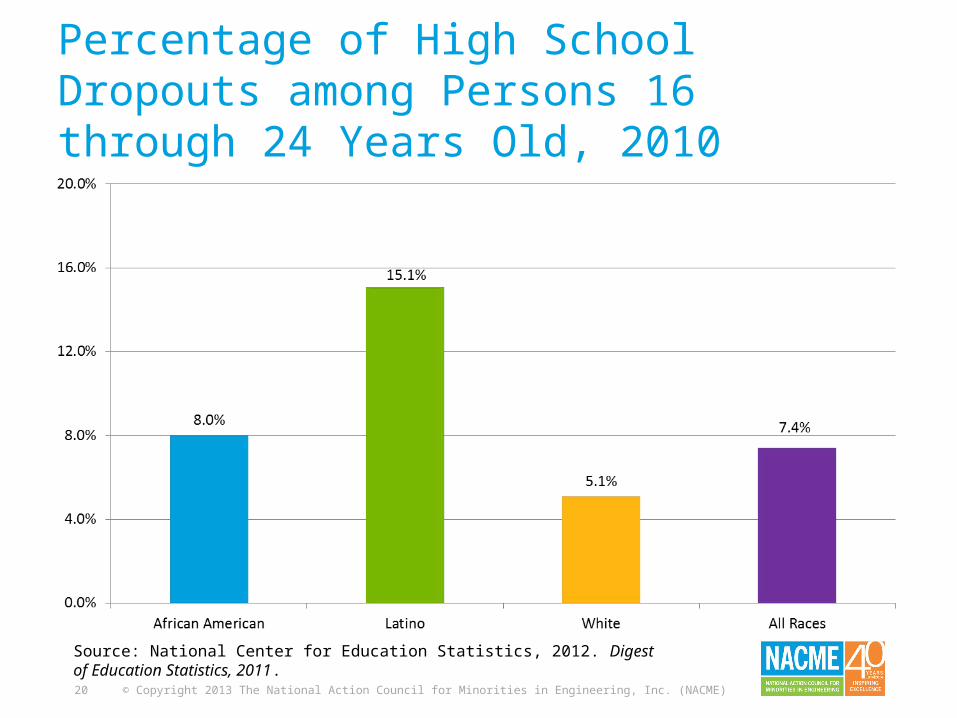
Percentage of High School Dropouts among Persons 16 through 24 Years Old, 2010
Source: National Center for Education Statistics, 2012. Digest of Education Statistics, 2011.
20 © Copyright 2013 The National Action Council for Minorities in Engineering, Inc. (NACME)
Percentage of High School Dropouts among Persons 16 through 24 Years Old, 2010
Source: National Center for Education Statistics, 2012. Digest of Education Statistics, 2011.
21 © Copyright 2013 The National Action Council for Minorities in Engineering, Inc. (NACME)21 © Copyright 2013 The National Action Council for Minorities in Engineering, Inc. (NACME)
National Assessment of Educational Progress (NAEP) Scores, by
Race/Ethnicity
Deck 2.3

22 © Copyright 2013 The National Action Council for Minorities in Engineering, Inc. (NACME)
Percentage of 17-Year-Old Students at or Above Selected Mathematics Proficiency Levels, 2008
Source: National Center for Education Statistics, 2012. Digest of Education Statistics, 2011.
Note: Scale ranges from 0 to 500

23 © Copyright 2013 The National Action Council for Minorities in Engineering, Inc. (NACME)
Percentage of 17-Year-Old Students at or Above Selected Mathematics Proficiency Levels, 2008
Source: National Center for Education Statistics, 2012. Digest of Education Statistics, 2011.
Note: Scale ranges from 0 to 500

24 © Copyright 2013 The National Action Council for Minorities in Engineering, Inc. (NACME)
Average Scale Scores for Science, Grade 12, 2009
Source: U.S. Department of Education, Institute of Education Sciences, National Center for Education Statistics, National Assessment of Educational Progress (NAEP), 2009 Science Assessment.
Note: Scale ranges from 0 to 300

25 © Copyright 2013 The National Action Council for Minorities in Engineering, Inc. (NACME)
Average Scale Scores for Science, Grade 12, 2009
Source: U.S. Department of Education, Institute of Education Sciences, National Center for Education Statistics, National Assessment of Educational Progress (NAEP), 2009 Science Assessment.
Note: Scale ranges from 0 to 300
26 © Copyright 2013 The National Action Council for Minorities in Engineering, Inc. (NACME)
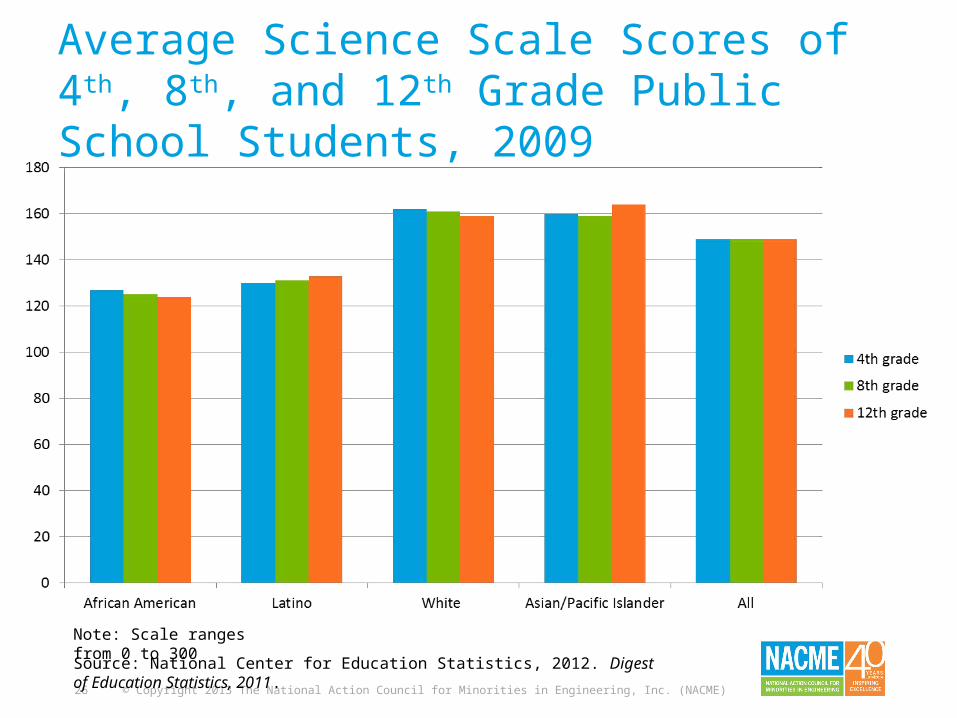
Average Science Scale Scores of 4th, 8th, and 12th Grade Public School Students, 2009
Source: National Center for Education Statistics, 2012. Digest of Education Statistics, 2011.
Note: Scale ranges from 0 to 300
27 © Copyright 2013 The National Action Council for Minorities in Engineering, Inc. (NACME)
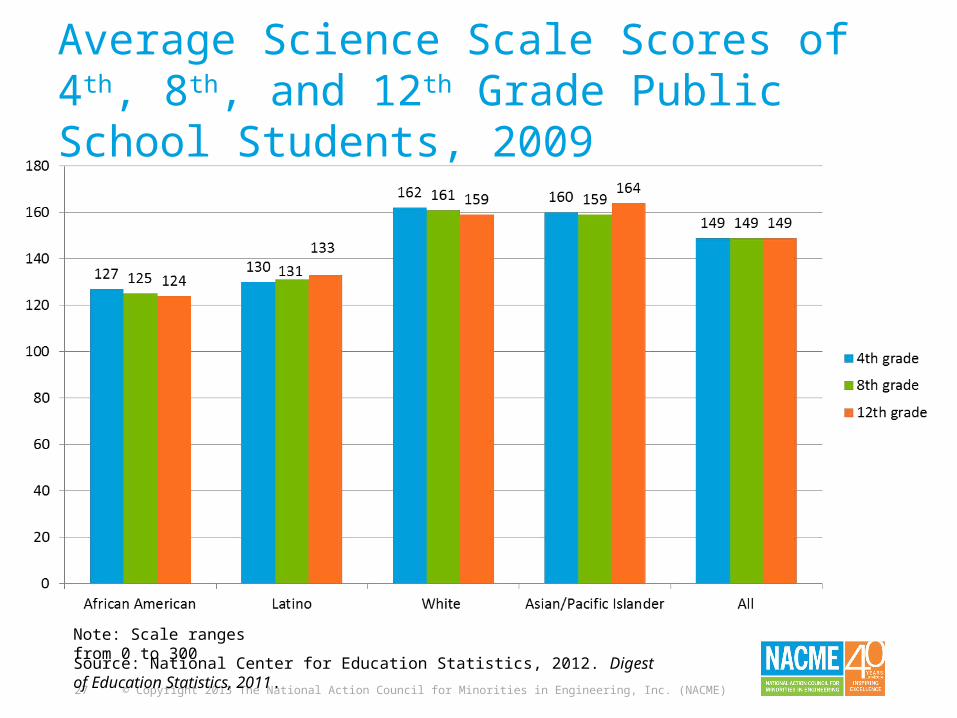
Average Science Scale Scores of 4th, 8th, and 12th Grade Public School Students, 2009
Source: National Center for Education Statistics, 2012. Digest of Education Statistics, 2011.
Note: Scale ranges from 0 to 300
28 © Copyright 2013 The National Action Council for Minorities in Engineering, Inc. (NACME)28 © Copyright 2013 The National Action Council for Minorities in Engineering, Inc. (NACME)
SAT and ACT Scores, by Race/Ethnicity
Deck 2.4

29 © Copyright 2013 The National Action Council for Minorities in Engineering, Inc. (NACME)
Mean SAT Math Score, 2012
Source: College Board, (2012). 2012 College-Bound Seniors: Total Group Profile Report. New York, NY: The College Board.
Note: Scale ranges from 200 to 800

30 © Copyright 2013 The National Action Council for Minorities in Engineering, Inc. (NACME)
Mean SAT Math Score, 2012
Source: College Board, (2012). 2012 College-Bound Seniors: Total Group Profile Report. New York, NY: The College Board.
Note: Scale ranges from 200 to 800

31 © Copyright 2013 The National Action Council for Minorities in Engineering, Inc. (NACME)
Mean ACT Scores in STEM Subjects, 2012
Source: ACT Profile Report, National (Graduating Class 2012). Accessed online at www.act.org.
Note: Scale ranges from 1 to 36

32 © Copyright 2013 The National Action Council for Minorities in Engineering, Inc. (NACME)
Mean ACT Scores in STEM Subjects, 2012
Source: ACT Profile Report, National (Graduating Class 2012). Accessed online at www.act.org.
Note: Scale ranges from 1 to 36

33 © Copyright 2013 The National Action Council for Minorities in Engineering, Inc. (NACME)
Percentage of Students Meeting ACT College Readiness Benchmark Scores, 2012
Source: College Board, (2012). 2012 College-Bound Seniors: Total Group Profile Report. New York, NY: The College Board.
Note: ACT college readiness benchmarks are 22 for Mathematics, 24 for Science, 18 for English, and 21 for Reading. A benchmark score is the minimum score needed on an ACT subject-area test to indicate a 50% chance of obtaining a B or higher or about a 75% chance of obtaining a C or higher in the corresponding credit-bearing college courses.

34 © Copyright 2013 The National Action Council for Minorities in Engineering, Inc. (NACME)
Percentage of Students Meeting ACT College Readiness Benchmark Scores, 2012
Source: College Board, (2012). 2012 College-Bound Seniors: Total Group Profile Report. New York, NY: The College Board.
Note: ACT college readiness benchmarks are 22 for Mathematics, 24 for Science, 18 for English, and 21 for Reading. A benchmark score is the minimum score needed on an ACT subject-area test to indicate a 50% chance of obtaining a B or higher or about a 75% chance of obtaining a C or higher in the corresponding credit-bearing college courses.
35 © Copyright 2013 The National Action Council for Minorities in Engineering, Inc. (NACME)
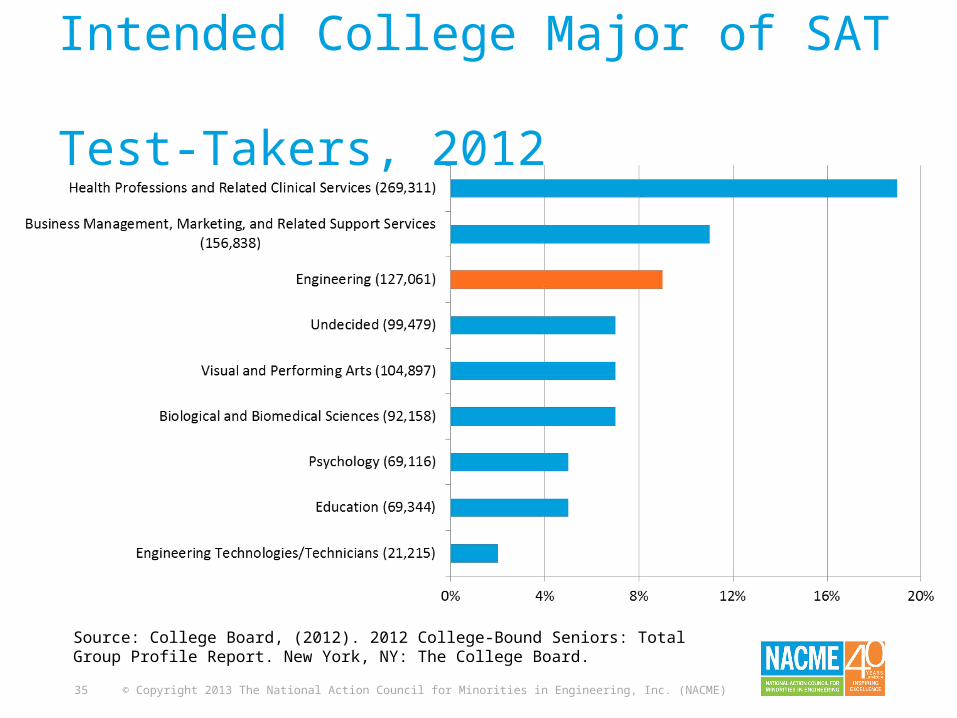
Intended College Major of SAT Test-Takers, 2012
Source: College Board, (2012). 2012 College-Bound Seniors: Total Group Profile Report. New York, NY: The College Board.
36 © Copyright 2013 The National Action Council for Minorities in Engineering, Inc. (NACME)
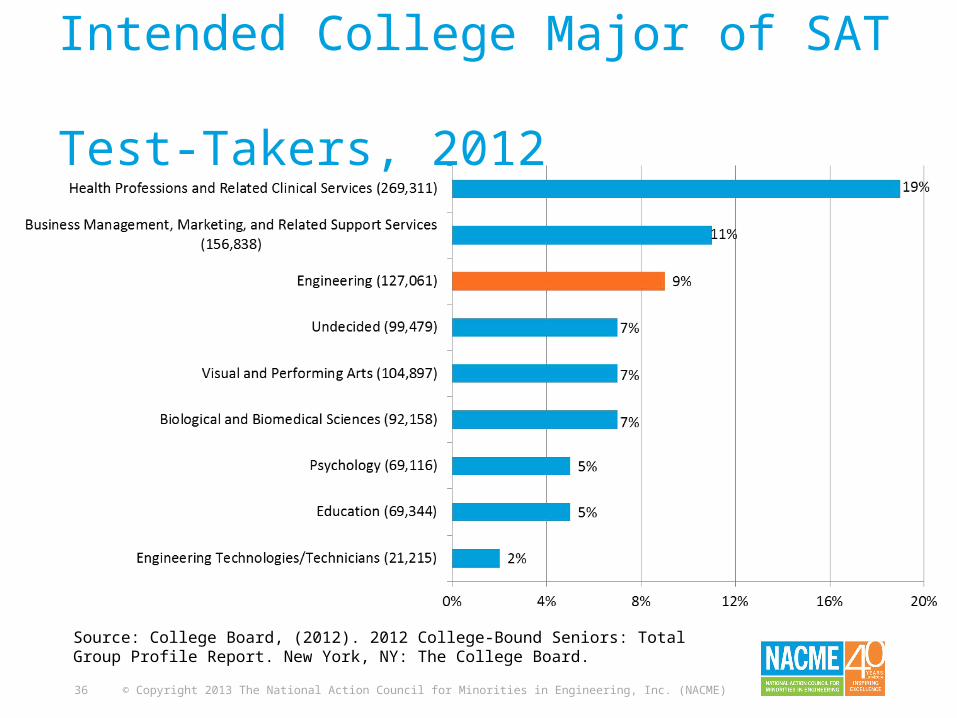
Intended College Major of SAT Test-Takers, 2012
Source: College Board, (2012). 2012 College-Bound Seniors: Total Group Profile Report. New York, NY: The College Board.
National Action Council for Minorities in Engineering, Inc.
440 Hamilton AvenueSuite 302White Plains, NY 10601914-539-4010914-539-4032 fax
Visit us online: nacme.org
Connect with us: