Embed Size (px)
Citation preview
2013 LEGISLATIVE REPORT ON
THE SKILLS FOR JOBS ACT
MAY 2013
1560 Broadway, Suite 1600Denver, Colorado 80204(303) 866-2723
LT. GOVERNOR JOSEPH GARCIA, EXECUTIVE DIRECTOR
FY2012-13 Colorado Skills for Jobs Report
Page 2
TABLE OF CONTENTS
Introduction 4
Highlights 5
National Perspective: Colorado in the Spotlight 6
Colorado Workforce Needs and Educational Credentials 7
Economic Conditions 7
Figure 1: 1990-2000: Rapid Growth 7
Figure 2: 2000-2010: Rapid Growth 8
Figure 3: Colorado Employment: 1990-2012 Volatility 9
Figure 4: Total Completions and Net Wages and Salary Jobs 9
Industry Changes 10
Table 1: Industry/Employment in Colorado, 2011-2015 10
Occupation Needs 11
Figure 5: Occupation Groups 11
Education and Training Industry, Training, and Education 12
Figure 6: Training, Experience, Degree, and Other Requirements 12
Figure 7: Industry Percent Requiring Awards 13
Occupation, Training, and Education 13
Figure 8: Occupation Group Percent Requiring Awards 14
Figure 9: Total Awards / % of Total Awards/ Annualized Growth Rate 15
Education and Awards 16
Figure 10: Annualized Rate of Change 2010/ Total in () by CIP 16
Completions and Workforce Needs: Supply and Demand 16
Table 2: Population Change, Educational Supply and Workforce Demand 17
Table 3: Completions/Job Openings. Median Hourly Wage 17
Conclusion 18
Endnotes 19
Appendix A: Technical Information 21
Methodology/Future Reports 21
Appendix B: Regional Data 22
FY2012-13 Colorado Skills for Jobs Report
Page 3
This report was prepared by The Colorado Department of Higher Education (DHE)
pursuant to the requirements of §23-1-130 Colorado Revised Statutes.
For more information please contact:
Dr. Beth Bean, Director of Research and Information at the Colorado Department of
Higher Education, at 303-866-2661 or by email at [email protected]
Sierra Fleenor, Data Analyst/Project Coordinator at the Colorado Department of Higher
Education at 303-866-5079 or by email at [email protected]
Gary Horvath, Independent Researcher, 303-460-9767 or by email
FY2012-13 Colorado Skills for Jobs Report
Page 4
INTRODUCTION
The landscape of higher education is changing to meet the needs of an evolving economy and
more discerning student consumers. Legislators and the public are asking for more information
regarding the value of a college degree from the perspective of individuals and employers in the
state and the nation. Can college graduates find gainful employment? Are colleges and
universities producing degrees that align with job vacancies and employers’ needs? To address
these and other questions, the Colorado General Assembly passed the 2012 “Skills for Jobs Act,”
a bill that was designed to examine the intersection between the demand for skilled workers and
the type and number of postsecondary degrees being produced.
Pursuant to statute (23-1-130 C.R.S), the Colorado Department of Higher Education, in
consultation with the Department of Labor and the Department of Regulatory Agencies, is
required to submit a report concerning the state workforce need projections and credential
production. In fulfillment of this requirement, this report identifies trends in the State’s
anticipated workforce needs and the number of degrees, certificates, and other credentials that
have been or are expected to be produced. This report will be submitted to the Education
Committees of the Senate and House of Representatives, the Economic and Business
Development Committee of the House of Representatives, the Business, Labor, and Technology
Committee of the Senate, and the Governor. Additionally, it will be sent to every public
postsecondary governing board and be made available through the Department of Education to
the State’s public, private, and charter schools and districts.
This report summarizes the following:
The national perspective on higher education and workforce needs with a particular
emphasis on Colorado;
The State’s anticipated workforce needs and the number of degrees, certificates, and
other credentials expected to be issued through postsecondary education or workforce
training programs; and,
Workforce needs, at the macro level, which are being met through postsecondary
educational offerings in Colorado.
FY2012-13 Colorado Skills for Jobs Report
Page 5
HIGHLIGHTS
By 2018, 67% of jobs in Colorado will require a postsecondary credential.
Colorado is among the top five states regarding the percent of jobs that will require a
college credential for employment.
Over the next ten years, new jobs in Colorado requiring postsecondary education will
grow at twice the rate of those requiring a high school diploma or below.
In Colorado, the postsecondary sector (supply) is meeting workforce needs (demand) at a
high level
The projected industry areas of strongest absolute growth in Colorado are Healthcare,
Financial Activities, and Professional, Scientific, and Technical Services, all sectors with
rigorous educational requirements.
The top occupations with respect to projected growth across all industry sectors are as
follows: sales, office and administrative support, management, and business and financial
operations.
Currently, over half of all jobs in Colorado require varying lengths of on-the-job training.
Careers in Science, Technology, Engineering, and Mathematics (STEM), Healthcare, and
Education account for about 28% of employment in Colorado; a high percentage of these
positions require a college credential.
Completions, including everything from certificates to professional degrees at public and
private institutions, increased at an average annualized rate of 4.6% between 2003 and
2010.
From 2003 to 2010 more than 23,000 postsecondary completions (certificates to
professional degrees) were issued in Education for an average annualized growth rate of
6.0%.
Between 2003 and 2010, there were 95,532 STEM completions in Colorado (17.3% of all
postsecondary degree completions).
At a state level, higher education appears to have addressed the basic employment needs
of the private sector, particularly in healthcare.
FY2012-13 Colorado Skills for Jobs Report
Page 6
NATIONAL PERSPECTIVE: COLORADO IN THE SPOTLIGHT
The past few years has seen a surge of research and information regarding the intersection
between higher education and the workforce. The consensus is clear: The majority of the U.S.
workforce will need some type of postsecondary credential to obtain a job now and, increasingly,
in the future. However, as a nation, we face a crisis in the supply of students qualified to enter
college and meet the growing demands of our economy. A recent study by the Georgetown
University Center on Education and the Workforce shows that 63 percent of all jobs will require
a postsecondary degree above a high school diploma by 20181. This 63 percent equates to
approximately 22 million college degrees or ten percent annual growth in awarded degrees for
colleges and universities through 2018. Related, the Obama Administration has argued that 60%
of Americans aged 25-34 should obtain a college degree.
According to the Georgetown University report, Colorado is among the top five states with
projected jobs requiring a postsecondary credential. By 2018, it is projected that 67%, or 2.1
million, jobs in Colorado will require a college degree or certificate1. Over the next ten years,
new jobs in Colorado requiring postsecondary education will grow at twice the rate of those
requiring a high school diploma or below. These projections rank Colorado 3rd
in the nation in
regards to the intensity and need of a college degree. However, Colorado is also ranked third in
the nation for the number of citizens between 25 and 64
who currently have earned a postsecondary credential.
This gap is being addressed with the recently adopted
Colorado Commission on Higher Education Master
Plan, Colorado Competes, which established a goal of
66% college completion for residents aged 25-34 by
20252.
Numerous efforts are underway to increase college
completion and address Colorado’s economic needs.
For example, the Colorado Workforce Development
Council recently hosted the 2013 Colorado Sector
Summit, which brought together education, workforce
development, economic development, and industry to
increase collaboration between the supply (education)
and demand (workforce) components of our Colorado
economic system. Additionally, the Colorado Department of Higher Education recently
partnered with College Measures, through a Lumina Foundation grant, to create a website tool
for parents, students, and counselors to view first-year earnings of Colorado graduates working
in Colorado based upon major and level of credential (www.collegemeasures.org/esm/colorado).
“By 2018, 67%
of all jobs in
Colorado will
require a
postsecondary
credential.”
FY2012-13 Colorado Skills for Jobs Report
Page 7
COLORADO WORKFORCE NEEDS AND EDUCATIONAL CREDENTIALS
This report draws heavily from a research study conducted on behalf of the Colorado Department
of Higher Education, funded by a grant from the National Governors Association. It includes
data reaching back to 1990 and projects workforce needs into the future.
To better understand workforce needs and how these needs are met in the state of Colorado,
there are several factors that should be considered:
Economic conditions and outlook
Industry changes
Occupation needs
Completions/Education (degrees, certificates, awards) and Training
Taking into account these four factors, the research suggests that higher education in Colorado
(supply) is meeting workforce needs (demand) at a high level.
ECONOMIC CONDITIONS
Interpreting economic conditions is critical to understanding anticipated workforce needs. The
performance of the Colorado economy from 1990-2010 illustrates the challenges inherent to
forecasting industries and occupations (and completions). Over this 20-year period, the state
experienced dramatic changes in population and workforce participation as well as a high degree
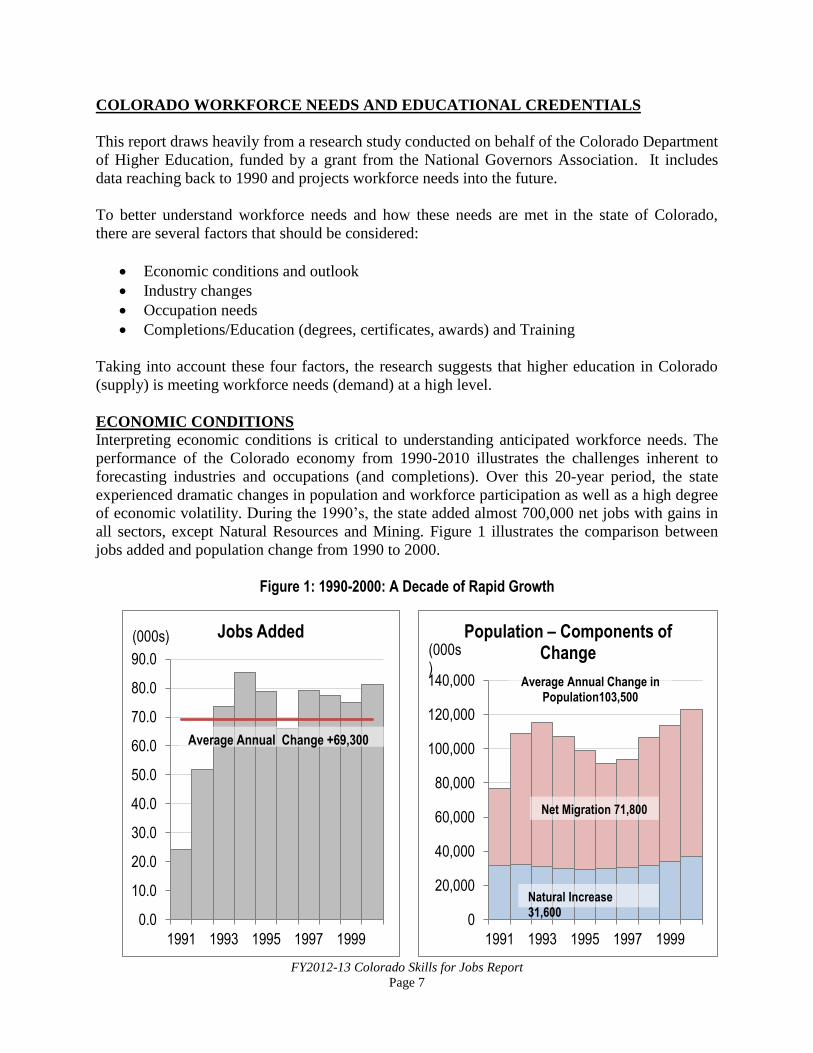
of economic volatility. During the 1990’s, the state added almost 700,000 net jobs with gains in
all sectors, except Natural Resources and Mining. Figure 1 illustrates the comparison between
jobs added and population change from 1990 to 2000.
Figure 1: 1990-2000: A Decade of Rapid Growth
0
20,000
40,000
60,000
80,000
100,000
120,000
140,000
1991 1993 1995 1997 1999
Population – Components of Change (000s
)
Net Migration 71,800
Average Annual Change in Population103,500
Natural Increase 31,600
0.0
10.0
20.0
30.0
40.0
50.0
60.0
70.0
80.0
90.0
1991 1993 1995 1997 1999
Jobs Added (000s)
Average Annual Change +69,300
FY2012-13 Colorado Skills for Jobs Report
Page 8
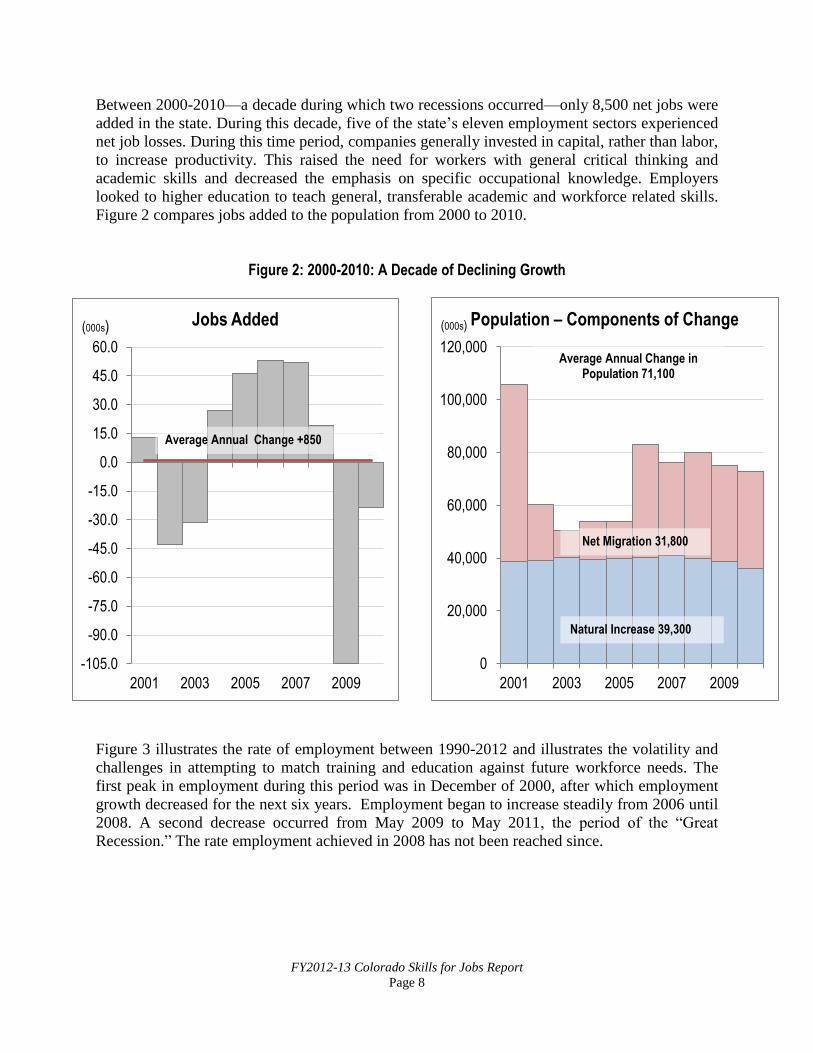
Between 2000-2010—a decade during which two recessions occurred—only 8,500 net jobs were
added in the state. During this decade, five of the state’s eleven employment sectors experienced
net job losses. During this time period, companies generally invested in capital, rather than labor,
to increase productivity. This raised the need for workers with general critical thinking and
academic skills and decreased the emphasis on specific occupational knowledge. Employers
looked to higher education to teach general, transferable academic and workforce related skills.
Figure 2 compares jobs added to the population from 2000 to 2010.
Figure 2: 2000-2010: A Decade of Declining Growth
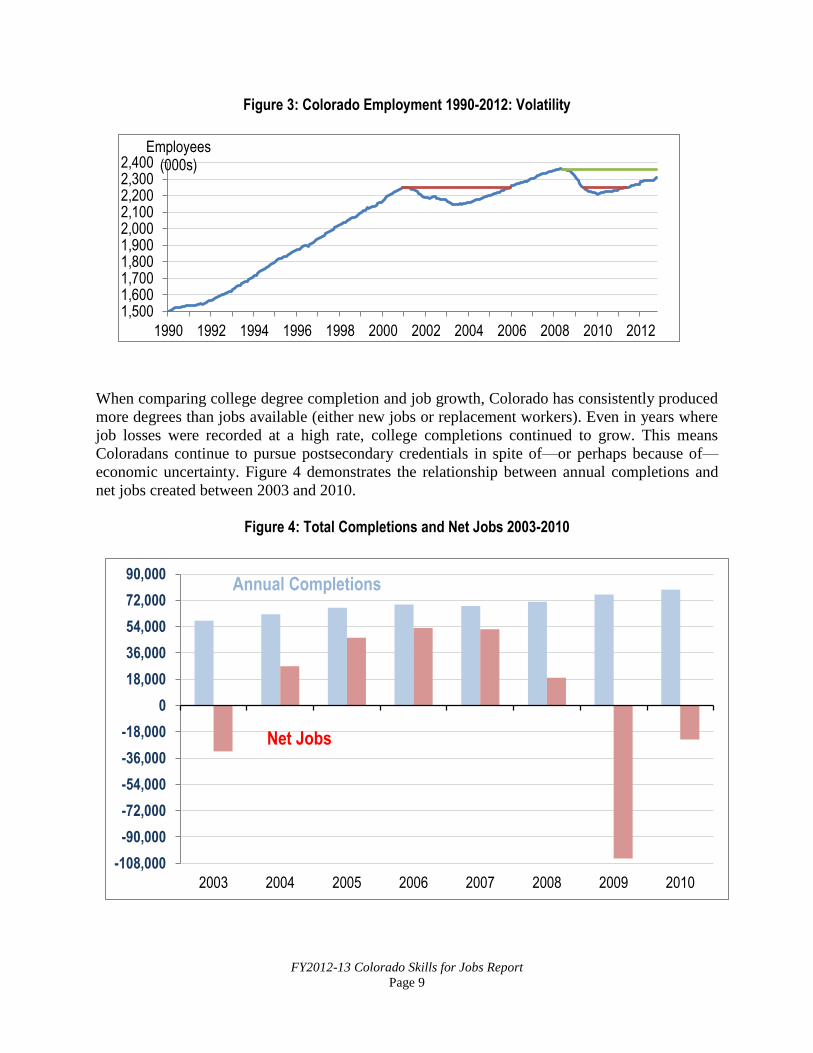
Figure 3 illustrates the rate of employment between 1990-2012 and illustrates the volatility and
challenges in attempting to match training and education against future workforce needs. The
first peak in employment during this period was in December of 2000, after which employment
growth decreased for the next six years. Employment began to increase steadily from 2006 until
2008. A second decrease occurred from May 2009 to May 2011, the period of the “Great
Recession.” The rate employment achieved in 2008 has not been reached since.
-105.0
-90.0
-75.0
-60.0
-45.0
-30.0
-15.0
0.0
15.0
30.0
45.0
60.0
2001 2003 2005 2007 2009
Jobs Added (000s)
Average Annual Change +850
0
20,000
40,000
60,000
80,000
100,000
120,000
2001 2003 2005 2007 2009
Population – Components of Change (000s)
Net Migration 31,800
Average Annual Change in Population 71,100
Natural Increase 39,300
FY2012-13 Colorado Skills for Jobs Report
Page 9
Figure 3: Colorado Employment 1990-2012: Volatility
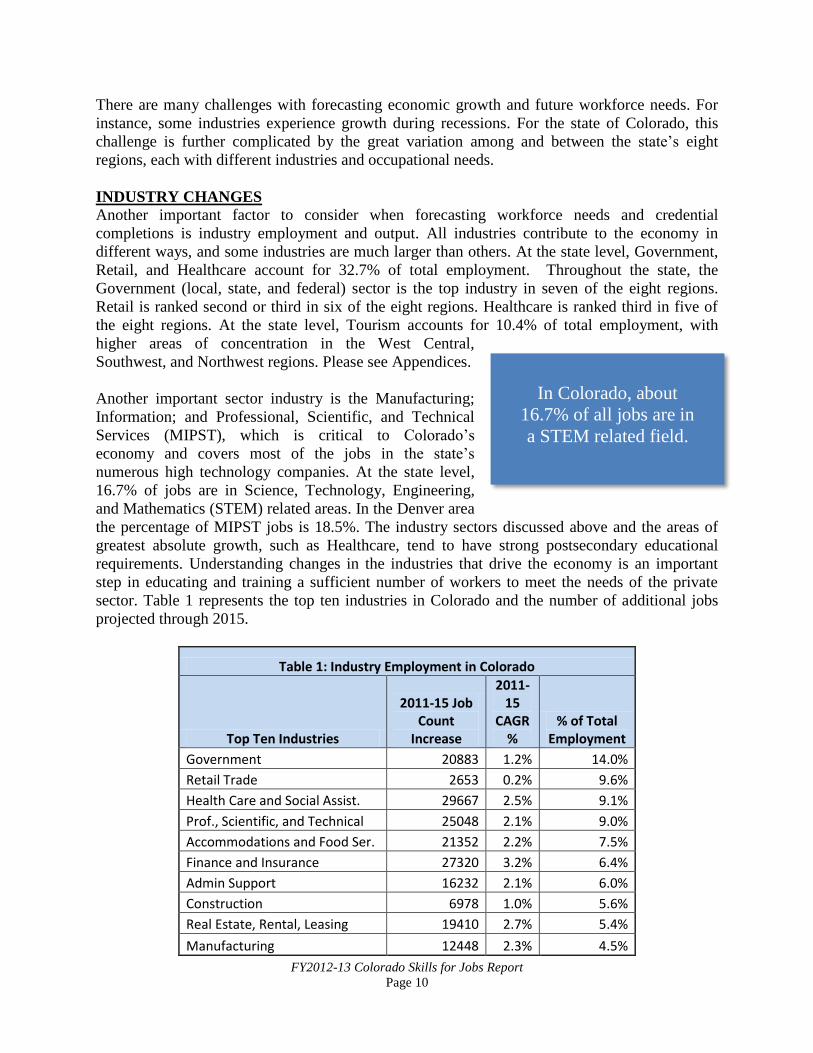
When comparing college degree completion and job growth, Colorado has consistently produced
more degrees than jobs available (either new jobs or replacement workers). Even in years where
job losses were recorded at a high rate, college completions continued to grow. This means
Coloradans continue to pursue postsecondary credentials in spite of—or perhaps because of—
economic uncertainty. Figure 4 demonstrates the relationship between annual completions and
net jobs created between 2003 and 2010.
Figure 4: Total Completions and Net Jobs 2003-2010
-108,000
-90,000
-72,000
-54,000
-36,000
-18,000
0
18,000
36,000
54,000
72,000
90,000
2003 2004 2005 2006 2007 2008 2009 2010
Net Jobs
Annual Completions
1,5001,6001,7001,8001,9002,0002,1002,2002,3002,400
1990 1992 1994 1996 1998 2000 2002 2004 2006 2008 2010 2012
Employees (000s)
FY2012-13 Colorado Skills for Jobs Report
Page 10
There are many challenges with forecasting economic growth and future workforce needs. For
instance, some industries experience growth during recessions. For the state of Colorado, this
challenge is further complicated by the great variation among and between the state’s eight
regions, each with different industries and occupational needs.
INDUSTRY CHANGES
Another important factor to consider when forecasting workforce needs and credential
completions is industry employment and output. All industries contribute to the economy in
different ways, and some industries are much larger than others. At the state level, Government,
Retail, and Healthcare account for 32.7% of total employment. Throughout the state, the
Government (local, state, and federal) sector is the top industry in seven of the eight regions.
Retail is ranked second or third in six of the eight regions. Healthcare is ranked third in five of
the eight regions. At the state level, Tourism accounts for 10.4% of total employment, with
higher areas of concentration in the West Central,
Southwest, and Northwest regions. Please see Appendices.
Another important sector industry is the Manufacturing;
Information; and Professional, Scientific, and Technical
Services (MIPST), which is critical to Colorado’s
economy and covers most of the jobs in the state’s
numerous high technology companies. At the state level,
16.7% of jobs are in Science, Technology, Engineering,
and Mathematics (STEM) related areas. In the Denver area
the percentage of MIPST jobs is 18.5%. The industry sectors discussed above and the areas of
greatest absolute growth, such as Healthcare, tend to have strong postsecondary educational
requirements. Understanding changes in the industries that drive the economy is an important
step in educating and training a sufficient number of workers to meet the needs of the private
sector. Table 1 represents the top ten industries in Colorado and the number of additional jobs
projected through 2015.
Table 1: Industry Employment in Colorado
Top Ten Industries
2011-15 Job Count
Increase
2011-15
CAGR %
% of Total Employment
Government 20883 1.2% 14.0%
Retail Trade 2653 0.2% 9.6%
Health Care and Social Assist. 29667 2.5% 9.1%
Prof., Scientific, and Technical 25048 2.1% 9.0%
Accommodations and Food Ser. 21352 2.2% 7.5%
Finance and Insurance 27320 3.2% 6.4%
Admin Support 16232 2.1% 6.0%
Construction 6978 1.0% 5.6%
Real Estate, Rental, Leasing 19410 2.7% 5.4%
Manufacturing 12448 2.3% 4.5%
In Colorado, about
16.7% of all jobs are in
a STEM related field.
FY2012-13 Colorado Skills for Jobs Report
Page 11
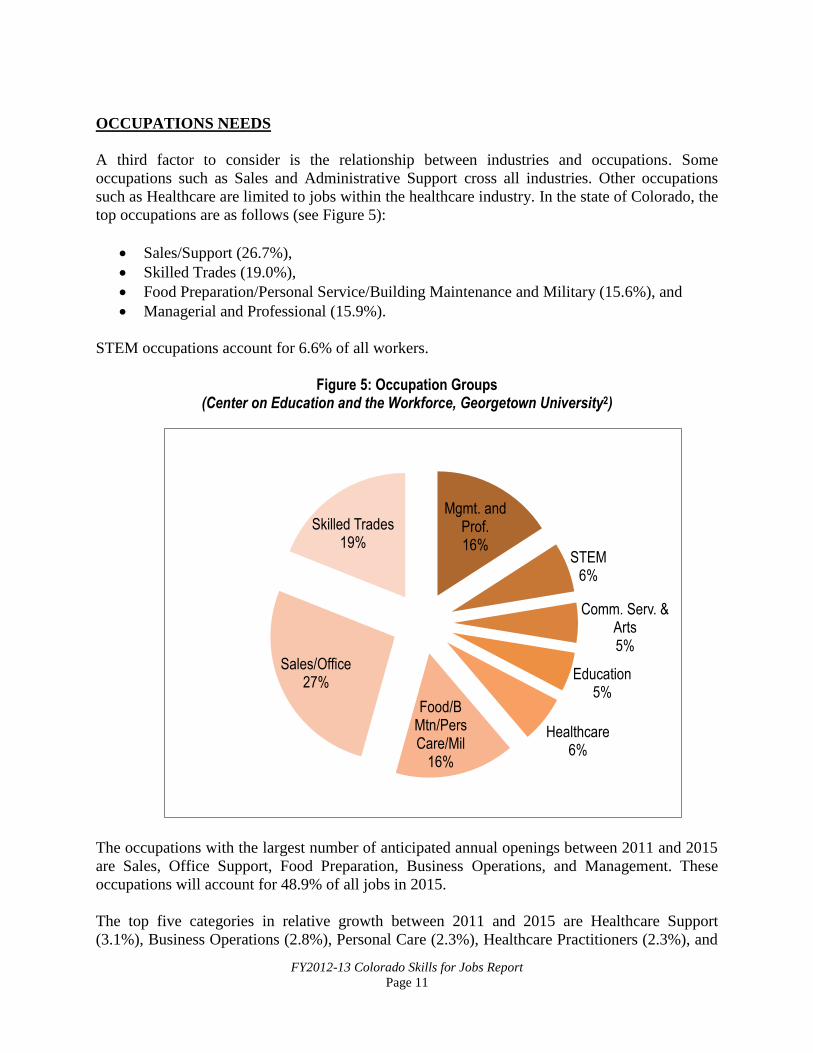
OCCUPATIONS NEEDS
A third factor to consider is the relationship between industries and occupations. Some
occupations such as Sales and Administrative Support cross all industries. Other occupations
such as Healthcare are limited to jobs within the healthcare industry. In the state of Colorado, the
top occupations are as follows (see Figure 5):
Sales/Support (26.7%),
Skilled Trades (19.0%),
Food Preparation/Personal Service/Building Maintenance and Military (15.6%), and
Managerial and Professional (15.9%).
STEM occupations account for 6.6% of all workers.
Figure 5: Occupation Groups (Center on Education and the Workforce, Georgetown University2)
The occupations with the largest number of anticipated annual openings between 2011 and 2015
are Sales, Office Support, Food Preparation, Business Operations, and Management. These
occupations will account for 48.9% of all jobs in 2015.
The top five categories in relative growth between 2011 and 2015 are Healthcare Support
(3.1%), Business Operations (2.8%), Personal Care (2.3%), Healthcare Practitioners (2.3%), and
Mgmt. and Prof. 16%
STEM 6%
Comm. Serv. & Arts 5%
Education 5%
Healthcare 6%
Food/B Mtn/Pers Care/Mil
16%
Sales/Office 27%
Skilled Trades 19%
FY2012-13 Colorado Skills for Jobs Report
Page 12
Food Preparation (2.2%). Combined these sectors are expected to account for 24.3% of total
employment in 2015.
With regard to compensation, the top categories are Healthcare Practitioners, Management,
Education, Business Operations, and Construction. Employees in these top five categories earn
salaries above the overall state average of $51,628. The majority of these occupations require
some type of a postsecondary credential.
EDUCATION AND TRAINING
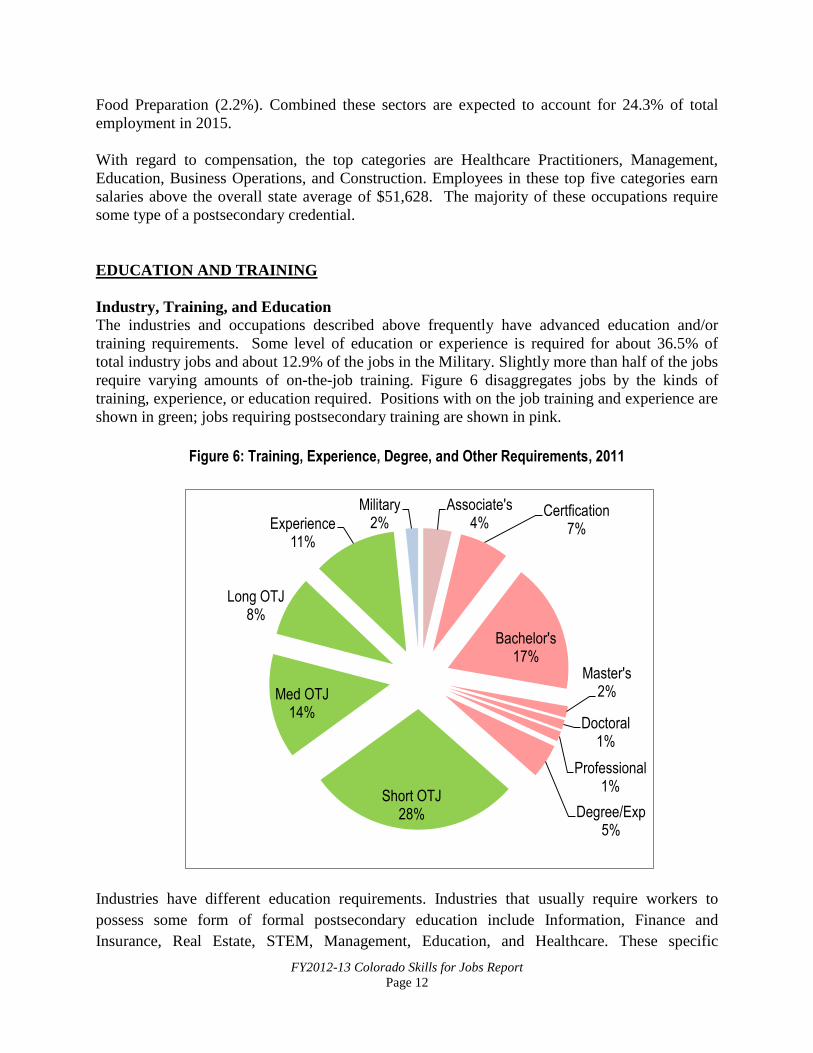
Industry, Training, and Education
The industries and occupations described above frequently have advanced education and/or
training requirements. Some level of education or experience is required for about 36.5% of
total industry jobs and about 12.9% of the jobs in the Military. Slightly more than half of the jobs
require varying amounts of on-the-job training. Figure 6 disaggregates jobs by the kinds of
training, experience, or education required. Positions with on the job training and experience are
shown in green; jobs requiring postsecondary training are shown in pink.
Figure 6: Training, Experience, Degree, and Other Requirements, 2011
Industries have different education requirements. Industries that usually require workers to
possess some form of formal postsecondary education include Information, Finance and
Insurance, Real Estate, STEM, Management, Education, and Healthcare. These specific
Associate's 4%
Certfication 7%
Bachelor's 17%
Master's 2%
Doctoral 1%
Professional 1%
Degree/Exp 5%
Short OTJ 28%
Med OTJ 14%
Long OTJ 8%
Experience 11%
Military 2%
FY2012-13 Colorado Skills for Jobs Report
Page 13
industries, which require higher levels of education, employee about 36% of working
Coloradans.
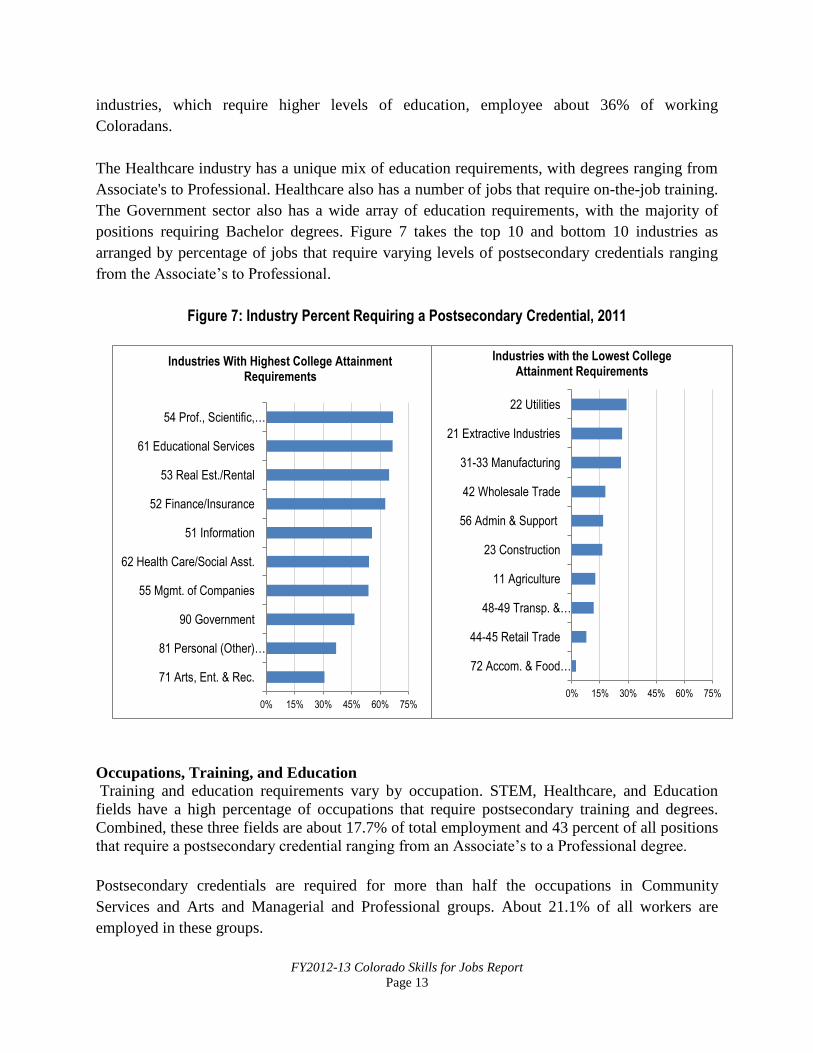
The Healthcare industry has a unique mix of education requirements, with degrees ranging from
Associate's to Professional. Healthcare also has a number of jobs that require on-the-job training.
The Government sector also has a wide array of education requirements, with the majority of
positions requiring Bachelor degrees. Figure 7 takes the top 10 and bottom 10 industries as
arranged by percentage of jobs that require varying levels of postsecondary credentials ranging
from the Associate’s to Professional.
Figure 7: Industry Percent Requiring a Postsecondary Credential, 2011
Occupations, Training, and Education
Training and education requirements vary by occupation. STEM, Healthcare, and Education
fields have a high percentage of occupations that require postsecondary training and degrees.
Combined, these three fields are about 17.7% of total employment and 43 percent of all positions
that require a postsecondary credential ranging from an Associate’s to a Professional degree.
Postsecondary credentials are required for more than half the occupations in Community
Services and Arts and Managerial and Professional groups. About 21.1% of all workers are
employed in these groups.
0% 15% 30% 45% 60% 75%
71 Arts, Ent. & Rec.
81 Personal (Other)…
90 Government
55 Mgmt. of Companies
62 Health Care/Social Asst.
51 Information
52 Finance/Insurance
53 Real Est./Rental
61 Educational Services
54 Prof., Scientific,…
Industries With Highest College Attainment Requirements
0% 15% 30% 45% 60% 75%
72 Accom. & Food…
44-45 Retail Trade
48-49 Transp. &…
11 Agriculture
23 Construction
56 Admin & Support
42 Wholesale Trade
31-33 Manufacturing
21 Extractive Industries
22 Utilities
Industries with the Lowest College Attainment Requirements
FY2012-13 Colorado Skills for Jobs Report
Page 14
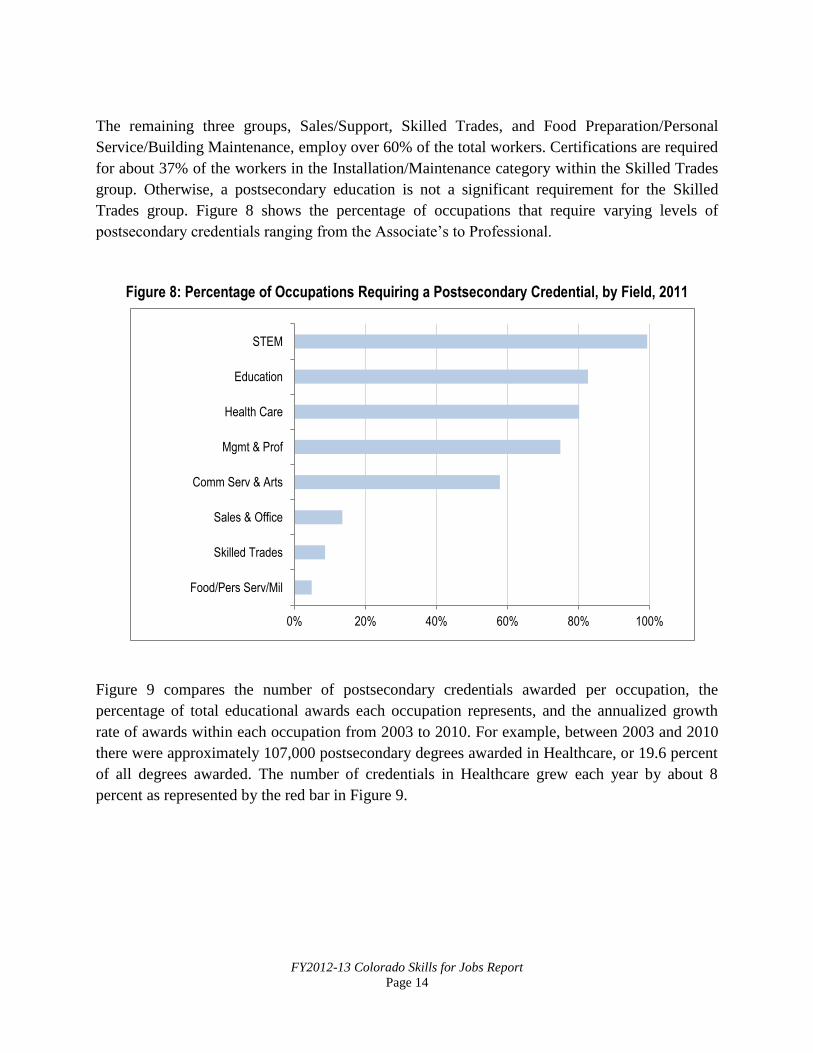
The remaining three groups, Sales/Support, Skilled Trades, and Food Preparation/Personal
Service/Building Maintenance, employ over 60% of the total workers. Certifications are required
for about 37% of the workers in the Installation/Maintenance category within the Skilled Trades
group. Otherwise, a postsecondary education is not a significant requirement for the Skilled
Trades group. Figure 8 shows the percentage of occupations that require varying levels of
postsecondary credentials ranging from the Associate’s to Professional.
Figure 8: Percentage of Occupations Requiring a Postsecondary Credential, by Field, 2011
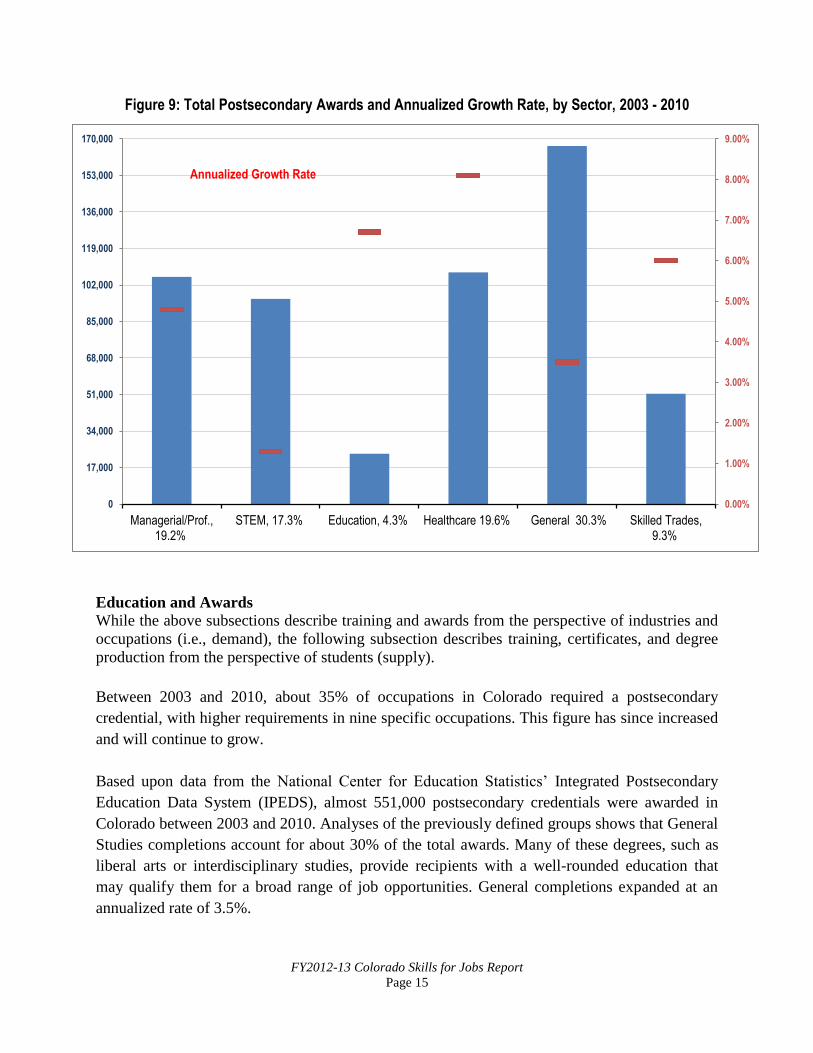
Figure 9 compares the number of postsecondary credentials awarded per occupation, the
percentage of total educational awards each occupation represents, and the annualized growth
rate of awards within each occupation from 2003 to 2010. For example, between 2003 and 2010
there were approximately 107,000 postsecondary degrees awarded in Healthcare, or 19.6 percent
of all degrees awarded. The number of credentials in Healthcare grew each year by about 8
percent as represented by the red bar in Figure 9.
0% 20% 40% 60% 80% 100%
Food/Pers Serv/Mil
Skilled Trades
Sales & Office
Comm Serv & Arts
Mgmt & Prof
Health Care
Education
STEM
FY2012-13 Colorado Skills for Jobs Report
Page 15
Figure 9: Total Postsecondary Awards and Annualized Growth Rate, by Sector, 2003 - 2010
Education and Awards
While the above subsections describe training and awards from the perspective of industries and
occupations (i.e., demand), the following subsection describes training, certificates, and degree
production from the perspective of students (supply).
Between 2003 and 2010, about 35% of occupations in Colorado required a postsecondary
credential, with higher requirements in nine specific occupations. This figure has since increased
and will continue to grow.
Based upon data from the National Center for Education Statistics’ Integrated Postsecondary
Education Data System (IPEDS), almost 551,000 postsecondary credentials were awarded in
Colorado between 2003 and 2010. Analyses of the previously defined groups shows that General
Studies completions account for about 30% of the total awards. Many of these degrees, such as
liberal arts or interdisciplinary studies, provide recipients with a well-rounded education that
may qualify them for a broad range of job opportunities. General completions expanded at an
annualized rate of 3.5%.
0.00%
1.00%
2.00%
3.00%
4.00%
5.00%
6.00%
7.00%
8.00%
9.00%
0
17,000
34,000
51,000
68,000
85,000
102,000
119,000
136,000
153,000
170,000
Managerial/Prof.,19.2%
STEM, 17.3% Education, 4.3% Healthcare 19.6% General 30.3% Skilled Trades,9.3%
Annualized Growth Rate
FY2012-13 Colorado Skills for Jobs Report
Page 16
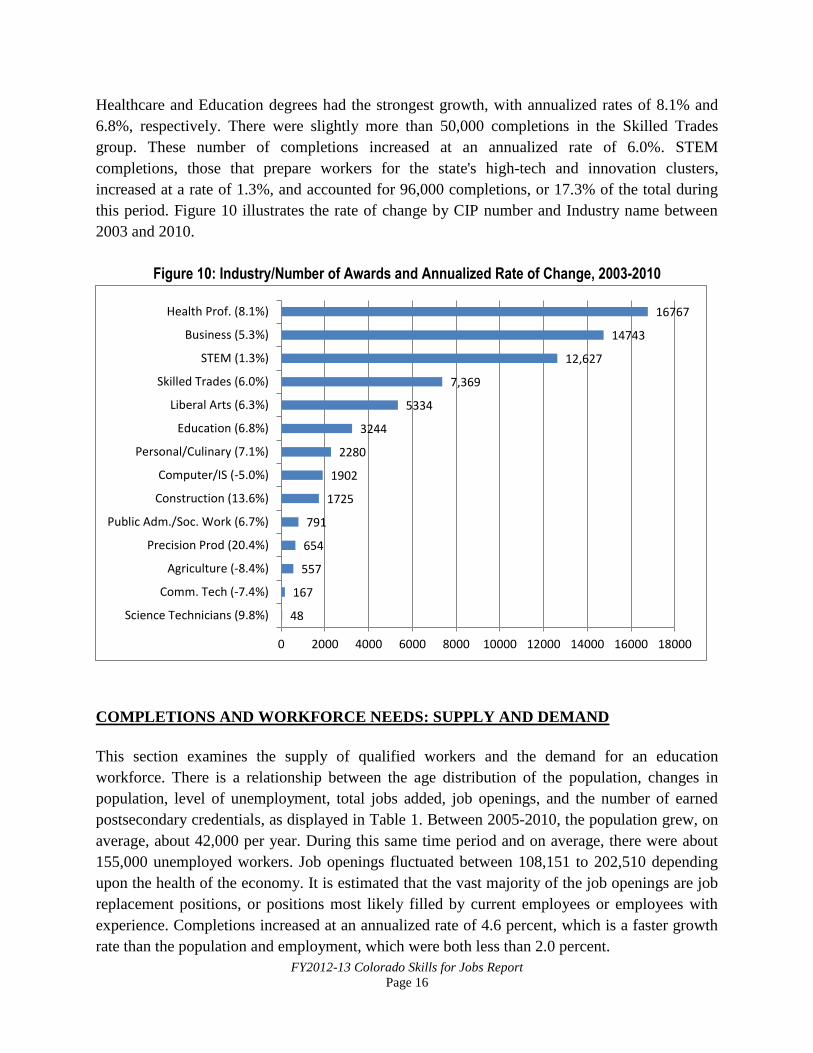
Healthcare and Education degrees had the strongest growth, with annualized rates of 8.1% and
6.8%, respectively. There were slightly more than 50,000 completions in the Skilled Trades
group. These number of completions increased at an annualized rate of 6.0%. STEM
completions, those that prepare workers for the state's high-tech and innovation clusters,
increased at a rate of 1.3%, and accounted for 96,000 completions, or 17.3% of the total during
this period. Figure 10 illustrates the rate of change by CIP number and Industry name between
2003 and 2010.
Figure 10: Industry/Number of Awards and Annualized Rate of Change, 2003-2010
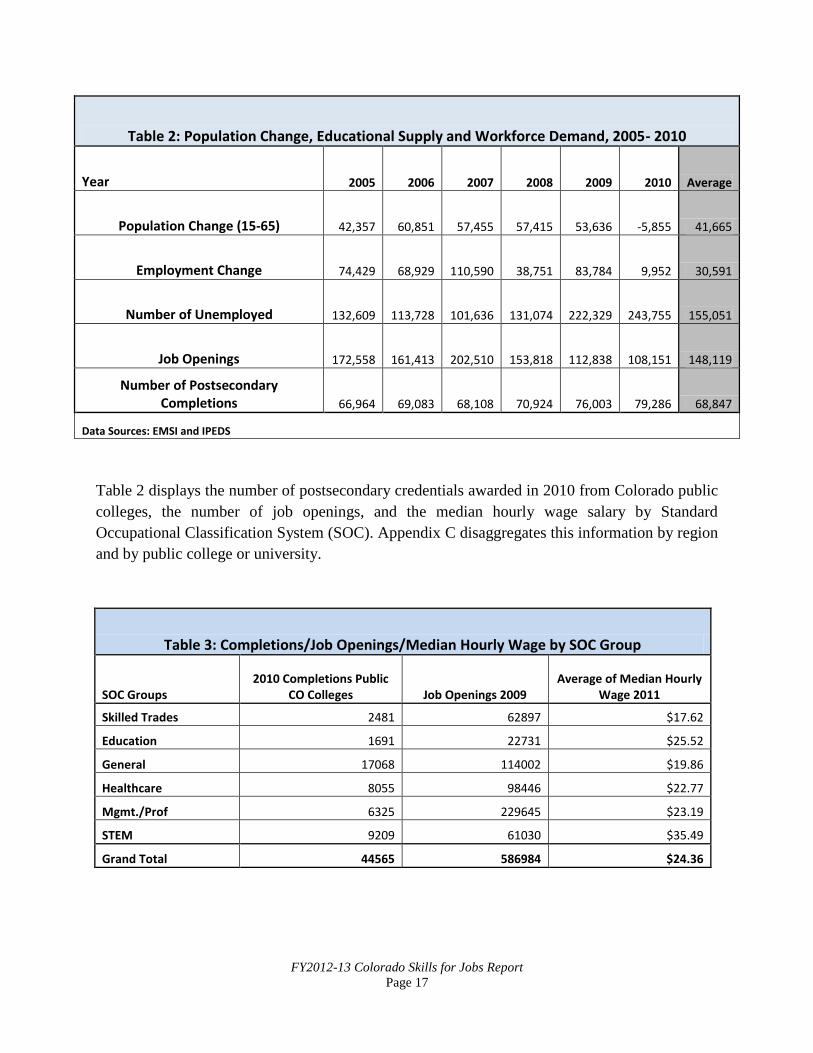
COMPLETIONS AND WORKFORCE NEEDS: SUPPLY AND DEMAND
This section examines the supply of qualified workers and the demand for an education
workforce. There is a relationship between the age distribution of the population, changes in
population, level of unemployment, total jobs added, job openings, and the number of earned
postsecondary credentials, as displayed in Table 1. Between 2005-2010, the population grew, on
average, about 42,000 per year. During this same time period and on average, there were about
155,000 unemployed workers. Job openings fluctuated between 108,151 to 202,510 depending
upon the health of the economy. It is estimated that the vast majority of the job openings are job
replacement positions, or positions most likely filled by current employees or employees with
experience. Completions increased at an annualized rate of 4.6 percent, which is a faster growth
rate than the population and employment, which were both less than 2.0 percent.
48
167
557
654
791
1725
1902
2280
3244
5334
7,369
12,627
14743
16767
0 2000 4000 6000 8000 10000 12000 14000 16000 18000
Science Technicians (9.8%)
Comm. Tech (-7.4%)
Agriculture (-8.4%)
Precision Prod (20.4%)
Public Adm./Soc. Work (6.7%)
Construction (13.6%)
Computer/IS (-5.0%)
Personal/Culinary (7.1%)
Education (6.8%)
Liberal Arts (6.3%)
Skilled Trades (6.0%)
STEM (1.3%)
Business (5.3%)
Health Prof. (8.1%)
FY2012-13 Colorado Skills for Jobs Report
Page 17
Table 2: Population Change, Educational Supply and Workforce Demand, 2005- 2010
Year 2005 2006 2007 2008 2009 2010 Average
Population Change (15-65) 42,357 60,851 57,455 57,415 53,636 -5,855 41,665
Employment Change 74,429 68,929 110,590 38,751 83,784 9,952 30,591
Number of Unemployed 132,609 113,728 101,636 131,074 222,329 243,755 155,051
Job Openings 172,558 161,413 202,510 153,818 112,838 108,151 148,119
Number of Postsecondary Completions 66,964 69,083 68,108 70,924 76,003 79,286 68,847
Data Sources: EMSI and IPEDS
Table 2 displays the number of postsecondary credentials awarded in 2010 from Colorado public
colleges, the number of job openings, and the median hourly wage salary by Standard
Occupational Classification System (SOC). Appendix C disaggregates this information by region
and by public college or university.
Table 3: Completions/Job Openings/Median Hourly Wage by SOC Group
SOC Groups 2010 Completions Public
CO Colleges Job Openings 2009 Average of Median Hourly
Wage 2011
Skilled Trades 2481 62897 $17.62
Education 1691 22731 $25.52
General 17068 114002 $19.86
Healthcare 8055 98446 $22.77
Mgmt./Prof 6325 229645 $23.19
STEM 9209 61030 $35.49
Grand Total 44565 586984 $24.36
FY2012-13 Colorado Skills for Jobs Report
Page 18
CONCLUSION
This report illustrates that the employment demands of Colorado’s employers have largely been
met by the state’s postsecondary sector. In Colorado, roughly 80,000 students graduate from a
postsecondary institution each year. Over half of these awards are from the state's 31 public
colleges and universities.
In order to effectively reach our collective goal of credentialing 66% of all 25- to 34-year old
Coloradans, our postsecondary sector must ensure that awarded credentials are in the areas
needed in the state’s workforce. To accomplish this, higher education and workforce must
understand and coordinate efforts to support the sectors that will require a college credential.
This information will need to be communicated with future students. Aligning these efforts will
ensure a healthy economic future for Colorado
Looking ahead, this report provides Colorado education leaders and policy makers with
information for focused discussions about the relationship between industry, occupations, and
completions.
FY2012-13 Colorado Skills for Jobs Report
Page 19
ENDNOTES
1Carnevale, Anthony P.; Smith, N.; Strohl, J. (2010). Help Wanted: Projections of Jobs and
Education Requirements through 2018. Washington, D.C.: Georgetown Center for Education
and the Workforce.
2 Colorado Commission on Higher Education (2012). Colorado Competes: A Completion
Agenda for Higher Education. Denver, CO: Colorado Commission on Higher Education Master
Plan.

FY2012-13 Colorado Skills for Jobs Report
Page 20
APPENDICES
FY2012-13 Colorado Skills for Jobs Report
Page 21
APPENDIX A: TECHNICAL INFORMATION
METHOD
The majority of this report was based upon research conducted by Gary Horvath, an independent
contract. The report was created using data from The Integrated Postsecondary Education Data
System (IPEDS), a system managed by the National Center to Education Statistics, and
Economic Modeling Systems Incorporated (EMSI), a recognized source used by many of the
state's workforce centers and economic development officers. The labor and occupation data
found in this report was collected from EMSI. The Colorado information in EMSI is based on
the wage and salary data published by the Bureau of Labor Statistics. The completions are
reported by Integrated Postsecondary Education Data System (IPEDS), collected via the EMSI
database. Completions include degrees and awards produced by the public and private sector.
The definitions of the regions are based on information provided by the National Center for
Higher Education Management Systems (NCHEMS). Their recommendations were adjusted
slightly to align with the state's major Metropolitan Statistical Areas (MSAs).
FUTURE REPORTS
This report was based upon comparing two national aggregate datasets: IPEDS and EMSI.
Future reports will use linked data at the individual level to match a college graduate’s
completion information and follow that same graduate into the Colorado labor market. In
addition to quarterly salary earnings, future reporting will also include the industry the Colorado
graduate is working in so we can match academic college majors to areas of employment. Lastly,
the Colorado Department of Higher Education will continue to expand relationships with the
Colorado Department of Labor and Employment, the Office of Economic Development and
International Trade, and Colorado Workforce Centers to better align the supply of degrees with
the demand of jobs.
P a g e | 22
FY2012-13 Colorado Skills for Jobs Report
Page 22
APPENDIX B: Employment, Occupation, and Completions by Region
This appendix includes summaries broken down by region. Colorado is comprised of rural and metro areas, each with different strengths ranging from tourism to the extractive industries. For purposes of this study, the state was grouped into eight regions. Industry, occupation, and completion data is provided for each region. The definitions of the regions are based on information provided by the National Center for Higher Education Management Systems (NCHEM). Their recommendations were adjusted slightly so that regions would align with the state's major Metropolitan Statistical Areas (MSAs). The following breakdown includes the counties, main campus location of the public institutions, and percent of state employment. The following regions are considered in this appendix:
Denver Boulder
Northeast
Northwest
North Metro
South Metro
Southeast
Southwest
West Central
P a g e | 23
FY2012-13 Colorado Skills for Jobs Report
Page 23
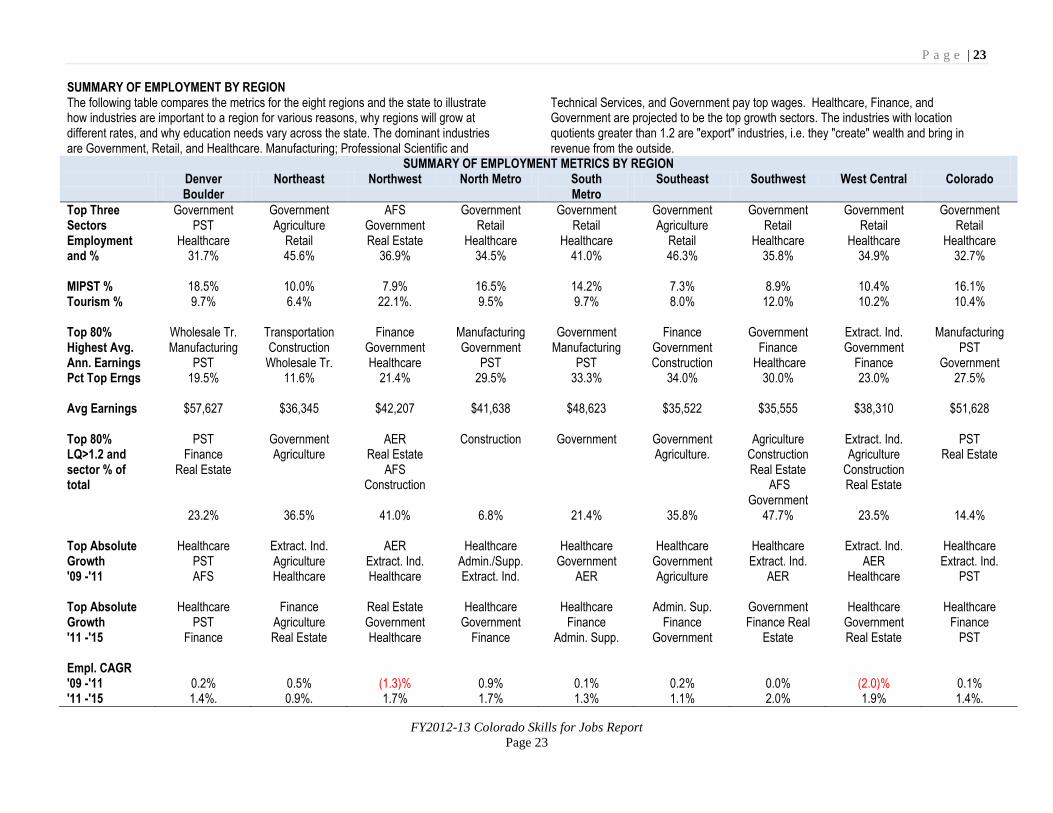
SUMMARY OF EMPLOYMENT BY REGION The following table compares the metrics for the eight regions and the state to illustrate how industries are important to a region for various reasons, why regions will grow at different rates, and why education needs vary across the state. The dominant industries are Government, Retail, and Healthcare. Manufacturing; Professional Scientific and
Technical Services, and Government pay top wages. Healthcare, Finance, and Government are projected to be the top growth sectors. The industries with location quotients greater than 1.2 are "export" industries, i.e. they "create" wealth and bring in revenue from the outside.
SUMMARY OF EMPLOYMENT METRICS BY REGION Denver
Boulder Northeast Northwest North Metro South
Metro Southeast Southwest West Central Colorado
Top Three Sectors Employment and %
Government PST
Healthcare 31.7%
Government Agriculture
Retail 45.6%
AFS Government Real Estate
36.9%
Government Retail
Healthcare 34.5%
Government Retail
Healthcare 41.0%
Government Agriculture
Retail 46.3%
Government Retail
Healthcare 35.8%
Government Retail
Healthcare 34.9%
Government Retail
Healthcare 32.7%
MIPST % 18.5% 10.0% 7.9% 16.5% 14.2% 7.3% 8.9% 10.4% 16.1% Tourism %
9.7% 6.4% 22.1%. 9.5% 9.7% 8.0% 12.0% 10.2% 10.4%
Top 80% Highest Avg. Ann. Earnings
Wholesale Tr. Manufacturing
PST
Transportation Construction
Wholesale Tr.
Finance Government Healthcare
Manufacturing Government
PST
Government Manufacturing
PST
Finance Government Construction
Government Finance
Healthcare
Extract. Ind. Government
Finance
Manufacturing PST
Government Pct Top Erngs
19.5% 11.6% 21.4% 29.5% 33.3% 34.0% 30.0% 23.0% 27.5%
Avg Earnings
$57,627 $36,345 $42,207 $41,638 $48,623 $35,522 $35,555 $38,310 $51,628
Top 80% LQ>1.2 and sector % of total
PST Finance
Real Estate
Government Agriculture
AER Real Estate
AFS Construction
Construction Government Government Agriculture.
Agriculture Construction Real Estate
AFS Government
Extract. Ind. Agriculture
Construction Real Estate
PST Real Estate
23.2% 36.5% 41.0% 6.8% 21.4% 35.8% 47.7% 23.5% 14.4% Top Absolute Growth '09 -'11
Healthcare PST AFS
Extract. Ind. Agriculture Healthcare
AER Extract. Ind. Healthcare
Healthcare Admin./Supp. Extract. Ind.
Healthcare Government
AER
Healthcare Government Agriculture
Healthcare Extract. Ind.
AER
Extract. Ind. AER
Healthcare
Healthcare Extract. Ind.
PST Top Absolute Growth '11 -'15
Healthcare PST
Finance
Finance Agriculture Real Estate
Real Estate Government Healthcare
Healthcare Government
Finance
Healthcare Finance
Admin. Supp.
Admin. Sup. Finance
Government
Government Finance Real
Estate
Healthcare Government Real Estate
Healthcare Finance
PST Empl. CAGR '09 -'11 0.2% 0.5% (1.3)% 0.9% 0.1% 0.2% 0.0% (2.0)% 0.1% '11 -'15 1.4%. 0.9%. 1.7% 1.7% 1.3% 1.1% 2.0% 1.9% 1.4%.
P a g e | 24
FY2012-13 Colorado Skills for Jobs Report
Page 24
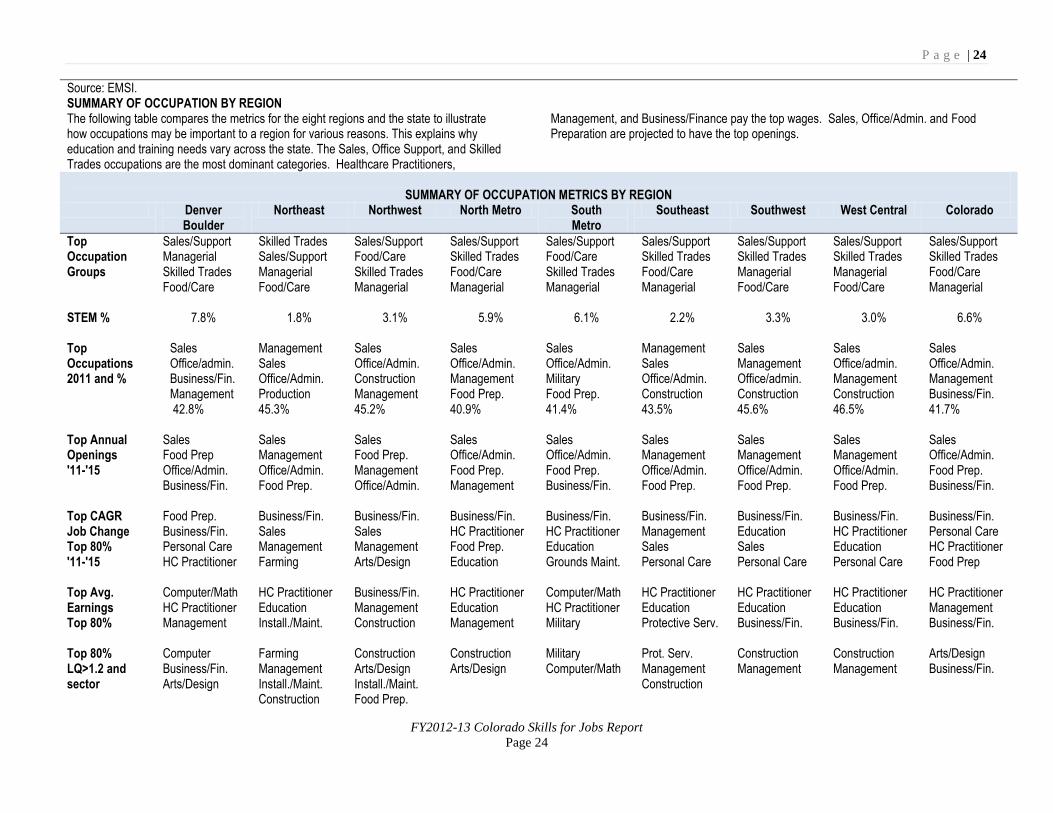
Source: EMSI. SUMMARY OF OCCUPATION BY REGION The following table compares the metrics for the eight regions and the state to illustrate how occupations may be important to a region for various reasons. This explains why education and training needs vary across the state. The Sales, Office Support, and Skilled Trades occupations are the most dominant categories. Healthcare Practitioners,
Management, and Business/Finance pay the top wages. Sales, Office/Admin. and Food Preparation are projected to have the top openings.
SUMMARY OF OCCUPATION METRICS BY REGION
Denver Boulder
Northeast Northwest North Metro South Metro
Southeast Southwest West Central Colorado
Top Occupation Groups
Sales/Support Managerial Skilled Trades Food/Care
Skilled Trades Sales/Support Managerial Food/Care
Sales/Support Food/Care Skilled Trades Managerial
Sales/Support Skilled Trades Food/Care Managerial
Sales/Support Food/Care Skilled Trades Managerial
Sales/Support Skilled Trades Food/Care Managerial
Sales/Support Skilled Trades Managerial Food/Care
Sales/Support Skilled Trades Managerial Food/Care
Sales/Support Skilled Trades Food/Care Managerial
STEM % 7.8% 1.8% 3.1% 5.9% 6.1% 2.2% 3.3% 3.0% 6.6% Top Occupations 2011 and %
Sales Office/admin. Business/Fin. Management 42.8%
Management Sales Office/Admin. Production 45.3%
Sales Office/Admin. Construction Management 45.2%
Sales Office/Admin. Management Food Prep. 40.9%
Sales Office/Admin. Military Food Prep. 41.4%
Management Sales Office/Admin. Construction 43.5%
Sales Management Office/admin. Construction 45.6%
Sales Office/admin. Management Construction 46.5%
Sales Office/Admin. Management Business/Fin. 41.7%
Top Annual Openings '11-'15
Sales Food Prep Office/Admin. Business/Fin.
Sales Management Office/Admin. Food Prep.
Sales Food Prep. Management Office/Admin.
Sales Office/Admin. Food Prep. Management
Sales Office/Admin. Food Prep. Business/Fin.
Sales Management Office/Admin. Food Prep.
Sales Management Office/Admin. Food Prep.
Sales Management Office/Admin. Food Prep.
Sales Office/Admin. Food Prep. Business/Fin.
Top CAGR Job Change Top 80% '11-'15
Food Prep. Business/Fin. Personal Care HC Practitioner
Business/Fin. Sales Management Farming
Business/Fin. Sales Management Arts/Design
Business/Fin. HC Practitioner Food Prep. Education
Business/Fin. HC Practitioner Education Grounds Maint.
Business/Fin. Management Sales Personal Care
Business/Fin. Education Sales Personal Care
Business/Fin. HC Practitioner Education Personal Care
Business/Fin. Personal Care HC Practitioner Food Prep
Top Avg. Earnings Top 80%
Computer/Math HC Practitioner Management
HC Practitioner Education Install./Maint.
Business/Fin. Management Construction
HC Practitioner Education Management
Computer/Math HC Practitioner Military
HC Practitioner Education Protective Serv.
HC Practitioner Education Business/Fin.
HC Practitioner Education Business/Fin.
HC Practitioner Management Business/Fin.
Top 80% LQ>1.2 and sector
Computer Business/Fin. Arts/Design
Farming Management Install./Maint. Construction
Construction Arts/Design Install./Maint. Food Prep.
Construction Arts/Design
Military Computer/Math
Prot. Serv. Management Construction
Construction Management
Construction Management
Arts/Design Business/Fin.
P a g e | 25
FY2012-13 Colorado Skills for Jobs Report
Page 25
Management.
Source: EMSI.
2010 COMPLETIONS AND ANNUALIZED GROWTH RATE 2003-2010 BY REGIONThe following table evaluates completions by region and the annualized rate of growth of each CIP by region. As expected a majority of the completions are awarded in the Denver Boulder Metro area, about 56%. Almost 23% are awarded in the Southern Metro Area (Colorado Springs and Pueblo MSAs), followed by 14% in the northern MSAs (Greeley and Fort Collins). The Western Slope (Southwest, West Central, and Northwest) account for about 5% of total completions and the Eastern Plains are about 2% of the total. It is interesting to note that the number of completions increased at an annualized rate of almost 11% in the southern MSAs. This was due to double digit rates of growth for completions in the largest CIPs: Business, Healthcare, Liberal Arts, and Homeland Security. The Southern MSA was the only region to grow at a rate above the state, 4.6%. The number of degrees completed in the Southwest region declined by 14%. In 2003 there were programs offered in Homeland Security and Healthcare that awarded about 1,900 completions. Those programs were not in existence in 2010. It was the only region
to post a decline, although that decline is not a reflection of degrees granted by the four-year institutions in the area. The STEM CIPs were offered primarily in the three major MSA areas, with the most completions occurring in the Denver/Boulder MSAs. Interestingly enough the Southern region was the only region where Computer/IS completions increased. A majority of the Education completions were awarded in the three major MSAs. Only the Denver/Boulder MSAs posted growth in Education completions. Healthcare completions were positive in all regions, except the Southwest. Most completions in the General group were awarded in the three MSA regions and the Western Slope. There were a limited number of completions on the Eastern Plains. Skilled Trades completions occurred in all regions except the Southwest. To that point, it is interesting to note the sharp decline in Agriculture completions despite that fact that Agriculture is an important export industry for Colorado.
P a g e | 26
FY2012-13 Colorado Skills for Jobs Report
Page 26
2010 COMPLETIONS AND ANNUALIZED GROWTH RATE 2003-2010 BY REGION
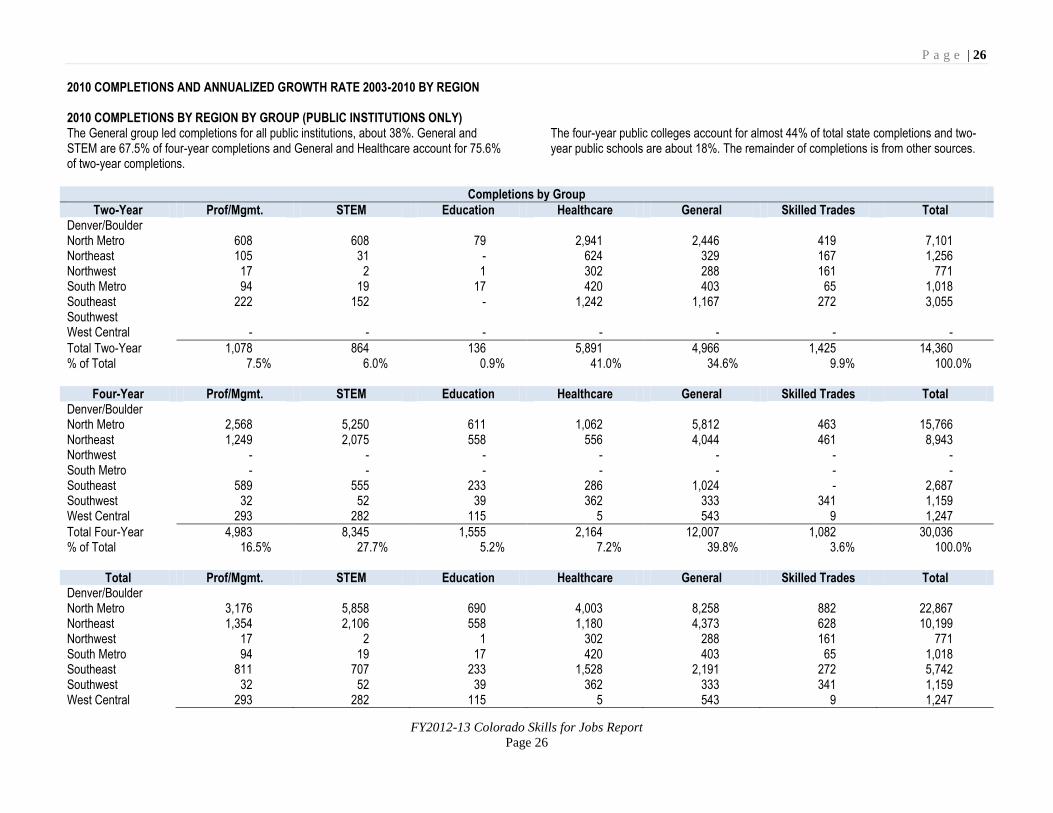
2010 COMPLETIONS BY REGION BY GROUP (PUBLIC INSTITUTIONS ONLY) The General group led completions for all public institutions, about 38%. General and STEM are 67.5% of four-year completions and General and Healthcare account for 75.6% of two-year completions.
The four-year public colleges account for almost 44% of total state completions and two-year public schools are about 18%. The remainder of completions is from other sources.
Completions by Group
Two-Year Prof/Mgmt. STEM Education Healthcare General Skilled Trades Total Denver/Boulder North Metro 608 608 79 2,941 2,446 419 7,101 Northeast 105 31 - 624 329 167 1,256 Northwest 17 2 1 302 288 161 771 South Metro 94 19 17 420 403 65 1,018 Southeast 222 152 - 1,242 1,167 272 3,055 Southwest West Central - - - - - - -
Total Two-Year 1,078 864 136 5,891 4,966 1,425 14,360 % of Total 7.5% 6.0% 0.9% 41.0% 34.6% 9.9% 100.0%
Four-Year Prof/Mgmt. STEM Education Healthcare General Skilled Trades Total
Denver/Boulder North Metro 2,568 5,250 611 1,062 5,812 463 15,766 Northeast 1,249 2,075 558 556 4,044 461 8,943 Northwest - - - - - - - South Metro - - - - - - - Southeast 589 555 233 286 1,024 - 2,687 Southwest 32 52 39 362 333 341 1,159 West Central 293 282 115 5 543 9 1,247
Total Four-Year 4,983 8,345 1,555 2,164 12,007 1,082 30,036 % of Total 16.5% 27.7% 5.2% 7.2% 39.8% 3.6% 100.0%
Total Prof/Mgmt. STEM Education Healthcare General Skilled Trades Total
Denver/Boulder North Metro 3,176 5,858 690 4,003 8,258 882 22,867 Northeast 1,354 2,106 558 1,180 4,373 628 10,199 Northwest 17 2 1 302 288 161 771 South Metro 94 19 17 420 403 65 1,018 Southeast 811 707 233 1,528 2,191 272 5,742 Southwest 32 52 39 362 333 341 1,159 West Central 293 282 115 5 543 9 1,247
P a g e | 27
FY2012-13 Colorado Skills for Jobs Report
Page 27
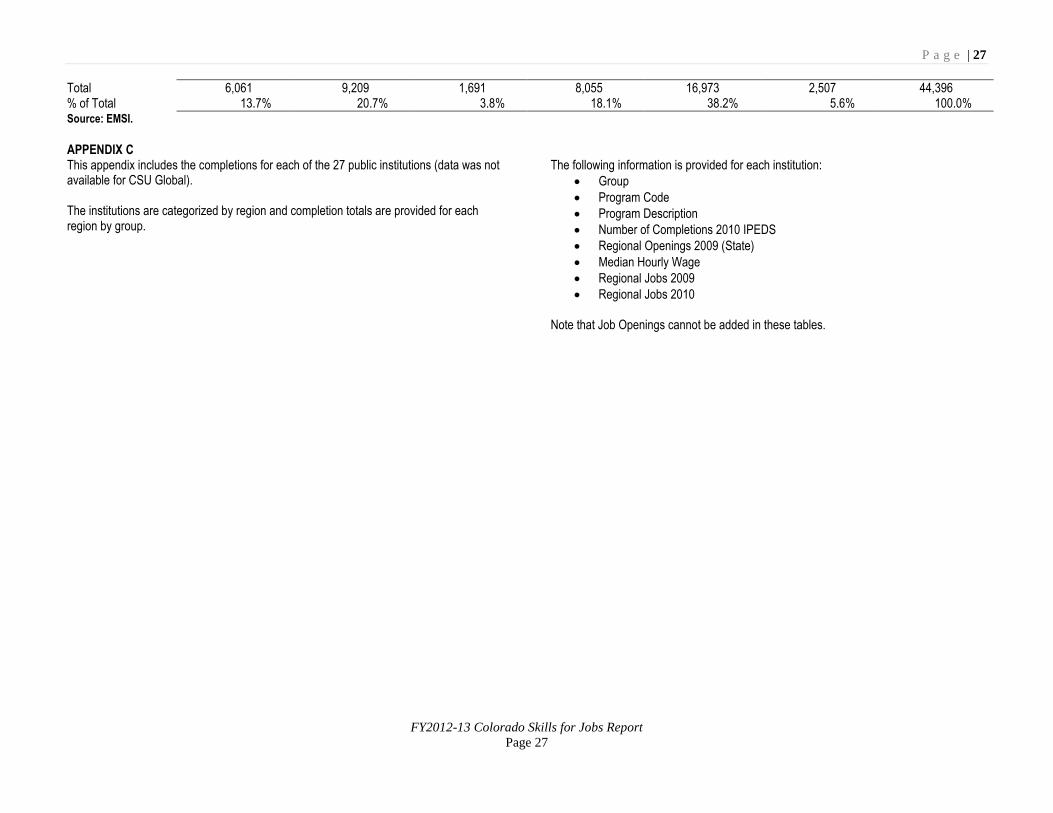
Total 6,061 9,209 1,691 8,055 16,973 2,507 44,396 % of Total 13.7% 20.7% 3.8% 18.1% 38.2% 5.6% 100.0% Source: EMSI.
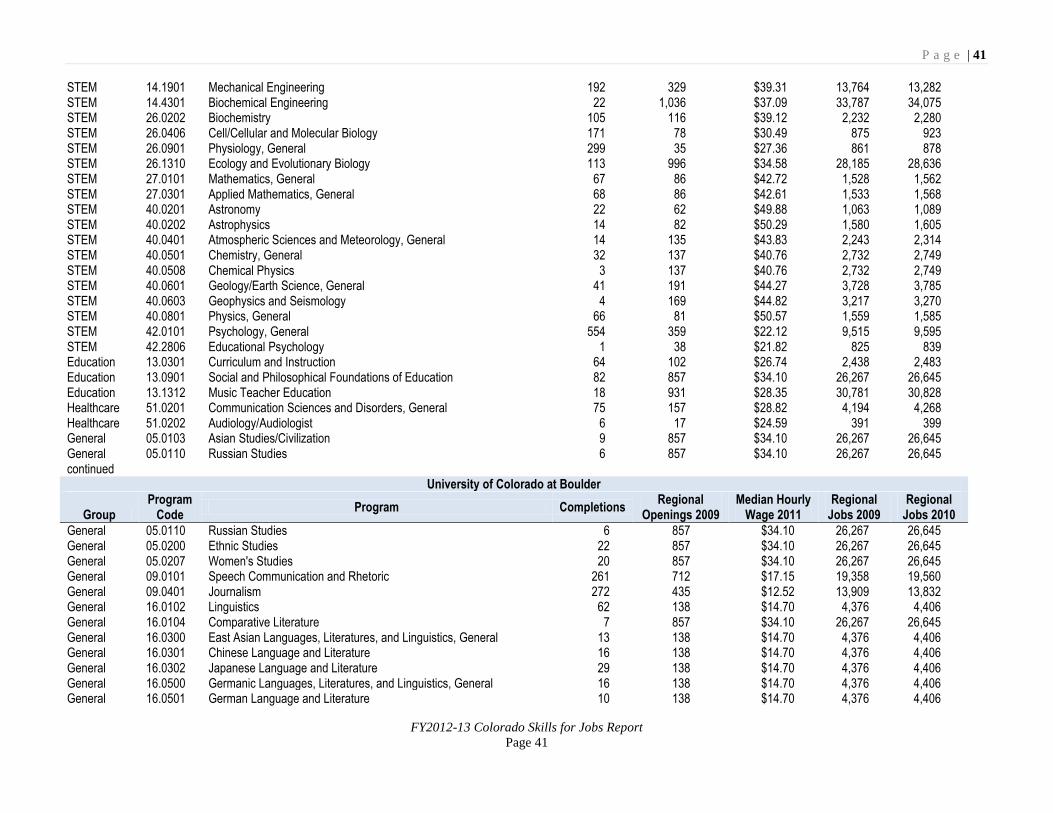
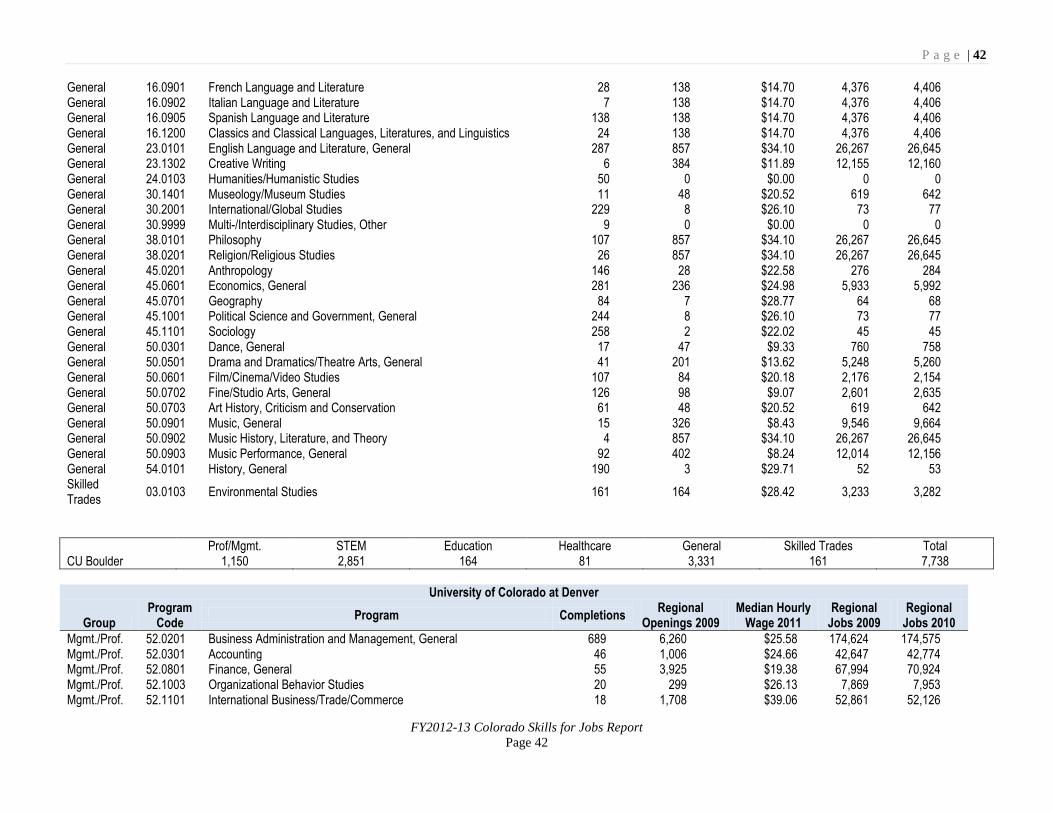
APPENDIX C This appendix includes the completions for each of the 27 public institutions (data was not available for CSU Global). The institutions are categorized by region and completion totals are provided for each region by group.
The following information is provided for each institution:
Group
Program Code
Program Description
Number of Completions 2010 IPEDS
Regional Openings 2009 (State)
Median Hourly Wage
Regional Jobs 2009
Regional Jobs 2010 Note that Job Openings cannot be added in these tables.
P a g e | 28
FY2012-13 Colorado Skills for Jobs Report
Page 28
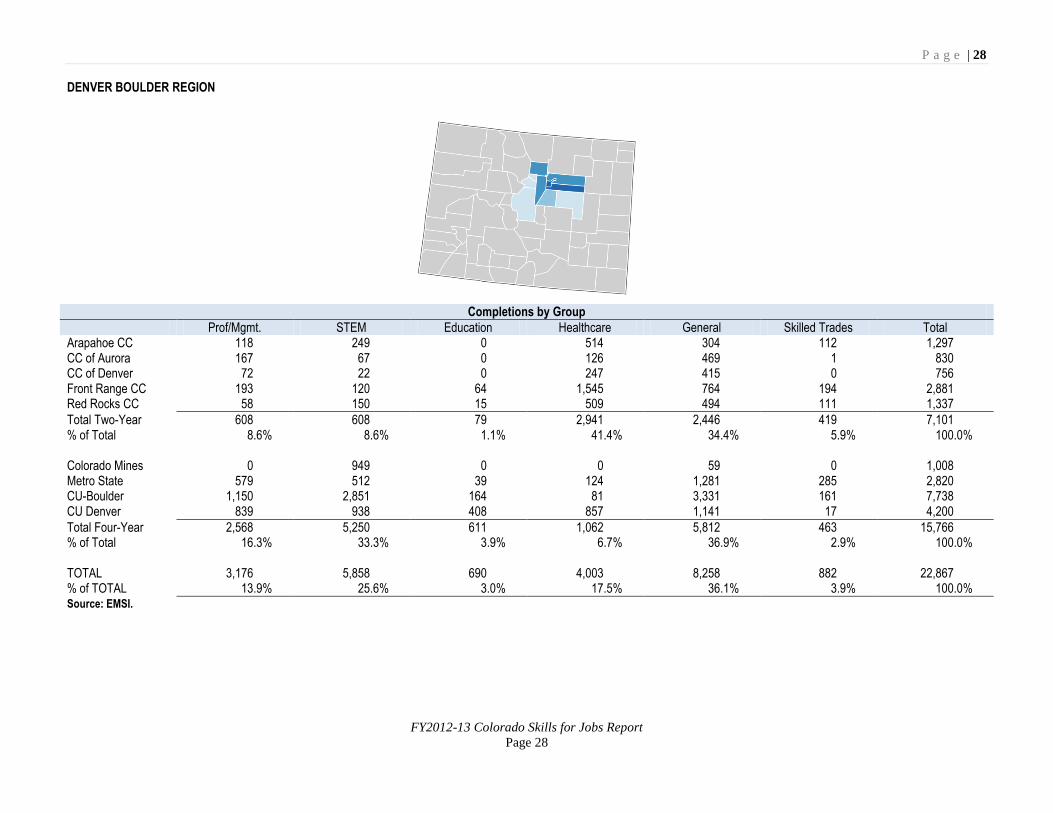
DENVER BOULDER REGION
Completions by Group
Prof/Mgmt. STEM Education Healthcare General Skilled Trades Total Arapahoe CC 118 249 0 514 304 112 1,297 CC of Aurora 167 67 0 126 469 1 830 CC of Denver 72 22 0 247 415 0 756 Front Range CC 193 120 64 1,545 764 194 2,881 Red Rocks CC 58 150 15 509 494 111 1,337
Total Two-Year 608 608 79 2,941 2,446 419 7,101 % of Total 8.6% 8.6% 1.1% 41.4% 34.4% 5.9% 100.0% Colorado Mines 0 949 0 0 59 0 1,008 Metro State 579 512 39 124 1,281 285 2,820 CU-Boulder 1,150 2,851 164 81 3,331 161 7,738 CU Denver 839 938 408 857 1,141 17 4,200
Total Four-Year 2,568 5,250 611 1,062 5,812 463 15,766 % of Total 16.3% 33.3% 3.9% 6.7% 36.9% 2.9% 100.0% TOTAL 3,176 5,858 690 4,003 8,258 882 22,867 % of TOTAL 13.9% 25.6% 3.0% 17.5% 36.1% 3.9% 100.0% Source: EMSI.
P a g e | 29
FY2012-13 Colorado Skills for Jobs Report
Page 29
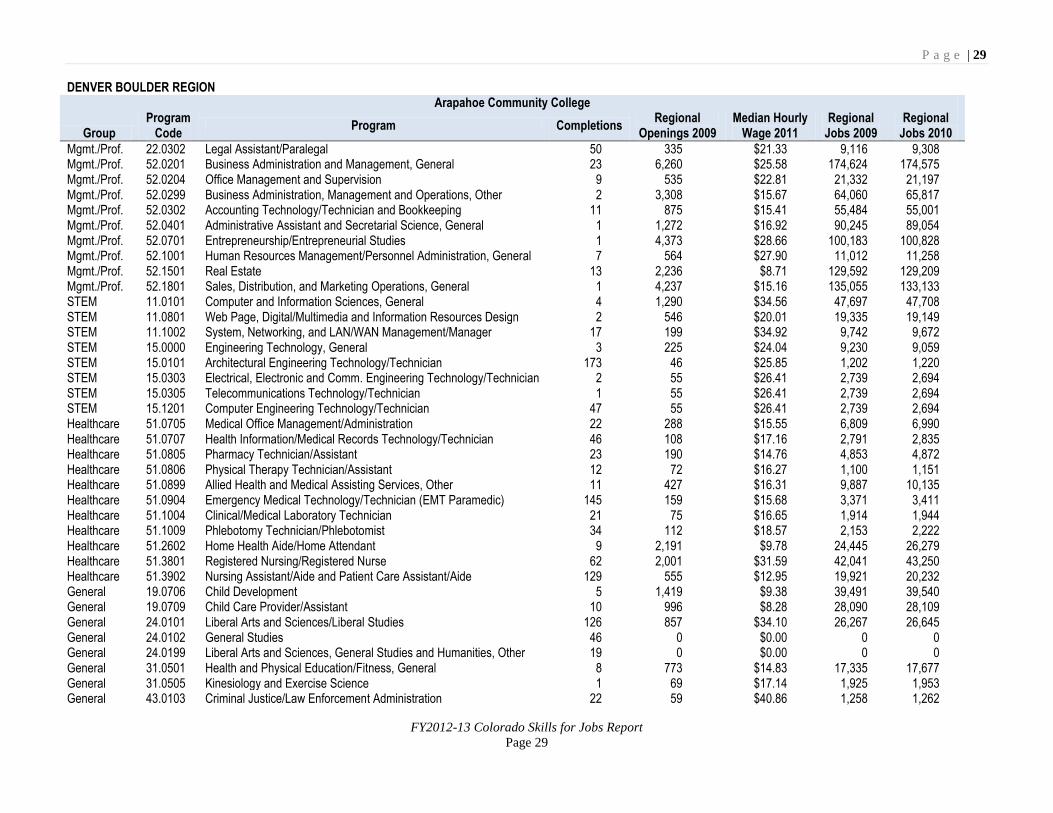
DENVER BOULDER REGION Arapahoe Community College
Group Program
Code Program Completions
Regional Openings 2009
Median Hourly Wage 2011
Regional Jobs 2009
Regional Jobs 2010
Mgmt./Prof. 22.0302 Legal Assistant/Paralegal 50 335 $21.33 9,116 9,308 Mgmt./Prof. 52.0201 Business Administration and Management, General 23 6,260 $25.58 174,624 174,575 Mgmt./Prof. 52.0204 Office Management and Supervision 9 535 $22.81 21,332 21,197 Mgmt./Prof. 52.0299 Business Administration, Management and Operations, Other 2 3,308 $15.67 64,060 65,817 Mgmt./Prof. 52.0302 Accounting Technology/Technician and Bookkeeping 11 875 $15.41 55,484 55,001 Mgmt./Prof. 52.0401 Administrative Assistant and Secretarial Science, General 1 1,272 $16.92 90,245 89,054 Mgmt./Prof. 52.0701 Entrepreneurship/Entrepreneurial Studies 1 4,373 $28.66 100,183 100,828 Mgmt./Prof. 52.1001 Human Resources Management/Personnel Administration, General 7 564 $27.90 11,012 11,258 Mgmt./Prof. 52.1501 Real Estate 13 2,236 $8.71 129,592 129,209 Mgmt./Prof. 52.1801 Sales, Distribution, and Marketing Operations, General 1 4,237 $15.16 135,055 133,133 STEM 11.0101 Computer and Information Sciences, General 4 1,290 $34.56 47,697 47,708 STEM 11.0801 Web Page, Digital/Multimedia and Information Resources Design 2 546 $20.01 19,335 19,149 STEM 11.1002 System, Networking, and LAN/WAN Management/Manager 17 199 $34.92 9,742 9,672 STEM 15.0000 Engineering Technology, General 3 225 $24.04 9,230 9,059 STEM 15.0101 Architectural Engineering Technology/Technician 173 46 $25.85 1,202 1,220 STEM 15.0303 Electrical, Electronic and Comm. Engineering Technology/Technician 2 55 $26.41 2,739 2,694 STEM 15.0305 Telecommunications Technology/Technician 1 55 $26.41 2,739 2,694 STEM 15.1201 Computer Engineering Technology/Technician 47 55 $26.41 2,739 2,694 Healthcare 51.0705 Medical Office Management/Administration 22 288 $15.55 6,809 6,990 Healthcare 51.0707 Health Information/Medical Records Technology/Technician 46 108 $17.16 2,791 2,835 Healthcare 51.0805 Pharmacy Technician/Assistant 23 190 $14.76 4,853 4,872 Healthcare 51.0806 Physical Therapy Technician/Assistant 12 72 $16.27 1,100 1,151 Healthcare 51.0899 Allied Health and Medical Assisting Services, Other 11 427 $16.31 9,887 10,135 Healthcare 51.0904 Emergency Medical Technology/Technician (EMT Paramedic) 145 159 $15.68 3,371 3,411 Healthcare 51.1004 Clinical/Medical Laboratory Technician 21 75 $16.65 1,914 1,944 Healthcare 51.1009 Phlebotomy Technician/Phlebotomist 34 112 $18.57 2,153 2,222 Healthcare 51.2602 Home Health Aide/Home Attendant 9 2,191 $9.78 24,445 26,279 Healthcare 51.3801 Registered Nursing/Registered Nurse 62 2,001 $31.59 42,041 43,250 Healthcare 51.3902 Nursing Assistant/Aide and Patient Care Assistant/Aide 129 555 $12.95 19,921 20,232 General 19.0706 Child Development 5 1,419 $9.38 39,491 39,540 General 19.0709 Child Care Provider/Assistant 10 996 $8.28 28,090 28,109 General 24.0101 Liberal Arts and Sciences/Liberal Studies 126 857 $34.10 26,267 26,645 General 24.0102 General Studies 46 0 $0.00 0 0 General 24.0199 Liberal Arts and Sciences, General Studies and Humanities, Other 19 0 $0.00 0 0 General 31.0501 Health and Physical Education/Fitness, General 8 773 $14.83 17,335 17,677 General 31.0505 Kinesiology and Exercise Science 1 69 $17.14 1,925 1,953 General 43.0103 Criminal Justice/Law Enforcement Administration 22 59 $40.86 1,258 1,262
P a g e | 30
FY2012-13 Colorado Skills for Jobs Report
Page 30
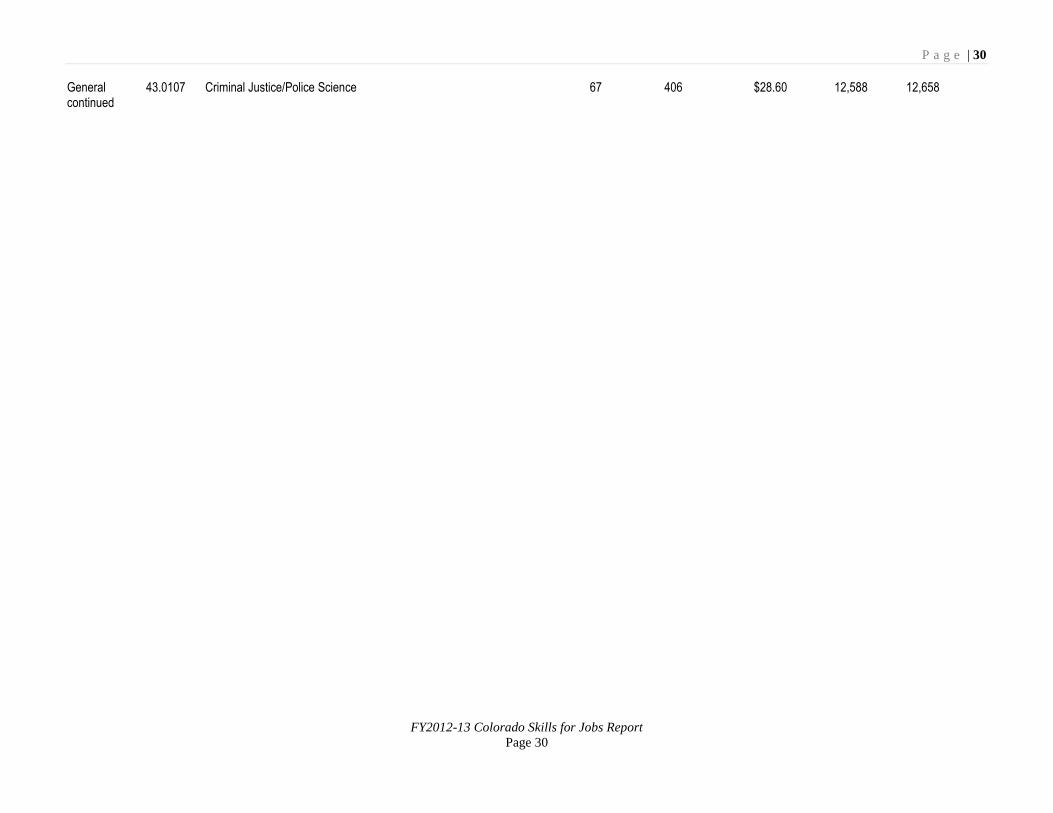
General 43.0107 Criminal Justice/Police Science 67 406 $28.60 12,588 12,658 continued
P a g e | 31
FY2012-13 Colorado Skills for Jobs Report
Page 31
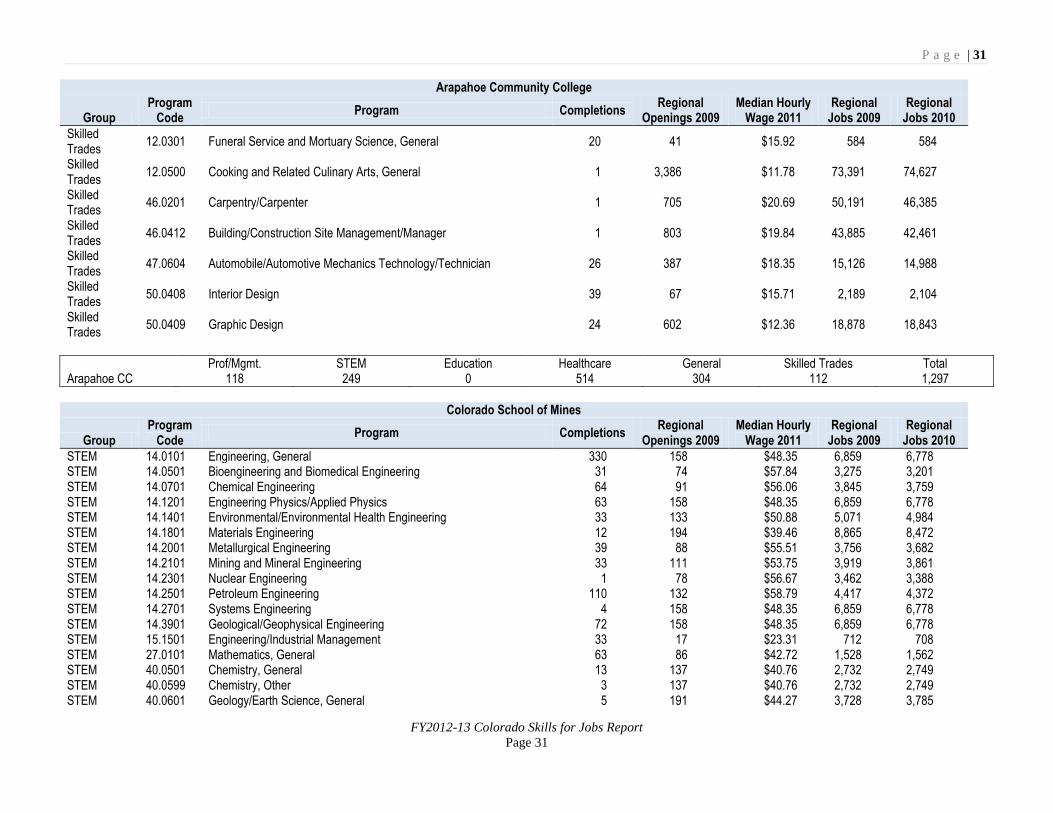
Arapahoe Community College
Group Program
Code Program Completions
Regional Openings 2009
Median Hourly Wage 2011
Regional Jobs 2009
Regional Jobs 2010
Skilled Trades
12.0301 Funeral Service and Mortuary Science, General 20 41 $15.92 584 584
Skilled Trades
12.0500 Cooking and Related Culinary Arts, General 1 3,386 $11.78 73,391 74,627
Skilled Trades
46.0201 Carpentry/Carpenter 1 705 $20.69 50,191 46,385
Skilled Trades
46.0412 Building/Construction Site Management/Manager 1 803 $19.84 43,885 42,461
Skilled Trades
47.0604 Automobile/Automotive Mechanics Technology/Technician 26 387 $18.35 15,126 14,988
Skilled Trades
50.0408 Interior Design 39 67 $15.71 2,189 2,104
Skilled Trades
50.0409 Graphic Design 24 602 $12.36 18,878 18,843
Prof/Mgmt. STEM Education Healthcare General Skilled Trades Total Arapahoe CC 118 249 0 514 304 112 1,297
Colorado School of Mines
Group Program
Code Program Completions
Regional Openings 2009
Median Hourly Wage 2011
Regional Jobs 2009
Regional Jobs 2010
STEM 14.0101 Engineering, General 330 158 $48.35 6,859 6,778 STEM 14.0501 Bioengineering and Biomedical Engineering 31 74 $57.84 3,275 3,201 STEM 14.0701 Chemical Engineering 64 91 $56.06 3,845 3,759 STEM 14.1201 Engineering Physics/Applied Physics 63 158 $48.35 6,859 6,778 STEM 14.1401 Environmental/Environmental Health Engineering 33 133 $50.88 5,071 4,984 STEM 14.1801 Materials Engineering 12 194 $39.46 8,865 8,472 STEM 14.2001 Metallurgical Engineering 39 88 $55.51 3,756 3,682 STEM 14.2101 Mining and Mineral Engineering 33 111 $53.75 3,919 3,861 STEM 14.2301 Nuclear Engineering 1 78 $56.67 3,462 3,388 STEM 14.2501 Petroleum Engineering 110 132 $58.79 4,417 4,372 STEM 14.2701 Systems Engineering 4 158 $48.35 6,859 6,778 STEM 14.3901 Geological/Geophysical Engineering 72 158 $48.35 6,859 6,778 STEM 15.1501 Engineering/Industrial Management 33 17 $23.31 712 708 STEM 27.0101 Mathematics, General 63 86 $42.72 1,528 1,562 STEM 40.0501 Chemistry, General 13 137 $40.76 2,732 2,749 STEM 40.0599 Chemistry, Other 3 137 $40.76 2,732 2,749 STEM 40.0601 Geology/Earth Science, General 5 191 $44.27 3,728 3,785
P a g e | 32
FY2012-13 Colorado Skills for Jobs Report
Page 32
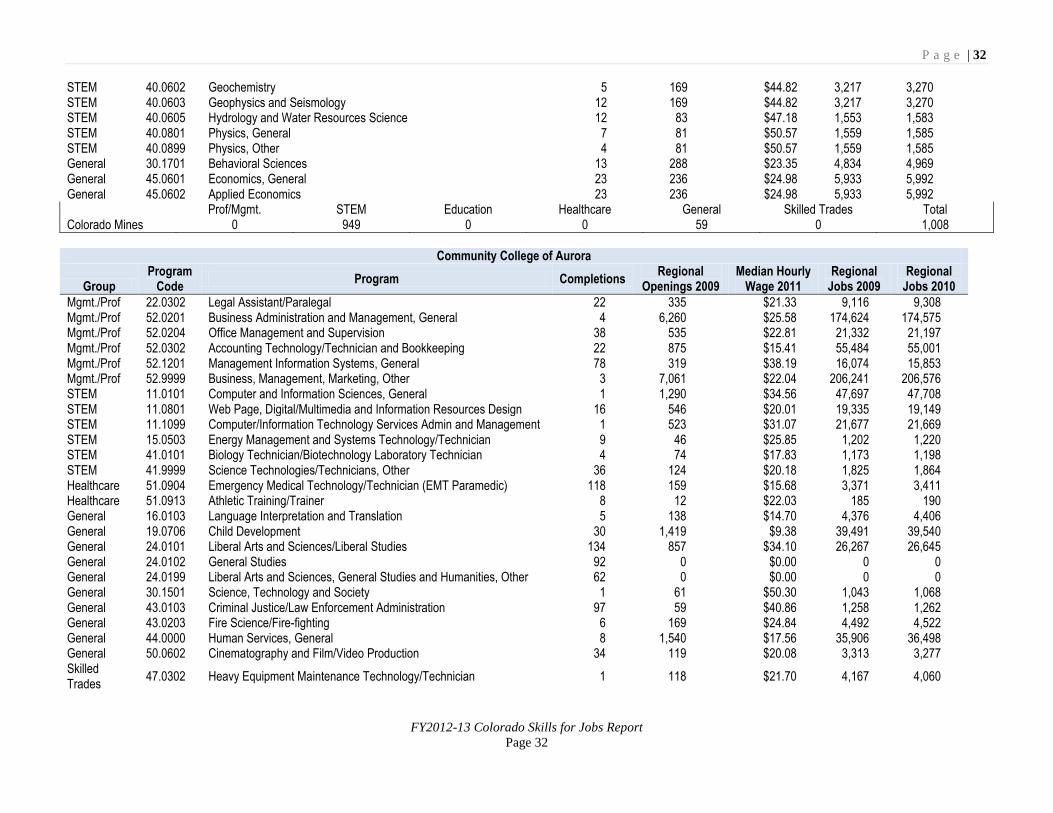
STEM 40.0602 Geochemistry 5 169 $44.82 3,217 3,270 STEM 40.0603 Geophysics and Seismology 12 169 $44.82 3,217 3,270 STEM 40.0605 Hydrology and Water Resources Science 12 83 $47.18 1,553 1,583 STEM 40.0801 Physics, General 7 81 $50.57 1,559 1,585 STEM 40.0899 Physics, Other 4 81 $50.57 1,559 1,585 General 30.1701 Behavioral Sciences 13 288 $23.35 4,834 4,969 General 45.0601 Economics, General 23 236 $24.98 5,933 5,992 General 45.0602 Applied Economics 23 236 $24.98 5,933 5,992
Prof/Mgmt. STEM Education Healthcare General Skilled Trades Total Colorado Mines 0 949 0 0 59 0 1,008
Community College of Aurora
Group Program
Code Program Completions
Regional Openings 2009
Median Hourly Wage 2011
Regional Jobs 2009
Regional Jobs 2010
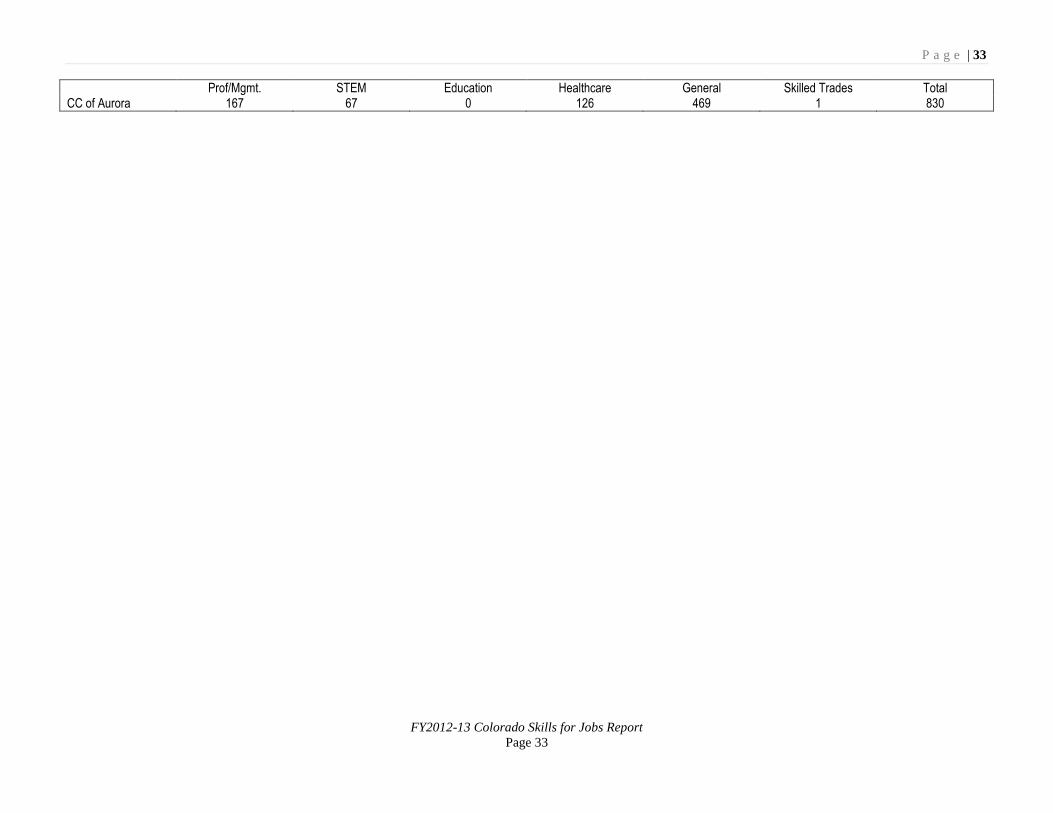
Mgmt./Prof 22.0302 Legal Assistant/Paralegal 22 335 $21.33 9,116 9,308 Mgmt./Prof 52.0201 Business Administration and Management, General 4 6,260 $25.58 174,624 174,575 Mgmt./Prof 52.0204 Office Management and Supervision 38 535 $22.81 21,332 21,197 Mgmt./Prof 52.0302 Accounting Technology/Technician and Bookkeeping 22 875 $15.41 55,484 55,001 Mgmt./Prof 52.1201 Management Information Systems, General 78 319 $38.19 16,074 15,853 Mgmt./Prof 52.9999 Business, Management, Marketing, Other 3 7,061 $22.04 206,241 206,576 STEM 11.0101 Computer and Information Sciences, General 1 1,290 $34.56 47,697 47,708 STEM 11.0801 Web Page, Digital/Multimedia and Information Resources Design 16 546 $20.01 19,335 19,149 STEM 11.1099 Computer/Information Technology Services Admin and Management 1 523 $31.07 21,677 21,669 STEM 15.0503 Energy Management and Systems Technology/Technician 9 46 $25.85 1,202 1,220 STEM 41.0101 Biology Technician/Biotechnology Laboratory Technician 4 74 $17.83 1,173 1,198 STEM 41.9999 Science Technologies/Technicians, Other 36 124 $20.18 1,825 1,864 Healthcare 51.0904 Emergency Medical Technology/Technician (EMT Paramedic) 118 159 $15.68 3,371 3,411 Healthcare 51.0913 Athletic Training/Trainer 8 12 $22.03 185 190 General 16.0103 Language Interpretation and Translation 5 138 $14.70 4,376 4,406 General 19.0706 Child Development 30 1,419 $9.38 39,491 39,540 General 24.0101 Liberal Arts and Sciences/Liberal Studies 134 857 $34.10 26,267 26,645 General 24.0102 General Studies 92 0 $0.00 0 0 General 24.0199 Liberal Arts and Sciences, General Studies and Humanities, Other 62 0 $0.00 0 0 General 30.1501 Science, Technology and Society 1 61 $50.30 1,043 1,068 General 43.0103 Criminal Justice/Law Enforcement Administration 97 59 $40.86 1,258 1,262 General 43.0203 Fire Science/Fire-fighting 6 169 $24.84 4,492 4,522 General 44.0000 Human Services, General 8 1,540 $17.56 35,906 36,498 General 50.0602 Cinematography and Film/Video Production 34 119 $20.08 3,313 3,277 Skilled Trades
47.0302 Heavy Equipment Maintenance Technology/Technician 1 118 $21.70 4,167 4,060
P a g e | 33
FY2012-13 Colorado Skills for Jobs Report
Page 33
Prof/Mgmt. STEM Education Healthcare General Skilled Trades Total CC of Aurora 167 67 0 126 469 1 830
P a g e | 34
FY2012-13 Colorado Skills for Jobs Report
Page 34
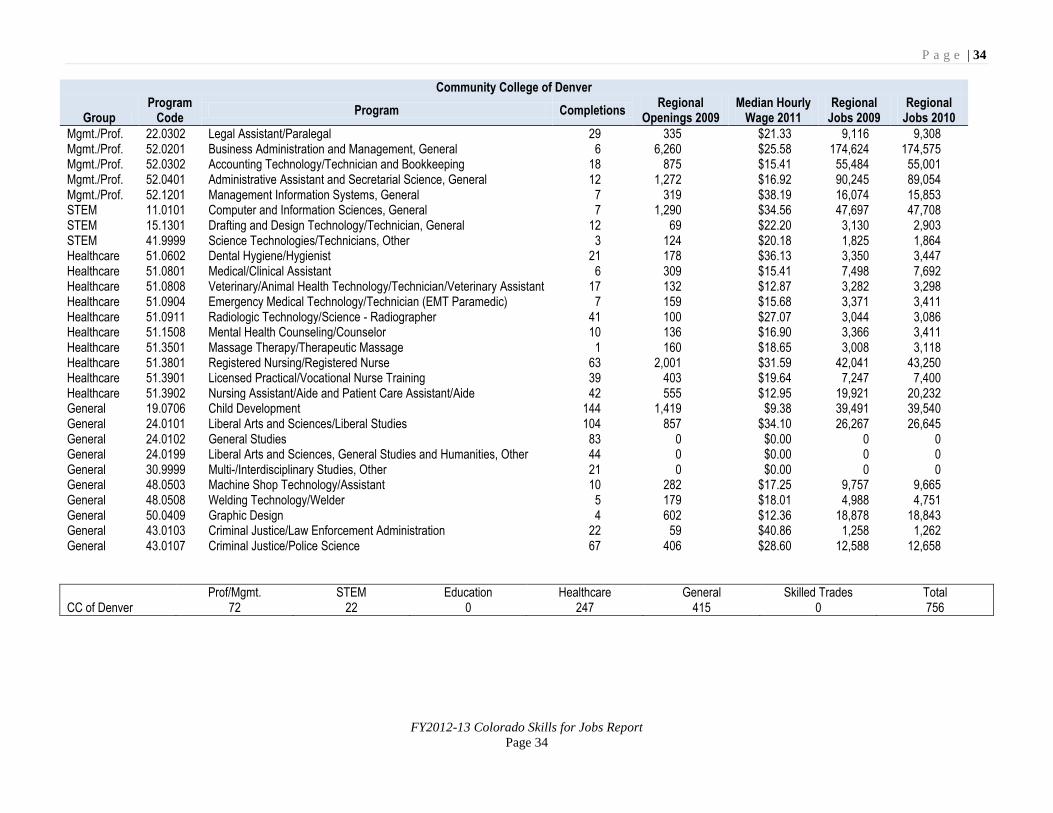
Community College of Denver
Group Program
Code Program Completions
Regional Openings 2009
Median Hourly Wage 2011
Regional Jobs 2009
Regional Jobs 2010
Mgmt./Prof. 22.0302 Legal Assistant/Paralegal 29 335 $21.33 9,116 9,308 Mgmt./Prof. 52.0201 Business Administration and Management, General 6 6,260 $25.58 174,624 174,575 Mgmt./Prof. 52.0302 Accounting Technology/Technician and Bookkeeping 18 875 $15.41 55,484 55,001 Mgmt./Prof. 52.0401 Administrative Assistant and Secretarial Science, General 12 1,272 $16.92 90,245 89,054 Mgmt./Prof. 52.1201 Management Information Systems, General 7 319 $38.19 16,074 15,853 STEM 11.0101 Computer and Information Sciences, General 7 1,290 $34.56 47,697 47,708 STEM 15.1301 Drafting and Design Technology/Technician, General 12 69 $22.20 3,130 2,903 STEM 41.9999 Science Technologies/Technicians, Other 3 124 $20.18 1,825 1,864 Healthcare 51.0602 Dental Hygiene/Hygienist 21 178 $36.13 3,350 3,447 Healthcare 51.0801 Medical/Clinical Assistant 6 309 $15.41 7,498 7,692 Healthcare 51.0808 Veterinary/Animal Health Technology/Technician/Veterinary Assistant 17 132 $12.87 3,282 3,298 Healthcare 51.0904 Emergency Medical Technology/Technician (EMT Paramedic) 7 159 $15.68 3,371 3,411 Healthcare 51.0911 Radiologic Technology/Science - Radiographer 41 100 $27.07 3,044 3,086 Healthcare 51.1508 Mental Health Counseling/Counselor 10 136 $16.90 3,366 3,411 Healthcare 51.3501 Massage Therapy/Therapeutic Massage 1 160 $18.65 3,008 3,118 Healthcare 51.3801 Registered Nursing/Registered Nurse 63 2,001 $31.59 42,041 43,250 Healthcare 51.3901 Licensed Practical/Vocational Nurse Training 39 403 $19.64 7,247 7,400 Healthcare 51.3902 Nursing Assistant/Aide and Patient Care Assistant/Aide 42 555 $12.95 19,921 20,232 General 19.0706 Child Development 144 1,419 $9.38 39,491 39,540 General 24.0101 Liberal Arts and Sciences/Liberal Studies 104 857 $34.10 26,267 26,645 General 24.0102 General Studies 83 0 $0.00 0 0 General 24.0199 Liberal Arts and Sciences, General Studies and Humanities, Other 44 0 $0.00 0 0 General 30.9999 Multi-/Interdisciplinary Studies, Other 21 0 $0.00 0 0 General 48.0503 Machine Shop Technology/Assistant 10 282 $17.25 9,757 9,665 General 48.0508 Welding Technology/Welder 5 179 $18.01 4,988 4,751 General 50.0409 Graphic Design 4 602 $12.36 18,878 18,843 General 43.0103 Criminal Justice/Law Enforcement Administration 22 59 $40.86 1,258 1,262 General 43.0107 Criminal Justice/Police Science 67 406 $28.60 12,588 12,658
Prof/Mgmt. STEM Education Healthcare General Skilled Trades Total CC of Denver 72 22 0 247 415 0 756
P a g e | 35
FY2012-13 Colorado Skills for Jobs Report
Page 35
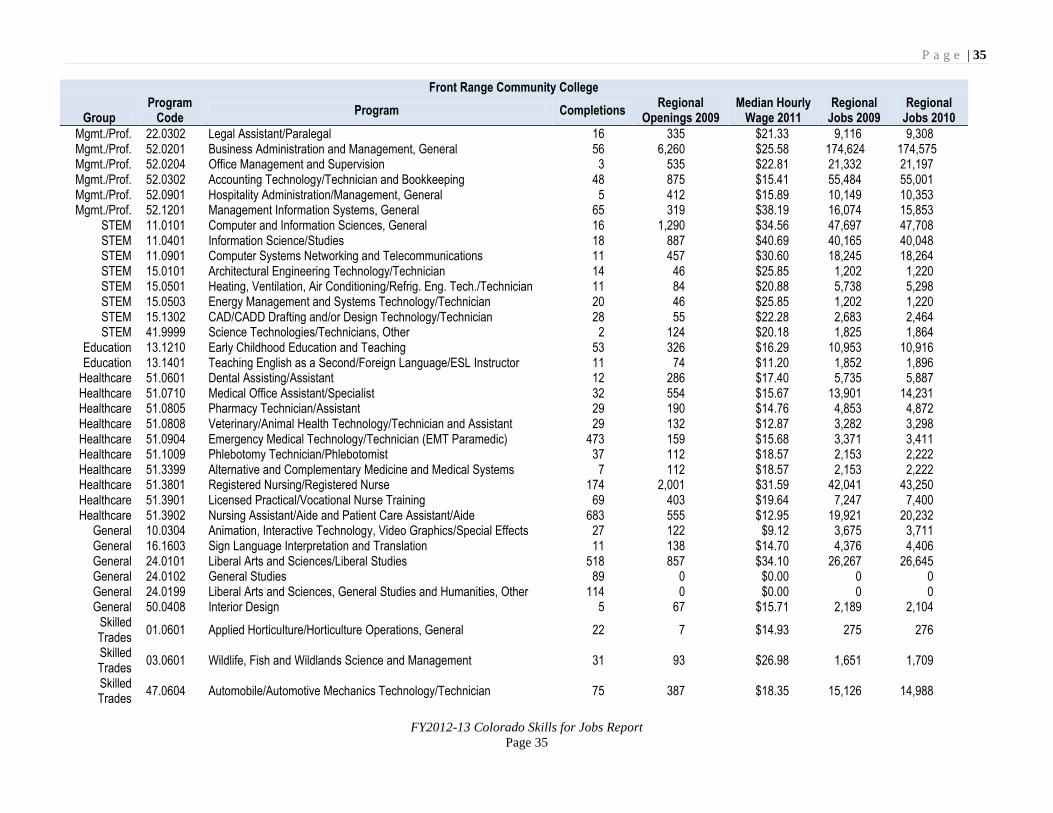
Front Range Community College
Group Program
Code Program Completions
Regional Openings 2009
Median Hourly Wage 2011
Regional Jobs 2009
Regional Jobs 2010
Mgmt./Prof. 22.0302 Legal Assistant/Paralegal 16 335 $21.33 9,116 9,308 Mgmt./Prof. 52.0201 Business Administration and Management, General 56 6,260 $25.58 174,624 174,575 Mgmt./Prof. 52.0204 Office Management and Supervision 3 535 $22.81 21,332 21,197 Mgmt./Prof. 52.0302 Accounting Technology/Technician and Bookkeeping 48 875 $15.41 55,484 55,001 Mgmt./Prof. 52.0901 Hospitality Administration/Management, General 5 412 $15.89 10,149 10,353 Mgmt./Prof. 52.1201 Management Information Systems, General 65 319 $38.19 16,074 15,853
STEM 11.0101 Computer and Information Sciences, General 16 1,290 $34.56 47,697 47,708 STEM 11.0401 Information Science/Studies 18 887 $40.69 40,165 40,048 STEM 11.0901 Computer Systems Networking and Telecommunications 11 457 $30.60 18,245 18,264 STEM 15.0101 Architectural Engineering Technology/Technician 14 46 $25.85 1,202 1,220 STEM 15.0501 Heating, Ventilation, Air Conditioning/Refrig. Eng. Tech./Technician 11 84 $20.88 5,738 5,298 STEM 15.0503 Energy Management and Systems Technology/Technician 20 46 $25.85 1,202 1,220 STEM 15.1302 CAD/CADD Drafting and/or Design Technology/Technician 28 55 $22.28 2,683 2,464 STEM 41.9999 Science Technologies/Technicians, Other 2 124 $20.18 1,825 1,864
Education 13.1210 Early Childhood Education and Teaching 53 326 $16.29 10,953 10,916 Education 13.1401 Teaching English as a Second/Foreign Language/ESL Instructor 11 74 $11.20 1,852 1,896
Healthcare 51.0601 Dental Assisting/Assistant 12 286 $17.40 5,735 5,887 Healthcare 51.0710 Medical Office Assistant/Specialist 32 554 $15.67 13,901 14,231 Healthcare 51.0805 Pharmacy Technician/Assistant 29 190 $14.76 4,853 4,872 Healthcare 51.0808 Veterinary/Animal Health Technology/Technician and Assistant 29 132 $12.87 3,282 3,298 Healthcare 51.0904 Emergency Medical Technology/Technician (EMT Paramedic) 473 159 $15.68 3,371 3,411 Healthcare 51.1009 Phlebotomy Technician/Phlebotomist 37 112 $18.57 2,153 2,222 Healthcare 51.3399 Alternative and Complementary Medicine and Medical Systems 7 112 $18.57 2,153 2,222 Healthcare 51.3801 Registered Nursing/Registered Nurse 174 2,001 $31.59 42,041 43,250 Healthcare 51.3901 Licensed Practical/Vocational Nurse Training 69 403 $19.64 7,247 7,400 Healthcare 51.3902 Nursing Assistant/Aide and Patient Care Assistant/Aide 683 555 $12.95 19,921 20,232
General 10.0304 Animation, Interactive Technology, Video Graphics/Special Effects 27 122 $9.12 3,675 3,711 General 16.1603 Sign Language Interpretation and Translation 11 138 $14.70 4,376 4,406 General 24.0101 Liberal Arts and Sciences/Liberal Studies 518 857 $34.10 26,267 26,645 General 24.0102 General Studies 89 0 $0.00 0 0 General 24.0199 Liberal Arts and Sciences, General Studies and Humanities, Other 114 0 $0.00 0 0 General 50.0408 Interior Design 5 67 $15.71 2,189 2,104
Skilled Trades
01.0601 Applied Horticulture/Horticulture Operations, General 22 7 $14.93 275 276
Skilled Trades
03.0601 Wildlife, Fish and Wildlands Science and Management 31 93 $26.98 1,651 1,709
Skilled Trades
47.0604 Automobile/Automotive Mechanics Technology/Technician 75 387 $18.35 15,126 14,988
P a g e | 36
FY2012-13 Colorado Skills for Jobs Report
Page 36
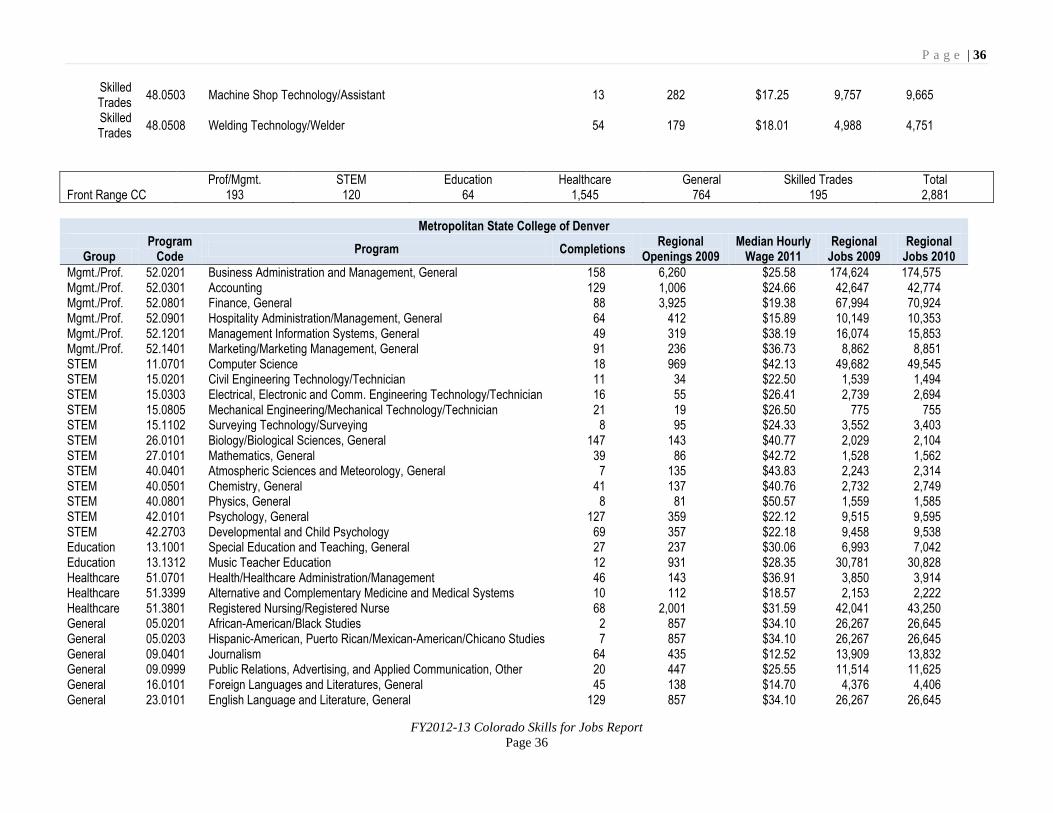
Skilled Trades
48.0503 Machine Shop Technology/Assistant 13 282 $17.25 9,757 9,665
Skilled Trades
48.0508 Welding Technology/Welder 54 179 $18.01 4,988 4,751
Prof/Mgmt. STEM Education Healthcare General Skilled Trades Total Front Range CC 193 120 64 1,545 764 195 2,881
Metropolitan State College of Denver
Group Program
Code Program Completions
Regional Openings 2009
Median Hourly Wage 2011
Regional Jobs 2009
Regional Jobs 2010
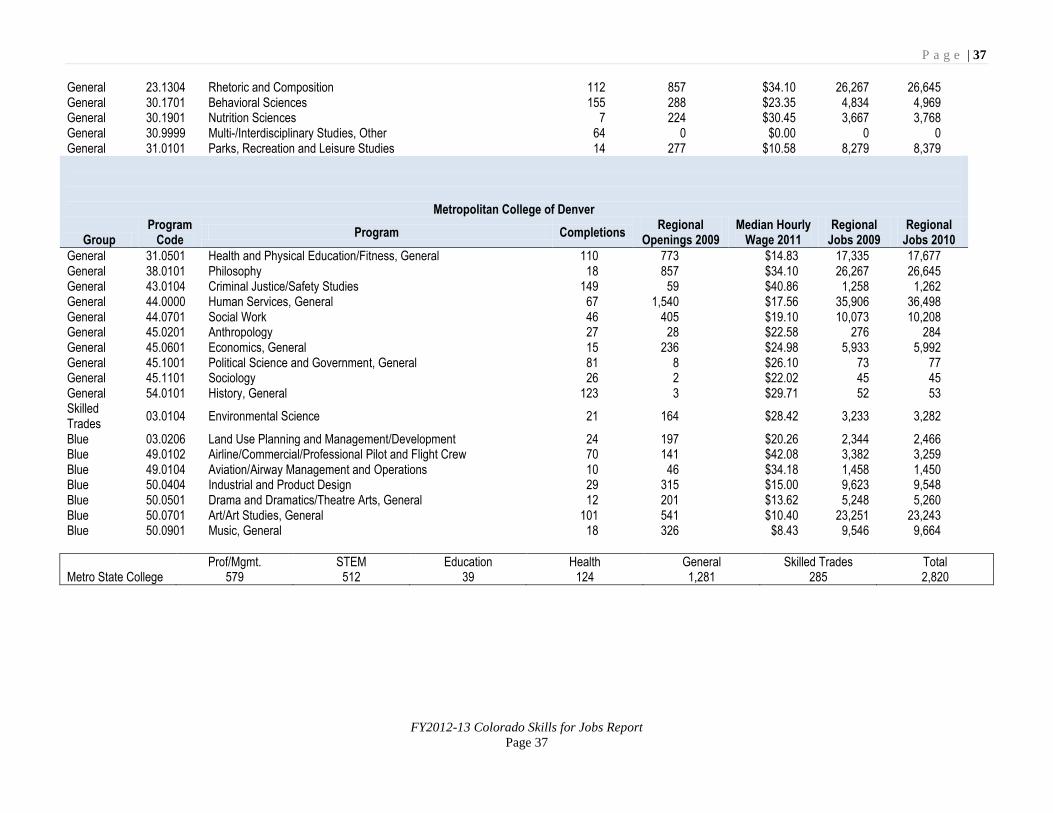
Mgmt./Prof. 52.0201 Business Administration and Management, General 158 6,260 $25.58 174,624 174,575 Mgmt./Prof. 52.0301 Accounting 129 1,006 $24.66 42,647 42,774 Mgmt./Prof. 52.0801 Finance, General 88 3,925 $19.38 67,994 70,924 Mgmt./Prof. 52.0901 Hospitality Administration/Management, General 64 412 $15.89 10,149 10,353 Mgmt./Prof. 52.1201 Management Information Systems, General 49 319 $38.19 16,074 15,853 Mgmt./Prof. 52.1401 Marketing/Marketing Management, General 91 236 $36.73 8,862 8,851 STEM 11.0701 Computer Science 18 969 $42.13 49,682 49,545 STEM 15.0201 Civil Engineering Technology/Technician 11 34 $22.50 1,539 1,494 STEM 15.0303 Electrical, Electronic and Comm. Engineering Technology/Technician 16 55 $26.41 2,739 2,694 STEM 15.0805 Mechanical Engineering/Mechanical Technology/Technician 21 19 $26.50 775 755 STEM 15.1102 Surveying Technology/Surveying 8 95 $24.33 3,552 3,403 STEM 26.0101 Biology/Biological Sciences, General 147 143 $40.77 2,029 2,104 STEM 27.0101 Mathematics, General 39 86 $42.72 1,528 1,562 STEM 40.0401 Atmospheric Sciences and Meteorology, General 7 135 $43.83 2,243 2,314 STEM 40.0501 Chemistry, General 41 137 $40.76 2,732 2,749 STEM 40.0801 Physics, General 8 81 $50.57 1,559 1,585 STEM 42.0101 Psychology, General 127 359 $22.12 9,515 9,595 STEM 42.2703 Developmental and Child Psychology 69 357 $22.18 9,458 9,538 Education 13.1001 Special Education and Teaching, General 27 237 $30.06 6,993 7,042 Education 13.1312 Music Teacher Education 12 931 $28.35 30,781 30,828 Healthcare 51.0701 Health/Healthcare Administration/Management 46 143 $36.91 3,850 3,914 Healthcare 51.3399 Alternative and Complementary Medicine and Medical Systems 10 112 $18.57 2,153 2,222 Healthcare 51.3801 Registered Nursing/Registered Nurse 68 2,001 $31.59 42,041 43,250 General 05.0201 African-American/Black Studies 2 857 $34.10 26,267 26,645 General 05.0203 Hispanic-American, Puerto Rican/Mexican-American/Chicano Studies 7 857 $34.10 26,267 26,645 General 09.0401 Journalism 64 435 $12.52 13,909 13,832 General 09.0999 Public Relations, Advertising, and Applied Communication, Other 20 447 $25.55 11,514 11,625 General 16.0101 Foreign Languages and Literatures, General 45 138 $14.70 4,376 4,406 General 23.0101 English Language and Literature, General 129 857 $34.10 26,267 26,645
P a g e | 37
FY2012-13 Colorado Skills for Jobs Report
Page 37
General 23.1304 Rhetoric and Composition 112 857 $34.10 26,267 26,645 General 30.1701 Behavioral Sciences 155 288 $23.35 4,834 4,969 General 30.1901 Nutrition Sciences 7 224 $30.45 3,667 3,768 General 30.9999 Multi-/Interdisciplinary Studies, Other 64 0 $0.00 0 0 General 31.0101 Parks, Recreation and Leisure Studies 14 277 $10.58 8,279 8,379
Metropolitan College of Denver
Group Program
Code Program Completions
Regional Openings 2009
Median Hourly Wage 2011
Regional Jobs 2009
Regional Jobs 2010
General 31.0501 Health and Physical Education/Fitness, General 110 773 $14.83 17,335 17,677 General 38.0101 Philosophy 18 857 $34.10 26,267 26,645 General 43.0104 Criminal Justice/Safety Studies 149 59 $40.86 1,258 1,262 General 44.0000 Human Services, General 67 1,540 $17.56 35,906 36,498 General 44.0701 Social Work 46 405 $19.10 10,073 10,208 General 45.0201 Anthropology 27 28 $22.58 276 284 General 45.0601 Economics, General 15 236 $24.98 5,933 5,992 General 45.1001 Political Science and Government, General 81 8 $26.10 73 77 General 45.1101 Sociology 26 2 $22.02 45 45 General 54.0101 History, General 123 3 $29.71 52 53 Skilled Trades
03.0104 Environmental Science 21 164 $28.42 3,233 3,282
Blue 03.0206 Land Use Planning and Management/Development 24 197 $20.26 2,344 2,466 Blue 49.0102 Airline/Commercial/Professional Pilot and Flight Crew 70 141 $42.08 3,382 3,259 Blue 49.0104 Aviation/Airway Management and Operations 10 46 $34.18 1,458 1,450 Blue 50.0404 Industrial and Product Design 29 315 $15.00 9,623 9,548 Blue 50.0501 Drama and Dramatics/Theatre Arts, General 12 201 $13.62 5,248 5,260 Blue 50.0701 Art/Art Studies, General 101 541 $10.40 23,251 23,243 Blue 50.0901 Music, General 18 326 $8.43 9,546 9,664
Prof/Mgmt. STEM Education Health General Skilled Trades Total Metro State College 579 512 39 124 1,281 285 2,820
P a g e | 38
FY2012-13 Colorado Skills for Jobs Report
Page 38
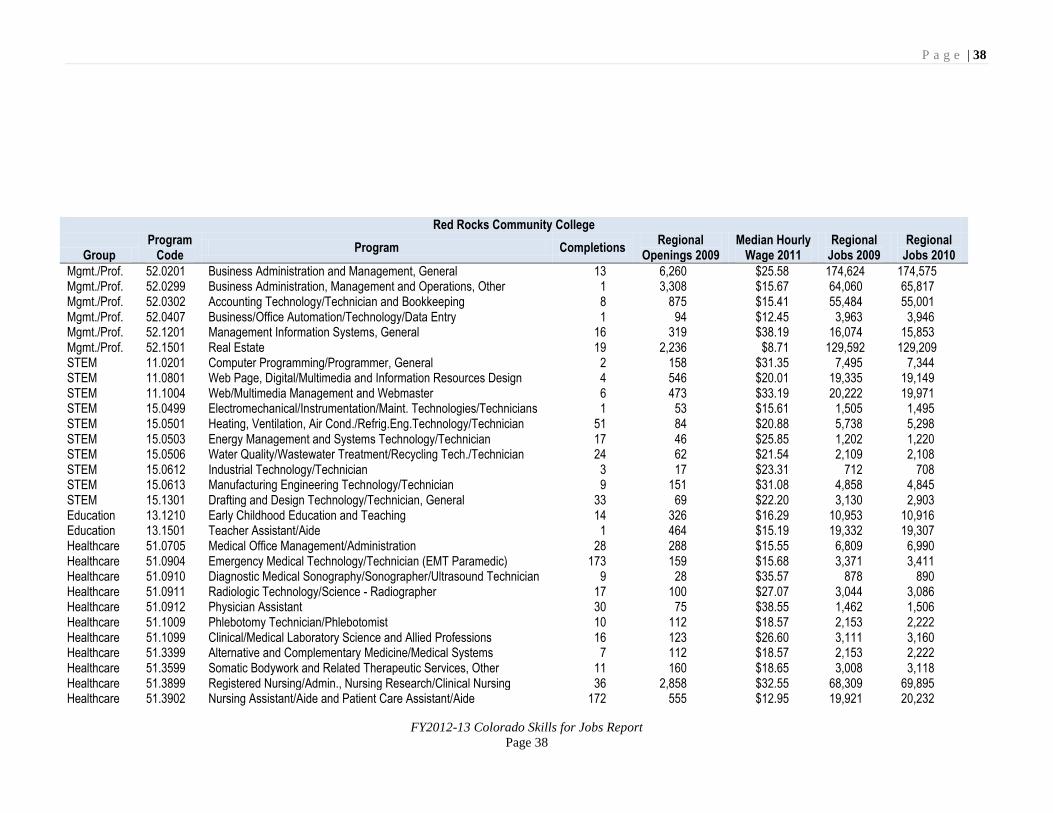
Red Rocks Community College
Group Program
Code Program Completions
Regional Openings 2009
Median Hourly Wage 2011
Regional Jobs 2009
Regional Jobs 2010
Mgmt./Prof. 52.0201 Business Administration and Management, General 13 6,260 $25.58 174,624 174,575 Mgmt./Prof. 52.0299 Business Administration, Management and Operations, Other 1 3,308 $15.67 64,060 65,817 Mgmt./Prof. 52.0302 Accounting Technology/Technician and Bookkeeping 8 875 $15.41 55,484 55,001 Mgmt./Prof. 52.0407 Business/Office Automation/Technology/Data Entry 1 94 $12.45 3,963 3,946 Mgmt./Prof. 52.1201 Management Information Systems, General 16 319 $38.19 16,074 15,853 Mgmt./Prof. 52.1501 Real Estate 19 2,236 $8.71 129,592 129,209 STEM 11.0201 Computer Programming/Programmer, General 2 158 $31.35 7,495 7,344 STEM 11.0801 Web Page, Digital/Multimedia and Information Resources Design 4 546 $20.01 19,335 19,149 STEM 11.1004 Web/Multimedia Management and Webmaster 6 473 $33.19 20,222 19,971 STEM 15.0499 Electromechanical/Instrumentation/Maint. Technologies/Technicians 1 53 $15.61 1,505 1,495 STEM 15.0501 Heating, Ventilation, Air Cond./Refrig.Eng.Technology/Technician 51 84 $20.88 5,738 5,298 STEM 15.0503 Energy Management and Systems Technology/Technician 17 46 $25.85 1,202 1,220 STEM 15.0506 Water Quality/Wastewater Treatment/Recycling Tech./Technician 24 62 $21.54 2,109 2,108 STEM 15.0612 Industrial Technology/Technician 3 17 $23.31 712 708 STEM 15.0613 Manufacturing Engineering Technology/Technician 9 151 $31.08 4,858 4,845 STEM 15.1301 Drafting and Design Technology/Technician, General 33 69 $22.20 3,130 2,903 Education 13.1210 Early Childhood Education and Teaching 14 326 $16.29 10,953 10,916 Education 13.1501 Teacher Assistant/Aide 1 464 $15.19 19,332 19,307 Healthcare 51.0705 Medical Office Management/Administration 28 288 $15.55 6,809 6,990 Healthcare 51.0904 Emergency Medical Technology/Technician (EMT Paramedic) 173 159 $15.68 3,371 3,411 Healthcare 51.0910 Diagnostic Medical Sonography/Sonographer/Ultrasound Technician 9 28 $35.57 878 890 Healthcare 51.0911 Radiologic Technology/Science - Radiographer 17 100 $27.07 3,044 3,086 Healthcare 51.0912 Physician Assistant 30 75 $38.55 1,462 1,506 Healthcare 51.1009 Phlebotomy Technician/Phlebotomist 10 112 $18.57 2,153 2,222 Healthcare 51.1099 Clinical/Medical Laboratory Science and Allied Professions 16 123 $26.60 3,111 3,160 Healthcare 51.3399 Alternative and Complementary Medicine/Medical Systems 7 112 $18.57 2,153 2,222 Healthcare 51.3599 Somatic Bodywork and Related Therapeutic Services, Other 11 160 $18.65 3,008 3,118 Healthcare 51.3899 Registered Nursing/Admin., Nursing Research/Clinical Nursing 36 2,858 $32.55 68,309 69,895 Healthcare 51.3902 Nursing Assistant/Aide and Patient Care Assistant/Aide 172 555 $12.95 19,921 20,232
P a g e | 39
FY2012-13 Colorado Skills for Jobs Report
Page 39
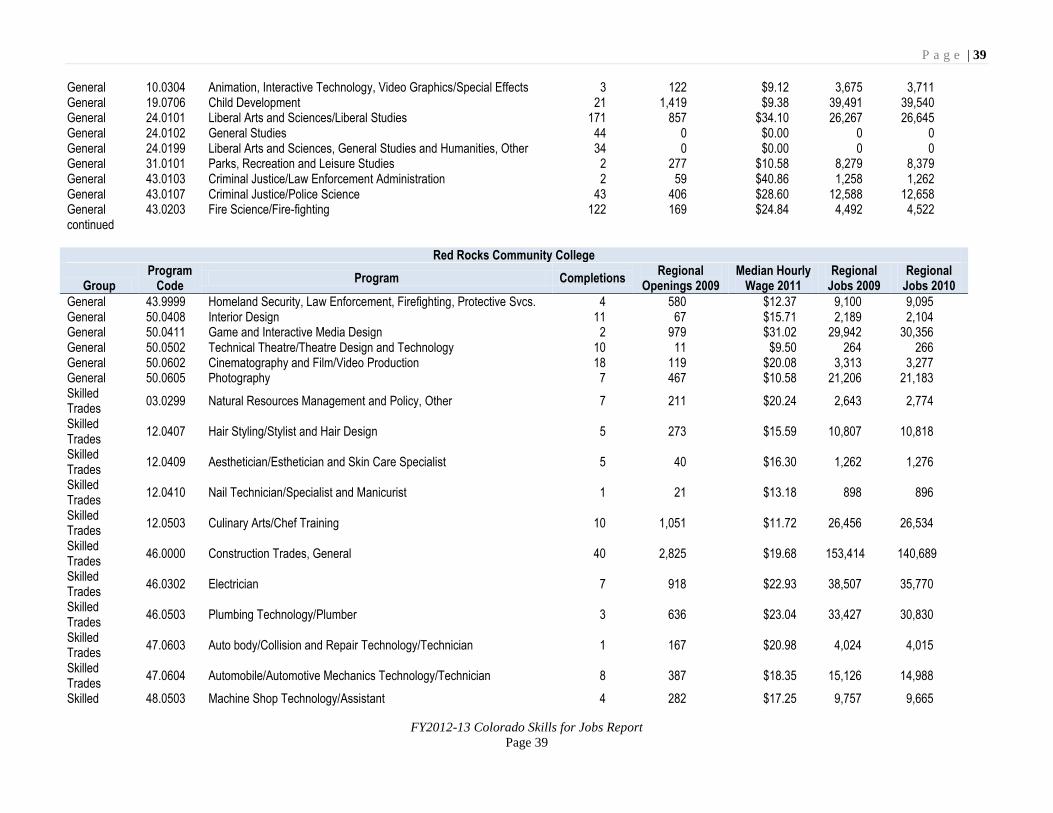
General 10.0304 Animation, Interactive Technology, Video Graphics/Special Effects 3 122 $9.12 3,675 3,711 General 19.0706 Child Development 21 1,419 $9.38 39,491 39,540 General 24.0101 Liberal Arts and Sciences/Liberal Studies 171 857 $34.10 26,267 26,645 General 24.0102 General Studies 44 0 $0.00 0 0 General 24.0199 Liberal Arts and Sciences, General Studies and Humanities, Other 34 0 $0.00 0 0 General 31.0101 Parks, Recreation and Leisure Studies 2 277 $10.58 8,279 8,379 General 43.0103 Criminal Justice/Law Enforcement Administration 2 59 $40.86 1,258 1,262 General 43.0107 Criminal Justice/Police Science 43 406 $28.60 12,588 12,658 General 43.0203 Fire Science/Fire-fighting 122 169 $24.84 4,492 4,522 continued
Red Rocks Community College
Group Program
Code Program Completions
Regional Openings 2009
Median Hourly Wage 2011
Regional Jobs 2009
Regional Jobs 2010
General 43.9999 Homeland Security, Law Enforcement, Firefighting, Protective Svcs. 4 580 $12.37 9,100 9,095 General 50.0408 Interior Design 11 67 $15.71 2,189 2,104 General 50.0411 Game and Interactive Media Design 2 979 $31.02 29,942 30,356 General 50.0502 Technical Theatre/Theatre Design and Technology 10 11 $9.50 264 266 General 50.0602 Cinematography and Film/Video Production 18 119 $20.08 3,313 3,277 General 50.0605 Photography 7 467 $10.58 21,206 21,183 Skilled Trades
03.0299 Natural Resources Management and Policy, Other 7 211 $20.24 2,643 2,774
Skilled Trades
12.0407 Hair Styling/Stylist and Hair Design 5 273 $15.59 10,807 10,818
Skilled Trades
12.0409 Aesthetician/Esthetician and Skin Care Specialist 5 40 $16.30 1,262 1,276
Skilled Trades
12.0410 Nail Technician/Specialist and Manicurist 1 21 $13.18 898 896
Skilled Trades
12.0503 Culinary Arts/Chef Training 10 1,051 $11.72 26,456 26,534
Skilled Trades
46.0000 Construction Trades, General 40 2,825 $19.68 153,414 140,689
Skilled Trades
46.0302 Electrician 7 918 $22.93 38,507 35,770
Skilled Trades
46.0503 Plumbing Technology/Plumber 3 636 $23.04 33,427 30,830
Skilled Trades
47.0603 Auto body/Collision and Repair Technology/Technician 1 167 $20.98 4,024 4,015
Skilled Trades
47.0604 Automobile/Automotive Mechanics Technology/Technician 8 387 $18.35 15,126 14,988
Skilled 48.0503 Machine Shop Technology/Assistant 4 282 $17.25 9,757 9,665
P a g e | 40
FY2012-13 Colorado Skills for Jobs Report
Page 40
Trades Skilled Trades
48.0508 Welding Technology/Welder 6 179 $18.01 4,988 4,751
Skilled Trades
48.0701 Woodworking, General 14 41 $11.52 1,434 1,321
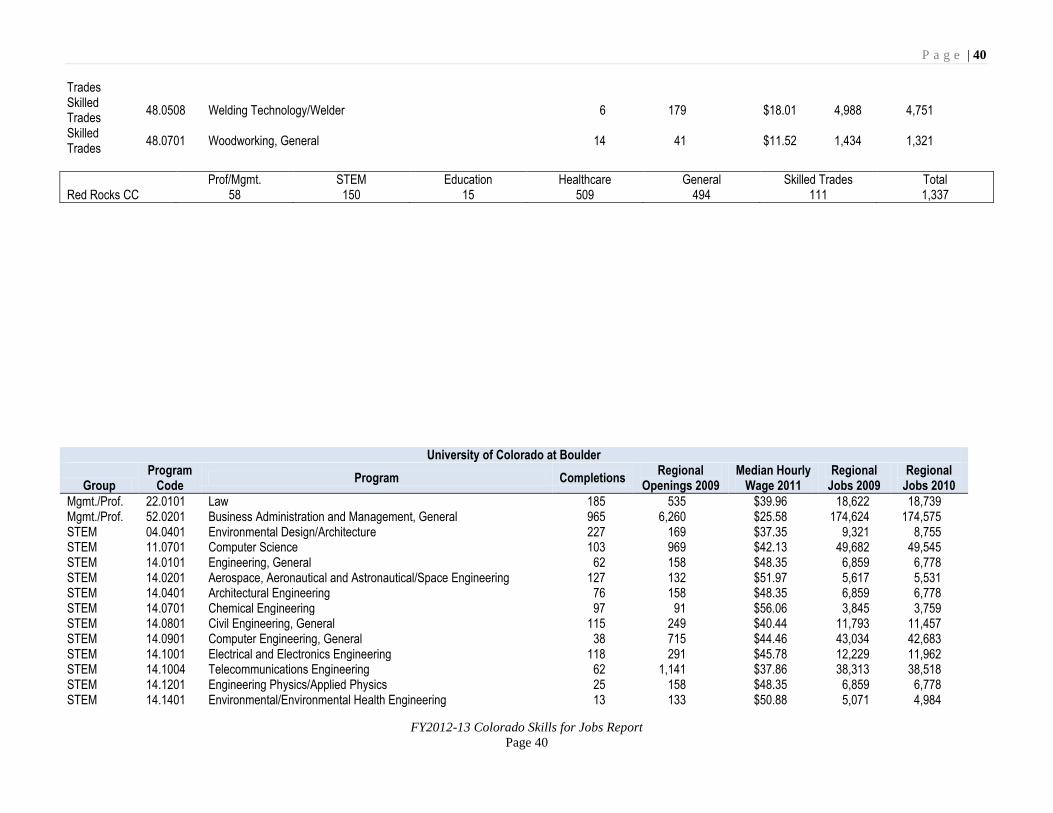
Prof/Mgmt. STEM Education Healthcare General Skilled Trades Total Red Rocks CC 58 150 15 509 494 111 1,337
University of Colorado at Boulder
Group Program
Code Program Completions
Regional Openings 2009
Median Hourly Wage 2011
Regional Jobs 2009
Regional Jobs 2010
Mgmt./Prof. 22.0101 Law 185 535 $39.96 18,622 18,739 Mgmt./Prof. 52.0201 Business Administration and Management, General 965 6,260 $25.58 174,624 174,575 STEM 04.0401 Environmental Design/Architecture 227 169 $37.35 9,321 8,755 STEM 11.0701 Computer Science 103 969 $42.13 49,682 49,545 STEM 14.0101 Engineering, General 62 158 $48.35 6,859 6,778 STEM 14.0201 Aerospace, Aeronautical and Astronautical/Space Engineering 127 132 $51.97 5,617 5,531 STEM 14.0401 Architectural Engineering 76 158 $48.35 6,859 6,778 STEM 14.0701 Chemical Engineering 97 91 $56.06 3,845 3,759 STEM 14.0801 Civil Engineering, General 115 249 $40.44 11,793 11,457 STEM 14.0901 Computer Engineering, General 38 715 $44.46 43,034 42,683 STEM 14.1001 Electrical and Electronics Engineering 118 291 $45.78 12,229 11,962 STEM 14.1004 Telecommunications Engineering 62 1,141 $37.86 38,313 38,518 STEM 14.1201 Engineering Physics/Applied Physics 25 158 $48.35 6,859 6,778 STEM 14.1401 Environmental/Environmental Health Engineering 13 133 $50.88 5,071 4,984
P a g e | 41
FY2012-13 Colorado Skills for Jobs Report
Page 41
STEM 14.1901 Mechanical Engineering 192 329 $39.31 13,764 13,282 STEM 14.4301 Biochemical Engineering 22 1,036 $37.09 33,787 34,075 STEM 26.0202 Biochemistry 105 116 $39.12 2,232 2,280 STEM 26.0406 Cell/Cellular and Molecular Biology 171 78 $30.49 875 923 STEM 26.0901 Physiology, General 299 35 $27.36 861 878 STEM 26.1310 Ecology and Evolutionary Biology 113 996 $34.58 28,185 28,636 STEM 27.0101 Mathematics, General 67 86 $42.72 1,528 1,562 STEM 27.0301 Applied Mathematics, General 68 86 $42.61 1,533 1,568 STEM 40.0201 Astronomy 22 62 $49.88 1,063 1,089 STEM 40.0202 Astrophysics 14 82 $50.29 1,580 1,605 STEM 40.0401 Atmospheric Sciences and Meteorology, General 14 135 $43.83 2,243 2,314 STEM 40.0501 Chemistry, General 32 137 $40.76 2,732 2,749 STEM 40.0508 Chemical Physics 3 137 $40.76 2,732 2,749 STEM 40.0601 Geology/Earth Science, General 41 191 $44.27 3,728 3,785 STEM 40.0603 Geophysics and Seismology 4 169 $44.82 3,217 3,270 STEM 40.0801 Physics, General 66 81 $50.57 1,559 1,585 STEM 42.0101 Psychology, General 554 359 $22.12 9,515 9,595 STEM 42.2806 Educational Psychology 1 38 $21.82 825 839 Education 13.0301 Curriculum and Instruction 64 102 $26.74 2,438 2,483 Education 13.0901 Social and Philosophical Foundations of Education 82 857 $34.10 26,267 26,645 Education 13.1312 Music Teacher Education 18 931 $28.35 30,781 30,828 Healthcare 51.0201 Communication Sciences and Disorders, General 75 157 $28.82 4,194 4,268 Healthcare 51.0202 Audiology/Audiologist 6 17 $24.59 391 399 General 05.0103 Asian Studies/Civilization 9 857 $34.10 26,267 26,645 General 05.0110 Russian Studies 6 857 $34.10 26,267 26,645 continued
University of Colorado at Boulder
Group Program
Code Program Completions
Regional Openings 2009
Median Hourly Wage 2011
Regional Jobs 2009
Regional Jobs 2010
General 05.0110 Russian Studies 6 857 $34.10 26,267 26,645 General 05.0200 Ethnic Studies 22 857 $34.10 26,267 26,645 General 05.0207 Women's Studies 20 857 $34.10 26,267 26,645 General 09.0101 Speech Communication and Rhetoric 261 712 $17.15 19,358 19,560 General 09.0401 Journalism 272 435 $12.52 13,909 13,832 General 16.0102 Linguistics 62 138 $14.70 4,376 4,406 General 16.0104 Comparative Literature 7 857 $34.10 26,267 26,645 General 16.0300 East Asian Languages, Literatures, and Linguistics, General 13 138 $14.70 4,376 4,406 General 16.0301 Chinese Language and Literature 16 138 $14.70 4,376 4,406 General 16.0302 Japanese Language and Literature 29 138 $14.70 4,376 4,406 General 16.0500 Germanic Languages, Literatures, and Linguistics, General 16 138 $14.70 4,376 4,406 General 16.0501 German Language and Literature 10 138 $14.70 4,376 4,406
P a g e | 42
FY2012-13 Colorado Skills for Jobs Report
Page 42
General 16.0901 French Language and Literature 28 138 $14.70 4,376 4,406 General 16.0902 Italian Language and Literature 7 138 $14.70 4,376 4,406 General 16.0905 Spanish Language and Literature 138 138 $14.70 4,376 4,406 General 16.1200 Classics and Classical Languages, Literatures, and Linguistics 24 138 $14.70 4,376 4,406 General 23.0101 English Language and Literature, General 287 857 $34.10 26,267 26,645 General 23.1302 Creative Writing 6 384 $11.89 12,155 12,160 General 24.0103 Humanities/Humanistic Studies 50 0 $0.00 0 0 General 30.1401 Museology/Museum Studies 11 48 $20.52 619 642 General 30.2001 International/Global Studies 229 8 $26.10 73 77 General 30.9999 Multi-/Interdisciplinary Studies, Other 9 0 $0.00 0 0 General 38.0101 Philosophy 107 857 $34.10 26,267 26,645 General 38.0201 Religion/Religious Studies 26 857 $34.10 26,267 26,645 General 45.0201 Anthropology 146 28 $22.58 276 284 General 45.0601 Economics, General 281 236 $24.98 5,933 5,992 General 45.0701 Geography 84 7 $28.77 64 68 General 45.1001 Political Science and Government, General 244 8 $26.10 73 77 General 45.1101 Sociology 258 2 $22.02 45 45 General 50.0301 Dance, General 17 47 $9.33 760 758 General 50.0501 Drama and Dramatics/Theatre Arts, General 41 201 $13.62 5,248 5,260 General 50.0601 Film/Cinema/Video Studies 107 84 $20.18 2,176 2,154 General 50.0702 Fine/Studio Arts, General 126 98 $9.07 2,601 2,635 General 50.0703 Art History, Criticism and Conservation 61 48 $20.52 619 642 General 50.0901 Music, General 15 326 $8.43 9,546 9,664 General 50.0902 Music History, Literature, and Theory 4 857 $34.10 26,267 26,645 General 50.0903 Music Performance, General 92 402 $8.24 12,014 12,156 General 54.0101 History, General 190 3 $29.71 52 53 Skilled Trades
03.0103 Environmental Studies 161 164 $28.42 3,233 3,282
Prof/Mgmt. STEM Education Healthcare General Skilled Trades Total CU Boulder 1,150 2,851 164 81 3,331 161 7,738
University of Colorado at Denver
Group Program
Code Program Completions
Regional Openings 2009
Median Hourly Wage 2011
Regional Jobs 2009
Regional Jobs 2010
Mgmt./Prof. 52.0201 Business Administration and Management, General 689 6,260 $25.58 174,624 174,575 Mgmt./Prof. 52.0301 Accounting 46 1,006 $24.66 42,647 42,774 Mgmt./Prof. 52.0801 Finance, General 55 3,925 $19.38 67,994 70,924 Mgmt./Prof. 52.1003 Organizational Behavior Studies 20 299 $26.13 7,869 7,953 Mgmt./Prof. 52.1101 International Business/Trade/Commerce 18 1,708 $39.06 52,861 52,126
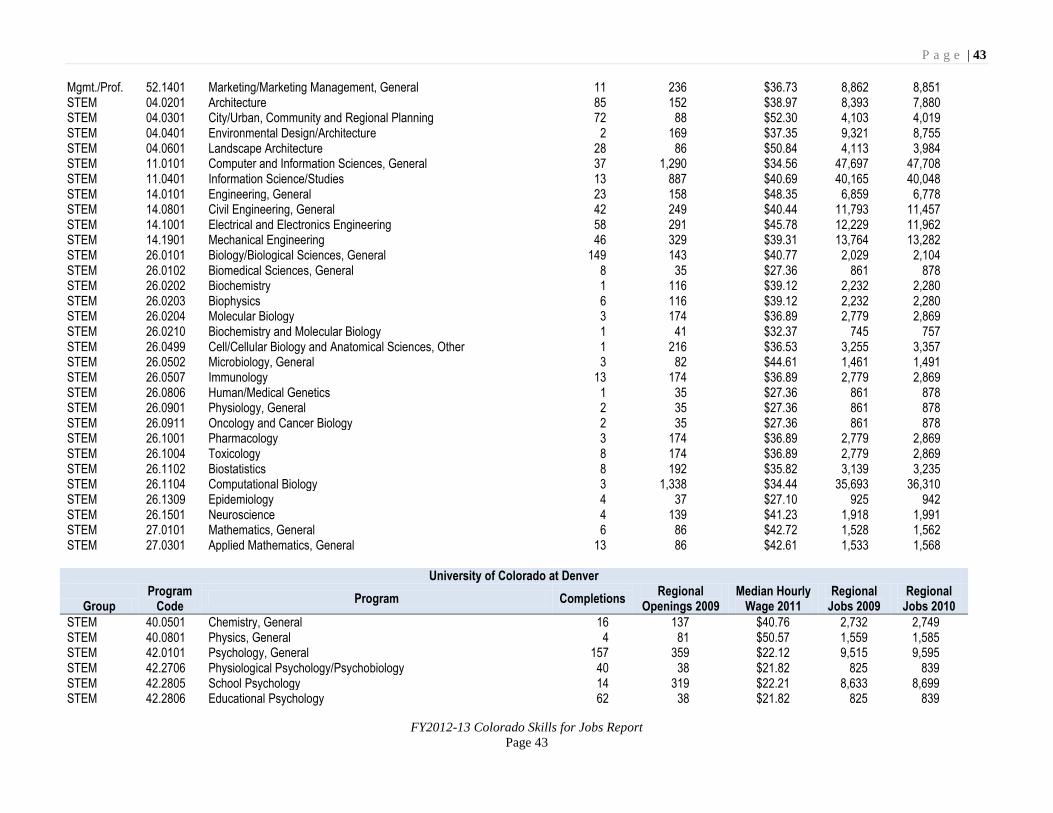
P a g e | 43
FY2012-13 Colorado Skills for Jobs Report
Page 43
Mgmt./Prof. 52.1401 Marketing/Marketing Management, General 11 236 $36.73 8,862 8,851 STEM 04.0201 Architecture 85 152 $38.97 8,393 7,880 STEM 04.0301 City/Urban, Community and Regional Planning 72 88 $52.30 4,103 4,019 STEM 04.0401 Environmental Design/Architecture 2 169 $37.35 9,321 8,755 STEM 04.0601 Landscape Architecture 28 86 $50.84 4,113 3,984 STEM 11.0101 Computer and Information Sciences, General 37 1,290 $34.56 47,697 47,708 STEM 11.0401 Information Science/Studies 13 887 $40.69 40,165 40,048 STEM 14.0101 Engineering, General 23 158 $48.35 6,859 6,778 STEM 14.0801 Civil Engineering, General 42 249 $40.44 11,793 11,457 STEM 14.1001 Electrical and Electronics Engineering 58 291 $45.78 12,229 11,962 STEM 14.1901 Mechanical Engineering 46 329 $39.31 13,764 13,282 STEM 26.0101 Biology/Biological Sciences, General 149 143 $40.77 2,029 2,104 STEM 26.0102 Biomedical Sciences, General 8 35 $27.36 861 878 STEM 26.0202 Biochemistry 1 116 $39.12 2,232 2,280 STEM 26.0203 Biophysics 6 116 $39.12 2,232 2,280 STEM 26.0204 Molecular Biology 3 174 $36.89 2,779 2,869 STEM 26.0210 Biochemistry and Molecular Biology 1 41 $32.37 745 757 STEM 26.0499 Cell/Cellular Biology and Anatomical Sciences, Other 1 216 $36.53 3,255 3,357 STEM 26.0502 Microbiology, General 3 82 $44.61 1,461 1,491 STEM 26.0507 Immunology 13 174 $36.89 2,779 2,869 STEM 26.0806 Human/Medical Genetics 1 35 $27.36 861 878 STEM 26.0901 Physiology, General 2 35 $27.36 861 878 STEM 26.0911 Oncology and Cancer Biology 2 35 $27.36 861 878 STEM 26.1001 Pharmacology 3 174 $36.89 2,779 2,869 STEM 26.1004 Toxicology 8 174 $36.89 2,779 2,869 STEM 26.1102 Biostatistics 8 192 $35.82 3,139 3,235 STEM 26.1104 Computational Biology 3 1,338 $34.44 35,693 36,310 STEM 26.1309 Epidemiology 4 37 $27.10 925 942 STEM 26.1501 Neuroscience 4 139 $41.23 1,918 1,991 STEM 27.0101 Mathematics, General 6 86 $42.72 1,528 1,562 STEM 27.0301 Applied Mathematics, General 13 86 $42.61 1,533 1,568
University of Colorado at Denver
Group Program
Code Program Completions
Regional Openings 2009
Median Hourly Wage 2011
Regional Jobs 2009
Regional Jobs 2010
STEM 40.0501 Chemistry, General 16 137 $40.76 2,732 2,749 STEM 40.0801 Physics, General 4 81 $50.57 1,559 1,585 STEM 42.0101 Psychology, General 157 359 $22.12 9,515 9,595 STEM 42.2706 Physiological Psychology/Psychobiology 40 38 $21.82 825 839 STEM 42.2805 School Psychology 14 319 $22.21 8,633 8,699 STEM 42.2806 Educational Psychology 62 38 $21.82 825 839
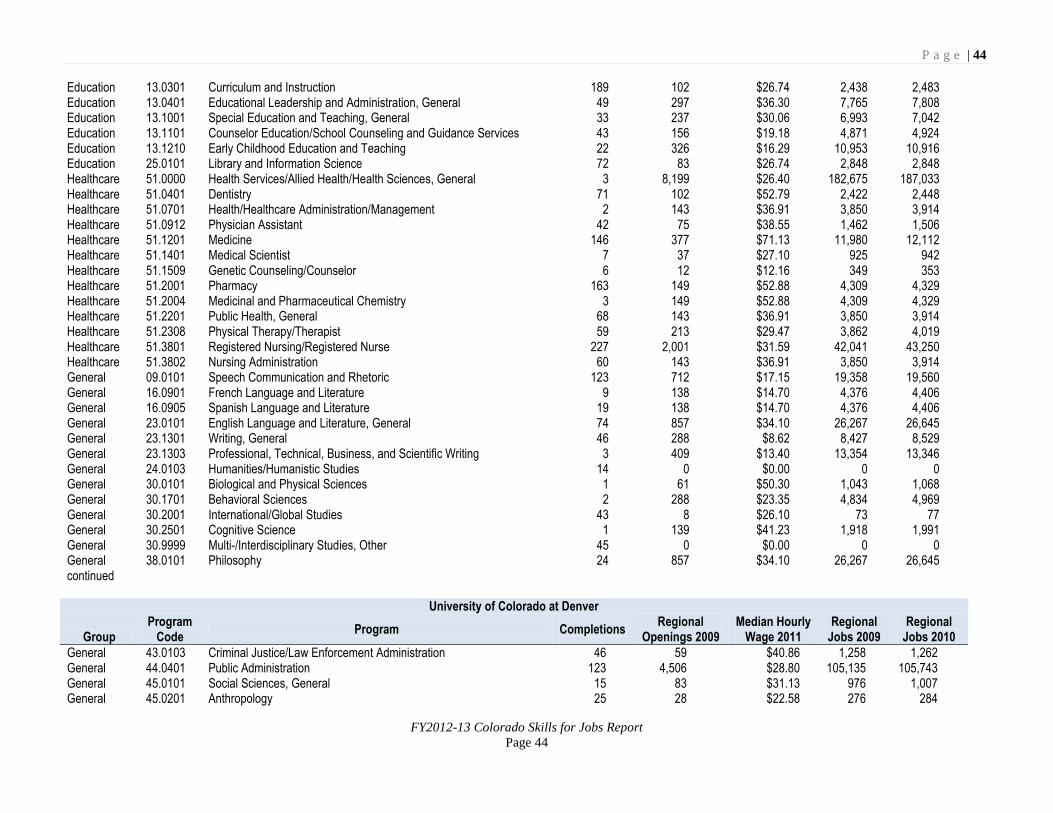
P a g e | 44
FY2012-13 Colorado Skills for Jobs Report
Page 44
Education 13.0301 Curriculum and Instruction 189 102 $26.74 2,438 2,483 Education 13.0401 Educational Leadership and Administration, General 49 297 $36.30 7,765 7,808 Education 13.1001 Special Education and Teaching, General 33 237 $30.06 6,993 7,042 Education 13.1101 Counselor Education/School Counseling and Guidance Services 43 156 $19.18 4,871 4,924 Education 13.1210 Early Childhood Education and Teaching 22 326 $16.29 10,953 10,916 Education 25.0101 Library and Information Science 72 83 $26.74 2,848 2,848 Healthcare 51.0000 Health Services/Allied Health/Health Sciences, General 3 8,199 $26.40 182,675 187,033 Healthcare 51.0401 Dentistry 71 102 $52.79 2,422 2,448 Healthcare 51.0701 Health/Healthcare Administration/Management 2 143 $36.91 3,850 3,914 Healthcare 51.0912 Physician Assistant 42 75 $38.55 1,462 1,506 Healthcare 51.1201 Medicine 146 377 $71.13 11,980 12,112 Healthcare 51.1401 Medical Scientist 7 37 $27.10 925 942 Healthcare 51.1509 Genetic Counseling/Counselor 6 12 $12.16 349 353 Healthcare 51.2001 Pharmacy 163 149 $52.88 4,309 4,329 Healthcare 51.2004 Medicinal and Pharmaceutical Chemistry 3 149 $52.88 4,309 4,329 Healthcare 51.2201 Public Health, General 68 143 $36.91 3,850 3,914 Healthcare 51.2308 Physical Therapy/Therapist 59 213 $29.47 3,862 4,019 Healthcare 51.3801 Registered Nursing/Registered Nurse 227 2,001 $31.59 42,041 43,250 Healthcare 51.3802 Nursing Administration 60 143 $36.91 3,850 3,914 General 09.0101 Speech Communication and Rhetoric 123 712 $17.15 19,358 19,560 General 16.0901 French Language and Literature 9 138 $14.70 4,376 4,406 General 16.0905 Spanish Language and Literature 19 138 $14.70 4,376 4,406 General 23.0101 English Language and Literature, General 74 857 $34.10 26,267 26,645 General 23.1301 Writing, General 46 288 $8.62 8,427 8,529 General 23.1303 Professional, Technical, Business, and Scientific Writing 3 409 $13.40 13,354 13,346 General 24.0103 Humanities/Humanistic Studies 14 0 $0.00 0 0 General 30.0101 Biological and Physical Sciences 1 61 $50.30 1,043 1,068 General 30.1701 Behavioral Sciences 2 288 $23.35 4,834 4,969 General 30.2001 International/Global Studies 43 8 $26.10 73 77 General 30.2501 Cognitive Science 1 139 $41.23 1,918 1,991 General 30.9999 Multi-/Interdisciplinary Studies, Other 45 0 $0.00 0 0 General 38.0101 Philosophy 24 857 $34.10 26,267 26,645 continued
University of Colorado at Denver
Group Program
Code Program Completions
Regional Openings 2009
Median Hourly Wage 2011
Regional Jobs 2009
Regional Jobs 2010
General 43.0103 Criminal Justice/Law Enforcement Administration 46 59 $40.86 1,258 1,262 General 44.0401 Public Administration 123 4,506 $28.80 105,135 105,743 General 45.0101 Social Sciences, General 15 83 $31.13 976 1,007 General 45.0201 Anthropology 25 28 $22.58 276 284
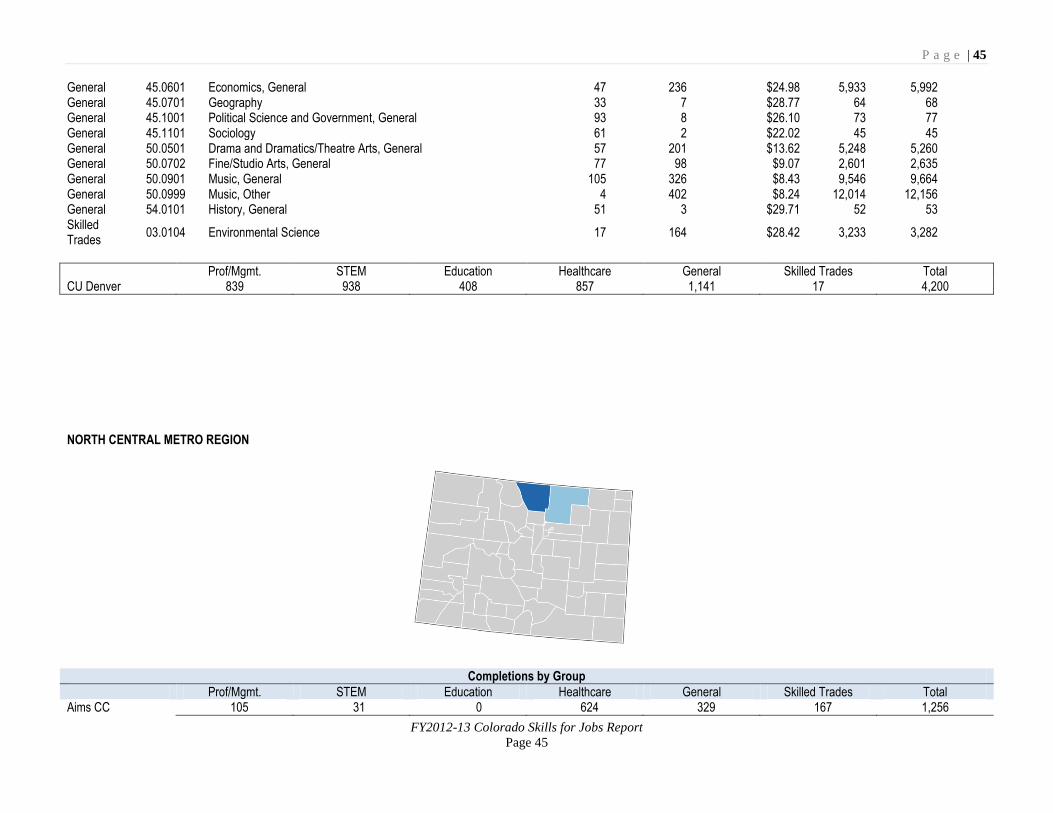
P a g e | 45
FY2012-13 Colorado Skills for Jobs Report
Page 45
General 45.0601 Economics, General 47 236 $24.98 5,933 5,992 General 45.0701 Geography 33 7 $28.77 64 68 General 45.1001 Political Science and Government, General 93 8 $26.10 73 77 General 45.1101 Sociology 61 2 $22.02 45 45 General 50.0501 Drama and Dramatics/Theatre Arts, General 57 201 $13.62 5,248 5,260 General 50.0702 Fine/Studio Arts, General 77 98 $9.07 2,601 2,635 General 50.0901 Music, General 105 326 $8.43 9,546 9,664 General 50.0999 Music, Other 4 402 $8.24 12,014 12,156 General 54.0101 History, General 51 3 $29.71 52 53 Skilled Trades
03.0104 Environmental Science 17 164 $28.42 3,233 3,282
Prof/Mgmt. STEM Education Healthcare General Skilled Trades Total CU Denver 839 938 408 857 1,141 17 4,200
NORTH CENTRAL METRO REGION
Completions by Group
Prof/Mgmt. STEM Education Healthcare General Skilled Trades Total Aims CC 105 31 0 624 329 167 1,256
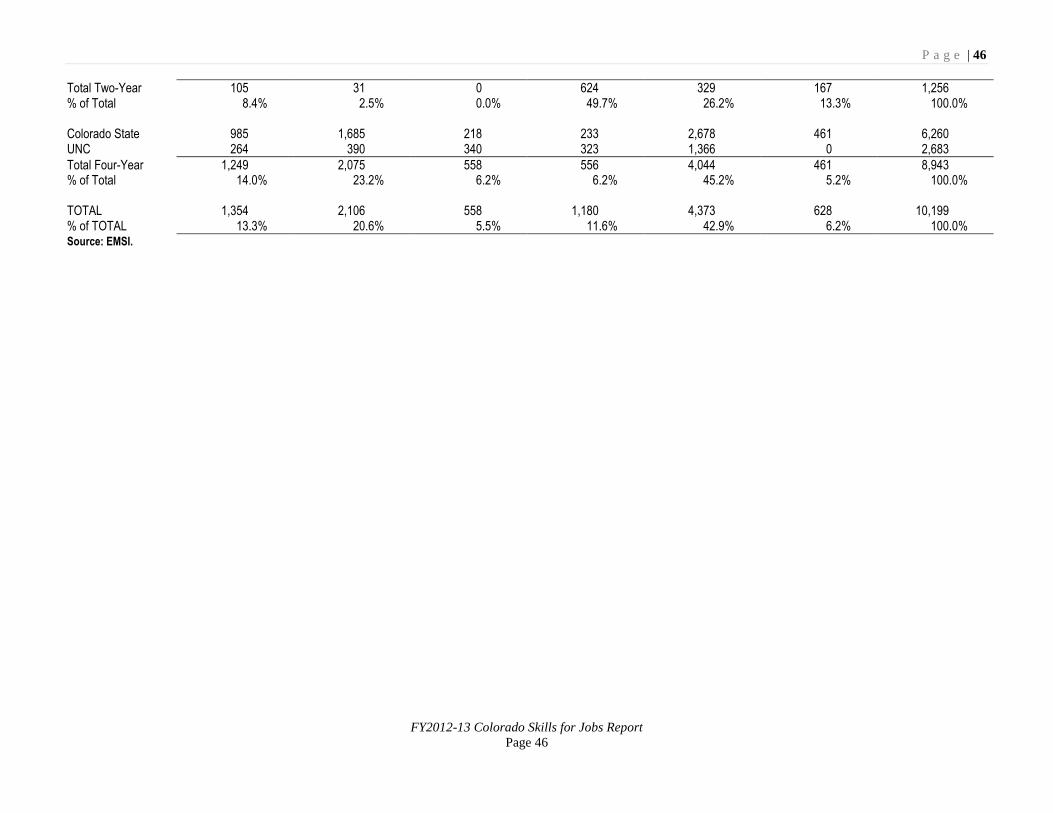
P a g e | 46
FY2012-13 Colorado Skills for Jobs Report
Page 46
Total Two-Year 105 31 0 624 329 167 1,256 % of Total 8.4% 2.5% 0.0% 49.7% 26.2% 13.3% 100.0% Colorado State 985 1,685 218 233 2,678 461 6,260 UNC 264 390 340 323 1,366 0 2,683
Total Four-Year 1,249 2,075 558 556 4,044 461 8,943 % of Total 14.0% 23.2% 6.2% 6.2% 45.2% 5.2% 100.0% TOTAL 1,354 2,106 558 1,180 4,373 628 10,199 % of TOTAL 13.3% 20.6% 5.5% 11.6% 42.9% 6.2% 100.0% Source: EMSI.
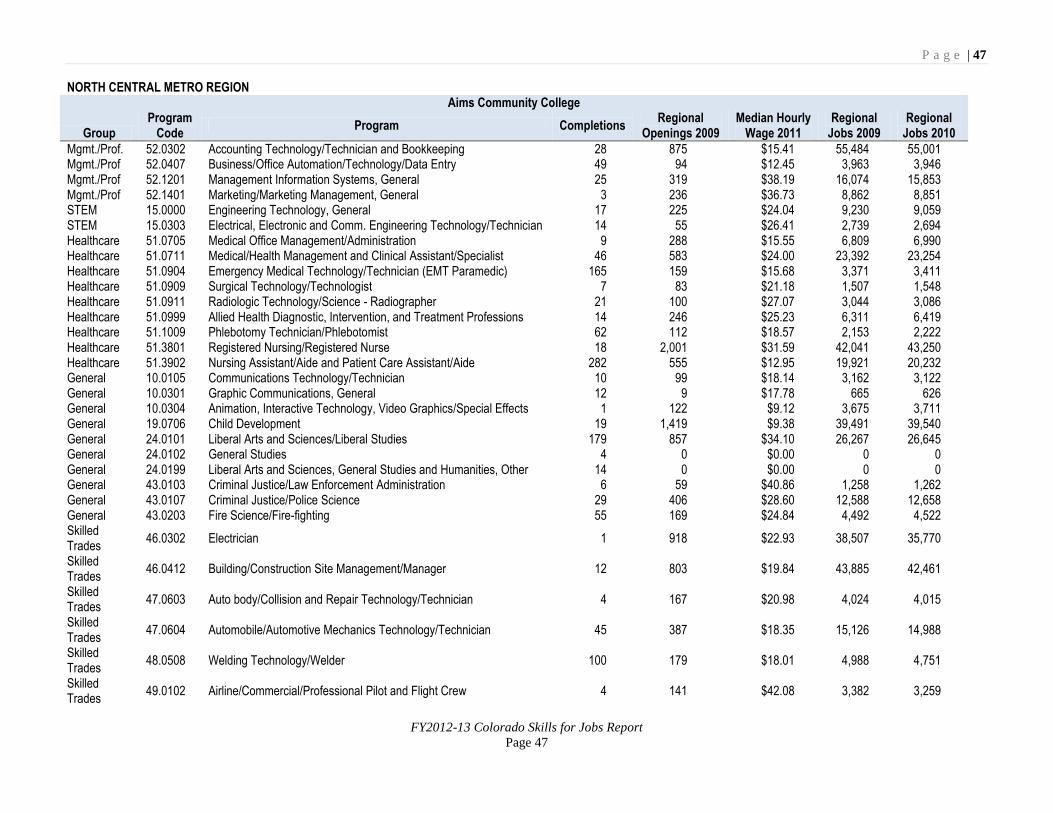
P a g e | 47
FY2012-13 Colorado Skills for Jobs Report
Page 47
NORTH CENTRAL METRO REGION Aims Community College
Group Program
Code Program Completions
Regional Openings 2009
Median Hourly Wage 2011
Regional Jobs 2009
Regional Jobs 2010
Mgmt./Prof. 52.0302 Accounting Technology/Technician and Bookkeeping 28 875 $15.41 55,484 55,001 Mgmt./Prof 52.0407 Business/Office Automation/Technology/Data Entry 49 94 $12.45 3,963 3,946 Mgmt./Prof 52.1201 Management Information Systems, General 25 319 $38.19 16,074 15,853 Mgmt./Prof 52.1401 Marketing/Marketing Management, General 3 236 $36.73 8,862 8,851 STEM 15.0000 Engineering Technology, General 17 225 $24.04 9,230 9,059 STEM 15.0303 Electrical, Electronic and Comm. Engineering Technology/Technician 14 55 $26.41 2,739 2,694 Healthcare 51.0705 Medical Office Management/Administration 9 288 $15.55 6,809 6,990 Healthcare 51.0711 Medical/Health Management and Clinical Assistant/Specialist 46 583 $24.00 23,392 23,254 Healthcare 51.0904 Emergency Medical Technology/Technician (EMT Paramedic) 165 159 $15.68 3,371 3,411 Healthcare 51.0909 Surgical Technology/Technologist 7 83 $21.18 1,507 1,548 Healthcare 51.0911 Radiologic Technology/Science - Radiographer 21 100 $27.07 3,044 3,086 Healthcare 51.0999 Allied Health Diagnostic, Intervention, and Treatment Professions 14 246 $25.23 6,311 6,419 Healthcare 51.1009 Phlebotomy Technician/Phlebotomist 62 112 $18.57 2,153 2,222 Healthcare 51.3801 Registered Nursing/Registered Nurse 18 2,001 $31.59 42,041 43,250 Healthcare 51.3902 Nursing Assistant/Aide and Patient Care Assistant/Aide 282 555 $12.95 19,921 20,232 General 10.0105 Communications Technology/Technician 10 99 $18.14 3,162 3,122 General 10.0301 Graphic Communications, General 12 9 $17.78 665 626 General 10.0304 Animation, Interactive Technology, Video Graphics/Special Effects 1 122 $9.12 3,675 3,711 General 19.0706 Child Development 19 1,419 $9.38 39,491 39,540 General 24.0101 Liberal Arts and Sciences/Liberal Studies 179 857 $34.10 26,267 26,645 General 24.0102 General Studies 4 0 $0.00 0 0 General 24.0199 Liberal Arts and Sciences, General Studies and Humanities, Other 14 0 $0.00 0 0 General 43.0103 Criminal Justice/Law Enforcement Administration 6 59 $40.86 1,258 1,262 General 43.0107 Criminal Justice/Police Science 29 406 $28.60 12,588 12,658 General 43.0203 Fire Science/Fire-fighting 55 169 $24.84 4,492 4,522 Skilled Trades
46.0302 Electrician 1 918 $22.93 38,507 35,770
Skilled Trades
46.0412 Building/Construction Site Management/Manager 12 803 $19.84 43,885 42,461
Skilled Trades
47.0603 Auto body/Collision and Repair Technology/Technician 4 167 $20.98 4,024 4,015
Skilled Trades
47.0604 Automobile/Automotive Mechanics Technology/Technician 45 387 $18.35 15,126 14,988
Skilled Trades
48.0508 Welding Technology/Welder 100 179 $18.01 4,988 4,751
Skilled Trades
49.0102 Airline/Commercial/Professional Pilot and Flight Crew 4 141 $42.08 3,382 3,259
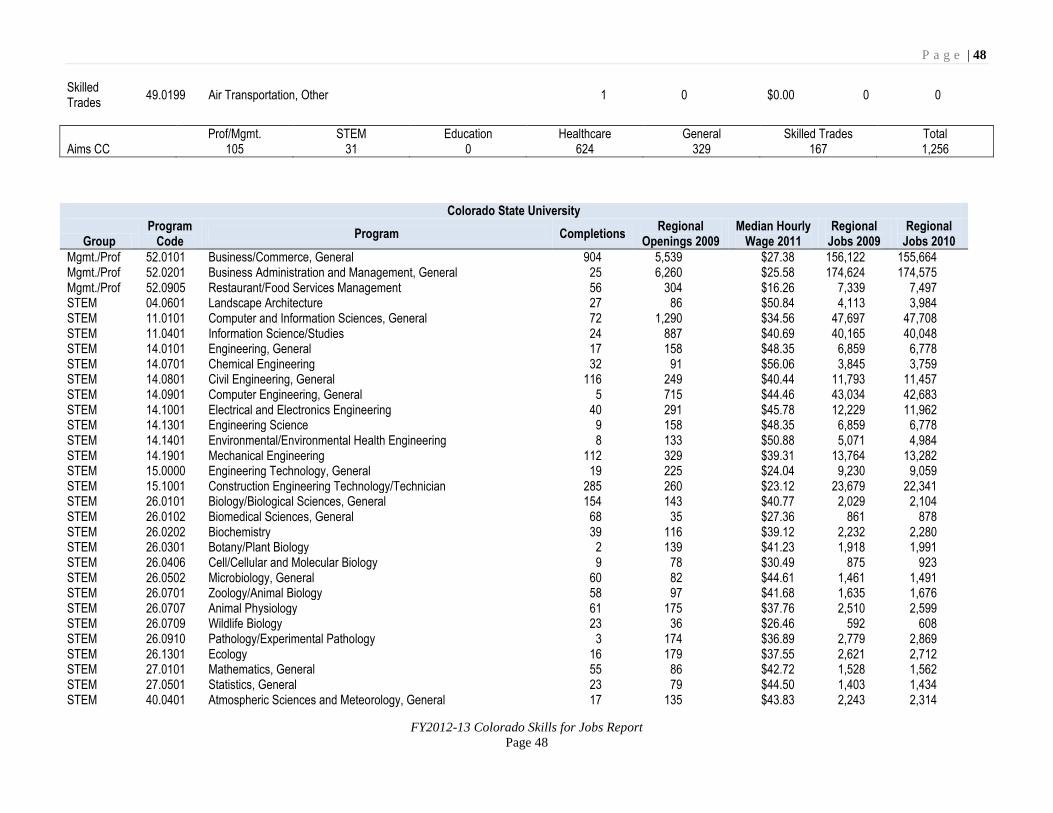
P a g e | 48
FY2012-13 Colorado Skills for Jobs Report
Page 48
Skilled Trades
49.0199 Air Transportation, Other 1 0 $0.00 0 0
Prof/Mgmt. STEM Education Healthcare General Skilled Trades Total Aims CC 105 31 0 624 329 167 1,256
Colorado State University
Group Program
Code Program Completions
Regional Openings 2009
Median Hourly Wage 2011
Regional Jobs 2009
Regional Jobs 2010
Mgmt./Prof 52.0101 Business/Commerce, General 904 5,539 $27.38 156,122 155,664 Mgmt./Prof 52.0201 Business Administration and Management, General 25 6,260 $25.58 174,624 174,575 Mgmt./Prof 52.0905 Restaurant/Food Services Management 56 304 $16.26 7,339 7,497 STEM 04.0601 Landscape Architecture 27 86 $50.84 4,113 3,984 STEM 11.0101 Computer and Information Sciences, General 72 1,290 $34.56 47,697 47,708 STEM 11.0401 Information Science/Studies 24 887 $40.69 40,165 40,048 STEM 14.0101 Engineering, General 17 158 $48.35 6,859 6,778 STEM 14.0701 Chemical Engineering 32 91 $56.06 3,845 3,759 STEM 14.0801 Civil Engineering, General 116 249 $40.44 11,793 11,457 STEM 14.0901 Computer Engineering, General 5 715 $44.46 43,034 42,683 STEM 14.1001 Electrical and Electronics Engineering 40 291 $45.78 12,229 11,962 STEM 14.1301 Engineering Science 9 158 $48.35 6,859 6,778 STEM 14.1401 Environmental/Environmental Health Engineering 8 133 $50.88 5,071 4,984 STEM 14.1901 Mechanical Engineering 112 329 $39.31 13,764 13,282 STEM 15.0000 Engineering Technology, General 19 225 $24.04 9,230 9,059 STEM 15.1001 Construction Engineering Technology/Technician 285 260 $23.12 23,679 22,341 STEM 26.0101 Biology/Biological Sciences, General 154 143 $40.77 2,029 2,104 STEM 26.0102 Biomedical Sciences, General 68 35 $27.36 861 878 STEM 26.0202 Biochemistry 39 116 $39.12 2,232 2,280 STEM 26.0301 Botany/Plant Biology 2 139 $41.23 1,918 1,991 STEM 26.0406 Cell/Cellular and Molecular Biology 9 78 $30.49 875 923 STEM 26.0502 Microbiology, General 60 82 $44.61 1,461 1,491 STEM 26.0701 Zoology/Animal Biology 58 97 $41.68 1,635 1,676 STEM 26.0707 Animal Physiology 61 175 $37.76 2,510 2,599 STEM 26.0709 Wildlife Biology 23 36 $26.46 592 608 STEM 26.0910 Pathology/Experimental Pathology 3 174 $36.89 2,779 2,869 STEM 26.1301 Ecology 16 179 $37.55 2,621 2,712 STEM 27.0101 Mathematics, General 55 86 $42.72 1,528 1,562 STEM 27.0501 Statistics, General 23 79 $44.50 1,403 1,434 STEM 40.0401 Atmospheric Sciences and Meteorology, General 17 135 $43.83 2,243 2,314
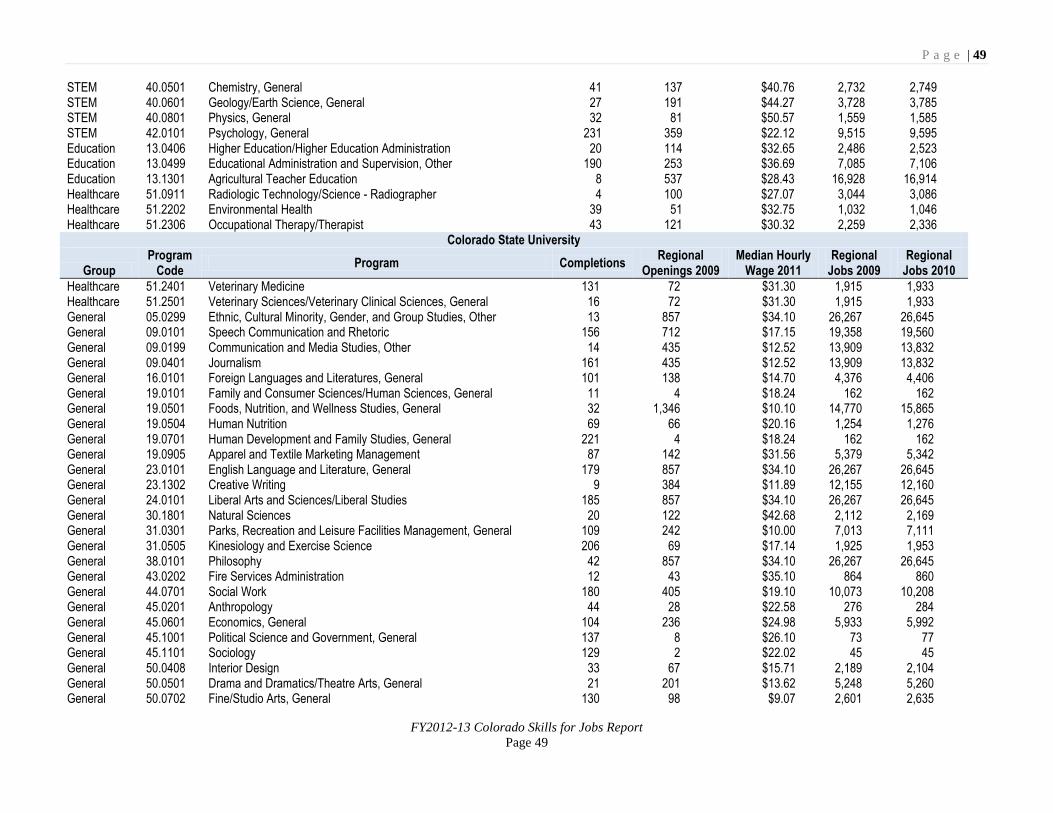
P a g e | 49
FY2012-13 Colorado Skills for Jobs Report
Page 49
STEM 40.0501 Chemistry, General 41 137 $40.76 2,732 2,749 STEM 40.0601 Geology/Earth Science, General 27 191 $44.27 3,728 3,785 STEM 40.0801 Physics, General 32 81 $50.57 1,559 1,585 STEM 42.0101 Psychology, General 231 359 $22.12 9,515 9,595 Education 13.0406 Higher Education/Higher Education Administration 20 114 $32.65 2,486 2,523 Education 13.0499 Educational Administration and Supervision, Other 190 253 $36.69 7,085 7,106 Education 13.1301 Agricultural Teacher Education 8 537 $28.43 16,928 16,914 Healthcare 51.0911 Radiologic Technology/Science - Radiographer 4 100 $27.07 3,044 3,086 Healthcare 51.2202 Environmental Health 39 51 $32.75 1,032 1,046 Healthcare 51.2306 Occupational Therapy/Therapist 43 121 $30.32 2,259 2,336
Colorado State University
Group Program
Code Program Completions
Regional Openings 2009
Median Hourly Wage 2011
Regional Jobs 2009
Regional Jobs 2010
Healthcare 51.2401 Veterinary Medicine 131 72 $31.30 1,915 1,933 Healthcare 51.2501 Veterinary Sciences/Veterinary Clinical Sciences, General 16 72 $31.30 1,915 1,933 General 05.0299 Ethnic, Cultural Minority, Gender, and Group Studies, Other 13 857 $34.10 26,267 26,645 General 09.0101 Speech Communication and Rhetoric 156 712 $17.15 19,358 19,560 General 09.0199 Communication and Media Studies, Other 14 435 $12.52 13,909 13,832 General 09.0401 Journalism 161 435 $12.52 13,909 13,832 General 16.0101 Foreign Languages and Literatures, General 101 138 $14.70 4,376 4,406 General 19.0101 Family and Consumer Sciences/Human Sciences, General 11 4 $18.24 162 162 General 19.0501 Foods, Nutrition, and Wellness Studies, General 32 1,346 $10.10 14,770 15,865 General 19.0504 Human Nutrition 69 66 $20.16 1,254 1,276 General 19.0701 Human Development and Family Studies, General 221 4 $18.24 162 162 General 19.0905 Apparel and Textile Marketing Management 87 142 $31.56 5,379 5,342 General 23.0101 English Language and Literature, General 179 857 $34.10 26,267 26,645 General 23.1302 Creative Writing 9 384 $11.89 12,155 12,160 General 24.0101 Liberal Arts and Sciences/Liberal Studies 185 857 $34.10 26,267 26,645 General 30.1801 Natural Sciences 20 122 $42.68 2,112 2,169 General 31.0301 Parks, Recreation and Leisure Facilities Management, General 109 242 $10.00 7,013 7,111 General 31.0505 Kinesiology and Exercise Science 206 69 $17.14 1,925 1,953 General 38.0101 Philosophy 42 857 $34.10 26,267 26,645 General 43.0202 Fire Services Administration 12 43 $35.10 864 860 General 44.0701 Social Work 180 405 $19.10 10,073 10,208 General 45.0201 Anthropology 44 28 $22.58 276 284 General 45.0601 Economics, General 104 236 $24.98 5,933 5,992 General 45.1001 Political Science and Government, General 137 8 $26.10 73 77 General 45.1101 Sociology 129 2 $22.02 45 45 General 50.0408 Interior Design 33 67 $15.71 2,189 2,104 General 50.0501 Drama and Dramatics/Theatre Arts, General 21 201 $13.62 5,248 5,260 General 50.0702 Fine/Studio Arts, General 130 98 $9.07 2,601 2,635
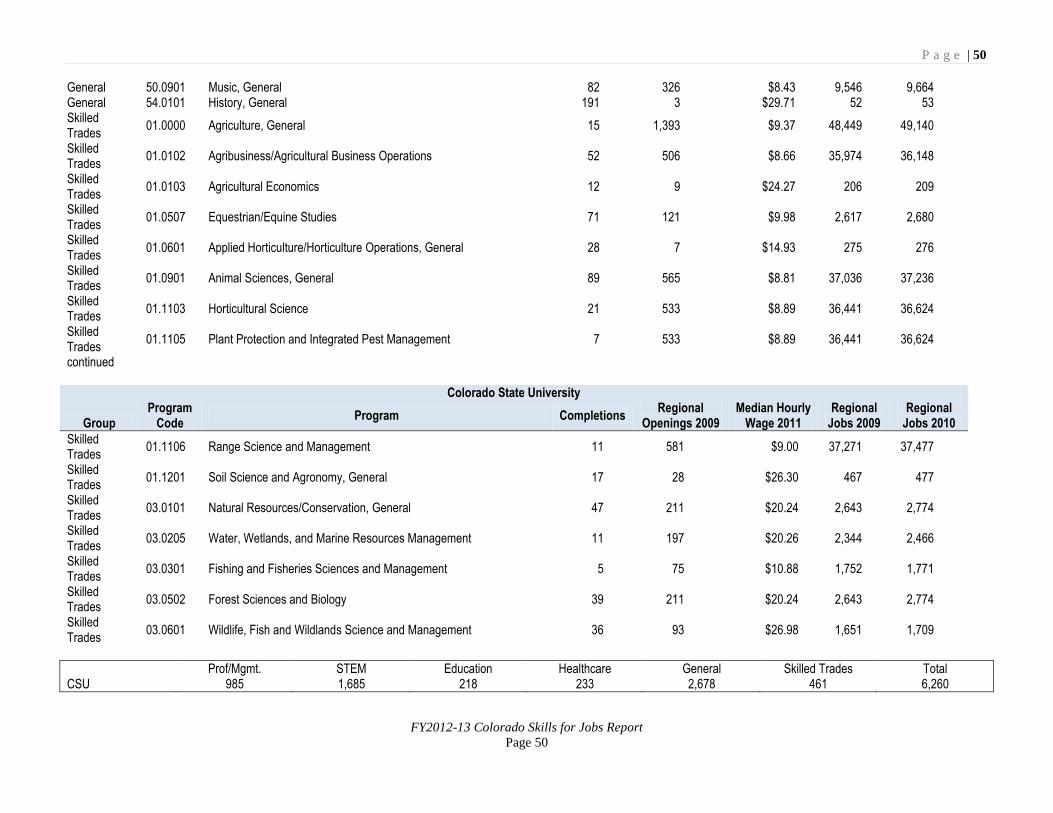
P a g e | 50
FY2012-13 Colorado Skills for Jobs Report
Page 50
General 50.0901 Music, General 82 326 $8.43 9,546 9,664 General 54.0101 History, General 191 3 $29.71 52 53 Skilled Trades
01.0000 Agriculture, General 15 1,393 $9.37 48,449 49,140
Skilled Trades
01.0102 Agribusiness/Agricultural Business Operations 52 506 $8.66 35,974 36,148
Skilled Trades
01.0103 Agricultural Economics 12 9 $24.27 206 209
Skilled Trades
01.0507 Equestrian/Equine Studies 71 121 $9.98 2,617 2,680
Skilled Trades
01.0601 Applied Horticulture/Horticulture Operations, General 28 7 $14.93 275 276
Skilled Trades
01.0901 Animal Sciences, General 89 565 $8.81 37,036 37,236
Skilled Trades
01.1103 Horticultural Science 21 533 $8.89 36,441 36,624
Skilled Trades
01.1105 Plant Protection and Integrated Pest Management 7 533 $8.89 36,441 36,624
continued
Colorado State University
Group Program
Code Program Completions
Regional Openings 2009
Median Hourly Wage 2011
Regional Jobs 2009
Regional Jobs 2010
Skilled Trades
01.1106 Range Science and Management 11 581 $9.00 37,271 37,477
Skilled Trades
01.1201 Soil Science and Agronomy, General 17 28 $26.30 467 477
Skilled Trades
03.0101 Natural Resources/Conservation, General 47 211 $20.24 2,643 2,774
Skilled Trades
03.0205 Water, Wetlands, and Marine Resources Management 11 197 $20.26 2,344 2,466
Skilled Trades
03.0301 Fishing and Fisheries Sciences and Management 5 75 $10.88 1,752 1,771
Skilled Trades
03.0502 Forest Sciences and Biology 39 211 $20.24 2,643 2,774
Skilled Trades
03.0601 Wildlife, Fish and Wildlands Science and Management 36 93 $26.98 1,651 1,709
Prof/Mgmt. STEM Education Healthcare General Skilled Trades Total CSU 985 1,685 218 233 2,678 461 6,260
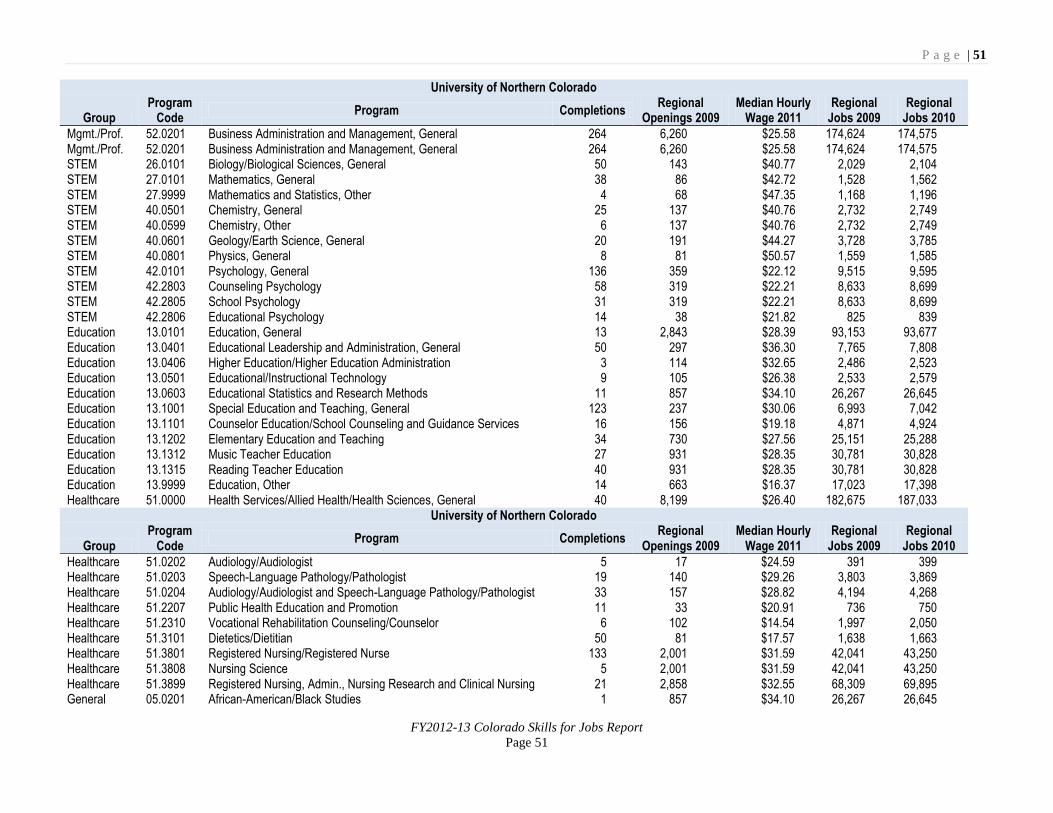
P a g e | 51
FY2012-13 Colorado Skills for Jobs Report
Page 51
University of Northern Colorado
Group Program
Code Program Completions
Regional Openings 2009
Median Hourly Wage 2011
Regional Jobs 2009
Regional Jobs 2010
Mgmt./Prof. 52.0201 Business Administration and Management, General 264 6,260 $25.58 174,624 174,575 Mgmt./Prof. 52.0201 Business Administration and Management, General 264 6,260 $25.58 174,624 174,575 STEM 26.0101 Biology/Biological Sciences, General 50 143 $40.77 2,029 2,104 STEM 27.0101 Mathematics, General 38 86 $42.72 1,528 1,562 STEM 27.9999 Mathematics and Statistics, Other 4 68 $47.35 1,168 1,196 STEM 40.0501 Chemistry, General 25 137 $40.76 2,732 2,749 STEM 40.0599 Chemistry, Other 6 137 $40.76 2,732 2,749 STEM 40.0601 Geology/Earth Science, General 20 191 $44.27 3,728 3,785 STEM 40.0801 Physics, General 8 81 $50.57 1,559 1,585 STEM 42.0101 Psychology, General 136 359 $22.12 9,515 9,595 STEM 42.2803 Counseling Psychology 58 319 $22.21 8,633 8,699 STEM 42.2805 School Psychology 31 319 $22.21 8,633 8,699 STEM 42.2806 Educational Psychology 14 38 $21.82 825 839 Education 13.0101 Education, General 13 2,843 $28.39 93,153 93,677 Education 13.0401 Educational Leadership and Administration, General 50 297 $36.30 7,765 7,808 Education 13.0406 Higher Education/Higher Education Administration 3 114 $32.65 2,486 2,523 Education 13.0501 Educational/Instructional Technology 9 105 $26.38 2,533 2,579 Education 13.0603 Educational Statistics and Research Methods 11 857 $34.10 26,267 26,645 Education 13.1001 Special Education and Teaching, General 123 237 $30.06 6,993 7,042 Education 13.1101 Counselor Education/School Counseling and Guidance Services 16 156 $19.18 4,871 4,924 Education 13.1202 Elementary Education and Teaching 34 730 $27.56 25,151 25,288 Education 13.1312 Music Teacher Education 27 931 $28.35 30,781 30,828 Education 13.1315 Reading Teacher Education 40 931 $28.35 30,781 30,828 Education 13.9999 Education, Other 14 663 $16.37 17,023 17,398 Healthcare 51.0000 Health Services/Allied Health/Health Sciences, General 40 8,199 $26.40 182,675 187,033
University of Northern Colorado
Group Program
Code Program Completions
Regional Openings 2009
Median Hourly Wage 2011
Regional Jobs 2009
Regional Jobs 2010
Healthcare 51.0202 Audiology/Audiologist 5 17 $24.59 391 399 Healthcare 51.0203 Speech-Language Pathology/Pathologist 19 140 $29.26 3,803 3,869 Healthcare 51.0204 Audiology/Audiologist and Speech-Language Pathology/Pathologist 33 157 $28.82 4,194 4,268 Healthcare 51.2207 Public Health Education and Promotion 11 33 $20.91 736 750 Healthcare 51.2310 Vocational Rehabilitation Counseling/Counselor 6 102 $14.54 1,997 2,050 Healthcare 51.3101 Dietetics/Dietitian 50 81 $17.57 1,638 1,663 Healthcare 51.3801 Registered Nursing/Registered Nurse 133 2,001 $31.59 42,041 43,250 Healthcare 51.3808 Nursing Science 5 2,001 $31.59 42,041 43,250 Healthcare 51.3899 Registered Nursing, Admin., Nursing Research and Clinical Nursing 21 2,858 $32.55 68,309 69,895 General 05.0201 African-American/Black Studies 1 857 $34.10 26,267 26,645
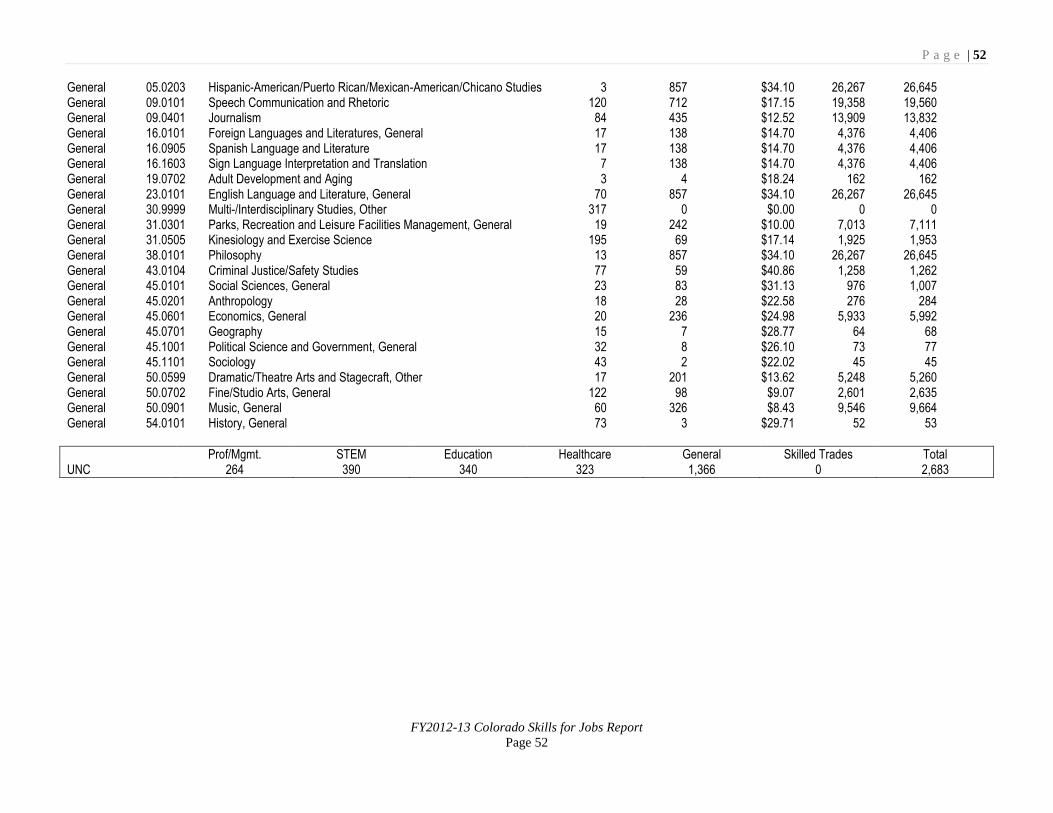
P a g e | 52
FY2012-13 Colorado Skills for Jobs Report
Page 52
General 05.0203 Hispanic-American/Puerto Rican/Mexican-American/Chicano Studies 3 857 $34.10 26,267 26,645 General 09.0101 Speech Communication and Rhetoric 120 712 $17.15 19,358 19,560 General 09.0401 Journalism 84 435 $12.52 13,909 13,832 General 16.0101 Foreign Languages and Literatures, General 17 138 $14.70 4,376 4,406 General 16.0905 Spanish Language and Literature 17 138 $14.70 4,376 4,406 General 16.1603 Sign Language Interpretation and Translation 7 138 $14.70 4,376 4,406 General 19.0702 Adult Development and Aging 3 4 $18.24 162 162 General 23.0101 English Language and Literature, General 70 857 $34.10 26,267 26,645 General 30.9999 Multi-/Interdisciplinary Studies, Other 317 0 $0.00 0 0 General 31.0301 Parks, Recreation and Leisure Facilities Management, General 19 242 $10.00 7,013 7,111 General 31.0505 Kinesiology and Exercise Science 195 69 $17.14 1,925 1,953 General 38.0101 Philosophy 13 857 $34.10 26,267 26,645 General 43.0104 Criminal Justice/Safety Studies 77 59 $40.86 1,258 1,262 General 45.0101 Social Sciences, General 23 83 $31.13 976 1,007 General 45.0201 Anthropology 18 28 $22.58 276 284 General 45.0601 Economics, General 20 236 $24.98 5,933 5,992 General 45.0701 Geography 15 7 $28.77 64 68 General 45.1001 Political Science and Government, General 32 8 $26.10 73 77 General 45.1101 Sociology 43 2 $22.02 45 45 General 50.0599 Dramatic/Theatre Arts and Stagecraft, Other 17 201 $13.62 5,248 5,260 General 50.0702 Fine/Studio Arts, General 122 98 $9.07 2,601 2,635 General 50.0901 Music, General 60 326 $8.43 9,546 9,664 General 54.0101 History, General 73 3 $29.71 52 53
Prof/Mgmt. STEM Education Healthcare General Skilled Trades Total UNC 264 390 340 323 1,366 0 2,683
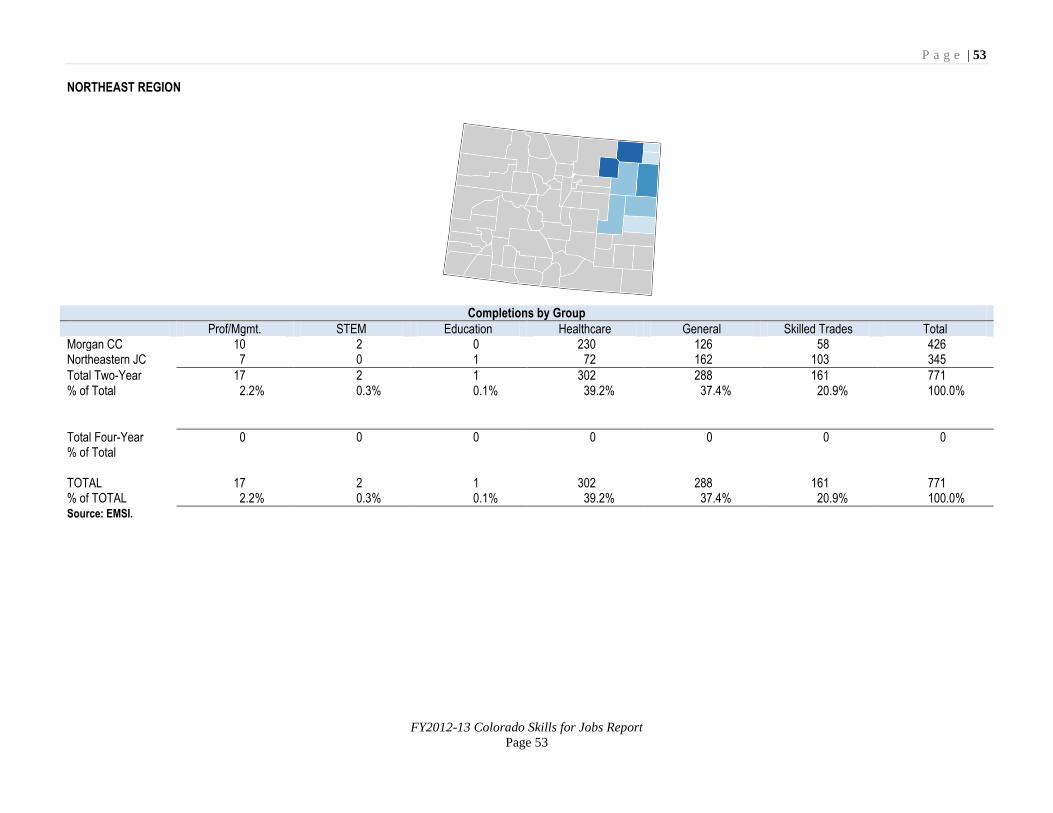
P a g e | 53
FY2012-13 Colorado Skills for Jobs Report
Page 53
NORTHEAST REGION
Completions by Group
Prof/Mgmt. STEM Education Healthcare General Skilled Trades Total Morgan CC 10 2 0 230 126 58 426 Northeastern JC 7 0 1 72 162 103 345
Total Two-Year 17 2 1 302 288 161 771 % of Total 2.2% 0.3% 0.1% 39.2% 37.4% 20.9% 100.0%
Total Four-Year 0 0 0 0 0 0 0 % of Total TOTAL 17 2 1 302 288 161 771 % of TOTAL 2.2% 0.3% 0.1% 39.2% 37.4% 20.9% 100.0% Source: EMSI.
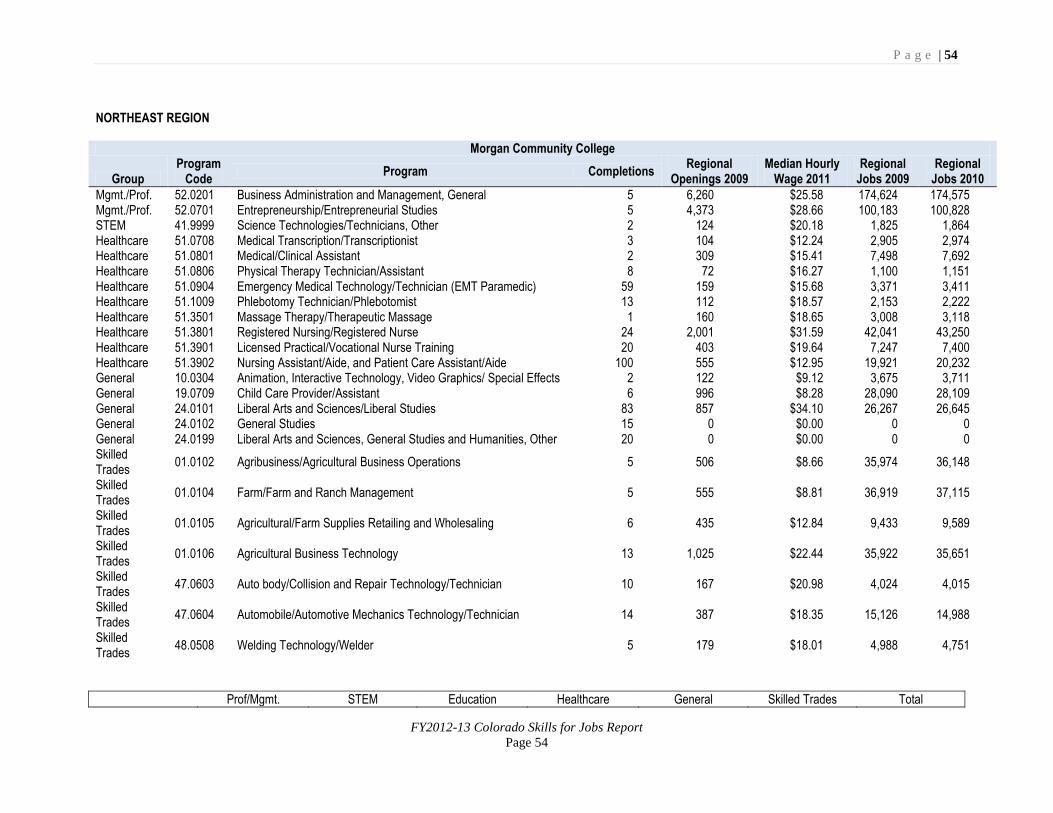
P a g e | 54
FY2012-13 Colorado Skills for Jobs Report
Page 54
NORTHEAST REGION
Morgan Community College
Group Program
Code Program Completions
Regional Openings 2009
Median Hourly Wage 2011
Regional Jobs 2009
Regional Jobs 2010
Mgmt./Prof. 52.0201 Business Administration and Management, General 5 6,260 $25.58 174,624 174,575 Mgmt./Prof. 52.0701 Entrepreneurship/Entrepreneurial Studies 5 4,373 $28.66 100,183 100,828 STEM 41.9999 Science Technologies/Technicians, Other 2 124 $20.18 1,825 1,864 Healthcare 51.0708 Medical Transcription/Transcriptionist 3 104 $12.24 2,905 2,974 Healthcare 51.0801 Medical/Clinical Assistant 2 309 $15.41 7,498 7,692 Healthcare 51.0806 Physical Therapy Technician/Assistant 8 72 $16.27 1,100 1,151 Healthcare 51.0904 Emergency Medical Technology/Technician (EMT Paramedic) 59 159 $15.68 3,371 3,411 Healthcare 51.1009 Phlebotomy Technician/Phlebotomist 13 112 $18.57 2,153 2,222 Healthcare 51.3501 Massage Therapy/Therapeutic Massage 1 160 $18.65 3,008 3,118 Healthcare 51.3801 Registered Nursing/Registered Nurse 24 2,001 $31.59 42,041 43,250 Healthcare 51.3901 Licensed Practical/Vocational Nurse Training 20 403 $19.64 7,247 7,400 Healthcare 51.3902 Nursing Assistant/Aide, and Patient Care Assistant/Aide 100 555 $12.95 19,921 20,232 General 10.0304 Animation, Interactive Technology, Video Graphics/ Special Effects 2 122 $9.12 3,675 3,711 General 19.0709 Child Care Provider/Assistant 6 996 $8.28 28,090 28,109 General 24.0101 Liberal Arts and Sciences/Liberal Studies 83 857 $34.10 26,267 26,645 General 24.0102 General Studies 15 0 $0.00 0 0 General 24.0199 Liberal Arts and Sciences, General Studies and Humanities, Other 20 0 $0.00 0 0 Skilled Trades
01.0102 Agribusiness/Agricultural Business Operations 5 506 $8.66 35,974 36,148
Skilled Trades
01.0104 Farm/Farm and Ranch Management 5 555 $8.81 36,919 37,115
Skilled Trades
01.0105 Agricultural/Farm Supplies Retailing and Wholesaling 6 435 $12.84 9,433 9,589
Skilled Trades
01.0106 Agricultural Business Technology 13 1,025 $22.44 35,922 35,651
Skilled Trades
47.0603 Auto body/Collision and Repair Technology/Technician 10 167 $20.98 4,024 4,015
Skilled Trades
47.0604 Automobile/Automotive Mechanics Technology/Technician 14 387 $18.35 15,126 14,988
Skilled Trades
48.0508 Welding Technology/Welder 5 179 $18.01 4,988 4,751
Prof/Mgmt. STEM Education Healthcare General Skilled Trades Total
P a g e | 55
FY2012-13 Colorado Skills for Jobs Report
Page 55
Morgan CC 10 2 0 230 126 58 426
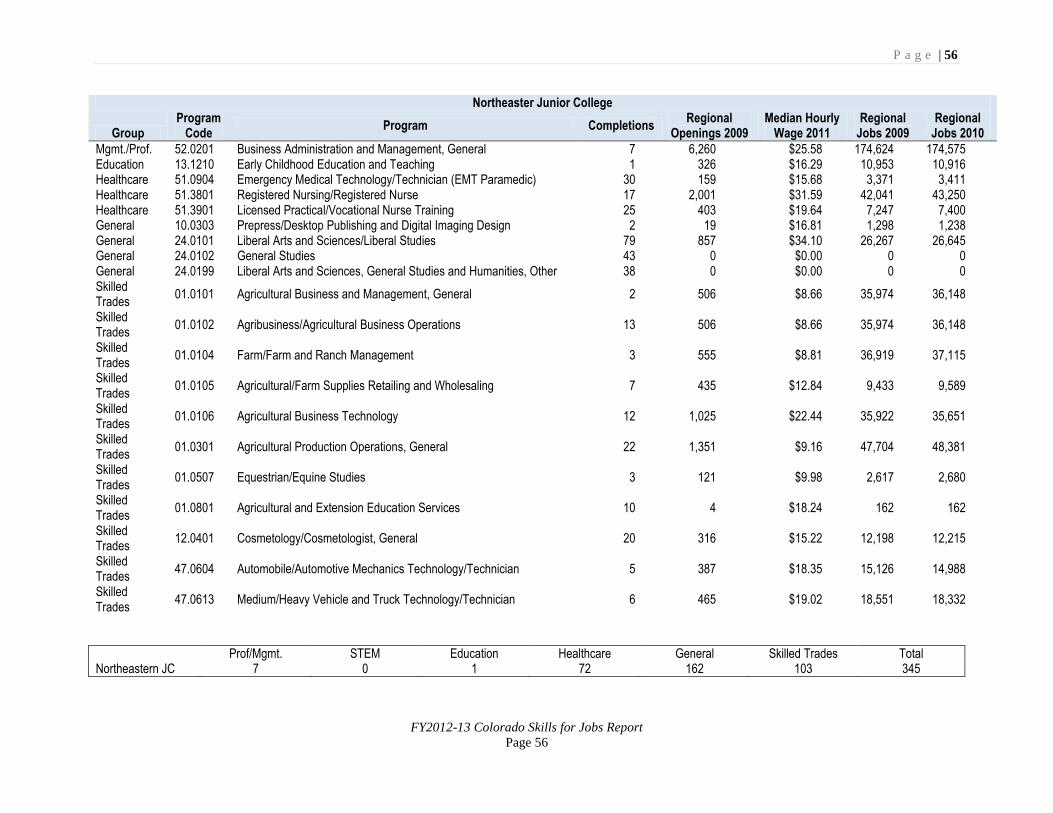
P a g e | 56
FY2012-13 Colorado Skills for Jobs Report
Page 56
Northeaster Junior College
Group Program
Code Program Completions
Regional Openings 2009
Median Hourly Wage 2011
Regional Jobs 2009
Regional Jobs 2010
Mgmt./Prof. 52.0201 Business Administration and Management, General 7 6,260 $25.58 174,624 174,575 Education 13.1210 Early Childhood Education and Teaching 1 326 $16.29 10,953 10,916 Healthcare 51.0904 Emergency Medical Technology/Technician (EMT Paramedic) 30 159 $15.68 3,371 3,411 Healthcare 51.3801 Registered Nursing/Registered Nurse 17 2,001 $31.59 42,041 43,250 Healthcare 51.3901 Licensed Practical/Vocational Nurse Training 25 403 $19.64 7,247 7,400 General 10.0303 Prepress/Desktop Publishing and Digital Imaging Design 2 19 $16.81 1,298 1,238 General 24.0101 Liberal Arts and Sciences/Liberal Studies 79 857 $34.10 26,267 26,645 General 24.0102 General Studies 43 0 $0.00 0 0 General 24.0199 Liberal Arts and Sciences, General Studies and Humanities, Other 38 0 $0.00 0 0 Skilled Trades
01.0101 Agricultural Business and Management, General 2 506 $8.66 35,974 36,148
Skilled Trades
01.0102 Agribusiness/Agricultural Business Operations 13 506 $8.66 35,974 36,148
Skilled Trades
01.0104 Farm/Farm and Ranch Management 3 555 $8.81 36,919 37,115
Skilled Trades
01.0105 Agricultural/Farm Supplies Retailing and Wholesaling 7 435 $12.84 9,433 9,589
Skilled Trades
01.0106 Agricultural Business Technology 12 1,025 $22.44 35,922 35,651
Skilled Trades
01.0301 Agricultural Production Operations, General 22 1,351 $9.16 47,704 48,381
Skilled Trades
01.0507 Equestrian/Equine Studies 3 121 $9.98 2,617 2,680
Skilled Trades
01.0801 Agricultural and Extension Education Services 10 4 $18.24 162 162
Skilled Trades
12.0401 Cosmetology/Cosmetologist, General 20 316 $15.22 12,198 12,215
Skilled Trades
47.0604 Automobile/Automotive Mechanics Technology/Technician 5 387 $18.35 15,126 14,988
Skilled Trades
47.0613 Medium/Heavy Vehicle and Truck Technology/Technician 6 465 $19.02 18,551 18,332
Prof/Mgmt. STEM Education Healthcare General Skilled Trades Total Northeastern JC 7 0 1 72 162 103 345

P a g e | 57
FY2012-13 Colorado Skills for Jobs Report
Page 57
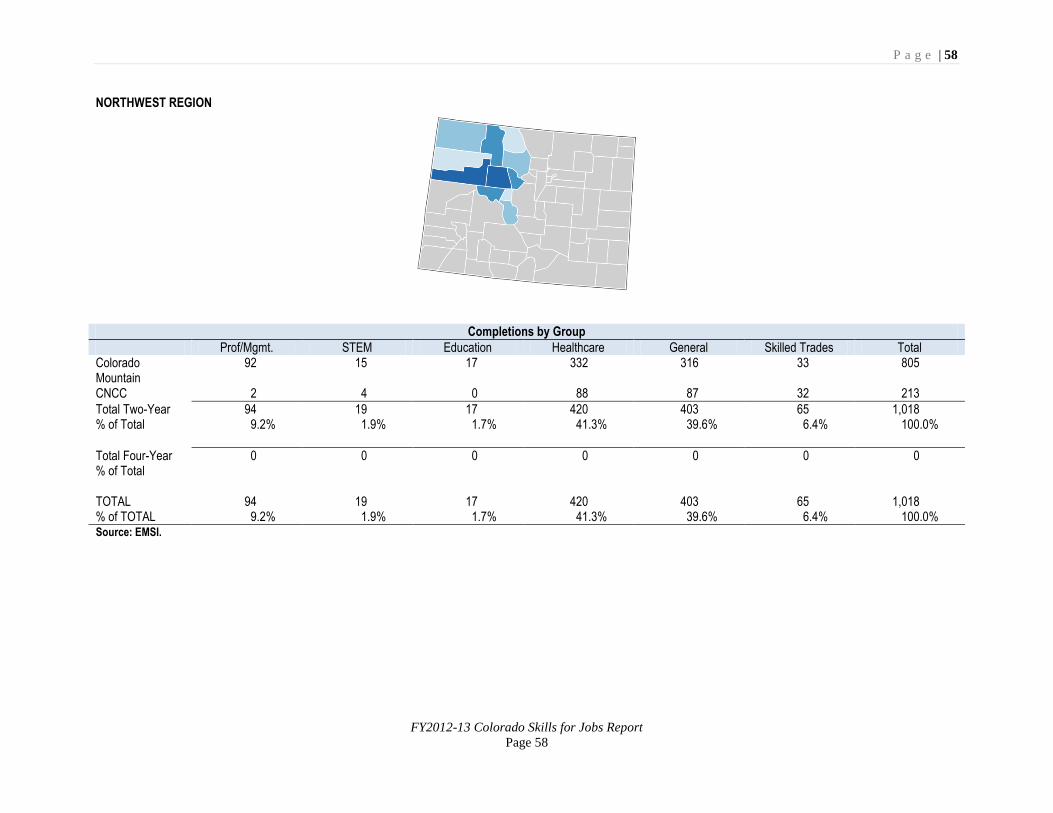
P a g e | 58
FY2012-13 Colorado Skills for Jobs Report
Page 58
NORTHWEST REGION
Completions by Group
Prof/Mgmt. STEM Education Healthcare General Skilled Trades Total Colorado Mountain
92 15 17 332 316 33 805
CNCC 2 4 0 88 87 32 213
Total Two-Year 94 19 17 420 403 65 1,018 % of Total 9.2% 1.9% 1.7% 41.3% 39.6% 6.4% 100.0%
Total Four-Year 0 0 0 0 0 0 0 % of Total TOTAL 94 19 17 420 403 65 1,018 % of TOTAL 9.2% 1.9% 1.7% 41.3% 39.6% 6.4% 100.0% Source: EMSI.
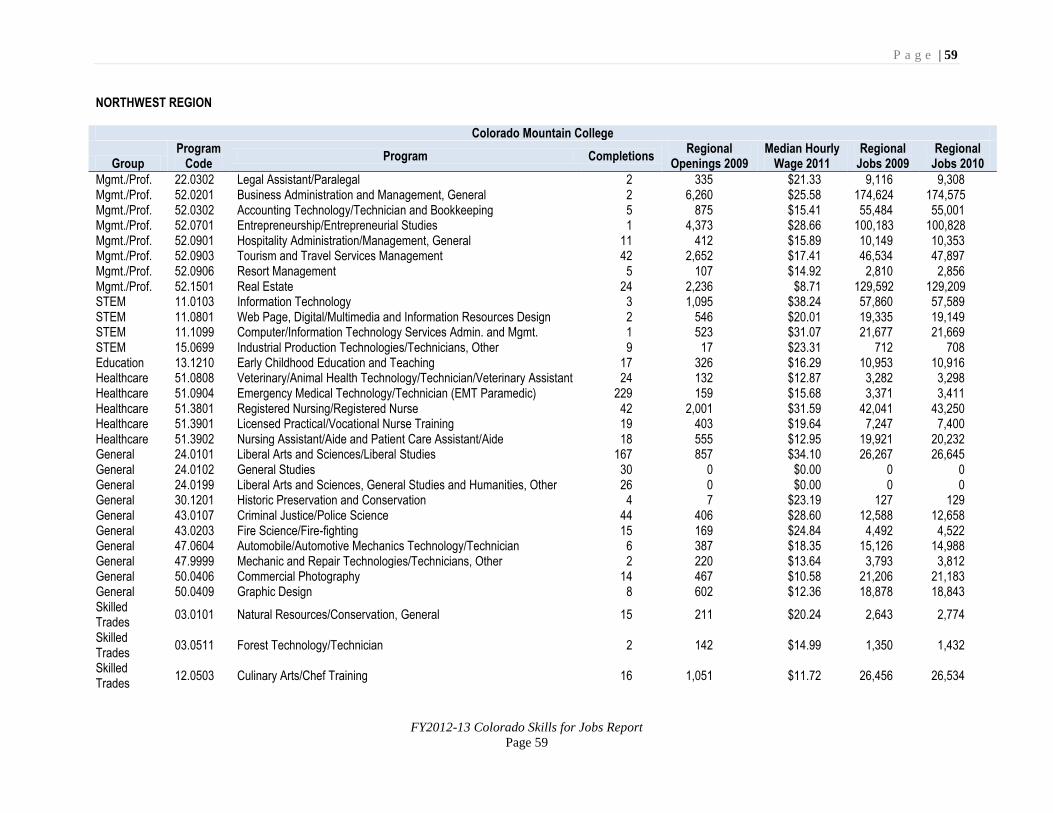
P a g e | 59
FY2012-13 Colorado Skills for Jobs Report
Page 59
NORTHWEST REGION
Colorado Mountain College
Group Program
Code Program Completions
Regional Openings 2009
Median Hourly Wage 2011
Regional Jobs 2009
Regional Jobs 2010
Mgmt./Prof. 22.0302 Legal Assistant/Paralegal 2 335 $21.33 9,116 9,308 Mgmt./Prof. 52.0201 Business Administration and Management, General 2 6,260 $25.58 174,624 174,575 Mgmt./Prof. 52.0302 Accounting Technology/Technician and Bookkeeping 5 875 $15.41 55,484 55,001 Mgmt./Prof. 52.0701 Entrepreneurship/Entrepreneurial Studies 1 4,373 $28.66 100,183 100,828 Mgmt./Prof. 52.0901 Hospitality Administration/Management, General 11 412 $15.89 10,149 10,353 Mgmt./Prof. 52.0903 Tourism and Travel Services Management 42 2,652 $17.41 46,534 47,897 Mgmt./Prof. 52.0906 Resort Management 5 107 $14.92 2,810 2,856 Mgmt./Prof. 52.1501 Real Estate 24 2,236 $8.71 129,592 129,209 STEM 11.0103 Information Technology 3 1,095 $38.24 57,860 57,589 STEM 11.0801 Web Page, Digital/Multimedia and Information Resources Design 2 546 $20.01 19,335 19,149 STEM 11.1099 Computer/Information Technology Services Admin. and Mgmt. 1 523 $31.07 21,677 21,669 STEM 15.0699 Industrial Production Technologies/Technicians, Other 9 17 $23.31 712 708 Education 13.1210 Early Childhood Education and Teaching 17 326 $16.29 10,953 10,916 Healthcare 51.0808 Veterinary/Animal Health Technology/Technician/Veterinary Assistant 24 132 $12.87 3,282 3,298 Healthcare 51.0904 Emergency Medical Technology/Technician (EMT Paramedic) 229 159 $15.68 3,371 3,411 Healthcare 51.3801 Registered Nursing/Registered Nurse 42 2,001 $31.59 42,041 43,250 Healthcare 51.3901 Licensed Practical/Vocational Nurse Training 19 403 $19.64 7,247 7,400 Healthcare 51.3902 Nursing Assistant/Aide and Patient Care Assistant/Aide 18 555 $12.95 19,921 20,232 General 24.0101 Liberal Arts and Sciences/Liberal Studies 167 857 $34.10 26,267 26,645 General 24.0102 General Studies 30 0 $0.00 0 0 General 24.0199 Liberal Arts and Sciences, General Studies and Humanities, Other 26 0 $0.00 0 0 General 30.1201 Historic Preservation and Conservation 4 7 $23.19 127 129 General 43.0107 Criminal Justice/Police Science 44 406 $28.60 12,588 12,658 General 43.0203 Fire Science/Fire-fighting 15 169 $24.84 4,492 4,522 General 47.0604 Automobile/Automotive Mechanics Technology/Technician 6 387 $18.35 15,126 14,988 General 47.9999 Mechanic and Repair Technologies/Technicians, Other 2 220 $13.64 3,793 3,812 General 50.0406 Commercial Photography 14 467 $10.58 21,206 21,183 General 50.0409 Graphic Design 8 602 $12.36 18,878 18,843 Skilled Trades
03.0101 Natural Resources/Conservation, General 15 211 $20.24 2,643 2,774
Skilled Trades
03.0511 Forest Technology/Technician 2 142 $14.99 1,350 1,432
Skilled Trades
12.0503 Culinary Arts/Chef Training 16 1,051 $11.72 26,456 26,534
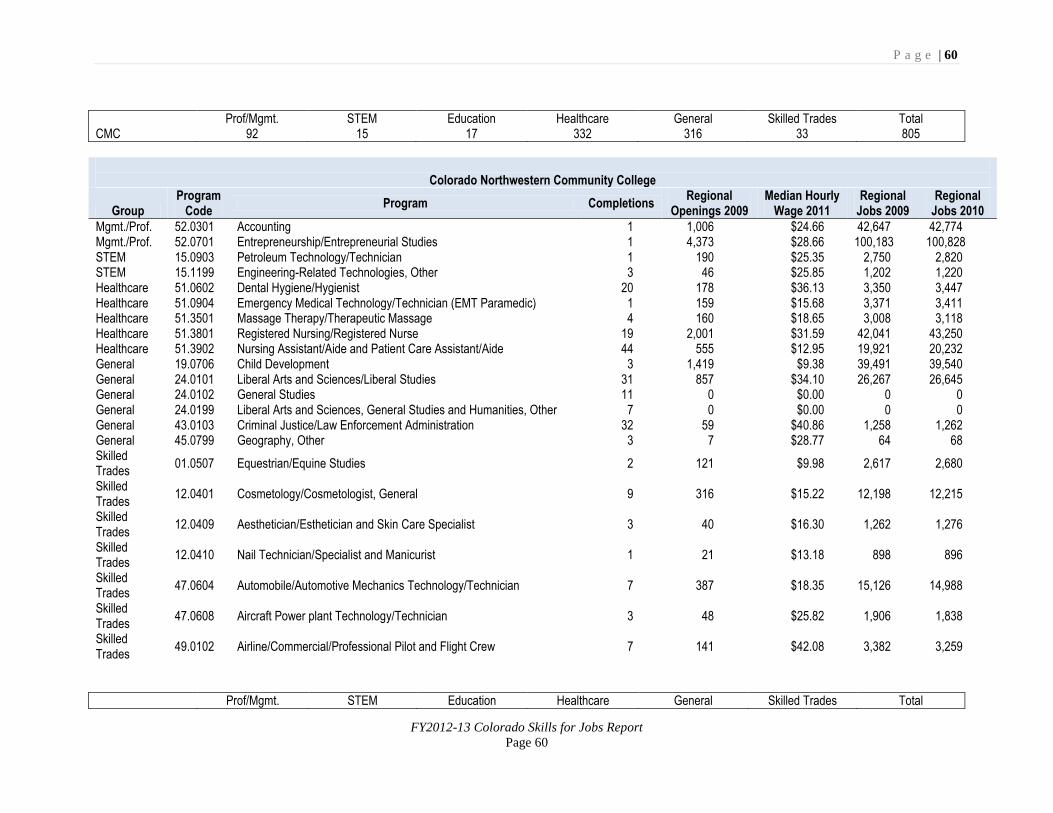
P a g e | 60
FY2012-13 Colorado Skills for Jobs Report
Page 60
Prof/Mgmt. STEM Education Healthcare General Skilled Trades Total CMC 92 15 17 332 316 33 805
Colorado Northwestern Community College
Group Program
Code Program Completions
Regional Openings 2009
Median Hourly Wage 2011
Regional Jobs 2009
Regional Jobs 2010
Mgmt./Prof. 52.0301 Accounting 1 1,006 $24.66 42,647 42,774 Mgmt./Prof. 52.0701 Entrepreneurship/Entrepreneurial Studies 1 4,373 $28.66 100,183 100,828 STEM 15.0903 Petroleum Technology/Technician 1 190 $25.35 2,750 2,820 STEM 15.1199 Engineering-Related Technologies, Other 3 46 $25.85 1,202 1,220 Healthcare 51.0602 Dental Hygiene/Hygienist 20 178 $36.13 3,350 3,447 Healthcare 51.0904 Emergency Medical Technology/Technician (EMT Paramedic) 1 159 $15.68 3,371 3,411 Healthcare 51.3501 Massage Therapy/Therapeutic Massage 4 160 $18.65 3,008 3,118 Healthcare 51.3801 Registered Nursing/Registered Nurse 19 2,001 $31.59 42,041 43,250 Healthcare 51.3902 Nursing Assistant/Aide and Patient Care Assistant/Aide 44 555 $12.95 19,921 20,232 General 19.0706 Child Development 3 1,419 $9.38 39,491 39,540 General 24.0101 Liberal Arts and Sciences/Liberal Studies 31 857 $34.10 26,267 26,645 General 24.0102 General Studies 11 0 $0.00 0 0 General 24.0199 Liberal Arts and Sciences, General Studies and Humanities, Other 7 0 $0.00 0 0 General 43.0103 Criminal Justice/Law Enforcement Administration 32 59 $40.86 1,258 1,262 General 45.0799 Geography, Other 3 7 $28.77 64 68 Skilled Trades
01.0507 Equestrian/Equine Studies 2 121 $9.98 2,617 2,680
Skilled Trades
12.0401 Cosmetology/Cosmetologist, General 9 316 $15.22 12,198 12,215
Skilled Trades
12.0409 Aesthetician/Esthetician and Skin Care Specialist 3 40 $16.30 1,262 1,276
Skilled Trades
12.0410 Nail Technician/Specialist and Manicurist 1 21 $13.18 898 896
Skilled Trades
47.0604 Automobile/Automotive Mechanics Technology/Technician 7 387 $18.35 15,126 14,988
Skilled Trades
47.0608 Aircraft Power plant Technology/Technician 3 48 $25.82 1,906 1,838
Skilled Trades
49.0102 Airline/Commercial/Professional Pilot and Flight Crew 7 141 $42.08 3,382 3,259
Prof/Mgmt. STEM Education Healthcare General Skilled Trades Total
P a g e | 61
FY2012-13 Colorado Skills for Jobs Report
Page 61
CNCC 2 4 0 88 87 32 213
P a g e | 62
FY2012-13 Colorado Skills for Jobs Report
Page 62
SOUTH CENTRAL METRO REGION
Completions by Group
Prof/Mgmt. STEM Education Healthcare General Skilled Trades Total Pikes Peak CC 90 93 0 676 778 124 1,761 Pueblo CC 132 59 0 566 389 148 1,294
Total Two-Year 222 152 - 1,242 1,167 272 3,055 % of Total 7.3% 5.0% 0.0% 40.7% 38.2% 8.9% 100.0% CSU-Pueblo 193 153 18 90 423 0 877 UCCS 396 402 215 196 601 1,810
Total Four-Year 589 555 233 286 1,024 0 2,687 % of Total 21.9% 20.7% 8.7% 10.6% 38.1% 0.0% 100.0% TOTAL 811 707 233 1,528 2,191 272 5,742 % of TOTAL 14.1% 12.3% 4.1% 26.6% 38.2% 4.7% 100.0% Source: EMSI.
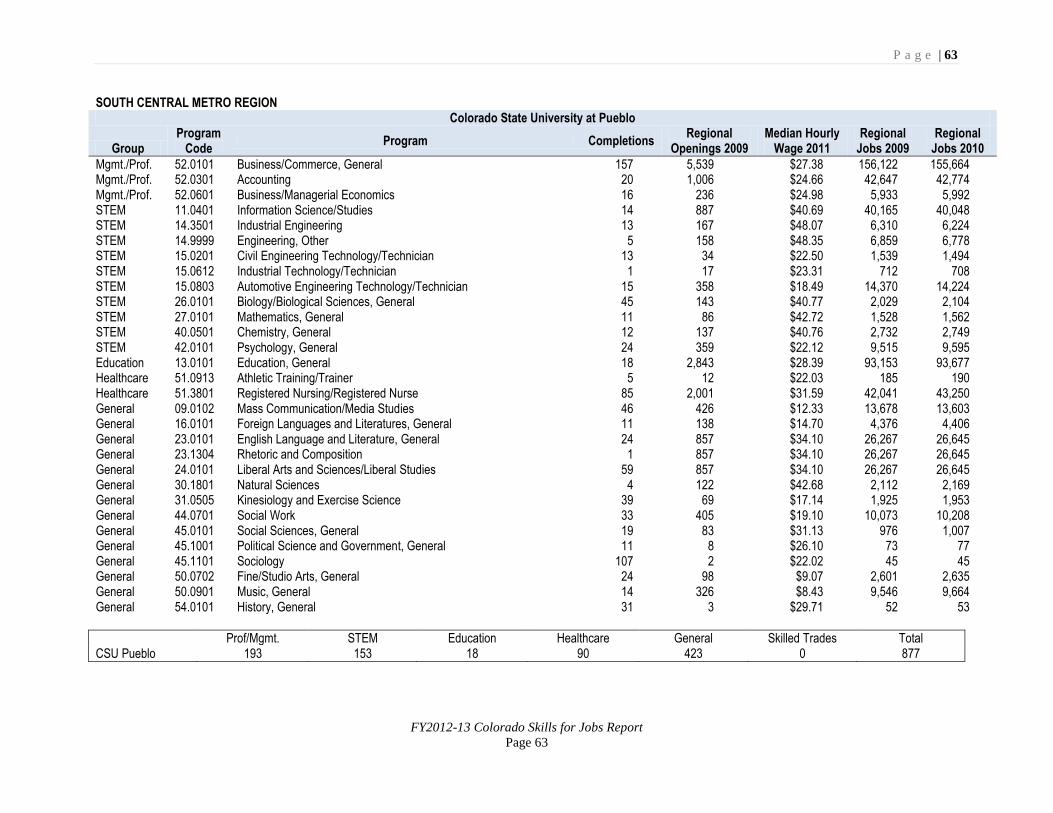
P a g e | 63
FY2012-13 Colorado Skills for Jobs Report
Page 63
SOUTH CENTRAL METRO REGION Colorado State University at Pueblo
Group Program
Code Program Completions
Regional Openings 2009
Median Hourly Wage 2011
Regional Jobs 2009
Regional Jobs 2010
Mgmt./Prof. 52.0101 Business/Commerce, General 157 5,539 $27.38 156,122 155,664 Mgmt./Prof. 52.0301 Accounting 20 1,006 $24.66 42,647 42,774 Mgmt./Prof. 52.0601 Business/Managerial Economics 16 236 $24.98 5,933 5,992 STEM 11.0401 Information Science/Studies 14 887 $40.69 40,165 40,048 STEM 14.3501 Industrial Engineering 13 167 $48.07 6,310 6,224 STEM 14.9999 Engineering, Other 5 158 $48.35 6,859 6,778 STEM 15.0201 Civil Engineering Technology/Technician 13 34 $22.50 1,539 1,494 STEM 15.0612 Industrial Technology/Technician 1 17 $23.31 712 708 STEM 15.0803 Automotive Engineering Technology/Technician 15 358 $18.49 14,370 14,224 STEM 26.0101 Biology/Biological Sciences, General 45 143 $40.77 2,029 2,104 STEM 27.0101 Mathematics, General 11 86 $42.72 1,528 1,562 STEM 40.0501 Chemistry, General 12 137 $40.76 2,732 2,749 STEM 42.0101 Psychology, General 24 359 $22.12 9,515 9,595 Education 13.0101 Education, General 18 2,843 $28.39 93,153 93,677 Healthcare 51.0913 Athletic Training/Trainer 5 12 $22.03 185 190 Healthcare 51.3801 Registered Nursing/Registered Nurse 85 2,001 $31.59 42,041 43,250 General 09.0102 Mass Communication/Media Studies 46 426 $12.33 13,678 13,603 General 16.0101 Foreign Languages and Literatures, General 11 138 $14.70 4,376 4,406 General 23.0101 English Language and Literature, General 24 857 $34.10 26,267 26,645 General 23.1304 Rhetoric and Composition 1 857 $34.10 26,267 26,645 General 24.0101 Liberal Arts and Sciences/Liberal Studies 59 857 $34.10 26,267 26,645 General 30.1801 Natural Sciences 4 122 $42.68 2,112 2,169 General 31.0505 Kinesiology and Exercise Science 39 69 $17.14 1,925 1,953 General 44.0701 Social Work 33 405 $19.10 10,073 10,208 General 45.0101 Social Sciences, General 19 83 $31.13 976 1,007 General 45.1001 Political Science and Government, General 11 8 $26.10 73 77 General 45.1101 Sociology 107 2 $22.02 45 45 General 50.0702 Fine/Studio Arts, General 24 98 $9.07 2,601 2,635 General 50.0901 Music, General 14 326 $8.43 9,546 9,664 General 54.0101 History, General 31 3 $29.71 52 53
Prof/Mgmt. STEM Education Healthcare General Skilled Trades Total CSU Pueblo 193 153 18 90 423 0 877
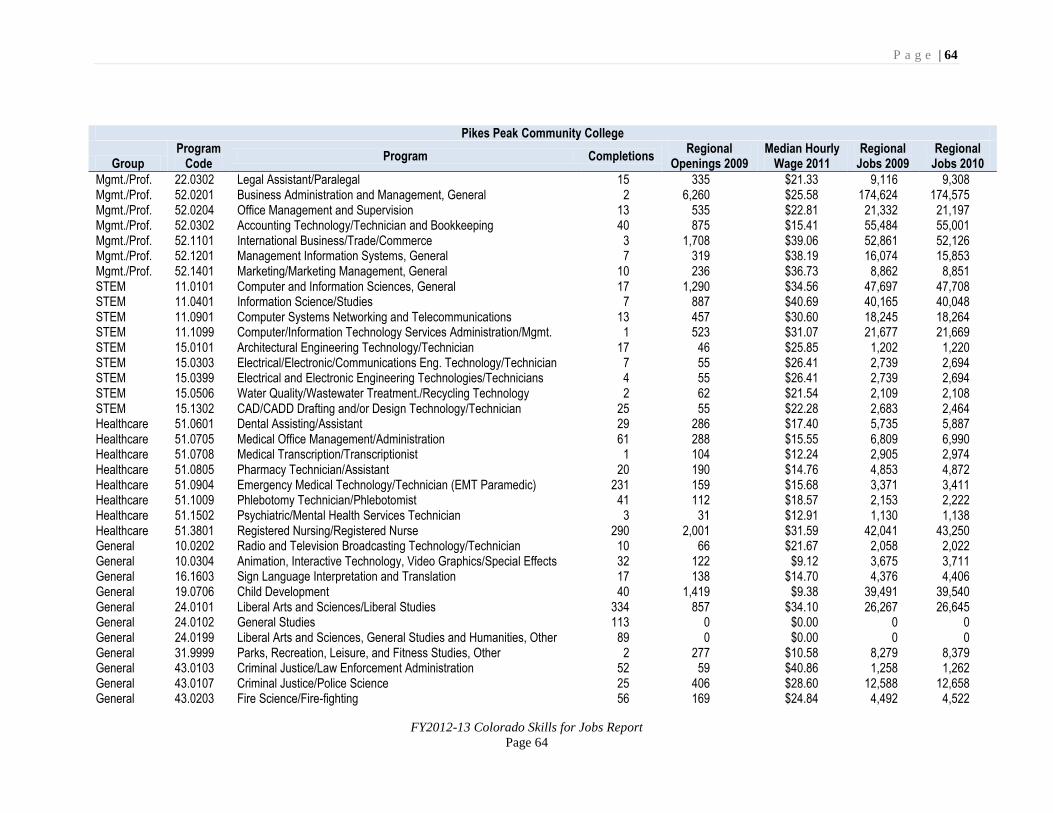
P a g e | 64
FY2012-13 Colorado Skills for Jobs Report
Page 64
Pikes Peak Community College
Group Program
Code Program Completions
Regional Openings 2009
Median Hourly Wage 2011
Regional Jobs 2009
Regional Jobs 2010
Mgmt./Prof. 22.0302 Legal Assistant/Paralegal 15 335 $21.33 9,116 9,308 Mgmt./Prof. 52.0201 Business Administration and Management, General 2 6,260 $25.58 174,624 174,575 Mgmt./Prof. 52.0204 Office Management and Supervision 13 535 $22.81 21,332 21,197 Mgmt./Prof. 52.0302 Accounting Technology/Technician and Bookkeeping 40 875 $15.41 55,484 55,001 Mgmt./Prof. 52.1101 International Business/Trade/Commerce 3 1,708 $39.06 52,861 52,126 Mgmt./Prof. 52.1201 Management Information Systems, General 7 319 $38.19 16,074 15,853 Mgmt./Prof. 52.1401 Marketing/Marketing Management, General 10 236 $36.73 8,862 8,851 STEM 11.0101 Computer and Information Sciences, General 17 1,290 $34.56 47,697 47,708 STEM 11.0401 Information Science/Studies 7 887 $40.69 40,165 40,048 STEM 11.0901 Computer Systems Networking and Telecommunications 13 457 $30.60 18,245 18,264 STEM 11.1099 Computer/Information Technology Services Administration/Mgmt. 1 523 $31.07 21,677 21,669 STEM 15.0101 Architectural Engineering Technology/Technician 17 46 $25.85 1,202 1,220 STEM 15.0303 Electrical/Electronic/Communications Eng. Technology/Technician 7 55 $26.41 2,739 2,694 STEM 15.0399 Electrical and Electronic Engineering Technologies/Technicians 4 55 $26.41 2,739 2,694 STEM 15.0506 Water Quality/Wastewater Treatment./Recycling Technology 2 62 $21.54 2,109 2,108 STEM 15.1302 CAD/CADD Drafting and/or Design Technology/Technician 25 55 $22.28 2,683 2,464 Healthcare 51.0601 Dental Assisting/Assistant 29 286 $17.40 5,735 5,887 Healthcare 51.0705 Medical Office Management/Administration 61 288 $15.55 6,809 6,990 Healthcare 51.0708 Medical Transcription/Transcriptionist 1 104 $12.24 2,905 2,974 Healthcare 51.0805 Pharmacy Technician/Assistant 20 190 $14.76 4,853 4,872 Healthcare 51.0904 Emergency Medical Technology/Technician (EMT Paramedic) 231 159 $15.68 3,371 3,411 Healthcare 51.1009 Phlebotomy Technician/Phlebotomist 41 112 $18.57 2,153 2,222 Healthcare 51.1502 Psychiatric/Mental Health Services Technician 3 31 $12.91 1,130 1,138 Healthcare 51.3801 Registered Nursing/Registered Nurse 290 2,001 $31.59 42,041 43,250 General 10.0202 Radio and Television Broadcasting Technology/Technician 10 66 $21.67 2,058 2,022 General 10.0304 Animation, Interactive Technology, Video Graphics/Special Effects 32 122 $9.12 3,675 3,711 General 16.1603 Sign Language Interpretation and Translation 17 138 $14.70 4,376 4,406 General 19.0706 Child Development 40 1,419 $9.38 39,491 39,540 General 24.0101 Liberal Arts and Sciences/Liberal Studies 334 857 $34.10 26,267 26,645 General 24.0102 General Studies 113 0 $0.00 0 0 General 24.0199 Liberal Arts and Sciences, General Studies and Humanities, Other 89 0 $0.00 0 0 General 31.9999 Parks, Recreation, Leisure, and Fitness Studies, Other 2 277 $10.58 8,279 8,379 General 43.0103 Criminal Justice/Law Enforcement Administration 52 59 $40.86 1,258 1,262 General 43.0107 Criminal Justice/Police Science 25 406 $28.60 12,588 12,658 General 43.0203 Fire Science/Fire-fighting 56 169 $24.84 4,492 4,522
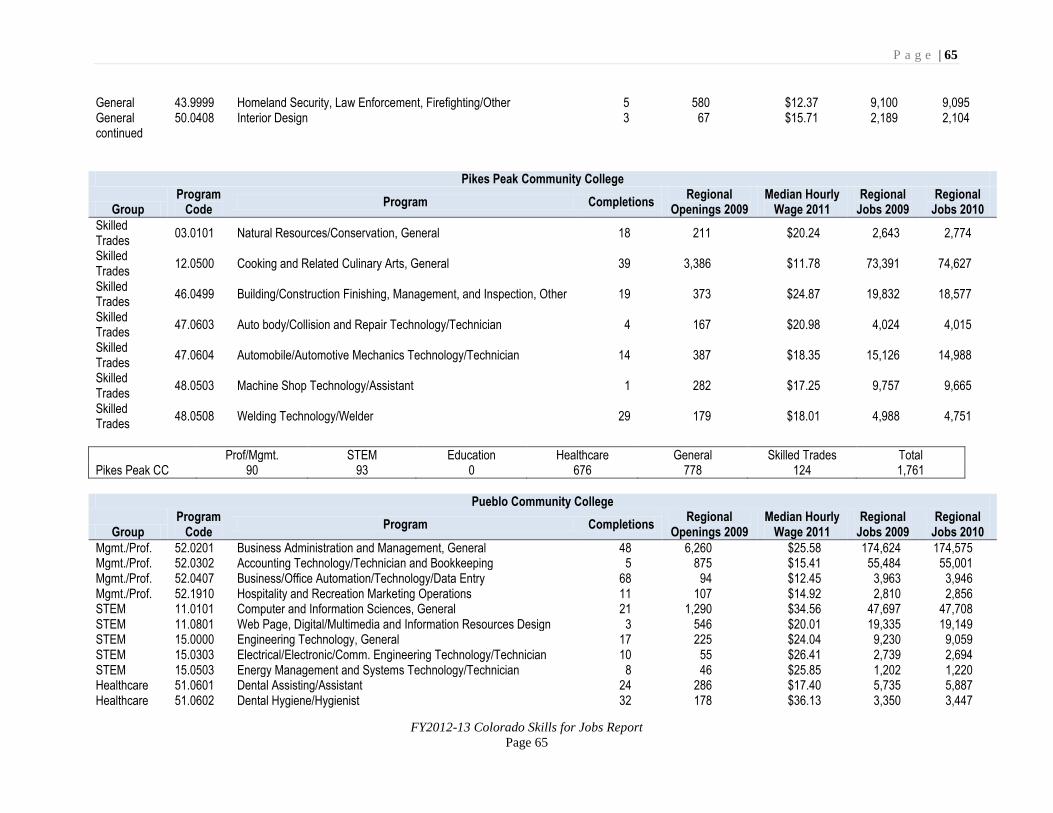
P a g e | 65
FY2012-13 Colorado Skills for Jobs Report
Page 65
General 43.9999 Homeland Security, Law Enforcement, Firefighting/Other 5 580 $12.37 9,100 9,095 General 50.0408 Interior Design 3 67 $15.71 2,189 2,104 continued
Pikes Peak Community College
Group Program
Code Program Completions
Regional Openings 2009
Median Hourly Wage 2011
Regional Jobs 2009
Regional Jobs 2010
Skilled Trades
03.0101 Natural Resources/Conservation, General 18 211 $20.24 2,643 2,774
Skilled Trades
12.0500 Cooking and Related Culinary Arts, General 39 3,386 $11.78 73,391 74,627
Skilled Trades
46.0499 Building/Construction Finishing, Management, and Inspection, Other 19 373 $24.87 19,832 18,577
Skilled Trades
47.0603 Auto body/Collision and Repair Technology/Technician 4 167 $20.98 4,024 4,015
Skilled Trades
47.0604 Automobile/Automotive Mechanics Technology/Technician 14 387 $18.35 15,126 14,988
Skilled Trades
48.0503 Machine Shop Technology/Assistant 1 282 $17.25 9,757 9,665
Skilled Trades
48.0508 Welding Technology/Welder 29 179 $18.01 4,988 4,751
Prof/Mgmt. STEM Education Healthcare General Skilled Trades Total Pikes Peak CC 90 93 0 676 778 124 1,761
Pueblo Community College
Group Program
Code Program Completions
Regional Openings 2009
Median Hourly Wage 2011
Regional Jobs 2009
Regional Jobs 2010
Mgmt./Prof. 52.0201 Business Administration and Management, General 48 6,260 $25.58 174,624 174,575 Mgmt./Prof. 52.0302 Accounting Technology/Technician and Bookkeeping 5 875 $15.41 55,484 55,001 Mgmt./Prof. 52.0407 Business/Office Automation/Technology/Data Entry 68 94 $12.45 3,963 3,946 Mgmt./Prof. 52.1910 Hospitality and Recreation Marketing Operations 11 107 $14.92 2,810 2,856 STEM 11.0101 Computer and Information Sciences, General 21 1,290 $34.56 47,697 47,708 STEM 11.0801 Web Page, Digital/Multimedia and Information Resources Design 3 546 $20.01 19,335 19,149 STEM 15.0000 Engineering Technology, General 17 225 $24.04 9,230 9,059 STEM 15.0303 Electrical/Electronic/Comm. Engineering Technology/Technician 10 55 $26.41 2,739 2,694 STEM 15.0503 Energy Management and Systems Technology/Technician 8 46 $25.85 1,202 1,220 Healthcare 51.0601 Dental Assisting/Assistant 24 286 $17.40 5,735 5,887 Healthcare 51.0602 Dental Hygiene/Hygienist 32 178 $36.13 3,350 3,447
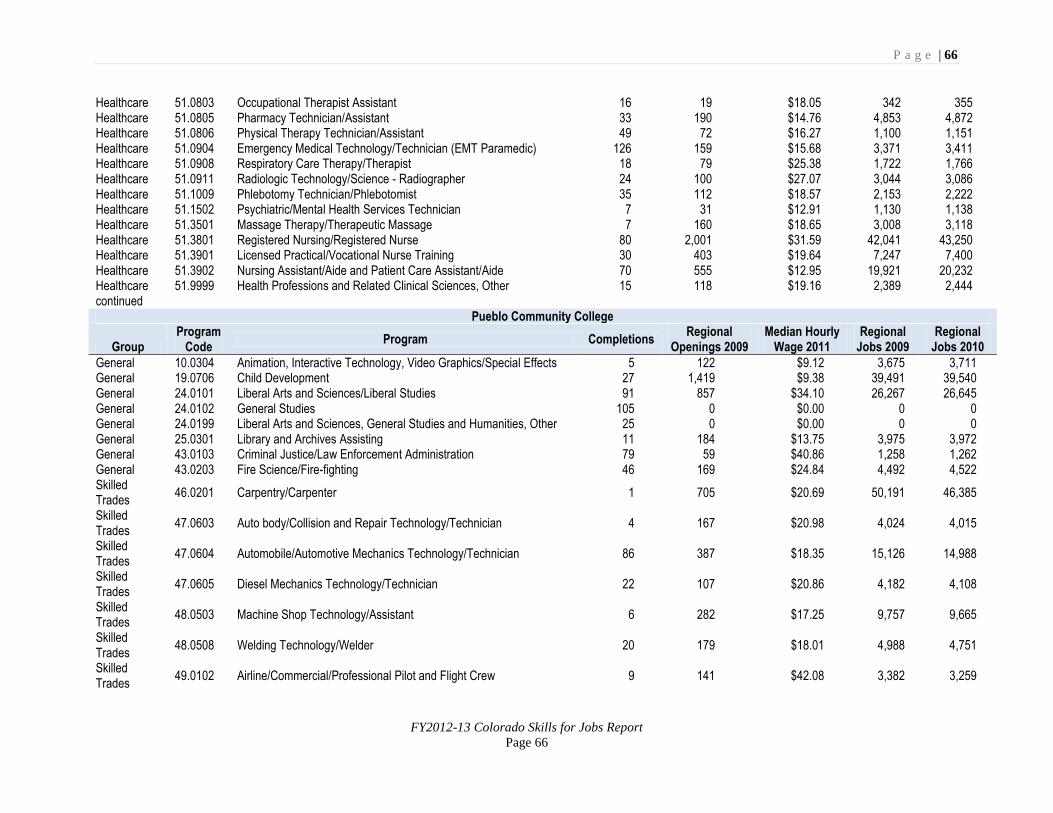
P a g e | 66
FY2012-13 Colorado Skills for Jobs Report
Page 66
Healthcare 51.0803 Occupational Therapist Assistant 16 19 $18.05 342 355 Healthcare 51.0805 Pharmacy Technician/Assistant 33 190 $14.76 4,853 4,872 Healthcare 51.0806 Physical Therapy Technician/Assistant 49 72 $16.27 1,100 1,151 Healthcare 51.0904 Emergency Medical Technology/Technician (EMT Paramedic) 126 159 $15.68 3,371 3,411 Healthcare 51.0908 Respiratory Care Therapy/Therapist 18 79 $25.38 1,722 1,766 Healthcare 51.0911 Radiologic Technology/Science - Radiographer 24 100 $27.07 3,044 3,086 Healthcare 51.1009 Phlebotomy Technician/Phlebotomist 35 112 $18.57 2,153 2,222 Healthcare 51.1502 Psychiatric/Mental Health Services Technician 7 31 $12.91 1,130 1,138 Healthcare 51.3501 Massage Therapy/Therapeutic Massage 7 160 $18.65 3,008 3,118 Healthcare 51.3801 Registered Nursing/Registered Nurse 80 2,001 $31.59 42,041 43,250 Healthcare 51.3901 Licensed Practical/Vocational Nurse Training 30 403 $19.64 7,247 7,400 Healthcare 51.3902 Nursing Assistant/Aide and Patient Care Assistant/Aide 70 555 $12.95 19,921 20,232 Healthcare 51.9999 Health Professions and Related Clinical Sciences, Other 15 118 $19.16 2,389 2,444 continued
Pueblo Community College
Group Program
Code Program Completions
Regional Openings 2009
Median Hourly Wage 2011
Regional Jobs 2009
Regional Jobs 2010
General 10.0304 Animation, Interactive Technology, Video Graphics/Special Effects 5 122 $9.12 3,675 3,711 General 19.0706 Child Development 27 1,419 $9.38 39,491 39,540 General 24.0101 Liberal Arts and Sciences/Liberal Studies 91 857 $34.10 26,267 26,645 General 24.0102 General Studies 105 0 $0.00 0 0 General 24.0199 Liberal Arts and Sciences, General Studies and Humanities, Other 25 0 $0.00 0 0 General 25.0301 Library and Archives Assisting 11 184 $13.75 3,975 3,972 General 43.0103 Criminal Justice/Law Enforcement Administration 79 59 $40.86 1,258 1,262 General 43.0203 Fire Science/Fire-fighting 46 169 $24.84 4,492 4,522 Skilled Trades
46.0201 Carpentry/Carpenter 1 705 $20.69 50,191 46,385
Skilled Trades
47.0603 Auto body/Collision and Repair Technology/Technician 4 167 $20.98 4,024 4,015
Skilled Trades
47.0604 Automobile/Automotive Mechanics Technology/Technician 86 387 $18.35 15,126 14,988
Skilled Trades
47.0605 Diesel Mechanics Technology/Technician 22 107 $20.86 4,182 4,108
Skilled Trades
48.0503 Machine Shop Technology/Assistant 6 282 $17.25 9,757 9,665
Skilled Trades
48.0508 Welding Technology/Welder 20 179 $18.01 4,988 4,751
Skilled Trades
49.0102 Airline/Commercial/Professional Pilot and Flight Crew 9 141 $42.08 3,382 3,259
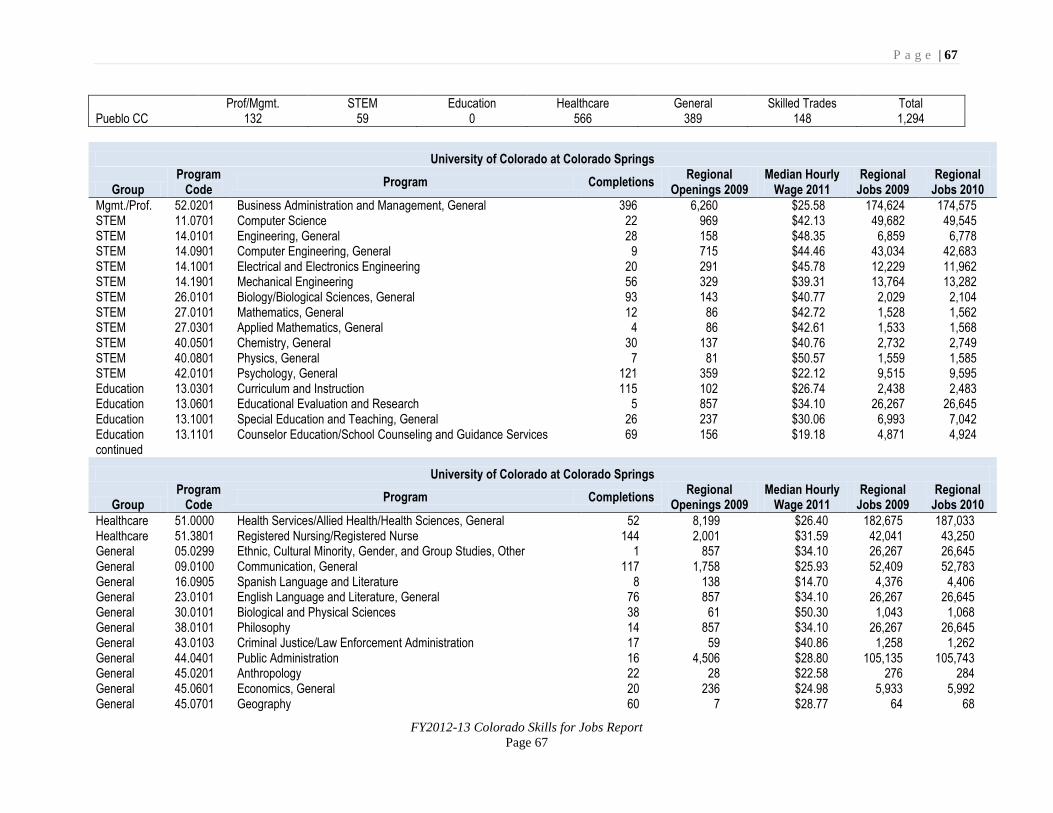
P a g e | 67
FY2012-13 Colorado Skills for Jobs Report
Page 67
Prof/Mgmt. STEM Education Healthcare General Skilled Trades Total Pueblo CC 132 59 0 566 389 148 1,294
University of Colorado at Colorado Springs
Group Program
Code Program Completions
Regional Openings 2009
Median Hourly Wage 2011
Regional Jobs 2009
Regional Jobs 2010
Mgmt./Prof. 52.0201 Business Administration and Management, General 396 6,260 $25.58 174,624 174,575 STEM 11.0701 Computer Science 22 969 $42.13 49,682 49,545 STEM 14.0101 Engineering, General 28 158 $48.35 6,859 6,778 STEM 14.0901 Computer Engineering, General 9 715 $44.46 43,034 42,683 STEM 14.1001 Electrical and Electronics Engineering 20 291 $45.78 12,229 11,962 STEM 14.1901 Mechanical Engineering 56 329 $39.31 13,764 13,282 STEM 26.0101 Biology/Biological Sciences, General 93 143 $40.77 2,029 2,104 STEM 27.0101 Mathematics, General 12 86 $42.72 1,528 1,562 STEM 27.0301 Applied Mathematics, General 4 86 $42.61 1,533 1,568 STEM 40.0501 Chemistry, General 30 137 $40.76 2,732 2,749 STEM 40.0801 Physics, General 7 81 $50.57 1,559 1,585 STEM 42.0101 Psychology, General 121 359 $22.12 9,515 9,595 Education 13.0301 Curriculum and Instruction 115 102 $26.74 2,438 2,483 Education 13.0601 Educational Evaluation and Research 5 857 $34.10 26,267 26,645 Education 13.1001 Special Education and Teaching, General 26 237 $30.06 6,993 7,042 Education 13.1101 Counselor Education/School Counseling and Guidance Services 69 156 $19.18 4,871 4,924 continued
University of Colorado at Colorado Springs
Group Program
Code Program Completions
Regional Openings 2009
Median Hourly Wage 2011
Regional Jobs 2009
Regional Jobs 2010
Healthcare 51.0000 Health Services/Allied Health/Health Sciences, General 52 8,199 $26.40 182,675 187,033 Healthcare 51.3801 Registered Nursing/Registered Nurse 144 2,001 $31.59 42,041 43,250 General 05.0299 Ethnic, Cultural Minority, Gender, and Group Studies, Other 1 857 $34.10 26,267 26,645 General 09.0100 Communication, General 117 1,758 $25.93 52,409 52,783 General 16.0905 Spanish Language and Literature 8 138 $14.70 4,376 4,406 General 23.0101 English Language and Literature, General 76 857 $34.10 26,267 26,645 General 30.0101 Biological and Physical Sciences 38 61 $50.30 1,043 1,068 General 38.0101 Philosophy 14 857 $34.10 26,267 26,645 General 43.0103 Criminal Justice/Law Enforcement Administration 17 59 $40.86 1,258 1,262 General 44.0401 Public Administration 16 4,506 $28.80 105,135 105,743 General 45.0201 Anthropology 22 28 $22.58 276 284 General 45.0601 Economics, General 20 236 $24.98 5,933 5,992 General 45.0701 Geography 60 7 $28.77 64 68
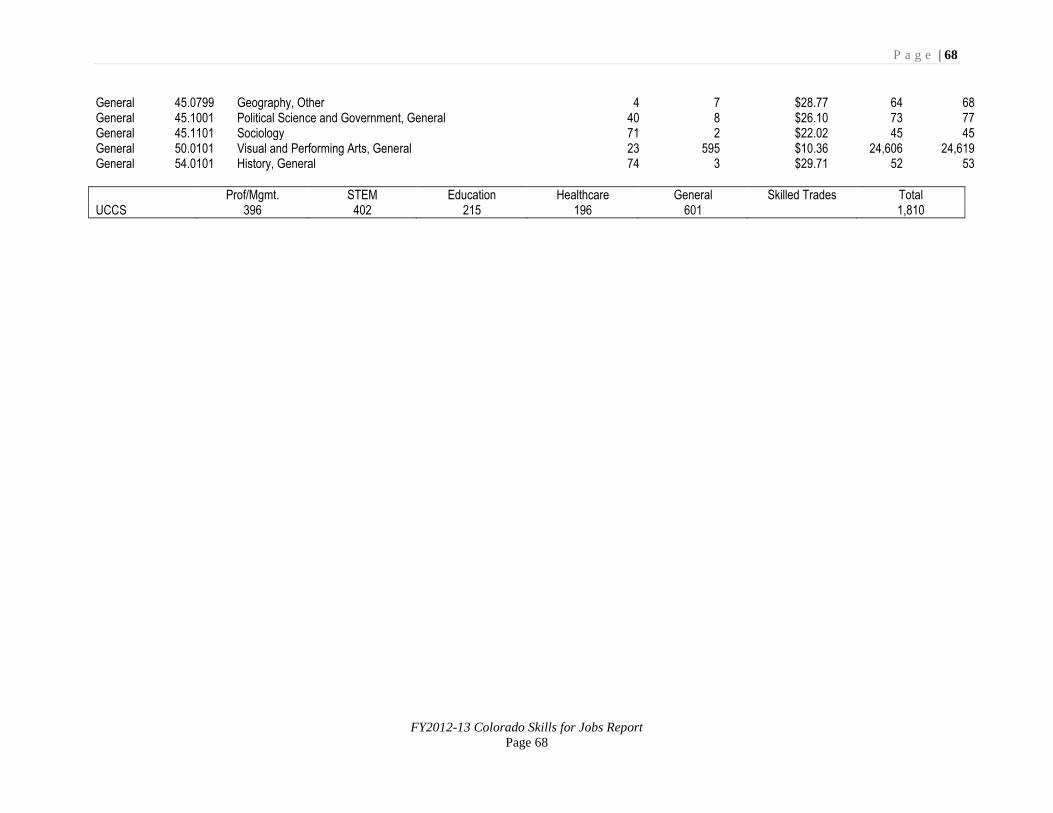
P a g e | 68
FY2012-13 Colorado Skills for Jobs Report
Page 68
General 45.0799 Geography, Other 4 7 $28.77 64 68 General 45.1001 Political Science and Government, General 40 8 $26.10 73 77 General 45.1101 Sociology 71 2 $22.02 45 45 General 50.0101 Visual and Performing Arts, General 23 595 $10.36 24,606 24,619 General 54.0101 History, General 74 3 $29.71 52 53
Prof/Mgmt. STEM Education Healthcare General Skilled Trades Total UCCS 396 402 215 196 601 1,810
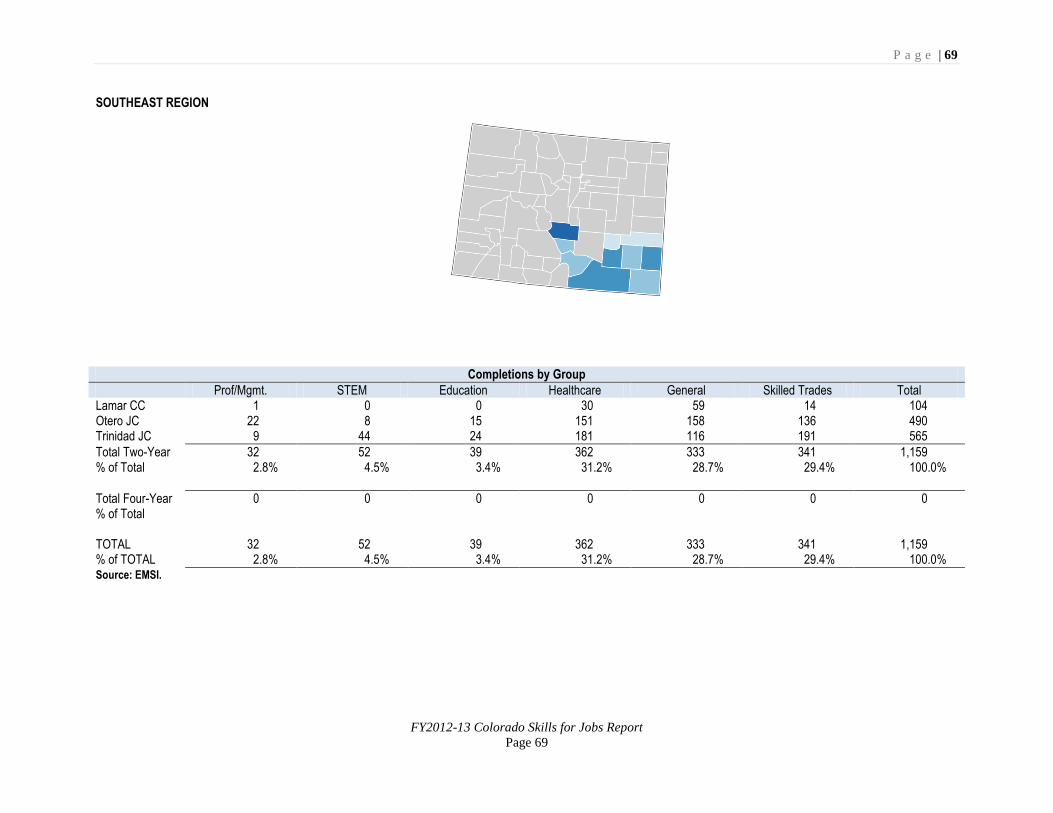
P a g e | 69
FY2012-13 Colorado Skills for Jobs Report
Page 69
SOUTHEAST REGION
Completions by Group
Prof/Mgmt. STEM Education Healthcare General Skilled Trades Total Lamar CC 1 0 0 30 59 14 104 Otero JC 22 8 15 151 158 136 490 Trinidad JC 9 44 24 181 116 191 565
Total Two-Year 32 52 39 362 333 341 1,159 % of Total 2.8% 4.5% 3.4% 31.2% 28.7% 29.4% 100.0%
Total Four-Year 0 0 0 0 0 0 0 % of Total TOTAL 32 52 39 362 333 341 1,159 % of TOTAL 2.8% 4.5% 3.4% 31.2% 28.7% 29.4% 100.0% Source: EMSI.
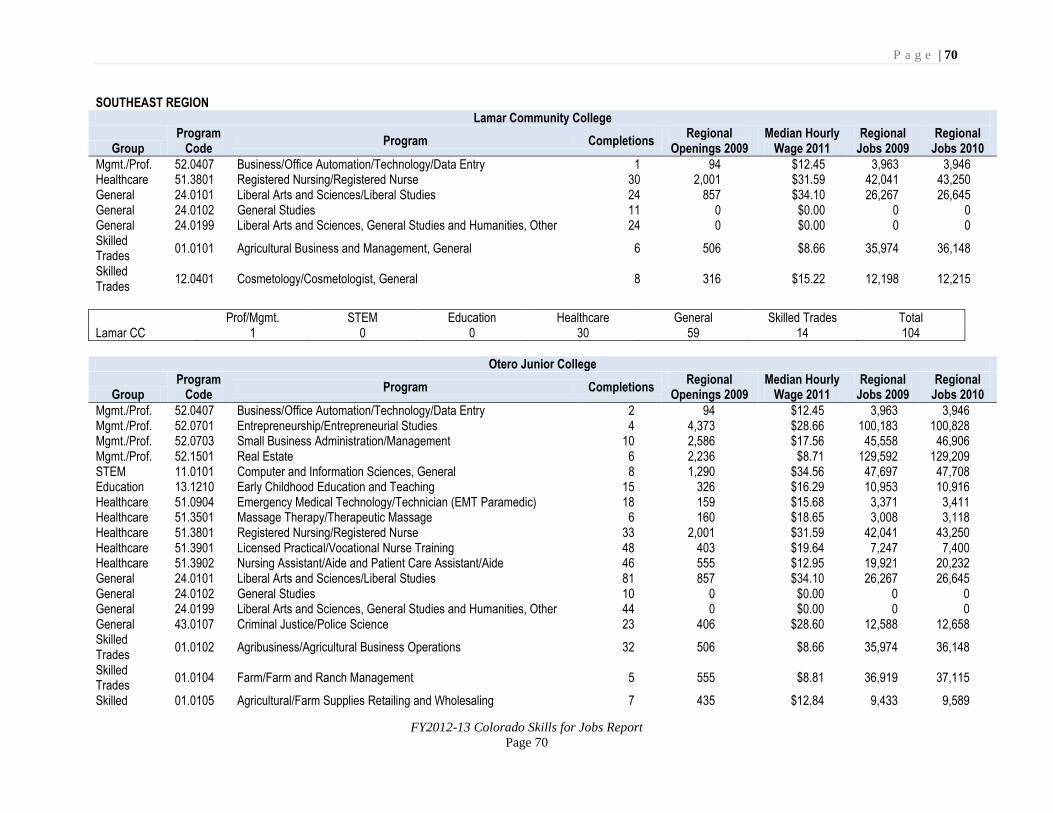
P a g e | 70
FY2012-13 Colorado Skills for Jobs Report
Page 70
SOUTHEAST REGION Lamar Community College
Group Program
Code Program Completions
Regional Openings 2009
Median Hourly Wage 2011
Regional Jobs 2009
Regional Jobs 2010
Mgmt./Prof. 52.0407 Business/Office Automation/Technology/Data Entry 1 94 $12.45 3,963 3,946 Healthcare 51.3801 Registered Nursing/Registered Nurse 30 2,001 $31.59 42,041 43,250 General 24.0101 Liberal Arts and Sciences/Liberal Studies 24 857 $34.10 26,267 26,645 General 24.0102 General Studies 11 0 $0.00 0 0 General 24.0199 Liberal Arts and Sciences, General Studies and Humanities, Other 24 0 $0.00 0 0 Skilled Trades
01.0101 Agricultural Business and Management, General 6 506 $8.66 35,974 36,148
Skilled Trades
12.0401 Cosmetology/Cosmetologist, General 8 316 $15.22 12,198 12,215
Prof/Mgmt. STEM Education Healthcare General Skilled Trades Total Lamar CC 1 0 0 30 59 14 104
Otero Junior College
Group Program
Code Program Completions
Regional Openings 2009
Median Hourly Wage 2011
Regional Jobs 2009
Regional Jobs 2010
Mgmt./Prof. 52.0407 Business/Office Automation/Technology/Data Entry 2 94 $12.45 3,963 3,946 Mgmt./Prof. 52.0701 Entrepreneurship/Entrepreneurial Studies 4 4,373 $28.66 100,183 100,828 Mgmt./Prof. 52.0703 Small Business Administration/Management 10 2,586 $17.56 45,558 46,906 Mgmt./Prof. 52.1501 Real Estate 6 2,236 $8.71 129,592 129,209 STEM 11.0101 Computer and Information Sciences, General 8 1,290 $34.56 47,697 47,708 Education 13.1210 Early Childhood Education and Teaching 15 326 $16.29 10,953 10,916 Healthcare 51.0904 Emergency Medical Technology/Technician (EMT Paramedic) 18 159 $15.68 3,371 3,411 Healthcare 51.3501 Massage Therapy/Therapeutic Massage 6 160 $18.65 3,008 3,118 Healthcare 51.3801 Registered Nursing/Registered Nurse 33 2,001 $31.59 42,041 43,250 Healthcare 51.3901 Licensed Practical/Vocational Nurse Training 48 403 $19.64 7,247 7,400 Healthcare 51.3902 Nursing Assistant/Aide and Patient Care Assistant/Aide 46 555 $12.95 19,921 20,232 General 24.0101 Liberal Arts and Sciences/Liberal Studies 81 857 $34.10 26,267 26,645 General 24.0102 General Studies 10 0 $0.00 0 0 General 24.0199 Liberal Arts and Sciences, General Studies and Humanities, Other 44 0 $0.00 0 0 General 43.0107 Criminal Justice/Police Science 23 406 $28.60 12,588 12,658 Skilled Trades
01.0102 Agribusiness/Agricultural Business Operations 32 506 $8.66 35,974 36,148
Skilled Trades
01.0104 Farm/Farm and Ranch Management 5 555 $8.81 36,919 37,115
Skilled 01.0105 Agricultural/Farm Supplies Retailing and Wholesaling 7 435 $12.84 9,433 9,589
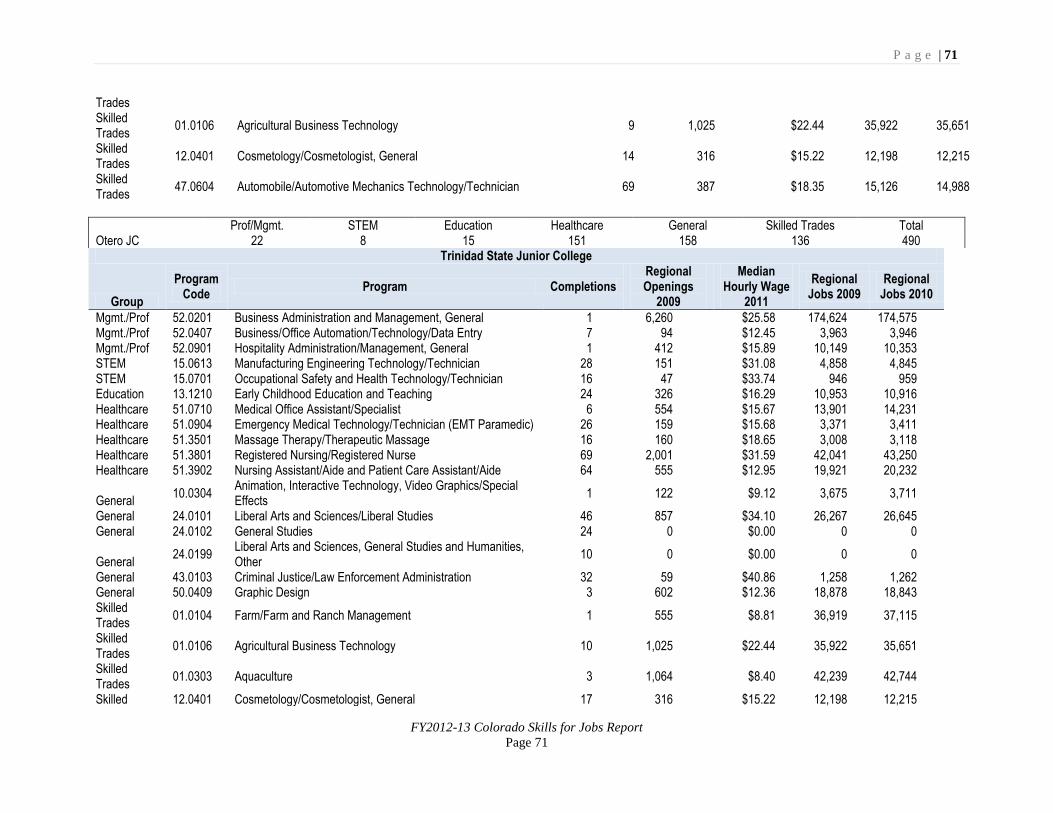
P a g e | 71
FY2012-13 Colorado Skills for Jobs Report
Page 71
Trades Skilled Trades
01.0106 Agricultural Business Technology 9 1,025 $22.44 35,922 35,651
Skilled Trades
12.0401 Cosmetology/Cosmetologist, General 14 316 $15.22 12,198 12,215
Skilled Trades
47.0604 Automobile/Automotive Mechanics Technology/Technician 69 387 $18.35 15,126 14,988
Prof/Mgmt. STEM Education Healthcare General Skilled Trades Total Otero JC 22 8 15 151 158 136 490
Trinidad State Junior College
Group
Program Code
Program Completions Regional Openings
2009
Median Hourly Wage
2011
Regional Jobs 2009
Regional Jobs 2010
Mgmt./Prof 52.0201 Business Administration and Management, General 1 6,260 $25.58 174,624 174,575 Mgmt./Prof 52.0407 Business/Office Automation/Technology/Data Entry 7 94 $12.45 3,963 3,946 Mgmt./Prof 52.0901 Hospitality Administration/Management, General 1 412 $15.89 10,149 10,353 STEM 15.0613 Manufacturing Engineering Technology/Technician 28 151 $31.08 4,858 4,845 STEM 15.0701 Occupational Safety and Health Technology/Technician 16 47 $33.74 946 959 Education 13.1210 Early Childhood Education and Teaching 24 326 $16.29 10,953 10,916 Healthcare 51.0710 Medical Office Assistant/Specialist 6 554 $15.67 13,901 14,231 Healthcare 51.0904 Emergency Medical Technology/Technician (EMT Paramedic) 26 159 $15.68 3,371 3,411 Healthcare 51.3501 Massage Therapy/Therapeutic Massage 16 160 $18.65 3,008 3,118 Healthcare 51.3801 Registered Nursing/Registered Nurse 69 2,001 $31.59 42,041 43,250 Healthcare 51.3902 Nursing Assistant/Aide and Patient Care Assistant/Aide 64 555 $12.95 19,921 20,232
General 10.0304
Animation, Interactive Technology, Video Graphics/Special Effects
1 122 $9.12 3,675 3,711
General 24.0101 Liberal Arts and Sciences/Liberal Studies 46 857 $34.10 26,267 26,645 General 24.0102 General Studies 24 0 $0.00 0 0
General 24.0199
Liberal Arts and Sciences, General Studies and Humanities, Other
10 0 $0.00 0 0
General 43.0103 Criminal Justice/Law Enforcement Administration 32 59 $40.86 1,258 1,262 General 50.0409 Graphic Design 3 602 $12.36 18,878 18,843 Skilled Trades
01.0104 Farm/Farm and Ranch Management 1 555 $8.81 36,919 37,115
Skilled Trades
01.0106 Agricultural Business Technology 10 1,025 $22.44 35,922 35,651
Skilled Trades
01.0303 Aquaculture 3 1,064 $8.40 42,239 42,744
Skilled 12.0401 Cosmetology/Cosmetologist, General 17 316 $15.22 12,198 12,215
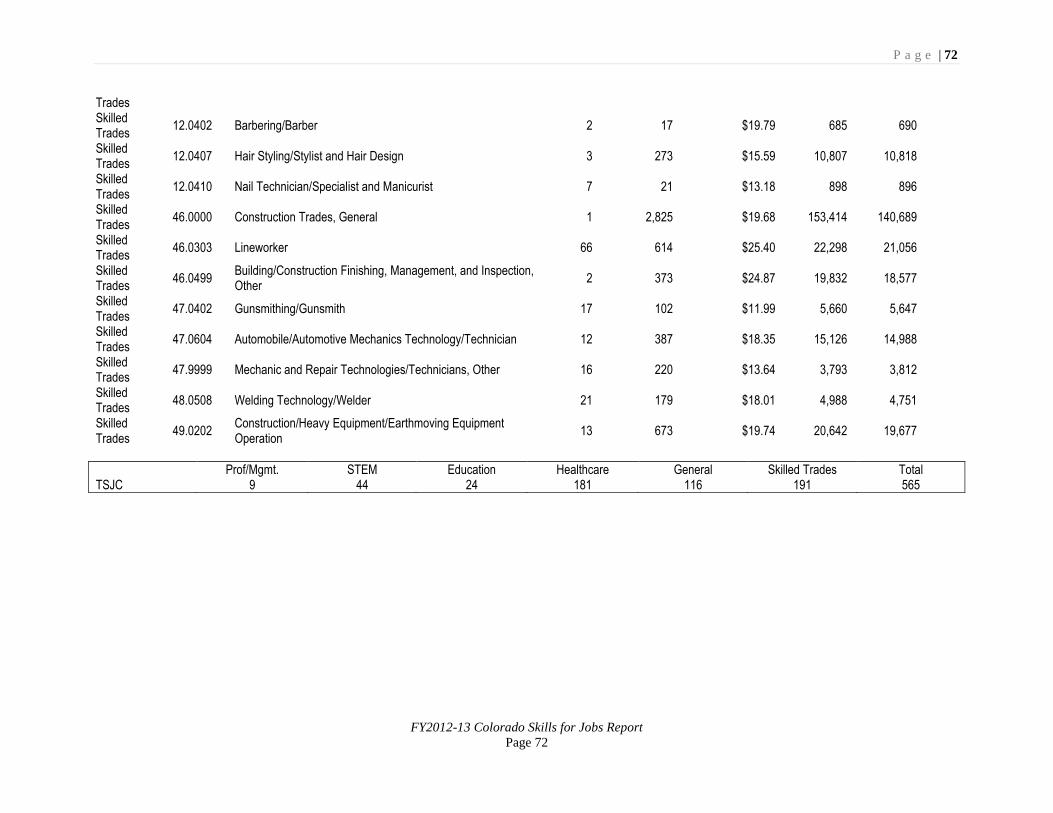
P a g e | 72
FY2012-13 Colorado Skills for Jobs Report
Page 72
Trades Skilled Trades
12.0402 Barbering/Barber 2 17 $19.79 685 690
Skilled Trades
12.0407 Hair Styling/Stylist and Hair Design 3 273 $15.59 10,807 10,818
Skilled Trades
12.0410 Nail Technician/Specialist and Manicurist 7 21 $13.18 898 896
Skilled Trades
46.0000 Construction Trades, General 1 2,825 $19.68 153,414 140,689
Skilled Trades
46.0303 Lineworker 66 614 $25.40 22,298 21,056
Skilled Trades
46.0499 Building/Construction Finishing, Management, and Inspection, Other
2 373 $24.87 19,832 18,577
Skilled Trades
47.0402 Gunsmithing/Gunsmith 17 102 $11.99 5,660 5,647
Skilled Trades
47.0604 Automobile/Automotive Mechanics Technology/Technician 12 387 $18.35 15,126 14,988
Skilled Trades
47.9999 Mechanic and Repair Technologies/Technicians, Other 16 220 $13.64 3,793 3,812
Skilled Trades
48.0508 Welding Technology/Welder 21 179 $18.01 4,988 4,751
Skilled Trades
49.0202 Construction/Heavy Equipment/Earthmoving Equipment Operation
13 673 $19.74 20,642 19,677
Prof/Mgmt. STEM Education Healthcare General Skilled Trades Total TSJC 9 44 24 181 116 191 565
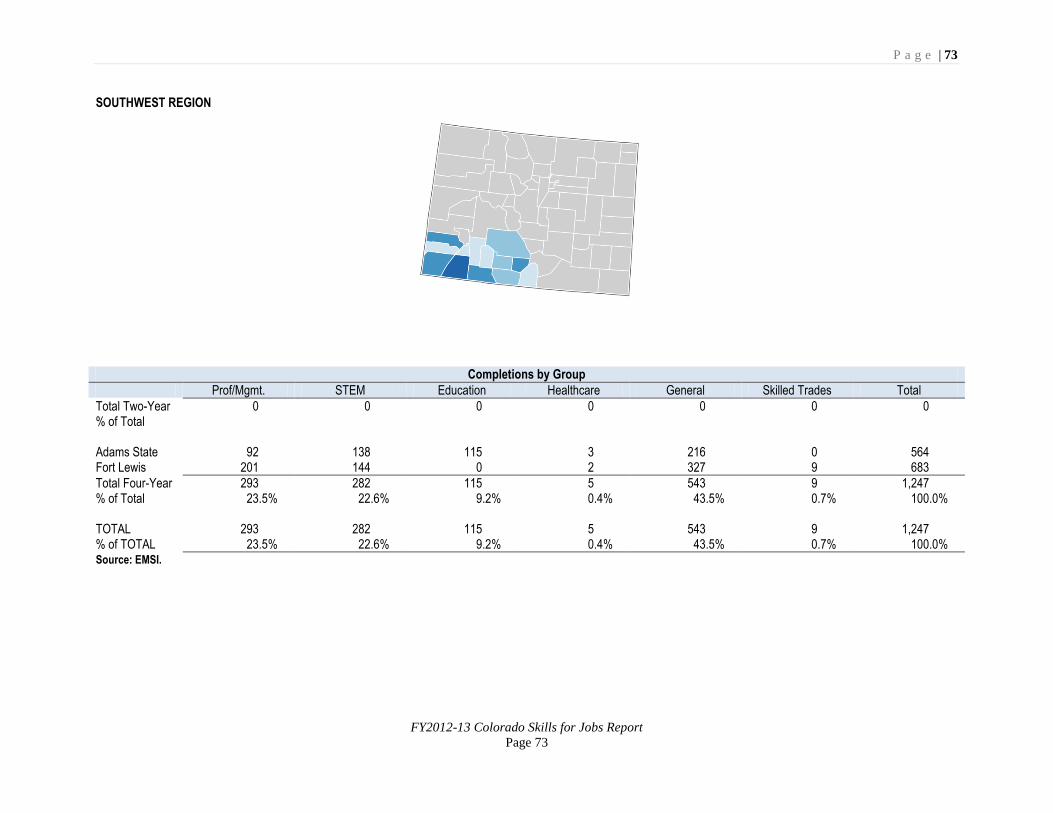
P a g e | 73
FY2012-13 Colorado Skills for Jobs Report
Page 73
SOUTHWEST REGION
Completions by Group
Prof/Mgmt. STEM Education Healthcare General Skilled Trades Total
Total Two-Year 0 0 0 0 0 0 0 % of Total Adams State 92 138 115 3 216 0 564 Fort Lewis 201 144 0 2 327 9 683
Total Four-Year 293 282 115 5 543 9 1,247 % of Total 23.5% 22.6% 9.2% 0.4% 43.5% 0.7% 100.0% TOTAL 293 282 115 5 543 9 1,247 % of TOTAL 23.5% 22.6% 9.2% 0.4% 43.5% 0.7% 100.0% Source: EMSI.
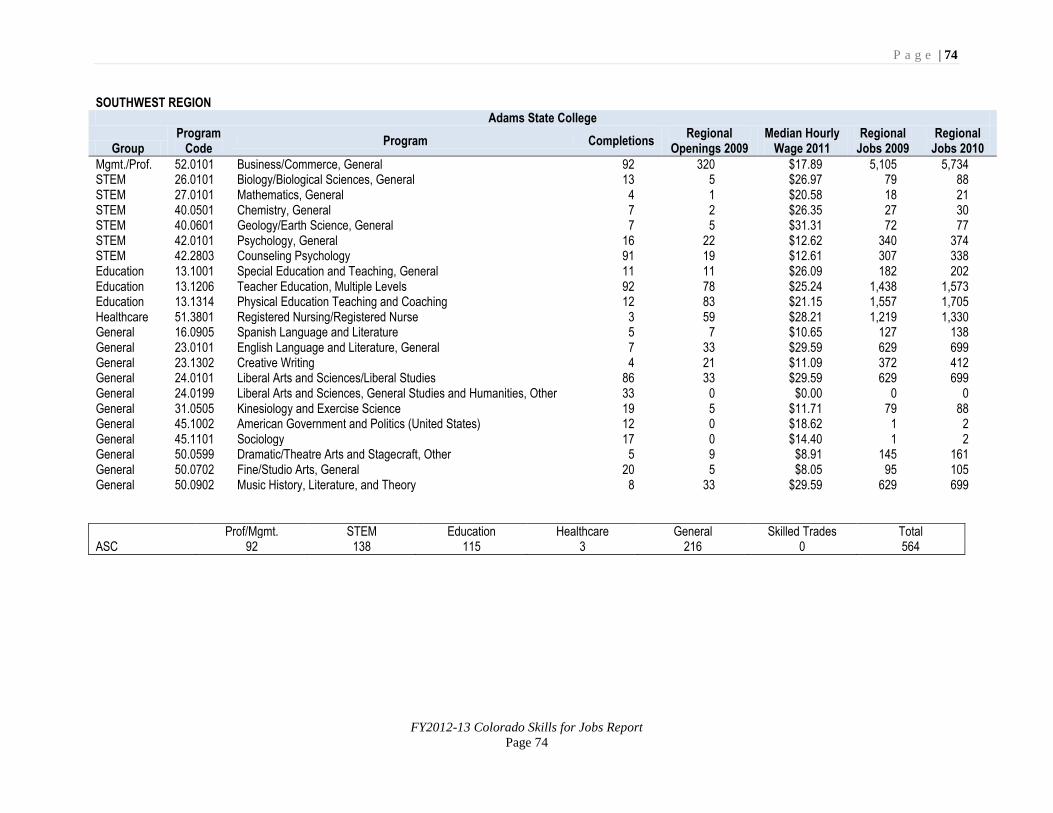
P a g e | 74
FY2012-13 Colorado Skills for Jobs Report
Page 74
SOUTHWEST REGION Adams State College
Group Program
Code Program Completions
Regional Openings 2009
Median Hourly Wage 2011
Regional Jobs 2009
Regional Jobs 2010
Mgmt./Prof. 52.0101 Business/Commerce, General 92 320 $17.89 5,105 5,734 STEM 26.0101 Biology/Biological Sciences, General 13 5 $26.97 79 88 STEM 27.0101 Mathematics, General 4 1 $20.58 18 21 STEM 40.0501 Chemistry, General 7 2 $26.35 27 30 STEM 40.0601 Geology/Earth Science, General 7 5 $31.31 72 77 STEM 42.0101 Psychology, General 16 22 $12.62 340 374 STEM 42.2803 Counseling Psychology 91 19 $12.61 307 338 Education 13.1001 Special Education and Teaching, General 11 11 $26.09 182 202 Education 13.1206 Teacher Education, Multiple Levels 92 78 $25.24 1,438 1,573 Education 13.1314 Physical Education Teaching and Coaching 12 83 $21.15 1,557 1,705 Healthcare 51.3801 Registered Nursing/Registered Nurse 3 59 $28.21 1,219 1,330 General 16.0905 Spanish Language and Literature 5 7 $10.65 127 138 General 23.0101 English Language and Literature, General 7 33 $29.59 629 699 General 23.1302 Creative Writing 4 21 $11.09 372 412 General 24.0101 Liberal Arts and Sciences/Liberal Studies 86 33 $29.59 629 699 General 24.0199 Liberal Arts and Sciences, General Studies and Humanities, Other 33 0 $0.00 0 0 General 31.0505 Kinesiology and Exercise Science 19 5 $11.71 79 88 General 45.1002 American Government and Politics (United States) 12 0 $18.62 1 2 General 45.1101 Sociology 17 0 $14.40 1 2 General 50.0599 Dramatic/Theatre Arts and Stagecraft, Other 5 9 $8.91 145 161 General 50.0702 Fine/Studio Arts, General 20 5 $8.05 95 105 General 50.0902 Music History, Literature, and Theory 8 33 $29.59 629 699
Prof/Mgmt. STEM Education Healthcare General Skilled Trades Total ASC 92 138 115 3 216 0 564
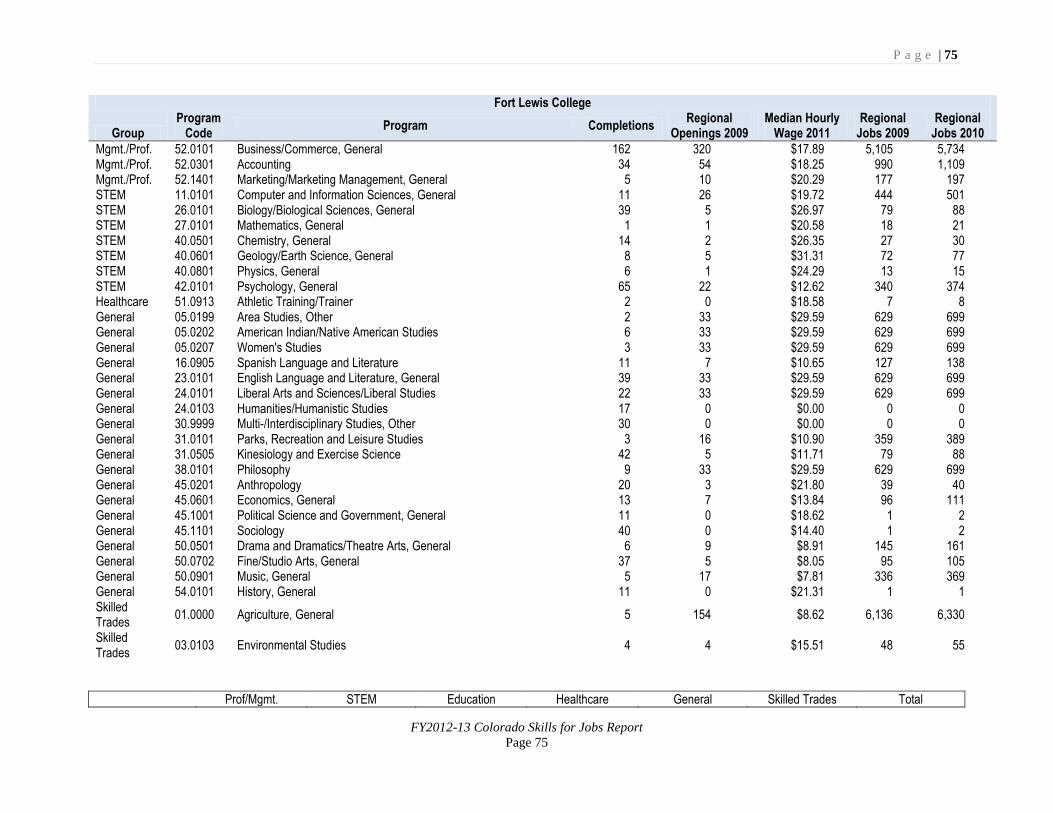
P a g e | 75
FY2012-13 Colorado Skills for Jobs Report
Page 75
Fort Lewis College
Group Program
Code Program Completions
Regional Openings 2009
Median Hourly Wage 2011
Regional Jobs 2009
Regional Jobs 2010
Mgmt./Prof. 52.0101 Business/Commerce, General 162 320 $17.89 5,105 5,734 Mgmt./Prof. 52.0301 Accounting 34 54 $18.25 990 1,109 Mgmt./Prof. 52.1401 Marketing/Marketing Management, General 5 10 $20.29 177 197 STEM 11.0101 Computer and Information Sciences, General 11 26 $19.72 444 501 STEM 26.0101 Biology/Biological Sciences, General 39 5 $26.97 79 88 STEM 27.0101 Mathematics, General 1 1 $20.58 18 21 STEM 40.0501 Chemistry, General 14 2 $26.35 27 30 STEM 40.0601 Geology/Earth Science, General 8 5 $31.31 72 77 STEM 40.0801 Physics, General 6 1 $24.29 13 15 STEM 42.0101 Psychology, General 65 22 $12.62 340 374 Healthcare 51.0913 Athletic Training/Trainer 2 0 $18.58 7 8 General 05.0199 Area Studies, Other 2 33 $29.59 629 699 General 05.0202 American Indian/Native American Studies 6 33 $29.59 629 699 General 05.0207 Women's Studies 3 33 $29.59 629 699 General 16.0905 Spanish Language and Literature 11 7 $10.65 127 138 General 23.0101 English Language and Literature, General 39 33 $29.59 629 699 General 24.0101 Liberal Arts and Sciences/Liberal Studies 22 33 $29.59 629 699 General 24.0103 Humanities/Humanistic Studies 17 0 $0.00 0 0 General 30.9999 Multi-/Interdisciplinary Studies, Other 30 0 $0.00 0 0 General 31.0101 Parks, Recreation and Leisure Studies 3 16 $10.90 359 389 General 31.0505 Kinesiology and Exercise Science 42 5 $11.71 79 88 General 38.0101 Philosophy 9 33 $29.59 629 699 General 45.0201 Anthropology 20 3 $21.80 39 40 General 45.0601 Economics, General 13 7 $13.84 96 111 General 45.1001 Political Science and Government, General 11 0 $18.62 1 2 General 45.1101 Sociology 40 0 $14.40 1 2 General 50.0501 Drama and Dramatics/Theatre Arts, General 6 9 $8.91 145 161 General 50.0702 Fine/Studio Arts, General 37 5 $8.05 95 105 General 50.0901 Music, General 5 17 $7.81 336 369 General 54.0101 History, General 11 0 $21.31 1 1 Skilled Trades
01.0000 Agriculture, General 5 154 $8.62 6,136 6,330
Skilled Trades
03.0103 Environmental Studies 4 4 $15.51 48 55
Prof/Mgmt. STEM Education Healthcare General Skilled Trades Total
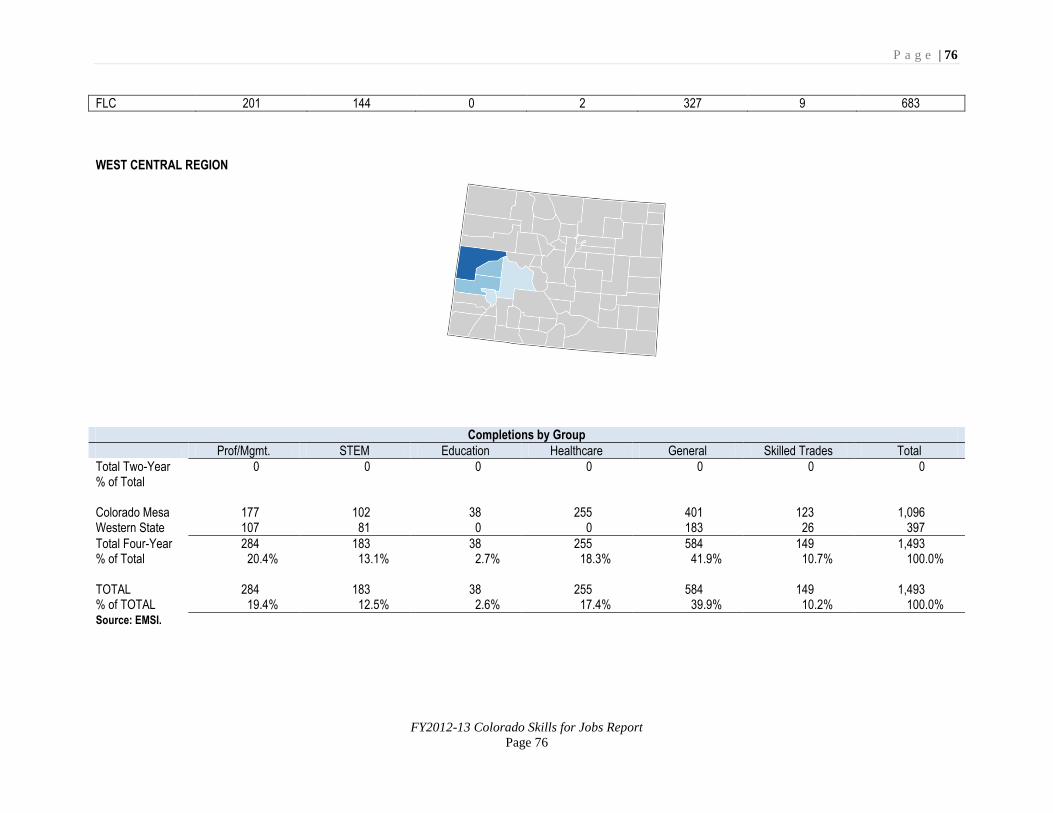
P a g e | 76
FY2012-13 Colorado Skills for Jobs Report
Page 76
FLC 201 144 0 2 327 9 683
WEST CENTRAL REGION
Completions by Group
Prof/Mgmt. STEM Education Healthcare General Skilled Trades Total
Total Two-Year 0 0 0 0 0 0 0 % of Total Colorado Mesa 177 102 38 255 401 123 1,096 Western State 107 81 0 0 183 26 397
Total Four-Year 284 183 38 255 584 149 1,493 % of Total 20.4% 13.1% 2.7% 18.3% 41.9% 10.7% 100.0% TOTAL 284 183 38 255 584 149 1,493 % of TOTAL 19.4% 12.5% 2.6% 17.4% 39.9% 10.2% 100.0% Source: EMSI.
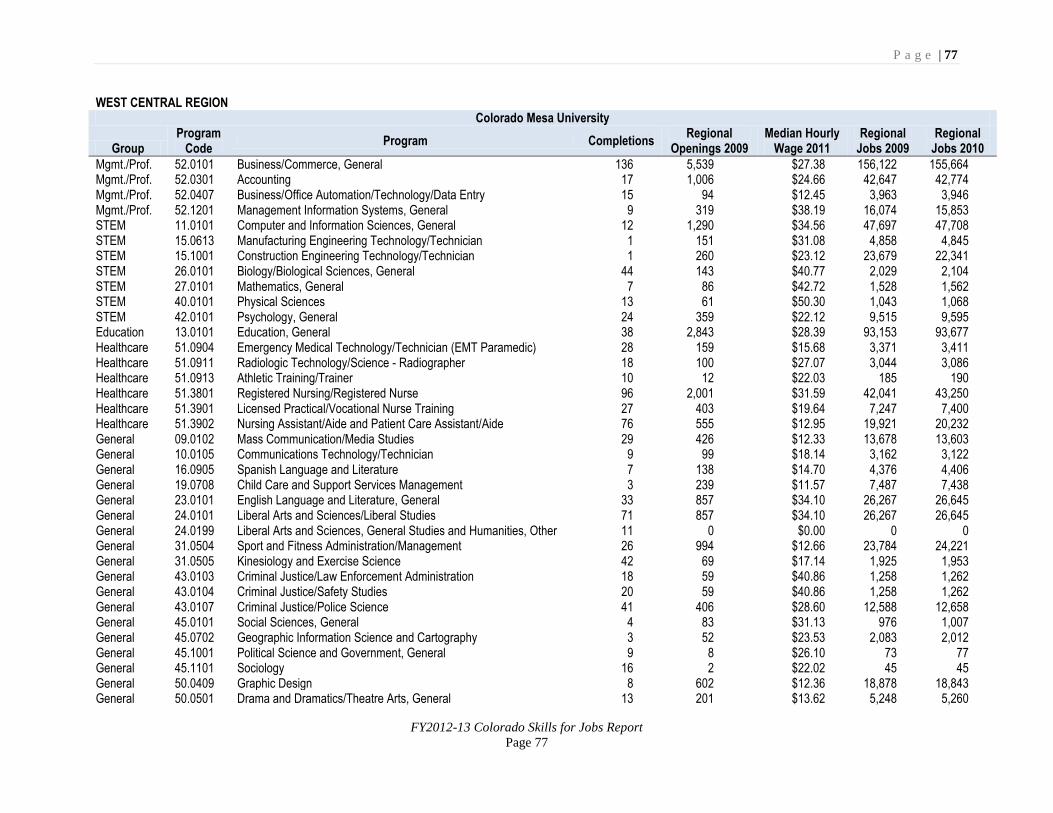
P a g e | 77
FY2012-13 Colorado Skills for Jobs Report
Page 77
WEST CENTRAL REGION Colorado Mesa University
Group Program
Code Program Completions
Regional Openings 2009
Median Hourly Wage 2011
Regional Jobs 2009
Regional Jobs 2010
Mgmt./Prof. 52.0101 Business/Commerce, General 136 5,539 $27.38 156,122 155,664 Mgmt./Prof. 52.0301 Accounting 17 1,006 $24.66 42,647 42,774 Mgmt./Prof. 52.0407 Business/Office Automation/Technology/Data Entry 15 94 $12.45 3,963 3,946 Mgmt./Prof. 52.1201 Management Information Systems, General 9 319 $38.19 16,074 15,853 STEM 11.0101 Computer and Information Sciences, General 12 1,290 $34.56 47,697 47,708 STEM 15.0613 Manufacturing Engineering Technology/Technician 1 151 $31.08 4,858 4,845 STEM 15.1001 Construction Engineering Technology/Technician 1 260 $23.12 23,679 22,341 STEM 26.0101 Biology/Biological Sciences, General 44 143 $40.77 2,029 2,104 STEM 27.0101 Mathematics, General 7 86 $42.72 1,528 1,562 STEM 40.0101 Physical Sciences 13 61 $50.30 1,043 1,068 STEM 42.0101 Psychology, General 24 359 $22.12 9,515 9,595 Education 13.0101 Education, General 38 2,843 $28.39 93,153 93,677 Healthcare 51.0904 Emergency Medical Technology/Technician (EMT Paramedic) 28 159 $15.68 3,371 3,411 Healthcare 51.0911 Radiologic Technology/Science - Radiographer 18 100 $27.07 3,044 3,086 Healthcare 51.0913 Athletic Training/Trainer 10 12 $22.03 185 190 Healthcare 51.3801 Registered Nursing/Registered Nurse 96 2,001 $31.59 42,041 43,250 Healthcare 51.3901 Licensed Practical/Vocational Nurse Training 27 403 $19.64 7,247 7,400 Healthcare 51.3902 Nursing Assistant/Aide and Patient Care Assistant/Aide 76 555 $12.95 19,921 20,232 General 09.0102 Mass Communication/Media Studies 29 426 $12.33 13,678 13,603 General 10.0105 Communications Technology/Technician 9 99 $18.14 3,162 3,122 General 16.0905 Spanish Language and Literature 7 138 $14.70 4,376 4,406 General 19.0708 Child Care and Support Services Management 3 239 $11.57 7,487 7,438 General 23.0101 English Language and Literature, General 33 857 $34.10 26,267 26,645 General 24.0101 Liberal Arts and Sciences/Liberal Studies 71 857 $34.10 26,267 26,645 General 24.0199 Liberal Arts and Sciences, General Studies and Humanities, Other 11 0 $0.00 0 0 General 31.0504 Sport and Fitness Administration/Management 26 994 $12.66 23,784 24,221 General 31.0505 Kinesiology and Exercise Science 42 69 $17.14 1,925 1,953 General 43.0103 Criminal Justice/Law Enforcement Administration 18 59 $40.86 1,258 1,262 General 43.0104 Criminal Justice/Safety Studies 20 59 $40.86 1,258 1,262 General 43.0107 Criminal Justice/Police Science 41 406 $28.60 12,588 12,658 General 45.0101 Social Sciences, General 4 83 $31.13 976 1,007 General 45.0702 Geographic Information Science and Cartography 3 52 $23.53 2,083 2,012 General 45.1001 Political Science and Government, General 9 8 $26.10 73 77 General 45.1101 Sociology 16 2 $22.02 45 45 General 50.0409 Graphic Design 8 602 $12.36 18,878 18,843 General 50.0501 Drama and Dramatics/Theatre Arts, General 13 201 $13.62 5,248 5,260
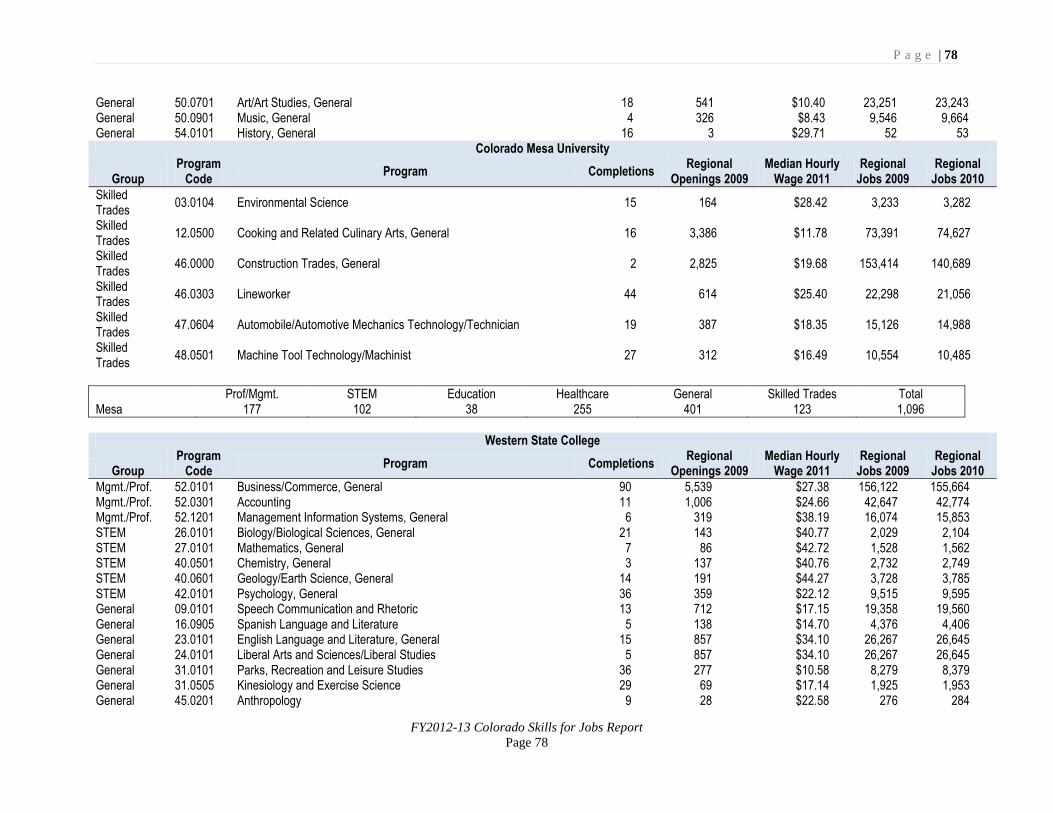
P a g e | 78
FY2012-13 Colorado Skills for Jobs Report
Page 78
General 50.0701 Art/Art Studies, General 18 541 $10.40 23,251 23,243 General 50.0901 Music, General 4 326 $8.43 9,546 9,664 General 54.0101 History, General 16 3 $29.71 52 53
Colorado Mesa University
Group Program
Code Program Completions
Regional Openings 2009
Median Hourly Wage 2011
Regional Jobs 2009
Regional Jobs 2010
Skilled Trades
03.0104 Environmental Science 15 164 $28.42 3,233 3,282
Skilled Trades
12.0500 Cooking and Related Culinary Arts, General 16 3,386 $11.78 73,391 74,627
Skilled Trades
46.0000 Construction Trades, General 2 2,825 $19.68 153,414 140,689
Skilled Trades
46.0303 Lineworker 44 614 $25.40 22,298 21,056
Skilled Trades
47.0604 Automobile/Automotive Mechanics Technology/Technician 19 387 $18.35 15,126 14,988
Skilled Trades
48.0501 Machine Tool Technology/Machinist 27 312 $16.49 10,554 10,485
Prof/Mgmt. STEM Education Healthcare General Skilled Trades Total Mesa 177 102 38 255 401 123 1,096
Western State College
Group Program
Code Program Completions
Regional Openings 2009
Median Hourly Wage 2011
Regional Jobs 2009
Regional Jobs 2010
Mgmt./Prof. 52.0101 Business/Commerce, General 90 5,539 $27.38 156,122 155,664 Mgmt./Prof. 52.0301 Accounting 11 1,006 $24.66 42,647 42,774 Mgmt./Prof. 52.1201 Management Information Systems, General 6 319 $38.19 16,074 15,853 STEM 26.0101 Biology/Biological Sciences, General 21 143 $40.77 2,029 2,104 STEM 27.0101 Mathematics, General 7 86 $42.72 1,528 1,562 STEM 40.0501 Chemistry, General 3 137 $40.76 2,732 2,749 STEM 40.0601 Geology/Earth Science, General 14 191 $44.27 3,728 3,785 STEM 42.0101 Psychology, General 36 359 $22.12 9,515 9,595 General 09.0101 Speech Communication and Rhetoric 13 712 $17.15 19,358 19,560 General 16.0905 Spanish Language and Literature 5 138 $14.70 4,376 4,406 General 23.0101 English Language and Literature, General 15 857 $34.10 26,267 26,645 General 24.0101 Liberal Arts and Sciences/Liberal Studies 5 857 $34.10 26,267 26,645 General 31.0101 Parks, Recreation and Leisure Studies 36 277 $10.58 8,279 8,379 General 31.0505 Kinesiology and Exercise Science 29 69 $17.14 1,925 1,953 General 45.0201 Anthropology 9 28 $22.58 276 284
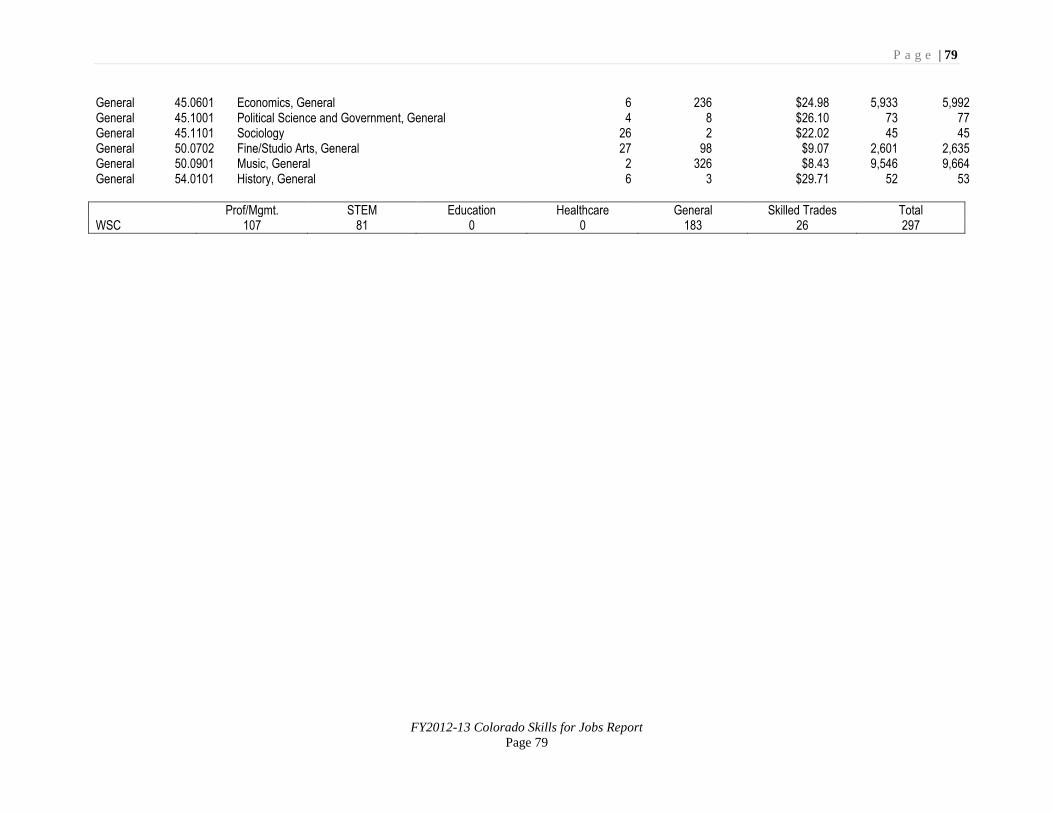
P a g e | 79
FY2012-13 Colorado Skills for Jobs Report
Page 79
General 45.0601 Economics, General 6 236 $24.98 5,933 5,992 General 45.1001 Political Science and Government, General 4 8 $26.10 73 77 General 45.1101 Sociology 26 2 $22.02 45 45 General 50.0702 Fine/Studio Arts, General 27 98 $9.07 2,601 2,635 General 50.0901 Music, General 2 326 $8.43 9,546 9,664 General 54.0101 History, General 6 3 $29.71 52 53
Prof/Mgmt. STEM Education Healthcare General Skilled Trades Total WSC 107 81 0 0 183 26 297