Embed Size (px)
Citation preview

2013 Financial Report

2009
2010
2011
2012
2013
496
863
2 626
4 201
4 444
2009
2010
2011
2012
2013
496
863
2 626
4 201
4 444
2009
2010
2011
2012
2013
496
863
2 626
4 201
4 444
2009
2010
2011
2012
2013
25 344
25 342
29 590
34 002
32 952
2009
2010
2011
2012
2013
25 344
25 342
29 590
34 002
32 952
2009
2010
2011
2012
2013
25 344
25 342
29 590
34 002
32 952
Shareholders’ equity(USD millions)
Net income(USD millions)
Key information
Financial highlightsfor the twelve months ended 31 December
USD millions, unless otherwise stated 2012 2013 Change in %
Groupnet income attributable to common shareholders 4 201 4 444 6Premiums earned and fee income 25 446 28 818 13earnings per share in CHf 11.13 12.04 8Shareholders’ equity 34 002 32 952 –3return on equity1 in % 13.4 13.7return on investments in % 4.0 3.6number of employees2 (31.12.2012/31.12.2013) 11 193 11 574 3
Property & Casualty Reinsurancenet income attributable to common shareholders 2 990 3 292 10Premiums earned 12 329 14 542 18Combined ratio in % 80.7 83.3return on equity1 in % 26.7 26.4
Life & Health Reinsurancenet income attributable to common shareholders 739 356 –52Premiums earned and fee income 9 122 10 023 10operating margin in % 8.6 5.2return on equity1 in % 8.9 5.4
Corporate Solutionsnet income attributable to common shareholders 196 279 42Premiums earned 2 284 2 922 28Combined ratio in % 96.2 95.1return on equity1 in % 7.4 9.6
Admin Re®net income attributable to common shareholders 183 423 131Premiums earned and fee income 1 705 1 330 –22return on equity1 in % 2.6 6.8
1 return on equity is calculated by dividing net income attributable to common shareholders by average common shareholders’ equity.
2 regular staff.
* Swiss withholding tax exempt distribution out of legal reserves from capital contributions.
Proposed dividend per share for 2013 (CHf)*
Financial strength ratingStandard & Poor’s moody’s a.m.Best
3.85(CHf 3.50 for 2012)
aa−stable
aa3stable
a+stable
4.15 Proposed special dividend per share for 2013 (CHf)*

In thIs FInancIal RepoRt ...
About the coveras part of our 150th anniversary celebrations, swiss Re led industry-wide dialogues and thoughtful discussions about the risks facing our communities today and for generations to come. the theme of the anniversary is “open minds connecting generations.”
Swiss Re at a glance02 our mission04 how we operate06 Message from the chairman08 statement from the Group ceo10 our business
Financial year 14 Market environment20 Financial stability21 Group strategy22 Group results26 summary of financial statements28 Reinsurance34 corporate solutions36 admin Re®38 share performance
Risk and capital management 42 overview44 capital management47 economic Value Management 49 liquidity management50 Risk management52 Risk assessment
Corporate governance64 overview66 Group structure and shareholders69 capital structure72 Board of Directors86 executive management92 shareholders’ participation rights93 changes of control
and defence measures94 auditors96 Information policy
Corporate responsibility100 Governance and reporting100 sustainable business101 our carbon footprint103 our employees
Compensation106 Report from the
compensation committee107 compensation context and
highlights in 2013109 compensation governance113 compensation framework120 compensation decisions in 2013
Financial statements130 Group financial statements138 notes to the Group financial
statements232 Report of the statutory auditor234 Group financial years 2004–2013236 swiss Re ltd
General information258 Glossary264 cautionary note on
forward-looking statements266 note on risk factors272 Business contact details273 corporate calendar

OUR BUILDING BLOCKS:STRATEGY
ReinsuranceReinsurance is Swiss Re’s largest business in terms of income and the foundation of our strength, providing about 85% of gross premiums and fee income through two segments — Property & Casualty and Life & Health. The unit aims to extend Swiss Re’s industry-leading position with disciplined underwriting, prudent portfolio management and diligent client service.
Corporate SolutionsCorporate Solutions serves mid-sized and large corporations, with product offerings ranging from traditional property and casualty insurance to highly customised solutions. Corporate Solutions serves customers from over 40 offices worldwide and is a growth engine of the Swiss Re Group.
Admin Re®Admin Re® provides risk and capital management solutions by which Swiss Re acquires closed books of in-force life and health insurance business, entire lines of business, or the entire capital stock of life insurance companies. Admin Re® solutions help clients free up capital to redeploy to new business opportunities while reducing administrative burdens.
Swiss Re Group
GROUP STRUCTURE AND OPERATING MODEL
OUR MISSIONSwiss Re aims to be the leading player in the wholesale re/insurance industry. We seek to outperform peers in core areas, combined with a smart expansion into areas where additional growth opportunities exist.
Our emphasisThe organisation has settled well into the new Group structure created in 2011 with three distinct Business Units: Reinsurance, Corporate Solutions and Admin Re®. Higher transparency and higher accountability drive a positive business culture and allow for agility and flexibility. The Group’s principal goal is to ensure optimal capital and resource allocation across diversified insurance risks and businesses in order to maximise shareholder value.
Our strengthBuilding on our capital strength, expertise and innovation we enable the risk-taking upon which clients and progress in society depend.
Superior performanceWe aim to be the best re/insurer in the world, and to outperform our peers in the closed life book business as well as with our balanced asset management approach.
Smart expansionWe continue to expand our business where we see opportunities for sustainable growth, especially in Corporate Solutions, in high growth markets, and in funding longer lives and health.
Reinsurance is working smarter together with clients in Colombia see page 16 of the 2013 Business Report
Corporate Solutions supports sustainable energy see page 20 of the 2013 Business Report
Admin Re® helps insurers adjust to changing conditions see page 24 of the 2013 Business Report
2 Swiss Re 2013 Financial Report
SwISS RE AT A GLANCE

GROUP STRUCTURE AND OPERATING MODEL
About these targetsThe 2011–2015 financial targets remain our top priority. In 2013 we continued to make good progress toward achieving them. We are well ahead of schedule on our return on equity, our earnings per share and our economic net worth per share targets.
The Group continues to be an industry leader in underwriting quality. In Property & Casualty Reinsurance, working smarter
Target
Return on equity:700 basis points above risk-free (average over five years)1
Earnings per share growth:10% average annual growth rate over 5 years, adjusted for special dividends2 (in USD, base 2010)
Economic net worth per share growth plus dividend:10% average annual growth rate over 5 years (in USD, base 2010)
1 Average US gov 5 years from 31 December 2012 until 31 December 2013: 1.16%.2 EPS growth rate has been adjusted from 10% to 5% for 2014 to account for the proposed CHF 4.15 per share special
dividend (approx. USD 1.6 billion) expected to be distributed in April 2014. Methodology is in line with the approach taken for the special dividend of CHF 4.00 per share paid in April 2013.
3 EPS growth rate from 31 December 2012 until 31 December 2013.4 ENW growth rate from 31 December 2012 until 31 December 2013, including regular and special dividends per share paid.
2013 performance
13.7%(13.4% in 2012)
9.5%3
(54.5% in 2012)
17.0%4
(19.9% in 2012)
OUR 2011–2015 FINANCIAL TARGETS
together with clients, supported by a strict focus on risk selection and portfolio management, will remain a key value driver. We are determined to meet the challenge of low returns in Life & Health Reinsurance through management actions and generating profitable new business. Corporate Solutions is managing its costs and investing for growth, especially in high growth markets. Admin Re® continues to make progress to transform its operations and grow selectively in the UK.
At Group level measures are in place to enhance productivity. We expect to deliver USD 250–300 million in cash savings by 2015 compared to 2012. Our main focus will be on redeploying these savings to higher return opportunities.
With these actions we aim to achieve our 2011–2015 financial targets.
SwISS RE AT A GLANCE | OUR MISSION
Swiss Re 2013 Financial Report 3

HOW WE OPERATERe/insurance creates stability. By managing risks and covering losses, we protect investments and enable economic growth.
MARKET FORCES A changing world of riskLongevity, climate change, and threats to cybersecurity are just a few of the forces altering the risk landscape.
New markets, new clientsGrowth in emerging markets is driving urbanisation and drawing more and more people into a global middle class. New markets demand re/insurance solutions.
OUR APPROACH AND WHY
A knowledge company We are a knowledge company and a thought leader. We devote substantial resources to understanding the risks we re/insure, as well as the ones just over the horizon. See pages 61 and 101 for details.
Building ties We are actively recruiting top talent to fuel our growth and build up the relationships that are essential to success. See page 16 of the Business Report for a success story in Colombia.
we cost, price, structure ANd diversify risk
risk coverage
claims payment
capital relief
clieNts
4 swiss re 2013 Financial Report
swiss re At A glANce

Alternative capitalLow interest rates have driven pension funds, hedge funds and other investors into the natural catastrophe risk pool, increasing competition and capacity for property re/insurance.
changing regulationsRegulatory reforms aiming for stability in the banking sector can also have adverse consequences for the re/insurance sector.
shifting risk burdensThe governments of many countries are constrained and the needs of their populations are growing. Individuals are taking on more of the responsibility for risk.
A resilient business model Over 150 years we have accumulated vast experience and expertise that we apply for the benefit of our clients. Alternative capital does not fundamentally challenge our business model. See page 17 for our strategic view on alternative capital.
supporting growth and stability The core activities of insurance are fundamental to economic growth, and they are neither a source nor an amplifier of systemic risk. See pages 20 and 25 for our view on regulatory reforms.
protecting societies We are proud of our long record of supporting generations when disaster strikes. That reliability — and the trust it has earned us — goes a long way toward explaining our durability. See page 26 of the Business Report for some highlights of Swiss Re’s relevance to society over the years.
profit
we receive up-froNt premiums
we iNvest uNtil moNey
is Needed
we compeNsAte for losses
swiss re At A glANce | HOW WE OPERATE
swiss re 2013 Financial Report 5

Dear shareholders At this time last year I wrote of my confidence in Swiss Reʼs prospects for 2013. That confidence has now been confirmed. Based on Swiss Reʼs very strong 2013 performance, the Board of Directors will recommend a regular dividend of CHF 3.85 per share at this yearʼs Annual General Meeting. We will also propose a special dividend of CHF 4.15 per share. Altogether this represents a return of about USD 3.1 billion of capital to our shareholders.
I am pleased to propose these dividends in our 150th year. While the anniversary is an impressive testament to our endurance and strength, strong dividends are proof.
We have earned another very strong profit in 2013, but the business environment remains challenging. We face headwinds from a few sources, such as regulatory developments as well as the inflow of so-called alternative capital into re/insurance markets. I am confident that we have the right business model in place to withstand these pressures, but we need to watch these trends carefully, analyse what they mean for us and respond proactively.
Central banks have kept interest rates artificially low for several years. This policy, pursued to stimulate economic growth and lower unemployment, has undoubtedly had some success. But it comes at increasing cost. One of the costs has been financial repression, ie, depriving long-term savers and investors, such as large re/insurers and pension funds, of important returns on their shareholdersʼ and policyholdersʼ assets. In returning to more ʼnormalʼ interest rates, central banks will face the risk of policy error. We are monitoring developments and preparing accordingly — indeed, the strategic short duration position that we implemented was meant partly to give us the flexibility to respond to changing conditions.
3.85Proposed dividend in CHF for 2013*(CHF 3.50 in 2012)
4.15Proposed special dividend in CHF for 2013*(CHF 4.00 in 2012)
* Swiss withholding tax exempt distribution out of legal reserves from capital contributions.
MESSAGE FROM THE CHAIRMAN
6 Swiss Re 2013 Financial Report
SwiSS Re at a glanCe

In the broader environment we saw in 2013 that the G-20 designated nine large insurers as globally systemically important insurers (G-SII). By all indications the companies named will be subject to additional reporting and higher capital requirements. The designation of reinsurers has been postponed to July 2014. We are looking at different scenarios although we continue to emphasise that our core activities are neither a source nor an amplifier of systemic risk. We believe we are well prepared for any additional requirements that would arise from such a designation.
These are major changes, and change should give us confidence. Indeed, our business depends on change. As we have often said, we enable the risk-taking on which economic progress depends. For our 150th anniversary we have celebrated under the motto “Open minds connecting generations”, examining ways to tackle some of the large-scale risks facing us today — longevity, climate change, natural disasters and food security. By highlighting ʼgenerations , we looked at the long-term consequences and implications of change in these areas and discussed possible solutions.
“Based on Swiss Reʼs very strong 2013 performance, the Board of Directors will recommend a regular dividend of CHF 3.85 per share at this yearʼs annual general Meeting. we will also propose a special dividend of CHF 4.15. altogether this represents a return of about USD 3.1 billion of capital to our shareholders.”
The long term has always been the focus in our business. The reinsurance business is long-term and long-tail by nature. We look forward to helping clients and society to manage the changes they are facing on a daily basis with innovative and forward-looking solutions.
Thank you for your trust.
Zurich, 20 February 2014
walter B. Kielholz Chairman of the Board of Directors
wal
ter
B. K
ielh
olz
SwiSS Re at a glanCe | MESSAGE FROM THE CHAIRMAN
Swiss Re 2013 Financial Report 7

Dear shareholders I am very pleased to report that all Business Units contributed to Swiss Reʼs very strong 2013 net income of USD 4.4 billion. These results would be gratifying in any year, though especially so in our 150th — they reveal the dynamism that underlies our durability.
Over 2013 our strategy remained unchanged. The point was execution. Execution led foremost to our excellent net income, led by another very strong performance by Property & Casualty Reinsurance with a 2013 net income of USD 3.3 billion. Corporate Solutions delivered continued profitable growth with a profit of USD 279 million. Admin Re® added USD 423 million to the Group result. Net income for Life & Health Reinsurance was USD 356 million.
We also executed against our two capital and asset management goals published at our Investorsʼ Day in June 2013. The first was to reduce our debt by USD 4 billion by 2016, thereby increasing return on equity and earnings per share. Here we are well ahead of schedule. The second was to rebalance our assets so that we invest in a greater share of high-quality credit and equities. This goal was achieved.
Another area of execution was to invest in profitable growth, especially in high growth markets. We continue to expect that a large share of future growth in re/insurance will be in these markets. In addition to our organic expansion in these markets, in 2013 we took a stake in SulAmérica, a well-established and successful multiline insurer in Brazil. In China we invested in New China Life and in the Hong Kong-based insurer FWD Group. We also obtained a license in Singapore for Corporate Solutions.
In Admin Re®, we will focus on the UK market for further acquisitions of closed life books going forward. There we already have a robust platform in place to take on additional business, and thus the maximum leverage for generating operational efficiencies. We have our eyes open for suitable opportunities and remain open to raising third-party capital to fund them. We may also make use of leverage for new business funding.
Internally we have started to enhance productivity. I remain firmly of the belief that we can perform and grow at the same time, and I have every confidence that we will deliver USD 250–300 million in cash savings by 2015 when compared to 2012.
We also have the task of addressing low returns in the Life & Health segment of Reinsurance. Although we made significant progress and remain on track to achieve our 10%–12% RoE target for this segment by 2015, we saw negative developments in the Australian group disability business. These latter developments required us to add USD 369 million to reserves in 2013. We are determined to meet these challenges and generate profitable new business going forward, especially in health.
Meanwhile low interest rates have played a large role in driving pension funds, hedge funds and others toward reinsurance, where returns are perceived to be comparatively high and not correlated to other assets, while barriers to entry remain low. This inflow of so-called alternative capital intensifies competition and increases pressure on our industryʼs profit margins.
STATEMENT FROM THE GROUP CEO
8 Swiss Re 2013 Financial Report
SwiSS Re at a glance

Mic
hel M
. liè
s
2013
2012
2011
2010
2009
4444
4 201
2 626
863
496
2013
2012
2011
2010
2009
4444
4 201
2 626
863
496
2013
2012
2011
2010
2009
4444
4 201
2 626
863
496
We are not impervious to these forces. But in comparison to some small and medium-sized competitors, we believe we have more to offer than ‘just’ capacity. I am confident that we have an agile and flexible business model that will allow us to continue to profit in this challenging environment.
However, we need the best talent at hand. It is with regret that we say farewell to our Group Chief Financial Officer George Quinn, who has decided to pursue other opportunities from May 2014. We are grateful for the contribution George made over the last seven years. At the same time, I am pleased to announce that George can pass the baton to David Cole, our current Group Chief Risk Officer. With him, we could recruit an internal successor with the right skill profile for this key role, which underlines the quality of our own talent pool.
net income(USD millions)
A final word on our brand. Some of you may have noticed our logo has evolved. The logo is the visual symbol of a much more powerful brand promise: We are smarter together. Our companyʼs success has always depended on our clientsʼ success — the new logo and promise are now fresh reminders of this essential relationship. As a shareholder I hope you come to see more and more how ʼsmarter togetherʼ is the mindset and common thread running through all of our thinking and behaviour, and ultimately underlying our results.
Smarter together? Weʼll need to be. Conditions for 2014 look challenging but weʼre ready to take them on.
Thank you for your continued support.
Zurich, 20 February 2014
Michel M. liès Group Chief Executive Officer
“all Business Units contributed to Swiss Reʼs very strong 2013 net income of USD 4.4 billion.”
SwiSS Re at a glance | STATEMENT FROM THE GROUP CEO
Swiss Re 2013 Financial Report 9

THE SWISS RE GROUPBUSINESS UNIT NET PREMIUMS EARNED
AND FEE INCOME (USD BILLIONS)NET INCOME(USD MILLIONS)
ReinsuranceWe cover reinsurance needs in the areas of Property & Casualty and Life & Health.
Corporate SolutionsWe offer innovative, high-quality insurance capacity to mid-sized and large multinational corporations.
Admin Re®We acquire closed in-force life and health books of business, which we administer through Admin Re®.
Total(after consolidation)
Reinsurance Property & Casualty
Reinsurance Life & Health
OUR BUSINESSSwiss Re is a leader in wholesale reinsurance, insurance and risk transfer solutions. Our clients include insurance companies, corporations and public sector bodies. Our knowledge and capital strength enable the risk-taking on which economies depend.
3 292
2 990
356
739
14.5
12.3
10.0
9.1
2.9
2.3
1.3
1.7
28.8
25.4
279
196
423
183
4 444
4 201
2013
2013
2013
2013
2013
2012
2012
2012
2012
2012
2013
2013
2013
2013
2013
2012
2012
2012
2012
2012
10 Swiss Re 2013 Financial Report
SwISS RE AT A gLANCE

NET INCOME(USD MILLIONS)
XX.X% Corporate Solutions
XX.X% Admin Re
XX.X% L&H Reinsurance
XX.X% P&C Reinsurance
XX.X% ASIA-Pacific
XX.X% Americas
XX.X% EMEA
XX.X% Corporate Solutions
XX.X% Admin Re
XX.X% L&H Reinsurance
XX.X% P&C Reinsurance
XX.X% ASIA-Pacific
XX.X% Americas
XX.X% EMEA
DIVERSIFIED AND GLOBALNet premiums earned in 2013 (Total: USD 28.8 billion)
50.5% P & C Reinsurance
34.8% L & H Reinsurance
10.1% Corporate Solutions
4.6% Admin Re®
Employees (Total: 11 574 regular staff1)
63% EMEA
26% Americas
11% Asia-Pacific
1 as of 31 December 2013
RETURN ON EQUITY OPERATINg PERFORMANCE
26.4%(26.7% in 2012)
83.3%(80.7% in 2012) Combined ratio
5.4%(8.9% in 2012)
5.2%(8.6% in 2012) Operating margin
9.6%(7.4% in 2012)
6.8%(2.6% in 2012)
95.1%(96.2% in 2012) Combined ratio
521m(USD 1 196m in 2012) gross cash generation
13.7%(13.4% in 2012) For more information see swissre.com
3 292
2 990
356
739
14.5
12.3
10.0
9.1
2.9
2.3
1.3
1.7
28.8
25.4
279
196
423
183
4 444
4 201
2013
2013
2013
2013
2013
2012
2012
2012
2012
2012
2013
2013
2013
2013
2013
2012
2012
2012
2012
2012
SwISS RE AT A gLANCE | OUR BUSINESS
Swiss Re 2013 Financial Report 11

12 Swiss Re 2013 Financial Report

14 Market environment20 Financial stability21 Group strategy22 Group results26 Summary of financial statements28 Reinsurance34 Corporate Solutions36 Admin Re®38 Share performance
Financial yearSwiss Re delivered a very strong net income of USD 4.4 billion. Overall the year was characterised by moderate economic growth and rising benchmark government bond yields. Developments in re/insurance markets were mixed, with the strongest growth in high growth markets.
FinAnCiAl yeAR | IntRODUctIOn
Swiss Re 2013 Financial Report 13

MaRket envIROnMent
the global economy and financial markets
Global growth remained moderate in 2013. The advanced economies saw modest growth which gained strength over the course of the year, while the pace of expansion in the emerging economies slowed a little from the relatively robust levels of 2012. Monetary policy in the major markets remained accommodative. expectations of stronger growth and reduced monetary stimulus in the US, however, led to a marked increase in benchmark government bond yields. equity markets continued to perform well, supported by the easy monetary conditions and improving growth in the advanced economies.
Global economy US growth was restrained by tax increases and spending cuts, but even so, the economy remained resilient. the eurozone emerged from recession in the second quarter but growth was fragile. Some member states remained in recession with tight fiscal and credit conditions and deleveraging of the private sector weighing on economic activity. the Japanese economy gained momentum helped by expansionary fiscal and monetary policies which weakened the yen (see economic indicators table on page 15). the Uk economy also faced fiscal headwinds but managed to accelerate nonetheless.
Despite the improving economic environment, political uncertainties continued. In europe, the struggle to reach agreement on bail-out terms almost led to an exit of cyprus from the monetary union. also, the political ability, or will, to tackle urgently needed structural reforms remained weak in several countries. the pace of reform at a europe-wide level was moderate, with some progress towards a banking union. In the US, the ongoing impasse on the budget ultimately led to a government shutdown for 16 days in October. a US sovereign debt default was only narrowly averted by a last-minute deal to postpone the debate over increasing the debt ceiling until 2014.
Growth in emerging markets was more robust than in advanced markets but slower than in previous years. In addition, expectations of tighter monetary policy by the US Federal Reserve (the Fed) led to capital outflows from some emerging markets. those economies with large current account deficits, elevated debt levels and high inflation proved especially vulnerable.
Inflation remained moderate in most economies with the exception of a few emerging markets, notably India. In the US and the eurozone, inflation declined during 2013 to end the year well below their respective central bank target levels.
Global growth remained moderate in 2013. Benchmark government bond yields increased from very low levels while stock markets performed well.
interest rates for ten-year government bonds 2009–2013
– United States – United kingdom – Germany – Japan – Switzerland Source: Datastream
2009 20112010 2012 2013
Interest rates for 10-year government bonds 2009 – 2013
United States United Kingdom Germany Japan Switzerland
in %
Source: Datastream
5
4
3
2
1
0
14 Swiss Re 2013 Financial Report
FinAnCiAl yeAR

2009 20112010 2012 2013
Stock markets 2009 – 2013
United States (S & P 500) United Kingdom (MSCI UK) DJ Euro STOXX 50 Japan (TOPIX) Switzerland (SMI)
160
180
200
140
120
100
80
31 December 2008 = 100
60
220
Source: Datastream
interest ratesMonetary policy remained highly accommodative through 2013. the european central Bank (ecB) lowered its benchmark rate twice to reach 0.25%. the Fed and the Bank of england (Boe) kept interest rates unchanged while attempting to steer expectations by providing guidance on their expectations of the future rate path. Meanwhile, the Bank of Japan (BoJ), in an effort to increase inflation to 2% by 2015, announced a doubling of the monetary base by March 2015.
Despite low policy rates, benchmark government bond yields rose significantly during the summer as markets began to anticipate a reduction in monthly asset purchases by the Fed. However, with ongoing political uncertainty and only modest employment growth, the Fed decided to delay its tapering actions. as a result, bond yields dropped, but increased again towards the end of the year, with
2.0%Bank of Japan consumer price index inflation target
3.0%10-year US government bond yield (2012: 1.75%)
Stock markets 2009–2013 31 December 2008 = 100
– United States (S&P 500) – United kingdom (MScI Uk) – DJ euro StOXX 50– Japan (tOPIX) – Switzerland (SMI) Source: Datastream
US and German 10-year government bond yields about 120 and 60 basis points above their respective previous year-end levels (see interest rate chart).
By contrast, bond yields of the peripheral eurozone economies declined. the narrowing yield spreads versus the German benchmark reflected lower perceived risk given improved growth prospects and likely support from the ecB. corporate credit spreads also narrowed as growth in the advanced economies improved.
Stock market performance Global stock markets suffered a brief setback in the early summer as investors worried about the Fed unwinding its asset purchase programme. Overall, however, all major markets performed well in 2013 (see stock markets chart). the MScI Uk was up 14%, the eurostoxx50 18%, the Swiss Market Index 20% and the S&P 500 30%. Japanese equities performed particularly well, supported by the BoJ’s monetary easing. the tOPIX gained 51% over the year.
Currency movementsthe BoJ’s accommodative monetary stance also prompted a continued weakening of the Japanese yen, particularly during the first few months of the year. the yen ended the year down 17% versus the US dollar. Other foreign exchange moves were less pronounced. the US dollar strengthened a little against other key currencies in the first half of the year but reversed those gains in the second half. It ended the year 2%–4% weaker versus the Uk pound, the euro and the Swiss franc.
economic indicators 2012–2013USa eurozone Uk Japan china
2012 2013 2012 2013 2012 2013 2012 2013 2012 2013
Real GDP growth1 2.8 1.9 –0.6 –0.4 0.3 1.9 1.4 1.6 7.7 7.7Inflation1 2.1 1.5 2.5 1.4 2.8 2.6 0.0 0.2 2.7 2.6Long-term interest rate2 1.8 3.0 1.3 1.9 1.8 3.0 0.8 0.7 3.6 4.6USD exchange rate2,3 – – 132 138 162 166 1.15 0.95 16.0 16.5
1 Yearly average2 Year-end3 USD per 100 units of foreign currency Source: Swiss Re economic Research & consulting, Datastream, ceIc
Swiss Re 2013 Financial Report 15
FinAnCiAl yeAR | MaRket envIROnMent

Marine and airline insurance
Global marine and aviation insurance premiums have roughly doubled over the past decade, reaching an estimated USD 44 billion in 2012. these premiums are projected to expand on average by 4% to 5.5% per year over the next decade.
transportation risks are often large and complex, leaving great potential for unpleasant surprises about the severity of losses. Insurers must continue to
Market overviewthe global non-life industry generated around USD 2 100 billion of premium income in 2013; 18% of this came from emerging markets. non-life insurance extends from standardised motor and household insurance to sophisticated tailor-made liability and property covers, including specialty commercial and industrial risk insurance.
Market performancethe global non-life insurance sector was stable in 2013, with overall premium growth slightly up from 2012 to 3% in real terms. In the advanced markets, premium growth likewise remained steady at 1.4%. this mostly reflected moderate rate increases in some markets plus, to a lesser extent, growth in exposure – weakened, however, by the slow-growing global economy. Southern europe saw significant declines in premium income for the second year in a row.
emerging market premiums grew by 7.8%, down from 8.0% in 2012: a reflection of the economic slowdown in many export-dependent countries in Southeast asia and central and eastern europe. that said, china non-life premiums rose by about 13%, largely due to new car sales and infrastructure investments. Premium growth in Latin america, africa and the Middle east was also estimated to be stronger in 2013 than it had been in 2012.
ships, aircrafts and cargo) as is the room to adopt underwriting insights from different insurance classes.
Ultimately the long-term prospects for marine and airline insurance are tied to growth. If the world economy continues to recover, and the global rebalancing of trade and capital flows proceeds smoothly, marine and airline premiums should follow suit.
Further reading: Swiss Re’s 04/13 sigma on navigating recent developments in marine and airline insurance.
Underwriting profitability improved marginally, thanks to a gradual strengthening of premium rates in the US, europe and other selected markets, and also because claims growth remained benign. canada and Germany among others, however, bucked this trend with an increase in natural catastrophe claims.
While 2013 underwriting results improved from the previous year, non-life earnings remained under pressure from weak investment returns. Six years after the financial crisis, the investment environment continues to challenge the insurance industry.
Overall non-life insurance profitability remains subdued by historical standards. the return on equity (Roe) for the main non-life markets is estimated to have been about 7% in 2013, only slightly better than 2012 and well short of the industry’s cost of capital.
OutlookGlobal growth forecasts for 2014 are more positive, which is expected to lead to increased demand for non-life insurance. Premium growth in the emerging markets will likely remain strong, at about the same levels as 2013.
2 100Market size in USD billionsestimated global premium income in 2013
3%Market performanceestimated global premium growth in 2013
Primary non-life
develop their understanding of marine and airline risks, especially with regard to accumulated losses from the same event.
Insurers are also innovating on the product side by offering new or amended types of cover, as well as novel product features. Swiss Re corporate Solutions is promoting aviation safety by discounting insurance for airlines that implement flight training and comprehensive threat mitigation strategies. Room for further technology enhancements is ample (eg, in tracking
16 Swiss Re 2013 Financial Report
FinAnCiAl yeAR | MaRket envIROnMent

Market overviewGlobal non-life reinsurance premiums in 2013 totalled about USD 190 billion, approximately 25% of which came from ceding companies in emerging markets. In general, reinsurance demand depends on the size and capital resources of primary insurance companies, as well as on the risk profile of the insurance products provided.
Market performancethe reinsurance industry exhibited solid premium growth of 4% in 2013. Industry underwriting results were mixed during 2013: a very good first quarter, with a low incidence of large losses and significant reserve releases, followed by a second quarter with high catastrophe losses from tornadoes in the US and floods in Germany, the czech Republic and canada. the third quarter, which is most exposed to north american hurricanes losses, was generally benign. Hailstorms in Germany, however, generated multi-billion dollar insurance losses. the widespread devastation caused by the tropical cyclones that battered Mexico, eastern India and the Philippines was not reflected in the severity of reinsurance claims because of low insurance penetration in these markets. Preliminary data indicate a combined ratio of around 90% for 2013, reflecting a slightly below average natural catastrophe burden and continuing significant releases from prior-year loss reserves.
Reinsurance non-life
190Market size in USD billionsestimated global premium income in 2013
4%Market performanceestimated global premium growth in 2013
as with the primary insurance industry, the investment environment still poses challenges for reinsurance. the industry’s average annualised investment yield has declined to just 3%. the full-year industry Roe is expected to be around 12%, down from 14% in 2012.
the reinsurance industry’s capital base remains strong. any contraction from mark-to-market losses on fixed income securities and dividend payments was largely offset by retained earnings. So-called “alternative capacity” continued to grow, reaching a total of about USD 45 billion at the end of 2013, representing roughly 11% of the global property catastrophe reinsurance market (see box below).
OutlookSignificant pressure on reinsurance pricing and rising retentions of primary insurers were evident at the January 2014 renewals. accordingly, premium growth is expected to slow down and, assuming average catastrophe losses, the reinsurance sector’s overall combined ratio is expected to rise to around 95% in 2014. the industry Roe will trend toward 9%.
Alternative capital
Pension funds, hedge funds and others have been supplying an increasing share of capacity to the global natural catastrophe re/insurance market.
For these providers, catastrophe risk is a diversified asset class that has become relatively more attractive since the financial crisis, after which interest rates fell to historic lows.
through insurance-linked securities and other form of collateralised reinsurance they complement the traditional capacity of re/insurance carriers in certain peak risk markets where margins are comparably high and entry barriers are low.
about 70% of alternative capital is concentrated on the US natural catastrophe market, mostly wind and some earthquake. another 25% is allocated to the european catastrophe market. the remainder is in other markets and perils.
alternative capital operates in commoditised markets and we believe it does not fundamentally threaten Swiss Re’s business model. Swiss Re is a knowledge company that offers tailored solutions, as well as a long track record of partnership and reliability to our clients.
Swiss Re 2013 Financial Report 17
FinAnCiAl yeAR | MaRket envIROnMent
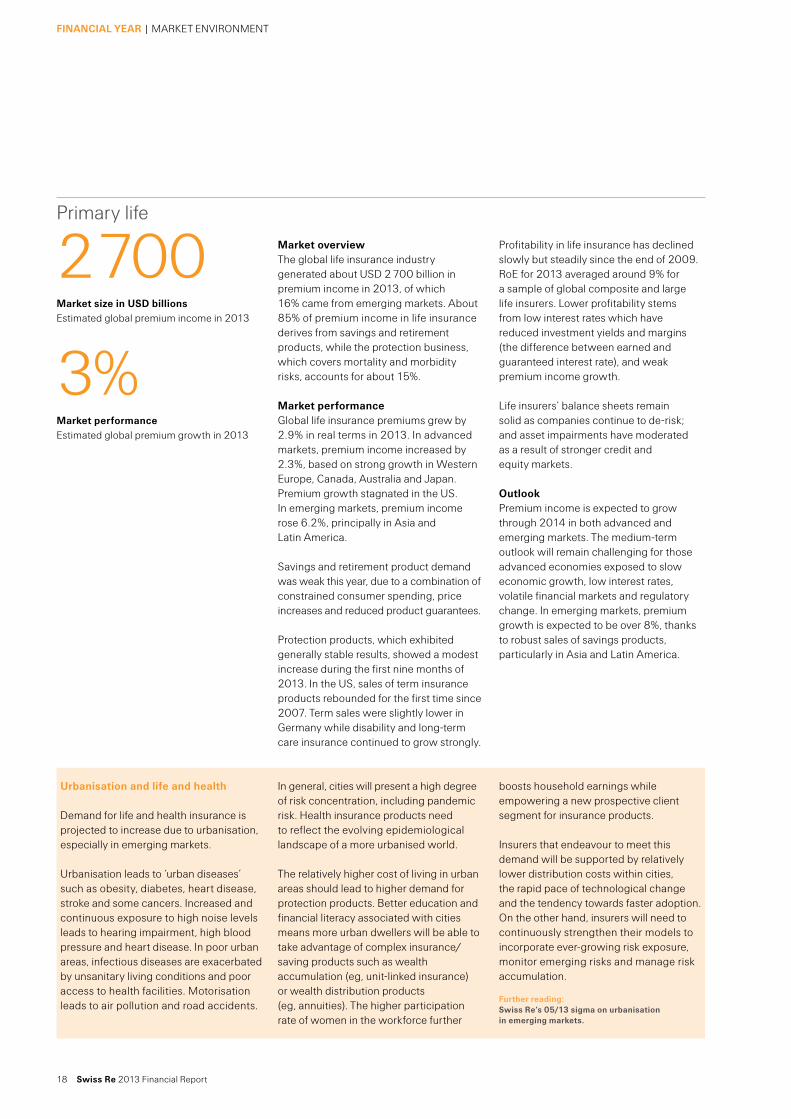
Market overviewthe global life insurance industry generated about USD 2 700 billion in premium income in 2013, of which 16% came from emerging markets. about 85% of premium income in life insurance derives from savings and retirement products, while the protection business, which covers mortality and morbidity risks, accounts for about 15%.
Market performanceGlobal life insurance premiums grew by 2.9% in real terms in 2013. In advanced markets, premium income increased by 2.3%, based on strong growth in Western europe, canada, australia and Japan. Premium growth stagnated in the US. In emerging markets, premium income rose 6.2%, principally in asia and Latin america.
Savings and retirement product demand was weak this year, due to a combination of constrained consumer spending, price increases and reduced product guarantees.
Protection products, which exhibited generally stable results, showed a modest increase during the first nine months of 2013. In the US, sales of term insurance products rebounded for the first time since 2007. term sales were slightly lower in Germany while disability and long-term care insurance continued to grow strongly.
boosts household earnings while empowering a new prospective client segment for insurance products.
Insurers that endeavour to meet this demand will be supported by relatively lower distribution costs within cities, the rapid pace of technological change and the tendency towards faster adoption. On the other hand, insurers will need to continuously strengthen their models to incorporate ever-growing risk exposure, monitor emerging risks and manage risk accumulation.
Further reading: Swiss Re’s 05/13 sigma on urbanisation in emerging markets.
Profitability in life insurance has declined slowly but steadily since the end of 2009. Roe for 2013 averaged around 9% for a sample of global composite and large life insurers. Lower profitability stems from low interest rates which have reduced investment yields and margins (the difference between earned and guaranteed interest rate), and weak premium income growth.
Life insurers’ balance sheets remain solid as companies continue to de-risk; and asset impairments have moderated as a result of stronger credit and equity markets.
OutlookPremium income is expected to grow through 2014 in both advanced and emerging markets. the medium-term outlook will remain challenging for those advanced economies exposed to slow economic growth, low interest rates, volatile financial markets and regulatory change. In emerging markets, premium growth is expected to be over 8%, thanks to robust sales of savings products, particularly in asia and Latin america.
2 700Market size in USD billionsestimated global premium income in 2013
3%Market performanceestimated global premium growth in 2013
Primary life
In general, cities will present a high degree of risk concentration, including pandemic risk. Health insurance products need to reflect the evolving epidemiological landscape of a more urbanised world.
the relatively higher cost of living in urban areas should lead to higher demand for protection products. Better education and financial literacy associated with cities means more urban dwellers will be able to take advantage of complex insurance/saving products such as wealth accumulation (eg, unit-linked insurance) or wealth distribution products (eg, annuities). the higher participation rate of women in the workforce further
Urbanisation and life and health
Demand for life and health insurance is projected to increase due to urbanisation, especially in emerging markets.
Urbanisation leads to ‘urban diseases’ such as obesity, diabetes, heart disease, stroke and some cancers. Increased and continuous exposure to high noise levels leads to hearing impairment, high blood pressure and heart disease. In poor urban areas, infectious diseases are exacerbated by unsanitary living conditions and poor access to health facilities. Motorisation leads to air pollution and road accidents.
18 Swiss Re 2013 Financial Report
FinAnCiAl yeAR | MaRket envIROnMent

Market overviewGlobal life reinsurance premiums were around USD 55 billion in 2013, 70% of which originated in the US, canada and the Uk. ceding companies from emerging markets accounted for 6% of global demand. Life reinsurers are increasingly diversifying away from traditional mortality business.
Market performanceGlobal premiums from traditional life reinsurance covering mortality and morbidity stagnated in 2013. In advanced markets, premiums declined 0.4%, but in emerging markets they were up almost 6.1% based on strong protection sales.
Operating margin in the life reinsurance industry declined to 5% of net premiums earned in 2013, compared with 8% in 2012 and 10% in 2011. this was primarily due to declining investment returns from low interest rates (see box below), but also to deteriorating underwriting results. Underwriting results were adversely affected in particular by increased claims in the australian group disability business, where claims were not only higher, but reinsurers needed to strengthen their claims reserves in anticipation of a significant rise in expected future claims.
Life reinsurance
55Market size in USD billionsestimated global premium income in 2013
0%Market performanceestimated global premium growth in 2013
Outlooktraditional life reinsurance is expected to stagnate in advanced economies over the next few years. cessions will continue to contract in the US and in Uk, but other advanced markets will have moderate growth in line with growth in the primary protection business. In emerging markets, life reinsurance is expected to grow by about 6%–7%. there continues to be considerable pressure on primary life insurers (including regulatory issues, the low interest rate environment and weak economic activity), which could generate further demand for capital solutions and other forms of non-traditional reinsurance.
The interest rate legacy
the forecast increase in interest rates should be a blessing for life insurers. However interest rate increases will not solve all problems. companies roll over only a small fraction of their investment portfolios every year — typically around 10%. Portfolio yields therefore lag changes in bond market yields.
even assuming a gradual increase in interest rates, the average insurer’s portfolio yield may continue to decline for some time. this is because the newly bought bonds have to be compared
against the maturing bonds they’re replacing, which may still have a higher coupon. this would put insurers under increasing pressure to serve long-term guarantees written in the 1990s and early years of the new millennium.
and there is another challenge. Once interest rates rise, the market value of bonds will start to decline. In the same scenario of moderately increasing interest rates, the unrealised gains of the past few years will disappear while unrealised losses will begin to accumulate.
It is important to highlight that this would not impact an economic balance sheet with fully matched assets and liabilities. However, under accounting regimes with book value liabilities (eg, US GaaP), a fairly small loss on the bond portfolio can mean a significant reduction in accounting shareholders’ equity.
Strongly capitalised life reinsurers can offer solutions to cope with stressed accounting balance sheets as we work through the legacy of low interest rates.
Further reading: Swiss Re’s 04/12 sigma on facing the interest rate challenge.
Swiss Re 2013 Financial Report 19
FinAnCiAl yeAR | MaRket envIROnMent

Swiss Re is actively engaged in the global regulatory debate
the IaIS and other regulatory authorities have determined that traditional insurance and reinsurance activities are unlikely to be a source or amplifier of systemic risk. Swiss Re endorses that view.
Swiss Re is well prepared for the upcoming regulatory changes as it already operates in one of the most advanced economic-based solvency regimes (the Swiss Solvency test) and is subject to comprehensive group supervision under an active college of Supervisors chaired by the Swiss Financial Market Supervisory authority FInMa. Swiss Re is concerned, however, that the ongoing regulatory reforms are overly focused on the size and interconnectedness of re/insurance groups, which undermines the essential idea of insurance: benefiting from risk pooling and global diversification to better manage risks.
FInancIaL StaBILItY
in July 2013, the international Association of insurance Supervisors (iAiS) and Financial Stability Board (FSB) announced a list of nine primary insurance groups considered global systemically important insurers (G-Siis). The designation of reinsurers has been delayed to July 2014.
the initiative to identify and designate global systemically important financial institutions (G-SIFIs) is led by the FSB under the authority of the G20. the FSB designates financial institutions that it considers to be large, complex and interconnected enough to disrupt the global financial system if they came into financial distress.
the IaIS is developing a specific set of policy measures to be applied to G-SIIs. the main aspects of the policy measures consist of three pillars (see below).
Highlights of iAiS policy measures for global systemically important insurers (G-Siis):
enhanced supervision effective resolution Higher loss absorption (HlA)
Group-wide supervisory framework
arrangements to deal with liquidity risk management
Systemic Risk Management Plan
establishment of a crisis Management Group (cMG)
Development of a recovery and resolution plan (RRP)
carrying out resolvability assessments
Institution-specific cross-border cooperation agreements
Basic capital requirements (BcR) for G-SIIs
High Loss absorption (HLa) capacity on non-traditional and non-insurance activities
Insurance capital standard (IcS) for all international active insurance groups
20 Swiss Re 2013 Financial Report
FinAnCiAl yeAR

a strategy for applying our strong combination of capital, knowledge and brand
new entrants in primary insurance will offer substantial partnership opportunities. telecommunications and technology companies are already starting to enter primary insurance markets. these new entrants have access to a large customer base and interact with their customers frequently. Swiss Re is watching developments in this area and discussing strategic opportunities.
Margin pressure as a result of alternative capital is counteracted by continued strong growth of natural catastrophe pools. competition in natural catastrophe reinsurance is expected to become fiercer as capital markets investors expand. Swiss Re is actively pursuing multiple actions to mitigate the economic impact of market softening. at the same time, Swiss Re is actively engaging governments, nGOs, and traditional insurers to extend catastrophe insurance to segments which have not historically been covered.
Going forward and taking these major strategic themes into account, we aim to apply our strong combination of capital, knowledge and brand to be the leading player across diversified re/insurance risks and businesses.
GROUP StRateGY
Swiss Re’s strategy remained unchanged in 2013. We aim to outperform our peers in Reinsurance and Admin Re®, as well as in our balanced asset management approach. We aim for a sustainable expansion in Corporate Solutions as well as in high growth markets and in funding longer lives and health. Our focus in 2014 will be on continuing to execute on this strategy and delivering on the previously communicated 2011–2015 financial targets.
In this context we have identified a series of important developments affecting the re/insurance world that are likely to influence our strategy over the mid-term.
We see four in particular:
High growth markets will drive demand for re/insurance products. We estimate that by 2020 up to 45% of new re/insurance business premiums will be generated in high growth markets. Swiss Re already has solid positions in many of these markets and aims to expand them, both in Reinsurance and corporate Solutions. these endeavours have been and will be complemented by selected investments in insurance or insurance-related businesses in these markets.
’Big data & smart analytics’ will change the way of insurance underwriting, costing, pricing and marketing. the ability to gather and process information is profoundly altering the business landscape. this process will not stop at the insurance sector. We aim to turn big data & smart analytics into a source of competitive advantage and an essential part of our value proposition to our customers. Swiss Re has launched a number of pilot projects to test practical applications with our clients.
Swiss Re 2013 Financial Report 21
FinAnCiAl yeAR

GROUP ReSULtS
Swiss Re reported net income of USD 4.4 billion for 2013, compared to net income of USD 4.2 billion in 2012. earnings per share were CHF 12.04 or USD 12.97, compared to CHF 11.13 (USD 11.85) in 2012.
the Group results in 2013 reflected a very good underwriting result along with favourable prior-year reserve development, investment gains and one-time tax benefits.
net income for Reinsurance was USD 3.6 billion compared to USD 3.7 billion in 2012. Property & casualty accounted for USD 3.3 billion (compared to USD 3.0 billion in 2012), while Life & Health accounted for USD 356 million, compared to USD 739 million in 2012. In 2013 a lower investment result and reserve strengthening for group disability business in australia were largely offset by one-time tax benefits.
corporate Solutions delivered net income of USD 279 million compared to USD 196 million in 2012. 2013 reflected continued profitable growth.
admin Re® reported net income of USD 423 million compared to USD 183 million in 2012. the 2013 result was due to a better investment performance and the positive effect of changes in Uk tax. the 2012 result included a USD 399 million loss relating to the sale of the admin Re® US business.
the Group combined ratio was 85.3% in 2013, compared to a combined ratio of 83.1% in 2012. the 2013 result was driven by higher natural catastrophe losses, although lower than expected, and higher man-made losses, partially offset by positive development on prior-year reserves.
Return on investments was 3.6%, compared to 4.0% for 2012, with the difference mainly attributable to lower realised gains in the current year.
Shareholders’ equity decreased to USD 33.0 billion at the end of 2013 from USD 34.0 billion at the end of 2012 reflecting the ordinary and special dividends to shareholders and unrealised losses on investments driven by increasing interest rates, partially offset by the strong net income for the year. Return on equity was 13.7% for 2013 compared to 13.4% for 2012.
Book value per common share decreased to USD 93.08 or cHF 82.76 at the end of 2013, compared to USD 95.87 or cHF 87.76 at the end of 2012. Book value per common share is based on common shareholders’ equity and excludes non-controlling interests and the impact of contingent capital instruments.
For information on segment shareholders’ equity, please see pages 212 to 213.
2013 operating performancePremiums earned for Property & casualty Reinsurance were USD 14.5 billion or 18% higher compared to 2012, mainly driven by the expiry of a quota share retrocession agreement at the end of 2012 and new business written in the americas. Life & Health Reinsurance premiums and fees increased by 10%, primarily driven by the business recaptured in the first quarter of 2013, rate increases in the yearly-renewable term business, growth in health premiums in europe and new business in asia.
corporate Solutions premiums earned increased 28% to USD 2.9 billion, reflecting organic growth across most lines of business and the expiry of the quota share retrocession agreement mentioned above.
very strong net income of USD 4.4 billion driven by strong underwriting; all Business Units contribute
22 Swiss Re 2013 Financial Report
FinAnCiAl yeAR

Net premiums earned in 2013 by segment
50% P & C Re
35% L & H Re
10% Corporate Solutions
5% Admin Re
Net premiums earned in 2013 by segment
50% P & C Re
35% L & H Re
10% Corporate Solutions
5% Admin Re
net premiums and fees earned by Business Unit, 2013(total: USD 28.8 billion)
50% P & c Reinsurance 35% L & H Reinsurance 10% corporate Solutions 5% admin Re®
the Group’s non-participating net investment income decreased to USD 3.9 billion, compared to USD 4.5 billion in 2012, largely driven by the impact of the sale of the admin Re® US business in 2012. the Group running yield was 3.2% in 2013, in line with the prior year.
the Group reported non-participating net realised investment gains of USD 766 million in 2013, mainly as a result of gains from the sale of investments related to the re-balancing of the investment portfolio and active management of the listed equity portfolio. this compares to USD 947 million in the prior year, which included significantly higher realised gains from the sale of government bonds offset by losses related to the sale of the admin Re® US business.
the Property & casualty Reinsurance combined ratio was 83.3% compared to 80.7% in 2012. the ratio increased due to higher man-made losses and lower net reserve releases from prior years.
the corporate Solutions combined ratio for 2013 was 95.1% compared to 96.2% in 2012, mainly driven by continued profitable growth across most lines of business and lower natural catastrophe losses. Both periods benefited from positive prior-year development.
Life & Health Reinsurance benefits increased 19% to USD 8.1 billion over 2012 reflecting higher business volumes, the impact of business recaptured in the first quarter of 2013 and reserve strengthening for australian group disability business. the operating margin was 5.2% in 2013 compared to 8.6% for 2012, and the decrease was primarily due to the items mentioned above.
Return credited to policyholders reflected the investment performance on the underlying assets, mainly backing unit-linked and with-profit policies, which are passed through to policyholders. In 2013, an investment gain of USD 3.7 billion was passed through to policyholders compared to a gain of USD 3.0 billion in the prior year.
acquisition costs for the Group increased to USD 4.9 billion reflecting higher business volumes and the impact of the recapture of retrocessions.
administrative expenses were USD 3.2 billion, 8% higher than in the prior year mainly due to the implementation of strategic growth initiatives. Other expenses were USD 349 million.
Interest expenses were USD 760 million, 3% higher when compared to 2012.
the Group reported a tax expense of USD 312 million on a pre-tax income of USD 4.8 billion in 2013, compared to an expense of USD 1.1 billion on a pre-tax income of USD 5.5 billion for 2012. this translates into an effective tax rate in the current and prior-year reporting periods of 6.5% and 20.4%, respectively. the particularly low effective tax rate in the current year mainly reflects the conclusion of audits, rulings and revised tax opinions and the enactment of lower tax rates and the transition to a new tax regime in the Uk.
Swiss Re 2013 Financial Report 23
FinAnCiAl yeAR | GROUP ReSULtS

StrategySwiss Re continued to move its asset allocation in 2013 within its mid-term plan, in line with an economic outlook of improving but moderate global growth. the now completed portfolio re-balancing mainly saw additions of higher quality credit exposure and, to a lesser extent, allocation to listed equities. Swiss Re also established a short duration position in anticipation of higher interest rates. the net impact was a reduction in government bonds and an increase in corporate bonds, where we are now close to the upper end of the mid-term plan’s range. the equity allocation also increased, including the contribution from Principal Investments. Principal Investments is managed in line with Swiss Re’s high growth markets strategy and the mid-term plan.
Financial markets overview for 2013 Systemic risks receded in 2013 in part due to the continued accommodative stance of central banks. the Bank of Japan introduced inflation targeting and a “US Fed-style” quantitative monetary easing. Positive steps were also taken in europe with progress on the eU banking union front. Starting from the second quarter, policies and politics were the key market drivers, ranging from elections in Italy and Germany to the bailout of cyprus, the debt ceiling debate, expectations of “tapering” of asset purchases in the US and reform announcements in china. Market risk appetite generally improved over 2013, as US growth continued to recover and the euro area exited recession in the third quarter. Despite the concern of a “hard landing” in mid-year, china’s growth remained stable at around 7.5% in 2013.
equities in developed markets were the best performers in 2013, helped by a moderate growth recovery and abundant liquidity. Meanwhile, volatility in the US treasury market picked up. Having reached a low of 1.63% in May, US 10-year treasury yields rose to a high of 3% in September due to “tapering” expectations of asset purchases in the US. credit spreads also widened in the second quarter before falling again to offset some of the rise in US treasury yields.
investment resultthe size of the Group’s investment portfolio, excluding unit-linked and with-profit investments, decreased to USD 130.1 billion at the end of December 2013 compared to USD 137.4 billion at the end of December 2012. the decrease was largely due to a reduction in unrealised gains stemming from higher interest rates, the effect of which was partially offset by the impact of tighter credit spreads and rising equity values in 2013.
the return on investments for 2013 was 3.6% compared to 4.0% in 2012, with the difference mainly attributable to lower realised gains in 2013. excluding the impact of foreign exchange movements, the return on investments was 3.6% in 2013 compared to 4.2% in 2012.
the Group’s non-participating net investment income decreased to USD 3.9 billion in 2013 compared to USD 4.5 billion in 2012, mostly driven by the impact of the sale of the admin Re® US business in 2012. the re-balancing of the investment portfolio across the Group helped offset the overall impact of lower reinvestment rates. On a full-year basis, the Group running yield of 3.2% was in line with 2012.
the Group reported non-participating net realised investment gains of USD 766 million in 2013, mainly as a result of gains from the sale of investments related to the re-balancing of the investment portfolio as well as from active management of the listed equity portfolio. this compares to USD 947 million in 2012, which included significantly higher realised gains in the investment portfolio offset by losses related to the sale of the admin Re® US business.
the total return on investments in 2013 was –0.1% as market value losses arising from higher interest rates were partially offset by credit spread tightening and a rise in equity values.
OutlookWe expect moderate growth recovery in global markets, with sustainable growth in the US set to continue. a disciplined “top-down” investment strategy continues to be warranted as the progress of economic repair is likely to be slow and accident-prone. this includes policy errors, the reform process in china and eU debt crisis as the key risk factors to monitor.
Group investments
3.9net investment income in USD billions, 2013
3.6%Group return on investments2013
24 Swiss Re 2013 Financial Report
FinAnCiAl yeAR | GROUP ReSULtS

Long-term investors are important to the global economic recovery, especially in an environment of high public deficits and volatile financial markets. the re/insurance sector is well-suited to take part in that recovery given its business model and liability structure as well as its USD 24 trillion in assets in the OecD (see chart 1).
as illustrated in chart 2, current global infrastructure spending is estimated at USD 2.6 trillion, whereas by 2030 financing needs are projected to be over USD 4 trillion. Re/insurers can help mitigate this emerging financing gap. Given that re/insurers’ liabilities are long-term, they are well placed to make investments in transport, water, energy and communications.
In order for this to happen, the investment and regulatory environment needs to be more supportive of long-term investing. In particular regulatory incentives (ie capital charges for longer-term assets) need to be aligned, policy uncertainty needs to be minimised, and appropriate financial market instruments need to be available. taking appropriate action to develop the supporting framework is key to increase the potential investment appetite and capacity of re/insurers as long-term investors.
Facilitating infrastructure investmentBank loans continue to be the predominant instrument for financing infrastructure and related projects. changes in bank regulation and capital rules, however, are making this business less attractive to the banking sector.
Infrastructure loans/debt meet several institutional investor needs, such as regular cash flows, attractive risk-adjusted yields, and generally lower default risk beyond the construction phase. the high credit quality of infrastructure debt has been largely demonstrated in the Moody’s report on infrastructure default and recovery rates1.
Insurance companies as long-term investors: opportunity for the real economy
– Investment funds – Insurance companies – Pension funds – Other
Source: G20/OecD, 2013
0
5
10
15
20
25
30
Pension fundsInsurance companiesInvestment funds Other
201120092007200520032001199919971995
USD trillion
Source: G20/OECD, 2013
Chart 1: Total assets by institutional investors in the OeCD (in USD trn)
Standardising financial instruments for infrastructure project investing could potentially attract more institutional investors. current infrastructure financing deals are complex, often involve a syndicate of banks and have relatively low investment ratings. Furthermore, no generally accepted benchmark is yet available for this asset class. efforts such as the World Bank’s Global Infrastructure Facility, the FSB Monitoring of regulatory impacts on long-term investing and the eU/eIB Project Bond initiative have all been undertaken in recognition of the importance of long-term investment for the real economy. coordination and concrete implementation of initiatives is needed on a global level.
Swiss Re remains engaged in public consultations with policymakers to unlock the potential of long-term investors for growth.
In infrastructure financing, the efforts should ultimately be geared towards creating an asset class with all its desired features. to this end, standardisation and a more supportive regulatory stance could help narrow the financing gap. In europe, a tradable and harmonised “Pan-european Project Bond”, which would build on the
1 “Infrastructure Default and Recovery Rates, 1983–2012H1”, December 2012
eU/eIB project bond initiative and integrate a pool structure as well as enhance the financing capacity by partnering with the re/insurance sector, could be one possible model to meet the challenges ahead.
RoW
Asia & Pacific
North America
EU
Est. financeneeds by 2030
Actual infrastructurespending (est. 2013)
RoW
Asia & Pacific
North America
EU
Total USD 4.3tmTotal USD 2.6tm
1.59
1.40
0.63
0.670.480.45
0.78
0.90
Chart 2: Annual infrastructure spending vs. needs
Source: Swiss Re, Mckinsey, Dealogic, IMF, OecD, aSce. Global infrastructure spending expected to grow at 3% p.a. to reach total of USD 60trn through 2030
total USD 2.6trn total USD 4.3trn
actual infrastructure spending (est. 2013)
est. finance needs by 2030
RoW asia & Pacific north america eU
Swiss Re 2013 Financial Report 25
FinAnCiAl yeAR | GROUP ReSULtS

SUMMaRY OF FInancIaL StateMentS
Changes in equityUSD millions 2012 2013 change in %
total shareholders’ equity as of 1 January 29 590 34 002 15net income attributable to common shareholders 4 201 4 444 6change in unrealised gains/losses on securities, net 184 –2 785 –change in other-than-temporary impairment, net of tax 90 22 –76change in foreign currency translation 332 –288 –Dividends –1 134 –2 760 143contingent capital instruments 1 102 0 –Purchase/sale of treasury shares and shares issued under employee plans –11 –102 –Other changes in equity –352 419 –Total shareholders’ equity as of 31 December 34 002 32 952 –3non-controlling interests 24 25 4Total equity as of 31 December 34 026 32 977 –3
income statementUSD millions 2012 2013 change in %
RevenuesPremiums earned 24 661 28 276 15Fee income from policyholders 785 542 –31net investment income – non-participating 4 473 3 947 –12net realised investment gains/losses – non-participating 947 766 –19net investment result – unit-linked and with-profit 2 570 3 347 30Other revenues 188 24 –87Total revenues 33 624 36 902 10
expensesclaims and claim adjustment expenses –7 763 –9 655 24Life and health benefits –8 878 –9 581 8Return credited to policyholders –2 959 –3 678 24acquisition costs –4 548 –4 895 8administrative expenses –2 917 –3 159 8Other expenses –300 –349 16Interest expenses –736 –760 3Total expenses –28 101 –32 077 14
income before income tax expense 5 523 4 825 –13Income tax expense –1 125 –312 –72net income before attribution of non-controlling interests 4 398 4 513 3
Income attributable to non-controlling interests –141 –2 –99net income after attribution of non-controlling interests 4 257 4 511 6
Interest on contingent capital instruments –56 –67 20net income attributable to common shareholders 4 201 4 444 6
26 Swiss Re 2013 Financial Report
FinAnCiAl yeAR

Summary balance sheetUSD millions 2012 2013 change in %
AssetsinvestmentsFixed income securities 88 848 79 296 –11equity securities 3 774 7 691 104Policy loans, mortgages and other loans 2 299 2 895 26Investment real estate 777 825 6Short-term investments, at amortised cost which approximates fair value 18 645 20 989 13Other invested assets 12 968 11 164 –14Investments for unit-linked and with-profit business 25 501 27 215 7Total investments 152 812 150 075 –2cash and cash equivalents 10 837 8 072 –26Reinsurance assets 34 883 33 003 –5Deferred acquisition costs and other intangible assets 7 062 8 293 17Goodwill 4 092 4 109 0Other assets 11 817 9 968 –16Total assets 221 503 213 520 –4
liabilities and equityUnpaid claims and claim adjustment expenses 63 670 61 484 –3Liabilities for life and health policy benefits 36 117 36 033 0Policyholder account balances 29 349 31 177 6Unearned premiums 9 384 10 334 10Funds held under reinsurance treaties 3 642 3 551 –2Reinsurance balances payable 3 754 2 370 –37Income taxes payable 604 660 9Deferred and other non-current taxes 9 442 8 242 –13Short-term debt 3 612 3 818 6accrued expenses and other liabilities 11 617 8 152 –30Long-term debt 16 286 14 722 –10Total liabilities 187 477 180 543 –4Total shareholders’ equity 34 002 32 952 –3non-controlling interests 24 25 4Total equity 34 026 32 977 –3Total liabilities and equity 221 503 213 520 –4
Swiss Re 2013 Financial Report 27
FinAnCiAl yeAR | SUMMaRY OF FInancIaL StateMentS

ReInSURance
Strategy and priorities Our Reinsurance strategy is to achieve excellence in our core business, continuously improve the value provided by our products and services, and expand selectively in target areas.
excellence in our core businesses relies on underwriting as a key differentiator, based on cycle management and portfolio steering. this includes the steering of peak perils, our risk transformation capabilities, and research and development. In property, an in-house research team develops and maintains proprietary models for storm, earthquake and flood. In casualty, we are developing an equivalent forward looking model based on a systematic assessment of risk drivers. In Life & Health, our mortality experience data allows us to better quantify the underlying risk.
Our key value drivers are large capacity, technical expertise and the ability to develop tailored solutions to meet clients’ needs, for example in the area of solvency relief. In addition we have a market-leading position in transferring both property and life risks to the capital markets.
We continue to see growth opportunities in health and high growth markets, particularly in the focus countries china, India, Indonesia, Brazil and Mexico, as well as Sub-Saharan africa. We are continuing to build our footprint in these markets through a combination of organic growth and direct investment, and building expertise by hiring and developing local talent.
Reinsurance consists of two segments, Property & casualty and Life & Health. the Business Unit operates globally, both through brokers and directly with clients, and provides a large range of solutions for risk and capital management.
28 Swiss Re 2013 Financial Report
FinAnCiAl yeAR

Property & CasualtyWe believe that active cycle management and positioning as a knowledge company is likely to be key to success for Property & casualty Reinsurance (P&c) in the current market environment. We aim to maintain earnings quality through disciplined underwriting and superior service. Our product offerings go beyond pure capacity, with customised solutions that complement traditional reinsurance. We believe this approach differentiates Swiss Re from pure capacity providers.
natural catastrophe prices are still attractive, though reduced. Over 2013 we were able to defend our leading position by deploying more capacity while maintaining absolute earnings at attractive economic profit margins. Property and specialty continued to contribute significantly to overall reinsurance earnings. casualty price levels are softer overall, though improving in some markets. In all segments we will continue to focus on tailored solutions for clients, which in 2013 allowed us to put our capital to use at differentiated terms and conditions.
capturing opportunities in growth markets remained a key priority across all P&c business lines in 2013. as part of the high growth market strategy implementation, we strengthened expertise by adding to our local underwriting and client management staff in asia and Latin america. We expect that this will enable us to deliver superior service to our existing clients and build new relationships.
life & Healththe environment for Life & Health Reinsurance (L&H) continued to be challenging in 2013, with low yields pressuring reinvestment rates and investment income. In addition, clients in mature markets are retaining more protection risks due to the diversification benefits recognised in economic solvency models. Most in-force portfolios are performing in line with or above expectations, although the performance of a few in-force books — in particular US pre-2004 individual life business and australia group disability income portfolios — has negatively impacted US GaaP profits and Roe. Management is committed to improving the performance of these portfolios and (combined with other initiatives on asset and capital management) to delivering 10%–12% Roe by 2015.
We believe L&H is strategically attractive. It is an integral part of Swiss Re’s business model. L&H adds to the profits and diversification of the Group, enhances the value proposition to core clients and represents an attractive growth opportunity.
L&H saw increased underlying demand in high growth markets in 2013, particularly in health. there were also a number of important large transactions in developed markets. One example of Swiss Re’s expertise in health was a very large in-force transaction with a major client. this was won thanks to an extraordinary effort of a highly dedicated team of Swiss Re experts across four countries and three continents. this deal is expected to contribute substantially to our revenues and earnings for many years.
Swiss Re offers a variety of life and health reinsurance solutions to help close the global protection gap. Due to our recognised expertise, strong balance sheet, excellent track record and dedicated teams, we believe Swiss Re is the ideal partner for product development, large capital-driven transactions, longevity deals and structured solutions tailored to client needs.
OutlookWe believe that we are well positioned to capture the market opportunities ahead of us. We expect that our capitalisation will allow for continued business growth and the payment of dividends to the holding company.
We expect natural catastrophe business to grow globally. Despite an increase in alternative capacity, particularly in the US, we believe we will continue to achieve attractive returns on the property business we write. We also see growth opportunities in casualty. In L&H we will continue to actively manage our in-force book to increase profitability and develop new solutions to grow in both mature and developing markets.
Swiss Re 2013 Financial Report 29
FinAnCiAl yeAR | ReInSURance
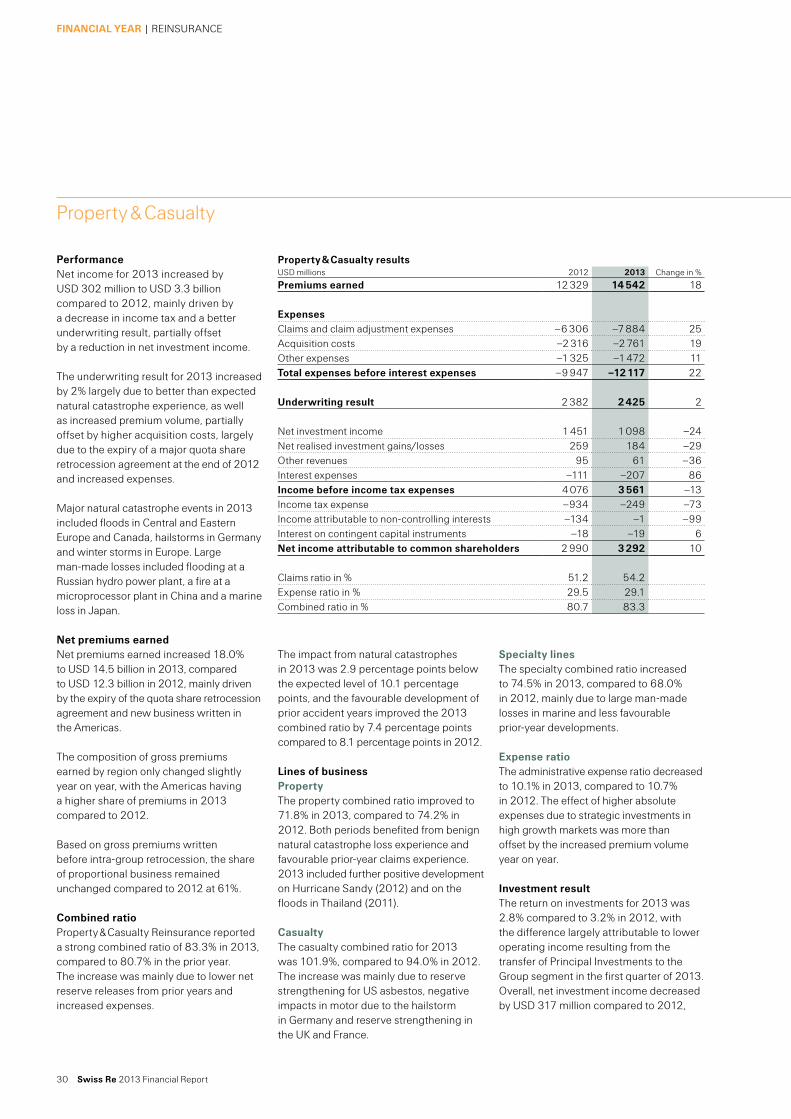
Performancenet income for 2013 increased by USD 302 million to USD 3.3 billion compared to 2012, mainly driven by a decrease in income tax and a better underwriting result, partially offset by a reduction in net investment income.
the underwriting result for 2013 increased by 2% largely due to better than expected natural catastrophe experience, as well as increased premium volume, partially offset by higher acquisition costs, largely due to the expiry of a major quota share retrocession agreement at the end of 2012 and increased expenses.
Major natural catastrophe events in 2013 included floods in central and eastern europe and canada, hailstorms in Germany and winter storms in europe. Large man-made losses included flooding at a Russian hydro power plant, a fire at a microprocessor plant in china and a marine loss in Japan.
net premiums earnednet premiums earned increased 18.0% to USD 14.5 billion in 2013, compared to USD 12.3 billion in 2012, mainly driven by the expiry of the quota share retrocession agreement and new business written in the americas.
the composition of gross premiums earned by region only changed slightly year on year, with the americas having a higher share of premiums in 2013 compared to 2012.
Based on gross premiums written before intra-group retrocession, the share of proportional business remained unchanged compared to 2012 at 61%.
Combined ratioProperty & casualty Reinsurance reported a strong combined ratio of 83.3% in 2013, compared to 80.7% in the prior year. the increase was mainly due to lower net reserve releases from prior years and increased expenses.
Specialty lines the specialty combined ratio increased to 74.5% in 2013, compared to 68.0% in 2012, mainly due to large man-made losses in marine and less favourable prior-year developments.
expense ratiothe administrative expense ratio decreased to 10.1% in 2013, compared to 10.7% in 2012. the effect of higher absolute expenses due to strategic investments in high growth markets was more than offset by the increased premium volume year on year.
investment resultthe return on investments for 2013 was 2.8% compared to 3.2% in 2012, with the difference largely attributable to lower operating income resulting from the transfer of Principal Investments to the Group segment in the first quarter of 2013. Overall, net investment income decreased by USD 317 million compared to 2012,
the impact from natural catastrophes in 2013 was 2.9 percentage points below the expected level of 10.1 percentage points, and the favourable development of prior accident years improved the 2013 combined ratio by 7.4 percentage points compared to 8.1 percentage points in 2012.
lines of businessProperty the property combined ratio improved to 71.8% in 2013, compared to 74.2% in 2012. Both periods benefited from benign natural catastrophe loss experience and favourable prior-year claims experience. 2013 included further positive development on Hurricane Sandy (2012) and on the floods in thailand (2011).
Casualtythe casualty combined ratio for 2013 was 101.9%, compared to 94.0% in 2012. the increase was mainly due to reserve strengthening for US asbestos, negative impacts in motor due to the hailstorm in Germany and reserve strengthening in the Uk and France.
Property & casualty
Property & Casualty resultsUSD millions 2012 2013 change in %
Premiums earned 12 329 14 542 18
expensesclaims and claim adjustment expenses –6 306 –7 884 25acquisition costs –2 316 –2 761 19Other expenses –1 325 –1 472 11Total expenses before interest expenses –9 947 –12 117 22
Underwriting result 2 382 2 425 2
net investment income 1 451 1 098 –24net realised investment gains/losses 259 184 –29Other revenues 95 61 –36Interest expenses –111 –207 86income before income tax expenses 4 076 3 561 –13Income tax expense –934 –249 –73Income attributable to non-controlling interests –134 –1 –99Interest on contingent capital instruments –18 –19 6net income attributable to common shareholders 2 990 3 292 10
claims ratio in % 51.2 54.2expense ratio in % 29.5 29.1combined ratio in % 80.7 83.3
30 Swiss Re 2013 Financial Report
FinAnCiAl yeAR | ReInSURance

with most of the reduction due to lower mark-to-market gains on private equity investments, also due in part to the shift of Principal Investments to the Group.
the re-balancing of the portfolio contributed to a positive total return of 1.3%, despite higher interest rates. Specifically, increases in equities and alternative investments as well as the impact of the short duration position offset the reduction in net unrealised gains on fixed income securities. the transition from government bonds to corporate bonds also positively impacted total return.
Investment-related net realised gains were USD 380 million in 2013, mainly as a result of gains from the sale of government bonds related to the re-balancing of the investment portfolio, active management of the listed equity portfolio and the sale of real estate, partially offset by unfavourable movements in foreign exchange remeasurement. this compared to USD 384 million in 2012.
Return on equity the return on equity for 2013 was 26.4%, compared to 26.7% in 2012. the decrease was mainly driven by an increase in net income that was more than offset by the impact of increasing average shareholders’ equity. total equity for the business segment increased to USD 13.3 billion in 2013 from USD 12.4 billion in 2012. Foreign currency translation gains were more than offset by an increase in dividends and net unrealised losses.
Outlook Other than loss-affected layers, natural catastrophe reinsurance rates are softening significantly for all regions due to the strong supply of traditional and alternative capacity in the market. casualty rates are generally softening with the exception of Latin america, where rates are stable, and weather-affected motor rates, where there are some increases. Most proportional covers experienced flat to small commission increases for P&c. Our superior risk selection remains a key value driver in this environment.
48% Property
37% Casualty
15% Specialty
Premiums earned by line of business, 2013
48% Property
37% Casualty
15% Specialty
Premiums earned by line of business, 2013
Regional and national insurers
Premiums earned by line of business, 2013(total USD 14.5 billion)
48% Property 37% casualty 15% Specialty
Regional and national clients provide us with a buffer against volatility and play an important role in our growth aspirations.
the Regional & national (R&n) client segment, comprised of insurers that focus on a specific geography or niche, has long been the bedrock of the P&c portfolio. the large number of comparably smaller companies within our R&n client portfolio provides us with a buffer from the volatility inherent in the reinsurance industry. additionally, the diversity of clients and their needs means we can provide innovative solutions and further build competitive advantage.
the R&n segment also plays an important role in our growth aspirations. Opportunity is significant in all geographies, with the US standing out as the largest R&n market. Growth will be driven by deepening relationships with existing clients and increasing opportunities for transactions with new clients.
Some of the longest-standing partnerships in our history are with R&n clients, and many relationships with our larger clients have their roots in this segment. R&n clients value us as a stable source of capital, technical expertise and broad market insight, and the fact that we are well positioned to rapidly provide expertise and tailored solutions, such as large multi-year transactions, sets us apart in the market.
We will achieve our goals with R&n clients by further increasing ease of doing business, providing the flexibility and timely service they require, and demonstrating our long-term commitment to them.
Swiss Re 2013 Financial Report 31
FinAnCiAl yeAR | ReInSURance

Performancenet income was USD 356 million for 2013, compared to USD 739 million for 2012. the reduction was primarily due to a large reserve addition of USD 369 million for australian group disability business, the impact of business recaptured in the first quarter of 2013 and lower realised gains, partly offset by one-time tax benefits and lower interest expense from capital structure optimisation in 2013.
Operating income was USD 592 million for 2013 compared to USD 885 million for 2012. excluding the impact of reserve strengthening for the australian group disability business, operating income in 2013 was higher due to more favourable experience on variable annuities and the pre-2004 guaranteed minimum death benefit (GMDB) business. In addition, the pre-2004 US individual life business gradually improved and asset re-balancing resulted in higher investment income.
Operating income is calculated as a net of total revenues (before non-participating realised gains/losses) and total expenses before interest expenses.
Premiums earned and fee income Premiums earned and fee income increased 9.9% to USD 10.0 billion for 2013, compared to USD 9.1 billion for 2012. the increase was primarily driven by the business recaptured in the first quarter of 2013, rate increases in the yearly-renewable term business in the US and higher health premiums in europe and asia, including a new large health transaction in asia.
Operating margin the operating margin was 5.2% for 2013 compared to 8.6% for 2012. the decrease was primarily due to reserve strengthening for the australian group disability business and the adverse performance of the US individual life business recaptured in the first quarter of 2013.
Operating margin is calculated as operating income divided by total operating revenues. total operating revenues are
Operating income for the Health segment declined 55.1% to USD 211 million for 2013, compared to USD 470 million for 2012. this was primarily driven by the reserve strengthening in the australian group disability business, partially offset by less unfavourable morbidity experience in 2013.
investment resultthe return on investments for 2013 was 4.1%, compared to 4.7% in 2012, reflecting a reduction in the investment result of USD 216 million, mainly driven by lower realised gains from the sales of government bonds as compared to 2012. net investment income improved by USD 107 million, largely driven by the re-balancing of the portfolio into additional corporate bonds and loans as well as some equity and alternative investment exposure.
total revenues excluding unit-linked and with-profit revenues and non-participating realised gains/losses.
expense ratiothe management expense ratio increased marginally to 8.3%, compared to 7.9% in 2012, reflecting higher expenses for growth initiatives.
lines of businessOperating income for the Life segment declined 8.2% to USD 381 million for 2013, compared to an income of USD 415 million in 2012. the lower result in 2013 was driven primarily by the business recaptured in the first quarter of 2013 and by mortality experience which was less favourable than expected in 2013 as compared to 2012. this was mostly offset by year-on-year favourable experience on variable annuities and the pre-2004 GMDB business, the positive impact from recaptures in europe and the gradually improving but still unfavourable pre-2004 US individual life results.
Life & Health
life & Health resultsUSD millions 2012 2013 change in %
RevenuesPremiums earned 9 050 9 967 10Fee income from policyholders 72 56 –22net investment income – non-participating 1 365 1 442 6net realised investment gains/losses – non-participating 562 269 –52net investment result – unit-linked and with-profit 222 249 12Other revenues 1 0 –Total revenues 11 272 11 983 6
expensesLife and health benefits –6 787 –8 075 19Return credited to policyholders –271 –286 6acquisition costs –1 787 –1 698 –5Other expenses –1 419 –1 490 5Total expenses –10 264 –11 549 13
income before income tax expenses 1 008 434 –57Income tax expense –231 –30 –87Interest on contingent capital instruments –38 –48 26net income attributable to common shareholders 739 356 –52
Management expense ratio in % 7.9 8.3Operating margin in % 8.6 5.2
32 Swiss Re 2013 Financial Report
FinAnCiAl yeAR | ReInSURance

Investment-related net realised gains were USD 386 million in 2013, mainly from mark-to-market gains on hedging positions and favourable movements in foreign exchange remeasurement. this compared to USD 709 million in 2012.
the total return was –1.5%, primarily due to interest rate increases, the effects of which are more pronounced in L&H due to the longer duration of the fixed income portfolio.
Shareholders’ equityReturn on equity was 5.4% for 2013 compared to 8.9% in 2012.
Shareholders’ equity declined to USD 6.2 billion as of 31 December 2013 from USD 8.3 billion as of 31 December 2012, mainly due to dividends of USD 966 million being paid to Group and a USD 1.4 billion increase in unrealised losses on available for sale securities, partially offset by net income.
OutlookGrowth in the traditional life business is expected to be muted as cession rates are expected to decrease as primary insurers retain more risk. the low interest rate environment will continue to have an unfavourable impact on the growth of long-term life business for our cedants.
We will continue to write new business at attractive rates, including through large transactions. Swiss Re aims to offer solutions and services in several attractive, growing markets where major demographic and socioeconomic trends are leading to increased demand for health insurance, including in asia. We experienced difficulties in our australian group disability business and have initiated changes in our pricing and product design to mitigate similar issues on future sales.
the new L&H business management team is focused on proactively managing the in-force business in order to improve profitability. Good progress is being made on actions outlined at the Investors’ Day in June 2013 and we expect the implementation of these strategies to begin to materialise in 2014.
0
2000
4000
6000
8000
10000
20132012
2874
6176 6678
3289
0
2000
4000
6000
8000
10000
20132012
2874
6176 6678
3289
Premiums earned by l&H segment, 2012–2013(USD millions)
Life Health
Life and health in high growth markets
analysis of the protection gap — the difference between the protection needed and the protection in place to maintain the living standards of dependents in the event of the death of the primary breadwinner — demonstrates that under-insurance is a massive global issue. this is particularly true in high growth markets. a Swiss Re study of eight markets in Latin america revealed a combined protection gap of USD 7.2 trillion (equivalent to 138% of GDP). In many cases the protection gap is even widening. In Brazil the gap increased from 2003 to 2012 even though life insurance penetration (premiums as a percentage of GDP) rose from 0.7% to 2.0% over the same period. the underlying reasons for protection gaps differ depending on the country, requiring country-specific products and distribution solutions to close them. Life insurers need to be proactive in helping customers fit life insurance into their lives and budgets.
Swiss Re is working closely with local and global insurers to develop affordable solutions to help minimise the gap for everyone, from the affluent to those below the poverty line. Product innovation is one way to address the issue. technology solutions such as Magnum, our automated underwriting engine, can also help. In high growth markets, both reinsurance and local market expertise are crucial to building sustainable insurance markets. Swiss Re is committed to investing in and developing local talent in order to allow these markets to thrive.
Swiss Re is working closely with local and global insurers to close the protection gap in high growth markets.
Swiss Re 2013 Financial Report 33
FinAnCiAl yeAR | ReInSURance
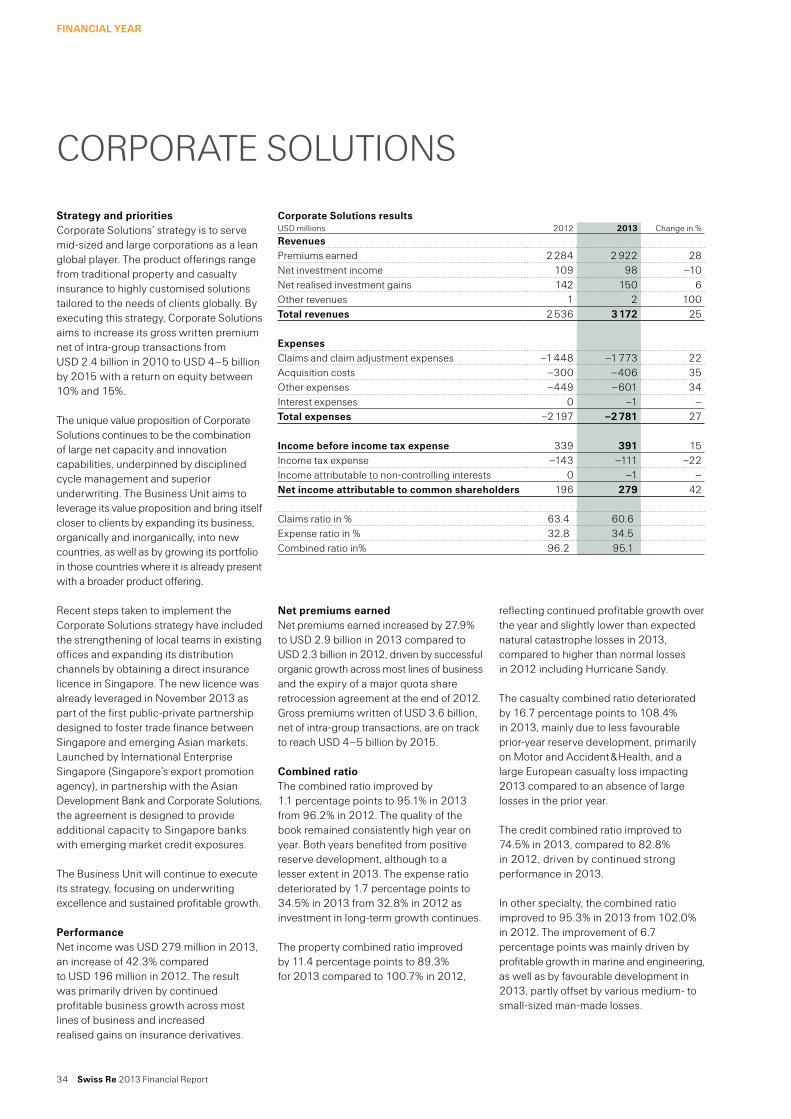
Strategy and prioritiescorporate Solutions’ strategy is to serve mid-sized and large corporations as a lean global player. the product offerings range from traditional property and casualty insurance to highly customised solutions tailored to the needs of clients globally. By executing this strategy, corporate Solutions aims to increase its gross written premium net of intra-group transactions from USD 2.4 billion in 2010 to USD 4–5 billion by 2015 with a return on equity between 10% and 15%.
the unique value proposition of corporate Solutions continues to be the combination of large net capacity and innovation capabilities, underpinned by disciplined cycle management and superior underwriting. the Business Unit aims to leverage its value proposition and bring itself closer to clients by expanding its business, organically and inorganically, into new countries, as well as by growing its portfolio in those countries where it is already present with a broader product offering.
Recent steps taken to implement the corporate Solutions strategy have included the strengthening of local teams in existing offices and expanding its distribution channels by obtaining a direct insurance licence in Singapore. the new licence was already leveraged in november 2013 as part of the first public-private partnership designed to foster trade finance between Singapore and emerging asian markets. Launched by International enterprise Singapore (Singapore’s export promotion agency), in partnership with the asian Development Bank and corporate Solutions, the agreement is designed to provide additional capacity to Singapore banks with emerging market credit exposures.
the Business Unit will continue to execute its strategy, focusing on underwriting excellence and sustained profitable growth.
Performancenet income was USD 279 million in 2013, an increase of 42.3% compared to USD 196 million in 2012. the result was primarily driven by continued profitable business growth across most lines of business and increased realised gains on insurance derivatives.
reflecting continued profitable growth over the year and slightly lower than expected natural catastrophe losses in 2013, compared to higher than normal losses in 2012 including Hurricane Sandy.
the casualty combined ratio deteriorated by 16.7 percentage points to 108.4% in 2013, mainly due to less favourable prior-year reserve development, primarily on Motor and accident & Health, and a large european casualty loss impacting 2013 compared to an absence of large losses in the prior year.
the credit combined ratio improved to 74.5% in 2013, compared to 82.8% in 2012, driven by continued strong performance in 2013.
In other specialty, the combined ratio improved to 95.3% in 2013 from 102.0% in 2012. the improvement of 6.7 percentage points was mainly driven by profitable growth in marine and engineering, as well as by favourable development in 2013, partly offset by various medium- to small-sized man-made losses.
net premiums earnednet premiums earned increased by 27.9% to USD 2.9 billion in 2013 compared to USD 2.3 billion in 2012, driven by successful organic growth across most lines of business and the expiry of a major quota share retrocession agreement at the end of 2012. Gross premiums written of USD 3.6 billion, net of intra-group transactions, are on track to reach USD 4–5 billion by 2015.
Combined ratiothe combined ratio improved by 1.1 percentage points to 95.1% in 2013 from 96.2% in 2012. the quality of the book remained consistently high year on year. Both years benefited from positive reserve development, although to a lesser extent in 2013. the expense ratio deteriorated by 1.7 percentage points to 34.5% in 2013 from 32.8% in 2012 as investment in long-term growth continues.
the property combined ratio improved by 11.4 percentage points to 89.3% for 2013 compared to 100.7% in 2012,
cORPORate SOLUtIOnS
Corporate Solutions resultsUSD millions 2012 2013 change in %
RevenuesPremiums earned 2 284 2 922 28net investment income 109 98 –10net realised investment gains 142 150 6Other revenues 1 2 100Total revenues 2 536 3 172 25
expensesclaims and claim adjustment expenses –1 448 –1 773 22acquisition costs –300 –406 35Other expenses –449 –601 34Interest expenses 0 –1 –Total expenses –2 197 –2 781 27
income before income tax expense 339 391 15Income tax expense –143 –111 –22Income attributable to non-controlling interests 0 –1 –net income attributable to common shareholders 196 279 42
claims ratio in % 63.4 60.6expense ratio in % 32.8 34.5combined ratio in% 96.2 95.1
34 Swiss Re 2013 Financial Report
FinAnCiAl yeAR

investment resultthe return on investments for 2013 was 2.4%, compared to 3.2% in 2012, reflecting a reduction in the investment result of USD 38 million, mainly driven by unfavourable movements in foreign exchange from the strengthening of the US dollar in 2013. excluding the effect of foreign exchange remeasurement, the investment result was generally in line with 2012 as the re-balancing of the investment portfolio helped offset the impact of lower overall reinvestment rates.
Investment-related net investment income decreased by USD 6 million to USD 111 million in 2013, mainly due to higher investment expenses, partially offset by the re-balancing of the investment portfolio.
Investment-related net realised gains were USD 59 million in 2013, mainly as a result of realised gains from active management of the listed equity portfolio and corporate bond portfolio, partially offset by unfavourable movements in foreign exchange remeasurement. this
compares to USD 91 million in the prior year. Realised insurance derivative gains, which are not included in the return on investments, increased to USD 91 million in 2013, compared to a gain of USD 55 million in 2012. these contracts offer protection against weather perils and other risks related to insurance but are accounted for as derivatives.
Return on equityReturn on equity was 9.6% in 2013, compared to 7.4% in 2012. Shareholders’ equity decreased slightly to USD 2.8 billion in 2013, primarily due to a USD 489 million dividend to the Group.
OutlookPricing trends for commercial insurance are moderately softening with only a few pockets showing increases. Differences in quality between geographies and types of business exist. corporate Solutions continues to believe it is well positioned to capture opportunities thanks to its value proposition, strong balance sheet and expanding geographic reach.
0
1
2
3
4
201220112010 2015(target)
2013
5
+6%
+38%
3-year CAGR: 15%
0
1
2
3
4
201220112010 2015(target)
2013
5
…
…
0
1
2
3
4
201220112010 2015(target)
2013
5
+6%
+38%
3-Jahres CAGR: 15%
…
2.4 2.5
3.5
4–5+5%3.6
2.4 2.5
3.5
4–5+5%3.6
3-year CAGR: 15%
+6%
+38%
2.4 2.5
3.5
4–5+5%3.6
Investments and tailored approaches for high growth markets
Gross written premiums (in USD billions, net of intra-group transactions; caGR is compound annual growth rate)
Swiss Re corporate Solutions is well on track to achieve its goal of reaching USD 4–5 billion in gross written premium net of intra-group transactions by 2015. High growth markets (HGMs) are an important element of that strategy. Our goal is to grow the business in HGMs by establishing local presence and tailored expertise for clients in Latin america, emerging eMea and emerging asia.
In 2013 we obtained a direct insurance licence in Singapore which reinforces the growth plans of our local operation. this milestone complements the establishment of the Dubai branch (2012) and the acquisition of UBF Seguros in Brazil (2011). also in 2013, we leveraged our position as Brazil's leading provider of agriculture insurance by signing a strategic alliance with caixa Seguros to develop, launch and market agro-insurance products through caixa econômica Federal, a government-owned financial institution.
at corporate Solutions, we offer a range of products that have a special relevance for corporations operating in HGMs including natural catastrophe cover, agriculture, infrastructure and credit and surety. In addition, we also promote public-private partnerships, whereby innovative risk-transfer and other insurance-based solutions provide immediate financial relief. Governments in HGMs are increasingly integrating such solutions in their risk mitigation plans, as in Mexico, where we provide protection against natural disaster risk.
Demand in HGMs for ground-breaking insurance solutions for corporations, state companies and governments alike is expected to grow further — and we are ready to participate.
Corporate Solutions is moving to triple the premiums generated in high growth markets (HGMs) between 2010 and 2015
Swiss Re 2013 Financial Report 35
FinAnCiAl yeAR | cORPORate SOLUtIOnS

Strategy and prioritiesadmin Re® aims to enhance business profitability by applying a three-pronged strategy to leverage its core competencies of selective growth, value extraction and operational excellence.
Selective growth is the first element of admin Re®’s strategy. admin Re® continues to pursue opportunities to build and enhance the franchise in the Uk market. all transactions need to meet Swiss Re’s Group investment criteria and hurdle rates.
value extraction relates to the active management of the portfolios of assets and blocks of businesses and a focus on consistently creating value through capital and tax synergies.
Operational excellence is the third core competency and involves continuous improvement of the unique and scalable operating platform as well as a focus on transformation and management actions including business efficiency and cost reduction.
In addition to in-house funding, the Swiss Re Group and admin Re® may seek alternative funding arrangements including an expanded use of leverage for new business growth. the clear objective is to lower admin Re®’s weighted average cost of capital, and build more flexibility for future transaction funding.
Performanceadmin Re® generated gross cash of USD 521 million, significantly higher than the USD 392 million generated in 2012 (net of the USD 804 million relating to the sale of the admin Re® US business).
admin Re® reported net income of USD 423 million in 2013 compared with USD 183 million in 2012. the 2013 result included realised gains following the re-balancing of the investment portfolio, favourable Uk tax impacts driven by a reduction in the corporation tax rate and favourable investment market movements in the Uk. the 2012 figure included a
Overall investment-related net investment income decreased by USD 345 million to USD 889 million in 2013, primarily due to lower income following the sale of the admin Re® US business, partially offset by the impact of portfolio re-balancing.
total investment-related net realised gains were USD 283 million in 2013, mainly as a result of gains from the sale of government bonds related to the re-balancing of the investment portfolio. this compares to USD 270 million in the prior year.
expenses administrative expenses decreased by USD 16 million to USD 441 million in 2013, primarily driven by lower costs following the sale of the admin Re® US business, partly offset by one-off transaction-related costs incurred in 2013.
USD 399 million loss relating to the sale of the admin Re® US business. excluding this loss, the 2012 net income would have been USD 582 million. the decrease in underlying income in 2013 was primarily due to lower revenues following the sale of the admin Re® US business and less favourable tax credits than in 2012.
investment resultthe return on investments for 2013 was 5.1%, compared to 4.9% in 2012. as the portfolio is primarily comprised of fixed income assets, the result for 2013 was driven by net investment income on corporate and government bonds. Re-balancing of the portfolio from government bonds to corporate bonds also led to realised gains, which contributed positively to the return on investments.
aDMIn Re®
Admin Re® resultsUSD millions 2012 2013 change in %
RevenuesPremiums earned 992 844 –15Fee income from policyholders 713 486 –32net investment income – non-participating 1 548 1 180 –24net realised investment gains/losses – non-participating –89 201 –net investment result – unit-linked and with-profit 2 348 3 098 32Other revenues 3 1 –67Total revenues 5 515 5 810 5
expensesLife and health benefits –2 086 –1 506 –28Return credited to policyholders –2 688 –3 392 26acquisition costs –142 –30 –79Other expenses –457 –441 –4Interest expenses –53 –46 –13Total expenses –5 426 –5 415 0
income before income tax benefit 89 395 –Income tax benefit 101 28 –72Income attributable to non-controlling interests –7 0 –net income attributable to common shareholders 183 423 131
36 Swiss Re 2013 Financial Report
FinAnCiAl yeAR

Return on equitythe return on equity was 6.8% for 2013 compared to 2.6% for 2012. the 2012 return on equity included the loss recognised in the year related to the sale of the admin Re® US business. excluding the loss on disposal, the return on equity would have been 7.7% for 2012.
Shareholdersʼ equityShareholders’ equity decreased by USD 0.9 billion to USD 5.8 billion compared to 31 December 2012. the reduction mainly reflects lower unrealised gains, driven by increasing interest rates in the Uk and the US during 2013. the increase related to net income was broadly offset by the USD 357 million dividends paid to the Group in 2013.
423net incomein USD millions, 2013
521Gross cash generationin USD millions, 2013
Outlookadmin Re® aims to pursue selective growth opportunities in the Uk, taking advantage of its unique and scalable platform. all transactions must meet Group investment criteria and hurdle rates. It also aims to improve efficiency, achieve capital and tax synergies, and to actively manage its asset portfolios and blocks of business. through these actions admin Re® aims to generate USD 850–950 million in cash from 2014 to 2016, and to pay dividends of USD 900 million to the Group in the same period.
Swiss Re 2013 Financial Report 37
FinAnCiAl yeAR | aDMIn Re®

SHaRe PeRFORMance
Swiss Re sharesSwiss Re had a market capitalisation of cHF 30.4 billion on 31 December 2013, with 370.7 million shares outstanding, of which 342.2 million are entitled to dividends. Swiss Re shares are listed in accordance with the main standard on the SIX Swiss exchange (SIX) and are traded under the ticker symbol SRen. the shares are also traded over the counter as part of an american Depositary Receipt (aDR) level I programme (Otc symbol SSReY).
Share price performanceSwiss Re shares opened the year at cHF 65.90. On 24 June 2013 the shares experienced an intra-day low of cHF 66.10. an intra-day high of cHF 84.75 was achieved on 11 november 2013. the year-end share price was cHF 82.05.
During 2013 the StOXX europe 600 Insurance index (SXIP) and the broader index of Swiss blue chips (SMI) increased by 28.9% and 20.2% respectively. the Swiss Re share increased by 24.5%.
Share tradingthe average on-exchange daily trading volume for 2013 was 1.0 million shares, the same as in 2012. trading volume peaked at 3.3 million shares on 21 February 2013, the day the 2012 annual Results were published.
Swiss Re’s dividend policySwiss Re’s highest priority is to grow the regular dividend with long-term earnings. at a minimum Swiss Re aims to maintain the regular dividend. then Swiss Re will deploy capital for business growth where it meets its profitability requirements. Dividends are typically paid out of current earnings and Swiss Re pays its dividend annually. Shares are ex-dividend two working days after the annual General Meeting (aGM), with payment made five working days after the aGM. the corresponding dates in 2014 are 15 and 22 april.
Dividendsthe Board of Directors proposes a regular dividend of cHF 3.85 per share and an additional special dividend of cHF 4.15 per share for 2013. Both dividends will be in the form of Swiss withholding tax exempt distributions out of legal reserves from capital contributions.
index representationIn addition to its relevant industry indices, Swiss Re is also represented in various Swiss, european and global indices,
including the SMI and the SXIP. the composition of these indices is typically based on free-float market capitalisation. Swiss Re is also a member of various sustainability indices, including the Dow Jones Sustainability and FtSe4Good index families.
information for investorsMore information on Swiss Re’s shares is available in the Investor Relations section on Swiss Re’s website at: www.swissre.com/investors
General information on Swiss Re sharesIdentification numbers Share aDR
Swiss Security number (valorennummer) 12688156 –ISIn (International Securities Identification number) cH0126881561 US8708861088
ticker symbols Bloomberg telekurs Reuters
Share SRen:vX SRen SRen.vXaDR1 SSReY:US SSReY SSReY.Pk
1 Swiss Re’s aDRs are not listed but traded over the counter; one aDR corresponds to one Swiss Re share.
Weighting in indicesas of 31 December 2013 Index weight (in %)
Swiss/blue chip indicesSMI 2.82SPI 2.37
insurance indicesStOXX europe 600 Insurance 5.18Bloomberg europe 500 Insurance 5.52FtSeurofirst 300 Insurance 6.48Dow Jones Insurance titans 30 2.78
Sustainability indicesDow Jones Sustainability europe 0.67Dow Jones Sustainability World 0.33FtSe4Good Global 0.21MScI Global climate 1.02
38 Swiss Re 2013 Financial Report
FinAnCiAl yeAR

571'841
Swiss Re share price and trading volume in 2013Volume in millionsClosing price in CHF
Preliminary 2012 annual results (21 February)
2012 annual results(15 March)
Ex dividend date(12 April)
Q1 results 2013(2 May)
Q2 results 2013(8 August)
70
80
90
60
50
40
20
30
10
0
DecemberNovemberOctoberSeptemberAugustJulyJuneMayAprilMarchFebruaryJanuary
Q3 results 2013(7 November)
Investors’ meeting Monte Carlo(9 September)
Investors’ Day 2013(24 June)
Dividend payment(17 April)
Closing price Volume on-exchange Volume off-exchange
7
8
9
6
5
4
2
3
1
0
Swiss Re share price and trading volume in 2013
January February March april May June July august September October november December
– closing price volume on-exchange volume off-exchange
Key share statistics 2009 —20131as of 31 December 2009 2010 2011 2012 2013
Shares outstanding2 370 701 168 370 704 153 370 706 931 370 706 931 370 706 931of which treasury shares and shares reserved for corporate purposes 27 994 167 28 083 630 27 970 432 27 537 673 28 511 298
Shares entitled to dividend 342 707 001 342 620 523 342 736 499 343 169 258 342 195 633
cHF unless otherwise stated
Dividend paid per share 0.10 1.00 2.75 3.00 3.503
Dividend yield4 (in %) 0.2 2.0 5.7 4.6 4.3earnings per share5 1.49 2.64 6.79 11.13 12.04Book value per share6 67.72 68.99 80.74 87.76 82.76
Price per share year-end 49.91 50.30 47.87 65.90 82.05Price per share year high (intra-day) 53.10 53.75 60.75 68.10 84.75Price per share year low (intra-day) 11.88 42.10 35.12 47.25 66.10Daily trading volume (in cHF millions) 98 86 73 58 78Market capitalisation7 (in cHF millions) 18 502 18 646 17 746 24 430 30 417 aDR price at year-end (in USD) 48.19 53.72 50.55 72.30 92.38
1 Due to the implementation of a new holding structure as of 23 May 2011, references to Swiss Re shares refer to shares of Swiss Reinsurance company Ltd (ticker symbol: RUkn) for the period until 20 May 2011 and to shares of Swiss Re Ltd (ticker symbol: SRen) as of 23 May 2011.
2 nominal value of cHF 0.10 per share.3 In addition to the regular dividend of cHF 3.50 per share a special dividend of cHF 4.00 per share was paid in 2013.4 Dividend divided by year-end share price of corresponding year.5 calculated by dividing net income by the weighted average number of common shares outstanding.6 Based on shareholders’ equity (excluding convertible perpetual capital instruments) divided by the number of external common shares entitled to dividend7 Based on shares outstanding.
Swiss Re 2013 Financial Report 39
FinAnCiAl yeAR | SHaRe PeRFORMance

40 Swiss Re 2013 Financial Report

RiSk and capital management | IntRoductIon
Swiss Re 2013 Financial Report 41
42 Overview44 capital management47 economic Value management49 liquidity management50 Risk management52 Risk assessment
Risk and capital managementIn 2013, Swiss Re remained strongly capitalised. We aim to combine this capital strength with financial flexibility, maximising return on equity within our risk tolerance targets.

oveRvIeW
in 2013, we actively increased our overall risk exposure by pursuing business growth and re-balancing our investment portfolio. Swiss Reʼs management is confident of the group’s overall risk profile and capitalisation, both of which lie within the boundaries of our self-imposed group-wide risk tolerance. We continue to hold excess capital under all applicable external capital adequacy requirements, as well as surplus liquidity and capital relative to our own, more conservative risk tolerance criteria.
changes in our risk profilethroughout 2013, Swiss Re’s overall risk increased as a result of higher financial market and credit risk. this reflected continued re-balancing of the investment portfolio with an increased allocation to high-quality corporate bonds and equities, along with the implementation of the short duration position. the other driver of the increase in Swiss Re’s overall risk was the higher property and casualty risk, driven by a reduction in hedging including, eg, the expiry of a major quota share retrocession agreement and some business growth. Life and health risk decreased mainly due to the rise in long-term interest rates. Swiss Re’s portfolio of risks from underwriting and investment activities remains widely diversified.
capitalisationduring 2013, Swiss Re maintained its strong capitalisation, directed excess capital flows from subsidiaries to parent companies and further optimised its capital structure at the Group level. Swiss Re continues to hold excess capital under all applicable external capital adequacy requirements, including the Swiss Solvency test (SSt), Solvency I, and Standard & Poor’s AA rating. We are following and implementing the requirements of the forthcoming Solvency II regime for our european entities. these are broadly in line with those of the SSt.
We have made significant progress in optimising our capital structure. As announced at our Investor’s day in June 2013, this incorporates three main activities. First, we continued to reduce senior leverage, including letters of credit (Locs). this involved the repurchase of senior notes and the maturing of senior debt, which supports our target to reduce Swiss Re’s leverage by more than uSd 4 billion by 2016. Second, Swiss Re continues to issue new hybrid instruments in the form of contingent capital (two of them in 2013) that combine high capital quality with flexibility and fungibility. For the most part, these instruments replace traditional subordinated debt. third, we
our management is confident of the Group’s overall risk profile and capitalisation.
42 Swiss Re 2013 Financial Report
RiSk and capital management
continue to direct excess capital flows from our legal entities to their respective parent companies and ultimately to Swiss Re Ltd. this enhances the financial flexibility of the Group, thereby supporting our commitment to an attractive and sustainable external dividend policy (see page 38).
our internal target capital adequacy ratios established under our Group risk tolerance framework are more conservative than those used by external agencies. they are set to fulfil three aims: to meet all regulatory requirements and expectations; to maintain capital and liquidity levels that compare favourably with those of our peers and are attractive to clients; and to ensure our ability to write business even after a large loss event, an extremely adverse year in the financial markets, or both together.
liquidityour core insurance and reinsurance operations generate liquidity primarily through premium income. our exposure to liquidity risk stems mainly from two sources: the need to cover potential extreme loss events and regulatory constraints that limit the flow of funds within the Group.
the amount of liquidity held is largely determined by internal liquidity stress tests, which estimate the potential funding requirements stemming from extreme loss events. Based on these internal liquidity stress tests, we estimate that the Swiss Reinsurance company Ltd liquidity pool, the primary liquidity pool of the Group, holds surplus liquidity.
Risk managementSwiss Re’s Risk Management function forms an integral part of our business model. Risk Management is involved in all of Swiss Re’s risk-taking activities and is mandated to support both the Group and the Business units. Risk Management is embedded throughout our business, through dedicated risk functions and chief Risk officers for each Business unit. each of them has a duty to analyse and challenge business decisions; their independence is maintained by a direct reporting line to the Group chief Risk officer. they apply a consistent enterprise Risk Management approach to ensure a fully integrated view of risk, thus sustaining long-term stability and growth.
our proprietary integrated risk model provides a meaningful assessment of the risks to which the company is exposed and is an important tool for managing our business. It determines the capital requirements for internal purposes and forms the basis for regulatory reporting under the SSt.
Regulationthe regulatory agenda continued to accelerate in 2013. Swiss Re remains actively engaged in regulatory discussions and is well prepared to implement new regulatory requirements such as Solvency II, capital market reforms, the own Risk and Solvency Assessment and group supervision that are approaching implementation in most markets.
Swiss Re 2013 Financial Report 43
RiSk and capital management | oveRvIeW
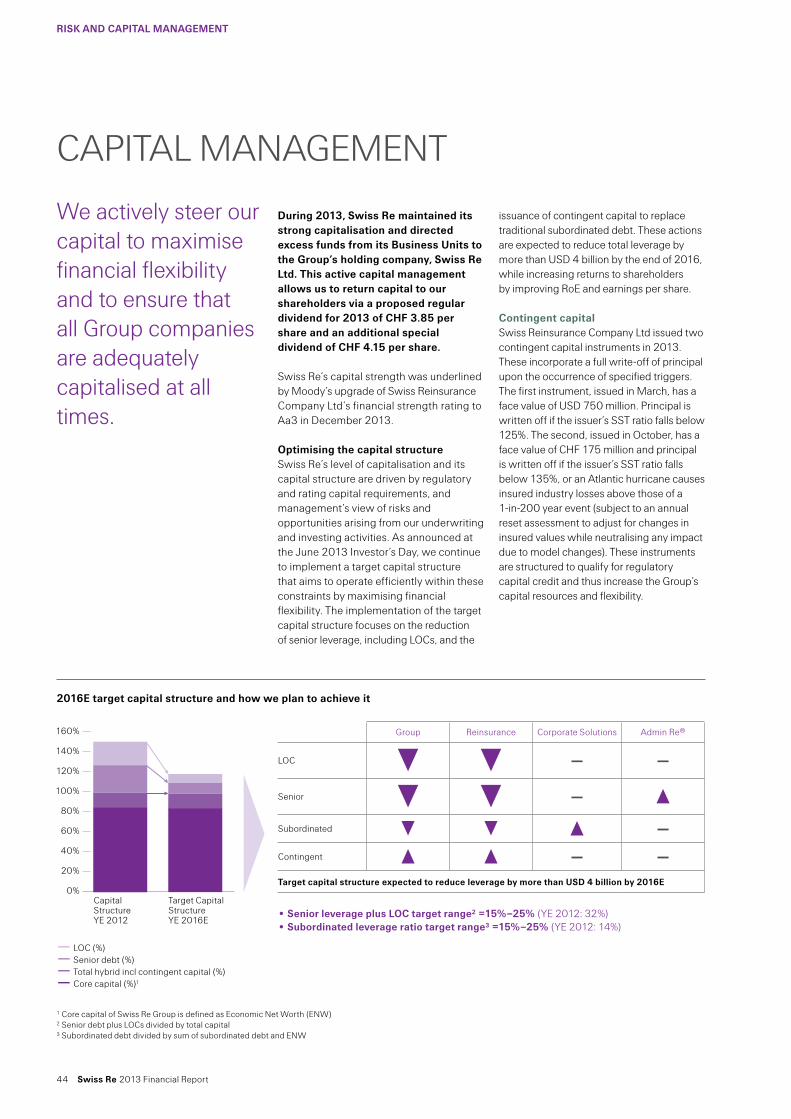
during 2013, Swiss Re maintained its strong capitalisation and directed excess funds from its Business Units to the groupʼs holding company, Swiss Re ltd. this active capital management allows us to return capital to our shareholders via a proposed regular dividend for 2013 of cHF 3.85 per share and an additional special dividend of cHF 4.15 per share.
Swiss Re’s capital strength was underlined by Moody’s upgrade of Swiss Reinsurance company Ltd’s financial strength rating to Aa3 in december 2013.
Optimising the capital structureSwiss Re’s level of capitalisation and its capital structure are driven by regulatory and rating capital requirements, and management’s view of risks and opportunities arising from our underwriting and investing activities. As announced at the June 2013 Investor’s day, we continue to implement a target capital structure that aims to operate efficiently within these constraints by maximising financial flexibility. the implementation of the target capital structure focuses on the reduction of senior leverage, including Locs, and the
We actively steer our capital to maximise financial flexibility and to ensure that all Group companies are adequately capitalised at all times.
issuance of contingent capital to replace traditional subordinated debt. these actions are expected to reduce total leverage by more than uSd 4 billion by the end of 2016, while increasing returns to shareholders by improving Roe and earnings per share.
contingent capitalSwiss Reinsurance company Ltd issued two contingent capital instruments in 2013. these incorporate a full write-off of principal upon the occurrence of specified triggers. the first instrument, issued in March, has a face value of uSd 750 million. Principal is written off if the issuer’s SSt ratio falls below 125%. the second, issued in october, has a face value of cHF 175 million and principal is written off if the issuer’s SSt ratio falls below 135%, or an Atlantic hurricane causes insured industry losses above those of a 1-in-200 year event (subject to an annual reset assessment to adjust for changes in insured values while neutralising any impact due to model changes). these instruments are structured to qualify for regulatory capital credit and thus increase the Group’s capital resources and flexibility.
cAPItAL MAnAGeMent
Group Reinsurance corporate Solutions Admin Re®
Loc — —
Senior —
Subordinated —
contingent — —target capital structure expected to reduce leverage by more than USd 4 billion by 2016e
• Senior leverage plus lOc target range2 =15%–25% (Ye 2012: 32%) • Subordinated leverage ratio target range3 =15%–25% (Ye 2012: 14%)
2016e target capital structure and how we plan to achieve it
160%
140%
120%
100%
80%
60%
40%
20%
0%capital Structure Ye 2012
target capital Structure Ye 2016e
1 core capital of Swiss Re Group is defined as economic net Worth (enW)2 Senior debt plus Locs divided by total capital 3 Subordinated debt divided by sum of subordinated debt and enW
– Loc (%)– Senior debt (%)– total hybrid incl contingent capital (%)– core capital (%)1
44 Swiss Re 2013 Financial Report
RiSk and capital management

Senior deleveragingAs part of the deleveraging strategy announced at the June 2013 Investor’s day, Swiss Re launched an “any-and-all” public tender offer resulting in the repurchase of uSd 713 million (in carrying value, uSd 527 million in notional terms) of senior legacy debt assumed as part of the 2006 acquisition of Ge Insurance Solutions. this liability management exercise reduced long-dated senior debt at a limited premium. In addition, senior leverage maturities totalled uSd 1.6 billion and a uSd 2.0 billion reduction in Locs was also completed in 2013.
legal entity capital managementour regulated subsidiaries are subject to local regulatory requirements, which for our eu subsidiaries will include Solvency II. At the subsidiary level we set target capital at a level tailored to each entity’s business and the market environment in which it operates. our underwriting and investment decisions are steered so as to make capital and liquidity fungible to the Group wherever possible, while complying with local regulations and client needs. cash dividends paid to the Group’s parent holding company, Swiss Re Ltd, totalled uSd 2.8 billion in 2013.
external dividends to shareholdersBased on our strong capital position and retained earnings of uSd 30.8 billion for 2013, the Board of directors proposes a regular dividend of cHF 3.85 per share for 2013, up from the previous year’s dividend of cHF 3.50 per share. In addition, Swiss Re proposes to pay a special dividend of cHF 4.15 per share for 2013 (a special dividend of cHF 4.00 per share was paid for 2012). If approved, the combined 2013 dividends will represent a total return of capital to shareholders of approximately uSd 3.1 billion. our priority remains to achieve our financial targets while providing a sustainable, growing dividend.
Swiss Re groupʼs capital adequacyRegulatory capital requirementsSwiss Re is supervised at Group level and for its regulated legal entities domiciled in Switzerland by the Swiss Financial Market Supervisory Authority (FInMA). FInMA supervision comprises minimum solvency requirements, along with a wide range of qualitative assessments and governance standards.
Swiss Re’s capital adequacy Swiss Re holds excess capital under all relevant capital adequacy requirements such as the SSt (see chart), Solvency I and Standard & Poor’s AA rating.
group capitalisation — Swiss Solvency test1 (SSt)
uSd bn %
– SSt risk-bearing capital – SSt target capital – SSt ratio
1 SSt RBc is based on the preceding (half-) year-end capital position (minus projected dividends). SSt target capital reflects a 12-month forward-looking view.
2 SSt 2/2013 as filed with FInMA at the end of october 2013, consolidated Group view based on a projection for mid-2013 to mid-2014. the impact of March 2013 uSd 750 million and october 2013 cHF 175 million subordinated contingent write-off securities are not reflected in SSt 2/2013.
0
10
20
30
40
50
60
70
SST target capitalSST risk-bearing capital Source: Insert info
2/2013²1/20131/20121/2011SST 1/2010
SST ratio
0
50
100
150
200
250
300269%
208% 213%
245%229%
40.5
1518.5 19.1
38.5 40.7
48.7 47.3
19.8 20.7
Swiss Re 2013 Financial Report 45
RiSk and capital management | cAPItAL MAnAGeMent

Swiss Re provides regulatory solvency reporting to FInMA under the rules of Solvency I and the SSt. the SSt is based on an economic view. We calculate available capital based on our economic value Management (evM) framework and required capital under the SSt using our internal risk model (see pages 47–48 for further information on evM). the minimum requirement for Solvency I and the SSt is a ratio of 100%. Swiss Re’s Solvency I and SSt ratios both materially exceed the minimum requirement.
Swiss Re’s capital management aims to ensure our ability to continue operations following an extremely adverse year of losses from insurance and/or financial market events.
Rating agency capital requirements Rating agencies assign credit ratings to the obligations of Swiss Reinsurance company Ltd (Swiss Re) and its rated subsidiaries.
the agencies evaluate Swiss Re based on a set of criteria that include an assessment of our capital adequacy.
each rating agency uses a different methodology for this assessment; A.M. Best and Standard & Poor’s (S&P) base their evaluation on proprietary capital models.
Swiss Re’s financial strength ratingsAs of 14 February 2014 Financial strength rating outlook Last update
Moody’s Aa3 Stable 10 december 2013Standard & Poor’s AA– Stable 18 december 2013A.M. Best A+ Stable 31 January 2014
A.M. Best, Moody’s and S&P rate Swiss Re’s financial strength based upon interactive relationships. the insurance financial strength ratings are shown in the table below.
on 10 december 2013, Moody’s upgraded Swiss Reinsurance company Ltd’s insurance financial strength rating to Aa3. the outlook on the rating is “stable”. this upgrade reflects Swiss Re Group’s improved financial profile, notably with respect to profitability and financial flexibility, whilst maintaining an overall excellent market position and strong business diversification.
on 18 december 2013, S&P affirmed the AA- financial strength of Swiss Reinsurance company Ltd (Swiss Re) and its core subsidiaries. the outlook on the rating is “stable”. the rating affirmation predominantly reflects S&P’s view that the Group continues to have an extremely strong competitive position and capital adequacy.
on 31 January 2014, A.M. Best affirmed the A+ financial strength rating of Swiss Reinsurance company Ltd and its subsidiaries. the outlook for the rating is “stable”. the rating reflects the Swiss Re Group’s excellent consolidated risk-adjusted capitalisation, strong operating performance and superior business profile as a leading global reinsurer.
46 Swiss Re 2013 Financial Report
RiSk and capital management | cAPItAL MAnAGeMent

econoMIc vALue MAnAGeMent
economic Value management (eVm) is Swiss Re’s integrated economic valuation framework for planning, pricing, reserving and steering the business. Since 2003, Swiss Re has used the eVm framework as a tool to support business and strategic financial decisions, including compensation decisions. eVm also provides the basis for determining available capital under the Swiss Solvency test (SSt) and, in the future, Solvency ii.
the key evM valuation principles are summarised below.
market consistent valuationsAll traded assets and liabilities are marked to market, based on quoted prices in active markets or observable inputs. untraded assets and liabilities are valued consistently with market prices. the Group’s insurance liabilities are valued on a market consistent basis by replicating future expected cash flows with liquid financial market instruments. As the majority of the Group’s insurance liabilities do not contain embedded financial market risk exposure other than to interest rates, the market consistent value can be determined by discounting future cash flows using prevailing risk-free interest rates. If insurance liabilities include embedded options or guarantees (eg, variable annuities or interest sensitive life business), they are valued on a market consistent basis using stochastic models and other appropriate valuation techniques.
performance split of insurance underwriting and investment activitiesevM values underwriting and investment activities separately. underwriting activities create value by raising funds on insurance markets at a lower cost than through other sources. the investment functions are assessed on a risk-adjusted basis. this makes possible a like-for-like comparison of underwriting and investment activities.
closed-book approachevM recognises all cash flows associated with a new contract at inception, and any changes in estimates as they occur. In comparison, the deferral and matching principle under uS GAAP postpones recognition of revenues until they are earned and matches expenses to those revenues. evM excludes the recognition of all potential future new business activities, as well as potential renewals.
Best estimatesSwiss Re values assets and liabilities based on best estimates of underlying cash flows – premiums, claims, expenses, taxes, capital costs, etc. – taking into consideration all the information available when a contract incepts. As with other valuation methods that depend on projections of future cash flows, evM involves a significant degree of judgement in establishing what assumptions should be used. Swiss Re actively and carefully reviews its assumptions, seeking both to achieve consistency across business activities and to reflect all available information.
performance measurement after capital costsevM explicitly recognises opportunity costs for shareholder capital. cost-of-capital charges include the base cost of capital and frictional capital costs. the base cost of capital is reflected through a charge for risk-free returns on available capital and market risk premiums. Market risk premiums compensate for systematic, non-diversifiable risk exposure, mainly assumed through investing activities. Frictional capital costs compensate for agency costs, costs of potential financial distress and regulatory (illiquidity) costs; they are reflected through a 4% charge on available capital and an average 2% charge on leverage.
evM is an integrated economic accounting and steering framework based on market consistent valuations and defines the method for measuring value creation for all business activities of Swiss Re.
Swiss Re 2013 Financial Report 47
RiSk and capital management

economic net worth (enW) is defined as the difference between the market value of assets and the market consistent value of liabilities. enW is the evM measure of shareholders’ equity and the starting point in determining available capital for SSt calculations.
In 2013, enW increased by uSd 3.3 billion from uSd 33.9 billion at the end of december 2012. 2013 evM income of uSd 6.3 billion was partially offset by the Swiss Re Group’s dividend payments.
economic net worthuSd billions 2012 2013 change in %
Property & casualty 15.6 17.2 10Life & Health 9.0 8.9 –1
Reinsurance 24.6 26.1 6corporate Solutions 3.7 3.9 5admin Re® 4.9 4.8 –2group items 3.4 4.8 41consolidation –2.7 –2.4 –11
total 33.9 37.2 10
eVm results for 2013 the 2013 eVm Report, showing Swiss Re’s results for the full year 2013, is available on swissre.com/investors/financial_information
economic net worth in 2013
48 Swiss Re 2013 Financial Report
RiSk and capital management | econoMIc vALue MAnAGeMent

LIquIdItY MAnAGeMent
as a re/insurance group, our core business generates liquidity primarily through premium income. Our exposure to liquidity risk stems mainly from two sources: the need to cover potential extreme loss events and regulatory constraints that limit the flow of funds within the group.
to manage these risks, we have a range of liquidity policies and measures in place. In particular, we aim to ensure that: sufficient liquidity is held to meet
funding requirements under current conditions as well as adverse circumstances;
funding is charged and credited at an appropriate market rate through our internal transfer pricing;
diversified sources are used to meet our residual funding needs; and
long-term liquidity needs are taken into account, both in our planning process and in our management of financial market risk.
liquidity risk managementour core liquidity policy is to retain sufficient liquidity in the form of unencumbered liquid assets and cash to meet potential funding requirements arising from a range of possible stress events. to allow for regulatory restrictions on intra-group funding, liquidity is managed within groups of entities known as liquidity pools. Swiss Re is served by four main liquidity pools representing the parent companies of the Group and the three Business units: the Swiss Re Ltd liquidity pool, the Swiss Reinsurance company Ltd (SRZ) liquidity pool, the Swiss Re corporate Solutions Ltd liquidity pool, and the Swiss Re Life capital liquidity pool. each liquidity pool comprises the parent company and its unregulated subsidiaries whose funds are freely transferable to the parent company. the amount of liquidity held is largely determined by internal liquidity stress tests, which estimate the potential funding requirements stemming from extreme loss events. the funding requirements under stress include: cash and collateral outflows, as well
as potential capital and funding support required by subsidiaries as a result of loss events;
repayment or loss of all maturing unsecured debt and credit facilities;
additional collateral requirements associated with a potential ratings downgrade;
further contingent funding requirements related to asset downgrades; and
other large committed payments, such as expenses, commissions and tax.
the stress tests also assume that funding from assets is subject to conservative haircuts, that intra-group funding is not available if it is subject to regulatory approval, that no new unsecured funding is available, and that funding from new reinsurance business is reduced.
the primary liquidity stress test is based on a one-year time horizon, a loss event corresponding to 99% tail vaR (see pages 52–53), and a three-notch ratings downgrade.
Swiss Re’s liquidity stress tests are reviewed regularly and their main assumptions are approved by the Group Risk and capital committee. Swiss Re provides FInMA with a yearly report on its liquidity position, in accordance with FInMA’s circular 13/5,“Liquidity – Insurers.”
liquidity position of the SRZ liquidity poolthe SRZ pool is the primary liquidity pool of the Group. the estimated total liquidity sources in the SRZ liquidity pool available within one year, after haircuts and net of short-term loans from Swiss Re Ltd, amounted to uSd 18.3 billion as of 31 december 2013, compared with uSd 22.5 billion on 31 december 2012. this total includes uSd 12.7 billion of liquid assets and cash, referred to as “spot liquidity”, compared with uSd 18.3 billion in 2012. Based on the internal liquidity stress tests described above, we estimate that the SRZ liquidity pool holds surplus liquidity.
In 2013, the surplus liquidity of the SRZ liquidity pool after dividends to Swiss Re Ltd was deployed mainly to reduce leverage and to facilitate an increase in investment risk.
We actively manage liquidity risks to ensure that we can satisfy the financial obligations of the Group
41% Cash and short-term investments
33% Government bonds AAA rated & US and
reverse repos23% Other developed market government bonds investment grade
3% Developed market supranational, agencies
and municipal bonds
Composition of spot liquidityin the central liquidity pool asof 31 December 2011Total USD 18.5 billion
composition of spot liquidity in the Swiss Reinsurance company ltd liquidity pool as of 31 december 2013(total uSd 12.7 billion)
41% cash and short-term investments 33% Government bonds AAA rated & uS
and reverse repos 23% other developed market government
bonds investment grade 3% developed market supranational,
agencies and municipal bonds
Swiss Re 2013 Financial Report 49
RiSk and capital management

RISk MAnAGeMent
Risk management ensures an integrated approach to managing current and emerging threats. embedded throughout the business, our group Risk management function ensures that our strategic planning and limit setting conform to Swiss Re’s group-wide risk tolerance. it is also deeply involved in capital cost assessment, large transaction approvals, portfolio monitoring, and performance measurement. its objective is to enable controlled risk-taking and the efficient, risk-adjusted allocation of capital.
controlled risk-taking requires a strong and independent risk management organisation, as well as comprehensive risk management processes to identify, assess and control the Group’s and the Business units’ risk exposures. We base our risk management on four guiding principles that we strive to apply consistently across all risk categories throughout Swiss Re: controlled risk-taking: Financial strength
and sustainable value creation are central to Swiss Re’s value proposition. We therefore operate within a clearly defined risk policy and risk control framework.
clear accountability: our operations are based on the principle of delegated and clearly defined authority. Individuals are accountable for the risks they take on, and their incentives are aligned with Swiss Re’s overall business objectives.
Independent risk controlling: dedicated specialised units within Risk Management monitor our risk-taking activities.
open risk culture: Risk transparency, knowledge sharing and responsiveness to change are integral to our risk control process.
Risk management organisationthe Board of directors is ultimately responsible for the Group’s governance principles and policies; these include the Group Risk Policy, which establishes both the guiding principles of risk management as well as the overall risk tolerance of the Group.
the Board of directors generally deals with risk management through two committees: the Finance and Risk committee is
responsible for reviewing the Group Risk Policy and capacity limits, as well as for monitoring risk tolerance and reviewing top risk issues and exposures.
the Audit committee is responsible for overseeing internal controls and compliance procedures.
We fully embed risk management in our business to enable controlled risk-taking and efficient, risk-adjusted capital allocation.
central Risk management departmentsIdentification, assessment, control and reporting of insurance, financial market, credit, liquidity, operational and other risks
group internal audit
compliance
key risk management bodies and functions
Board of directors
group executive committee group cRO
Group Risk and capital committee Reinsurance cRO
Regional cRos
corporate Solutions cRO
admin Re® cRO
Group Asset-Liability committee
Group Products and Limits committee
Group Regulatory committee
Finance and Risk committee Audit committee
50 Swiss Re 2013 Financial Report
RiSk and capital management

Business unit ceo. the Business unit cRos are responsible for risk oversight in their respective Business units, establishing the proper risk governance to ensure efficient risk identification, assessment, and control. there are also Regional cRos (Americas, Asia, and eMeA) with reporting duties to the Reinsurance regional management teams. they also provide functional support to the Regional Presidents.
For Swiss Re’s major legal entities, the Business unit cRos are supported by designated legal entity cRos who are responsible for overseeing specific risk management issues that arise at the legal entity level.
the central departments support both the Group cRo and the Business unit cRos in discharging their oversight responsibilities. they do so by providing specialised risk category expertise and accumulation control, risk modelling and reporting services, regulatory relations management, and central risk governance framework development. the central departments also oversee Group liquidity and capital adequacy and maintain the Group frameworks for controlling these risks throughout Swiss Re.
While in Reinsurance the setting of the reserves is performed by valuation actuaries working with the Business Management unit, in corporate Solutions and Admin Re® actuarial management is an integral part of Risk Management. the monitoring of reserves for the three Business units is provided by a dedicated Actuarial control unit within Risk Management.
Senior managers of Business and corporate units are responsible for managing operational risks in their areas of activity, based on a centrally coordinated methodology. their self-assessments are reviewed and challenged by dedicated operational risk managers. Risk management experts also review Swiss Re’s underwriting decision processes.
Risk management activities are also supported by Group Internal Audit and compliance. the Group Internal Audit department carries out independent, objective assessments of the adequacy and effectiveness of internal control systems. It evaluates the execution of processes within Swiss Re, including those within Risk Management.
the compliance function is principally responsible for overseeing Swiss Re’s compliance with applicable laws, regulations, rules, and the code of conduct, as well as managing compliance risk. It assists the Board of directors, the Group ec and management in discharging their respective duties to identify, mitigate, and manage compliance risks.
Risk tolerance and limit frameworkSwiss Re’s risk tolerance is an expression of the extent to which the Board of directors has authorised the Group and Business units’ executive management to assume risk. It represents the maximum amount of risk that Swiss Re is willing to accept within the constraints imposed by its capital and liquidity resources, its strategy, its risk appetite, and the regulatory and rating agency environment within which it operates. Risk tolerance criteria are specified for the Group and Business units, as well as for the major legal entities.
A key responsibility of Risk Management is to ensure that Swiss Re’s risk tolerance is applied throughout the business. As part of this responsibility, Risk Management ensures that our risk tolerance targets are a key basis for our business planning processes. Furthermore, both our risk tolerance and risk appetite – the types and level of risk we seek to take within our risk tolerance – are clearly reflected in a limit framework across all risk categories. the limit framework is approved at the Group ec level through the Group Risk and capital committee. the individual limits are established through an iterative process to ensure that the overall framework complies with our Group-wide policies on capital adequacy and risk accumulation.
the Group executive committee (Group ec) implements the risk management framework through four sub-committees: the Group Risk and capital committee
has responsibility for establishing the Group's Risk Governance Framework, including setting and monitoring risk capacity limits and determining changes to the internal risk and capital measurement methodology. It also oversees Swiss Re's economic value measurement framework, including the principles for the allocation of capital and funding resources.
the Group Asset-Liability committee oversees the management of Swiss Re’s balance sheet, in particular its liquidity, capital, and funding positions and related policies.
the Group Products and Limits committee determines Swiss Re’s product policy and underwriting standards, sets transaction limits, and decides on large or non-standard transactions.
the Group Regulatory committee is the central information and coordination platform for regulatory matters and compliance. It ensures a consistent approach to external communication on regulatory issues.
the Group chief Risk officer (cRo), who is a member of the Group ec, reports directly to the Group ceo as well as to the Board’s Finance and Risk committee. the Group cRo is a member of the four Group ec committees, serving as the chairman of both the Group Risk and capital committee and the Group Regulatory committee. In addition, the Group cRo leads the Group’s Risk Management function, which is responsible for risk oversight and control across the Group.
the Group Risk Management function is comprised of central departments providing shared services (such as Risk Reporting), along with dedicated departments for the Reinsurance, corporate Solutions, and Admin Re® Business units.
each of these Business unit departments has a dedicated chief Risk officer who reports directly to the Group cRo, with a secondary reporting line to the respective
Swiss Re 2013 Financial Report 51
RiSk and capital management | RISk MAnAGeMent

in 2013, Swiss Reʼs overall risk increased by 21%, predominantly driven by higher financial market and credit risk, which reflects the re-balancing of the investment portfolio.
Swiss Re uses its internal risk model to measure the Group’s capital requirements, as well as for defining risk tolerance, risk limits, and liquidity stress tests (see box on page 58). According to the internal risk model, Swiss Re’s overall risk exposure based on 99% tail vaR (expected shortfall) increased to uSd 20.0 billion in 2013, up 21% from uSd 16.6 billion in 2012. Alternative risk measures — 99% and 99.5% vaR — showed our risk increasing by 22% to uSd 14.7 billion and by 23% to uSd 17.7 billion, respectively.
the Group capital requirement table on page 53 shows the 99% tail vaR on a standalone basis for each of Swiss Re’s core risk categories: Financial market risk rose by 27% to
uSd 13.3 billion in 2013, reflecting the re-balancing of Swiss Re’s investment portfolio (see Group investments on page 24).
credit (default and migration) risk increased by 54% to uSd 3.0 billion due to the re-balancing of the investment portfolio and the growth in credit and surety re/insurance business.
Property and casualty risk rose by 17% to uSd 9.1 billion reflecting growth in natural catastrophe business and the expiry of a major quota share retrocession agreement.
Life and health risk decreased by 10% to uSd 6.6 billion primarily as a result of increased long-term interest rates.
our internal risk model takes account of the accumulation and diversification between individual risks. the effect of diversification at the category level is demonstrated in the table on page 53, which represents the difference between the Group 99% tail vaR and the sum of standalone tail vaRs for the risk categories. the extent of diversification is largely determined by the selected level of aggregation (the higher the aggregation level, the lower the diversification effect).
our model and its parameters are continuously refined and updated to reflect our experience, changes in the risk and regulatory environment, and advances in current best practice.
RISk ASSeSSMent
Higher overall risk in 2013 results from the re-balancing of our investment portfolio and increased exposure to natural catastrophe risks.
52 Swiss Re 2013 Financial Report
RiSk and capital management

Swiss Re’s risk landscape the risk categories set out in the table on the left are defined in the following sections. across these categories we identify and evaluate emerging threats and opportunities through a systematic framework that includes the assessment of potential surprise factors that could affect known loss potentials. liquidity risk management is discussed on page 49.
categorisation of Swiss Re’s risk landscape
credit credit default credit migration
insurance Property and casualty Life and health
Financial market credit spread equity market Foreign exchange Interest rate Inflation Real estate
core risks
Regulatory
Reputational
liquidity
Strategic
Other risks
people
Systems
processes
external
Operational risks
group capital requirement based on one-year 99% tail VaRuSd billions, as of 31 december 2012 2013 change in % cross reference information
Property and casualty 7.8 9.1 17 ➔ see page 54
Life and health 7.3 6.6 –10 ➔ see page 55
Financial market 10.5 13.3 27 ➔ see page 56
credit1 1.9 3.0 54 ➔ see page 57
Simple sum 27.5 31.9 16diversification effect –10.9 –12.0Swiss Re group 16.6 20.0 21
1 credit comprises credit default and credit migration risk.
Swiss Re 2013 Financial Report 53
RiSk and capital management | RISk ASSeSSMent
description
property and casualty risk
developments in 2013
change from 2012 99% tail VaR
Property and casualty (P&c) insurance risk arises from the coverage that Swiss Re provides for property, liability, motor, and accident risks through its Reinsurance and corporate Solutions Business units, as well as for specialty risks such as engineering, aviation, and marine. We classify and model our property and casualty risks in three categories at Group and Business unit level: natural catastrophes (eg, earthquakes and windstorms), man-made risks (eg liability and fire), and geopolitical risks (eg terrorism). We also monitor and manage underlying risks inherent in the business we underwrite, such as inflation or uncertainty in pricing and reserving.
Swiss Re’s property and casualty risk increased by 17% in 2013. Some natural catastrophe risks increased significantly above that while other risks, like those associated with reserves and general liability, moved to a lesser extent thereby reducing the overall impact on property and casualty 99% tail vaR.
the expiry of a major quota share retrocession agreement, which was only partly replaced by other hedges, was a key driver of the overall increase in risk.
management
Swiss Re writes property and casualty business using the four-eye principle across all Business units: every transaction must be approved by at least two authorised individuals — with the exception of single risk acceptances, which can be authorised by one underwriter with the four-eye principle taken care of by spot checks after acceptance. each underwriter is assigned an individual underwriting authority based on technical skills and experience; any business exceeding this authority triggers a well-defined escalation process that extends up to the Group Products and Limits committee.
the strong increase in the natural catastrophe stress tests shown in the table on page 55 were mainly driven by a reduction in effective hedging, some shifts in business mix from proportional to non-proportional business growth as well as parameter updates for Atlantic hurricane and californian earthquake.
Large individual transactions that could materially affect the Group’s and Business units’ risk exposure require independent review and sign-off by Risk Management before they can be authorised. this is part of our three-signature approval process (involving Swiss Re’s underwriting, client Markets, and Risk Management functions) that establishes the accountability of each of the parties for significant transactions.
We monitor accumulated exposure to single risks or to an underlying risk factor (such as californian earthquake) on a Group-wide basis. We further manage our risk by external retrocession, risk swaps, or by transferring risk to capital markets through insurance-linked securities (such as the current Successor and Mythen cat bond programmes).
Insurance risk
the risk management function is embedded in our business process. Before any business is written, Risk Management is involved in annual business planning; it also reviews underwriting guidelines, pricing models, and large individual transactions. total risk exposure is monitored against agreed risk limits.
Swiss Re’s Risk Management function monitors reserving levels; it provides information to the risk-taking functions on trends to ensure appropriate pricing. Regular internal risk and issue reporting ensures transparency at all stages. underwriting systems across the Group provide timely information on risks assumed and capacity committed.
insurance risk management includes overseeing risk-taking activities, as well as ensuring that an appropriate risk governance framework is defined and operated.
54 Swiss Re 2013 Financial Report
RiSk and capital management | RISk ASSeSSMent

description
life and health risk
developments in 2013
management
change from 2012 99% tail VaR
Swiss Re’s life and health insurance risk arises from the business we take on when providing mortality (death), longevity (annuity), and morbidity (illness and disability) coverage through both the Reinsurance Business unit, and when acquiring run-off business through the Admin Re® Business unit. In addition to potential shock events, such as a severe pandemic, we monitor and manage underlying risks inherent in life and health contracts (such as pricing and reserving risks) that arise when mortality, morbidity, or lapse experience deviates from expectations. the investment risk that is part of some life and health business is monitored and managed as financial market risk.
the decrease by 10% in Swiss Re’s life and health risk in 2013 was mainly driven by the rise in long-term interest rates throughout the year. Mortality trend risk, a major component of the life and health business, decreased significantly as the long time horizon of mortality trend risk means that changes in interest rates impact the economic value of future liabilities. updating the mortality and lapse assumptions used in the internal risk model, to take into account our most recent experience, further reduced life and health 99% tail vaR.
We have an aggregate Group limit governing the acceptance of all life and health risks, with separate individual limits for mortality, longevity, and lethal pandemic risk.
At the Business unit level, acceptance of life and health risks is governed by aggregated Business unit limits. Local teams can write reinsurance within their allocated capacity and clearly defined boundaries, such as per-life retention limits for individual business.
these developments are only partially offset by the increase in new business for both life and health portfolios. Lethal pandemic risk, the other major contributor to life and health risk, increased (see above table) mostly due to new business growth in group life insurance. Group life business, unlike individual life business, is renewed annually and is exposed to the shock of a lethal pandemic, but is not exposed to mortality trend risk which develops over time.
Market exposure limits are in place for catastrophe and stop-loss business. We pay particular attention to accumulation risk in densely populated areas and apply limits for individual buildings.
As in property and casualty, all large, complex, or unusual transactions are reviewed and require individual approval from Products underwriting, client Management, and Risk Management.
We manage the risk exposure of Swiss Re’s life and health book by external retrocession and also issue insurance-linked securities to reduce peak exposures.
insurance risk stress tests: Single event losses with a 200-year return period1 Pre-tax impact on economic capital in uSd billions, as of 31 december 2012 2013 change in %
natural catastrophesAtlantic hurricane –2.8 –4.5 60californian earthquake –2.4 –3.5 47european windstorm –2.6 –3.8 44Japanese earthquake –2.9 –3.3 16
life insuranceLethal pandemic –2.6 –2.9 11
1 Single event losses with a 200-year return period show for example that there is a 0.5% probability over the next year that the loss from a single Atlantic hurricane event could exceed uSd 4.5 billion. the impact excludes earned premiums for the business written and reinstatement premiums that could be triggered as a result of the event.
Swiss Re 2013 Financial Report 55
RiSk and capital management | RISk ASSeSSMent

description
Financial market risk
developments in 2013
management
change from 2012 99% tail VaR
Financial market risk is the risk that Swiss Re’s assets or liabilities may be affected by movements in financial market prices or rates — such as equity prices, interest rates, credit spreads, foreign exchange rates, or real estate prices. our financial market risk originates from two main sources: our own investment activities and the sensitivity of the economic value of liabilities to financial market fluctuations. Swiss Re actively manages the potential mismatch in financial market risk between its liabilities and the assets it holds.
In 2013, Swiss Re’s overall financial market tail vaR increased by 27% (see table on page 53) as a result of the re-balancing of the Group’s investment portfolio, mainly due to additional investments in listed equities, exchange traded funds and corporate bonds and the implementation of a substantial short duration position during 2013.
the table on page 57 shows Swiss Re’s sensitivity to various market scenarios. overall interest rate sensitivity rose substantially, driven by the short duration position implemented during 2013. the exposure to equity market risk significantly
Financial market risks are subject to limits at various levels of the organisation (eg, Group, Business units, lines of business and legal entities). Individual limits are expressed in terms of stress testing, vaR and risk factor sensitivities. Asset Management determines a more detailed set of risk limits for its portfolio mandates.
Financial Risk Management regularly reviews and updates the risk framework. the unit is also responsible for monitoring financial market risk in accordance with our risk management standards. daily and
increased, as a result of additional investments, along with growth in the asset value of existing holdings. the equity scenario includes listed and private equities, hedge funds, equity derivatives, equity exposure embedded in insurance liabilities (eg guaranteed minimum death benefit products, including variable annuities), fee income related to equities in unit-linked business, and funding obligations from equity holdings in Swiss Re pension funds. the sensitivity to credit spread widening increased due to additional investments in credit products.
weekly Group-level reports are provided on risks, and on specific limits for internally and externally managed investment mandates and for the Business units. these reports track exposures, document limit usage (which is independently monitored by Financial Risk Management), and provide information on key risks that could affect the portfolio. Specific limits are assigned to line of business heads, who seek to optimise their portfolios within those limits. the reports are presented and discussed with those responsible for the relevant business line at the weekly Asset Management Risk committee.
this process is complemented by regular risk discussions between Financial Risk Management, Asset Management and the Group’s external fund managers.
Financial market and credit risk
Financial Risk Management oversees financial market activities, sets limits, provides quantitative risk assessment across financial risk factors, and monitors portfolio risk; it also develops tactical proposals for risk mitigation or risk reduction, reviews risk and valuation models, assesses asset valuations, and approves transactions and new products. these responsibilities are exercised
through defined governance procedures, including monthly reviews by our Asset Management Senior Risk committee, where the Head of Financial Risk Management is a voting member. Financial Risk Management is responsible for both internally managed assets and Swiss Re’s external investment mandates.
group-wide financial market and credit risk management involves identifying, assessing, and controlling risks inherent in the financial and credit markets, while monitoring compliance with our risk management standards. Both risk categories are managed by our Financial Risk management team.
56 Swiss Re 2013 Financial Report
RiSk and capital management | RISk ASSeSSMent

description
credit risk
developments in 2013
management
change from 2012 99% tail VaR
credit risk is primarily the risk of incurring a financial loss from the default of Swiss Re’s counterparties or of third parties. We also take account of the increase in risk from any deterioration in credit ratings. credit risk arises directly from our investment activities as well as from liabilities underwritten by our Business units and from retrocession.
Swiss Re distinguishes between three types of credit exposure: the risk of issuer default from instruments in which Swiss Re invests or trades, such as corporate bonds; counterparty exposure in a direct
In 2013 Swiss Re’s credit risk increased by 54%, mainly due to an increased amount of corporate bonds in the Group's investment portfolio following the re-balancing, along with growth in our credit and surety re/insurance business. Both drivers also resulted in an increase in exposure to a defined credit default stress situation (see table above). this stress test is based on 20 years of historical corporate default data from Moody’s and assumes that a combination of the worst observed 12-month default frequencies for each credit rating category occurs in all of them in the same year.
credit risk is managed and monitored by a dedicated credit Risk Management team within our Financial Risk Management unit. In addition to the credit stress limit set by the Group Risk and capital committee, we assign aggregate credit limits by Business unit, corporate counterparty, and country. these limits are based on a variety of factors, including the prevailing economic environment, the nature of the underlying credit exposures, and (in the case of corporate counterparties) a detailed internal assessment of a corporate entity’s financial strength, industry position, and other qualitative factors. Risk Management is also responsible for
regularly monitoring corporate counterparty credit quality and exposures, and compiling watch lists of cases that merit close attention.
Risk Management monitors and reports credit exposure and limits for the Group and its Business units on a weekly basis. the reporting process is supported by a Group-wide credit exposure information system that contains all relevant data, including corporate counterparty details, ratings, credit risk exposures, credit limits, and watch lists. All key credit practitioners in the Group and Business units have access to this system, thus providing the necessary transparency to implement
specific exposure management strategies for individual counterparties, industry sectors, and geographic regions.
to take account of country risks other than from credit default, Swiss Re’s Political and Sustainability Risk Management unit prepares specific country ratings in addition to the sovereign ratings used by the Group and the Business units. these ratings are considered in the decision-making process, and cover political, economic and security-related country risks.
contractual relationship, such as retrocession or over-the-counter derivatives; and risk assumed by Swiss Re through reinsurance contracts, such as trade credit and surety reinsurance business. credit risk is viewed separately from credit spread risk, which is included under financial market risk.
Financial market and credit risk stress testsPre-tax impact on economic capital in uSd billions, as of 31 december 2012 2013 change in %
market scenarios100bp increase in credit spreads –3.3 –3.6 1030% fall in global equity markets (incl. hedge funds) –2.9 –4.3 4915% fall in global real estate markets –0.6 –0.6 0100bp parallel increase in global yield curves –0.1 0.6 –654
credit stress testcredit default stress –1.5 –2.0 33
Swiss Re 2013 Financial Report 57
RiSk and capital management | RISk ASSeSSMent

Risk modelling and risk measures
within a given range. From this distribution, we derive a base capital requirement that captures the potential for severe, but rare, aggregate losses over a one-year time horizon. Swiss Re’s risk model assesses the potential economic loss at a specific confidence level. there is thus a possibility that actual losses may exceed the selected threshold. In addition, the reliability of the model may be limited when future conditions are difficult to predict. For this reason, we continuously review and update our model and its parameters to reflect changes in the risk environment and current best practice. We complement our risk models by ensuring a sound understanding of the underlying risks and applying robust internal controls.
– +
Likelihood
economic profit and loss distribution (one-year horizon)
99% vaR
99% tail vaR
1 in 100 year loss expected result
the risk measures derived from the integrated risk model are expressed as economic loss severities taken from the total economic profit and loss distribution. In line with the SSt, Swiss Re measures its total capital requirement at 99% tail vaR (expected shortfall). this represents an estimate of the average annual loss likely to occur with a frequency of less than once in one hundred years. A less conservative measure is the 99% value at risk (vaR), which measures the loss likely to be exceeded in only one year out of one hundred. 99.5% value at risk (vaR) measures the loss likely to be exceeded in only one year out of two hundred.
We use a proprietary integrated risk model to determine the capital required to support the risks on Swiss Re’s books, and to allocate risk-taking capacity to the different lines of business. our internal model is based on two important principles. First, it applies an asset-liability management (ALM) approach, which measures the net impact of risk on the economic value of both assets and liabilities. Second, it adopts an integrated perspective, recognising that a single risk factor can affect different sub-portfolios and that different risk factors can have mutual dependencies.
Swiss Re’s risk model provides a meaningful assessment of the risks to which the Group is exposed and is an important tool for managing our business. It is used for determining capital requirements for internal purposes and for regulatory reporting under the Swiss Solvency test (SSt). the model provides the basis for capital cost allocation in our economic value Management (evM) framework, which is used for pricing, profitability evaluation, and compensation decisions (see pages 47–48 for further information on evM).
the model generates a probability distribution for the Group’s annual economic profit and loss, specifying the likelihood that the outcome will fall
58 Swiss Re 2013 Financial Report
RiSk and capital management | RISk ASSeSSMent

Operational riskoperational risk is defined as the expected and unexpected economic impact of inadequate or failed internal processes, from people and systems, or from external events. the definition includes legal and regulatory risks (see also page 60), as well as financial reporting risk, defined as the risk that a material misstatement is made by the Group in its financial statements, causing significant reputational damage.
Swiss Re mitigates these risks using an approach based on three lines of defence. the first is the day-to-day risk management activities of the individual risk takers in the Business units and corporate and enabling functions. the second line of defence comprises the independent oversight functions of Risk Management and compliance. the third consists of independent audits of processes and procedures carried out by Group Internal Audit.
the purpose at every stage is to identify and manage cost-effectively those operational events with the potential to cause large financial loss or significant reputational damage.
Members of Swiss Re’s Group Management Board and executive committee are required to assess and certify the effectiveness of the internal control system for their particular Business unit or corporate or enabling Function on a quarterly basis.
Strategic riskStrategic risk for Swiss Re represents the risk that poor strategic decision-making, execution, or response to industry changes or competitor actions could harm Swiss Re’s competitive position and thus its franchise value.
the responsibility for managing strategic risk lies with the Board of directors. It is addressed by examining multi-year scenarios, considering the related risks, as well as monitoring the implementation of the chosen strategy year-by-year in terms of the annual business plan. the operational risks of implementing the strategy are reviewed through our integrated assurance framework comprising business management, risk management and independent internal audits.
Swiss Re 2013 Financial Report 59
RiSk and capital management | RISk ASSeSSMent

Regulatory riskRegulatory risk represents the potential impact of changes in the regulatory and supervisory regimes of the countries in which we operate. the global regulatory agenda continued to accelerate in 2013. Governments and regulators rolled out new policies and conducted numerous consultations on rules and regulations with direct impact on the insurance sector. Many reform proposals reflect the financial supervision agenda set by the G20, which includes a focus on internationally active insurers and systemically important companies.
Swiss Re is actively engaged in the regulatory dialogue and supports reform to achieve regulatory convergence and increased application of economic and risk-based principles. However, the insurance industry, together with Swiss Re, remains concerned about the cumulative and cross-sectorial impacts of the reforms. Regulatory fragmentation is a key threat — particularly in europe, with the challenges in introducing Solvency II, but also in the context of transatlantic dialogue and the protectionist measures introduced in some growth markets. All these trends threaten to reverse progress toward a more coordinated global system.
there are also concerns that the design and implementation of regulatory reforms may increase procyclicality, which would exacerbate the effects of short-term market volatility. In 2013, Swiss Re participated in various consultations with the Financial Stability Board (FSB), oecd, the european Insurance and occupational Pensions Authority (eIoPA) and the european commission on the implications of regulatory reforms on long-term finance. In Solvency II, the institutions agreed to address the concerns regarding excessive volatility on long-term guarantee products.
In July, the FSB and the International Association of Insurance Supervisors (IAIS) published their first list of companies designated as globally systemically important insurers (G-SIIs). the designation of reinsurers as G-SIIs has been delayed until July or november 2014. Systemically important insurers will be subject to higher capital requirements; for this purpose, the FSB and IAIS announced the introduction of a basic capital requirement applicable to G-SIIs. In october, the IAIS confirmed its commitment to developing a global insurance capital standard (IcS), which will be applicable to large insurance groups, including Swiss Re, as part of comFrame, the IAIS common framework for international group supervision.
Swiss Re remained fully engaged in the regulatory debate during 2013, striving to mitigate potentially negative impacts while supporting reforms that could facilitate convergence of regulatory standards and generate business opportunities.
Reputational riskSwiss Re’s continued business success depends on maintaining our reputation with clients, investors, employees, and other stakeholders. environmental, socio-economic and related ethical risks to reputation may arise from individual business transactions; our reputation could also be damaged by operational failures.
We have a long-standing commitment to sustainable business practices, active corporate citizenship, and good governance. We mitigate potential damage to our reputation through clear corporate values, robust internal controls, and active dialogue with external stakeholders. All our employees are required to commit to and comply with the values and rules of behaviour defined in the Group code of conduct and further internal Swiss Re policies and guidelines. We support these values with processes that enable us to identify potential problems early.
60 Swiss Re 2013 Financial Report
RiSk and capital management | RISk ASSeSSMent

We have a formal framework to manage environmental, socio-economic, and related ethical risks that may be inherent in some of our business transactions. currently, this framework contains eight policies for sectors or issues, each with pre-defined exclusions, criteria and quality standards. transactions that could potentially compromise these standards need to be submitted to our Sensitive Business Risks process for review by our sustainability experts. We also consider the potential impact on Swiss Re’s reputation when assessing and controlling operational risk.
In addition, Swiss Re has been actively contributing over the years to the development of the un Principles for Sustainable Insurance (un PSI) and is currently co-chairing this initiative. As a founding signatory at the un conference on Sustainable development in Rio de Janeiro in 2012, Swiss Re reported progress against the un principles for the first time in its corporate Responsibility report in June 2013.
In 2013, Swiss Re was, for the seventh consecutive year, awarded the “RobecoSAM Gold class distinction” for superior sustainability performance in the dow Jones Sustainability Index (dJSI).
emerging risksAnticipating possible developments in Swiss Re’s risk landscape is an important element of our integrated approach to enterprise risk management. We encourage pre-emptive thinking on risk in all areas of our business, combining our broad claims experience and risk expertise with a structured horizon-scanning process. the key objectives are to reduce uncertainty and help diminish the volatility of the Group’s results, while also identifying new business opportunities and raising awareness both within the Group and across the industry.
our internal SonAR (Systematic observation of notions Associated with Risk) system gives Swiss Re employees a forum to raise ideas on emerging risks and report early signals using an interactive platform. this information is complemented with insights from collaboration with think tanks, academic networks, and international organisations and institutions. Findings are reported at annual intervals to senior management and other internal stakeholders, providing them with a prioritised overview of newly identified emerging risks, along with an estimate of their potential impact on Swiss Re’s business and recommendations for risk mitigation.
to further advance risk awareness across the industry and beyond, Swiss Re continues to participate actively in strategic risk initiatives such as the World economic Forum’s Risk Response network, the International Risk Governance council, and the cRo Forum’s emerging Risk Initiative. We contributed to several publications on emerging risk topics in 2013, including the World economic Forum’s annual Global Risks Report and a cRo Forum position paper, “Food and its impact on the risk landscape.”
Swiss Re 2013 Financial Report 61
RiSk and capital management | RISk ASSeSSMent

62 Swiss Re 2013 Financial Report

coRpoRate goveRnance | IntRoductIon
Swiss Re 2013 Financial Report 63
64 overview66 group structure and shareholders69 capital structure 72 Board of Directors 86 executive management92 Shareholders’ participation rights93 changes of control and defence measures94 auditors96 Information policy
corporate Governancetransparent and comprehensive disclosure of the Group’s governance structure and governance processes is indispensable to support the assessment of the quality of the Group’s organisation and business conduct.

oveRvIew
Swiss Re’s corporate governance adheres to the SIX Swiss exchange’s directive on Information Relating to corporate Governance, including its annex. It is also in line with the principles of the Swiss code of Best Practice for corporate Governance (Swiss code) issued in 2002 by economiesuisse, the Swiss business federation. An additional appendix was issued in 2007 which deals with compensation principles. Swiss Re, moreover, conforms to the Swiss Financial Market Supervisory Authority (FInMA) provisions on corporate governance, risk management and internal control systems, which came into effect on 1 January 2009. Swiss Re’s corporate governance also complies with applicable local rules and regulations in all jurisdictions where it conducts business. the Board of directors assesses the Group’s corporate governance on an annual basis against relevant best practice standards. It monitors corporate governance developments globally. It receives updates on developments affecting corporate governance from selected jurisdictions and considers the relevant studies and surveys on corporate governance. Information on compensation, shareholdings of and loans to members of the Board of directors and the Group executive committee (Group ec) is provided on pages 105–127 and in the notes to the Group financial statements included in this report.
Swiss Re’s corporate governance frameworkSwiss Re’s Board of directors is responsible for oversight, while the Group ec is responsible for managing operations. this structure maintains effective mutual checks and balances between the top corporate bodies. our corporate governance principles and procedures are defined in a series of documents governing the organisation and management of the company. these include at the Group level: the code of conduct, outlining our
compliance framework and setting out the basic legal and ethical principles and policies we apply globally;
the corporate Governance Guidelines, (Guidelines) setting forth the Group’s governance framework, principles and
processes, ensuring efficient and consistent corporate governance across the Group;
the Articles of Association, defining the legal and organisational framework of the Group’s holding company;
the Group Bylaws, defining the governance structure within the Group as well as the responsibilities of the Board of directors, chairman, Board committees, Group ec, Group ceo and Regional Presidents and the relevant reporting procedures;
the Board committee charters, outlining the duties and responsibilities of the Board committees;
the Group committee charters, outlining the duties and responsibilities of the committees at the Group ec level;
the instructions and guidelines describing working methods, governance processes and timetables of the Board of directors and Board committees.
Furthermore, they include at the Business unit level: Business unit regulations, defining the
governance structure and principles within the Business units Reinsurance, corporate Solutions and Admin Re® in line with the Group Bylaws.
2013 focus areasReview corporate governance guidelinesthe Group’s new Guidelines have been in force since 1 January 2013. At the end of 2013 the Board of directors reviewed and amended the Guidelines based on recommendations by the chairman’s and Governance committee. the stakeholders working with the Guidelines had been asked for feedback on the Group’s governance requirements and related processes. the amendments aim to streamline governance processes as far as possible to gain efficiency while maintaining high-quality corporate governance.
governance compliance review across the group In 2013, the Group’s legal entities were reviewed in a comprehensive exercise across the Group for their compliance with the Guidelines and the respective
governance requirements. the Board of directors of the Group’s most important legal entities have conducted governance self-assessments and the remaining legal entities were asked to complete a certification process. the results of the exercise showed that the Group’s legal entities have fit-for-purpose governance structures.
Diversity diversity is important to the Group. Swiss Re drives several external and internal initiatives supporting diversity in various areas. In line with those efforts the Group is pleased that with the election of Mary Francis, the Board of directors currently has two female members.
Introduction of electronic voting at agM 2013In order to facilitate voting for shareholders not able to attend the Annual General Meeting physically, Swiss Re introduced at the Annual General Meeting 2013 — as one of the first publicly listed Swiss companies — the possibility for the shareholders to instruct the Independent Proxy electronically via the investor web service on www.sherpany.com/swissre.
“Minder” ordinancethe “ordinance Against excessive compensation at Public corporations” (the ordinance) entered into effect on 1 January 2014. Swiss Re is undertaking the steps necessary to ensure timely compliance with the ordinance’s requirements. the requirement of electronic voting had already been introduced at the Annual General Meeting 2013. to the extent necessary amendments to the Articles of Association will be proposed to the Annual General Meeting 2014 for approval. Furthermore, starting with the Annual General Meeting 2014, the shareholders will elect annually and individually for a one-year term all the members of the Board of directors, the chairman of the Board of directors as well as the members of the compensation committee. the Annual General Meeting 2014 will also elect the Independent Proxy.
64 Swiss Re 2013 Financial Report
coRpoRate goveRnance

Mary Francis was elected as new member to the Board of directors by the shareholders at the AGM which took place in Zurich on 10 April 2013.
In line with the Group’s diversity efforts, Swiss Re is pleased that with the election of Mary Francis, the Board of directors currently has two female members.
three current members of the Board of directors are not standing for re-election at the Annual General Meeting 2014: – Jakob Baer; he served as the chair
of the Audit committee since his election to the Board, from 2005 to 2014;
– John R. coomber; he was Swiss Re’s Group ceo from 2003 to 2005 and was in various positions with the Swiss Re Group for 41 years;
– Malcolm d. Knight; he has been a Board member since 2010 and a member of the Audit committee and the Investment committee.
the Board of directors nominated Susan L. wagner to be proposed to the Annual General Meeting 2014 for election as new Board member.
George Quinn will leave the Group and step down as Group cFo and member of the Group ec as of 30 April 2014.
david cole, Swiss Re’s Group chief Risk officer since March 2011, was appointed Group cFo as of 1 May 2014.
Key developments in 2013/2014
Board of Directors and group ec
the Group’s corporate Governance Guidelines (Guidelines), which have been effective since 1 January 2013, have been reviewed by the chairman’s and Governance committee and reviewed and amended by the Board of directors to ensure even smoother corporate Governance processes and to achieve efficiency.
the Group has completed a comprehensive exercise in 2013 measuring the Group’s legal entities’ compliance with the Group’s Guidelines and requirements. It was found that the Group’s legal entities have fit-for-purpose Governance structures.
corporate governance
the “ordinance Against excessive compensation at Public corporations” (ordinance) became effective on 1 January 2014.
Swiss Re will ensure timely adherence to the ordinance’s requirements.
Swiss Re had already introduced the possibility for shareholders to instruct the Independent Proxy electronically, via the investor web service on www.sherpany.com/swissre, for the Annual General Meeting 2013.
next steps in 2014: – Amendments to Articles of
Association will be proposed to Annual General Meeting 2014 for approval;
– Annual General Meeting must elect for a one-year term Board of directors members, Board of directors chairman and members to the compensation committee individually;
– Annual General Meeting must elect Independent Proxy (an independent voting representative for shareholders).
“Minder” ordinance
Swiss Re 2013 Financial Report 65
coRpoRate goveRnance | oveRvIew

GRouP StRuctuRe And ShARehoLdeRS
Legal structure — listed and non-listed group companiesSwiss Re Ltd, the Group’s holding company, is a joint stock company, listed, in accordance with the Main Standard, on the SIX Swiss exchange (ISIn ch0126881561), domiciled at Mythenquai 50/60 in 8022 Zurich, and organised under the laws of Switzerland. Information on its market capitalisation is provided on page 39 of this report. no other Group companies have shares listed. More information on the Group companies is provided in note 18 to the Group financial statements on pages 220–222.
Swiss Re Ltd has a level I American depositary Receipts (AdRs) programme in the uS. the AdRs are traded over the counter (ISIn uS8708861088, otc symbol SSReY). neither the AdRs, nor the underlying Swiss Re shares, are listed on a securities exchange in the uS.
the voting rights entered into the commercial register, whether or not the voting rights can be exercised. notifications must also include financial instruments, regardless of whether cash or physically settled, constituting a purchase or a sale position. upon receipt of such notifications, the company is required to inform the public by publishing within two trading days the notification on the electronic platform of the SIX Swiss exchange. the following table provides a summary of the current disclosure notifications.
group structureoperational group structure
Reinsurance Americas Asia europe,
Middle east & Africa Globals Property & Specialty
underwriting casualty
underwriting Property & casualty
Business Management
Life & health Products Life & health Business
Management Finance Reinsurance
corporate Solutions Regions Products & Global
Markets claims Finance corporate
Solutions operations corporate
development
admin Re® origination &
Structuring Pricing & Portfolio
Management Asset Management Pricing Reassure Admin Re® Admin Re® Services,
Admin Re® uK Regional
Management Admin Re® uS
Finance Admin Re® Legal Admin Re®
group chief executive officer group executive committee
enabling Unitscorporate Functions Business Units
group Underwriting
group asset Management
group operations human Resources Legal & compliance Information
technology communications Global Service
operations corporate Real
estate & Logistics
group Strategy
group Risk Management
group Finance
Significant shareholders and shareholder structureunder the Swiss Federal Act on Stock exchanges and Securities trading (SeStA), anyone holding shares in a company listed on the SIX Swiss exchange is required to notify the company and the SIX Swiss exchange if their direct or indirect holding reaches, falls below or exceeds the following thresholds: 3%, 5%, 10%, 15%, 20%, 25%, 33⅓%, 50% or 66⅔% of
66 Swiss Re 2013 Financial Report
coRpoRate goveRnance

Significant shareholders
In addition, Swiss Re Ltd and Group companies held, as of 31 december 2013, directly and indirectly, 28 512 910 shares, representing 7.7% of voting rights and share capital. neither the company nor the Group companies can exercise the voting rights of the own shares they hold themselves. All notifications received in 2013 are published at http://www.swissre.com/investors/shares/disclosure_of_shareholdings/and http://www.six-exchange-regulation.com/obligations/disclosure/major_shareholders_en.html.
Shareholder structureRegistered – unregistered shares
Registered shares with voting rights by shareholder type
Shareholder1,2 number of shares% of voting rights and share capital
creation of the obligation to notify
Franklin Resources, Inc. 18 277 452 4.93 2 August 2012warren e. Buffett and Berkshire hathaway Inc. 11 262 000 3.10 10 June 2011 BlackRock, Inc. 11 134 246 3.09 26 September 2011
1 In the context of Swiss Reinsurance company Ltd’s issuance of Perpetual Subordinated capital Instruments in 2012 with a face value of uSd 750 million with a stock settlement in registered shares of Swiss Re Ltd, Aquarius + Investments plc (“Aquarius”) reported in compliance with SeStA and the ordinance of the Swiss Financial Market Supervisory Authority on Stock exchanges and Securities trading (Stock exchange ordinance – FInMA, SeSto-FInMA) a disclosable purchase and a sales position. each corresponding to 6.32% of the voting rights. Aquarius does not hold any registered shares of Swiss Re Ltd.
2 during the reporting period, dodge & cox and MFS Investment Management, which had been reported as significant shareholders in 2012, fell below the 3% threshold due to sale of securities.
Registered shareholdings by countryas of 31 december 2013
47.8% Switzerland
20.9% United Kingdom
16.3% USA
15.0% Other
Registered shareholders by typeas of 31 december 2013
73.1% Institutional shareholders
23.6% Individual shareholders
3.3% Swiss Re employees
73.1% Institutional shareholders
23.6% Individual shareholders
3.3% Swiss Re employees
47.8% Switzerland
20.9% united Kingdom
16.3% uSA
15.0% other registered shareholders
As of 31 december 2013 Shareholders in % Shares in %
Individual shareholders 60 796 89.7 46 779 046 23.6Swiss Re employees 3 354 4.9 6 557 054 3.3total individual shareholders 64 150 94.6 53 336 100 26.9Institutional shareholders 3 656 5.4 145 147 083 73.1total 67 806 100.0 198 483 183 100.0
As of 31 december 2013 Shares in %
Shares registered in the share register1 198 483 183 53.5unregistered shares1 143 710 838 38.8Shares held by Swiss Re 28 512 910 7.7total shares issued 370 706 931 100.0
1 excluding shares held by Swiss Re Ltd and Group companies
Swiss Re 2013 Financial Report 67
coRpoRate goveRnance | GRouP StRuctuRe And ShARehoLdeRS
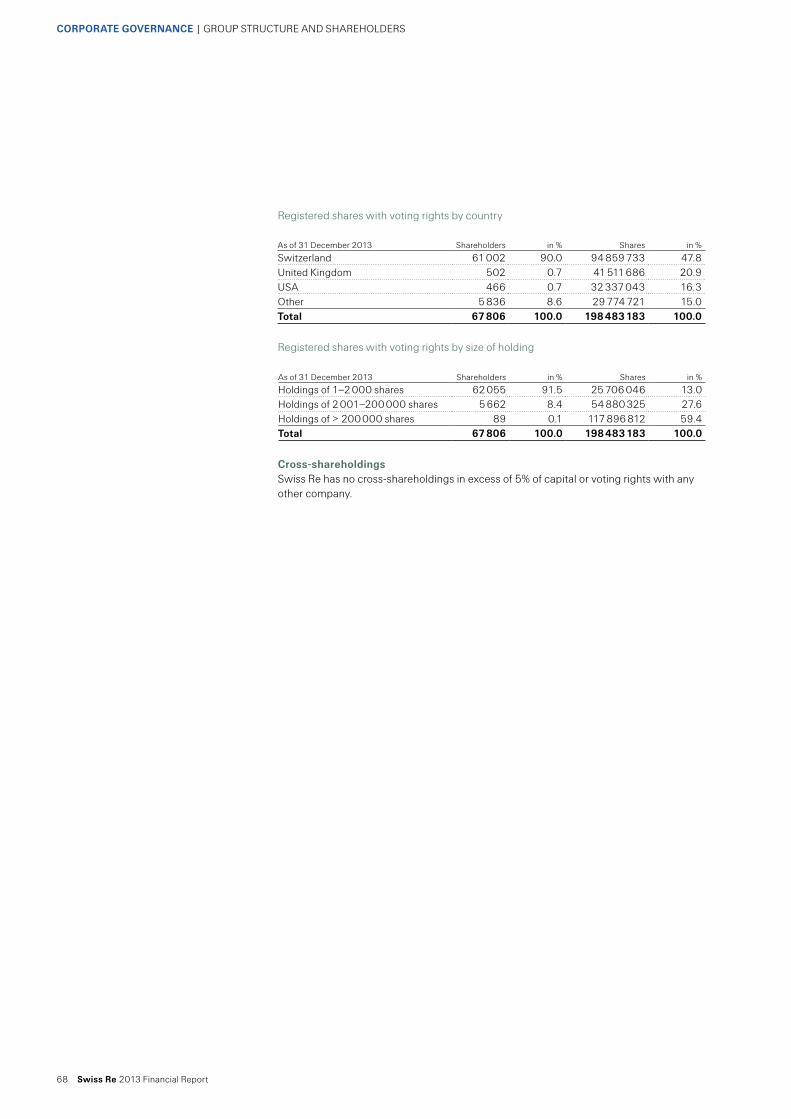
Registered shares with voting rights by country
Registered shares with voting rights by size of holding
cross-shareholdingsSwiss Re has no cross-shareholdings in excess of 5% of capital or voting rights with any other company.
As of 31 december 2013 Shareholders in % Shares in %
Switzerland 61 002 90.0 94 859 733 47.8united Kingdom 502 0.7 41 511 686 20.9uSA 466 0.7 32 337 043 16.3other 5 836 8.6 29 774 721 15.0total 67 806 100.0 198 483 183 100.0
As of 31 december 2013 Shareholders in % Shares in %
holdings of 1–2 000 shares 62 055 91.5 25 706 046 13.0holdings of 2 001–200 000 shares 5 662 8.4 54 880 325 27.6holdings of > 200 000 shares 89 0.1 117 896 812 59.4total 67 806 100.0 198 483 183 100.0
68 Swiss Re 2013 Financial Report
coRpoRate goveRnance | GRouP StRuctuRe And ShARehoLdeRS
cAPItAL StRuctuRe
31 december 2012 31 December 2013capital in chF Shares capital in chF Shares
Share capital 37 070 693.10 370 706 931 37 070 693.10 370 706 931conditional capital
for equity-Linked Financing Instruments 5 000 000.00 50 000 000 5 000 000.00 50 000 000
Authorised capitalregular 8 500 000.00 85 000 000 8 500 000.00 85 000 000for exchange of shares 4 005 061.30 40 050 613 0.00 0
capitalAs of 31 december 2013, the fully paid-in share capital of Swiss Re Ltd amounted to chF 37 070 693.10. It was divided into 370 706 931 registered shares, each with a par value of chF 0.10.
the table below provides an overview of the issued, conditional and authorised capital of Swiss Re Ltd as of 31 december 2013, compared with the issued, conditional and authorised capital as of 31 december 2012.
More information is provided in the sections “conditional and authorised capital in particular” below and “changes in capital” on page 70.
conditional and authorised capital in particularconditional capitalAs of 31 december 2013, the conditional capital of Swiss Re Ltd consisted of the following category:
conditional capital for equity-Linked Financing Instrumentsthe share capital of the company may be increased up to chF 5 000 000 by issuing a maximum of 50 000 000 registered shares, payable in full, each with a nominal value of chF 0.10. Such shares are issued through the voluntary or mandatory exercise of conversion and/or option rights granted by the company or Group companies in connection with bonds or similar instruments, including loans or other financial instruments (equity-Linked Financing Instruments).
existing shareholders’ subscription rights are excluded. the then current holders of the conversion and/or option rights granted in connection with equity-Linked Financing Instruments shall be entitled to subscribe for the new registered shares. Subject to the Articles of Association, the Board of directors may decide to restrict or exclude existing shareholders’ advance subscription rights with regard to these equity-Linked Financing Instruments. Such decision may be made in order to issue equity-Linked Financing Instruments on national and/or international capital markets (including private placements to selected strategic investors), and/or to finance or re-finance the acquisition of companies, parts of companies, participations or new investments planned by the company and/or Group companies.
If advance subscription rights are excluded, then the equity-Linked Financing Instruments are to be placed at market conditions, the exercise period is not to exceed ten years for option rights and 20 years for conversion rights, and the conversion or exercise price for the new registered shares is to be set at least in line with the market conditions prevailing at the date on which the equity-Linked Financing Instruments are issued.
the acquisition of registered shares through the exercise of conversion or option rights and any further transfers of registered shares shall be subject to the restrictions specified in the Articles of Association.
authorised capitalAs of 31 december 2013, the authorised capital of Swiss Re Ltd was as presented in the table below.
According to the Articles of Association, the Board of directors is authorised to increase the share capital of the company at any time up to 10 April 2015 by an amount not exceeding chF 8 500 000 through the issue of up to 85 000 000 registered shares, payable in full, each with a nominal value of chF 0.10. Increases by underwriting as well as partial increases are permitted. the Board of directors determines the date of issue, the issue price, the type of contribution and any possible acquisition of assets, the date of dividend entitlement as well as the expiry or allocation of non-exercised subscription rights.
the subscription rights of existing shareholders may not be excluded with respect to a maximum of chF 5 000 000 through the issue of up to 50 000 000 registered shares, payable in full, each with a nominal value of chF 0.10, out of the total amount of authorised capital.
Swiss Re 2013 Financial Report 69
coRpoRate goveRnance

Joint provision for conditional capital for equity-Linked Financing Instruments and for the above-mentioned authorised capitalthe total of registered shares issued from the authorised capital, where the existing shareholders’ subscription rights were excluded, and from the shares issued from conditional capital, where the existing shareholders’ advance subscription rights on the equity-Linked Financing Instruments were excluded, may not exceed 74 000 000 registered shares up to 10 April 2015.
changes in capitalchanges in 2013the Annual General Meeting of shareholders 2013 approved that the limitation included in the provisions of the Articles of Association to issue registered shares from conditional capital, where the existing shareholders’ advance subscription rights on the equity-Linked Financing Instruments were excluded, be extended to 10 April 2015 and the maximum number of shares under the same paragraph be set to 74 000 000 from 74 140 927 previously.
the Annual General Meeting of shareholders 2013 also approved that the authority to issue registered shares from authorised capital as set forth in the Articles of Association be extended to 10 April 2015 and that the limitation included in the Articles of Association to issue registered shares from authorised capital where the existing shareholders’ subscription rights were excluded, be extended to 10 April 2015 and the maximum number of registered shares under that provision be set to 74 000 000 from 74 140 927 previously.
the Annual General Meeting of shareholders furthermore approved the cancellation of the authorised capital created for the use as consideration for any remaining minority shareholders of Swiss Reinsurance company Ltd for any voluntary or mandatory surrendering of their shares in Swiss Reinsurance company Ltd after the execution of the public exchange offer at any time up to 20 May 2013 by an amount not exceeding chF 4 005 061.30 through the issue of up to 40 050 613 registered shares, payable in full, each with a nominal value of chF 0.10.
changes in 2012no changes in share capital took place during 2012.
changes in 2011 and previous yearsInformation about changes in share capital in 2011 is provided on pages 59 and 60 of the 2011 Annual Report. Information about changes in share capital of Swiss Reinsurance company Ltd for earlier years is provided in the Annual Reports of our predecessor Swiss Reinsurance company Ltd for the respective years.
the Board of directors may exclude or restrict the subscription rights of existing shareholders with respect to a maximum of chF 3 500 000 through the issue of up to 35 000 000 registered shares, payable in full, each with a nominal value of chF 0.10, out of the total amount of authorised capital. Such exclusion or restriction relates to the use of shares in connection with mergers, acquisitions (including take-over) of companies, parts of companies or holdings, participations or new investments planned by the company and/or Group companies, financing or re-financing of such mergers, acquisitions or new investments, the conversion of loans, securities or equity securities. exclusion and restriction may also relate to improving the regulatory capital position of the company or Group companies, including private placements, in a fast and expeditious manner if the Board of directors deems it appropriate or prudent to do so.
the subscription and acquisition of the new registered shares, as well as each subsequent transfer of registered shares, shall be subject to the restrictions specified in the Articles of Association.
70 Swiss Re 2013 Financial Report
coRpoRate goveRnance | cAPItAL StRuctuRe
Shares All shares issued by Swiss Re Ltd are fully paid-in registered shares, each with a par value of chF 0.10. each share carries one vote. there are no categories of shares with a higher or limited voting power, privileged dividend entitlement or any other preferential rights, nor are there any other securities representing a part of the company’s share capital. the company cannot exercise the voting rights of treasury shares. As of 31 december 2013, shareholders had registered 198 483 183 shares for the purpose of exercising their voting rights, out of a total of 370 706 931 shares issued. As of 31 december 2013, 342 195 633 shares were entitled to dividend payment.
profit-sharing and participation certificatesSwiss Re Ltd has not issued any profit-sharing and participation certificates.
Limitations on transferability and nominee registrationsFree transferabilitythe company maintains a share register for the registered shares, in which owners and usufructuaries are entered.
the company may issue its registered shares in the form of single certificates, global certificates and intermediated securities. the company may convert its registered shares from one form into another at any time and without the approval of the shareholders. the shareholders have no right to demand a conversion into a certain form of registered shares. each shareholder may, however, at any time request a written confirmation from the company of the registered shares held by such shareholder, as reflected in the company’s share register.
the registered shares are administered as intermediated securities. the transfer of intermediated securities and furnishing of collateral in intermediated securities must conform to the Intermediary-held Securities Act. the transfer and furnishing of collateral by assignment is excluded.
Persons acquiring registered shares will, upon application, be entered in the share register without limitation as shareholders with voting power if evidence of the acquisition of the shares is provided and if they expressly declare that they have acquired the shares in their own name and for their own account and, where applicable, that they are compliant with the disclosure requirement stipulated by the Federal Act on Stock exchanges and Securities trading (SeStA). the Board of directors is allowed to remove the entry of a shareholder with voting rights from the share register retroactively from the date of entry if the entry was obtained under false pretences or if the owner, whether acting alone or as part of a group, has breached notification rules.
admissibility of nominee registrationsPersons not expressly declaring in their application for entry in the share register that they are holding shares for their own account (nominees) are entered without further inquiry in the share register of Swiss Re Ltd as shareholders with voting rights of up to a maximum of 2% of the outstanding share capital available at the time. Additional shares held by such nominees that exceed the limit of 2% of the outstanding share capital are entered in the share register with voting rights only if such nominees disclose the names, addresses and shareholdings of any persons for whose account the nominee is holding 0.5% or more of the outstanding share capital. In addition, such nominees must comply with the disclosure requirements of the SeStA.
convertible bonds and options convertible bondsAs of 31 december 2013, neither Swiss Re Ltd nor any of its subsidiaries has any bonds outstanding that are convertible into equity securities of Swiss Re Ltd solely at the option of bondholders.
during 2012, Swiss Reinsurance company Ltd issued chF 320 000 000 of 7.25% perpetual subordinated notes and uSd 750 000 000 of 8.25% perpetual subordinated capital instruments both with stock settlement (collectively the “subordinated securities”), which provide Swiss Reinsurance company Ltd with options to initiate settlement of the subordinated securities by delivery of shares of Swiss Re Ltd.
optionsStock options granted to Swiss Re employees will be settled with treasury shares. the number of issued shares will not be affected.
For details on stock options granted to Swiss Re employees, see note 13 to the Group financial statements on pages 202–204.
Swiss Re 2013 Financial Report 71
coRpoRate goveRnance | cAPItAL StRuctuRe

Members of the Board of DirectorsAccording to the Articles of Association, the Board of directors of Swiss Re Ltd, the holding company of the Swiss Re Group, consists of at least seven members. As of 31 december 2013 the Board of directors consisted of the following members:
BoARd oF dIRectoRS
name nationality Age Initial election*/**
walter B. Kielholz Swiss 62 1998(chairman)Mathis cabiallavetta Swiss 68 2008(vice chairman)Renato Fassbind Swiss 58 2011(vice chairman)Jakob Baer Swiss 69 2005Raymund Breu Swiss 68 2003Raymond K.F. ch’ien chinese 61 2008John R. coomber British 64 2006Mary Francis British 65 2013Rajna Gibson Brandon Swiss 51 2000c. Robert henrikson American 66 2012Malcolm d. Knight canadian 69 2010hans ulrich Maerki Swiss 67 2007carlos e. Represas Mexican 68 2010Jean-Pierre Roth Swiss 67 2010
* the members were initially elected to the Board of directors of Swiss Reinsurance company Ltd, the Group’s former parent company; all members were subsequently elected to the Board of directors of the Group’s new holding company, Swiss Re Ltd, on 17 February 2011 with the exception of the following members who were elected to the Board of directors of Swiss Re Ltd as follows; Renato Fassbind was elected on 15 April 2011, c. Robert henrikson was elected on 13 April 2012 and Mary Francis was elected on 10 April 2013.
** the members of the Board of directors were elected for a term of office which would have ended as follows: Mathis cabiallavetta, Renato Fassbind, Raymund Breu, Raymond K.F. ch’ien, Rajna Gibson Brandon, hans ulrich Maerki in 2014; Jakob Baer, John R. coomber and c. Robert henrikson in 2015; and walter B. Kielholz, Mary Francis, Malcolm d. Knight, carlos e. Represas and Jean-Pierre Roth in 2016. the “ordinance Against excessive compensation at Public corporations” entered into effect on 1 January 2014. It provides that the shareholders at the AGM must elect members of the Board of directors individually for one-year terms, beginning at the AGM 2014. the current terms of all members of the Board of directors therefore end at the AGM 2014.
company Secretary
Felix horber
Independence Swiss Re’s Group Bylaws stipulate that the Board of directors consists of at least a majority of independent members. to be considered independent, a director may not be employed as an executive officer of the Group, or have been employed in such function for the previous three years. Moreover, he or she must not have a material relationship with any part of the Group, directly or as a partner, director, or shareholder of an organisation that has a material relationship with the Group. All members of the Board of directors meet our independence criteria.
the members of the Board of directors are also subject to procedures to avoid any conflict of interest.
72 Swiss Re 2013 Financial Report
coRpoRate goveRnance

Walter B. Kielholz (1951), Swiss chairman, non-executive and independent
careerwalter B. Kielholz began his career at the General Reinsurance corporation, Zurich, in 1976. In 1986, he joined credit Suisse, where he was responsible for banking relationships with large insurance groups. he joined Swiss Re in 1989 where he became an executive Board member in 1993 and was chief executive officer from 1997 to 2002. he was vice chairman from 2003 until he was nominated chairman in 2009. In addition, he chairs the chairman’s and Governance committee of the Swiss Re Board.
external appointments Board member of
credit Suisse Group AG chairman of the european Financial
Services Round table, where the chairman and ceos of the largest european financial institutions meet regularly
Board member of the Institute of International Finance
Member of the Board of trustees of Avenir Suisse, the liberal Swiss think tank
chairman of the Zurich Art Society, the organisation that is in charge of the Zurich Kunsthaus
educational background Business finance and accounting
degree, university of St. Gallen, Switzerland
For full biographies, please visit swissre.com/about_us/leadership/
Mathis cabiallavetta (1945), Swiss vice chairman, non-executive and independent
careerMathis cabiallavetta held several positions at uBS AG from 1971, including President of the Group executive Board in 1996 and chairman in 1998. he joined Marsh & McLennan companies in 1999 and was vice chairman of the company from 2001 to 2004. he was elected to Swiss Re’s Board of directors in 2008 and became vice chairman in 2009. he chairs the Finance and Risk committee as well as the Investment committee and is a member of the chairman’s and Governance committee.
external appointments Board member of Philip Morris
International and BlackRock, Inc. executive Advisory Board member
of General Atlantic Partners (GAP) Former member of the Bank council
of Swiss national Bank Past vice chairman of the Board
of directors of the Swiss Bankers Association
Past committee member of the Board of directors of SIX Swiss exchange
Past member of the International capital Markets Advisory committee of the Federal Reserve Bank of new York
educational background Bachelor’s degree in economics,
university of Montreal, canada
Renato Fassbind (1955), Swiss vice chairman, non-executive and independent
careerAfter two years with Kunz consulting AG, Renato Fassbind joined F. hoffmann-La Roche AG in 1984, becoming head of Internal Audit in 1988. From 1986 to 1987, he worked as a public accountant with Peat Marwick in new Jersey, uSA. In 1990, he joined ABB Ltd as head of corporate Staff Audit and, from 1997 to 2002, was chief Financial officer and member of the Group executive committee. In 2002, he joined diethelm Keller holding Ltd as Group chief executive officer. From 2004 to 2010, he was chief Financial officer and member of the executive Board of credit Suisse Group AG. Renato Fassbind was elected to Swiss Re’s Board of directors in 2011 and is a member of the chairman’s and Governance committee, the Audit committee and the compensation committee.
external appointments Board member of Kühne + nagel
International Ltd Board member of hSBc holdings plc Board member of the Swiss Federal
Audit oversight Authority
educational background Phd in economics, university of Zurich,
Switzerland certified Public Accountant (cPA),
denver, uSA
Swiss Re 2013 Financial Report 73
coRpoRate goveRnance | BoARd oF dIRectoRS

Jakob Baer (1944), Swiss Member, non-executive and independent
careerJakob Baer began his career with the Swiss Federal Finance Administration. he joined Fides trust company in 1975, then following a buyout became a member of KPMG Switzerland’s Management Board in 1992. he was appointed chief executive officer of KPMG Switzerland in 1994 and became a member of KPMG’s european and international Management Boards. he retired from KPMG in 2004. Jakob Baer was elected to Swiss Re’s Board of directors in 2005. he chairs the Audit committee and is a member of the chairman’s and Governance committee.
external appointments Board member of Allreal holding AG,
Barry callebaut AG and Rieter holding AG
chairman of the Board of directors of Stäubli holding AG
educational background Attorney-at-Law, Bern, Switzerland Phd in Law, university of Bern,
Switzerland
Raymund Breu (1945), Swiss Member, non-executive and independent
careerRaymund Breu started in group treasury at Sandoz in 1975, rising to chief Financial officer of Sandoz corporation in new York in 1985. In 1990, he became Group treasurer of Sandoz Ltd and in 1993 head of Group Finance and a member of the executive Board. From 1996 to 2010, he was chief Financial officer and member of the executive committee of novartis. Raymund Breu was elected to Swiss Re’s Board of directors in 2003 and is a member of the Finance and Risk committee and the Investment committee.
external appointments Board member of nobel Biocare
holding AG Member of the Swiss takeover Board
educational background Phd in Mathematics, Swiss Federal
Institute of technology (eth), Zurich, Switzerland
Raymond K.F. ch’ien (1952), chinese Member, non-executive and independent
careerRaymond K.F. ch’ien was Group Managing director of Lam Soon hong Kong Group from 1984 to 1997 and chairman of cdc corporation from 1999 to 2011. he was elected to Swiss Re’s Board of directors in 2008 and is a member of the Audit committee and the Investment committee.
external appointments chairman of the Boards of directors
of MtR corporation Ltd and hang Seng Bank Ltd
Board member of the hong Kong and Shanghai Banking corporation Ltd, convenience Retail Asia Ltd, china Resources Power holdings company Ltd, the wharf (holding) Ltd and uGL Ltd
Member of the economic development commission of the Government of the hong Kong SAR
honorary president of the Federation of hong Kong Industries
trustee of the university of Pennsylvania
educational background Phd in economics, university of
Pennsylvania, uSA
74 Swiss Re 2013 Financial Report
coRpoRate goveRnance | BoARd oF dIRectoRS

John R. coomber (1949), British Member, non-executive and independent
careerJohn R. coomber has been the chief executive officer of Pension Insurance corporation Limited since 2008. he joined Swiss Re in the uK in 1973. From 1987, he led the Life division and, in 1993, was made head of the uK operations. he was appointed a member of the Group executive Board in 1995, responsible for the Life & health division. he became a member of the executive committee in 2000 and was Swiss Re’s chief executive officer from 2003 to 2005. he was elected to the Group’s Board of directors in 2006. he is a member of the chairman’s and Governance committee, the Audit committee and the compensation committee.
external appointments chairman of the climate Group chairman of climatewise chairman of Mh (GB) Limited
educational background theoretical Mechanics degree,
nottingham university, united Kingdom
Rajna gibson Brandon (1962), Swiss Member, non-executive and independent
careerRajna Gibson Brandon is a Professor of Finance at the university of Geneva and director of the Geneva Finance Research Institute.
She held professorships at the university of Lausanne from 1991 to 2000 and the university of Zurich from 2000 to 2008. She was a member of the Swiss Federal Banking commission from 1997 to 2004. She was elected to Swiss Re’s Board of directors in 2000 and is a member of the Finance and Risk committee and the Investment committee.
external appointments Board member of Banque Privée
edmond de Rothschild S.A. director of Research of the Swiss
Finance Institute
educational background Phd in economics and social sciences,
university of Geneva, Switzerland
Mary Francis (1948), British Member, non-executive and independent
careerMary Francis joined the uK civil Service in 1971, focusing on financial and economic policy. She held a number of senior positions including Financial counsellor at the British embassy in washington dc from 1990 to 1992, Private Secretary to the Prime Minister from 1992 to 1995 and deputy Private Secretary to the Queen from 1995 to 1999. Between 1999 and 2005 she was director General of the Association of British Insurers. She was a non-executive director of the Bank of england from 2001 to 2007 and a member of the board of directors of Aviva plc from 2005 to 2012. Mary Francis was elected to Swiss Re’s Board of directors in 2013 and is a member of the Finance and Risk committee.
external appointments Senior independent director of
centrica plc Board member of ensco plc Senior advisor to chatham house
educational background Masters of Arts, newnham college,
university of cambridge, united Kingdom
Swiss Re 2013 Financial Report 75
coRpoRate goveRnance | BoARd oF dIRectoRS

Malcolm D. Knight (1944), canadian Member, non-executive and independent
careerMalcolm d. Knight began his career as an academic at the university of toronto and the London School of economics. In 1975, he joined the International Monetary Fund, holding senior positions in both research and operations until 1999. From 1999 to 2003, he was Senior deputy Governor of the Bank of canada and from 2003 to 2008 he was General Manager (ceo) of the Bank for International Settlements. he was vice chairman of deutsche Bank from 2008 to 2012, where he is now an Advisor. he was elected to Swiss Re’s Board of directors in 2010 and is a member of the Audit committee and the Investment committee.
external appointments visiting Professor in Finance at the
London School of economics trustee of the International valuation
Standards council Member of the Board of Patrons of
the european Association for Banking and Financial history
Member of the Board of directors of the Global Risk Institute in Financial Services
trustee of the Per Jacobsson Foundation
educational background honour BA in Political Science and
economics, university of toronto, canada
M.Sc. and Phd in economics, the London School of economics, united Kingdom
honorary doctorate, trinity college, university of toronto, canada
Hans Ulrich Maerki (1946), Swiss Member, non-executive and independent
careerhans ulrich Maerki worked for IBM for 35 years, starting in 1973. From 1993 to 1995, he was General Manager of IBM Switzerland. he was appointed chairman of the Board of directors of IBM europe, Middle east and Africa (eMeA) in 2001 and was chief executive officer of IBM eMeA from 2003 to 2005. hans ulrich Maerki was elected to Swiss Re’s Board of directors in 2007 and is a member of the compensation committee and the Finance and Risk committee.
external appointments Board member of ABB Ltd and Mettler-
toledo International Inc. Member of the Foundation Board of the
Schulthess-Klinik Zurich Member of the international advisory
boards of the École des hautes Études commerciales (edhec), Paris, the IeSe Business School university of navarra and Bocconi university Milan
educational background Master of Science in Business
Administration, university of Basel, Switzerland
Senior Fellow of Advanced Leadership, harvard university, cambridge, uSA
c. Robert Henrikson (1947), American Member, non-executive and independent
careerc. Robert henrikson was chairman and chief executive officer of MetLife, Inc. from 2006 to 2011. Before, he held senior positions in MetLife’s individual, group and pension businesses and became chief operating officer of the company in 2004. he is a former chairman of the American council of Life Insurers, a former chairman of the Financial Services Forum, director emeritus of the American Benefits council and a former member of the u.S. President’s export council. he was elected to Swiss Re’s Board of directors in 2012 and chairs the compensation committee. In addition, he is a member of the chairman’s and Governance committee and the Finance and Risk committee.
external appointments Board member of Invesco Ltd Board member of Americares and
new York Philharmonic Member of the Boards of trustees of
emory university, S.S. huebner Foundation for Insurance education and Indian Springs School
educational background Bachelor of Arts, university of
Pennsylvania, uSA Juris doctorate, emory university, uSA
76 Swiss Re 2013 Financial Report
coRpoRate goveRnance | BoARd oF dIRectoRS
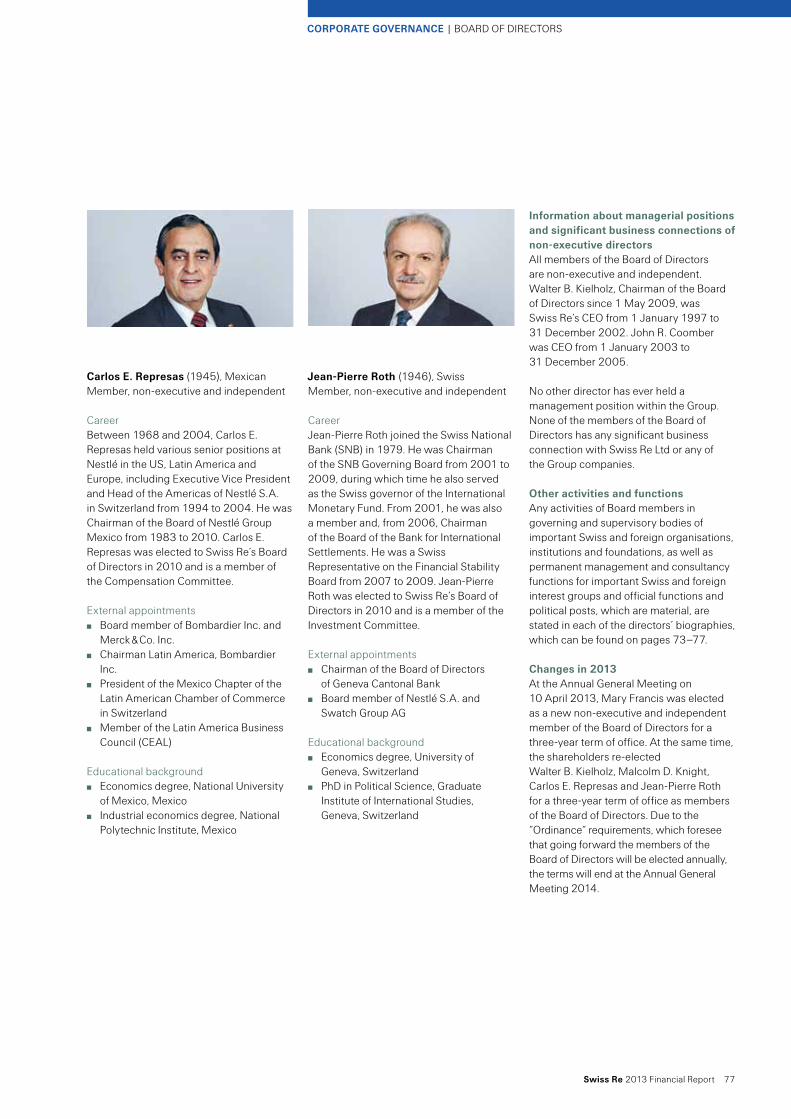
Information about managerial positions and significant business connections of non-executive directorsAll members of the Board of directors are non-executive and independent. walter B. Kielholz, chairman of the Board of directors since 1 May 2009, was Swiss Re’s ceo from 1 January 1997 to 31 december 2002. John R. coomber was ceo from 1 January 2003 to 31 december 2005.
no other director has ever held a management position within the Group. none of the members of the Board of directors has any significant business connection with Swiss Re Ltd or any of the Group companies.
other activities and functionsAny activities of Board members in governing and supervisory bodies of important Swiss and foreign organisations, institutions and foundations, as well as permanent management and consultancy functions for important Swiss and foreign interest groups and official functions and political posts, which are material, are stated in each of the directors’ biographies, which can be found on pages 73–77.
changes in 2013At the Annual General Meeting on 10 April 2013, Mary Francis was elected as a new non-executive and independent member of the Board of directors for a three-year term of office. At the same time, the shareholders re-elected walter B. Kielholz, Malcolm d. Knight, carlos e. Represas and Jean-Pierre Roth for a three-year term of office as members of the Board of directors. due to the “ordinance“ requirements, which foresee that going forward the members of the Board of directors will be elected annually, the terms will end at the Annual General Meeting 2014.
carlos e. Represas (1945), Mexican Member, non-executive and independent
careerBetween 1968 and 2004, carlos e. Represas held various senior positions at nestlé in the uS, Latin America and europe, including executive vice President and head of the Americas of nestlé S.A. in Switzerland from 1994 to 2004. he was chairman of the Board of nestlé Group Mexico from 1983 to 2010. carlos e. Represas was elected to Swiss Re’s Board of directors in 2010 and is a member of the compensation committee.
external appointments Board member of Bombardier Inc. and
Merck & co. Inc. chairman Latin America, Bombardier
Inc. President of the Mexico chapter of the
Latin American chamber of commerce in Switzerland
Member of the Latin America Business council (ceAL)
educational background economics degree, national university
of Mexico, Mexico Industrial economics degree, national
Polytechnic Institute, Mexico
Jean-pierre Roth (1946), Swiss Member, non-executive and independent
careerJean-Pierre Roth joined the Swiss national Bank (SnB) in 1979. he was chairman of the SnB Governing Board from 2001 to 2009, during which time he also served as the Swiss governor of the International Monetary Fund. From 2001, he was also a member and, from 2006, chairman of the Board of the Bank for International Settlements. he was a Swiss Representative on the Financial Stability Board from 2007 to 2009. Jean-Pierre Roth was elected to Swiss Re’s Board of directors in 2010 and is a member of the Investment committee.
external appointments chairman of the Board of directors
of Geneva cantonal Bank Board member of nestlé S.A. and
Swatch Group AG
educational background economics degree, university of
Geneva, Switzerland Phd in Political Science, Graduate
Institute of International Studies, Geneva, Switzerland
Swiss Re 2013 Financial Report 77
coRpoRate goveRnance | BoARd oF dIRectoRS

election and term of office election procedureMembers of the Board of directors are elected individually by the shareholders’ meeting.
the chairman’s and Governance committee evaluates candidates for Board membership and makes recommendations to the Board for election or re-election proposals. the Board nominates candidates for Board membership for election at the shareholders’ meeting, ensuring that the Board retains an adequate size and well-balanced composition and that the majority of the Board remains independent.
the Board aims to assemble among its members the requisite balance of managerial expertise and knowledge from different fields required for sound independent decision-making according to business needs. Potential new candidates are assessed against Board approved selection criteria, which include: integrity, selected skills and qualifications, experience, communication ability and community standing. Swiss Re’s Board members represent a wide range of backgrounds and capabilities in such key areas as insurance and reinsurance, finance, accounting, capital markets, risk management and regulatory topics. the company aims to constantly develop further the abilities of its Board members. newly elected Board members receive a comprehensive introduction in order to gain a sound understanding of the Group’s organisation and business, allowing them to perform their duties effectively. All Board members update and enhance their knowledge of emerging business trends and risks through regular meetings with internal and external experts throughout the year.
term of officehistorically, the regular term of a directorship was three years. It began with the date of election at the Annual General Meeting and ended at the third subsequent Annual General Meeting. effective with the Annual General Meeting of shareholders 2014, the term will be one year.
Members whose term has expired are immediately eligible for re-election. Members who reach the age of 70 during a regular term of office shall resign at the Annual General Meeting after reaching that age, although the Board can exempt a member from this age limit under exceptional circumstances.
the term of office of a committee member is described in the section on the committees of the Board of directors.
First election date and remaining term of each directorIn line with good corporate governance, Swiss Re’s Board of directors’ terms were composed in a way that they would lead to a staggered renewal of the Board. Going forward the ordinance requires an annual re-election. the initial election year as well as the end of the current term of office of each member are stated in the table on page 72.
nominations for re-election and election by the annual general Meeting on 11 april 2014on 1 January 2014 the “ordinance” entered into effect. It provides that going forward the Annual General Meeting will annually elect the members of the Board of directors, the chairman of the Board of directors, as well as the members of the compensation committee, individually and separately, for one-year terms.
the Board of directors proposes that the following Board members be re-elected for a one-year term: walter B. Kielholz Mathis cabiallavetta Renato Fassbind Raymund Breu Raymond K.F. ch’ien Mary Francis Rajna Gibson Brandon c. Robert henrikson hans ulrich Maerki carlos e. Represas Jean-Pierre Roth
Furthermore, the Board of directors has nominated Susan L. wagner
to be proposed to the Annual General Meeting in 2014 for first-time election as member of the Board of directors for a one-year term. Susan L. wagner is co-founder and director of BlackRock Inc., where she served as vice chairman and a member of the Global executive and operating committees before retiring in mid-2012. over the course of her nearly 25 years at the firm, Susan L. wagner served as chief operating officer, head of Strategy, corporate development, Investor Relations, Marketing and communications, Alternative Investments and International client Business. Susan L. wagner is American and graduated from wellesley college with a BA in english and economics, and earned an MBA in finance from the university of chicago.
the Board of directors proposes that the following Board member be elected as chairman of the Board of directors, for a one-year term: walter B. Kielholz
the Board of directors also proposes that the following Board members be elected as members of the compensation committee, for a one-year term: Renato Fassbind c. Robert henrikson hans ulrich Maerki carlos e. Represas
organisational structure of the Board of Directorsuntil now, the Board of directors constituted itself and elected among its members the chairman and vice chairmen as well as the chairpersons and members of the Board committees. It appoints its secretaries who do not need to be members of the Board.
the organisation of the Board of directors is set forth in the Group Bylaws, which define the responsibilities of the Board of directors, its committees and the Group executive committee (Group ec), as well as the respective reporting procedures. the chairman’s and Governance committee and the full Board annually review the Group Bylaws to ensure their continued effectiveness and compliance with the Articles of Association, applicable laws, regulations and best practice.
78 Swiss Re 2013 Financial Report
coRpoRate goveRnance | BoARd oF dIRectoRS

allocation of tasks within the Board of Directorschairman of the Board of Directorsthe chairman of the Board of directors exercises ultimate supervision of the Group on behalf of the Board. he has the right to attend the meetings of the Group ec and the Business units and receives all corresponding documentation and minutes. he ensures adequate reporting by the Group ceo and the Group ec to the Board of directors and facilitates their communication with the Board. he is also responsible, with the chairperson of the Audit committee, for overseeing Group Internal Audit and appoints its head, subject to confirmation by the Audit committee.
the chairman convenes meetings of the Board and its committees and makes preparations for, and presides over, Board meetings. the chairman coordinates the activities of Board committees and ensures that the Board is kept informed about the committees’ activities and findings. In cases of doubt, the chairman makes decisions about the authority of the Board or its committees and about interpreting and applying the Group Bylaws.
the chairman presides at General Meetings of Shareholders and represents the Group vis-à-vis shareholders and other stakeholders such as regulatory and political authorities, industry associations, or the media.
the chairman arranges introduction for new Board members and appropriate training for all Board members.
If the chairman of the Board is prevented from performing any of these duties, one of the vice chairmen or another member of the Board will assume them.
vice chairmenone of the vice chairmen will act in place of the chairman in the latter’s absence or in the event of a conflict of interest of the chairman. A vice chairman may prepare and execute Board resolutions on request of the Board and liaises between the Board and the Group ec in matters not reserved to the chairman.
namechairman’s and governance committee
audit committee
compensation committee
Finance and Risk committee
Investment committee
walter B. Kielholz (chair)Mathis cabiallavetta (chair) (chair)Renato Fassbind
Jakob Baer (chair)
Raymund Breu Raymond K.F. ch’ien John R. coomberMary FrancisRajna Gibson Brandon c. Robert henrikson (chair)Malcolm d. Knight hans ulrich Maerkicarlos e. RepresasJean-Pierre Roth
Board committee memberships
committees of the Board of Directorsthe Board has delegated certain responsibilities, including the preparation and execution of its resolutions, to five committees: the chairman’s and Governance committee, the Audit committee, the compensation committee, the Finance and Risk committee and the Investment committee.
each committee consists of a chairperson and at least two other members elected from among the Board of directors. the term of office of a Board committee member is one year, beginning with the appointment at the Board meeting following an Annual General Meeting and ending at the Board meeting following the subsequent Annual General Meeting.
each committee is governed by a charter which defines the committee’s responsibilities. the committees operate in line with the Group Bylaws and according to their respective charters. the committees have the following overall responsibilities:
Swiss Re 2013 Financial Report 79
coRpoRate goveRnance | BoARd oF dIRectoRS

Independence and other qualificationsAll members of the Audit committee are non-executive and independent. In addition to the independence criteria applicable to Board members for other committee memberships, members of the Audit committee may not accept any consulting, advisory, or other compensation fee from the Swiss Re Group, and will be required to possess such additional attributes as the Board may, from time to time, specify. each member of the Audit committee has to be financially literate. At least one member must possess the attributes to qualify as an Audit committee financial expert, as determined by the Board of directors. Members of the Audit committee should not serve on audit committees of more than two listed companies outside the Swiss Re Group. Audit committee members have to advise the chairman before accepting any further invitation to serve on an audit committee of another listed company outside the Group.
compensation committeeResponsibilities the compensation committee’s primary function is to propose to the Board for approval compensation principles in line with the Swiss Re Group’s legal and regulatory requirements and, within those approved principles, to determine the establishment of new (and amendments to existing) compensation plans, and determine, or propose as appropriate, individual compensation as outlined in its charter. the compensation committee will also ensure that compensation plans do not encourage inappropriate risk-taking within the Swiss Re Group and that all aspects of compensation are fully compliant with remuneration disclosure requirements.
Members c. Robert henrikson, chair Renato Fassbind John R. coomber (as of 11 April 2013) hans ulrich Maerki carlos e. Represas
Finance and Risk committeeResponsibilitiesthe Finance and Risk committee annually reviews the Group Risk Policy and proposes it for approval to the Board of directors, reviews the Risk control Framework and important risk exposures, including new products, strategic expansions, and compensation related risks. It reviews critical underwriting standards as well as principles used in internal risk measurement, asset and liability valuation, capital and liquidity adequacy assessment, and economic performance management. In addition, it reviews the Group’s funding structure, as well as capital and liquidity management activities.
Members Mathis cabiallavetta, chair Jakob Baer (until 11 April 2013) Raymund Breu (as of 11 April 2013) John R. coomber (until 11 April 2013) Mary Francis (as of 11 April 2013) Rajna Gibson Brandon c. Robert henrikson Malcolm d. Knight (until 11 April 2013) hans ulrich Maerki
Investment committeeResponsibilitiesthe Investment committee approves strategic asset allocation and reviews tactical asset allocation decisions. It reviews the monthly performance of all financial assets of the Swiss Re Group and makes proposals to the Board on strategic holdings. It reviews the risk analysis methodology as well as the valuation methodology related to each asset class and ensures that the relevant management processes and controlling mechanisms in Asset Management are in place.
Members Mathis cabiallavetta, chair Raymund Breu Raymond K.F. ch’ien Rajna Gibson Brandon Malcolm d. Knight (as of 11 April 2013) Jean-Pierre Roth
chairman’s and governance committeeResponsibilitiesthe chairman’s and Governance committee’s primary function is to act as advisor to the chairman and to address corporate governance issues affecting the Group. It is in charge of the succession planning process at the Board of directors level and oversees the annual performance assessment and self-assessment at both the Board of directors and Group ec level.
Members walter B. Kielholz, chair Mathis cabiallavetta Renato Fassbind Jakob Baer John R. coomber c. Robert henrikson
audit committeeResponsibilitiesthe central task of the Audit committee is to assist the Board of directors in fulfilling its oversight responsibilities as they relate to the integrity of Swiss Re’s and the Group’s financial statements, the Swiss Re Group’s compliance with legal and regulatory requirements, the external auditor’s qualifications and independence, and the performance of the Swiss Re Group’s internal audit function (GIA) and the Group’s external auditor. the Audit committee serves as an independent and objective monitor of Swiss Re’s and the Group’s financial reporting process and system of internal control, and facilitates ongoing communication between the external auditor, Group ec, Business units, GIA, and the Board with regard to the Swiss Re Group’s financial situation.
Members Jakob Baer, chair Renato Fassbind Raymund Breu (until 11 April 2013) Raymond K.F. ch’ien John R. coomber Malcolm d. Knight
80 Swiss Re 2013 Financial Report
coRpoRate goveRnance | BoARd oF dIRectoRS

A quorum is constituted when at least half of the members of the Board or the committee are present in person or participate using some alternative means of communication. Resolutions are adopted by majority vote. Board and committee meetings consider and discuss the items on the agenda incorporating presentations by members of the Group ec and, where needed, by other specialist employees or outside advisers. It is contemplated for every meeting that an executive session is held for discussions between the Board of directors and the Group ceo. Furthermore, private sessions are held for discussions involving all members of the Board of directors only.
the Board and its committees can also adopt resolutions by written agreement if no member of the Board of directors requests a discussion of the topic. each committee provides a report of its activities and recommendations following a committee meeting at the next Board of directors meeting. If any significant topic comes up, the committees contact the
Work methods of the Board of Directors and its committeesSwiss Re’s Board of directors oversees governance, audit, compensation, finance and risk, and investment and is supported in this responsibility by its committees. the full Board and its committees meet at the invitation of the chairman of the Board as often as business requires or at least quarterly. Any member of the Board of directors or the Group ec may, for a specific reason, require the chairman to call an extraordinary Board of directors or committee meeting.
the chairman defines the agenda for each meeting and therefore works closely with the chairpersons of the committees and the Group ceo. the agenda, along with any supporting documents, is delivered to the participants about ten days before the meeting in order to allow enough preparation time.
Body
number of meetings average duration average attendance Invitees in advisory capacity, in addition to members
Board of directors 12 meetings1 Group ec members, President Swiss Re Ltd, Group General counsel,3.5 hours company Secretary96.4%
chairman’s and 8 meetings Group ceo, company SecretaryGovernance committee 2 hours
97.9%Audit committee
8 meetings 2.5 hours 97.5%
Group ceo, Group cFo, Group cRo, Group coo, Group General counsel, chief compliance officer, head Group Internal Audit, chief Accounting officer, Lead auditors of external auditor, company Secretary
compensation committee 6 meetings Group ceo, Group coo, chief human Resources officer, 3 hours head compensation, Benefits & International Mobility, Advisers2100.0%
Finance and Risk committee 6 meetings Group ceo, Group cFo, Group cRo, Group chief Strategy officer & chairman Admin Re®, 3.5 hours Group chief underwriting officer, Group chief Investment officer, Group coo, 94.4% Group treasurer, ceo Reinsurance, ceo corporate Solutions, company Secretary
Investment committee 6 meetings Group ceo, Group cFo, Group cRo, Group chief Strategy officer & chairman Admin Re®, 2.5 hours Group chief Investment officer, head Financial Risk Management & cRo eMeA, 97.2% cFo Asset Management, head Rates, company Secretary
1 In addition, one decision by circular resolution. 2 the human resources consulting firm Mercer and the law firm niederer Kraft & Frey AG (nKF) provided support and advice for compensation issues during the reporting year.
Mercer organised benchmark studies and helped to review and amend the compensation philosophy. nKF provided support in disclosure matters. Representatives of Mercer and of nKF participated in six committee meetings each in 2013. during 2013 the compensation committee also received independent advice from hostettler, Kramarsch & Partner AG relating to compensation.
Board of directors immediately. It is the responsibility of each committee to keep the full Board of directors informed on a timely basis as deemed appropriate.
Minutes of discussions are kept and resolutions taken at each meeting of the Board of directors and its committees.
the Board has an assessment process in place, allowing the members to gauge the effectiveness of the Board on an annual basis.
each committee annually reviews the adequacy of the scope of its responsibilities, including processes and membership requirements, and also evaluates its performance.
the table below provides an overview of the meetings of the Board of directors and its committees held in 2013.
Swiss Re 2013 Financial Report 81
coRpoRate goveRnance | BoARd oF dIRectoRS

governance Supervises the Swiss Re Group Retains overall responsibility for
corporate governance Prepares for and convenes General
Meetings of shareholders and executes their resolutions
Strategy and structure Approves the Group’s strategy
and endorses the strategies of the Business units
determines the basic organisational structure of the Group
planning Approves the Group’s consolidated
short- and medium-term business plan and endorses the business plans of the Business units
Financial reporting Approves the annual report of
the holding company and of the Group
capital management Proposes capital measures to the
General Meeting of shareholders Approves principles on capital
allocation and capital steering for the Group
Approves aggregate limits for long-term debt issuances, bank facilities and similar instruments
Risk management Approves the Group Risk Policy Monitors risk developments
and adherence to the Group’s risk and capacity limits framework
Assesses the capital adequacy, funding structure and liquidity management of the Group
Business transactions decides on important strategic
transactions
Legal, regulatory and compliance matters Approves legal, regulatory and
compliance matters which have a material effect on the Group’s business
Human resources nominates Board member candidates
for election by the General Meeting of shareholders
Appoints the members of the Group executive committee (Group ec)
ensures appropriate succession planning at Board of directors and Group ec level
compensation Approves the Group’s compensation
principles determines the compensation of
the members of the Board of directors determines the compensation
of the Group ceo and the overall compensation available for the members of the Group ec
Approves the overall incentive pool for the Group
Key responsibilities of the Board of DirectorsBoard of Directors and group ec: areas of responsibilitythe Board of directors exercises ultimate responsibility for the Group. It delegates the responsibility for managing the Group’s operations to the Group ec (see section executive Management, starting on page 86). the Group ec also supports the Board of directors in fulfilling its duties and prepares proposals for consideration and decision-making by the Board of directors related to the following key responsibilities with Group relevance: strategy, the business plan, organisational structure, accounting principles, risk tolerance levels, share capital and any share repurchase programme, along with principles of financing through capital markets as well as for important strategic transactions. the following tables provide a summary of the key responsibilities of the Board of directors and delegations to the Group ec.
82 Swiss Re 2013 Financial Report
coRpoRate goveRnance | BoARd oF dIRectoRS

governance has overall responsibility for managing
operations, subject to delegation by the Board of directors
Issues guidelines relating to the delegation of decision-making authority within the Group
Strategy and structure ensures implementation of the
Group’s strategy decides on legal, financial and
management structures, subject to delegation by the Board of directors
planning Prepares and proposes the Group
business plan to the Board of directors for approval and reviews the Business units’ business plans
Financial reporting Prepares and presents to the Board
of directors the annual and interim financial statements of the Group together with segment reporting on the Business units
capital management establishes principles on financing
through capital markets and the allocation of financial resources within the Group
establishes the principles for intra-group transactions and funding
Risk management establishes the principles for external
retrocession and the balancing of Group-wide catastrophe and accumulated risks
Supervises the Group’s internal control evaluation and certification process
Business transactions decides on certain strategic
transactions and proposes important strategic transactions to the Board of directors for discussion and decision
Legal, regulatory and compliance matters oversees implementation of
Group-wide compliance procedures and monitors remediation of any regulatory and compliance deficiencies
Human resources has responsibility for the Group’s talent
management subject to the authority of the Board of directors
compensation Proposes short-term compensation
and benefit plans to the compensation committee for discussion and decision
Proposes individual compensation of Group Management Board members (other than Group ec) to Group ceo for discussion and decision
Key responsibilities of the group ec
Swiss Re 2013 Financial Report 83
coRpoRate goveRnance | BoARd oF dIRectoRS

Board supervision of executive managementSwiss Re’s Board of directors maintains effective and consistent oversight and monitors the execution of responsibilities it has delegated to executive management through the following control and information instruments.
participation of Board members at executive management meetingsthe chairman of the Board is invited to all meetings of the Group ec and Business units and receives the corresponding documentation and minutes.
Special investigationsthe Board committees are entitled to conduct or authorise special investigations at any time and at their full discretion into any matters within their respective scope of responsibilities, taking into consideration relevant peer group practice and general best practice. the committees are empowered to retain independent counsel, accountants or other experts if deemed necessary.
Involvement of executive management in meetings of the Board of DirectorsAs a matter of principle, all members of the Group ec are requested to attend the regular meetings of the Board of directors as advisers. the members of the Group ec do not attend the constitutional meeting of the Board of directors following the Annual General Meeting. the entire Group ec was present at five regular and one extraordinary Board meetings in 2013. At four meetings one member of the Group ec was absent. At two meetings the presence of only a part of the members of the Group ec was requested.
Involvement of executive management in Board committee meetings As a matter of principle, selected members of the Group ec as well as further senior management members participate at Board committee meetings as advisers. the charters of the Board committees specify management participation at committee meetings. A detailed summary of executive management participation in Board committee meetings is provided on page 81.
periodic reports to Board of Directors A comprehensive executive Report on business developments, including major business transactions, claims, corporate development and key projects, is provided to the Board of directors at each of its regular meetings.
executive management furthermore regularly provides the Board of directors with specific written reports containing: risk management issues and related
actions; the legally required update on the
solvency of the Swiss Re Group, Swiss Reinsurance company Ltd, european Reinsurance company of Zurich Ltd and Swiss Re corporate Solutions Ltd;
a detailed analysis of the loss reserves development of the major Group companies;
the use of derivative financial instruments within the Group;
an overview of the activities of the assurance work of operational Risk Management and by the Business Risk Review, by Group Internal Audit and compliance – including key risk indicators and significant losses and issues;
major pending legal matters such as litigation and arbitration, investigations and inquiries, as well as information about key legal developments and risks;
material compliance matters, including assessments of compliance risks and related mitigation efforts;
an update on the most important regulatory issues and supervisory developments; as well as
a description of trends and forecasts regarding the economic environment and the Property & casualty and Life & health re/insurance and financial markets.
Risk managementSwiss Re’s Risk Management function provides regular risk reports to the Board of directors, which are discussed in depth by the Finance and Risk committee. these reports cover Swiss Re’s compliance with the Group’s risk tolerance criteria, major changes in risk and capital adequacy measures and a description of the Group’s main risk issues, including related risk management actions. the Finance and Risk committee regularly reports to the full Board of directors as deemed appropriate.
Duty to inform on extraordinary eventsAs soon as the Group ceo or the Group ec becomes aware of any significant extraordinary business development or event, it is obliged to inform the Board of directors immediately. the Board has specific reporting procedures in place for this eventuality.
Right to obtain informationthe Board of directors has complete and open access to the Group ceo, the Group cFo, the Group cRo, the Group chief Strategy officer, the Group General counsel, the Group chief compliance officer and the head of Group Internal Audit. Any member of the Board of directors who wishes to have access to any other officer or employee of the Group will coordinate such access through the chairman.
Any member of the Board of directors may demand at Board meetings to obtain information on any aspect of the Group’s business. Any member may, in such meetings, request that books and records be produced for timely inspection. outside Board meetings, any member can direct a request for production of information and business records to the chairman.
84 Swiss Re 2013 Financial Report
coRpoRate goveRnance | BoARd oF dIRectoRS
group Internal auditGroup Internal Audit (GIA) is an independent assurance function, evaluating the adequacy and effectiveness of the Group’s internal control environment. It helps the Group accomplish its objectives by applying a systematic, disciplined approach to evaluate and improve the effectiveness of risk management, control and governance processes.
GIA applies a risk-based approach, performing its own risk assessment as well as making use of risk assessments performed by the Group’s Risk Management and other assurance functions (after reviewing the quality of the assurance work performed). Based on the results of the risk assessment, GIA produces an annual Audit Plan for review and approval by the Audit committee. the Audit Plan is updated on a quarterly basis according to the Group’s evolving needs. GIA provides formal quarterly updates on its activities to the Audit committee, which include audit results, the status of management actions required, the appropriateness of the resources and skills of GIA and any changes in the tools and methodologies it uses.
the head of GIA meets at least once per quarter with the Audit committee, and immediately reports any issue which could have a potentially material impact on the business of the Group to the chairman of the Audit committee.
GIA is an integral part of the Group’s Integrated Assurance Framework and coordinates its activities with those of the other assurance functions as well as the external auditor whilst still ensuring its independence. As part of this process it reviews the quarterly Assurance Report, which provides a summary of key issues as well as the assurance activities across the Group.
GIA has unrestricted access to any of the Group’s property and employees relevant to any function under review. All employees are required to assist GIA in fulfilling its duty. GIA has no direct operational responsibility or authority over any of the activities it reviews.
GIA staff govern themselves by following the code of ethics issued by the Institute of Internal Auditors (IIA). the IIA’s International Standards for the Professional Practice of Internal Auditing constitute the operating guidance for the department.
external auditorFor information regarding the external auditors, please refer to pages 94 and 95.
Swiss Re 2013 Financial Report 85
coRpoRate goveRnance | BoARd oF dIRectoRS

Members of the group executive committeethe Group executive committee (Group ec) consisted of the following members as of 31 december 2013:
eXecutIve MAnAGeMent
name nationality Age Function
Michel M. Liès Luxembourg 59 Group ceodavid cole dutch, American 52 Group chief Risk officerJohn R. dacey American 53 Group chief Strategy officer/chairman
Admin Re®Guido Fürer Swiss 50 Group chief Investment officerAgostino Galvagni Italian 53 ceo corporate SolutionsJean-Jacques henchoz Swiss 49 ceo Reinsurance europe, Middle east and
Africa (eMeA)/Regional President eMeAchristian Mumenthaler Swiss 44 ceo ReinsuranceMoses ojeisekhoba nigerian, American 47 ceo Reinsurance Asia/Regional
President AsiaGeorge Quinn British 47 Group cFoJ. eric Smith American 56 ceo Reinsurance Americas/Regional
President AmericasMatthias weber Swiss, American 52 Group chief underwriting officerthomas wellauer Swiss 58 Group chief operating officer
86 Swiss Re 2013 Financial Report
coRpoRate goveRnance
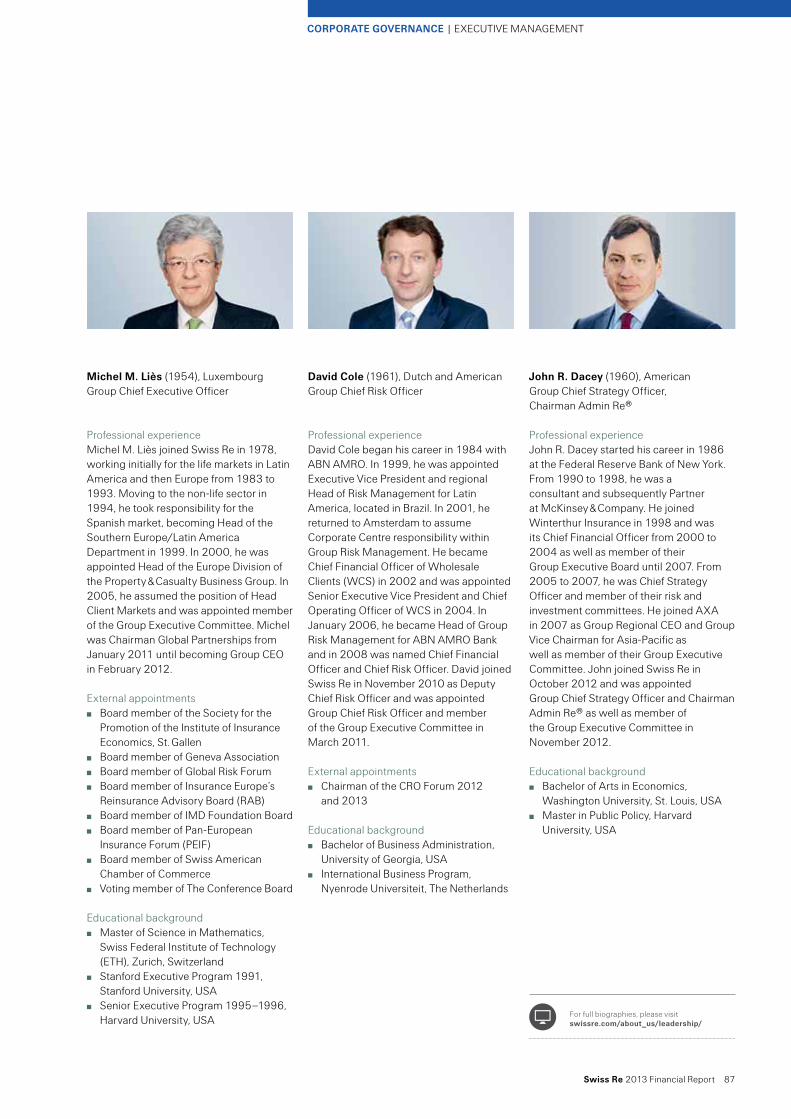
Michel M. Liès (1954), Luxembourg Group chief executive officer
Professional experienceMichel M. Liès joined Swiss Re in 1978, working initially for the life markets in Latin America and then europe from 1983 to 1993. Moving to the non-life sector in 1994, he took responsibility for the Spanish market, becoming head of the Southern europe/Latin America department in 1999. In 2000, he was appointed head of the europe division of the Property & casualty Business Group. In 2005, he assumed the position of head client Markets and was appointed member of the Group executive committee. Michel was chairman Global Partnerships from January 2011 until becoming Group ceo in February 2012.
external appointments Board member of the Society for the
Promotion of the Institute of Insurance economics, St. Gallen
Board member of Geneva Association Board member of Global Risk Forum Board member of Insurance europe’s
Reinsurance Advisory Board (RAB) Board member of IMd Foundation Board Board member of Pan-european
Insurance Forum (PeIF) Board member of Swiss American
chamber of commerce voting member of the conference Board
educational background Master of Science in Mathematics,
Swiss Federal Institute of technology (eth), Zurich, Switzerland
Stanford executive Program 1991, Stanford university, uSA
Senior executive Program 1995–1996, harvard university, uSA
For full biographies, please visit swissre.com/about_us/leadership/
David cole (1961), dutch and American Group chief Risk officer
Professional experiencedavid cole began his career in 1984 with ABn AMRo. In 1999, he was appointed executive vice President and regional head of Risk Management for Latin America, located in Brazil. In 2001, he returned to Amsterdam to assume corporate centre responsibility within Group Risk Management. he became chief Financial officer of wholesale clients (wcS) in 2002 and was appointed Senior executive vice President and chief operating officer of wcS in 2004. In January 2006, he became head of Group Risk Management for ABn AMRo Bank and in 2008 was named chief Financial officer and chief Risk officer. david joined Swiss Re in november 2010 as deputy chief Risk officer and was appointed Group chief Risk officer and member of the Group executive committee in March 2011.
external appointments chairman of the cRo Forum 2012
and 2013
educational background Bachelor of Business Administration,
university of Georgia, uSA International Business Program,
nyenrode universiteit, the netherlands
John R. Dacey (1960), American Group chief Strategy officer, chairman Admin Re®
Professional experienceJohn R. dacey started his career in 1986 at the Federal Reserve Bank of new York. From 1990 to 1998, he was a consultant and subsequently Partner at McKinsey & company. he joined winterthur Insurance in 1998 and was its chief Financial officer from 2000 to 2004 as well as member of their Group executive Board until 2007. From 2005 to 2007, he was chief Strategy officer and member of their risk and investment committees. he joined AXA in 2007 as Group Regional ceo and Group vice chairman for Asia-Pacific as well as member of their Group executive committee. John joined Swiss Re in october 2012 and was appointed Group chief Strategy officer and chairman Admin Re® as well as member of the Group executive committee in november 2012.
educational background Bachelor of Arts in economics,
washington university, St. Louis, uSA Master in Public Policy, harvard
university, uSA
Swiss Re 2013 Financial Report 87
coRpoRate goveRnance | eXecutIve MAnAGeMent

guido Fürer (1963), Swiss Group chief Investment officer
Professional experienceBefore joining Swiss Re, Guido Fürer worked for eight years in leading positions for the Swiss Bank corporation/ o’connor & Associates in option trading and structured capital markets transactions. Guido joined the new Markets division of Swiss Re in 1997, focusing on Alternative Risk transfer. Between 2001 and 2004, he worked for Swiss Re capital Partners with responsibility for european strategic participations. he was named head of the chief Investment office in 2008, with responsibility for Global Asset Allocation, Portfolio Steering and Portfolio Analytics. Guido became Group chief Investment officer and member of the Group executive committee in november 2012. In addition, he is head Asset Management Reinsurance.
educational background Master’s degree in economics,
university of Zurich, Switzerland Phd in Financial Risk Management,
university of Zurich, Switzerland executive MBA, InSeAd, France
agostino galvagni (1960), Italian chief executive officer corporate Solutions
Professional experience Agostino Galvagni joined Bavarian Re, a former Swiss Re subsidiary, in 1985 as a trainee in the fields of underwriting and marketing. he joined Swiss Re new Markets in new York in 1998. Agostino returned to Bavarian Re in 1999 as a member of the Management Board. In 2001, he joined Swiss Re in Zurich as head of the Globals Business, and in 2005 was appointed to the executive Board to head the Globals & Large Risks division within client Markets. In 2009, Agostino was appointed chief operating officer and member of the Group executive committee. he was made ceo corporate Solutions in october 2010.
educational background Master’s degree in economics, Bocconi
university, Milan, Italy
Jean-Jacques Henchoz (1964), Swiss chief executive officer Reinsurance europe, Middle east and Africa (eMeA) / Regional President eMeA
Professional experienceJean-Jacques henchoz started his career in 1988 at the Swiss Federal department of economic Affairs and the european Bank for Reconstruction and development. Jean-Jacques joined Swiss Re in 1998 and worked in several underwriting roles in the europe division until becoming head of Strategy for Property & casualty in 2003. From 2005 to 2010, he was chief executive officer of Swiss Re canada. Jean-Jacques assumed leadership of the europe division in March 2011. he was appointed chief executive officer Reinsurance eMeA, Regional President eMeA and member of the Group executive committee in January 2012.
educational background Master’s degree in Political Science,
university of Lausanne, Switzerland MBA, International Institute for
Management development (IMd), Switzerland
88 Swiss Re 2013 Financial Report
coRpoRate goveRnance | eXecutIve MAnAGeMent

christian Mumenthaler (1969), Swiss chief executive officer Reinsurance
Professional experiencechristian Mumenthaler started his career in 1997 as associate with the Boston consulting Group. he joined Swiss Re in 1999 and was responsible for key company projects. In 2002, he established and headed the Group Retro and Syndication unit. he served as Group chief Risk officer between 2005 and 2007 and was head of Life & health between 2007 and 2010. In January 2011, christian was appointed chief Marketing officer Reinsurance and member of the Group executive committee until he became chief executive officer Reinsurance that october.
external appointments Board member of International Risk
Governance council (IRGc) Board member of the Sustainability
Forum Zurich (tSF)
educational background Phd in Molecular Biology and
Biophysics, Swiss Federal Institute of technology (eth), Zurich, Switzerland
Moses ojeisekhoba (1966), nigerian and American chief executive officer Reinsurance Asia /Regional President Asia
Professional experienceMoses ojeisekhoba started his career in insurance as a registered representative and agent of the Prudential Insurance company of America in 1990. From 1992 to 1996, he was a Risk and underwriting Manager at unico American corporation. he then joined the chubb Group of Insurance companies as regional underwriting Manager and in 1999 became corporate Product development Manager in new Jersey and thereafter moved to London as Strategic Marketing Manager for chubb europe. In 2002, he was appointed International Field operations officer for chubb Personal Insurance before becoming head Asia Pacific in 2009, a position he remained in until he joined Swiss Re. Moses joined Swiss Re in February 2012 and was appointed chief executive officer Asia, Regional President Asia and member of the Group executive committee in March 2012.
educational background Master’s degree in Management,
London Business School, united Kingdom
Bachelor of Science in Statistics, university of Ibadan, nigeria
george Quinn (1966), British Group chief Financial officer
Professional experienceGeorge Quinn started his career as an adviser and consultant to insurance and reinsurance companies with KPMG in London. he joined Swiss Re in 1999 as chief Accounting officer. Between 2003 and 2005, he served as chief Financial officer for the Financial Services business group, then was named Regional chief Financial officer for Swiss Re Americas in new York in 2005. he has been Group chief Financial officer and member of the Group executive committee since March 2007.
educational background Bachelor’s degree in engineering,
university of Strathclyde, united Kingdom
Member, Institute of chartered Accountants in england and wales
Swiss Re 2013 Financial Report 89
coRpoRate goveRnance | eXecutIve MAnAGeMent

J. eric Smith (1957), American chief executive officer Swiss Re Americas / Regional President Americas
Professional experienceJ. eric Smith worked in various roles in property and casualty insurance with country Financial for more than 20 years, then joined Allstate in 2003 where he rose to the rank of President, Financial Services. he moved to uSAA in 2010 as President uSAA Life Insurance co. eric joined Swiss Re in July 2011 as chief executive officer of Swiss Re Americas and as a member of the Group Management Board. eric was appointed Regional President Americas and member of the Group executive committee in January 2012.
educational background Bachelor’s degree in Finance,
university of Illinois, uSA MBA, Kellogg School of Management,
northwestern university, uSA
Matthias Weber (1961), Swiss and American Group chief underwriting officer
Professional experienceMatthias weber started his career at Swiss Re in Zurich in 1992 as an expert for natural perils. he moved to the Swiss Re Americas division in 1998 and in 2000 became Regional executive for the western Region of the united States located in San Francisco. From 2001, he was responsible for property underwriting in the uS direct Business unit, and in 2005 was named head of the Americas Property hub in Armonk. From 2008, Matthias served as division head of Property & Specialty. Matthias was appointed Group chief underwriting officer and member of the Group executive committee in April 2012.
educational background Master’s degree in Physics, Swiss
Federal Institute of technology (eth), Zurich, Switzerland
Phd in natural Sciences, Swiss Federal Institute of technology (eth), Zurich, Switzerland
thomas Wellauer (1955), Swiss Group chief operating officer
Professional experiencethomas wellauer started his career with McKinsey & company, specialising in the financial services and pharmaceutical industry sectors, and became a Partner in 1991 and Senior Partner in 1996. In 1997, he was named chief executive officer of the winterthur Insurance Group, which was later acquired by credit Suisse. At credit Suisse he was a member of the Group executive Board, initially responsible for the group’s insurance business before becoming chief executive officer of the Financial Services division in 2000. From 2003 to 2006, he headed the global turnaround project at clariant. In 2007, he joined novartis as head of corporate Affairs and became member of the executive committee of novartis. From April 2009 until September 2010, he was a member of the Supervisory Board of Munich Re. thomas joined Swiss Re in october 2010 as Group chief operating officer and member of the Group executive committee.
external appointments chairman of the Swiss chapter of the
International chamber of commerce (Icc) since 2013
educational background Phd in Systems engineering, Swiss
Federal Institute of technology (eth), Zurich, Switzerland
MBA, university of Zurich, Switzerland
90 Swiss Re 2013 Financial Report
coRpoRate goveRnance | eXecutIve MAnAGeMent

changes in 2013 and 2014 there were no changes to the composition of the Group ec or any changes of responsibility for Group ec members during the business year 2013.
George Quinn will leave the Group and step down as Group cFo and member of the Group ec as of 30 April 2014.
david cole, Swiss Re’s Group chief Risk officer since March 2011, was appointed Group cFo as of 1 May 2014.
other activities and vested interestsAny activities of members of the Group ec in governing and supervisory bodies of important Swiss and foreign organisations, institutions and foundations as well as permanent management and consultancy functions for important Swiss and foreign interest groups and official functions and political posts, which are material, are stated in each of the Group ec members’ biographies on pages 87–90.
Management contractsSwiss Re has not entered into any management contract with any third party.
Swiss Re 2013 Financial Report 91
coRpoRate goveRnance | eXecutIve MAnAGeMent

ShARehoLdeRS’ PARtIcIPAtIon RIGhtS
voting right restrictions, statutory group clauses and exception rulesthere are no voting right restrictions and no statutory group clauses (other than the limitations on nominee registrations, page 71). therefore, there are no procedures or conditions for cancelling restrictions and no rules on making exceptions to them. Accordingly, no such exceptions were made in 2013.
Statutory rules on participating in the general Meeting of shareholders the share whose owner, usufructuary or nominee is entered in the share register as having voting rights on a specific qualifying day determined by the Board of directors entitles its holder to one vote at the General Meeting of shareholders.
Swiss Re’s legal provisions allow any shareholder with voting rights to have his or her shares represented at any General Meeting of shareholders by another person authorised in writing, or by corporate bodies, independent proxies or proxies for deposited shares. Such representatives need not be shareholders. the ordinance Against excessive compensation at Public corporations foresees that representations by corporate bodies or proxies for deposited shares are no longer permitted as of 1 January 2014.
Business firms, partnerships and corporate bodies may be represented by legal or authorised representatives or other proxies, married persons by their spouses, minors and wards by their guardians, even though such representatives are not shareholders.
Statutory quorumsthe General Meeting of shareholders may pass resolutions regardless of the number of shareholders present or shares represented by proxy. Resolutions pass by an absolute majority of votes validly cast, except where the law requires otherwise. the chairman does not have a casting vote.
the chairman of the General Meeting of shareholders determines the voting procedure. Provided that the voting is not done electronically, voting shall take place openly by a show of hands. the voting will only be carried out by written ballot if more than 50 of the shareholders present demand so by a show of hands.
convocation of the general Meeting of shareholdersIn accordance with Swiss Re’s Articles of Association, the Board of directors convenes the General Meeting of shareholders through a notice published in the Swiss official Gazette of commerce at least 20 days before the date of the meeting. the notice must state the day, time and place of the General Meeting of shareholders, along with the agenda and proposals, which will be submitted by the Board of directors.
extraordinary General Meetings of shareholders may be called by a resolution of the General Meeting of shareholders or the Board of directors, or by one or more shareholders with voting powers whose combined holdings represent at least 10% of the share capital.
agendathe Board of directors announces the agenda for the General Meeting of shareholders. Shareholders with voting power whose combined holdings represent shares with a nominal value of at least chF 100 000 may, no later than 45 days before the date of the meeting, request that further matters be included in the agenda. Such requests must be in writing and must specify the items and the proposals to be submitted.
Registrations in the share registerIn recent years, Swiss Re has acknowledged the voting rights of shares registered no later than two working days before the General Meeting of shareholders.
92 Swiss Re 2013 Financial Report
coRpoRate goveRnance

chAnGeS oF contRoL And deFence MeASuReS
Duty to make an offerSwiss Re has not put in place any specific measures to defend against potential unfriendly takeover attempts. the Board of directors believes that the company’s best protection is a fair valuation of its shares, and that the efficiency of a free market is preferable to artificial obstacles, which can have a negative impact on the share price in the long term.
In accordance with the Federal Act on Stock exchanges and Securities trading (SeStA), whosoever acquires equity securities, which added to equity securities already owned, exceed the threshold of 33⅓% of Swiss Re shares with voting rights, either directly, indirectly or in concert with third parties, and regardless of whether these rights are exercisable or not, triggers a mandatory takeover offer for the outstanding Swiss Re shares owned by all other shareholders.
the SeStA allows companies to include an “opting up” provision in their articles of association, which raises the mandatory takeover offer threshold up to 49%, or an “opting out” provision, which waives the mandatory offer. Swiss Re’s Articles of Association contain neither of these provisions.
the Board of directors believes that the efficiency of a free market is preferable to artificial obstacles, which can have a negative impact on the share price in the long term.
change of control clausesunvested incentive shares, share options and certain other employee benefit programmes would vest upon a change of control. In such an event, the rights of members of the Board of directors and the Group executive committee (Group ec) as well as of further members of senior management are identical to those of all other employees.
the mandates and employment contracts of the members of the Board of directors, Group ec, Group Management Board and other members of senior management do not contain any provisions such as severance payments, notice periods of more than 12 months or additional pension fund contributions that would benefit them in a change of control situation.
Swiss Re 2013 Financial Report 93
coRpoRate goveRnance

AudItoRS
Duration of the mandate and term of office of the lead auditors Pricewaterhousecoopers Ltd (Pwc) was appointed as the external auditor of Swiss Re Ltd when the company was founded on 2 February 2011. Pwc had been elected as the external auditor of the previous parent company of the Group, Swiss Reinsurance company Ltd, at its Annual General Meeting of 22 november 1991 and had been re-elected annually since then. the Annual General Meeting of shareholders of 10 April 2013, following the proposal of the Board of directors based on the recommendation of the Audit committee, re-elected Pwc for a term of one year as auditors.
dawn M. Kink and Alex Finn became lead auditors responsible for the auditing mandate of the former parent company, Swiss Reinsurance company Ltd, on 1 September 2006 and 23 September 2011, respectively. with Swiss Re Ltd becoming the new holding company of the Group, they also became lead auditors for the Swiss Re Ltd audit mandate. with the completion of the audit 2012, dawn M. Kink had been on this audit mandate for seven years in a row. In line with the Swiss code of obligations she was therefore replaced at the Annual General Meeting on 10 April 2013 by Bret Griffin as new lead auditor, together with Alex Finn.
auditing feesPwc fees (excluding vAt) for professional services during the year ended 31 december 2013 were: Audit fees: uSd 30.7 million Audit-related fees: uSd 7.9 million corporate Finance Services:
uSd 7.4 million
Audit-related fees (apart from corporate finance due diligence services) include, among other tasks, review of the economic value Management report, Solvency II model validation, comfort letters, accounting advice and regulatory reports. corporate Finance Services include due diligence services.
additional feesIn addition to the auditing fees, Pwc fees totaled uSd 2.2 million (excluding vAt) during the year ended 31 december 2013, primarily relating to: Income tax compliance and related
tax services: uSd 1.6 million other fees: uSd 0.6 million
other fees include permitted advisory work related to a range of projects, but are primarily related to corporate realignment activities and accounting advice.
Information tools pertaining to the external auditResponsibilitiesthe external auditor is accountable to the Audit committee, the Board of directors and ultimately to the shareholders. the Board of directors reviews the external auditor’s professional credentials, assisted in its oversight by the Audit committee.
cooperation and flow of information between the auditor and the audit committeethe Audit committee liaises closely with the external auditor; the lead auditors participate as advisers at all the Audit committee’s meetings. For more information on these, see page 81. the external auditor provides the Audit committee with regular updates on the audit work and related issues as well as with reports on topics requested by the Audit committee.
the Audit committee reviews and approves in advance all planned audit services and any non-audit services provided by the external auditor. It discusses the results of annual audits with the external auditor, including reports on the financial statements, necessary changes to the audit plans and critical accounting issues.
the external auditor shares with the Audit committee its findings on the adequacy of the financial reporting process and the efficacy of the system of internal controls. It informs the Audit committee about any differences of opinion between the external auditor and management encountered during the audits or in connection with the preparation of the financial statements.
evaluation of the external auditorthe Audit committee, which is responsible for recommending an audit firm to the Board of directors for election at the Annual General Meeting of shareholders, assesses the performance of the external auditor annually and presents its findings to the Board. this assessment is based on the external auditor’s qualifications, independence and performance.
QualificationsAt least once a year, the external auditor submits a report to the Audit committee describing the external auditor’s own quality control procedures, including any material issues raised by its most recent internal reviews or inquiries or investigations by governmental or professional authorities within the preceding five years, as well as any steps taken to deal with any such issues.
94 Swiss Re 2013 Financial Report
coRpoRate goveRnance

IndependenceAt least once a year, the external auditor provides a formal written statement delineating all relationships with the company that might affect its independence. Any disclosed relationships or services that might bear on the external auditor’s objectivity and independence are reviewed by the Audit committee, which then recommends appropriate action to be taken by the Board.
In accordance with the Swiss code of obligations and to foster external auditor independence, the lead audit partner rotates out from his or her role after seven years.
Performancethis assessment measures the external auditor’s performance against a number of criteria, including: understanding of Swiss Re’s business; technical knowledge and expertise; comprehensiveness of the audit plans; quality of the working relationship with management; and clarity of communication. It is compiled based on the input of key people involved in the financial reporting process and the observations of the Audit committee members.
audit feesthe Audit committee reviews annually the audit fees as well as any fees paid to the external auditor for non-audit services, based on recommendations by the Group cFo.
Special auditorthe extraordinary General Meeting of shareholders of Swiss Re Ltd, held on 20 May 2011, elected oBt AG, Zurich, as special auditor for a term of three years. According to the Articles of Association, the special auditor is responsible for conducting special audits as required by law in connection with changes in capital. In line with best practice in ensuring the independence of external auditors, special audit reports are prepared by an auditor different from the external auditor responsible for the conduct of the statutory audits and the audit of the consolidated financial statements.
oBt AG had been elected the first time as special auditor by the Annual General Meeting of shareholders of the former parent company, Swiss Reinsurance company Ltd, on 7 April 2010.
oBt AG did not prepare any audit reports under this mandate during the reporting year.
Swiss Re 2013 Financial Report 95
coRpoRate goveRnance | AudItoRS

InFoRMAtIon PoLIcY
Swiss Re’s core business – managing global risk – makes us by necessity an information company. our information policy therefore goes well beyond legal requirements in establishing transparency in our communications and equal access to the facts for all investors and the public.
the official medium for publications of the company is the Swiss official Gazette of commerce (Schweizerisches Handelsamtsblatt). In addition, we use our website to provide comprehensive, timely news and information on our activities as well as background discussion and analysis of issues relating to Swiss Re’s business and the broader insurance and reinsurance industries. Investors and other stakeholders can subscribe to receive ad hoc disclosures and other corporate news automatically at swissre.com/media. our contact details are provided on page 272.
our Investor Relations team holds regular meetings with institutional investors and analysts. Private investors, too, can follow these meetings by telephone conference or through the Swiss Re website. In 2013, Swiss Re held a special Investors’ day to discuss a Group strategy update, the Life & health Reinsurance business and the Group’s capital management. the presentations and conference call recordings from this event are also available on our website: http://www.swissre.com/investors/presentations.
Swiss Re observes strict close periods around the publications of the Group’s quarterly and annual results. the close periods apply throughout the preparation of the results and provide for an appropriate cooling-off period after the release of the results. during such close periods, employees of Swiss Re and members of the Board of directors and Group ec are prohibited from trading in Swiss Re securities.
our information policy goes well beyond legal requirements in establishing transparency in our communications and equal access to the facts for all investors and the public.
96 Swiss Re 2013 Financial Report
coRpoRate goveRnance

corporate news in 2013
date news Method of dissemination3 January Swiss Re places uSd 270 million of north American earthquake risk news release16 January Swiss Re releases sigma study on partnering for food security in emerging markets news release, sigma study21 February Swiss Re announces net income of uSd 4.2 billion for full-year 2012 news release, press conference15 March Swiss Re announces proposals for the upcoming Annual General Meeting news release27 March Swiss Re releases sigma study on natural catastrophes and man-made disasters in 2012 news release, sigma study28 March dispute with Berkshire hathaway settled news release10 April Swiss Re’s shareholders approve proposals put forward by the Board of directors news release, AGM in Zurich2 May Swiss Re delivers first-quarter Group net income of uSd 1.4 billion news release20 May northeast uS hurricane risk placed on behalf of travelers news release24 May Swiss Re structures and places uSd 175 million catastrophe bond news release19 June Swiss Re publishes its 2012 corporate Responsibility Report news release, report24 June Swiss Re confirms strategy at Investors’ day news release26 June Swiss Re releases sigma study on world insurance in 2012 news release, sigma study3 July Swiss Re capital Markets closes largest ever european wind cat bond news release8 July Swiss Re estimates losses from recent flooding in europe at approximately uSd 300 million news release12 July Swiss Re reacts to media speculation regarding Admin Re® news release8 August Swiss Re reports second quarter 2013 net income of uSd 786 million news release, press conference21 August Swiss Re sigma releases preliminary estimates for first half-year 2013 news release, sigma study27 August People of all generations brace themselves for a riskier world news release, press conference9 September Swiss Re releases sigma study on marine and airline insurance markets news release, sigma study9 September demand for natural catastrophe cover to double in high growth markets news release, press conference23 September Swiss Re estimates losses from German hail storms at uSd 240 million news release15 october Swiss Re capital Markets places euR 350 million catastrophe bond for AXA Global P&c news release16 october Swiss Re to invest up to uSd 425 million in Fwd Group news release31 october Swiss Re releases sigma study on urbanisation in emerging markets news release, sigma study7 november Swiss Re reports net income of uSd 1.1 billion for third quarter 2013 news release 13 november Swiss Re and Phoenix Group announce termination of discussions news release18 november Swiss Re to acquire a 14.9% stake in Brazilian insurer SulAmérica news release20 november Swiss Re invests uSd 493 million for a 4.9% stake in new china Life news release4 december Swiss Re releases sigma study on life insurance: focusing on the consumer news release, sigma study16 december Swiss Re’s Group chief Financial officer George Quinn to step down news release18 december Swiss Re sigma releases preliminary estimates on natural catastrophes and man-made
disasters in 2013news release, sigma study
19 december Swiss Re unveils new brand strategy and modernised logo news release
Important dates for 2014
date event
20 February 2013 annual results18 March Publication of 2013 Annual Report11 April 150th Annual General Meeting7 May First quarter 2014 results3 July Investors’ day in London6 August Second quarter 2014 results7 november third quarter 2014 results
Swiss Re 2013 Financial Report 97
coRpoRate goveRnance

98 Swiss Re 2013 Financial Report

CORPORATE RESPONSIBILITY | IntRoductIon
Swiss Re 2013 Financial Report 99
100 Governance and reporting100 Sustainable business101 Our carbon footprint103 Our employees
corporate Responsibilitycorporate Responsibility expresses Swiss Re’s commitment to being an open, honest and transparent organisation that treats all its stakeholders – employees, shareholders, clients, government regulators and the general public – with respect and integrity. We aim to take a long-term view, playing our part in enabling sustainable progress.

coRpoRate ReSponSIbIlIty
We work for the benefit of our clients and shareholders — and ultimately, we aim to serve society at large. this is the essence of sustainable value. this long-term approach is one of our core values, and thus reflected in the principles of our code of conduct: being open, honest and transparent
in everything we do treating everyone with respect taking the long-term view, playing our
part in enabling sustainable progress creating an inclusive culture that
encourages diversity of thought and opinion
this section describes some of the progress we have made in living up to those values over 2013. the full 2013 corporate Responsibility Report will be published in spring 2014.
Governance and reportingthe chairman’s and Governance committee of Swiss Re’s board of directors is responsible for overseeing implementation of our commitment to corporate responsibility. on an operational level, numerous units are involved in applying that commitment in our day-to-day work.
the Sustainability & political Risk Management unit carries out coordination tasks and is responsible for the full corporate Responsibility Report. We have voluntarily reported on our performance as a responsible company since 1998. the range of topics covered in the yearly reports has gradually widened from a focus on environmental topics to include social and governance issues.
Since 2007, we have published a comprehensive corporate Responsibility Report. the 2012 edition followed the G3.1 Sustainability Reporting Guidelines of the Global Reporting Initiative (as far as is sensible for, and applicable to, a business-to-business company in financial services). It also conformed with the disclosure guidelines of the un Global compact. Furthermore, the 2012 edition was the first to report progress on the principles for Sustainable Insurance (pSI, see next page).
this interim report provides summary information on how we have met our aspirations, beginning with sustainability in our re/insurance business and investment activities. the report also details our actions in reducing our own environmental footprint, particularly in terms of carbon emissions. It also describes at our policies toward employee diversity and engagement.
one of our 2013 goals was to help clients to develop and implement long-term adaptation strategies to climate change based on the economics of climate adaptation (eca) methodology. this is described in the box story on page 103, and in greater detail on page 33 of the business Report.
Sustainable businessSustainable progress — or sustainability — can be described as development that meets the needs of the present without compromising the ability of future generations to meet their needs. to be sustainable, progress must improve economic efficiency, protect and restore ecological systems and enhance social well-being.
Swiss Re’s business model helps to create stability. by managing risks and covering losses, we protect investments and enable economic growth. We seek to ensure that specific issues posing a potential threat to sustainability are adequately addressed.
Risk intelligence is as fundamental for sustainability as it is for every other aspect of our business. our Sustainability Risk Framework addresses sustainability risks in our core business — activities in sensitive sectors such as oil and gas, defence and nuclear proliferation, mining, dams, forestry, pulp & paper and oil palm, animal testing, or with clients whose practices may have severe and repeated detrimental
We are committed to being a responsible company. contributing to sustainable, long-term value creation serves as a guiding principle for our practical actions.
100 Swiss Re 2013 Financial Report
CORPORATE RESPONSIBILITY

effects on human rights or the environment. potentially sensitive business risks (SbRs) are referred to and handled through a tailor-made SbR process. In 2013 there were 210 SbR referrals. certain countries (in 2013: north Korea, Somalia and Sudan) and companies (such as those involved in particularly cruel weapons that inflict indiscriminate and disproportionate harm) are excluded from consideration outright.
We keep abreast of newly emerging risks through another structured process: “Systematic observation of notions associated with Risk,” or SonaR, is a Group-wide framework that allows us to identify and assess emerging risks and to incorporate the resulting insights into the relevant decision-making processes. In 2013 more than 100 “risk notions” were fed into SonaR, including driverless cars and oil drilling in remote areas. While many of the early signals will never actually turn into emerging risks, many may well do so. We also meet with other organisations to gain a better understanding of emerging risks, such as the World economic Forum, the cRo Forum’s emerging Risk Initiative and the International Risk Governance council.
Since 2012, we have been reporting our progress against the principles for Sustainable Insurance (pSI). the pSI initiative was launched in 2012 at the un conference on Sustainable development, after a worldwide consultation process that culminated in a meeting at our centre for Global dialogue. It presents a reporting framework that aims to ensure that “all activities in the insurance value chain, including interactions with stakeholders, are done in a responsible and forward-looking way by identifying, assessing, managing and monitoring risks and opportunities associated with environmental, social and governance issues.” We are one of the original signatories of the pSI and we played an active role in its development. the pSI progress report will again be included in our 2013 corporate Responsibility Report.
this coincides with another global framework for the financial sector, the principles for Responsible Investing (pRI), which we signed in 2007. as a natural extension of our Sustainability Risk Framework, we integrate sustainability-related risk information consistently across our entire investment portfolio. We consider environmental, social and governance (eSG) factors as an integral part of our investment management activities and decisions – also in the belief that these factors can have an impact on the financial performance of the investment portfolio in the long run. our Responsible Investment policy, issued by the Group chief Investment officer, defines Swiss Re’s approach as a responsible investor to follow high standards in its investment process. For key aspects of our investment activities — including sovereign fixed income investments, the engagement of external managers, the exercise of voting rights and direct real estate investments — we have developed specific requirements to ensure eSG criteria are duly taken into consideration. this creates both ethical and business value: we believe that eSG factors are a core element of long-term sustainable risk-adjusted economic value creation.
Our commitment to reducing our own footprintas a provider of financial services, Swiss Re does not cause large environmental impacts through its own operations. nonetheless, minimising our direct environmental footprint is an important part of our commitment to be a responsible company. our main environmental priorities are to reduce our co2 emissions and energy consumption. We calculate our emissions based on the Greenhouse Gas protocol, the most widely used emissions accounting standard.
210Sensitive business risk referrals in 2013(2012: 170)
Swiss Re 2013 Financial Report 101
CORPORATE RESPONSIBILITY

In environmental terms, 2013 has been a watershed year. We reached the end of our initial ten-year Greenhouse neutral programme, commenced in 2003, which originally sought to reduce co2 emissions per employee by 15% within ten years and to offset our emissions. this target was already met in 2007. by the end of 2013, we had successfully reduced co2 emissions by 56.5% per employee, principally by making continuous improvements in energy efficiency and switching to renewable power at many of our locations. We have now reached our goal of using 100% renewable power in all offices where it is reliably available. We have continued our efforts to curb unnecessary business travel without jeopardising our business objectives by encouraging full use of our worldwide video collaboration network. Growth of the business and expansion into new markets — along with new responsibilities created through the realignment of Swiss Re’s holding company into three business units — had contributed to an increase in business travel-related co2 emissions per employee in 2011 and 2012. against expectations, the figure did not rise in 2013, but remained stable, with a reduction of approximately 1%.
Since 2003 we have compensated these and all remaining co2 emissions by purchasing Voluntary emissions Reductions (VeRs). In 2013 we retired VeRs representing 55 800 tonnes of co2 emissions. this amount includes additional voluntary commitments to offset the emissions caused by events such as Swiss Re’s annual General Meeting of shareholders and those held at the centre for Global dialogue.
We are keen to ensure that the VeRs we buy are of a high environmental standard. to achieve this, we have developed a set of criteria to select the projects that generate certificates; for instance, we give priority to projects which come with strong social side-effects and benefit the poorest regions.
Swiss Re has over 60 offices in more than 20 countries; we also own and construct buildings, primarily in Switzerland, as part of the real estate component of our investment portfolio. In all these, we apply stringent building standards, including the use of environmentally sound, durable materials, low energy consumption and low maintenance and running costs. our construction and renovation projects in Switzerland conform to the MIneRGIe® standard of energy efficiency and superior user comfort, using where applicable its most stringent level, MIneRGIe-p-eco®, which incorporates the use of passive heat sources for ultra-low energy consumption.
In 2013, work continued on Swiss Re next, our new Zurich headquarters. a full environmental briefing on the project, including biweekly reports of its construction-related emissions, is available at http://next.swissre.com/en/.
We invite our employees to engage with Swiss Re’s commitment to the environment through the global coyou2 programme, which subsidises private emission-cutting investments with the goal to reduce employees’ own carbon footprint. Investments range from energy-efficient home infrastructure and appliances to more sustainable transport options such as bicycles. Subsidies cover 50% of eligible investments, up to a locally predefined total subsidy allowance. Since the launch of this innovative programme in 2007, more than 9 000 subsidies have been paid out to our employees throughout the world. due to this resounding success, Swiss Re decided to renew the programme for another seven years, starting in January 2014 and closing in line with the next phase of the climate strategy in 2020.
56.5%Total reduction in CO2 emissions per employee since 2003
CORPORATE RESPONSIBILITY
102 Swiss Re 2013 Financial Report

Our responsibility towards Swiss Re employeesSwiss Re’s goal is to attract talented people from a broad range of disciplines and backgrounds by providing our employees with a working environment conducive to their personal and professional development. We nurture a culture of diversity and inclusion across the company, offer excellent training opportunities, and provide a range of health and other benefits. We take active steps to promote mentoring, gender balance, career planning and overall employee well-being.
one of the primary means of checking our progress in these areas is through the employee engagement survey, conducted every other year. In 2013, 74% of our employees took part. Results improved over the 2011 survey, and although no Group-wide actions were specified, there are many working groups or teams who analyse their division or department results to see where improvements can be made.
Sustainability in our business: climate change adaptation
Integrating adaptation to climate change with economic development and sustainable growth
natural catastrophes are a key risk in our business. losses from floods, storms, earthquakes and other disasters affect millions of lives and the economies of entire countries. providing effective re/insurance protection against natural catastrophes therefore has large social and economic benefits.
Insured natural catastrophe losses around the world are becoming more frequent and severe as people and assets concentrate in high-risk areas. climate change is likely to contribute to this rising trend in losses through shifts in the frequency, intensity, spatial extent, duration and timing of extreme weather events.
We work to mitigate the impact of natural catastrophes, first by issuing re/insurance covers and insurance-linked securities, but also by offering our clients and others access to our strategic expertise. this include our wide range of expert publications, our catnet® online hazard information system, and our economics of climate adaptation (eca) studies. a collaborative project informed by an advisory group of leading academics, eca looks at the costs to governments and associated investment implications of adapting to climate change. With a time horizon of 2030, the eca’s fact-based risk management approach enables national and local leaders to understand the impact of climate on their economies and to identify actions to minimise that impact at the lowest cost to society, thus integrating adaptation to climate change with economic development and sustainable growth. the initial eca studies covered eight widely varying locations to test the relevance of the approach and the robustness of the results. In 2013, we had the chance to apply the methodology in collaboration with the city of new york, an area potentially at great risk from climate change (please see page 33 of the business Report for a full description).
Swiss Re 2013 Financial Report 103
CORPORATE RESPONSIBILITY

104 Swiss Re 2013 Financial Report

106 Report from the Compensation Committee107 Compensation context and highlights in 2013109 Compensation governance113 Compensation framework120 Compensation decisions in 2013
CompensationSwiss Re’s compensation framework is designed to promote long-term sustainable performance for the Group and its shareholders through a mix of fixed and variable elements. It comprises core components such as base salary, pensions and other benefits, as well as a combination of short- and long-term incentives. Swiss Re is committed to a performance-oriented and balanced compensation system that aligns the interests of employees and shareholders.
CompenSation | IntRoduCtIon
Swiss Re 2013 Financial Report 105

RepoRt FRom the CompenSatIon CommIttee
Dear shareholdersI am pleased to present the Report from the Compensation Committee related to the business year 2013.
the Compensation Committee continues to review and monitor the overall compensation framework at Swiss Re in light of business needs, existing and new regulatory requirements and market developments. the implementation of the revised compensation framework that was started in 2011 was completed in early 2013. there were no material changes to compensation governance and principles, which are outlined in the following pages.
Swiss Re’s compensation plans are continuously reviewed and (if appropriate) updated to ensure they align with the interests of shareholders and other stakeholders. In addition to market competitive base salaries, pensions and benefits, Swiss Re continues to reward employee performance through proven incentives. Results achieved in the previous performance year are rewarded with a short-term variable cash incentive, with performance over a three-year period reflected in a deferred cash component. a select number of key senior employees are also granted a long-term award that provides a forward-looking incentive for sustainable and successful performance.
uS Gaap and economic Value management (eVm) based business results continue to be the main drivers for variable compensation. the strong 2012 business results led to an increase of the incentive pools compared to 2011. the 2013 business performance was again positive leading to compensation levels which are broadly similar to 2012.
as always, the Compensation Committee works continuously to gauge and improve its own effectiveness. It also maintains regular interactions with the Swiss Financial market Supervisory authority FInma, as well as monitoring other regulatory developments including Solvency II and Swiss corporate law.
on 1 January 2014, the ordinance against excessive Compensation at public Corporations (the ordinance) came into force. the ordinance will have implications for compensation governance. during 2013, the Compensation Committee focused its efforts on preparing for the changes that will be implemented starting in 2014. the main changes are outlined below:
– Yearly individual election of the members of the Board of directors and of the Compensation Committee, as well as the Chairman of the Board of directors, by the annual General meeting of shareholders.
– Inclusion of the overarching compensation principles in the articles of association.
– Introduction of a binding shareholders’ vote on remuneration for the Board of directors and the Group executive Committee (Group eC) at the annual General meeting in 2015.
– adjustments to the Compensation Report in line with the new requirements under the ordinance as of the reporting year 2014.
– adjustments to employment contracts of the Group eC members in line with the provisions of the ordinance.
these changes strengthen the responsibilities of shareholders in compensation matters. Current governance at Swiss Re is already well aligned to the recent developments. this includes the non-binding vote on the Compensation Report (introduced in 2010) and the regular efforts to ensure transparent disclosure and communication about compensation.
the Compensation Committee is satisfied that this Compensation Report provides a comprehensive view of the compensation framework at Swiss Re. In addition, the Compensation Report provides disclosure for 2013 compensation decisions. the Report is divided into four sections:
Compensation context and highlights in 2013
Compensation governance Compensation framework Compensation decisions in 2013
Zurich, 17 march 2014
C. Robert henrikson Chairman of the Compensation Committee
106 Swiss Re 2013 Financial Report
CompenSation

CompenSatIon Context and hIGhlIGhtS In 2013
pay for performancethe Compensation Committee ensures that executive management compensation is linked to the business performance of Swiss Re by delivering a substantial portion of compensation in the form of variable and performance related incentives.
the Compensation Committee monitors how compensation develops against specific business metrics including net income and eVm profit.
uSd million (unless otherwise stated) 2011 % 2012 % 2013 %
Income before tax and variable compensation 3 029 100% 5 872 100% 5 262 100%
Variable compensation 326 11% 546 9% 506 9%
Income tax expense 77 3% 1 125 19% 312 6%
uS Gaap net income attributable to shareholders 2 626 4 201 4 444
of which paid out as dividend (incl. special dividend) 1 134 37% 2 760 47% 3 0361 58%
of which added to retained earnings within shareholders’ equity 1 492 49% 1 441 25% 1 408 27%
1 FY 2013 dividend includes a special dividend of approximately uSd 1.6bn and is estimated based on average ChF/uSd Fx rates as of February 2014. the dividend is subject to aGm approval and the amount depends on the final number of dividend eligible shares and Fx rates upon dividend pay out. FY 2012 includes a special dividend of uSd 1.5bn.
attribution of Group income to key stakeholders
Split of 2013 Group income (in USD million)Split of 2013 Group income (in USDm)
9% Variable compensation
6% Income tax expense
58% Net income paid out as dividend
27% Net income added to retained earnings
9% Variable compensation
6% Income tax expense
58% net income paid out as dividend
27% net income added to retained earnings
Fixed Variable/performance-related of which deferred
all employees 71% 29% 23%
Group eC1 30% 70% 66%
Group Ceo 24% 76% 69%
0% 20% 40% 60% 80% 100%
Grundsalär und Pauschalen Bar-API VAI LPP
0% 20% 40% 60% 80% 100%
Base salary and allowances Cash API VAI LPP
Group CEO
Mitglieder der Geschäftsleitung1
Alle Mitarbeitenden
variable/performance-related
Group CEO
Group EC1
All employees
variable/performance-related
variable/performance-related
variabel/leistungsabhänging
variabel/leistungsabhänging
variabel/leistungsabhänging
71% 22% 4% 3%
30% 23% 20% 27%
24% 23% 23% 30%
71% 22% 4% 3%
30% 23% 20% 27%
24% 23% 23% 30%
1 Including Group CEO
1 Einschliesslich Group CEO
uSd million (unless otherwise stated) 2011 2012 change 2013 change
uS Gaap net income 2 626 4 201 60% 4 444 6%
eVm profit –1 704 4 152 4 007
dividend payments to shareholders (ChF)1 3.00 3.50 17% 3.85 10%
Financial Strength Rating (Standard & poor’s) aa– aa– aa–
total equity 31 287 34 026 9% 32 977 –3%
number of employees 10 788 11 193 11 574
aggregate compensation for all employees (ChF) 1 775 2 032 14% 2 067 + 2%
Group eC members2,3 9 16 12
aggregate Group eC compensation (ChF)3 35 50 43% 45 –10%
1 dividend payments are made in april of the following year. For 2013 a special dividend of ChF 4.15 is proposed.distributions made in the form of Swiss withholding tax exempt distributions out of legal reserves from capital contributions.
2 Represents incumbents and not positions; four new Group eC positions were created in 2012. 3 Including Group Ceo.
Swiss Re 2013 Financial Report 107
CompenSation

Key developments
Background and contextIn 2011, based on feedback from shareholders and regulators, the Board of directors initiated a full review of the compensation framework for the Group. this review recommended several planned interventions in the performance and compensation area, with the objective to strengthen the link between pay and performance. most of the changes have been implemented in 2012, including the launch of the new two-dimensional performance management system, the introduction of the target annual performance Incentive (tapI) for senior management, the new long-term incentive leadership performance plan (lpp) and the new Global Share participation plan (GSpp).
activities in 2013Compensation changes Further embedding of two-dimensional
performance management, ensuring a balance between measuring the achievement of performance objectives and the demonstration of appropriate behaviours.
Full implementation of tapI. eligible employees have now been communicated a target incentive that influences the level of payout when business and individual objectives are achieved.
transparent methodology for the determination of the annual performance Incentive (apI) pools, thus creating a stronger link between variable compensation and performance.
Specific compensation plans For the lpp, introduction of an
additional two-year holding period for members of the Group eC and Group management Board (GmB) starting with the 2014 award.
updated vesting curve on the performance Share unit (pSu)component of the lpp with vesting beginning at median.
Introduction of the GSpp in order to encourage participation in Swiss Re’s future and to increase alignment with shareholders’ interests.
Regulatory oversight Continued interaction with FInma
in 2013. Continued monitoring of Solvency II
developments to ensure alignment of our compensation framework with the current draft requirements.
preparation of an implementation plan with regard to the ordinance.
annual General meeting as in previous years, the Compensation
Report 2012 was subject to a consultative vote. at the annual General meeting on 10 april 2013, the Report was approved by 90% of shareholder votes (up from 81% in 2012).
at the annual General meeting on 11 april 2014, the Compensation Report 2013 will be subject to a consultative vote.
outlook 2014In 2014, the Compensation Committee will continue implementing the provisions of the ordinance, focusing on: Yearly individual election of the
members of the Board of directors and of the Compensation Committee, as well as the Chairman of the Board of directors, by the annual General meeting of shareholders.
Inclusion of the overarching compensation principles in the articles of association.
Introduction of the binding shareholders’ vote on compensation at the annual General meeting in 2015.
adjustments to the Compensation Report to align with the new provisions as of the reporting year 2014.
adjustments to employment contracts of the Group eC members in line with the requirements of the ordinance.
In early 2013, Swiss Re completed the implementation of the compensation framework review initiated in 2011, with the objective to further strengthen the link between variable pay and performance.
108 Swiss Re 2013 Financial Report
CompenSation | CompenSatIon Context and hIGhlIGhtS In 2013
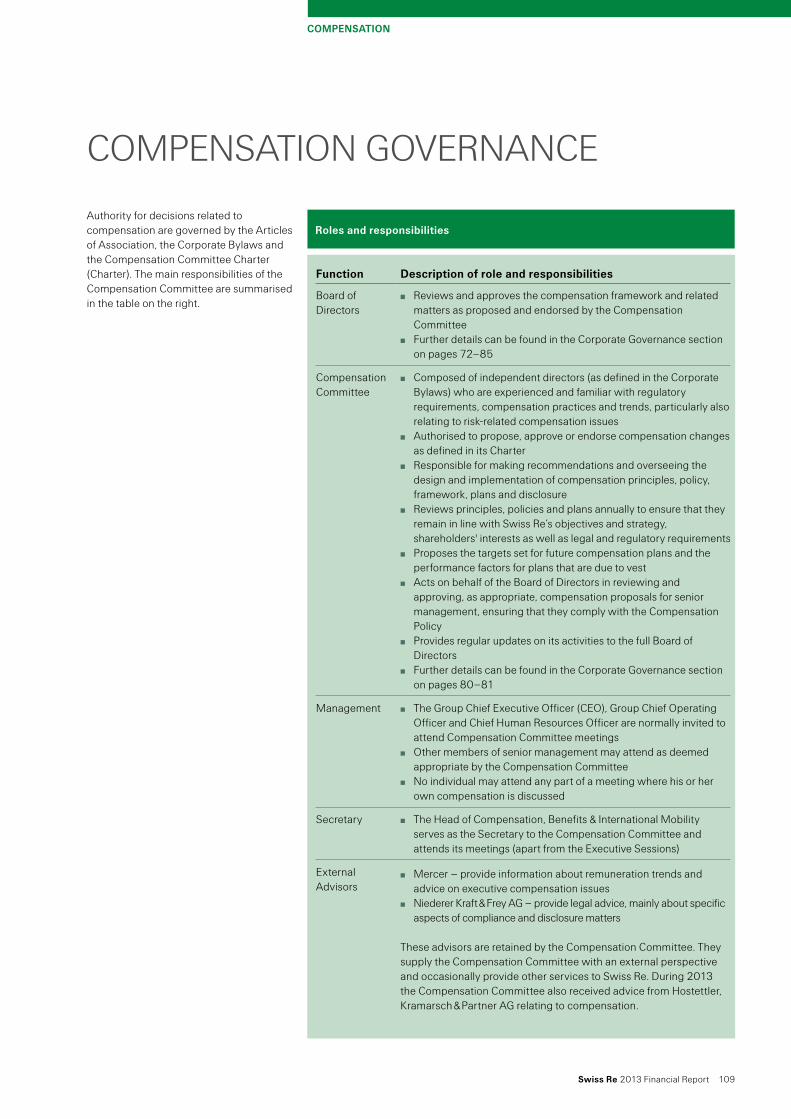
CompenSatIon GoVeRnanCe
Function Description of role and responsibilities
Board of directors
Reviews and approves the compensation framework and related matters as proposed and endorsed by the Compensation Committee
Further details can be found in the Corporate Governance section on pages 72–85
Compensation Committee
Composed of independent directors (as defined in the Corporate Bylaws) who are experienced and familiar with regulatory requirements, compensation practices and trends, particularly also relating to risk-related compensation issues
authorised to propose, approve or endorse compensation changes as defined in its Charter
Responsible for making recommendations and overseeing the design and implementation of compensation principles, policy, framework, plans and disclosure
Reviews principles, policies and plans annually to ensure that they remain in line with Swiss Re’s objectives and strategy, shareholders' interests as well as legal and regulatory requirements
proposes the targets set for future compensation plans and the performance factors for plans that are due to vest
acts on behalf of the Board of directors in reviewing and approving, as appropriate, compensation proposals for senior management, ensuring that they comply with the Compensation policy
provides regular updates on its activities to the full Board of directors
Further details can be found in the Corporate Governance section on pages 80–81
management the Group Chief executive officer (Ceo), Group Chief operating officer and Chief human Resources officer are normally invited to attend Compensation Committee meetings
other members of senior management may attend as deemed appropriate by the Compensation Committee
no individual may attend any part of a meeting where his or her own compensation is discussed
Secretary the head of Compensation, Benefits & International mobility serves as the Secretary to the Compensation Committee and attends its meetings (apart from the executive Sessions)
external advisors
mercer – provide information about remuneration trends and advice on executive compensation issues
niederer Kraft & Frey aG – provide legal advice, mainly about specific aspects of compliance and disclosure matters
these advisors are retained by the Compensation Committee. they supply the Compensation Committee with an external perspective and occasionally provide other services to Swiss Re. during 2013 the Compensation Committee also received advice from hostettler, Kramarsch & partner aG relating to compensation.
Roles and responsibilitiesauthority for decisions related to compensation are governed by the articles of association, the Corporate Bylaws and the Compensation Committee Charter (Charter). the main responsibilities of the Compensation Committee are summarised in the table on the right.
Swiss Re 2013 Financial Report 109
CompenSation

Compensation Committee activitiesthe Compensation Committee has a predetermined annual agenda to ensure that important reviews take place at the appropriate times throughout the year. the Compensation Committee also conducts periodic self-assessments to ensure its continued high level of effectiveness and spends some time at each meeting in executive sessions. It held six meetings during 2013 and provided an update to the Board of directors on
Compensation approvalthe table on the right shows the role of the Compensation Committee in approving compensation.
Compensation Committee’s time allocation to key topics in 2012
24% Variable compensation for the Group
8% Review of compensation framework
18% Compliance and Regulatory
9% Compensation and performance of
Group EC members
16% Executive session
25% Other topics
Compensation Committee’s time allocation to key topics in 2013
24% Variable compensation for the Group
8% Review of compensation framework
18% Compliance and regulatory
9% Compensation and performance of Group eC members
16% executive sessions
25% other topics
decision on proposed Reviewed/endorsed approved
total amount for apI payments Compensation Committee
Chairman of the Board of directors
Board of directors
total amount for long-term incentive plans
Compensation Committee
Board of directors
Remuneration of the members of the Board of directors1
Compensation Committee, Chairman of the Board of directors
Board of directors
Compensation of the Group Ceo
Compensation Committee, Chairman of the Board of directors
Board of directors
Individual compensation of the members of the Group eC (excluding Group Ceo)
Group Ceo Chairman of the Board of directors
Compensation Committee
1 Board member concerned abstains from voting
decisions and topics discussed after each of these meetings. a summary of the topics dealt with by the Compensation Committee during the year is shown on page 111.
these authority levels will change with the implementation of the ordinance, considering that the shareholders will approve the aggregate compensation of the members of the Board of directors and the Group eC through a binding vote, starting at the annual General meeting in 2015.
110 Swiss Re 2013 Financial Report
CompenSation | CompenSatIon GoVeRnanCe

High-level overview of topics discussed meeting
Variable compensation for the Group at Swiss Re, the compensation cycle begins in december, with payments made in march/april of each year. the Compensation Committee oversees each stage of the process, starting with deciding on the variable compensation for the prior performance year, reviewing these decisions, and setting targets for the upcoming year.
items relating to past performance cycle
Financial review and confirmation of the apI pool funding methodology december
performance assessment process and proposal of the apI pool for the prior business year January and February
approval of performance factors for deferred compensation awards February and april
Review of the decisions made during the prior compensation cycle June
items relating to the upcoming performance cycle
Review and recommendation of the lpp pool for the upcoming year January and February
Setting of the performance targets for variable and long-term compensation for the upcoming year February
Review lpp plan duration and vesting curve for pSu december
Compensation and performance of Group eC and GmB membersthe compensation of senior management follows the same cycle as that for the Group. again, the Compensation Committee is fully involved through all stages of the process, and all decisions are owned by the Compensation Committee and the Board of directors.
performance assessment of the prior year January and February
approval of individual compensation proposals for the Group eC and review of compensation proposals for the GmB February
analysis of Group eC members’ compensation relative to external peers June
analysis of GmB members’ compensation relative to external peers december
Compensation of the Board of Directorsthe compensation of the Board of directors is reviewed annually and the Compensation Committee formulates proposals for the attention of the Board of directors accordingly.
Fees of the Board of directors for the following compensation period February and april
Review of the Board of directors compensation policy June, September and december
Compensation principles and plans Compensation framework: review and approval of proposals related to the implementation
of the revised framework January, February and June annual benefits review June Review of the Group Compensation policy September
Compliance and regulatorythe Compensation Committee spends a considerable amount of time reviewing materials relating to regulatory or statutory reporting. In addition, the structure of the Compensation Committee and its advisors is reviewed on an ongoing basis.
Review and proposal of the Compensation Report January, February, June and december
Compliance and regulatory developments and submissions all meetings
Review of the role and mandate of external advisors June
Swiss Re 2013 Financial Report 111
CompenSation | CompenSatIon GoVeRnanCe

the role of the Control Functions in compensationthe role of Swiss Re's Control Functions (defined as Risk management, Group Internal audit and Compliance) in compensation matters is well established. their activities include providing management with information on risk and control awareness.
Control assessment of Group and business functionsthe Compensation Committee continues to focus on the link between compensation and risk awareness. the Control Functions provide the Group Ceo and the Compensation Committee with assessments and information regarding risk and control-related behaviour and performance. this information is collected from all Control Functions and combined into a Group report that covers each business function.
Control assessment of Key Risk takersKey Risk takers are defined as individuals who, by the nature of their role, can materially commit or control Swiss Re’s resources, or influence its risk profile. Swiss Re bears risks in the course of its business activities, including market, credit and liquidity, underwriting, operational (including legal and compliance) and reputational risk.
Swiss Re has identified 140 positions that qualify as Key Risk takers, including the members of the Group eC, GmB and other roles with significant risk authority. the increase of Key Risk takers from 125 positions in 2012 to 140 in 2013 was mainly driven by newly created functions (eg in high growth markets) and internal reorganisations.
the Control Functions together with senior management review the list of Key Risk takers on an annual basis.
influence of the control assessment on compensationthe control assessment provides additional input to determining the Group apI pool. It also influences the apI pool that is allocated to each business function.
Since Key Risk takers are responsible for managing substantial risk, their performance in this task needs to be assessed. the Control Functions assess the risk performance of each Key Risk taker and deliver a report to the business and human Resources on an annual basis. this assessment serves as an additional factor when considering the individual performance and compensation review.
independence of the Control FunctionsIn order to ensure the continued independence of Control Functions, Swiss Re has modified its compensation approval processes. although the compensation framework applicable to Control Functions remains largely the same as for all other employees, some of the key annual compensation decisions for these functions are approved differently. For example the Chairman of the audit Committee and the Chairman of the Finance and Risk Committee approve the aggregate apI pool of their respective Control Functions, as well as approving the individual compensation for the head of each Control Function.
112 Swiss Re 2013 Financial Report
CompenSation | CompenSatIon GoVeRnanCe

CompenSatIon FRamewoRK
Compensation policy Swiss Re’s guiding principles and compensation framework are captured within the global Swiss Re Group Compensation policy. the Compensation policy governs the compensation structure and processes across all functions and locations at Swiss Re and is reviewed annually.
the Compensation policy also contains guidance for the execution of individual compensation actions. the Compensation Committee, together with the Group Ceo, has approved an authority matrix that defines the limits to which each level of management can authorise compensation payments. Separate limits apply to each compensation element, thereby ensuring that all payments receive the appropriate level of approval. the Group Ceo or the Compensation Committee, as applicable, approves salaries, incentives, termination agreements or sign-on payments that exceed pre-set limits.
line managers receive guidance on practical aspects of the Compensation policy and its implementation. the human Resources function conducts a regular self-assessment on Swiss Re’s compliance with the Compensation policy. the Compensation Committee reviews this self-assessment and identifies potential areas of improvement. the Compensation Committee receives reports on compensation decisions as appropriate, including a comprehensive review of actions resulting from the annual Compensation Review Cycle.
Swiss Re is required to assess the degree to which the Compensation policy complies with the requirements of FInma. as part of this process, the Finance and Risk Committee is required to review risks related to the Compensation policy. In order to facilitate the compliance certification process, a comprehensive risk analysis of the Compensation policy is conducted on an annual basis.
In order to reflect best practices, the Compensation policy prohibits the use of any personal hedging strategies or remuneration and liability-related insurance that could undermine the risk alignment effects and economic exposure embedded in compensation arrangements.
Guiding principlesSwiss Re’s compensation framework is designed to attract, motivate, and retain the qualified talent the Group needs to succeed globally, while creating a tangible link between pay and performance. the aim is to provide compensation that is competitive in local labour markets while ensuring that employees focus on delivering outstanding results without taking inappropriate risks. a balanced compensation package is complemented by competitive pension plans and benefits. this approach contributes to the success of the business by: supporting strong performance with a
focus on risk-adjusted financial results; ensuring close correlation between
business results, individual contribution, compliance and compensation;
supporting Swiss Re’s commitment to attract, motivate and retain key talent;
aligning the interests of employees with those of Swiss Re’s shareholders; and
fostering compliance and supporting sensible risk-taking.
Swiss Re has a range of incentive programmes that reflect the long-term nature of the business: both the VaI and lpp aim to reward sustained performance rather than short-term results. this helps to align shareholder and employee interests more closely.
Swiss Re 2013 Financial Report 113
CompenSation

Global Share participation plan Swiss Re offers its employees an opportunity to directly participate in the long-term success of the company by purchasing Swiss Re shares, through the GSpp. the company provides a 30% match on the number of shares held by employees at the end of the three-year period. the match is subject to forfeiture rules in case of termination of employment before the end of the plan cycle. the GSpp has the same core design in all locations.
the plan was rolled out in 2013 as part of the overall compensation framework review and replaced the previous employee participation plan (epp) which has been discontinued.
Base salaryBase salary is fixed compensation paid to employees for carrying out their role and is established based on the following factors: Scope and responsibilities of the role,
as well as qualifications required to perform the role
external market value of the role in the location in which Swiss Re competes for talent
performance, skills and expertise of the individual in the role
BenefitsSwiss Re also aims to provide a proper degree of protection to employees and their dependents through pension, health, disability and death benefits in line with local market conditions.
overview of the compensation componentsSwiss Re aims for total compensation that is competitive in the external market.
In addition Swiss Re aims to ensure that total compensation is well-balanced in terms of fixed versus variable remuneration and in terms of short-term versus long-term incentives. this is to encourage sustainable performance and appropriate risk-taking.
the illustration below shows a summary of the compensation and benefit elements which are explained in the next section.
Fixed Variable compensation participation plans Benefits
(short-term) (short-term) (long-term) (long-term) (long-term)
Base salary Cash api Vai (deferred api) Lpp GSpp iSp Benefits
eligibility all employees all employees employees with an apI at or above uSd 100 000
upon Group Ceo invitation
all employees all employees all employees
purpose attract and retain
pay for performance
pay for performance
pay for performance
alignment to shareholders
alignment to shareholders
protection against risks
plan duration 3 years 5 years for eC and GmB members.3 years for all other participants
3 years 1 year
Drivers Role and experience
Company, business unit and individual performance
Business performance
Business performance
– – market practice
Settlement Cash (immediate)
Cash and/or shares*
Cash (deferred) Shares Shares Shares pension, insurances, perquisites
performance Kpis Business and individual performance
measurement of the economic impact of reserving accuracy
Relative tSRRoe
performance period 1 year 3 years 3 years
performance range 0%–200% of target 50%–150% 0%–150%
impact of share price on payout
no no no yes yes yes no
Forfeiture rules no yes yes yes yes (on match)
no no
*under the Incentive Share plan
Summary of compensation and benefit components
114 Swiss Re 2013 Financial Report
CompenSation | CompenSatIon FRamewoRK

when the total apI level for an employee exceeds a pre-defined amount, the variable pay is delivered in two components: a cash incentive payment (cash apI) and VaI (deferred apI).
incentive Share plan (iSp)employees also have the opportunity to take some or all of their cash apI in the form of Swiss Re shares at a discount of 10% and subject to a one-year blocking period (the Incentive Share plan), encouraging alignment with shareholder interests. after one year, the employee assumes full ownership of the shares.
Funding of the annual performance incentive and Leadership performance plan poolsthe Compensation Committee focuses primarily on financial results and qualitative criteria in determining global variable compensation pools.
the Compensation Committee receives proposals from management requesting the total funding for variable compensation pools for both the apI and the lpp. the management proposal for the annual apI pool is based on the Group’s overall performance for the year. the lpp pool is reviewed in the context of sustainable business performance and affordability, but generally remains stable. the Compensation Committee considers these proposals and recommends a total pool to the full Board of directors for approval. the Compensation Committee and the Chairman of the Board of directors also propose an individual award for the Group Ceo within this overall pool. the VaI is not funded as a separate pool, and the apI pool will include amounts paid in cash as well as the amounts to be deferred into the VaI.
In 2012 Swiss Re introduced a three-step process based on business performance to determine the overall Group apI pool. the process comprises a financial, a qualitative and an overall assessment. the financial assessment attributes equal weight to uS Gaap income, eVm, economic net worth and return on equity measures both for the Group and each Business unit individually. additionally, multi-year comparisons and an assessment of the quality of earnings are also considered. the chart below gives more detail on the criteria used to determine the size of the pool. the Business units then allocate their pools following a similar assessment.
annual performance incentive the apI is a discretionary, variable component of compensation. Combined with the base salary, it provides competitive total cash compensation when both business and individual performance targets are achieved.
In 2012 Swiss Re introduced the concept of target apI along with a revised performance management framework that provides equal weighting to “behavioural” criteria along with quantitative “results” for senior executives (with planned further
roll-out within the company going forward). In this way, apI is awarded both for objectives achieved and for demonstration of desired behaviours. the target apI is set in advance for each eligible employee based on multiple factors, including market benchmarks, with payout linked both to Swiss Re’s results and to individual performance.
assessment of the performance of the members of the Group eC will be based on the Group and their respective business area as well as their individual contribution.
approved Group
target apI pool
approved Group
apI pool
Group api pool funding process
overall Group assessment and proposal from management to the Compensation Committee, who retain adjustment discretion. Reviewed proposal recommended for approval to the full Board of Directors
Step 1 Financial assessment
Step 2 Qualitative assessment
Step 3 overall assessment
Includes assessment of the financial performance versus targets as well as a multi-year view and review of the quality of earnings that then impacts the overall assessment. KpIs include uS Gaap, eVm results, economic net worth and return on equity
Includes consideration for indicators such as Clients & Service Quality, Risk & Control Behaviour, Franchise Building, human Capital & talent management as well as Strategic Initiatives
Combining a series of overarching tests: includes assessment of market competitiveness as well as affordability checks
Can impact assessment +/– 30%
Can trigger possible adjustment +/– 20%
Determine need for upward or downward adjustment based on all information available
Swiss Re 2013 Financial Report 115
CompenSation | CompenSatIon FRamewoRK

management VaI each year to set annual payout factors. the annual payout factors are then averaged over the three-year measurement period to determine the final payout factor. the payout factor is still a linear function that ranges from 50% to 150%.
Settlementat the end of the deferral period, VaI will be settled in cash. For the full three-year performance measurement period, forfeiture conditions apply. additionally, clawback provisions apply in the event of any downward financial restatement which is caused or partially caused by the VaI participant’s fraud or misconduct. In this case, the company is entitled to seek repayment of any vested and settled award.
apply. the VaI tracks the eVm profit margin development over the subsequent three years after grant. eVm profit margin is the ratio of eVm profit to eVm capital. the average eVm profit margin over the three-year measurement period is used to determine the final payout factor. the payout factor is a linear function that ranges from 50% (for an average eVm profit margin development of –15%) to 150% (for an average eVm profit margin development of +15%).
VaI awards granted prior to 2012 contained an additional mark-up element as compensation for the time value of money. this mark-up has been eliminated for awards starting with the VaI 2011 (awarded in 2012) onwards.
eVm results, additional targets and non-financial performance factors are taken into consideration in the asset
Value alignment incentivepurposethe VaI is a mandatory deferral of a portion of the apI adding a time component to variable compensation. this supports the Group’s business model by aligning a substantial portion of variable compensation with sustained long-term results. the aim is to ensure that the ultimate value of the deferred variable compensation through VaI, though awarded for short-term performance, is significantly affected by the longer- term performance of the line of business and the Group.
plan durationthe VaI supports a longer-term perspective by directly linking awards to performance over a three-year period.
Structurethe higher the apI, the greater the portion of variable compensation that remains at risk through the VaI, as shown in the table below.
the payout factor of the VaI is based on the underwriting year eVm results. eVm is used to evaluate, price, reserve and steer the business decisions within Swiss Re. as eVm recognises all cash flows associated with a contract upfront, measuring the VaI over the following three years enables a reduction of VaI if performance is lower than expected; conversely, if performance is higher than expected, a premium will
portion of api that remains at riskdeferral into VaI
Group Ceo 50% of apIGroup eC members 45% of apIGmB members 40% of apIall other employees 50% of the amount at or above uSd 100 000
up to a maximum of 40% of apI
economic impact of reserving accuracy for decisions taken in 2013 measured over 3 years
Value alignment incentive – 2013 results measured over 3 years
Cashapi
Vaiaward
2014 2015 2016 2017 Year of award Year of Vesting
payout between50% and 150%of award
Vaipayout
150%
100%
50%total apI award based on Business and Individual performance
measurement period
116 Swiss Re 2013 Financial Report
CompenSation | CompenSatIon FRamewoRK

Leadership performance plan purposethe lpp is a forward-looking instrument focusing on motivating select members of Swiss Re’s senior management to take decisions that are in the shareholders’ long-term interest and to achieve sustainable business performance. the intention of the lpp is to: focus participants’ energies on earnings,
capital efficiency and our position against peers, all of which are critical to long-term shareholder value creation;
attract and retain individuals of exceptional skill; and
provide competitive compensation that rewards long-term performance.
plan durationFor all Group eC and GmB members, the lpp plan duration is five years. plan duration comprises a three-year vesting and performance measurement period and an additional two-year holding requirement. For all other participants, the vesting and performance measurement period is three years with no additional holding requirement.
Structureat grant date, the award is split equally into two underlying components – Restricted Share units (RSus), and performance Share units (pSus). Both are explained next.
Restricted Share Unitsthe performance condition for RSus is return on equity (Roe) with a linear vesting line. Vesting is at 0% for an Roe at risk free rate* and at 100% for an Roe at a predefined premium above risk free rate. the premium is set at the beginning of the plan period and for lpp 2014 this premium has been set at 900 basis points above the risk free rate*. at the end of each year, the performance against the Roe condition is assessed and one third of the RSus are locked in within a range from 0% to 100%. at the end of the three-year period, the total number of units locked in at each measurement period will vest.
performance Share Unitsthe performance condition for pSus is relative total shareholder return (tSR) measured over three years. the pSu vesting curve starts with 50% vesting at the 50th percentile of tSR relative to peers and is capped at 200% vesting at the 75th percentile. the pSus vest within a range of 0%–200%. In the case of a negative tSR over three years, the Compensation Committee retains the right to reduce the level of vesting.
Swiss Re’s tSR performance is assessed relative to the tSR of the peer group. the defined peer group consists of companies that are similar in scale, have a global footprint or have a similar business mix as Swiss Re. the peer group which is set at the beginning of the plan period is aCe
* annual risk free rate is defined as the average of 12 monthly rates for 5-year uS treasury Bonds of the corresponding performance year.
ltd, allianz Se, american International Group Inc, amlin plC, axa Sa, Catlin Group ltd, everest Re Group ltd, hannover Rueck Se, muenchener Rueckversiche-rungs-Gesellschaft aG, partnerRe ltd, Reinsurance Group america Inc, RenaissanceRe holding ltd, SCoR Se, xl Group plC and Zurich Insurance Group aG.
Final settlementat the end of the three-year measurement period, both components will typically be settled in Swiss Re shares. For Group eC and GmB members, an additional two-year holding is required. For the full three-year performance measurement period, forfeiture conditions apply.
additionally, clawback provisions apply in the event of any downward financial restatement which is caused or partially caused by the lpp participant’s fraud or misconduct. In this case, the company is entitled to seek repayment of any vested and settled award.
Lpp grantthe amounts disclosed under lpp in the section Compensation decisions in 2013 reflect the grants made in march 2014. this lpp award will be measured over the period 2014–2016.
Swiss Re also offers the possibility for all lpp participants to have shares sold to cover statutory tax and social security liabilities that may arise at vesting.
performance period
2014 2015 2016 2017
performance condition:Roe, measured after each year
performance condition: Relative tSR, measured over 3 years
pS
Us
–
per
form
ance
S
hare
Uni
ts
RS
Us
–
Res
tric
ted
S
hare
Uni
ts
Vest
ing
afte
r 3
yea
rs
Forf
eitu
re c
ondi
tion
s
tota
l Lp
p a
war
d
add
itio
nal 2
yea
r ho
ldin
g fo
r
Gro
up e
C a
nd G
mB
mem
bers
100%
200%
0%
0%
Leadership performance plan
Swiss Re 2013 Financial Report 117
CompenSation | CompenSatIon FRamewoRK

Compensation framework for Group eC membersCompensation principlesthe Group Ceo and the other members of the Group eC are remunerated under the same compensation framework and guiding principles as all other Swiss Re employees. the Group Ceo and the other members of the Group eC are paid a fixed base salary and are eligible to receive variable compensation in the form of apI, VaI as well as lpp.
In 2013, for the members of the Group eC including the Group Ceo, the total of the aggregate target apIs was ChF 15.8 million (capped at 3x annual base salary) and the aggregate lpp award was ChF 11.4 million.
the Compensation Committee assesses the performance of the Group Ceo and the Group eC members against a set of quantitative and qualitative objectives. the main financial performance indicators are based on uS Gaap, eVm results, economic net worth and return on equity. the qualitative criteria include client and service quality, franchise building, leadership and talent management as well as risk and control related behaviour objectives. these objectives are agreed at the beginning of the year and are aligned with the Group’s financial plan.
Benchmarking the external adviser, mercer, conducts an annual review of the total compensation for the Group eC relative to a group of reference companies in the financial services industry to ensure that market competitiveness is maintained. this peer group consists of the following globally active primary insurance and reinsurance firms: ace ltd, allianz Se, american International Group Inc, aviva plC, axa Sa, Generali, hannover Rueck Se, metlife Inc, muenchener Rueckversicherungs-Gesellschaft aG, partnerRe ltd, QBe Insurance Group ltd, Reinsurance Group of america Inc, SCoR Se, xl Group plC and Zurich Insurance Group aG.
employment conditionsthe Group Ceo and the other Group eC members have employment contracts with maximum notice periods of 12 months and without severance payment agreements. Information on “change of control” clauses is covered in the Corporate Governance section on page 93. executives are covered by the Group’s standard defined-contribution pension plans.
Stock ownership Guidelineswith effect from 1 January 2010, Swiss Re established stock ownership guidelines which articulate the levels of stock ownership expected of the members of the Group eC and the GmB. the guidelines are designed to increase the alignment of individual members of senior management with shareholders and demonstrate that Swiss Re executives bear the same risks as other shareholders.
the guidelines define target ownership by role and the ownership levels required are outlined below: Group Ceo — 3x annual base salary Group eC members — 2x annual
base salary GmB members — 1x annual base salary
members have a five-year timeframe to achieve these targets. In addition, because Swiss Re believes that a meaningful stock ownership position is essential, restrictions on the cash portion of apI delivered will apply if these levels are not met within the specified timeframe.
the determination for whether a Group eC or GmB member has met the guidelines will include all vested shares that are owned directly or indirectly by the relevant members and related parties.
Discontinued compensation plans Long-term incentiveuntil 2012, a different vintage of the ltI plan was awarded to employees. there is still one vintage of awards outstanding under this plan, vesting in march 2014.
the ltI awards vest after three years and are paid in Swiss Re shares, provided the performance thresholds are met. For each ltI plan year, final payment, if any, occurs at the end of the respective three-year performance measurement period. the plan includes a payout factor which can vary between zero and two, driven by average return on equity (Roe) and average earnings per share (epS) over the performance period. the final payment in respect of each plan will depend on whether performance targets, expressed as average Roe and epS, have been achieved over the plan period, as well as the share price at conclusion.
118 Swiss Re 2013 Financial Report
CompenSation | CompenSatIon FRamewoRK

Roles and time commitment the fees for the members of the Board of directors reflect differing levels of responsibility and time commitment. the individual levels of pay therefore vary considerably. Certain committees, such as the audit Committee as well as the Finance and Risk Committee, meet more frequently with longer meetings and require more preparation time than other committees and hence have higher workloads. Chairpersons of these committees devote even more time to their task.
the Chairman of the Board of directors devotes himself full-time to his role. In defining the position of Chairman as a full-time role, Swiss Re applies international best practice for highly regulated, complex financial institutions. the Chairman participates in developing the firm’s strategy, supervises the implementation of the agreed strategy and organises the work of the Board of directors and its committees. he also has an important task, together with the Group Ceo, in representing the firm to outside parties including shareholders, industry associations, the media and the general public, at all key locations where Swiss Re operates.
Swiss Re has two Vice Chairmen. one Vice Chairman was appointed in 2009 and chairs the Investment Committee, and since 2012 also the Finance and Risk Committee. additionally he is a member of the Chairman’s and Governance Committee. throughout the year, this Vice Chairman devotes about three-quarters of his time to his tasks. an additional Vice Chairman was appointed in 2012 and is also a member of the Chairman’s and Governance Committee and furthermore is a member of the audit Committee and the Compensation Committee. the Board of directors may assign further tasks to the Vice Chairmen. Such tasks may include representation of the Board of directors in the Boards of the Group’s uS or european subsidiaries, which are highly relevant to Swiss Re from both a risk and revenue perspective.
Compensation framework for the Board of DirectorsCompensation principlesthe objective in compensating members of the Board of directors is to attract and retain experienced individuals who are motivated to perform a critical role in the strategic oversight of the company and to contribute their individual business experience and expertise. the structure of compensation for members of the Board of directors must, however, take account of the way their contribution to the success of Swiss Re differs from that of the Group eC.
It is important that the compensation elements are used so as to achieve a strong alignment with the interests of the shareholders of Swiss Re. therefore, a significant portion of the compensation arrangements for the Board of directors consists of shares of the company, in line with best practice.
unlike the apI for the Group eC, which is determined in arrears based on the results of the performance year, the fees for the Board of directors are determined in advance for the term of office they are elected for. the fee level for each Board member is reviewed annually to ensure that it remains appropriate.
Compensation structure Group fees for the members of the Board of directors are delivered as 60% in cash, and a mandatory 40% in Swiss Re shares, with a four-year blocking period.
the degree of in-depth oversight requires from each Board member a high level of professional experience and expertise in their respective field. Furthermore, the demands on the Chairs of the respective committees continue to increase. Swiss Re is confident that the skill set of its Board of directors is well-balanced, which in turn ensures an effective level of supervision.
Valid cross-border comparisons of the roles and responsibilities of the Swiss Re Board against the boards of other international companies are clearly difficult to make, given both the differing legal environment and operating context within each country. nevertheless, it is apparent that the demands on the Swiss Re Board members are particularly significant, and that these requirements continue to increase. In addition to their core responsibilities, Board members, similar to the Chairman, are regularly asked to meet with external stakeholders including regulators, political authorities and investors, all of which warrant additional time, dedication and commitment from the individuals concerned.
Subsidiary boards of directors the majority of the members of the boards at the subsidiary level are Swiss Re executives and they receive no additional fees for their services in this role. the non-executive members of the boards receive their fees 100% in cash.
Swiss Re 2013 Financial Report 119
CompenSation | CompenSatIon FRamewoRK

Status of Value alignment incentive awards
VaI plan year performance measurement period as of 31 december 2013 performance factor
2006 3 years (closed) 124.2%2007 3 years (closed) 123.4%2008 3 years (closed) 135.7%2009 3 years (closed) 104.0%2010 3 years to be determined2011 2 years to be determined2012 1 year to be determined
CompenSatIon deCISIonS In 2013
General compensation
payouts of deferred compensation plansValue alignment incentive the VaI performance is measured for the Group and each underlying business area. participants receive the performance factor relating to the business area that they were in at the time of award. In march 2013, the Group VaI 2009 (awarded in 2010) vested with an average performance factor of 104%.
the VaI 2009 performance factor resulted from favourable claims development in 2011 and 2012, and a positive investment result. however, compared to the VaI 2008 performance factor, the positive developments were lower.
Long term incentive the performance hurdles for the ltI award defined in 2011 were centred on an average return on equity (Roe) target of 10.2% and average earnings per share (epS) target of uSd 6.60. Considerations which led to the respective targets were the market outlook, the level of uncertainty and the clear priority set by the Board to de-risk the balance sheet.
the ltI plan has been discontinued and the last award of ltI was granted in march 2011. the last grant of ltI was disclosed in the 2010 Compensation Report. the table below reflects the units awarded and subsequently vested across all ltI plan years.
of the plans that have expired or are due to expire in 2014, the ltI represented about 29% of the total compensation for the Group eC members over that period. these ltI plans have resulted or will result in a settlement value of approximately 84% of the award value. Consequently, the total compensation awarded for the Group eC members over that period was approximately 5% higher than the value realised upon vesting.
in ChF millions total
Grant units awarded1 6 037 420Value awarded2 286weighted average value per unit at grant 47.17
Vesting units vested1,3 5 519 740Value vested of which: 271
Vesting related to performance factor 155Vesting related to share price growth 116
weighted average value per unit at vesting 49.16
1 number of units2 “Value awarded” includes awards to all employees3 Vesting of ltI 2011 is on 31 march 2014. number of units is as of 28 February 2014. an indicative share price
of ChF 82.20 as of 28 February 2014 has been used for the calculations
120 Swiss Re 2013 Financial Report
CompenSation

aggregate compensation of the Swiss Re Groupthe aggregate compensation for the performance years 2012 and 2013 for all employees was as follows:
as of 31 december 2013, Swiss Re Group employed 11 574 regular staff worldwide, compared to 11 193 employees at the end of 2012.
aggregate compensation for Key Risk takersthe aggregate compensation of the individuals that held a key risk-taking position during the performance years 2012 and 2013 was:
performance Year 2012 performance Year 2013
Category type of plannumber of
participantsValues (in
ChF millions)number of
participantsValues (in
ChF millions)
Fixed compensation Base salaries 11 193 1 082 11 574 1 122pensions, social security and benefits1 11 193 424 11 574 457
annual performance Incentive
Cash annual performance Incentive2 10 015 379 10 318 357Value alignment Incentive 1 081 72 959 63
long-term variable compensation
leadership performance plan 243 43 278 45
other payments Severance payments3 393 28 355 19Sign-on payments 94 4 83 4
1 In 2012 various cash allowances (eg service awards, car and meal allowances) in the amount of ChF 11.6 million were not included.
2 a post-award adjustment was made in 2013 in respect of two employees for the 2012 performance year. the incremental amount was ChF 280 000 which is not included in the table above.
3 Severance payments in the table above include (i) payments under standard severance packages, (ii) other payments that are over and above what is contractually or legally required, and (iii) voluntary supplementary departure payments, but exclude similar legally permitted payments or garden leave which are aligned with local market practice for comparable positions in respect of amount, nature or duration.
performance Year 2012 performance Year 2013
Category type of plannumber of
participantsValues (in
ChF millions)number of
participantsValues (in
ChF millions)
Fixed compensation Base salaries 125 53 140 55pensions, social security and benefits 125 22 140 28
annual performance Incentive
Cash annual performance Incentive1 125 51 137 45Value alignment Incentive 124 33 136 30
long-term variable compensation
leadership performance plan 114 32 126 32
other payments Severance payments2 4 6 0 0Sign-on payments 7 2 2 2
1 a post-award adjustment was made in 2013 in respect of two employees for the 2012 performance year. the incremental amount was ChF 280 000 which is not included in the table above.
2 Severance payments in the table above include (i) payments under standard severance packages, (ii) other payments that are over and above what is contractually or legally required, and (iii) voluntary supplementary departure payments, but exclude similar legally permitted payments or garden leave which are aligned with local market practice for comparable positions in respect of amount, nature or duration.
Swiss Re 2013 Financial Report 121
CompenSation | CompenSatIon deCISIonS In 2013

aggregate variable compensation expensethe Compensation Committee takes its decisions to award variable compensation on an economic value basis at the time of grant. In the financial statements the recognition of deferred compensation follows the accrual principles as defined under uS Gaap. the financial statements reflect the aggregate value of variable compensation for the year under review as follows:
Compensation decisions for the Group eC
the variable compensation awarded to all members of the Group eC (including the Group Ceo) totalled ChF 30.0 million for 2013, compared to ChF 33.2 million in 2012. the following table covers payments to 16 members for 2012, of whom seven were employed for the full year. the 2013 payments cover 12 members who were all employed for the full year.
28% Base salary and allowances
27 % Cash API
18 % VAI (paid after 3 years)
27% LPP (paid after 3 years)
Compensation mix for Group EC 2012
Compensation mix for Group eC 2013
2012
28% Base salary and allowances
27% Cash apI
18% VaI (paid after 3 years)
27% lpp (paid after 3 years)
30% Base salary and allowances
23% Cash apI
20% VaI (paid after 3 years)
27% lpp (paid after 5 years)
US Gaap accounting year 2013
ChF millionseconomic
value at grantaccrued
grant valueFair value
mark-uptotal
expense
Cash apI 2013 357 357 357VaI 2013 (granted in april 2014) 63lpp 2014 (granted in april 2014) 45Cash apI 20121 –25 –25VaI 2009–2012 (granted between 2010 and 2013)2 64 –2 62lpp 2012–2013 (granted between 2012 and 2013)2 24 –1 23ltI 2009–2011 (granted between 2009 and 2011)2 14 15 29total 459 –13 446
1 accrual related to prior performance year.2 plans were granted in prior years.
16 members9 12 membersChF thousands1 2012 2013
Base salary and allowances2,3 12 985 12 984Funding of pension benefits 1 656 1 914total fixed compensation 14 641 14 898Cash annual performance Incentive4,5 12 394 10 072Value alignment Incentive 8 359 8 532leadership performance plan6 12 400 11 400total variable compensation 33 153 30 004total fixed and variable compensation7 47 794 44 902Compensation due to members leaving8 2 268total compensation 50 062 44 902
1 the company contributions to social security systems paid by Swiss Re in line with applicable laws amounted to ChF 4 961 777 in 2012 and ChF 3 116 428 in 2013. the table shows gross amounts.
2 allowances consist of housing, schooling, lump sum expenses, child and similar allowances.3 For 2012, notional loan interest of ChF 8 265 for one Group eC member was not included. For 2013, the
notional loan interest is included.4 For 2012, does not include sign-on bonuses in the amount of ChF 1.4 million as payments were made prior
to joining the Group eC. these amounts were however included in both “aggregate compensation” tables on page 121 for 2012.
5 a post-award adjustment was made in 2013 in respect of one employee for the 2012 performance year. this incremental amount of ChF 220 000 related to duties prior to joining the Group eC which is not included in the table above. please also see “aggregate compensation” tables on page 121.
6 disclosure reflects all awards within a compensation cycle; eg, the 2013 value reflects the fair value of lpp granted in march 2014.
7 Includes payments reflecting the time in the role as Group eC members.8 Covers legally or contractually required payments for members who were in the role for only a part of the
reporting period.9 Represents incumbents and not positions.
30% Base salary and allowances
23% Cash API
20% VAI (paid after 3 years)
27% LPP (paid after 3 years)
2012
122 Swiss Re 2013 Financial Report
CompenSation | CompenSatIon deCISIonS In 2013

Compensation decisions for the Group Ceomichel m. Liès, Group Ceo since February 2012
additional information on compensation decisionsall amounts reported are gross (that is, before any statutory social security or tax deductions). amounts reported under base salary and allowances include the base salary which is paid in cash, as well as benefits or allowances paid in cash.
total fixed compensation (excluding funding of pension benefits) reflects the portion of the total compensation that is fixed and therefore not variable with performance. For 2013, the portion of Group eC compensation that is fixed amounts to 30% (compared to 28% for 2012).
the lpp 2013 represents the fair value of the lpp award granted in march 2013. this lpp may lead to a payment in march 2016, subject to return on equity and relative total shareholder return performance conditions from 2013 to 2015. In the same way, the lpp 2014 represents the fair value of the lpp award granted in march 2014, which may (subject to the performance conditions from 2014 to 2016) lead to vesting in march 2017. the lpp is described in detail on page 117.
each member of the Group eC (including the Group Ceo) participates in a defined-contribution pension scheme. the funding of pension benefits shown in the table above reflects the actual employer contributions.
other payments to members of the executive Committeeduring 2013, no payments (or waivers of claims) other than those set out in the “Compensation decision” tables were made to current members of the Group eC.
ChF thousands1 20122 2013
Base salary and allowances 1 663 1 639Funding of pension benefits 175 177total fixed compensation 1 838 1 816Cash annual performance Incentive 1 450 1 600Value alignment Incentive 1 450 1 600leadership performance plan3 2 000 2 000total variable compensation 4 900 5 200total compensation 6 738 7 016
1 the company contributions to social security systems paid by Swiss Re in line with applicable laws amounted to ChF 613 490 in 2012 and ChF 491 381 in 2013. the table shows gross amounts.
2 For 2012, includes one month for the former Group Ceo, Stefan lippe, and 11 months for the current Group Ceo, michel m. liès.
3 disclosure reflects all awards within a compensation cycle; eg, the 2013 value reflects the fair value of lpp granted in march 2014.
Swiss Re 2013 Financial Report 123
CompenSation | CompenSatIon deCISIonS In 2013

Shares held by members of the Group eCthe following table reflects total current Swiss Re share ownership by members of the Group eC as of 31 december:
Unvested restricted share units held by members of the Group eCprior to the introduction of the lpp, Swiss Re did not grant restricted share units (RSus) on a regular basis, except for events such as exceptional business cycles, significant acquisitions or the replacement of forfeited equity for new executive hires.
the following table reflects unvested restricted share unit ownership by members of the Group eC as of 31 december:
Vested options held by members of the Group eCthe following table reflects total vested option ownership by members of the Group eC as of 31 december:
Swiss Re granted options to senior management in the past and the last grant was made in 2006. the underlying exercise price for the outstanding option series has been adjusted for the special dividend payout in 2013. the remaining vested options held by active members of the Group eC will expire between 2014 and 2015, and have a weighted average exercise price of ChF 83.92 (within a range between ChF 78.52 and ChF 88.13) after the adjustment.
2013
michel m. liès, Group Ceo 171 947Guido Fürer, Group Chief Investment officer 21 253agostino Galvagni, Ceo Corporate Solutions 108 060Jean-Jacques henchoz, Ceo Reinsurance emea 16 335Christian mumenthaler, Ceo Reinsurance 50 984moses ojeisekhoba, Ceo Reinsurance asia 8 583George Quinn, Group Chief Financial officer 96 506matthias weber, Group Chief underwriting officer 38 592thomas wellauer, Group Chief operating officer 17 708total 529 968
2013
moses ojeisekhoba, Ceo Reinsurance asia 5 693total 5 693
2013
weighted average exercise price in ChF 83.92michel liès, Group Ceo 42 000Guido Fürer, Group Chief Investment officer 7 500George Quinn, Group Chief Financial officer 20 000matthias weber, Group Chief underwriting officer 7 000total 76 500
124 Swiss Re 2013 Financial Report
CompenSation | CompenSatIon deCISIonS In 2013

Long term incentive units held by members of the Group eCthe following table reflects total unvested long term Incentive units held by members of the Group eC as of 31 december. this includes both awards under the previous ltI and the current lpp:
Loans to members of the Group eCIn general, credit is secured against real estate or pledged shares. the terms and conditions of loans and mortgages are typically the same as those available to all employees of the Swiss Re Group in their particular locations to the extent possible. For example, in Switzerland fixed-rate mortgages have a maturity of five years and interest rates that correspond to the five-year Swiss franc swap rate plus a margin of 10 basis points.
Swiss-based variable-rate mortgages have no agreed maturity dates. the basic preferential interest rates equal the corresponding interest rates applied by the Zurich Cantonal Bank minus one percentage point. to the extent that fixed or floating interest rates are preferential, the value of this benefit has been included in the line item “base salary and allowances” on pages 122 and 123.
the following table reflects total mortages and loans for members of the Group eC (see Financial Statements, note 13 on page 251 for more details).
Compensation for former members of the Group eCduring 2013, payments in the total amount of ChF 1.1 million were made to seven former members of the Group eC. this amount is made up of a pro-rata base salary payment, company contributions to social security and pension systems paid by Swiss Re in line with applicable laws, benefits in the context of the outstanding mortgages and loans not at market rates above, risk benefits as well as company commitments for tax related services.
ChF thousands 2013
total mortgages and loans to members of the Group eC 3 956highest mortgages and loans to an individual member of the Group eC:
Christian mumenthaler 1 919total mortgages and loans not at market conditions to former members of the Group eC 4 300
2013
michel liès, Group Ceo 108 795david Cole, Group Chief Risk officer 69 280John R. dacey, Group Chief Strategy officer, Chairman admin Re® 17 685Guido Fürer, Group Chief Investment officer 47 760agostino Galvagni, Ceo Corporate Solutions 77 825Jean-Jacques henchoz, Ceo Reinsurance emea 47 740Christian mumenthaler, Ceo Reinsurance 77 825moses ojeisekhoba, Ceo Reinsurance asia 34 915George Quinn, Group Chief Financial officer 86 375J. eric Smith, Ceo Swiss Re americas 34 915matthias weber, Group Chief underwriting officer 65 005thomas wellauer, Group Chief operating officer 77 825total 745 945
Swiss Re 2013 Financial Report 125
CompenSation | CompenSatIon deCISIonS In 2013

Compensation for the members of the Board of directors
Compensation for the members of the Board of Directorsthe individual compensation for the members of the Board of directors for 2013 was:
Shares held by members of the Board of Directorsthe number of shares held by members of the Board of directors as of 31 december were:
ChF thousands1,2 total 2012
Fees and allowances in
cash
Fees in blocked
sharestotal
2013
walter B. Kielholz, Chairman 5 137 2 988 1 976 4 964mathis Cabiallavetta, Vice Chairman3 2 556 1 482 988 2 470Renato Fassbind, Vice Chairman4 461 302 202 504Jakob Baer, Chairman of the audit Committee 807 484 323 807Raymund Breu, member 360 201 134 335Raymond K.F. Ch’ien, member 360 212 141 353John R. Coomber, member5 495 248 161 409mary Francis, member6 — 120 80 200Rajna Gibson Brandon, member 335 197 131 328C. Robert henrikson, Chairman of the Compensation Committee7 306 257 171 428malcolm d. Knight, member 332 212 141 353hans ulrich maerki, member 328 197 131 328Carlos e. Represas, member8 385 273 111 384Jean-pierre Roth, member 284 166 111 277Robert a. Scott, former Chairman of the Compensation Committee9 145total 12 291 7 339 4 801 12 140
1 Compensation for the members of the Board of directors includes fixed fees and allowances both in cash and shares. no sign-on or severance payments are made.
2 the company contributions to social security systems paid by Swiss Re in line with applicable laws amounted to ChF 1 294 292 in 2012 and ChF 1 282 026 in 2013. the table shows gross amounts.
3 Chairman of the Finance and Risk Committee since 13 april 2012, Chairman of the Investment Committee4 elected to Vice Chairman as of 13 april 2012.5 Chairman of the Finance and Risk Committee until 13 april 2012.6 elected to Swiss Re’s Board of directors at the annual General meeting of 10 april 2013.7 elected to Swiss Re’s Board of directors at the annual General meeting of 13 april 2012.8 Includes fees for duties on the board of uS Group companies.9 term of office expired as of 13 april 2012 and did not stand for re-election due to retirement.
2013
walter B. Kielholz, Chairman 399 490mathis Cabiallavetta, Vice Chairman 109 177Renato Fassbind, Vice Chairman 7 655Jakob Baer, Chairman of the audit Committee 44 699Raymund Breu, member 36 024Raymond K.F. Ch’ien, member 15 048John R. Coomber, member 140 200mary Francis, member 1 027Rajna Gibson Brandon, member 26 047C. Robert henrikson, Chairman of the Compensation Committee 4 339malcolm d. Knight, member 7 665hans ulrich maerki, member 25 594Carlos e. Represas, member 8 900Jean-pierre Roth, member 6 762total 832 627
126 Swiss Re 2013 Financial Report
CompenSation | CompenSatIon deCISIonS In 2013

performance shares for the members of the Board of DirectorsIn 2009 and 2010, the Chairman and the then-Vice Chairman received half of their respective total fees in the form of a three-year performance share plan. the final number of shares to vest after the three years could vary between 0% and 150% of the original award, depending on Swiss Re’s relative total shareholder return (tSR) ranking against a peer group over the performance period. For a vesting at 150% of the original award, performance on this measure had to be at or above the 75th percentile. the peer group companies comprised ace ltd, allianz Se, the allstate Corporation, aviva plC, axa Sa, Credit Suisse Group aG, assicurazioni Generali S.p.a, hannnover Rückversicherung aG, InG Groep nV, metlife Inc, muenchener Rueckversicherungs-Gesellschaft aG, prudential Financial Inc, uBS aG and Zurich Insurance Group aG. awards under this plan were only made in 2009 and 2010.
In march 2013, the 2010 award vested, and based on a third-party assessment of achievement against the performance targets set, Swiss Re achieved a ranking of 3rd out of 15 participants as well as a tSR of 66.19%. Given this performance, the vesting percentage was determined at the maximum 150%.
as of 31 december no performance shares for the members of the Board of directors were outstanding.
Vested options held by members of the Board of DirectorsSwiss Re does not grant employee stock options to members of the Board of directors. the stock options shown in the table below were awarded at a time when the recipients were still members of Swiss Re’s executive management. the vested options held by members of the Board of directors as of 31 december were:
the underlying exercise prices for the outstanding option series have been adjusted for the special dividend payout in 2013. the vested options held by members of the Board of directors will expire in 2014 and 2015, and the weighted average exercise price is ChF 83.04 after the adjustment.
Loans to members of the Board of Directorsthe table below includes loans for the members of the Board of directors. this loan was established when the recipient was still a member of Swiss Re’s executive management.
the mortgage is secured against real estate and its terms and conditions are the same as those available to all Swiss Re employees in Switzerland. It carries a fixed rate and has a maturity of five years. the interest rate corresponds to the five-year Swiss franc swap rate plus a margin of 10 basis points at the time of fixing. to the extent interest rates are preferential, the value of this benefit has been included in the line item “fees and allowances” on page 126.
Related parties transactionsdisclosure on compensation decisions in 2013 covers members of the Group eC and the Board of directors as indicated, and for both including related parties to the extent applicable. Such related parties cover spouses, partners, children and other dependents or closely linked persons. In 2013 no compensation was paid to any related party.
2013
weighted average exercise price in ChF 83.04walter B. Kielholz, Chairman 40 000John R. Coomber, member 130 000total 170 000
ChF thousands 2013
walter B. Kielholz, Chairman 2 000
Swiss Re 2013 Financial Report 127
CompenSation | CompenSatIon deCISIonS In 2013

128 Swiss Re 2013 Financial Report

Financial statements
130 Group financial statements130 income statement131 statement of comprehensive
income132 Balance sheet134 statement of shareholders’
equity136 statement of cash flow
236 Swiss Re Ltd236 annual Report237 income statement238 Balance sheet240 notes 253 Proposal for allocation of
disposable profit254 Report of the statutory auditor
138 Notes to the Group financial statements
138 note 1 Organisation and summary of significant accounting policies
146 note 2 investments153 note 3 Fair value disclosures170 note 4 Derivative financial
instruments176 note 5 Deferred acquisition costs
(Dac) and acquired present value of future profits (PVFP)
179 note 6 Debt and contingent capital instruments
182 note 7 Unpaid claims and claim adjustment expenses
184 note 8 insurance information189 note 9 Premiums written 190 note 10 earnings per share191 note 11 income taxes194 note 12 Benefit plans202 note 13 share-based payments205 note 14 compensation, participations
and loans of members of governing bodies
206 note 15 Related parties207 note 16 commitments and contingent
liabilities209 note 17 information on business
segments220 note 18 significant subsidiaries and
equity investees 224 note 19 Variable interest entities228 note 20 Restructuring provision229 note 21 Risk assessment232 Report of the statutory auditor234 Group financial years 2004–2013
fiNaNciaL StatemeNtS | intRODUctiOn
Swiss Re 2013 Financial Report 129

incOme statementFor the years ended 31 December
UsD millions note 2012 2013
RevenuesPremiums earned 8 24 661 28 276Fee income from policyholders 8 785 542net investment income – non-participating 2 4 473 3 947net realised investment gains/losses – non-participating business (total impairments for the years ended 31 December were 215 in 2012 and 41 in 2013, of which 162 and 41, respectively, were recognised in earnings) 2 947 766net investment result – unit-linked and with-profit 2 2 570 3 347Other revenues 188 24total revenues 33 624 36 902
expensesclaims and claim adjustment expenses 8 –7 763 –9 655life and health benefits 8 –8 878 –9 581Return credited to policyholders –2 959 –3 678acquisition costs 8 –4 548 –4 895Other expenses –3 217 –3 508interest expenses –736 –760total expenses –28 101 –32 077
income before income tax expense 5 523 4 825income tax expense 11 –1 125 –312Net income before attribution of non-controlling interests 4 398 4 513
income attributable to non-controlling interests –141 –2Net income after attribution of non-controlling interests 4 257 4 511
interest on contingent capital instruments –56 –67Net income attributable to common shareholders 4 201 4 444
earnings per share in USDBasic 10 11.85 12.97Diluted 10 11.06 11.89earnings per share in cHf1Basic 10 11.13 12.04Diluted 10 10.39 11.04
1 the translation from UsD to cHF is shown for informational purposes only and has been calculated using the Group’s average exchange rates.
the accompanying notes are an integral part of the Group financial statements.
130 Swiss Re 2013 Financial Report
fiNaNciaL StatemeNtS | GROUP Financial statements

statement OF cOmPReHensiVe incOmeFor the years ended 31 December
UsD millions 2012 2013
net income before attribution of non-controlling interests 4 398 4 513Other comprehensive income, net of tax:
change in unrealised gains/losses (tax: 59 in 2012 and 1 106 in 2013) 184 –2 785change in other-than-temporary impairment (tax: –47 in 2012 and –12 in 2013) 90 22change in foreign currency translation (tax: 28 in 2012 and 39 in 2013) 332 –288change in adjustment for pension benefits (tax: 59 in 2012 and –119 in 2013) –178 419
total comprehensive income before attribution of non-controlling interests 4 826 1 881
interest on contingent capital instruments –56 –67attribution of value to option on redeemable non-controlling interest1 –132comprehensive income attributable to non-controlling interests –141 –2total comprehensive income attributable to common shareholders 4 497 1 812
1 in 2000, swiss Re and the shareholders of new california Holdings, inc. entered into a put/call agreement for the acquisition of new california Holdings, inc. by swiss Re. the put/call agreement was considered a redeemable non-controlling interest, however, a value was not assigned to this instrument as the exercise was contingent on several items occurring to complete the transaction. During the second quarter of 2012, the majority of the contingencies had been resolved and the exercise of the put/call option at the predetermined price became probable. in accordance with Us GaaP requirements, the difference between the carrying value of the minority interest and the redemption price, UsD 132 million, was recorded against shareholders’ equity and as a reduction in the net income attributable to common shareholders for the purposes of calculating earnings per share.
Reclassification out of accumulated other comprehensive incomeFor the year ended 31 December
the accompanying notes are an integral part of the Group financial statements.
2013 UsD millions
Unrealised gains/losses1
Other-than-temporary impairment1
Foreign currency translation1,2
adjustment from pension benefits3
accumulated other comprehensive income
Balance as of 1 January 4 407 –28 –3 609 –953 –183change during the period –3 057 34 –327 479 –2 871amounts reclassified out of accumulated other comprehensive income –834 59 –775tax 1 106 –12 39 –119 1 014Balance as of period end 1 622 –6 –3 897 –534 –2 815
1 Reclassification adjustment included in net income is presented in the “net realised investment gains/losses – non-participating business” line. this line also includes a shadow adjustment, please refer to note 5 “Deferred acquisition costs and acquired present value of future profits”.
2 Reclassification adjustment is limited to translation gains and losses realised upon sale or upon complete or substantially complete liquidation of an investment in a foreign entity.
3 Reclassification adjustment included in net income is presented in the “Other expenses” line.
Swiss Re 2013 Financial Report 131
fiNaNciaL StatemeNtS | GROUP Financial statements

Balance sHeetas of 31 December
assets
the accompanying notes are an integral part of the Group financial statements.
UsD millions note 2012 2013
investments 2, 3, 4Fixed income securities:
available-for-sale, at fair value (including 9 529 in 2012 and 11 720 in 2013 subject to securities lending and repurchase agreements) (amortised cost: 2012: 80 594; 2013: 76 349) 86 974 77 761trading (including 196 in 2012 and 1 in 2013 subject to securities lending and repurchase agreements) 1 874 1 535
equity securities: available-for-sale, at fair value (including 0 in 2012 and 65 in 2013 subject to securities lending and repurchase agreements) (cost: 2012: 2 789; 2013: 6 110) 3 102 7 076trading 672 615
Policy loans, mortgages and other loans 2 299 2 895investment real estate 777 825short-term investments, at amortised cost which approximates fair value (including 3 464 in 2012 and 4 425 in 2013 subject to securities lending and repurchase agreements) 18 645 20 989Other invested assets 12 968 11 164investments for unit-linked and with-profit business (including fixed income securities trading: 4 630 in 2012 and 4 585 in 2013, equity securities trading: 18 617 in 2012 and 21 180 in 2013) 25 501 27 215total investments 152 812 150 075
cash and cash equivalents (including 75 in 2012 and 4 in 2013 subject to securities lending) 10 837 8 072accrued investment income 1 050 1 018Premiums and other receivables 11 529 12 276Reinsurance recoverable on unpaid claims and policy benefits 10 109 8 327Funds held by ceding companies 13 245 12 400Deferred acquisition costs 5 4 039 4 756acquired present value of future profits 5 3 023 3 537Goodwill 4 092 4 109income taxes recoverable 467 490Deferred tax assets 5 718 5 763Other assets 4 582 2 697
total assets 221 503 213 520
132 Swiss Re 2013 Financial Report
fiNaNciaL StatemeNtS | GROUP Financial statements

liabilities and equity
the accompanying notes are an integral part of the Group financial statements.
UsD millions note 2012 2013
LiabilitiesUnpaid claims and claim adjustment expenses 63 670 61 484liabilities for life and health policy benefits 3 36 117 36 033Policyholder account balances 29 349 31 177Unearned premiums 9 384 10 334Funds held under reinsurance treaties 3 642 3 551Reinsurance balances payable 3 754 2 370income taxes payable 604 660Deferred and other non-current tax liabilities1 9 442 8 242short-term debt 6 3 612 3 818accrued expenses and other liabilities 11 617 8 152long-term debt 6 16 286 14 722total liabilities 187 477 180 543
equitycontingent capital instruments 6 1 102 1 102common stock, cHF 0.10 par value
2012: 370 706 931; 2013: 370 706 931 shares authorised and issued2 35 35additional paid-in capital 7 721 4 963treasury shares, net of tax –995 –1 099
accumulated other comprehensive income:net unrealised investment gains/losses, net of tax 4 407 1 622Other-than-temporary impairment, net of tax –28 –6cumulative translation adjustments, net of tax –3 609 –3 897accumulated adjustment for pension and post-retirement benefits, net of tax –953 –534
total accumulated other comprehensive income –183 –2 815
Retained earnings 26 322 30 766Shareholders’ equity 34 002 32 952
non-controlling interests 24 25total equity 34 026 32 977
total liabilities and equity 221 503 213 520
1 the Group updated its balance sheet presentation of deferred tax assets and liabilities. Deferred tax assets and liabilities are presented on a gross basis as per the first quarter 2013. the comparative period has been adjusted accordingly and is consistent with the relevant income tax disclosure in the notes to the financial statements in the prior year.
2 Please refer to note 1 “Organisation and summary of significant accounting policies” and note 10 “earnings per share” for details on the number of shares authorised and issued.
Swiss Re 2013 Financial Report 133
fiNaNciaL StatemeNtS | GROUP Financial statements

statement OF sHaReHOlDeRs’ eqUityFor the years ended 31 December
UsD millions 2012 2013
contingent capital instrumentsBalance as of 1 January 0 1 102issued 1 102Balance as of period end 1 102 1 102
common sharesBalance as of 1 January 35 35issue of common sharesBalance as of period end 35 35
additional paid-in capitalBalance as of 1 January 8 985 7 721contingent capital instruments’ issuance costs –18share-based compensation –29 14Realised gains/losses on treasury shares –83 –12Dividends on common shares1 –1 134 –2 760Balance as of period end 7 721 4 963
treasury shares, net of taxBalance as of 1 January –1 096 –995Purchase of treasury shares –147 –290issuance of treasury shares, including share-based compensation to employees 248 186Balance as of period end –995 –1 099
Net unrealised gains/losses, net of taxBalance as of 1 January 4 223 4 407Other changes during the period 184 –2 785Balance as of period end 4 407 1 622
Other-than-temporary impairment, net of taxBalance as of 1 January –118 –28Other changes during the period 90 22Balance as of period end –28 –6
foreign currency translation, net of taxBalance as of 1 January –3 941 –3 609Other changes during the period 332 –288Balance as of period end –3 609 –3 897
adjustment for pension and other post-retirement benefits, net of taxBalance as of 1 January –775 –953change during the period –178 419Balance as of period end –953 –534
Retained earningsBalance as of 1 January 22 277 26 322net income after attribution of non-controlling interests 4 257 4 511interest on contingent capital instruments, net of tax –56 –67cumulative effect of adoption of asU 2010-262, net of tax –24attribution of value to option on redeemable non-controlling interest3 –132Balance as of period end 26 322 30 766
Shareholders’ equity 34 002 32 952Non-controlling interests
Balance as of 1 January 1 697 24change during the period4 –1 946 –1income attributable to non-controlling interests 141 2attribution of value to option on redeemable non-controlling interest3 132Balance as of period end 24 25
total equity 34 026 32 977
134 Swiss Re 2013 Financial Report
fiNaNciaL StatemeNtS | GROUP Financial statements

1 Dividends to shareholders were paid in the form of a withholding tax-exempt repayment out of legal reserves from capital contributions.2 the Group adopted a new accounting guidance, asU 2010-26 “accounting for costs associated with acquiring or Renewing insurance contracts” as of 1 January 2012,
which required the release of UsD 24 million of deferred acquisition costs against retained earnings.3 in 2000, swiss Re and the shareholders of new california Holdings, inc. entered into a put/call agreement for the acquisition of new california Holdings, inc. by swiss Re.
the put/call agreement was considered a redeemable non-controlling interest; however, a value was not assigned to this instrument as the exercise was contingent on several items occurring to complete the transaction. During the second quarter of 2012, the majority of the contingencies had been resolved and the exercise of the put/call option at the predetermined price became probable. in accordance with Us GaaP requirements, the difference between the carrying value of the minority interest and the redemption price, UsD 132 million, was recorded against shareholders’ equity and as a reduction in the net income attributable to common shareholders for the purposes of calculating earnings per share. in august 2012, the put/call option was exercised and new california Holdings inc. was acquired.
4 the sale of swiss Re Private equity Partners aG, the management company of swiss Re’s private equity fund-of-fund business, to BlackRock, inc. was closed on 4 september 2012. the sale resulted in the deconsolidation of a number of private equity funds, which led to a reduction in non-controlling interests of UsD 1 400 million. in addition, new california Holdings, inc. was acquired for UsD 548 million in cash on 29 august 2012. as of acquisition date, swiss Re also fully owned aurora national life assurance company and consequently no longer reports any non-controlling interest related to this subsidiary.
the accompanying notes are an integral part of the Group financial statements.
Swiss Re 2013 Financial Report 135
fiNaNciaL StatemeNtS | GROUP Financial statements

statement OF casH FlOwFor the years ended 31 December
UsD millions 2012 2013
cash flows from operating activitiesnet income attributable to common shareholders 4 201 4 444add net income attributable to non-controlling interests 141 2
adjustments to reconcile net income to net cash provided/used by operating activities:Depreciation, amortisation and other non-cash items 3 888 4 013net realised investment gains/losses –2 688 –3 324change in:
technical provisions, net –3 397 –4 062Funds held by ceding companies and other reinsurance balances 46 –1 103Reinsurance recoverable on unpaid claims and policy benefits 17 1 179Other assets and liabilities, net 235 1 739income taxes payable/recoverable 1 138 –162income from equity-accounted investees, net of dividends received –380 –152trading positions, net –543 –263securities purchased/sold under agreement to resell/repurchase, net 1 845 –28
Net cash provided/used by operating activities 4 503 2 283
cash flows from investing activitiesFixed income securities:
sales and maturities 108 231 84 173Purchases –106 064 –79 382net purchase/sale/maturities of short-term investments –5 073 –2 017
equity securities:sales 1 501 2 603Purchases –2 242 –5 625
cash paid/received for acquisitions/disposal and reinsurance transactions, net1 106net purchases/sales/maturities of other investments 10 –96Net cash provided/used by investing activities –3 531 –344
cash flows from financing activitiesissuance/repayment of long-term debt 740 40issuance/repayment of short-term debt –2 200 –1 593Proceeds from the issuance of contingent capital instruments, net of issuance cost 1 084Purchase/sale of treasury shares –133 –227Dividends paid to shareholders –1 134 –2 760Net cash provided/used by financing activities –1 643 –4 540
total net cash provided/used –671 –2 601effect of foreign currency translation 101 –164change in cash and cash equivalents –570 –2 765cash and cash equivalents as of 1 January 11 407 10 837cash and cash equivalents as of 31 December 10 837 8 072
1 swiss Re closed the sale of the admin Re® Us business to Jackson national life insurance co in the third quarter 2012. the purchase price included a cash payment of UsD 589 million. in addition, new california Holdings, inc. was acquired for UsD 548 million in cash. also in 2012, swiss Re Private equity Partners aG, swiss Re’s private equity fund-of-fund business, was sold to BlackRock, inc. for UsD 65 million in cash. swiss Re continues to be invested as a limited partner in the funds.
interest paid was UsD 887 million and UsD 929 million for the years ended 31 December 2012 and 2013, respectively.
tax paid was UsD 123 million and UsD 447 million for the years ended 31 December 2012 and 2013, respectively.
the accompanying notes are an integral part of the Group financial statements.
136 Swiss Re 2013 Financial Report
fiNaNciaL StatemeNtS | GROUP Financial statements

this page intentionally left blank
Swiss Re 2013 Financial Report 137
fiNaNciaL StatemeNtS | GROUP Financial statements

Notes to the Group fiNaNcial statemeNts
1 organisation and summary of significant accounting policies
Nature of operationsthe swiss re Group, which is headquartered in Zurich, switzerland, comprises swiss re ltd (the parent company) and its subsidiaries (collectively, the “swiss re Group” or the “Group”). the swiss re Group is a wholesale provider of reinsurance, insurance and other insurance-based forms of risk transfer. Working through brokers and a network of more than 60 offices around the globe, the Group serves a client base made up of insurance companies, mid- to large-sized corporations and public sector clients.
Basis of presentationthe accompanying consolidated financial statements have been prepared in accordance with accounting principles generally accepted in the united states of america (us Gaap) and comply with swiss law. all significant intra-group transactions and balances have been eliminated on consolidation.
Principles of consolidationthe Group’s financial statements include the consolidated financial statements of swiss re ltd and its subsidiaries. Voting entities which swiss re ltd directly or indirectly controls through holding a majority of the voting rights are consolidated in the Group’s accounts. Variable interest entities (Vies) are consolidated when the swiss re Group is the primary beneficiary. the Group is the primary beneficiary when it has power over the activities that impact the Vie’s economic performance and at the same time has the obligation to absorb losses or the right to receive benefits that could potentially be significant to the Vie. companies which the Group does not control, but over which it directly or indirectly exercises significant influence, are accounted for using the equity method or the fair value option and are included in other invested assets. the swiss re Group’s share of net profit or loss in investments accounted for under the equity method is included in net investment income. equity and net income of these companies are adjusted as necessary to be in line with the Group’s accounting policies. the results of consolidated subsidiaries and investments accounted for using the equity method are included in the financial statements for the period commencing from the date of acquisition.
Use of estimates in the preparation of financial statementsthe preparation of financial statements requires management to make significant estimates and assumptions that affect the reported amounts of assets, liabilities, revenues and expenses as well as the related disclosure, including contingent assets and liabilities. the swiss re Group’s liabilities for unpaid claims and claim adjustment expenses and policy benefits for life and health include estimates for premium, claim and benefit data not received from ceding companies at the date of the financial statements. in addition, the Group uses certain financial instruments and invests in securities of certain entities for which exchange trading does not exist. the Group determines these estimates based on historical information, actuarial analyses, financial modelling and other analytical techniques. actual results could differ significantly from the estimates described above.
Foreign currency remeasurements and translationtransactions denominated in foreign currencies are remeasured to the respective subsidiary’s functional currency at average quarterly exchange rates. monetary assets and liabilities are remeasured to the functional currency at closing exchange rates, whereas non-monetary assets and liabilities are remeasured to the functional currency at historical rates. remeasurement gains and losses on monetary assets and liabilities and trading securities are reported in earnings. remeasurement gains and losses on available-for-sale securities, investments in consolidated subsidiaries and investments accounted for using the equity method are reported in shareholders’ equity.
for consolidation purposes, assets and liabilities of subsidiaries with functional currencies other than us dollars are translated from the functional currency to us dollars at closing rates. revenues and expenses are translated at average exchange rates. translation adjustments are reported in shareholders’ equity.
Valuation of financial assetsthe fair value of the majority of the Group’s financial instruments is based on quoted prices in active markets or observable inputs. these instruments include government and agency securities, commercial paper, most investment-grade corporate debt, most high-yield debt securities, exchange-traded derivative instruments, most mortgage- and asset-backed securities and listed equity securities. in markets with reduced or no liquidity, spreads between bid and offer prices are normally wider compared to spreads in highly liquid markets. such market conditions affect the valuation of certain asset classes of the Group, such as some asset-backed securities as well as certain derivative structures referencing such asset classes.
138 Swiss Re 2013 financial report
FiNaNcial StatemeNtS

the Group considers both the credit risk of its counterparties and own risk of non-performance in the valuation of derivative instruments and other over-the-counter financial assets. in determining the fair value of these financial instruments, the assessment of the Group’s exposure to the credit risk of its counterparties incorporates consideration of existing collateral and netting arrangements entered into with each counterparty. the measure of the counterparty credit risk is estimated with incorporation of the observable credit spreads, where available, or credit spread estimates derived based on the benchmarking techniques where market data is not available. the impact of the Group’s own risk of non-performance is analysed in the manner consistent with the aforementioned approach, with consideration of the Group’s observable credit spreads. the value representing such risk is incorporated into the fair value of the financial instruments (primarily derivatives), in a liability position as of the measurement date. the change in this adjustment from period to period is reflected in realised gains and losses in the income statement.
for assets or derivative structures at fair value, the Group uses market prices or inputs derived from market prices. a separate internal price verification process, independent of the trading function, provides an additional control over the market prices or market input used to determine the fair values of such assets. although management considers that appropriate values have been ascribed to such assets, there is always a level of uncertainty and judgment over these valuations. subsequent valuations could differ significantly from the results of the process described above. the Group may become aware of counterparty valuations, either directly through the exchange of information or indirectly, for example, through collateral demands. any implied differences are considered in the independent price verification process and may result in adjustments to initially indicated valuations. as of 31 December 2013, the Group had not provided any collateral on financial instruments in excess of its own market value estimates.
investmentsthe Group’s investments in fixed income and equity securities are classified as available-for-sale (afs) or trading. fixed income securities afs and equity securities afs are carried at fair value, based on quoted market prices, with the difference between original cost and fair value being recognised in shareholders’ equity. trading fixed income and equity securities are carried at fair value with unrealised gains and losses being recognised in earnings.
the cost of equity securities afs is reduced to fair value, with a corresponding charge to realised investment losses if the decline in value, expressed in functional currency terms, is other-than-temporary. subsequent recoveries of previously recognised impairments are not recognised in earnings.
for debt securities afs which are other-than-temporary impaired and there is not an intention to sell, the impairment is separated into (i) the estimated amount relating to credit loss, and (ii) the amount relating to all other factors. the estimated credit loss amount is recognised in earnings, with the remainder of the loss amount recognised in other comprehensive income. in cases where there is an intention or requirement to sell, the accounting of the other-than-temporary impairment is the same as for equity securities afs described above.
interest on fixed income securities is recorded in net investment income when earned and is adjusted for the amortisation of any purchase premium or discount. Dividends on equity securities are recorded on the basis of the ex-dividend date. realised gains and losses on sales are included in earnings and are calculated using the specific identification method.
policy loans, mortgages and other loans are carried at amortised cost. interest income is recognised in accordance with the effective yield method.
investment in real estate that the Group intends to hold for the production of income is carried at depreciated cost, net of any write-downs for impairment in value. impairment in value is recognised if the sum of the estimated future undiscounted cash flows from the use of the real estate is lower than its carrying value. impairment in value, depreciation and other related charges or credits are included in net investment income. investment in real estate held for sale is carried at the lower of cost or fair value, less estimated selling costs, and is not depreciated. reductions in the carrying value of real estate held for sale are included in realised investment losses.
short-term investments are carried at amortised cost, which approximates fair value. the Group considers highly liquid investments with a remaining maturity at the date of acquisition of one year or less, but greater than three months, to be short-term investments.
other invested assets include affiliated companies, equity accounted companies, derivative financial instruments, collateral receivables, securities purchased under agreement to resell, and investments without readily determinable fair value (including limited partnership investments). investments in limited partnerships where the Group’s interest equals or exceeds 3% are accounted for using the equity method. investments in limited partnerships where the Group’s interest is below 3% and equity investments in corporate entities which are not publicly traded are accounted for at estimated fair value with changes in fair value recognised as unrealised gains/losses in shareholders’ equity.
Swiss Re 2013 financial report 139
FiNaNcial StatemeNtS | Notes to the Group fiNaNcial statemeNts

the Group enters into security lending arrangements under which it loans certain securities in exchange for collateral and receives securities lending fees. the Group’s policy is to require collateral, consisting of cash or securities, equal to at least 102% of the carrying value of the securities loaned. in certain arrangements, the Group may accept collateral of less than 102% if the structure of the overall transaction offers an equivalent level of security. cash received as collateral is recognised along with an obligation to return the cash. securities received as collateral that can be sold or repledged are also recognised along with an obligation to return those securities. security lending fees are recognised over the term of the related loans.
Derivative financial instruments and hedge accountingthe Group uses a variety of derivative financial instruments including swaps, options, forwards and exchange-traded financial futures for the Group’s trading and hedging strategy in line with the overall risk management strategy. Derivative financial instruments are primarily used as a means of managing exposure to price, foreign currency and/or interest rate risk on planned or anticipated investment purchases, existing assets or existing liabilities and also to lock in attractive investment conditions for funds which become available in the future. the Group recognises all of its derivative instruments on the balance sheet at fair value. Derivatives that are not designated as hedging instruments are adjusted to fair value through earnings.
if the derivative is designated as a hedge of the fair value of assets or liabilities, changes in the fair value of the derivative are recognised in earnings, together with changes in the fair value of the related hedged item. if the derivative is designated as a hedge of the variability in expected future cash flows related to a particular risk, changes in the fair value of the derivative are reported in other comprehensive income until the hedged item is recognised in earnings. the ineffective portion of the hedge is recognised in earnings. When hedge accounting is discontinued on a cash flow hedge, the net gain or loss remains in accumulated other comprehensive income and is reclassified to earnings in the period in which the formerly hedged transaction is reported in earnings. When the Group discontinues hedge accounting because it is no longer probable that a forecasted transaction will occur within the required time period, the derivative continues to be carried on the balance sheet at fair value, and gains and losses that were previously recorded in accumulated other comprehensive income are recognised in earnings.
the Group recognises separately derivatives that are embedded within other host instruments if the economic characteristics and risks are not clearly and closely related to the economic characteristics and risks of the host contract and if it meets the definition of a derivative if it were stand-alone.
Derivative financial instrument assets are generally included in other invested assets and derivative financial instrument liabilities are generally included in accrued expenses and other liabilities.
the Group also designates non-derivative monetary financial instruments as a hedge of the foreign currency exposure of its net investment in certain foreign operations. from the inception of the hedging relationship, remeasurement gains and losses on the designated non-derivative monetary financial instruments and translation gains and losses on the hedged net investment are reported as translation gains and losses in shareholders’ equity.
cash and cash equivalentscash and cash equivalents include cash on hand, short-term deposits, certain short-term investments in money market funds, and highly liquid debt instruments with a remaining maturity at the date of acquisition of three months or less.
Deferred acquisition costsacquisition costs, which vary with, and are primarily related to, the production of new insurance and reinsurance business, are deferred to the extent they are deemed recoverable from future gross profits. Deferred acquisition costs consist principally of commissions. Deferred acquisition costs for short-duration contracts are amortised in proportion to premiums earned. future investment income is considered in determining the recoverability of deferred acquisition costs for short-duration contracts. Deferred acquisition costs for long-duration contracts are amortised over the life of underlying contracts. Deferred acquisition costs for universal-life and similar products are amortised based on the present value of estimated gross profits. estimated gross profits are updated quarterly.
140 Swiss Re 2013 financial report
FiNaNcial StatemeNtS | Notes to the Group fiNaNcial statemeNts

modifications of insurance and reinsurance contractsthe Group accounts for modifications of insurance and reinsurance contracts that result in a substantially unchanged contract as a continuation of the replaced contract. the associated deferred acquisition costs and present value of future profits (pVfp) will continue to be amortised. for modifications of insurance and reinsurance contracts that result in a substantially changed contract, the Group accounts for as an extinguishment of the replaced contract. the associated deferred acquisition costs or pVfp are written off immediately through income and any new deferrable costs associated with the replacement contract are deferred.
Business combinationsthe Group applies the purchase method of accounting for business combinations. this method allocates the cost of the acquired entity to the assets and liabilities assumed based on their estimated fair values at the date of acquisition.
admin re® blocks of business can be acquired in different legal forms, either through an acquisition of an entity’s share capital or through a reinsurance transaction. the Group’s policy is to treat these transactions consistently regardless of the form of acquisition. accordingly, the Group records the acquired assets and liabilities directly to the balance sheet. premiums, life and health benefits and other income statement items are not recorded in the income statement on the date of the acquisition.
the underlying liabilities and assets acquired are subsequently accounted for according to the relevant Gaap guidance, including specific guidance applicable to subsequent accounting for assets and liabilities recognised as part of the purchase method of accounting, including present value of future profit, goodwill and other intangible assets.
acquired present value of future profitsthe acquired present value of future profits (pVfp) of business in force is recorded in connection with the acquisition of life and/or health business. the initial value is determined actuarially by discounting estimated future gross profits as a measure of the value of business acquired. the resulting asset is amortised on a constant yield basis over the expected revenue recognition period of the business acquired, generally over periods ranging up to 30 years, with the accrual of interest added to the unamortised balance at the earned rate. the earned rate encompasses both, the current earned rate or the original earned rate depending on the business written. the rate is consistently applied for the entire life of the applicable business. for universal-life and similar products, pVfp is amortised in line with estimated gross profits, and estimated gross profits are updated quarterly. the carrying value of pVfp is reviewed periodically for indicators of impairment in value. adjustments to reflect impairment in value are recognised in earnings during the period in which the determination of impairment is made or to other comprehensive income for shadow loss recognition.
Goodwillthe excess of the purchase price of acquired businesses over the estimated fair value of net assets acquired is recorded as goodwill, which is reviewed periodically for indicators of impairment in value. adjustments to reflect impairment in value are recognised in earnings in the period in which the determination of impairment is made.
Other assetsother assets include deferred expenses on retroactive reinsurance, prepaid reinsurance premiums, receivables related to investing activities, real estate for own use, property, plant and equipment, accrued income, certain intangible assets and prepaid assets.
the excess of estimated liabilities for claims and claim adjustment expenses payable over consideration received in respect of retroactive property and casualty reinsurance contracts is recorded as a deferred expense. the deferred expense on retroactive reinsurance contracts is amortised through earnings over the expected claims-paying period.
real estate for own use, property, plant and equipment are carried at depreciated cost.
Swiss Re 2013 financial report 141
FiNaNcial StatemeNtS | Notes to the Group fiNaNcial statemeNts

capitalised software costsexternal direct costs of materials and services incurred to develop or obtain software for internal use, payroll and payroll-related costs for employees directly associated with software development and interest cost incurred while developing software for internal use are capitalised and amortised on a straight-line basis through earnings over the estimated useful life.
Deferred income taxesDeferred income tax assets and liabilities are recognised based on the difference between financial statement carrying amounts and the corresponding income tax bases of assets and liabilities using enacted income tax rates and laws. a valuation allowance is recorded against deferred tax assets when it is deemed more likely than not that some or all of the deferred tax asset may not be realised.
Unpaid claims and claim adjustment expensesliabilities for unpaid claims and claim adjustment expenses for property and casualty and life and health insurance and reinsurance contracts are accrued when insured events occur and are based on the estimated ultimate cost of settling the claims, using reports and individual case estimates received from ceding companies. a provision is also included for claims incurred but not reported, which is developed on the basis of past experience adjusted for current trends and other factors that modify past experience. the establishment of the appropriate level of reserves is an inherently uncertain process involving estimates and judgments made by management, and therefore there can be no assurance that ultimate claims and claim adjustment expenses will not exceed the loss reserves currently established. these estimates are regularly reviewed, and adjustments for differences between estimates and actual payments for claims and for changes in estimates are reflected in income in the period in which the estimates are changed or payments are made.
the Group does not discount liabilities arising from prospective property and casualty insurance and reinsurance contracts, including liabilities which are discounted for us statutory reporting purposes. liabilities arising from property and casualty insurance and reinsurance contracts acquired in a business combination are initially recognised at fair value in accordance with the purchase method of accounting. the Group does not discount life and health claim reserves except for disability income claims in payment which are recognised at the estimated present value of the remaining ultimate net costs of the incurred claims.
experience features which are directly linked to a reinsurance asset or liability are classified in a manner that is consistent with the presentation of that asset or liability.
liabilities for life and health policy benefitsliabilities for life and health policy benefits from reinsurance business are generally calculated using the net level premium method, based on assumptions as to investment yields, mortality, withdrawals, lapses and policyholder dividends. assumptions are set at the time the contract is issued or, in the case of contracts acquired by purchase, at the purchase date. the assumptions are based on projections from past experience, making allowance for possible adverse deviation. interest assumptions for life and health (re)insurance benefits liabilities range from 0.2% to 12.6%. assumed mortality rates are generally based on experience multiples applied to the actuarial select and ultimate tables based on industry experience.
liabilities for life and health policy benefits are increased with a charge to earnings if it is determined that future cash flows, including investment income, are insufficient to cover future benefits and expenses. Where assets backing liabilities for policy benefits are held as afs these liabilities for policyholder benefits are increased by a shadow adjustment, with a charge to other comprehensive income, where future cash flows at market rates are insufficient to cover future benefits and expenses.
Policyholder account balancespolicyholder account balances relate to universal life-type contracts and investment contracts. interest crediting rates for policyholder account balances range from 1.3% to 8.9%.
universal life-type contracts are long-duration insurance contracts, providing either death or annuity benefits, with terms that are not fixed and guaranteed.
investment contracts are long-duration contracts that do not incorporate significant insurance risk, ie there is no mortality and morbidity risk, or the mortality and morbidity risk associated with the insurance benefit features offered in the contract is of insignificant amount or remote probability. amounts received as payment for investment contracts are reported as policyholder account balances. related assets are included in general account assets except for investments for unit-linked and with-profit business, which are presented in a separate line item on the face of the balance sheet.
142 Swiss Re 2013 financial report
FiNaNcial StatemeNtS | Notes to the Group fiNaNcial statemeNts

amounts assessed against policyholders for mortality, administration and surrender are shown as fee income. amounts credited to policyholders are shown as interest credited to policyholders. investment income and realised investment gains and losses allocable to policyholders are included in net investment income and net realised investment gains/losses except for unit-linked and with-profit business which is presented in a separate line item on the face of the income statement.
unit-linked and with-profit business are presented together as they are similar in nature. for unit-linked contracts, the investment risk is borne by the policyholder. for with-profit contracts, the majority of the investment risk is also borne by the policyholder, although there are certain guarantees that limit the down-side risk for the policyholder, and a certain proportion of the returns may be retained by swiss re Group (typically 10%). additional disclosures are provided in Note 2.
Funds held assets and liabilitieson the asset side, funds held by ceding companies’ consist mainly of amounts retained by the ceding company for business written on a funds withheld basis. in addition, amounts arising from the application of the deposit method of accounting to ceded retrocession or reinsurance contracts are included.
on the liability side, funds held under reinsurance treaties’ consist mainly of amounts arising from the application of the deposit method of accounting to inward insurance and reinsurance contracts. in addition, amounts retained from ceded business written on a funds withheld basis are included.
funds withheld assets are assets that would normally be paid to the Group but are withheld by the cedent to reduce a potential credit risk or to retain control over investments. in case of funds withheld liabilities, it is the Group that withholds assets related to ceded business in order to reduce its credit risk or retain control over the investments.
the deposit method of accounting is applied to insurance and reinsurance contracts that do not indemnify the ceding company or the Group against loss or liability relating to insurance risk. under the deposit method of accounting, the deposit asset or liability is initially measured based on the consideration paid or received. for contracts that transfer neither significant timing nor underwriting risk, and contracts that transfer only significant timing risk, changes in estimates of the timing or amounts of cash flows are accounted for by recalculating the effective yield. the deposit is then adjusted to the amount that would have existed had the new effective yield been applied since the inception of the contract. the revenue and expense recorded for such contracts is included in net investment income. for contracts that transfer only significant underwriting risk, once a loss is incurred, the deposit is adjusted by the present value of the incurred loss. at each subsequent balance sheet date, the portion of the deposit attributable to the incurred loss is recalculated by discounting the estimated future cash flows. the resulting changes in the carrying amount of the deposit are recognised in claims and claim adjustment expenses.
funds withheld balances are presented together with assets and liabilities arising from the application of the deposit method because of their common deposit type character.
Shadow adjustmentsshadow adjustments are recognized in other comprehensive income reflecting the offset of adjustments to deferred acquisition costs and pVfp, typically related to universal life-type contracts, and policyholder liabilities. the purpose is to reflect the fact that certain amounts recorded as unrealised investment gains and losses within shareholders’ equity will ultimately accrue to policyholders and not shareholders.
shadow loss recognition testing becomes relevant in low interest rate environments. the test considers whether the hypothetical sale of afs securities and the reinvestment of proceeds at lower yields would lead to negative operational earnings in future periods and thereby causing a loss recognition event. for shadow loss recognition testing, the Group uses current market yields to determine best estimate Gaap reserves rather than using locked in or current book yields. if the unlocked best estimate Gaap reserves based on current market rates are in excess of reserves based on locked in or current book yields, then a shadow loss recognition reserve is recognized. shadow loss recognition is recognized in other comprehensive income and does not impact net income. in addition, shadow losses recognized can reverse up to the amount of losses recognized due to a loss recognition event.
Swiss Re 2013 financial report 143
FiNaNcial StatemeNtS | Notes to the Group fiNaNcial statemeNts

Premiumsproperty and casualty reinsurance premiums are recorded when written and include an estimate for written premiums receivable at period end. premiums earned are generally recognised in income over the contract period in proportion to the amount of reinsurance provided. unearned premiums consist of the unexpired portion of reinsurance provided. life reinsurance premiums are earned when due. related policy benefits are recorded in relation to the associated premium or gross profits so that profits are recognised over the expected lives of the contracts.
life and health reinsurance premiums for group coverages are generally earned over the term of the coverage. for group contracts that allow experience adjustments to premiums, such premiums are recognised as the related experience emerges.
reinstatement premiums are due where coverage limits for the remaining life of the contract are reinstated under pre-defined contract terms. the recognition of reinstatement premiums as written depends on individual contract features. reinstatement premiums are either recognised as written at the time a loss event occurs or in line with the recognition pattern of premiums written of the underlying contract. the accrual of reinstatement premiums is based on actuarial estimates of ultimate losses. reinstatement premiums are generally earned in proportion to the amount of reinsurance provided.
Reinsurance cededthe Group uses retrocession arrangements to increase its aggregate underwriting capacity, to diversify its risk and to reduce the risk of catastrophic loss on reinsurance assumed. the ceding of risks to retrocessionaires does not relieve the Group of its obligations to its ceding companies. the Group regularly evaluates the financial condition of its retrocessionaires and monitors the concentration of credit risk to minimise its exposure to financial loss from retrocessionaires’ insolvency. premiums and losses ceded under retrocession contracts are reported as reductions of premiums earned and claims and claim adjustment expenses. amounts recoverable for ceded short- and long-duration contracts, including universal life-type and investment contracts, are reported as assets in the accompanying consolidated balance sheet.
the Group provides reserves for uncollectible amounts on reinsurance balances ceded, based on management’s assessment of the collectability of the outstanding balances.
Receivablespremium and claims receivables which have been invoiced are accounted for at face value. together with assets arising from the application of the deposit method of accounting that meet the definition of financing receivables they are regularly assessed for impairment. evidence of impairment is the age of the receivable and/or any financial difficulties of the counterparty. allowances are set up on the net balance, meaning all balances related to the same counterparty are considered. the amount of the allowance is set up in relation to the time a receivable has been due and financial difficulties of the debtor, and can be as high as the outstanding net balance.
Pensions and other post-retirement benefitsthe Group accounts for its pension and other post-retirement benefit costs using the accrual method of accounting. amounts charged to expense are based on periodic actuarial determinations.
Share-based payment transactionsthe Group has a long-term incentive plan, a leadership performance plan, a fixed option plan, a restricted share plan, an employee participation plan and a global share participation plan. these plans are described in more detail in Note 13. the Group accounts for share-based payment transactions with employees using the fair value method. under the fair value method, the fair value of the awards is recognised in earnings over the vesting period.
for share-based compensation plans which are settled in cash, compensation costs are recognised as liabilities, whereas for equity-settled plans, compensation costs are recognised as an accrual to additional paid-in capital within shareholders’ equity.
144 Swiss Re 2013 financial report
FiNaNcial StatemeNtS | Notes to the Group fiNaNcial statemeNts

treasury sharestreasury shares are reported at cost in shareholders’ equity. treasury shares also include stand-alone derivative instruments indexed to the Group’s shares that meet the requirements for classification in shareholders’ equity.
earnings per common shareBasic earnings per common share are determined by dividing net income available to shareholders by the weighted average number of common shares entitled to dividends during the year. Diluted earnings per common share reflect the effect on earnings and average common shares outstanding associated with dilutive securities.
Subsequent eventssubsequent events for the current reporting period have been evaluated up to 17 march 2014. this is the date on which the financial statements are available to be issued.
Recent accounting guidancein December 2011, the fasB issued “Disclosures about offsetting assets and liabilities” (asu 2011-11), an update to topic 210 – Balance sheet. in January 2013, a scope clarification of asu 2011-11 was issued, “clarifying the scope of Disclosures about offsetting assets and liabilities” (asu 2013-01). asu 2011-11 requires additional disclosures on derivatives, repurchase and reverse repurchase agreements, and securities borrowing and lending transactions that are netted in accordance with current us Gaap guidance. the Group adopted this guidance as of 1 January 2013. the additional disclosure requirements are reflected in Note 2.
in July 2012, the fasB issued “testing indefinite-lived intangible assets for impairment” (asu 2012-02), an update to topic 350 – intangibles - Goodwill and other. the update allows an entity to first assess qualitative factors to determine whether it is necessary to perform a quantitative impairment test for indefinite-lived intangible assets. the Group adopted this guidance as of 1 January 2013. the adoption did not have an impact on the Group’s financial statements.
in october 2012, the fasB issued “subsequent accounting for an indemnification asset recognized at the acquisition Date as a result of a Government-assisted acquisition of a financial institution” (asu 2012-06), an update to topic 805 – Business combinations. this asu gives guidance on the subsequent accounting of an indemnification asset in a government-assisted acquisition. the Group adopted this guidance as of 1 January 2013. the adoption did not have an impact on the Group’s financial statements.
in february 2013, the fasB issued “reporting of amounts reclassified out of accumulated other comprehensive income” (asu 2013-02), an update to topic 220 – comprehensive income. this update supersedes and replaces the presentation requirements for reclassifications out of accumulated other comprehensive income in asu 2011-05 and asu 2011-12. the new guidance requires an entity to provide additional information about reclassifications out of accumulated other comprehensive income. the Group adopted this guidance as of 1 January 2013. the additional disclosures are presented below the statement of comprehensive income.
on 17 July 2013, the fasB issued “inclusion of the fed funds effective swap rate (or overnight index swap rate) as a Benchmark interest rate for hedge accounting purposes” (asu 2013-10), an update to topic 815 – Derivatives and hedging. this asu allows explicitly the use of the fed funds effective swap rate as a benchmark interest rate for hedge accounting purposes. the Group adopted this guidance as of 17 July 2013. the adoption did not have an impact on the Group’s financial statements.
Swiss Re 2013 financial report 145
FiNaNcial StatemeNtS | Notes to the Group fiNaNcial statemeNts

2 investments
investment incomeNet investment income by source (excluding unit-linked and with-profit business) was as follows:
Dividends received from investments accounted for using the equity method were usD 128 million and usD 198 million for 2012 and 2013, respectively.
Realised gains and lossesrealised gains and losses for fixed income, equity securities and other investments (excluding unit-linked and with-profit business) were as follows:
usD millions 2012 2013
fixed income securities 3 063 2 626equity securities 91 143policy loans, mortgages and other loans 313 119investment real estate 134 139short-term investments 102 109other current investments 78 93share in earnings of equity-accounted investees 508 350cash and cash equivalents 79 48Net result from deposit-accounted contracts 166 154Deposits with ceding companies 430 595Gross investment income 4 964 4 376investment expenses –464 –406interest charged for funds held –27 –23Net investment income – non-participating 4 473 3 947
usD millions 2012 2013
fixed income securities available-for-sale:Gross realised gains 2 336 1 215Gross realised losses –383 –689
equity securities available-for-sale:Gross realised gains 181 349Gross realised losses –77 –46
other-than-temporary impairments –162 –41Net realised investment gains/losses on trading securities 58 –4change in net unrealised investment gains/losses on trading securities 67 –38other investments:
Net realised/unrealised gains/losses –230 301Net realised/unrealised gains/losses on insurance-related derivatives –189 –306Gain/loss related to sale of admin re® us operations –399foreign exchange gains/losses –255 25Net realised investment gains/losses – non-participating 947 766
146 Swiss Re 2013 financial report
FiNaNcial StatemeNtS | Notes to the Group fiNaNcial statemeNts

proceeds from sales of fixed income securities available-for-sale amounted to usD 101 046 million and usD 79 815 million for 2012 and 2013, respectively. sales of equity securities available-for-sale were usD 1 494 million and usD 2 604 million for 2012 and 2013, respectively.
investment result – unit-linked and with-profit businessunit-linked and with-profit business are presented together as they are similar in nature. for unit-linked contracts, the investment risk is borne by the policyholder. for with-profit contracts, the majority of the investment risk is also borne by the policyholder, although there are certain guarantees that limit the down-side risk for the policyholder, and a certain proportion of the returns may be retained by swiss re (typically 10%).
Net investment result on unit-linked and with-profit business credited to policyholders was as follows:
impairment on fixed income securities related to credit lossesother-than-temporary impairments for debt securities are bifurcated between credit and non-credit components, with the credit component recognised through earnings and the non-credit component recognised in other comprehensive income. the credit component of other-than-temporary impairments is defined as the difference between a security’s amortised cost basis and expected cash flows. methodologies for measuring the credit component of impairment are aligned to market observer forecasts of credit performance drivers. management believes that these forecasts are representative of median market expectations.
for securitised products, cash flow projection analysis is conducted by integrating forward-looking evaluation of collateral performance drivers, including default rates, prepayment rates and loss severities, and deal-level features, such as credit enhancement and prioritisation among tranches for payments of principal and interest. analytics are differentiated by asset class, product type and security-level differences in historical and expected performance. for corporate bonds and hybrid debt instruments, an expected loss approach based on default probabilities and loss severities expected in the current and forecast economic environment is used for securities identified as credit-impaired to project probability-weighted cash flows. expected cash flows resulting from these analyses are discounted, and net present value is compared to the amortised cost basis to determine the credit component of other-than-temporary impairments.
a reconciliation of other-than-temporary impairment related to credit losses recognised in earnings was as follows:
2012 2013usD millions unit-linked With-profit unit-linked With-profit
investment income – fixed income securities 128 97 117 97investment income – equity securities 531 32 511 26investment income – other 18 24 25 13total investment income – unit-linked and with-profit business 677 153 653 136realised gains/losses – fixed income securities 65 88 –133 –105realised gains/losses – equity securities 1 679 89 2 711 136realised gains/losses – other –149 –32 1 –52total realised gains/losses – unit-linked and with-profit business 1 595 145 2 579 –21total net investment result – unit-linked and with-profit business 2 272 298 3 232 115
usD millions 2012 2013
Balance as of 1 January1 515 310credit losses for which an other-than-temporary impairment was not previously recognised 14 1reductions for securities sold during the period –237 –57increase of credit losses for which an other-than-temporary impairment has been recognised previously, when the Group does not intend to sell, or more likely than not will not be required to sell before recovery 54 11impact of increase in cash flows expected to be collected –61 –37impact of foreign exchange movements 6
Balance as of 31 December 291 228
1 During 2013 the Group revised the other-than-temporary impairment on fixed income securities related to credit losses. the revision had no impact on net income and shareholders’ equity of the Group.
Swiss Re 2013 financial report 147
FiNaNcial StatemeNtS | Notes to the Group fiNaNcial statemeNts

investments available-for-saleamortised cost or cost, estimated fair values and other-than-temporary impairments of fixed income securities classified as available-for-sale as of 31 December were as follows:
the “other-than-temporary impairments recognised in other comprehensive income” column includes only securities with a credit-related loss recognised in earnings. subsequent recovery in fair value of securities previously impaired in other comprehensive income is presented in the “other-than-temporary impairments recognised in other comprehensive income” column.
2012 usD millions
amortised cost or cost
Gross unrealised
gains
Gross unrealised
losses
other-than-temporary impairments
recognised in other comprehensive income
estimated fair value
Debt securities issued by governments and government agencies:
us treasury and other us government corporations and agencies 13 375 746 –26 14 095us agency securitised products 4 063 114 –7 4 170states of the united states and political subdivisions of the states 85 19 104united Kingdom 14 820 1 268 –48 16 040canada 3 556 760 –2 4 314Germany 5 963 273 –7 6 229france 3 201 255 –6 3 450other 7 627 514 –37 8 104
total 52 690 3 949 –133 56 506corporate debt securities 21 347 2 369 –46 –18 23 652residential mortgage-backed securities 911 46 –23 –14 920commercial mortgage-backed securities 2 894 245 –33 –2 3 104other asset-backed securities 2 752 56 –9 –7 2 792Fixed income securities available-for-sale 80 594 6 665 –244 –41 86 974equity securities available-for-sale 2 789 373 –60 3 102
2013 usD millions
amortised cost or cost
Gross unrealised
gains
Gross unrealised
losses
other-than-temporary impairments
recognised in other comprehensive income
estimated fair value
Debt securities issued by governments and government agencies:
us treasury and other us government corporations and agencies 6 027 143 –113 6 057us agency securitised products 3 970 36 –75 3 931states of the united states and political subdivisions of the states 953 10 –48 915united Kingdom 11 255 344 –351 11 248canada 3 063 315 –67 3 311Germany 4 386 96 –37 4 445france 2 727 113 –12 2 828other 7 185 181 –274 7 092
total 39 566 1 238 –977 39 827corporate debt securities 30 464 1 477 –528 –4 31 409residential mortgage-backed securities 796 54 –12 –3 835commercial mortgage-backed securities 2 712 182 –40 2 854other asset-backed securities 2 811 48 –22 –1 2 836Fixed income securities available-for-sale 76 349 2 999 –1 579 –8 77 761equity securities available-for-sale 6 110 1 047 –81 7 076
148 Swiss Re 2013 financial report
FiNaNcial StatemeNtS | Notes to the Group fiNaNcial statemeNts
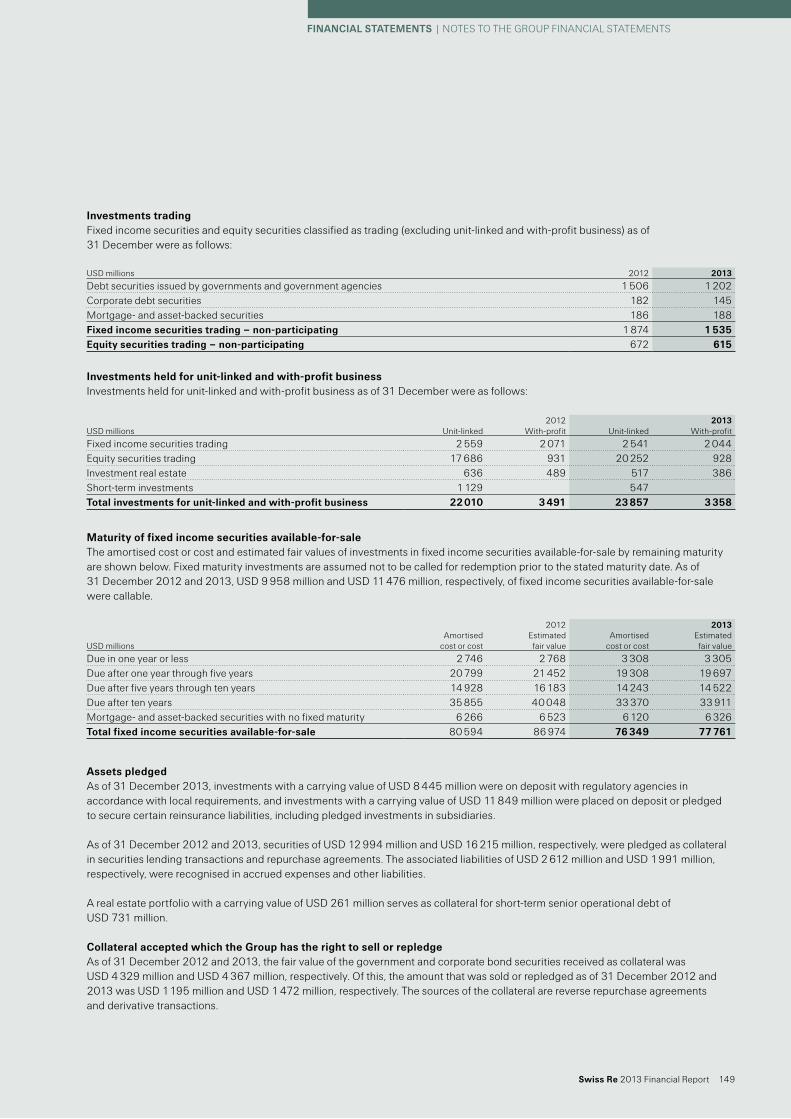
investments tradingfixed income securities and equity securities classified as trading (excluding unit-linked and with-profit business) as of 31 December were as follows:
investments held for unit-linked and with-profit businessinvestments held for unit-linked and with-profit business as of 31 December were as follows:
maturity of fixed income securities available-for-salethe amortised cost or cost and estimated fair values of investments in fixed income securities available-for-sale by remaining maturity are shown below. fixed maturity investments are assumed not to be called for redemption prior to the stated maturity date. as of 31 December 2012 and 2013, usD 9 958 million and usD 11 476 million, respectively, of fixed income securities available-for-sale were callable.
assets pledgedas of 31 December 2013, investments with a carrying value of usD 8 445 million were on deposit with regulatory agencies in accordance with local requirements, and investments with a carrying value of usD 11 849 million were placed on deposit or pledged to secure certain reinsurance liabilities, including pledged investments in subsidiaries.
as of 31 December 2012 and 2013, securities of usD 12 994 million and usD 16 215 million, respectively, were pledged as collateral in securities lending transactions and repurchase agreements. the associated liabilities of usD 2 612 million and usD 1 991 million, respectively, were recognised in accrued expenses and other liabilities.
a real estate portfolio with a carrying value of usD 261 million serves as collateral for short-term senior operational debt of usD 731 million.
collateral accepted which the Group has the right to sell or repledgeas of 31 December 2012 and 2013, the fair value of the government and corporate bond securities received as collateral was usD 4 329 million and usD 4 367 million, respectively. of this, the amount that was sold or repledged as of 31 December 2012 and 2013 was usD 1 195 million and usD 1 472 million, respectively. the sources of the collateral are reverse repurchase agreements and derivative transactions.
usD millions 2012 2013
Debt securities issued by governments and government agencies 1 506 1 202corporate debt securities 182 145mortgage- and asset-backed securities 186 188Fixed income securities trading – non-participating 1 874 1 535equity securities trading – non-participating 672 615
2012 2013usD millions unit-linked With-profit unit-linked With-profit
fixed income securities trading 2 559 2 071 2 541 2 044equity securities trading 17 686 931 20 252 928investment real estate 636 489 517 386short-term investments 1 129 547total investments for unit-linked and with-profit business 22 010 3 491 23 857 3 358
2012 2013 usD millions
amortised cost or cost
estimated fair value
amortised cost or cost
estimated fair value
Due in one year or less 2 746 2 768 3 308 3 305Due after one year through five years 20 799 21 452 19 308 19 697Due after five years through ten years 14 928 16 183 14 243 14 522Due after ten years 35 855 40 048 33 370 33 911mortgage- and asset-backed securities with no fixed maturity 6 266 6 523 6 120 6 326total fixed income securities available-for-sale 80 594 86 974 76 349 77 761
Swiss Re 2013 financial report 149
FiNaNcial StatemeNtS | Notes to the Group fiNaNcial statemeNts

Offsetting of derivatives, financial assets and financial liabilitiesoffsetting of derivatives, financial assets and financial liabilities as of 31 December was as follows:
collateral pledged or received between two counterparties with a master netting arrangement in place, but not subject to balance sheet netting is disclosed at fair value. the fair values represent the gross carrying value amounts at the reporting date for each financial instrument received or pledged by the Group. management believes that master netting agreements provide for legally enforceable setoff in the event of default, which substantially reduces credit exposure. upon occurrence of an event of default the non-defaulting party may set off the obligation against collateral received regardless if offset on balance sheet prior to the defaulting event. the net amounts of the financial assets and liabilities presented on the balance sheet were recognised in “other invested assets”, and “accrued expenses and other liabilities”, respectively.
2013 usD millions
Gross amounts of recognised financial
assetscollateral set off
in the balance sheet
Net amounts of financial assets presented in the
balance sheet
related financial instruments not set off
in the balance sheet Net amount
Derivative financial instruments – assets 4 099 –2 877 1 222 –380 842reverse repurchase agreements 4 064 –1 811 2 253 –2 253 0securities borrowing 0 0total 8 163 –4 688 3 475 –2 633 842
2013 usD millions
Gross amounts of recognised financial
liabilitiescollateral set off
in the balance sheet
Net amounts of financial liabilities presented in the
balance sheet
related financial instruments not set off
in the balance sheet Net amount
Derivative financial instruments – liabilities –4 104 2 656 –1 448 157 –1 291repurchase agreements –2 009 1 811 –198 198 0securities lending –1 792 –1 792 1 655 –137total –7 905 4 467 –3 438 2 010 –1 428
2012 usD millions
Gross amounts of recognised financial
assetscollateral set off
in the balance sheet
Net amounts of financial assets presented in the
balance sheet
related financial instruments not set off
in the balance sheet Net amount
Derivative financial instruments – assets 7 929 –5 645 2 284 –411 1 873reverse repurchase agreements 5 900 –3 437 2 463 –2 462 1securities borrowing 0 0total 13 829 –9 082 4 747 –2 873 1 874
2012 usD millions
Gross amounts of recognised financial
liabilitiescollateral set off
in the balance sheet
Net amounts of financial liabilities presented in the
balance sheet
related financial instruments not set off
in the balance sheet Net amount
Derivative financial instruments – liabilities –8 713 4 990 –3 723 93 –3 630repurchase agreements –3 899 3 437 –462 462 0securities lending –2 135 –2 135 2 062 –73total –14 747 8 427 –6 320 2 617 –3 703
150 Swiss Re 2013 financial report
FiNaNcial StatemeNtS | Notes to the Group fiNaNcial statemeNts

Unrealised losses on securities available-for-salethe following table shows the fair value and unrealised losses of the Group’s fixed income securities, aggregated by investment category and length of time that individual securities were in a continuous unrealised loss position as of 31 December 2012 and 2013. as of 31 December 2012 and 2013, usD 32 million and usD 77 million, respectively, of the gross unrealised loss on equity securities available-for-sale relates to declines in value for less than 12 months and usD 28 million and usD 4 million, respectively, to declines in value for more than 12 months.
less than 12 months 12 months or more total2012 usD millions fair value
unrealised losses fair value
unrealised losses fair value
unrealised losses
Debt securities issued by governments and government agencies:
us treasury and other us government corporations and agencies 2 766 26 2 766 26us agency securitised products 734 7 734 7states of the united states and political subdivisions of the states 4 4 0united Kingdom 3 316 48 3 316 48canada 291 2 2 293 2Germany 524 6 32 1 556 7france 147 6 5 152 6other 1 846 33 37 4 1 883 37
total 9 628 128 76 5 9 704 133corporate debt securities 1 845 32 318 32 2 163 64residential mortgage-backed securities 56 2 424 35 480 37commercial mortgage-backed securities 190 14 347 21 537 35other asset-backed securities 547 9 98 7 645 16total 12 266 185 1 263 100 13 529 285
less than 12 months 12 months or more total2013 usD millions fair value
unrealised losses fair value
unrealised losses fair value
unrealised losses
Debt securities issued by governments and government agencies:
us treasury and other us government corporations and agencies 2 874 113 2 874 113us agency securitised products 2 248 71 41 4 2 289 75states of the united states and political subdivisions of the states 703 48 703 48united Kingdom 6 973 351 6 973 351canada 938 65 11 2 949 67Germany 1 697 33 199 4 1 896 37france 506 10 47 2 553 12other 3 392 198 646 76 4 038 274
total 19 331 889 944 88 20 275 977corporate debt securities 12 189 494 319 38 12 508 532residential mortgage-backed securities 50 1 252 14 302 15commercial mortgage-backed securities 601 31 174 9 775 40other asset-backed securities 1 183 15 139 8 1 322 23total 33 354 1 430 1 828 157 35 182 1 587
Swiss Re 2013 financial report 151
FiNaNcial StatemeNtS | Notes to the Group fiNaNcial statemeNts

mortgages, loans and real estateas of 31 December, the carrying values of investments in mortgages, policy and other loans, and real estate (excluding unit-linked and with-profit business) were as follows:
the fair value of the real estate as of 31 December 2012 and 2013 was usD 2 536 million and usD 2 551 million, respectively. the carrying value of policy loans, mortgages and other loans approximates fair value.
as of 31 December 2012 and 2013, investments in real estate included usD 5 million and usD 5 million, respectively, of real estate held for sale.
Depreciation expense related to income-producing properties was usD 24 million and usD 25 million for 2012 and 2013, respectively. accumulated depreciation on investment real estate totalled usD 549 million and usD 577 million as of 31 December 2012 and 2013, respectively.
substantially all mortgages, policy loans and other loan receivables are secured by buildings, land or the underlying policies.
usD millions 2012 2013
policy loans 284 270mortgage loans 1 362 1 801other loans 653 824investment real estate 777 825
152 Swiss Re 2013 financial report
FiNaNcial StatemeNtS | Notes to the Group fiNaNcial statemeNts

3 fair value disclosures
fair value, as defined by the fair Value measurements and Disclosures topic, is the price that would be received to sell an asset or paid to transfer a liability in an orderly transaction between market participants at the measurement date.
the fair Value measurements and Disclosures topic requires all assets and liabilities that are measured at fair value to be categorised within the fair value hierarchy. this three-level hierarchy is based on the observability of the inputs used in the fair value measurement. the levels of the fair value hierarchy are defined as follows:
level 1 inputs are quoted prices in active markets for identical assets or liabilities that the Group has the ability to access. level 1 inputs are the most persuasive evidence of fair value and are to be used whenever possible.
level 2 inputs are market-based inputs that are directly or indirectly observable, but not considered level 1 quoted prices. level 2 inputs consist of (i) quoted prices for similar assets or liabilities in active markets; (ii) quoted prices for identical assets or liabilities in non-active markets (eg markets which have few transactions and where prices are not current or price quotations vary substantially); (iii) inputs other than quoted prices that are observable (eg interest rates, yield curves, volatilities, prepayment speeds, credit risks and default rates); and (iv) inputs derived from, or corroborated by, observable market data.
level 3 inputs are unobservable inputs. these inputs reflect the Group’s own assumptions about market pricing using the best internal and external information available.
the types of instruments valued, based on unadjusted quoted market prices in active markets, include most us government and sovereign obligations, active listed equities and most money market securities. such instruments are generally classified within level 1 of the fair value hierarchy.
the types of instruments that trade in markets that are not considered to be active, but are valued based on quoted market prices, broker or dealer quotations, or alternative pricing sources with reasonable levels of price transparency, include most government agency securities, investment-grade corporate bonds, certain mortgage- and asset-backed products, less liquid listed equities, and state, municipal and provincial obligations. such instruments are generally classified within level 2 of the fair value hierarchy.
exchange-traded derivative instruments typically fall within level 1 or level 2 of the fair value hierarchy depending on whether they are considered to be actively traded or not.
certain financial instruments are classified within level 3 of the fair value hierarchy, because they trade infrequently and therefore have little or no price transparency. such instruments include private equity, less liquid corporate debt securities and certain asset-backed securities. certain over-the-counter derivatives trade in less liquid markets with limited pricing information, and the determination of fair value for these derivatives is inherently more difficult. such instruments are classified within level 3 of the fair value hierarchy. pursuant to the election of the fair value option, the Group classifies certain liabilities for life and health policy benefits in level 3 of the fair value hierarchy. When appropriate, valuations are adjusted for various factors such as liquidity, bid/offer spreads, and credit considerations. such adjustments are generally based on available market evidence. in the absence of such evidence, management’s best estimate is used.
the fair values of assets are adjusted to incorporate the counterparty risk of non-performance. similarly, the fair values of liabilities reflect the risk of non-performance of the Group, captured by the Group’s credit spread. these valuation adjustments from assets and liabilities measured at fair value using significant unobservable inputs are recognised in net realised gains and losses. for the year ended 31 December 2013, these adjustments were not material. Whenever the underlying assets or liabilities are reported in a specific business segment, the valuation adjustment is allocated accordingly. Valuation adjustments not attributable to any business segment are reported in Group items.
in certain situations, the Group uses inputs to measure the fair value of asset or liability positions that fall into different levels of the fair value hierarchy. in these situations, the Group will determine the appropriate level based on the lowest level input that is significant to the determination of the fair value.
Swiss Re 2013 financial report 153
FiNaNcial StatemeNtS | Notes to the Group fiNaNcial statemeNts

Valuation techniquesus government securities typically have quoted market prices in active markets and are categorised as level 1 instruments in the fair value hierarchy. Non-us government holdings are generally classified as level 2 instruments and are valued on the basis of the quotes provided by pricing services, which are subject to the Group’s pricing validation reviews and pricing vendor challenge process. Valuations provided by pricing vendors are generally based on the actual trade information as substantially all of the Group’s non-us government holdings are traded in a transparent and liquid market.
corporate debt securities mainly include us and european investment-grade positions, which are priced on the basis of quotes provided by third-party pricing vendors and first utilise valuation inputs from actively traded securities, such as bid prices, bid spreads to treasury securities, treasury curves, and same or comparable issuer curves and spreads. issuer spreads are determined from actual quotes and traded prices and incorporate considerations of credit/default, sector composition, and liquidity and call features. Where market data is not available, valuations are developed based on the modelling techniques that utilise observable inputs and option-adjusted spreads and incorporate considerations of the security’s seniority, maturity and the issuer’s corporate structure.
Values of residential mortgage-backed securities (rmBs), commercial mortgage-backed securities (cmBs) and other asset-backed securities (other aBs) are obtained both from third-party pricing vendors and through quoted prices, some of which may be based on the prices of comparable securities with similar structural and collateral features. Values of certain aBs for which there are no significant observable inputs are developed using benchmarks to similar transactions or indices. for both rmBs and cmBs, cash flows are derived based on the transaction-specific information, which incorporates priority in the capital structure, and are generally adjusted to reflect benchmark yields, market prepayment data, collateral performance (default rates and loss severity) for specific vintage and geography, credit enhancements, and ratings. for certain rmBs and cmBs with low levels of market liquidity, judgments may be required to determine comparable securities based on the loan type and deal-specific performance. cmBs terms may also incorporate lock-out periods that restrict borrowers from prepaying the loans or provide disincentives to prepay and therefore reduce prepayment risk of these securities, compared to rmBs. the factors specifically considered in valuation of cmBs include borrower-specific statistics in a specific region, such as debt service coverage and loan-to-value ratios, as well as the type of commercial property.
the category “other aBs” primarily includes debt securitised by credit card, student loan and auto loan receivables. pricing inputs for these securities also focus on capturing, where relevant, collateral quality and performance, payment patterns, and delinquencies.
the Group uses third-party pricing vendor data to value agency securitised products, which mainly include collateralised mortgage obligations (cmo) and mortgage-backed government agency securities. the valuations generally utilise observable inputs consistent with those noted above for rmBs and cmBs.
equity securities held by the Group for proprietary investment purposes are mainly classified in levels 1 and 2. securities classified in level 1 are traded on public stock exchanges for which quoted prices are readily available. level 2 equities include equity investments fair valued pursuant to the fair value option election and certain hedge fund positions; all valued based on primarily observable inputs.
the category “other invested assets” mainly includes the Group’s private equity and hedge fund investments which are made directly or via ownership of funds. substantially all these investments are classified as level 3 due to the lack of observable prices and significant judgment required in valuation. Valuation of direct private equity investments requires significant management judgment due to the absence of quoted market prices and the lack of liquidity. initial valuation is based on the acquisition cost, and is further refined based on the available market information for the public companies that are considered comparable to the Group’s holdings in the private companies being valued, and the private company-specific performance indicators; both historic and projected. subsequent valuations also reflect business or asset appraisals, as well as market transaction data for private and public benchmark companies and the actual companies being valued, such as financing rounds and mergers and acquisitions activity. the Group’s holdings in the private equity and hedge funds are generally valued utilising net asset values (NaV), subject to adjustments, as deemed necessary, for restrictions on redemption (lock-up periods and amount limitations on redemptions).
154 Swiss Re 2013 financial report
FiNaNcial StatemeNtS | Notes to the Group fiNaNcial statemeNts

the Group holds both exchange-traded and over-the-counter (otc) interest rate, foreign exchange, credit and equity derivative contracts for hedging and trading purposes. the fair values of exchange-traded derivatives measured using observable exchange prices are classified in level 1. long-dated contracts may require adjustments to the exchange-traded prices which would trigger reclassification to level 2 in the fair value hierarchy. otc derivatives are generally valued by the Group based on the internal models, which are consistent with industry standards and practices, and use both observable (dealer, broker or market consensus prices, spot and forward rates, interest rate and credit curves and volatility indices) and unobservable inputs (adjustments for liquidity, inputs derived from the observable data based on the Group’s judgments and assumptions).
the Group’s otc interest rate derivatives primarily include interest rate swaps, futures, options, caps and floors, and are valued based on the cash flow discounting models which generally utilise as inputs observable market yield curves and volatility assumptions.
the Group’s otc foreign exchange derivatives primarily include forward, spot and option contracts and are generally valued based on the cash flow discounting models, utilising as main inputs observable foreign exchange forward curves.
the Group’s investments in equity derivatives primarily include otc equity option contracts on single or baskets of market indices and equity options on individual or baskets of equity securities, which are valued using internally developed models (such as the Black-scholes option pricing model and various simulation models) calibrated with the inputs, which include underlying spot prices, dividend curves, volatility surfaces, yield curves, and correlations between underlying assets.
the Group’s otc credit derivatives include index and single-name credit default swaps, as well as more complex structured credit derivatives. plain vanilla credit derivatives, such as index and single-name credit default swaps, are valued by the Group based on the models consistent with the industry valuation standards for these credit contracts, and primarily utilising observable inputs published by market data sources, such as credit spreads and recovery rates. these valuation techniques warrant classification of plain vanilla otc derivatives as level 2 financial instruments in the fair value hierarchy.
the Group also holds complex structured credit contracts, such as credit default swaps (cDs) referencing mortgage-backed securities, certain types of collateralised debt obligation (cDo) transactions, and the products sensitive to correlation between two or more underlying parameters (cDo-squared); all of which are classified within level 3 of the fair value hierarchy. a cDo is a debt instrument collateralised by various debt obligations, including bonds, loans and cDs of differing credit profiles. in a cDo-squared transaction, both the primary instrument and the underlying instruments are represented by cDos. Generally, for cDo and cDo-squared transactions, the observable inputs such as cDs spreads and recovery rates are modified to adjust for correlation between the underlying debt instruments. the correlation levels are modelled at the portfolio level and calibrated at a transaction level to liquid benchmark rates.
Governance around level 3 fair valuationthe Group risk & capital committee, chaired by the Group chief risk officer, has a primary responsibility for governing and overseeing all of the Group’s valuation policies and operating parameters (including level 3 measurements). the Group risk & capital committee delegates the responsibility for implementation and oversight of consistent application of the Group’s pricing and valuation policies to the pricing and Valuation committee, which is a management control committee. Key functions of the pricing and Valuation committee include: oversight over the entire valuation process, approval of internal valuation methodologies, approval of external pricing vendors, monitoring of the independent price verification (ipV) process and resolution of significant or complex valuation issues.
a formal ipV process is undertaken monthly by members of the ipV team within a financial risk management function. the process includes monitoring and in-depth analyses of approved pricing methodologies and valuations of the Group’s financial instruments aimed at identifying and resolving pricing discrepancies.
the risk function is responsible for independent validation and ongoing review of the Group’s valuation models. the product control group within finance is tasked with reporting of fair values and is empowered to challenge vendor- and model-based valuations.
Swiss Re 2013 financial report 155
FiNaNcial StatemeNtS | Notes to the Group fiNaNcial statemeNts
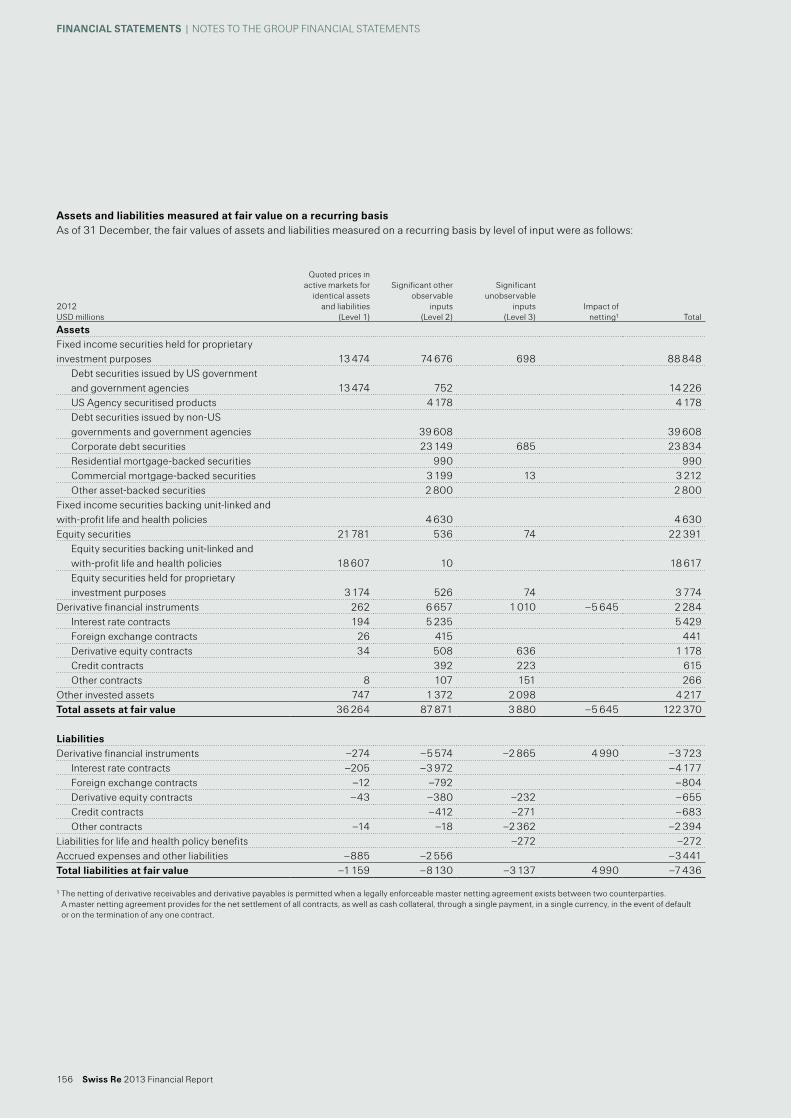
assets and liabilities measured at fair value on a recurring basisas of 31 December, the fair values of assets and liabilities measured on a recurring basis by level of input were as follows:
2012 usD millions
Quoted prices in active markets for
identical assets and liabilities
(level 1)
significant other observable
inputs (level 2)
significant unobservable
inputs (level 3)
impact of netting1 total
assetsfixed income securities held for proprietary investment purposes 13 474 74 676 698 88 848
Debt securities issued by us government and government agencies 13 474 752 14 226us agency securitised products 4 178 4 178Debt securities issued by non-us governments and government agencies 39 608 39 608corporate debt securities 23 149 685 23 834residential mortgage-backed securities 990 990commercial mortgage-backed securities 3 199 13 3 212other asset-backed securities 2 800 2 800
fixed income securities backing unit-linked and with-profit life and health policies 4 630 4 630equity securities 21 781 536 74 22 391
equity securities backing unit-linked and with-profit life and health policies 18 607 10 18 617equity securities held for proprietary investment purposes 3 174 526 74 3 774
Derivative financial instruments 262 6 657 1 010 –5 645 2 284interest rate contracts 194 5 235 5 429foreign exchange contracts 26 415 441Derivative equity contracts 34 508 636 1 178credit contracts 392 223 615other contracts 8 107 151 266
other invested assets 747 1 372 2 098 4 217total assets at fair value 36 264 87 871 3 880 –5 645 122 370
liabilitiesDerivative financial instruments –274 –5 574 –2 865 4 990 –3 723
interest rate contracts –205 –3 972 –4 177foreign exchange contracts –12 –792 –804Derivative equity contracts –43 –380 –232 –655credit contracts –412 –271 –683other contracts –14 –18 –2 362 –2 394
liabilities for life and health policy benefits –272 –272accrued expenses and other liabilities –885 –2 556 –3 441total liabilities at fair value –1 159 –8 130 –3 137 4 990 –7 436
1 the netting of derivative receivables and derivative payables is permitted when a legally enforceable master netting agreement exists between two counterparties. a master netting agreement provides for the net settlement of all contracts, as well as cash collateral, through a single payment, in a single currency, in the event of default or on the termination of any one contract.
156 Swiss Re 2013 financial report
FiNaNcial StatemeNtS | Notes to the Group fiNaNcial statemeNts

2013 usD millions
Quoted prices in active markets for
identical assets and liabilities
(level 1)
significant other observable
inputs (level 2)
significant unobservable
inputs (level 3)
impact of netting1 total
assetsfixed income securities held for proprietary investment purposes 5 454 73 180 662 79 296
Debt securities issued by us government and government agencies 5 454 1 537 6 991us agency securitised products 3 946 3 946Debt securities issued by non-us governments and government agencies 30 092 30 092corporate debt securities 30 904 650 31 554residential mortgage-backed securities 915 915commercial mortgage-backed securities 2 935 12 2 947other asset-backed securities 2 851 2 851
fixed income securities backing unit-linked and with-profit life and health policies 4 585 4 585equity securities 28 257 565 49 28 871
equity securities backing unit-linked and with-profit life and health policies 21 169 11 21 180equity securities held for proprietary investment purposes 7 088 554 49 7 691
Derivative financial instruments 31 3 563 505 –2 877 1 222interest rate contracts 8 2 372 2 380foreign exchange contracts 267 267Derivative equity contracts 23 842 401 1 266credit contracts 18 28 46other contracts 64 76 140
other invested assets 1 476 210 2 256 3 942total assets at fair value 35 218 82 103 3 472 –2 877 117 916
liabilitiesDerivative financial instruments –14 –3 097 –993 2 656 –1 448
interest rate contracts –2 123 –2 123foreign exchange contracts –428 –428Derivative equity contracts –14 –527 –190 –731credit contracts –11 –38 –49other contracts –8 –765 –773
liabilities for life and health policy benefits –145 –145accrued expenses and other liabilities –1 634 –1 271 –2 905total liabilities at fair value –1 648 –4 368 –1 138 2 656 –4 498
1 the netting of derivative receivables and derivative payables is permitted when a legally enforceable master netting agreement exists between two counterparties. a master netting agreement provides for the net settlement of all contracts, as well as cash collateral, through a single payment, in a single currency, in the event of default or on the termination of any one contract.
Swiss Re 2013 financial report 157
FiNaNcial StatemeNtS | Notes to the Group fiNaNcial statemeNts

2012 usD millions
corporate debt securities
residential mortgage-backed securities
commercial mortgage-backed
securitiesother asset-backed
securities
equity securities held for proprietary
investment purposesDerivative interest
rate contractsDerivative foreign
exchange contractsDerivative equity
contractsDerivative credit
contractsother derivative
contractsother invested
assets total
assetsBalance as of 1 January 2012 1 111 4 8 16 69 1 471 112 41 986 36 2 041 5 895
realised/unrealised gains/losses:included in net income 49 –1 20 7 –192 –430 44 –15 –518included in other comprehensive income –18 2 3 121 108
purchases 51 6 32 43 192 324issuances 0sales –448 –40 –32 –18 –33 –216 –787settlements –58 –9 –7 –81 –12 –2 –169transfers into level 31 24 41 3 828 38 40 41 1 015transfers out of level 31 –26 –4 –3 –7 –1 474 –112 –41 –257 –74 –1 998impact of foreign exchange movements 10 10
closing balance as of 31 December 2012 685 0 13 0 74 0 0 636 223 151 2 098 3 880
Derivative interest rate contracts
Derivative foreign exchange contracts
Derivative equity contracts
Derivative credit contracts
other derivative contracts
liabilities for life and health
policy benefits total
liabilitiesBalance as of 1 January 2012 –1 075 –66 –170 –1 075 –3 489 –341 –6 216
realised/unrealised gains/losses:included in net income 59 582 1 043 68 1 752included in other comprehensive income 0
purchases 0issuances –2 –19 –50 –71sales 2 96 98settlements 54 7 –26 35transfers into level 31 –368 –126 –29 –523transfers out of level 31 1 075 66 116 341 189 1 787impact of foreign exchange movements 1 1
closing balance as of 31 December 2012 0 0 –232 –271 –2 362 –272 –3 137
1 transfers are recognised at the date of the event or change in circumstances that caused the transfer. With the introduction of asu No. 2011-4 the Group has reassessed the observability of fair value inputs as of 1 January 2012. Yield curves for instruments with maturities above 20 years were deemed observable and related positions were therefore reclassified to level 2. the inputs of one level 2 position were assessed to be unobservable, the respective assets and liabilities were therefore shifted to level 3.
assets and liabilities measured at fair value on a recurring basis using significant unobservable inputs (level 3)as of 31 December, the reconciliation of the fair values of assets and liabilities measured on a recurring basis using significant unobservable inputs were as follows:
158 Swiss Re 2013 financial report
FiNaNcial StatemeNtS | Notes to the Group fiNaNcial statemeNts

2012 usD millions
corporate debt securities
residential mortgage-backed securities
commercial mortgage-backed
securitiesother asset-backed
securities
equity securities held for proprietary
investment purposesDerivative interest
rate contractsDerivative foreign
exchange contractsDerivative equity
contractsDerivative credit
contractsother derivative
contractsother invested
assets total
assetsBalance as of 1 January 2012 1 111 4 8 16 69 1 471 112 41 986 36 2 041 5 895
realised/unrealised gains/losses:included in net income 49 –1 20 7 –192 –430 44 –15 –518included in other comprehensive income –18 2 3 121 108
purchases 51 6 32 43 192 324issuances 0sales –448 –40 –32 –18 –33 –216 –787settlements –58 –9 –7 –81 –12 –2 –169transfers into level 31 24 41 3 828 38 40 41 1 015transfers out of level 31 –26 –4 –3 –7 –1 474 –112 –41 –257 –74 –1 998impact of foreign exchange movements 10 10
closing balance as of 31 December 2012 685 0 13 0 74 0 0 636 223 151 2 098 3 880
Derivative interest rate contracts
Derivative foreign exchange contracts
Derivative equity contracts
Derivative credit contracts
other derivative contracts
liabilities for life and health
policy benefits total
liabilitiesBalance as of 1 January 2012 –1 075 –66 –170 –1 075 –3 489 –341 –6 216
realised/unrealised gains/losses:included in net income 59 582 1 043 68 1 752included in other comprehensive income 0
purchases 0issuances –2 –19 –50 –71sales 2 96 98settlements 54 7 –26 35transfers into level 31 –368 –126 –29 –523transfers out of level 31 1 075 66 116 341 189 1 787impact of foreign exchange movements 1 1
closing balance as of 31 December 2012 0 0 –232 –271 –2 362 –272 –3 137
1 transfers are recognised at the date of the event or change in circumstances that caused the transfer. With the introduction of asu No. 2011-4 the Group has reassessed the observability of fair value inputs as of 1 January 2012. Yield curves for instruments with maturities above 20 years were deemed observable and related positions were therefore reclassified to level 2. the inputs of one level 2 position were assessed to be unobservable, the respective assets and liabilities were therefore shifted to level 3.
Swiss Re 2013 financial report 159
FiNaNcial StatemeNtS | Notes to the Group fiNaNcial statemeNts

2013 usD millions
corporate debt securities
commercial mortgage-backed
securitiesother asset-backed
securities
equity securities held for proprietary
investment purposesDerivative equity
contractsDerivative credit
contractsother derivative
contracts other invested assets total
assetsBalance as of 1 January 2013 685 13 0 74 636 223 151 2 098 3 880
realised/unrealised gains/losses:included in net income –4 4 –235 44 –139 108 –222included in other comprehensive income 1 12 13
purchases 37 16 13 12 346 424issuances 100 100sales –23 –16 –30 –182 –51 –462 –764settlements –45 –1 –70 3 –113transfers into level 3 419 419transfers out of level 3 –292 –292impact of foreign exchange movements 27 27
closing balance as of 31 December 2013 650 12 0 49 401 28 76 2 256 3 472
Derivative equity contracts
Derivative credit contracts
other derivative contracts
liabilities for life and health policy benefits total
liabilitiesBalance as of 1 January 2013 –232 –271 –2 362 –272 –3 137
realised/unrealised gains/losses:included in net income 53 –14 1 685 131 1 855included in other comprehensive income 0
purchases 0issuances –62 –62sales 160 50 210settlements –11 87 –76 0transfers into level 3 0transfers out of level 3 0impact of foreign exchange movements –4 –4
closing balance as of 31 December 2013 –190 –38 –765 –145 –1 138
160 Swiss Re 2013 financial report
FiNaNcial StatemeNtS | Notes to the Group fiNaNcial statemeNts

2013 usD millions
corporate debt securities
commercial mortgage-backed
securitiesother asset-backed
securities
equity securities held for proprietary
investment purposesDerivative equity
contractsDerivative credit
contractsother derivative
contracts other invested assets total
assetsBalance as of 1 January 2013 685 13 0 74 636 223 151 2 098 3 880
realised/unrealised gains/losses:included in net income –4 4 –235 44 –139 108 –222included in other comprehensive income 1 12 13
purchases 37 16 13 12 346 424issuances 100 100sales –23 –16 –30 –182 –51 –462 –764settlements –45 –1 –70 3 –113transfers into level 3 419 419transfers out of level 3 –292 –292impact of foreign exchange movements 27 27
closing balance as of 31 December 2013 650 12 0 49 401 28 76 2 256 3 472
Derivative equity contracts
Derivative credit contracts
other derivative contracts
liabilities for life and health policy benefits total
liabilitiesBalance as of 1 January 2013 –232 –271 –2 362 –272 –3 137
realised/unrealised gains/losses:included in net income 53 –14 1 685 131 1 855included in other comprehensive income 0
purchases 0issuances –62 –62sales 160 50 210settlements –11 87 –76 0transfers into level 3 0transfers out of level 3 0impact of foreign exchange movements –4 –4
closing balance as of 31 December 2013 –190 –38 –765 –145 –1 138
Swiss Re 2013 financial report 161
FiNaNcial StatemeNtS | Notes to the Group fiNaNcial statemeNts

Gains and losses on assets and liabilities measured at fair value on a recurring basis using significant unobservable inputs (level 3)the gains and losses relating to the assets and liabilities measured at fair value using significant unobservable inputs (level 3) for the years ended 31 December were as follows:
assets and liabilities measured at fair value on a non-recurring basisthe acquired present value of future profits (pVfp) of business in force is recorded in connection with the acquisition of life and/or health business. the initial value is determined actuarially by discounting estimated future gross profits as a measure of the value of business acquired. the resulting asset is amortised on a constant yield basis over the expected revenue recognition period of the business acquired, generally over periods ranging up to 30 years, with the accrual of interest added to the unamortised balance at the earned rate. the carrying value of pVfp is reviewed periodically for indicators of impairment in value. adjustments to reflect impairment in value are recognised in earnings during the period in which the determination of impairment is made.
transfers between level 1 and level 2transfers between level 1 and level 2 for the year ended 31 December 2012 were as follows:
there were no material transfers between level 1 and level 2 for the year ended 31 December 2013.
usD millions 2012 2013
Gains/losses included in net income for the period 1 234 1633Whereof change in unrealised gains/losses relating to assets and liabilities still held at the reporting date 1 005 1 484
2012 usD millions
Quoted prices in active markets for identical assets and liabilities
(level 1)
significant other observable inputs
(level 2)
assetstransfer into1 191 2 358transfer out of1 –78 –1 388
liabilitiestransfer into1 –1 930transfer out of1 589
1 transfers are recognised at the date of the event or change in circumstances that caused the transfer. With the introduction of asu No. 2011-4, the Group has reassessed the observability of fair value inputs as of 1 January 2012. Yield curves for instruments with maturities above 20 years were deemed observable and related positions were therefore reclassified from level 3 to level 2. the inputs of one level 2 position were assessed to be unobservable, the respective assets and liabilities were therefore shifted to level 3.
162 Swiss Re 2013 financial report
FiNaNcial StatemeNtS | Notes to the Group fiNaNcial statemeNts

this page intentionally left blank
Swiss Re 2013 financial report 163
FiNaNcial StatemeNtS | Notes to the Group fiNaNcial statemeNts

usD millions2012
fair value2013
fair value Valuation technique unobservable input range (weighted average)
assetscorporate debt securities 685 650
surplus notes with a mortality underlying 168 195 Discounted cash flow model illiquidity premium 75 bps (n.a.)private placement corporate debt 437 383 corporate spread matrix illiquidity premium 0 bps–250 bps (79 bps)private placement credit tenant leases 72 68 Discounted cash flow model illiquidity premium 75 bps–200 bps (129 bps)
Derivative equity contracts 636 401otc equity option referencing correlated equity indices 636 401 proprietary option model correlation –10%–100% (45%)1
Derivative credit contracts 223 28
credit default swaps referencing various asset-backed securities (aBs) 109 22credit spreads derived based on a
reciprocal of a reference instrumentup-front credit default
swap premium 5%–94% (81%)credit correlation tranche transactions 112 6 Base correlation model correlation 40%–88% (64%)1
liabilitiesDerivative equity contracts –232 –190
otc equity option referencing correlated equity indices –81 –49 proprietary option model correlation –10%–100% (45%)1option contract referencing a private equity underlying –144 –137 option model Volatility 100%
Growth rate 6% (n.a.)
Derivative credit contracts –271 –38
credit default swaps referencing various asset-backed securities (aBs) –86 –7credit spreads derived based on a
reciprocal of a reference instrumentup-front credit default
swap premium 1%–91% (65%)credit correlation tranche transactions –171 –30 Base correlation model correlation 40%–88% (64%)1
other derivative contracts and liabilities for life and health policy benefits –2 634 –910Variable annuity and fair valued GmDB contracts –2 287 –677 Discounted cash flow model risk margin 4% (n.a.)
Volatility 4%–42%lapse 0.5%–24%
mortality adjustment –10%–0%Withdrawal rate 0%–90%
embedded derivatives in mod-co and coinsurance with funds Withheld treaties –170 –125 Discounted cash flow model lapse 3%–10%mortality adjustment 80% (n.a.)
1 represents average input value for the reporting period.
Quantitative information about level 3 fair value measurementsunobservable inputs for major level 3 assets and liabilities as of 31 December were as follows:
164 Swiss Re 2013 financial report
FiNaNcial StatemeNtS | Notes to the Group fiNaNcial statemeNts

usD millions2012
fair value2013
fair value Valuation technique unobservable input range (weighted average)
assetscorporate debt securities 685 650
surplus notes with a mortality underlying 168 195 Discounted cash flow model illiquidity premium 75 bps (n.a.)private placement corporate debt 437 383 corporate spread matrix illiquidity premium 0 bps–250 bps (79 bps)private placement credit tenant leases 72 68 Discounted cash flow model illiquidity premium 75 bps–200 bps (129 bps)
Derivative equity contracts 636 401otc equity option referencing correlated equity indices 636 401 proprietary option model correlation –10%–100% (45%)1
Derivative credit contracts 223 28
credit default swaps referencing various asset-backed securities (aBs) 109 22credit spreads derived based on a
reciprocal of a reference instrumentup-front credit default
swap premium 5%–94% (81%)credit correlation tranche transactions 112 6 Base correlation model correlation 40%–88% (64%)1
liabilitiesDerivative equity contracts –232 –190
otc equity option referencing correlated equity indices –81 –49 proprietary option model correlation –10%–100% (45%)1option contract referencing a private equity underlying –144 –137 option model Volatility 100%
Growth rate 6% (n.a.)
Derivative credit contracts –271 –38
credit default swaps referencing various asset-backed securities (aBs) –86 –7credit spreads derived based on a
reciprocal of a reference instrumentup-front credit default
swap premium 1%–91% (65%)credit correlation tranche transactions –171 –30 Base correlation model correlation 40%–88% (64%)1
other derivative contracts and liabilities for life and health policy benefits –2 634 –910Variable annuity and fair valued GmDB contracts –2 287 –677 Discounted cash flow model risk margin 4% (n.a.)
Volatility 4%–42%lapse 0.5%–24%
mortality adjustment –10%–0%Withdrawal rate 0%–90%
embedded derivatives in mod-co and coinsurance with funds Withheld treaties –170 –125 Discounted cash flow model lapse 3%–10%mortality adjustment 80% (n.a.)
1 represents average input value for the reporting period.
Swiss Re 2013 financial report 165
FiNaNcial StatemeNtS | Notes to the Group fiNaNcial statemeNts

Sensitivity of recurring level 3 measurements to changes in unobservable inputsthe significant unobservable input used in the fair value measurement of the Group’s surplus notes, private placement debt securities and private placement credit tenant leases is illiquidity premium. a significant increase (decrease) in this input in isolation would result in a significantly higher (lower) fair value measurement.
the significant unobservable input used in the fair value measurement of the Group’s otc equity option referencing correlated equity indices is correlation. Where the Group is long correlation risk, a significant increase (decrease) in this input in isolation would result in a significantly higher (lower) fair value measurement. Where the Group is short correlation risk, a significant increase (decrease) in this input in isolation would result in a significantly lower (higher) fair value measurement.
the significant unobservable input used in the fair value measurement of the Group’s credit default swaps referencing aBs is a current up-front credit default swap premium. Where the Group is long protection, a significant increase (decrease) in this input in isolation would result in a significantly higher (lower) fair value measurement. Where the Group is short protection, a significant decrease (increase) in this input in isolation would result in a significantly higher (lower) fair value measurement.
the significant unobservable input used in the fair value measurement of the Group’s credit correlation tranche transactions is correlation. Where the Group is long correlation, a significant increase (decrease) in this input in isolation would result in a significantly higher (lower) fair value measurement. Where the Group is short correlation, a significant increase (decrease) in this input in isolation would result in a significantly lower (higher) fair value measurement.
the significant unobservable inputs used in the fair value measurement of the Group’s option referencing private equity underlying are: volatility and growth rate. Where the Group is long vega, a significant increase (decrease) in volatility in isolation would result in a significantly higher (lower) fair value measurement. Where the Group is short vega, a significant increase (decrease) in volatility in isolation would result in a significantly lower (higher) fair value measurement. Where the Group is long delta, a significant increase (decrease) in the growth rate in isolation would result in a significantly higher (lower) fair value measurement. Where the Group is short delta, a significant increase (decrease) in the growth rate in isolation would result in a significantly lower (higher) fair value measurement.
the significant unobservable inputs used in the fair value measurement of the Group’s variable annuity and fair valued guaranteed minimum death benefit (GmDB) contracts are: risk margin, volatility, lapse, mortality adjustment rate and withdrawal rate. a significant increase (decrease) in isolation in each of the following inputs: risk margin, volatility and withdrawal rate would result in a significantly higher (lower) fair value of the Group’s obligation. a significant increase (decrease) in isolation in a lapse rate for in-the-money contracts would result in a significantly lower (higher) fair value of the Group’s obligation, whereas for out-of-the-money contracts, an isolated increase (decrease) in a lapse assumption would increase (decrease) fair value of the Group’s obligation. changes in the mortality adjustment rate impact fair value of the Group’s obligation differently for living-benefit products, compared to death-benefit products. for the former, a significant increase (decrease) in the mortality adjustment rate (i.e. increase (decrease) in mortality, respectively) in isolation would result in a decrease (increase) in fair value of the Group’s liability. for the latter, a significant increase (decrease) in the mortality adjustment rate in isolation would result in an increase (decrease) in fair value of the Group’s liability.
the significant unobservable inputs underlying the fair valuation of an embedded derivative bifurcated from the Group’s modified coinsurance (mod-co) and coinsurance with funds Withheld treaties are lapse and mortality adjustment to published mortality tables; both are applied to build an expectation of cash flows associated with the underlying block of term business. Both inputs are not expected to significantly fluctuate over time.
166 Swiss Re 2013 financial report
FiNaNcial StatemeNtS | Notes to the Group fiNaNcial statemeNts

Other invested assets measured at net asset valueother invested assets measured at net asset value as of 31 December, respectively, were as follows:
the hedge fund investments employ a variety of strategies, including global macro, relative value and event-driven strategies, across various asset classes, including long/short equity and credit investments.
the private equity direct portfolio consists of equity and equity-like investments directly in other companies. these investments have no contractual term and are generally held based on financial or strategic intent.
private equity and real estate funds generally have limitations imposed on the amount of redemptions from the fund during the redemption period due to illiquidity of the underlying investments. fees may apply for redemptions or transferring of interest to other parties. Distributions are expected to be received from these funds as the underlying assets are liquidated over the life of the fund, which is generally from 10 to 12 years.
the redemption frequency of hedge funds varies depending on the manager as well as the nature of the underlying product. additionally, certain funds may impose lock-up periods and redemption gates as defined in the terms of the individual investment agreement.
Fair value optionthe fair value option under the financial instruments topic permits the choice to measure specified financial assets and liabilities at fair value on an instrument-by-instrument basis.
the Group elected the fair value option for positions in the following line items in the balance sheet:
equity securities tradingthe Group elected the fair value option for an investment previously classified as available-for-sale within other invested assets in the balance sheet. the Group economically hedges the investment with derivative instruments that offset this exposure. the changes in fair value of the derivatives are recorded in earnings. electing the fair value option eliminates the mismatch previously caused by the economic hedging of the investment and reduces the volatility in the income statement.
Other invested assetsthe Group elected the fair value option for certain investments classified as equity method investees within other invested assets in the balance sheet. the Group applied the fair value option, as the investments are managed on a fair value basis. the changes in fair value of these elected investments are recorded in earnings.
liabilities for life and health policy benefitsthe Group elected the fair value option for existing GmDB reserves related to certain variable annuity contracts which are classified as universal life-type contracts. the Group has applied the fair value option, as the equity risk associated with those contracts is managed on a fair value basis and it is economically hedged with derivative options in the market.
usD millions2012
fair value2013
fair valueunfunded
commitmentsredemption frequency
(if currently eligible)redemption
notice period
private equity funds 701 735 301 non-redeemable n.a.
hedge funds 1 140 749 redeemable1 90–180 days2
private equity direct 96 138 non-redeemable n.a.
real estate funds 223 231 97 non-redeemable n.a.
total 2 160 1 853 398
1 the redemption frequency varies from monthly to up to three years.2 cash distribution can be delayed for up to three years depending on the sale of the underlyings.
Swiss Re 2013 financial report 167
FiNaNcial StatemeNtS | Notes to the Group fiNaNcial statemeNts

assets and liabilities measured at fair value pursuant to election of the fair value optionpursuant to the election of the fair value option for the items described, the balances as of 31 December were as follows:
changes in fair values for items measured at fair value pursuant to election of the fair value optionGains/losses included in earnings for the years ended 31 December for items measured at fair value pursuant to election of the fair value option including foreign exchange were as follows:
fair value changes from equity securities trading are reported in “Net realised investment gains/losses – non-participating business”. fair value changes from other invested assets are reported in “Net investment income – non-participating”. fair value changes from the GmDB reserves are shown in “life and health benefits”.
usD millions 2012 2013
assetsequity securities held for proprietary investment purposes 672 615
of which at fair value pursuant to the fair value option 509 544other invested assets 11 164
of which at fair value pursuant to the fair value option 403liabilitiesliabilities for life and health policy benefits –36 117 –36 033
of which at fair value pursuant to the fair value option –272 –145
usD millions 2012 2013
equity securities held for proprietary investment purposes 54 35other invested assets 72liabilities for life and health policy benefits 71 125total 125 232
168 Swiss Re 2013 financial report
FiNaNcial StatemeNtS | Notes to the Group fiNaNcial statemeNts

assets and liabilities not measured at fair value but for which the fair value is disclosedassets and liabilities not measured at fair value but for which the fair value is disclosed as of 31 December, were as follows:
policy loans, other loans and certain mortgage loans are classified as level 3 measurements, as they do not have an active exit market. the majority of these positions need to be assessed in conjunction with the corresponding insurance business. considering these circumstances, the Group presents the carrying amount as an approximation for the fair value.
investments in real estate are fair valued primarily by external appraisers based on proprietary discounted cash flow models that incorporate applicable risk premium adjustments to discount yields and projected market rental income streams based on market-specific data. these fair value measurements are classified in level 3 in the fair value hierarchy.
Debt positions, which are fair valued based on executable broker quotes or based on the discounted cash flow method using observable inputs, are classified as level 2 measurements. fair value of the majority of the Group’s level 3 debt positions is judged to approximate carrying value due to the highly tailored nature of the obligation and short-notice termination provisions.
2012 usD millions
significant other observable inputs
(level 2)
significant unobservable
inputs (level 3) total
assetspolicy loans 284 284mortgage loans 1 362 1 362other loans 653 653investment real estate 2 536 2 536total assets 4 835 4 835
liabilitiesDebt –9 970 –10 136 –20 106total liabilities –9 970 –10 136 –20 106
2013 usD millions
significant other observable inputs
(level 2)
significant unobservable
inputs (level 3) total
assetspolicy loans 270 270mortgage loans 1 801 1 801other loans 824 824investment real estate 2 551 2 551total assets 5 446 5 446
liabilitiesDebt –10 998 –7 528 –18 526total liabilities –10 998 –7 528 –18 526
Swiss Re 2013 financial report 169
FiNaNcial StatemeNtS | Notes to the Group fiNaNcial statemeNts

4 Derivative financial instruments
the Group uses a variety of derivative financial instruments including swaps, options, forwards, credit derivatives and exchange-traded financial futures in its trading and hedging strategies, in line with the Group’s overall risk management strategy. the objectives include managing exposure to price, foreign currency and/or interest rate risk on planned or anticipated investment purchases, existing assets or liabilities, as well as locking in attractive investment conditions for future available funds.
the fair values represent the gross carrying value amounts at the reporting date for each class of derivative contract held or issued by the Group. the gross fair values are not an indication of credit risk, as many over-the-counter transactions are contracted and documented under isDa master agreements or their equivalent. management believes that such agreements provide for legally enforceable setoff in the event of default, which substantially reduces credit exposure.
170 Swiss Re 2013 financial report
FiNaNcial StatemeNtS | Notes to the Group fiNaNcial statemeNts

Fair values and notional amounts of derivative financial instrumentsas of 31 December, the fair values and notional amounts of the derivatives outstanding were as follows:
the notional amounts of derivative financial instruments give an indication of the Group’s volume of derivative activity. the fair value assets are included in “other invested assets” and the fair value liabilities are included in “accrued expenses and other liabilities”. the fair value amounts that were not offset were nil as of 31 December 2012 and 2013.
2012 usD millions
Notional amount assets/liabilities
fair value assets
fair value liabilities
carrying value assets/liabilities
Derivatives not designated as hedging instrumentsinterest rate contracts 125 577 4 609 –4 177 432foreign exchange contracts 25 739 441 –785 –344equity contracts 17 917 1 178 –655 523credit contracts 33 137 615 –683 –68other contracts 22 965 266 –2 394 –2 128total 225 335 7 109 –8 694 –1 585
Derivatives designated as hedging instrumentsinterest rate contracts 2 828 820 820foreign exchange contracts 1 609 –19 –19total 4 437 820 –19 801
total derivative financial instruments 229 772 7 929 –8 713 –784
amount offsetWhere a right of setoff exists –4 466 4 466Due to cash collateral –1 179 524
total net amount of derivative financial instruments 2 284 –3 723 –1 439
2013 usD millions
Notional amount assets/liabilities
fair value assets
fair value liabilities
carrying value assets/liabilities
Derivatives not designated as hedging instrumentsinterest rate contracts 81 197 2 380 –2 123 257foreign exchange contracts 15 580 252 –417 –165equity contracts 20 111 1 266 –731 535credit contracts 2 676 46 –49 –3other contracts 23 055 140 –773 –633total 142 619 4 084 –4 093 –9
Derivatives designated as hedging instrumentsinterest rate contracts 0foreign exchange contracts 1 472 15 –11 4total 1 472 15 –11 4
total derivative financial instruments 144 091 4 099 –4 104 –5
amount offsetWhere a right of setoff exists –2 353 2 353Due to cash collateral –524 303
total net amount of derivative financial instruments 1 222 –1 448 –226
Swiss Re 2013 financial report 171
FiNaNcial StatemeNtS | Notes to the Group fiNaNcial statemeNts

Non-hedging activitiesthe Group primarily uses derivative financial instruments for risk management and trading strategies. Gains and losses of derivative financial instruments not designated as hedging instruments are recorded in “Net realised investment gains/losses” in the income statement. for the years ended 31 December, the gains and losses of derivative financial instruments not designated as hedging instruments were as follows:
Hedging activitiesthe Group designates certain derivative financial instruments as hedging instruments. the designation of derivative financial instruments is primarily used for overall portfolio and risk management strategies. as of 31 December 2012 and 2013, the following hedging relationships were outstanding:
Fair value hedgesthe Group enters into interest rate and foreign exchange swaps to reduce the exposure to interest rate and foreign exchange volatility for certain of its issued debt positions. these derivative instruments are designated as hedging instruments in qualifying fair value hedges. Gains and losses on derivative financial instruments designated as fair value hedging instruments are recorded in “Net realised investment gains/losses” in the income statement. for the years ended 31 December, the gains and losses attributable to the hedged risks were as follows:
Hedges of the net investment in foreign operationsthe Group designates non-derivative monetary financial instruments as hedging the foreign currency exposure of its net investment in certain foreign operations.
for the years ended 31 December 2012 and 2013, the Group recorded an accumulated net unrealised foreign currency remeasurement gain of usD 220 million and a gain of usD 29 million, respectively, in shareholders’ equity. these offset translation gains and losses on the hedged net investment.
usD millions 2012 2013
Derivatives not designated as hedging instrumentsinterest rate contracts –141 –241foreign exchange contracts –547 –584equity contracts –774 –962credit contracts –82 –71other contracts 1 030 1 728total gain/loss recognised in income –514 –130
2012 2013 usD millions
Gains/losses on derivatives
Gains/losses on hedged items
Gains/losses on derivatives
Gains/losses on hedged items
Fair value hedging relationshipsinterest rate contracts –26 33 –240 255foreign exchange contracts –24 11 2 –1total gain/loss recognised in income –50 44 –238 254
172 Swiss Re 2013 financial report
FiNaNcial StatemeNtS | Notes to the Group fiNaNcial statemeNts

maximum potential lossin consideration of the rights of setoff and the qualifying master netting arrangements with various counterparties, the maximum potential loss as of 31 December 2012 and 2013 was approximately usD 3 463 million and usD 1 746 million, respectively. the maximum potential loss is based on the positive market replacement cost assuming non-performance of all counterparties, excluding cash collateral.
credit risk-related contingent featurescertain derivative instruments held by the Group contain provisions that require its debt to maintain an investment-grade credit rating. if the Group’s credit rating were downgraded or no longer rated, the counterparties could request immediate payment, guarantee or an ongoing full overnight collateralisation on derivative instruments in net liability positions.
the total fair value of derivative financial instruments containing credit risk-related contingent features amounted to usD 1 446 million and usD 855 million as of 31 December 2012 and 2013, respectively. for derivative financial instruments containing credit risk-related contingent features, the Group posted collateral of usD 524 million and usD 303 million as of 31 December 2012 and 2013, respectively. in the event of a reduction of the Group’s credit rating to below investment grade, a fair value of usD 552 million additional collateral would have had to be posted as of 31 December 2013. the total equals the amount needed to settle the instruments immediately as of 31 December 2012 and 2013, respectively.
credit derivatives written/soldthe Group writes/sells credit derivatives, including credit default swaps, credit spread options and credit index products, and total return swaps. the total return swaps, for which the Group assumes asset risk mainly of variable interest entities, qualify as guarantees under fasB asc topic 460. these activities are part of the Group’s overall portfolio and risk management strategies. the events that could require the Group to perform include bankruptcy, default, obligation acceleration or moratorium of the credit derivative’s underlying.
the following tables show the fair values and the maximum potential payout of the credit derivatives written/sold as of 31 December 2012 and 2013, categorised by the type of credit derivative and credit spreads, which were based on external market data. the fair values represent the gross carrying values, excluding the effects of netting under isDa master agreements and cash collateral netting. the maximum potential payout is based on the notional values of the derivatives and represents the gross undiscounted future payments the Group would be required to make, assuming the default of all credit derivatives’ underlyings.
the fair values of the credit derivatives written/sold do not represent the Group’s effective net exposure as the isDa master agreement and the cash collateral netting are excluded.
the Group has purchased protection to manage the performance/payment risks related to credit derivatives. as of 31 December 2012 and 2013, the total purchased credit protection based on notional values was usD 16 689 million and usD 2 061 million, respectively, of which usD 8 220 million and usD 514 million, respectively, were related to identical underlyings for which the Group sold credit protection. for tranched indexes and baskets, only matching tranches of the respective index were determined as identical. in addition to the purchased credit protection, the Group manages the performance/payment risks through a correlation hedge, which is established with non-identical offsetting positions.
the maximum potential payout is based on notional values of the credit derivatives. the Group enters into total return swaps mainly with variable interest entities which issue insurance-linked and credit-linked securities.
Swiss Re 2013 financial report 173
FiNaNcial StatemeNtS | Notes to the Group fiNaNcial statemeNts

as of 31 December, the fair values and maximum potential payout of the written credit derivatives outstanding were as follows:
total fair values of credit
derivatives written/sold
maximum potential payout (time to maturity)
total maximum potential payout
2012 usD millions 0–5 years 5–10 years over 10 years
credit Default Swapscredit spread in basis points
0–250 9 1 174 1 174251–500 –1 38 38501–1 000 –11 96 34 130Greater than 1 000 –92 146 133 279
total –95 1 454 0 167 1 621
credit index Productscredit spread in basis points
0–250 –63 14 400 14 400251–500 30 427 427
total –33 14 827 0 0 14 827
total Return Swapscredit spread in basis points
No credit spread available 72 773 773total 72 773 0 0 773
total credit derivatives written/sold –56 17 054 0 167 17 221
174 Swiss Re 2013 financial report
FiNaNcial StatemeNtS | Notes to the Group fiNaNcial statemeNts

total fair values of credit
derivatives written/sold
maximum potential payout (time to maturity)
total maximum potential payout
2013 usD millions 0–5 years 5–10 years over 10 years
credit Default Swapscredit spread in basis points
0–250 –15 59 60 119251–500 0501–1 000 0Greater than 1 000 0
total –15 59 0 60 119
credit index Productscredit spread in basis points
0–250 15 96 400 496251–500 0
total 15 96 400 0 496
total Return Swapscredit spread in basis points
No credit spread available 1 25 25total 1 25 0 0 25
total credit derivatives written/sold 1 180 400 60 640
Swiss Re 2013 financial report 175
FiNaNcial StatemeNtS | Notes to the Group fiNaNcial statemeNts

5 Deferred acquisition costs (Dac) and acquired present value of future profits (pVfp)
as of 31 December, the Dac were as follows:
retroceded Dac may arise on retrocession of reinsurance portfolios, including reinsurance undertaken as part of a securitisation. the associated potential retrocession recoveries are determined by the nature of the retrocession agreements and by the terms of the securitisation.
2012 usD millions
property & casualty reinsurance
life & health reinsurance
corporate solutions admin re® Group items total
opening balance as of 1 January 2012 1 247 2 663 –25 34 4 3 923cumulative effect of adoption of asu No. 2010-26 –35 –35Deferred 2 119 399 542 3 060effect of acquisitions/disposals and retrocessions 0amortisation –2 266 –367 –300 –1 –3 –2 937effect of foreign currency translation 3 53 2 1 59Write-off of Dac –31 –31closing balance as of 31 December 2012 1 103 2 713 219 2 2 4 039
2013 usD millions
property & casualty reinsurance
life & health reinsurance
corporate solutions admin re® Group items total
opening balance as of 1 January 2013 1 103 2 713 219 2 2 4 039cumulative effect of adoption of asu No. 2010-26 0Deferred 3 217 491 504 4 212effect of acquisitions/disposals and retrocessions 57 57amortisation –2 710 –397 –406 –3 513effect of foreign currency translation –19 –19 2 –1 –2 –39Write-off of Dac 0closing balance as of 31 December 2013 1 591 2 845 319 1 0 4 756
176 Swiss Re 2013 financial report
FiNaNcial StatemeNtS | Notes to the Group fiNaNcial statemeNts

as of 31 December, the pVfp was as follows:
retroceded pVfp may arise on retrocession of reinsurance portfolios, including reinsurance undertaken as part of a securitisation. the associated potential retrocession recoveries are determined by the nature of the retrocession agreements and by the terms of the securitisation.
in 2013, based on the results of shadow loss recognition testing the shadow loss reserve was reduced by usD 308 million, net of tax, impacting pVfp and other comprehensive income. the adjustment relates to admin re® business and is reflected in the “effect of change in unrealised gains/losses” in the table above. shadow loss recognition testing considers the adequacy of contractual liabilities, net of Dac and pVfp, using current best estimates of all future cash flows discounted at current market yields. the purpose is to reflect the fact that certain amounts recorded as unrealised investment gains and losses within shareholders’ equity will ultimately accrue to policyholders and not shareholders. shadow losses recognised can reverse up to the amount of losses recognised due to a loss recognition event.
the percentage of pVfp which is expected to be amortised in each of the next five years is 7%, 6%, 6%, 6% and 6%.
2012 2013
usD millionslife & health reinsurance admin re® total
life & health reinsurance admin re® total
opening balance as of 1 January 1 674 2 552 4 226 1 358 1 665 3 023effect of acquisitions/disposals and retrocessions –206 126 –80 206 –30 176amortisation –201 –244 –445 –151 –184 –335interest accrued on unamortised pVfp 51 140 191 35 186 221effect of foreign currency translation 40 56 96 3 44 47effect of change in unrealised gains/losses –316 –316 405 405Write-off of pVfp –649 –649 0closing balance as of 31 December 1 358 1 665 3 023 1 451 2 086 3 537
Swiss Re 2013 financial report 177
FiNaNcial StatemeNtS | Notes to the Group fiNaNcial statemeNts

this page intentionally left blank
178 Swiss Re 2013 financial report
FiNaNcial StatemeNtS | Notes to the Group fiNaNcial statemeNts

6 Debt and contingent capital instruments
The Group enters into long- and short-term debt arrangements to obtain funds for general corporate use and specific transaction financing. The Group defines short-term debt as debt having a maturity at the balance sheet date of not greater than one year and long-term debt as having a maturity of greater than one year. Interest expense is classified accordingly.
The Groupʼs debt as of 31 December was as follows:
The Group uses debt for general corporate purposes and to fund discrete pools of operational leverage and financial intermediation assets. Operational leverage and financial intermediation are subject to asset and liability matching, resulting in little to no risk that the assets will be insufficient to service and settle the liabilities. Debt used for operational leverage and financial intermediation is treated as operational debt and excluded by the rating agencies from financial leverage calculations. Certain debt positions are limited recourse, meaning the debtorsʼ claims are limited to assets underlying the financing. As of 31 December 2012 and 2013, debt related to operational leverage and financial intermediation amounted to USD 9.9 billion (thereof USD 6.1 billion limited recourse) and USD 9.0 billion (thereof USD 6.1 billion limited recourse), respectively.
Maturity of long-term debtAs of 31 December, long-term debt as reported above had the following maturities:
USD millions 2012 2013
Senior financial debt 793 901Senior operational debt 2 819 2 917Short-term debt – financial and operational debt 3 612 3 818
Senior financial debt 4 952 3 233Senior operational debt 1 704 708Subordinated financial debt 4 302 5 367Subordinated operational debt 5 328 5 414Long-term debt – financial and operational debt 16 286 14 722
Total carrying value 19 898 18 540Total fair value 20 106 18 526
USD millions 2012 2013
Due in 2014 1 763 01Due in 2015 708 730Due in 2016 2 136 2 151Due in 2017 1 428 1 341Due in 2018 0 0Due after 2018 10 251 10 500Total carrying value 16 286 14 722
1 Balance was reclassified to short-term debt.
Swiss Re 2013 Financial Report 179
FinanciaL STaTeMenTS | NOTeS TO The GROUp FINANCIAl STATemeNTS

Senior long-term debt
Subordinated long-term debt
maturity Instrument Issued in Currency Nominal in millions Interest rate Book value in USD millions
2015 emTN 2001 ChF 150 4.00% 1692015 emTN 2010 ChF 500 2.00% 5612017 emTN 2011 ChF 600 2.13% 6712019 Senior notes1 1999 USD 234 6.45% 2822022 Senior notes 2012 USD 250 2.88% 2482026 Senior notes1 1996 USD 397 7.00% 5302030 Senior notes1 2000 USD 193 7.75% 2852042 Senior notes 2012 USD 500 4.25% 488Various payment undertaking agreements various USD 559 various 707Total senior debt as of 31 December 2013 3 941Total senior debt as of 31 December 2012 6 656
1 Assumed in the acquisition of Ge Insurance Solutions.
maturity Instrument Issued in CurrencyNominal in
millions Interest rate first call inBook value
in USD millions
2024 Subordinated contingent write-off loan notes 2013 USD 750 6.38% 2019 8312042 Subordinated fixed-to-floating rate loan note 2012 eUR 500 6.63% 2022 6792045 Subordinated contingent write-off securities 2013 ChF 175 7.50% 2020 234
2047Subordinated private placement (amortising, limited recourse) 2007 GBp 1 355 4.90% 2 223
2057Subordinated private placement (amortising, limited recourse) 2007 GBp 1 929 4.77% 3 191Subordinated perpetual loan note 2006 eUR 1 000 5.25% 2016 1 376Subordinated perpetual loan note 2006 USD 752 6.85% 2016 752Subordinated perpetual loan note 2007 GBp 500 6.30% 2019 8262 subordinated perpetual loan notes 2007 AUD 750 various 2017 669
Total subordinated debt as of 31 December 2013 10 781Total subordinated debt as of 31 December 2012 9 630
180 Swiss Re 2013 Financial Report
FinanciaL STaTeMenTS | NOTeS TO The GROUp FINANCIAl STATemeNTS

interest expense on long-term debt and contingent capital instrumentsInterest expense on long-term debt for the years ended 31 December was as follows:
Interest expense on contingent capital instruments was USD 56 million and USD 67 million for the years ended 31 December 2012 and 2013, respectively.
Long-term debt issued in 2013In march 2013, Swiss Reinsurance Company ltd issued subordinated contingent write-off loan notes with a scheduled maturity in 2024. The instrument has a face value of USD 750 million, with a fixed coupon of 6.375% per annum until the optional redemption date (1 September 2019). The full principal amount of the instrument is mandatorily written off if Swiss Reinsurance Company ltd reports a Swiss Solvency Test (SST) ratio of less than 125% to the Swiss Financial market Supervisory Authority (FINmA).
In October 2013, Swiss Reinsurance Company ltd issued 32-year subordinated contingent write-off securities with a scheduled maturity in 2045. The instrument has a face value of ChF 175 million, with a fixed coupon of 7.5% per annum until the first optional redemption date (1 September 2020). The full principal amount of the instrument will be written off upon the earlier to occur of: 1) Swiss Reinsurance Company ltd reporting a Swiss Solvency Test (SST) ratio of less than 135% to the Swiss Financial market Supervisory Authority (FINmA), or 2) the occurrence of an Atlantic hurricane which causes insured industry losses defined in an USD billion amount exceeding those of a 1-in-200 year event, subject to an annual reset assessment to adjust for changes in insured values, while neutralising any impact due to model changes.
contingent capital instruments issued in 2012In February 2012, Swiss Reinsurance Company ltd issued a perpetual subordinated instrument with stock settlement. The instrument has a face value of ChF 320 million, with a fixed coupon of 7.25% per annum until the first optional redemption date (1 September 2017).
In march 2012, Swiss Reinsurance Company ltd issued a perpetual subordinated capital instrument with stock settlement. The instrument has a face value of USD 750 million, with a fixed coupon of 8.25% per annum until the first optional redemption date (1 September 2018).
Both instruments may be converted, at the option of the issuer, into Swiss Re ltd shares at any time through at market conversion using the retrospective five-day volume weighted average share price with a 3% discount or within six months following a solvency event at a pre-set floor price (ChF 26 for the instrument with face value of ChF 320 million and USD 32 for the instrument with face value of USD 750 million, respectively). These instruments are referred to in these financial statements as “contingent capital instruments”.
USD millions 2012 2013
Senior financial debt 161 148Senior operational debt 109 48Subordinated financial debt 238 286Subordinated operational debt 251 246Total 759 728
Swiss Re 2013 Financial Report 181
FinanciaL STaTeMenTS | NOTeS TO The GROUp FINANCIAl STATemeNTS

7 Unpaid claims and claim adjustment expenses
The liability for unpaid claims and claim adjustment expenses as of 31 December is analysed as follows:
A reconciliation of the opening and closing reserve balances for non-life unpaid claims and claim adjustment expenses for the period is presented as follows:
The Group does not discount liabilities arising from prospective property and casualty insurance and reinsurance contracts, including liabilities which are discounted for US statutory reporting purposes. liabilities arising from property and casualty insurance and reinsurance contracts acquired in a business combination are initially recognised at fair value in accordance with the purchase method of accounting.
USD millions 2012 2013
Non-life 53 010 50 392life & health 10 660 11 092Total 63 670 61 484
USD millions 2012 2013
Balance as of 1 January 53 827 53 010Reinsurance recoverable –6 610 –7 101Deferred expense on retroactive reinsurance –320 –229net balance as of 1 January 46 897 45 680
Incurred related to:Current year 9 050 10 765prior year –1 477 –1 371
Amortisation of deferred expense on retroactive reinsurance and impact of commutations 64 151Total incurred 7 637 9 545
paid related to:Current year –1 525 –2 103prior year –7 962 –9 265
Total paid –9 487 –11 368
Foreign exchange 334 211effect of acquisitions, disposals, new retroactive reinsurance and other items 299 239net balance as of 31 December 45 680 44 307
Reinsurance recoverable 7 101 6 029Deferred expense on retroactive reinsurance 229 56Balance as of 31 December 53 010 50 392
182 Swiss Re 2013 Financial Report
FinanciaL STaTeMenTS | NOTeS TO The GROUp FINANCIAl STATemeNTS

Prior-year developmentNet claims development on prior years was favourable overall during 2013, driven by reserve releases from property, liability, accident and health and several of the special lines, especially engineering. In most cases, the releases were the result of better-than-expected claims experience helped, particularly in the case of accident and health, by commutations. These releases come about despite further strengthening for US and UK asbestos and environmental claims, strengthening on motor business in several european countries and adverse development of claims arising from the New Zealand earthquakes, partly offset by favourable development on claims from hurricane Sandy in the US.
A summary of prior year claims development by lines of business is shown below:
US asbestos and environmental claims exposureThe Groupʼs obligation for claims payments and claims settlement charges also includes obligations for long-latent injury claims arising out of policies written prior to 1986, in particular in the area of US asbestos and environmental liability.
At the end of 2013, the Group carried net reserves for US asbestos and environmental liabilities equal to USD 1 950 million. During 2013, the Group incurred net losses of USD 352 million and paid net against these liabilities USD 393 million.
estimating ultimate asbestos and environmental liabilities is particularly complex for a number of reasons relating in part to the long period between exposure and manifestation of claims, and in part to other factors, which include risks and lack of predictability inherent in complex litigation, changes in projected costs to resolve, and in the projected number of, asbestos and environmental claims, the effect of bankruptcy protection, insolvencies, and changes in the legal, legislative and regulatory environment. As a result, the Group believes that projection of exposures for asbestos and environmental claims is subject to far less predictability relative to non-environmental and non-asbestos exposures. management believes that its reserves for asbestos and environmental claims are appropriately established based upon known facts and the current state of the law. however, reserves are subject to revision as new information becomes available and as claims develop. Additional liabilities may arise for amounts in excess of reserves, and the Groupʼs estimate of claims and claim adjustment expenses may change. Any such additional liabilities or increases in estimates cannot be reasonably estimated in advance but could result in charges that could be material to operating results.
The Group maintains an active commutation strategy to reduce exposure. When commutation payments are made, the traditional “survival ratio” is artificially reduced by premature payments which should not imply a reduction in reserve adequacy.
USD millions 2012 2013
line of business:property –242 –441Casualty –699 –455Specialty –536 –475
Total –1 477 –1 371
Swiss Re 2013 Financial Report 183
FinanciaL STaTeMenTS | NOTeS TO The GROUp FINANCIAl STATemeNTS

8 Insurance information
For the year ended 31 December
Premiums earned and fees assessed against policyholders
2012 USD millions
property & Casualty Reinsurance
life & health Reinsurance
Corporate Solutions Admin Re® Group items Total
Premiums earned, thereof:Direct 179 2 196 1 204 3 579Reinsurance 16 097 10 506 385 196 6 27 190Intra-group transactions (assumed and ceded) –278 250 278 –250 0
Premiums earned before retrocession to external parties 15 819 10 935 2 859 1 150 6 30 769
Reinsurance ceded to external parties –3 490 –1 885 –575 –158 –6 108net premiums earned 12 329 9 050 2 284 992 6 24 661
Fee income from policyholders, thereof:Direct 587 587Reinsurance 64 134 198Intra-group transactions (assumed and ceded) 8 –8 0
Gross fee income before retrocession to external parties 72 713 785
Fee income ceded to external parties 0net fee income 0 72 0 713 0 785
184 Swiss Re 2013 Financial Report
FinanciaL STaTeMenTS | NOTeS TO The GROUp FINANCIAl STATemeNTS

For the year ended 31 December
Premiums earned and fees assessed against policyholders
2013 USD millions
property & Casualty Reinsurance
life & health Reinsurance
Corporate Solutions Admin Re® Group items Total
Premiums earned, thereof:Direct 624 2 564 946 4 134Reinsurance 16 594 10 481 473 191 1 27 740Intra-group transactions (assumed and ceded) –228 254 228 –254 0
Premiums earned before retrocession to external parties 16 366 11 359 3 265 883 1 31 874
Reinsurance ceded to external parties –1 824 –1 392 –343 –39 –3 598net premiums earned 14 542 9 967 2 922 844 1 28 276
Fee income from policyholders, thereof:Direct 401 401Reinsurance 56 85 141Intra-group transactions (assumed and ceded) 0
Gross fee income before retrocession to external parties 56 486 542
Fee income ceded to external parties 0net fee income 0 56 0 486 0 542
Swiss Re 2013 Financial Report 185
FinanciaL STaTeMenTS | NOTeS TO The GROUp FINANCIAl STATemeNTS

For the year ended 31 December
claims and claim adjustment expenses
acquisition costs
2012 USD millions
property & Casualty Reinsurance
life & health Reinsurance
Corporate Solutions Admin Re® Group items Total
claims paid, thereof:Gross claims paid to external parties –9 553 –8 341 –1 915 –2 868 –18 –22 695Intra-group transactions (assumed and ceded) –818 –130 818 130 0
claims before receivables from retrocession to external parties –10 371 –8 471 –1 097 –2 738 –18 –22 695
Receivables from retrocession to external parties 1 620 2 209 379 293 4 501net claims paid –8 751 –6 262 –718 –2 445 –18 –18 194
change in unpaid claims and claim adjustment expenses; life and health benefits, thereof:
Gross – with external parties 910 –42 400 297 4 1 569Intra-group transactions (assumed and ceded) 1 219 –85 –1 225 91 0
Unpaid claims and claim adjustment expenses; life and health benefits before impact of retrocession to external parties 2 129 –127 –825 388 4 1 569
Reinsurance ceded to external parties 316 –398 95 –29 –16net unpaid claims and claim adjustment expenses; life and health benefits 2 445 –525 –730 359 4 1 553
claims and claim adjustment expenses; life and health benefits –6 306 –6 787 –1 448 –2 086 –14 –16 641
2012 USD millions
property & Casualty Reinsurance
life & health Reinsurance
Corporate Solutions Admin Re® Group items Total
acquisition costs, thereof:Gross acquisition costs with external parties –3 522 –2 057 –362 –177 –3 –6 121Intra-group transactions (assumed and ceded) 55 –14 –55 14 0
acquisition costs before impact of retrocession to external parties –3 467 –2 071 –417 –163 –3 –6 121
Retrocession to external parties 1 151 284 117 21 1 573net acquisition costs –2 316 –1 787 –300 –142 –3 –4 548
186 Swiss Re 2013 Financial Report
FinanciaL STaTeMenTS | NOTeS TO The GROUp FINANCIAl STATemeNTS

For the year ended 31 December
claims and claim adjustment expenses
acquisition costs
2013 USD millions
property & Casualty Reinsurance
life & health Reinsurance
Corporate Solutions Admin Re® Group items Total
claims paid, thereof:Gross claims paid to external parties –10 421 –8 564 –3 086 –2 269 –2 –24 342Intra-group transactions (assumed and ceded) –1 417 –334 1 422 331 –2 0
claims before receivables from retrocession to external parties –11 838 –8 898 –1 664 –1 938 –4 –24 342
Receivables from retrocession to external parties 1 713 1 230 425 65 3 433net claims paid –10 125 –7 668 –1 239 –1 873 –4 –20 909
change in unpaid claims and claim adjustment expenses; life and health benefits, thereof:
Gross – with external parties 1 581 –482 1 189 511 6 2 805Intra-group transactions (assumed and ceded) 1 695 121 –1 698 –118 0
Unpaid claims and claim adjustment expenses; life and health benefits before impact of retrocession to external parties 3 276 –361 –509 393 6 2 805
Reinsurance ceded to external parties –1 035 –46 –25 –26 –1 132net unpaid claims and claim adjustment expenses; life and health benefits 2 241 –407 –534 367 6 1 673
claims and claim adjustment expenses; life and health benefits –7 884 –8 075 –1 773 –1 506 2 –19 236
2013 USD millions
property & Casualty Reinsurance
life & health Reinsurance
Corporate Solutions Admin Re® Group items Total
acquisition costs, thereof:Gross acquisition costs with external parties –3 429 –2 005 –432 –34 –5 900Intra-group transactions (assumed and ceded) 49 –2 –49 2 0
acquisition costs before impact of retrocession to external parties –3 380 –2 007 –481 –32 –5 900
Retrocession to external parties 619 309 75 2 1 005net acquisition costs –2 761 –1 698 –406 –30 0 –4 895
Swiss Re 2013 Financial Report 187
FinanciaL STaTeMenTS | NOTeS TO The GROUp FINANCIAl STATemeNTS

Reinsurance recoverable on unpaid claims and policy benefitsFor the year ended 2013 the Group recorded a reinsurance recoverable of USD 8.3 billion. The concentration of credit risk is regularly monitored and evaluated. The reinsurance programme with Berkshire hathaway and subsidiaries accounts for 62% of the Group’s reinsurance recoverable.
Reinsurance receivablesReinsurance receivables as of 31 December were as follows:
Policyholder dividendspolicyholder dividends are recognised as an element of policyholder benefits. The relative percentage of participating insurance of the life and health policy benefits in 2012 and 2013 was 8% and 7%, respectively. The amount of policyholder dividend expense in 2012 and 2013 was USD 124 million and USD 139 million, respectively.
USD millions 2012 2013
premium receivables invoiced 1 254 1 482Receivables invoiced from ceded re/insurance business 447 446Assets arising from the application of the deposit method of accounting and meeting the definition of financing receivables 1 322 1 273Recognised allowance –109 –101
188 Swiss Re 2013 Financial Report
FinanciaL STaTeMenTS | NOTeS TO The GROUp FINANCIAl STATemeNTS

9 premiums written
For the years ended 31 December
2012 USD millions
property & Casualty Reinsurance
life & health Reinsurance
Corporate Solutions Admin Re® Group items Consolidation Total
Gross premiums written, thereof:Direct 388 2 637 1 207 4 232Reinsurance 16 387 10 464 444 196 27 491Intra-group transactions (assumed) 239 249 648 –1 136 0
Gross premiums written 16 626 11 101 3 729 1 403 –1 136 31 723Intra-group transactions (ceded) –648 –239 –249 1 136 0
Gross premiums written before retrocession to external parties 15 978 11 101 3 490 1 154 31 723
Reinsurance ceded to external parties –3 571 –1 870 –780 –158 –6 379net premiums written 12 407 9 231 2 710 996 0 0 25 344
2013 USD millions
property & Casualty Reinsurance
life & health Reinsurance
Corporate Solutions Admin Re® Group items Consolidation Total
Gross premiums written, thereof:Direct 643 2 870 973 4 486Reinsurance 17 243 10 458 557 190 28 448Intra-group transactions (assumed) 328 254 549 –1 131 0
Gross premiums written 17 571 11 355 3 976 1 163 –1 131 32 934Intra-group transactions (ceded) –549 –328 –254 1 131 0
Gross premiums written before retrocession to external parties 17 022 11 355 3 648 909 32 934
Reinsurance ceded to external parties –865 –1 383 –169 –39 –2 456net premiums written 16 157 9 972 3 479 870 0 0 30 478
Swiss Re 2013 Financial Report 189
FinanciaL STaTeMenTS | NOTeS TO The GROUp FINANCIAl STATemeNTS

10 Earnings per share
All of the Groupʼs companies prepare statutory financial statements based on local laws and regulations. Most jurisdictions require reinsurers to maintain a minimum amount of capital in excess of statutory definition of net assets or maintain certain minimum capital and surplus levels. In addition, some jurisdictions place certain restrictions on amounts that may be loaned or transferred to the parent company. The Groupʼs ability to pay dividends may be restricted by these requirements.
Dividends are declared in Swiss francs. During the years ended 31 December 2012 and 2013, the Groupʼs regular dividends declared per share were CHF 3.00 and CHF 3.50 respectively, as well as an additional special dividend of CHF 4.00 for the 2012 financial year paid in 2013. All dividends were paid in the form of withholding tax exempt repayment of legal reserves from capital contributions.
Earnings per share for the years ended 31 December were as follows:
USD millions (except share data) 2012 2013
Basic earnings per shareNet income 4 398 4 513Non-controlling interests –141 –2Interest on contingent capital instruments1 –56 –67Net income attributable to common shareholders 4 201 4 444Attribution of value to option on redeemable non-controlling interest –132Net income attributable to common shareholders after adjustment to non-controlling interest 4 069 4 444Weighted average common shares outstanding 343 380 921 342 764 609Net income per share in USD 11.85 12.97Net income per share in CHF2 11.13 12.04
Effect of dilutive securitiesChange in income available to common shares due to contingent capital instruments1 54 69Change in average number of shares due to contingent capital instruments 28 617 588 35 745 192Change in average number of shares due to employee options 720 579 1 094 715
Diluted earnings per shareNet income assuming debt conversion and exercise of options 4 123 4 513Weighted average common shares outstanding 372 719 088 379 604 516Net income per share in USD 11.06 11.89Net income per share in CHF2 10.39 11.04
1 Please refer to Note 6 “Debt and contingent capital instruments”.2 The translation from USD to CHF is shown for informational purposes only and has been calculated using the Group’s average exchange rates.
190 Swiss Re 2013 Financial Report
FiNaNCial StatEmENtS | NoTES To THE GRoUP FINANCIAl STATEMENTS

11 Income taxes
The Group is generally subject to corporate income taxes based on the taxable net income in various jurisdictions in which the Group operates. The components of the income tax charge were:
tax rate reconciliationThe following table reconciles the expected tax expense at the Swiss statutory tax rate to the actual tax expense in the accompanying income statement:
For 2013, the Group reported a tax expense of USD 312 million. This represents an effective tax rate of 6.5%, compared to an effective tax rate of 20.4% in the prior year. The lower tax rate in the current year is primarily due to lower taxes on the geographical mix of earnings, non-taxable income in Switzerland and the release of uncertain tax liabilities upon effective settlements with local tax authorities.
USD millions 2012 2013
Current taxes 472 641Deferred taxes 653 –329income tax expense 1 125 312
USD millions 2012 2013
Income tax at the Swiss statutory tax rate of 21.0% 1 160 1 013Increase (decrease) in the income tax charge resulting from:
Foreign income taxed at different rates 150 61Impact of foreign exchange movements –2 –8Tax exempt income/dividends received deduction –61 –164Change in valuation allowance –274 –257Tax effects of losses not recognised 73Basis differences in subsidiaries –74 –152Change in statutory tax rates –44 2Change in liability for unrecognised tax benefits including interest and penalties 146 –144other, net 51 –39
total 1 125 312
Swiss Re 2013 Financial Report 191
FiNaNCial StatEmENtS | NoTES To THE GRoUP FINANCIAl STATEMENTS

Deferred and other non-current taxesThe components of deferred and other non-current taxes were as follows:
As of 31 December 2013, the aggregate amount of temporary differences associated with investment in subsidiaries, branches and associates and interests in joint ventures, for which deferred tax liabilities have not been recognised amount to approximately USD 3.9 billion. In the remote scenario in which these temporary differences were to reverse simultaneously, the resulting tax liabilities would be very limited due to participation exemption rules.
As of 31 December 2013, the Group had USD 11 172 million net operating tax loss carryforwards, expiring as follows: USD 70 million in 2017, USD 152 million in 2018, USD 6 380 million in 2019 and beyond and USD 4 570 million never expire.
The Group also had capital loss carryforwards of USD 677 million, expiring as follows: USD 1 million in 2016 and USD 676 million never expire.
Net operating tax losses of USD 2 076 million and net capital tax losses of USD 24 million were utilised during the period ended 31 December 2013.
Income taxes paid in 2012 and 2013 were USD 123 million and USD 447 million, respectively.
USD millions 2012 2013
Deferred tax assetsIncome accrued/deferred 480 503Technical provisions 541 762Pension provisions 355 206Benefit on loss carryforwards 3 748 3 648Currency translation adjustments 514 540other 1 239 1 039Gross deferred tax asset 6 877 6 698
Valuation allowance –1 159 –935total deferred tax assets 5 718 5 763
Deferred tax liabilitiesPresent value of future profits –752 –727Income accrued/deferred –598 –642Bond amortisation –188 –206Deferred acquisition costs –680 –721Technical provisions –2 559 –2 845Unrealised gains on investments –1 487 –589Untaxed realised gains –557 –524Foreign exchange provisions –301 –132other –826 –705total deferred tax liabilities –7 948 –7 091
liability for unrecognised tax benefits including interest and penalties –1 494 –1 151
total deferred and other non-current tax liabilities –9 442 –8 242
Net deferred and other non-current taxes –3 724 –2 479
192 Swiss Re 2013 Financial Report
FiNaNCial StatEmENtS | NoTES To THE GRoUP FINANCIAl STATEMENTS

Unrecognised tax benefitsA reconciliation of the opening and closing amount of gross unrecognised tax benefits (excluding interest and penalties) is as follows:
The amount of gross unrecognised tax benefits within the tabular reconciliation that, if recognised, would affect the effective tax rate were approximately USD 871 million and USD 778 million at 31 December 2012 and 31 December 2013, respectively.
Interest and penalties related to unrecognised tax benefits are recorded in income tax expense. Such expense for the period ending 31 December 2013 was USD 128 million (USD 56 million for the period ending 31 December 2012). As of 31 December 2012 and 31 December 2013, USD 266 million and USD 138 million, respectively, were accrued for the payment of interest (net of tax benefits) and penalties. The accrued interest balance as of 31 December 2013 is included within the deferred and other non-current taxes section reflected above and in the balance sheet.
The balance of gross unrecognised tax benefits as of 31 December 2013 presented in the table above is less than the liability for unrecognised tax benefits reflected in the deferred and other non-current taxes section due to the exclusion of interest expense (USD 138 million).
During the year, certain tax positions and audits in Switzerland and Germany were effectively settled.
The Group continually evaluates proposed adjustments by taxing authorities. The Group believes that it is reasonably possible (more than remote and less than likely) that the balance of unrecognised tax benefits could increase or decrease over the next 12 months due to settlements or expiration of statutes. However, quantification of an estimated range cannot be made at this time.
The following table summarises jurisdictions and tax years that remain subject to examination:
USD millions 2012 2013
Balance as of 1 January 1 047 1 228Additions based on tax positions related to current year 246 88Additions based on tax positions related to prior years 91 158Reductions for tax positions of prior years –163 –392Settlements –8 –90other (including foreign currency translation) 15 21Balance as of 31 December 1 228 1 013
Australia 2009–2013 Korea 2009–2013Belgium 2010–2013 luxembourg 2008–2013Brazil 2008–2013 Malaysia 1996–2013Canada 2008–2013 Mexico 2008–2013China 2003–2013 Netherlands 2010–2013Denmark 2009–2013 New Zealand 2008–2013France 2008–2013 Singapore 2008–2013Germany 2007–2013 Slovakia 2009–2013Hong Kong 2007–2013 South Africa 2004, 2009–2013India 2005–2013 Spain 2009–2013Ireland 2010–2013 Switzerland 2009–2013Israel 2008–2013 United Kingdom 2008, 2011–2013Italy 2009–2013 United States 2009–2013Japan 2009–2013
Swiss Re 2013 Financial Report 193
FiNaNCial StatEmENtS | NoTES To THE GRoUP FINANCIAl STATEMENTS
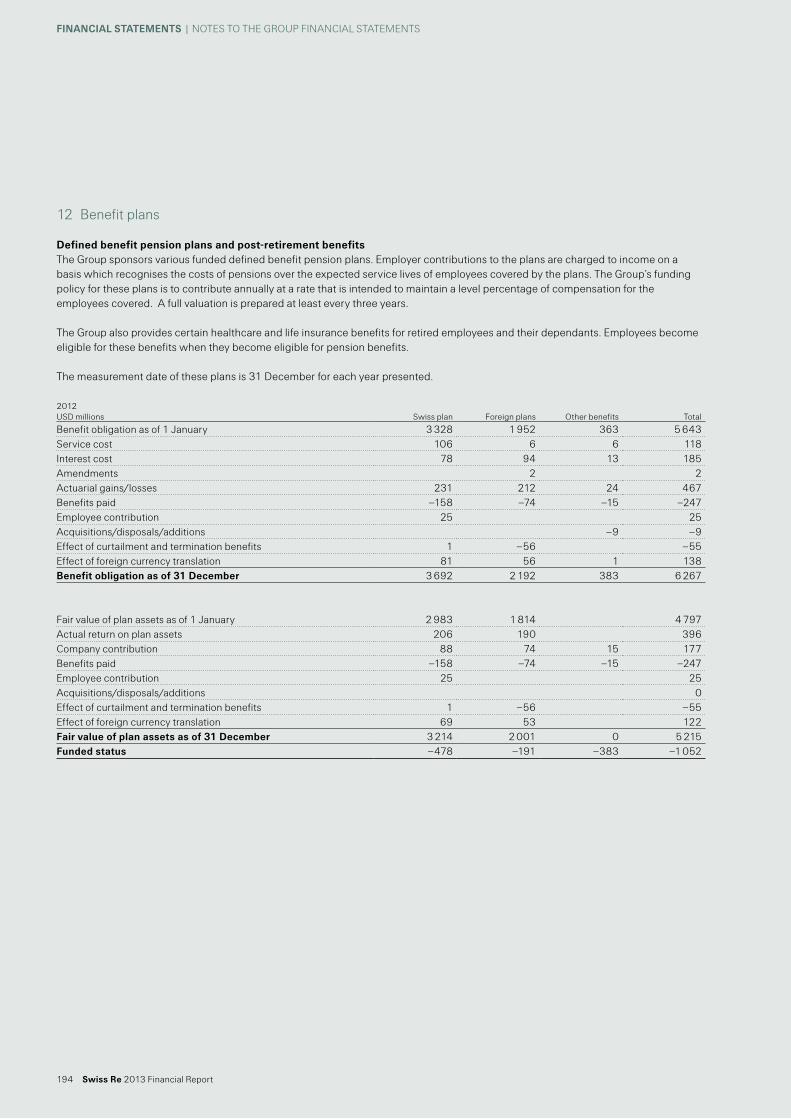
12 Benefit plans
Defined benefit pension plans and post-retirement benefitsThe Group sponsors various funded defined benefit pension plans. Employer contributions to the plans are charged to income on a basis which recognises the costs of pensions over the expected service lives of employees covered by the plans. The Group’s funding policy for these plans is to contribute annually at a rate that is intended to maintain a level percentage of compensation for the employees covered. A full valuation is prepared at least every three years.
The Group also provides certain healthcare and life insurance benefits for retired employees and their dependants. Employees become eligible for these benefits when they become eligible for pension benefits.
The measurement date of these plans is 31 December for each year presented.
2012 USD millions Swiss plan Foreign plans other benefits Total
Benefit obligation as of 1 January 3 328 1 952 363 5 643Service cost 106 6 6 118Interest cost 78 94 13 185Amendments 2 2Actuarial gains/losses 231 212 24 467Benefits paid –158 –74 –15 –247Employee contribution 25 25Acquisitions/disposals/additions –9 –9Effect of curtailment and termination benefits 1 –56 –55Effect of foreign currency translation 81 56 1 138Benefit obligation as of 31 December 3 692 2 192 383 6 267
Fair value of plan assets as of 1 January 2 983 1 814 4 797Actual return on plan assets 206 190 396Company contribution 88 74 15 177Benefits paid –158 –74 –15 –247Employee contribution 25 25Acquisitions/disposals/additions 0Effect of curtailment and termination benefits 1 –56 –55Effect of foreign currency translation 69 53 122Fair value of plan assets as of 31 December 3 214 2 001 0 5 215Funded status –478 –191 –383 –1 052
194 Swiss Re 2013 Financial Report
FiNaNCial StatEmENtS | NoTES To THE GRoUP FINANCIAl STATEMENTS

Amounts recognised in the balance sheet, as of 31 December were as follows:
2013 USD millions Swiss plan Foreign plans other benefits Total
Benefit obligation as of 1 January 3 692 2 192 383 6 267Service cost 118 7 6 131Interest cost 72 87 11 170Amendments 0Actuarial gains/losses –338 57 –47 –328Benefits paid –137 –73 –15 –225Employee contribution 26 26Acquisitions/disposals/additions 0Effect of curtailment and termination benefits 1 1Effect of foreign currency translation 97 35 3 135Benefit obligation as of 31 December 3 531 2 305 341 6 177
Fair value of plan assets as of 1 January 3 214 2 001 5 215Actual return on plan assets 221 141 362Company contribution 227 143 15 385Benefits paid –137 –74 –15 –226Employee contribution 26 26Acquisitions/disposals/additions 0Effect of curtailment and termination benefits 1 1Effect of foreign currency translation 109 34 143Fair value of plan assets as of 31 December 3 661 2 245 0 5 906Funded status 130 –60 –341 –271
2012 USD millions Swiss plan Foreign plans other benefits Total
Non-current assets 51 51Current liabilities –3 –16 –19Non-current liabilities –478 –239 –367 –1 084Net amount recognised –478 –191 –383 –1 052
2013 USD millions Swiss plan Foreign plans other benefits Total
Non-current assets 130 49 179Current liabilities –2 –16 –18Non-current liabilities –107 –325 –432Net amount recognised 130 –60 –341 –271
Swiss Re 2013 Financial Report 195
FiNaNCial StatEmENtS | NoTES To THE GRoUP FINANCIAl STATEMENTS

Amounts recognised in accumulated other comprehensive income, gross of tax, as of 31 December were as follows:
Components of net periodic benefit costThe components of pension and post-retirement cost for the years ended 31 December, were as follows:
2012 USD millions Swiss plan Foreign plans other benefits Total
Net gain/loss 1 034 379 –67 1 346Prior service cost/credit –1 2 –100 –99total 1 033 381 –167 1 247
2013 USD millions Swiss plan Foreign plans other benefits Total
Net gain/loss 521 385 –109 797Prior service cost/credit –2 2 –88 –88total 519 387 –197 709
2012 USD millions Swiss plan Foreign plans other benefits Total
Service cost (net of participant contributions) 106 6 6 118Interest cost 78 94 13 185Expected return on assets –100 –98 –198Amortisation of: Net gain/loss 42 12 –9 45 Prior service cost –11 –11Effect of settlement, curtailment and termination 1 10 11Net periodic benefit cost 127 24 –1 150
2013 USD millions Swiss plan Foreign plans other benefits Total
Service cost (net of participant contributions) 118 7 6 131Interest cost 72 87 11 170Expected return on assets –102 –99 –201Amortisation of: Net gain/loss 57 18 –6 69 Prior service cost –10 –10Effect of settlement, curtailment and termination 1 1Net periodic benefit cost 146 13 1 160
196 Swiss Re 2013 Financial Report
FiNaNCial StatEmENtS | NoTES To THE GRoUP FINANCIAl STATEMENTS

other changes in plan assets and benefit obligations recognised in other comprehensive income for the years ended 31 December were as follows:
The estimated net loss and prior service cost for the defined benefit pension plans that will be amortised from accumulated other comprehensive income into net periodic benefit cost in 2014 are USD 61 million and USD 1 million, respectively. The estimated net gain and prior service credit for the other defined post-retirement benefits that will be amortised from accumulated other comprehensive income into net periodic benefit cost in 2014 are USD 11 million and USD 11 million, respectively.
The accumulated benefit obligation (the current value of accrued benefits excluding future salary increases) for pension benefits was USD 5 767 million and USD 5 735 million as of 31 December 2012 and 2013, respectively.
Pension plans with an accumulated benefit obligation in excess of plan assets as of 31 December were as follows:
2012 USD millions Swiss plan Foreign plans other benefits Total
Net gain/loss 125 120 24 269Prior service cost/credit 2 2Amortisation of: Net gain/loss –42 –12 9 –45 Prior service cost 11 11Effect of settlement, curtailment and termination –10 –10Exchange rate gain/loss recognised during the year 11 11total recognised in other comprehensive income, gross of tax 83 111 44 238total recognised in net periodic benefit cost and other comprehensive income, gross of tax 210 135 43 388
2013 USD millions Swiss plan Foreign plans other benefits Total
Net gain/loss –457 15 –46 –488Prior service cost/credit 0Amortisation of: Net gain/loss –57 –18 6 –69 Prior service cost 10 10Effect of settlement, curtailment and termination 0Exchange rate gain/loss recognised during the year 10 10total recognised in other comprehensive income, gross of tax –514 7 –30 –537total recognised in net periodic benefit cost and other comprehensive income, gross of tax –368 20 –29 –377
USD millions 2012 2013
Projected benefit obligation 4 652 594Accumulated benefit obligation 4 584 593Fair value of plan assets 3 938 490
Swiss Re 2013 Financial Report 197
FiNaNCial StatEmENtS | NoTES To THE GRoUP FINANCIAl STATEMENTS

Principal actuarial assumptions
The expected long-term rates of return on plan assets are based on long-term expected inflation, interest rates, risk premiums and targeted asset category allocations. The estimates take into consideration historical asset category returns.
Assumed healthcare cost trend rates have a significant effect on the amounts reported for the healthcare plans. A one percentage point change in assumed healthcare cost trend rates would have had the following effects for 2013:
Swiss plan Foreign plans weighted average other benefits weighted average
2012 2013 2012 2013 2012 2013
assumptions used to determine obligations at the end of the yearDiscount rate 2.0% 2.3% 4.2% 4.4% 3.1% 3.5%Rate of compensation increase 2.3% 2.3% 3.2% 3.4% 3.4% 2.1%
assumptions used to determine net periodic pension costs for the year endedDiscount rate 2.4% 2.0% 4.9% 4.2% 3.5% 3.1%Expected long-term return on plan assets 3.3% 3.3% 5.3% 5.1%Rate of compensation increase 2.3% 2.3% 2.2% 3.2% 3.9% 3.4%
assumed medical trend rates at year endMedical trend – initial rate 6.2% 6.0%Medical trend – ultimate rate 4.5% 4.5%Year that the rate reaches the ultimate trend rate 2019 2018
USD millions1 percentage point
increase1 percentage point
decrease
Effect on total of service and interest cost components 1 –1Effect on post-retirement benefit obligation 23 –21
198 Swiss Re 2013 Financial Report
FiNaNCial StatEmENtS | NoTES To THE GRoUP FINANCIAl STATEMENTS

Plan asset allocation by asset categoryThe actual asset allocation by major asset category for defined benefit pension plans as of the respective measurement dates in 2012 and 2013 was as follows:
Actual asset allocation is determined by a variety of current economic and market conditions and considers specific asset class risks.
Equity securities include Swiss Re common stock of USD 5 million (0.1% of total plan assets) and USD 7 million (0.1% of total plan assets) as of 31 December 2012 and 2013, respectively.
The Groupʼs pension plan investment strategy is to match the maturity profiles of the assets and liabilities in order to reduce the future volatility of pension expense and funding status of the plans. This involves balancing investment portfolios between equity and fixed income securities. Tactical allocation decisions that reflect this strategy are made on a quarterly basis.
assets measured at fair valueFor a description of the different fair value levels and valuation techniques see Note 3 “Fair value disclosures”.
Certain items reported as pension plan assets at fair value in the table below are not within the scope of Note 3, namely two positions: real estate and an insurance contract.
Real estate positions classified as level 1 and level 2 are exchange traded real estate funds where a market valuation is readily available. Real estate reported on level 3 is property owned by the pension funds. These positions are accounted for at the capitalised income value. The capitalisation based on sustainable recoverable earnings is conducted at interest rates that are determined individually for each property, based on the property's location, age and condition. If properties are intended for disposal, the estimated selling costs and taxes are recognised in provisions. Sales gains or losses are allocated to income from real estate when the contract is concluded.
The fair value of the insurance contract is based on the fair value of the assets backing the contract.
other assets classified within level 3 mainly consist of private equity investments valued with the same methodology as mentioned in Note 3.
Swiss plan allocation Foreign plans allocation
2012 2013 target allocation 2012 2013 target allocation
asset categoryEquity securities 27% 27% 25% 37% 36% 34%Debt securities 45% 41% 48% 55% 59% 61%Real estate 19% 19% 21% 1% 1% 2%other 9% 13% 6% 7% 4% 3%total 100% 100% 100% 100% 100% 100%
Swiss Re 2013 Financial Report 199
FiNaNCial StatEmENtS | NoTES To THE GRoUP FINANCIAl STATEMENTS

As of 31 December, the fair values of pension plan assets by level of input were as follows:
2012 USD millions
Quoted prices in active markets for
identical assets (level 1)
Significant other observable inputs
(level 2)
Significant unobservable
inputs (level 3) Total
assetsFixed income securities: 2 626 2 626
Debt securities issued by the US government and government agencies 62 62Debt securities issued by non-US governments and government agencies 1 031 1 031Corporate debt securities 1 474 1 474Residential mortgage-backed securities 49 49Commercial mortgage-backed securities 5 5other asset-backed securities 5 5
Equity securities:Equity securities held for proprietary investment purposes 866 735 1 601
Derivative financial instruments 3 3Real estate 50 20 572 642other assets 48 125 173total assets at fair value 919 3 429 697 5 045Cash 170 170total plan assets 1 089 3 429 697 5 215
2013 USD millions
Quoted prices in active markets for
identical assets (level 1)
Significant other observable inputs
(level 2)
Significant unobservable
inputs (level 3) Total
assetsFixed income securities: 2 838 2 838
Debt securities issued by the US government and government agencies 136 136Debt securities issued by non-US governments and government agencies 1 028 1 028Corporate debt securities 1 647 1 647Residential mortgage-backed securities 21 21Commercial mortgage-backed securities 1 1other asset-backed securities 5 5
Equity securities:Equity securities held for proprietary investment purposes 1 030 801 1 831
Derivative financial instruments 16 16Real estate 54 17 631 702other assets 136 58 132 326total assets at fair value 1 236 3 714 763 5 713Cash 193 193total plan assets 1 429 3 714 763 5 906
200 Swiss Re 2013 Financial Report
FiNaNCial StatEmENtS | NoTES To THE GRoUP FINANCIAl STATEMENTS

assets measured at fair value using significant unobservable inputs (level 3)For the years ended 31 December, the reconciliation of fair value of pension plan assets using significant unobservable inputs were as follows:
Expected contributions and estimated future benefit paymentsThe employer contributions expected to be made in 2014 to the defined benefit pension plans are USD 195 million and to the post-retirement benefit plan are USD 16 million.
As of 31 December 2013, the projected benefit payments, which reflect expected future service, not adjusted for transfers in and for employees’ voluntary contributions, are as follows:
Defined contribution pension plansThe Group sponsors a number of defined contribution plans to which employees and the Group make contributions. The accumulated balances are paid as a lump sum at the earlier of retirement, termination, disability or death. The amount expensed in 2012 and in 2013 was USD 71 million and USD 74 million, respectively.
2012 USD millions Real estate other assets Total
Balance as of 1 January 549 119 668Realised/unrealised gains/losses:
Relating to assets still held at the reporting date 1 –13 –12Relating to assets sold during the period 3 3
Purchases, issuances and settlements 10 15 25Transfers in and/or out of level 3 0Impact of foreign exchange movements 12 1 13Closing balance as of 31 December 572 125 697
2013 USD millions Real estate other assets Total
Balance as of 1 January 572 125 697Realised/unrealised gains/losses:
Relating to assets still held at the reporting date 31 1 32Relating to assets sold during the period 4 4
Purchases, issuances and settlements 11 –1 10Transfers in and/or out of level 3 0Impact of foreign exchange movements 17 3 20Closing balance as of 31 December 631 132 763
USD millions Swiss plan Foreign plans other benefits Total
2014 216 75 16 3072015 210 79 17 3062016 210 83 18 3112017 208 86 19 3132018 206 89 20 315Years 2019–2023 982 486 107 1575
Swiss Re 2013 Financial Report 201
FiNaNCial StatEmENtS | NoTES To THE GRoUP FINANCIAl STATEMENTS

13 Share-based payments
As of 31 December 2012 and 2013, the Group had the share-based compensation plans as described below.
Total compensation cost for share-based compensation plans recognised in net income was USD 69 million and USD 126 million in 2012 and 2013, respectively. The related tax benefit was USD 17 million and USD 28 million, respectively.
Stock option plansStock option plans include a fixed-option plan and an additional grant to certain members of executive management. No options were granted under these plans from 2007 onwards. Under the fixed-option plan, the exercise price of each option is equal to the market price of the shares on the date of the grant. options issued vest at the end of the fourth year and have a maximum life of ten years.
A summary of the activity of the Group’s stock option plans is as follows:
The weighted remaining contractual life is 2.3 years and all stock options outstanding are also exercisable. The fair value of each option grant was estimated on the date of grant using a binomial option-pricing model. The underlying strike price for the outstanding option series has been adjusted for the special dividend payout in 2013.
Restricted sharesThe Group granted 38 930 and 10 458 restricted shares to selected employees in 2012 and 2013, respectively. Moreover, as an alternative to the Group's cash bonus programme, 275 309 and 295 535 shares were delivered during 2012 and 2013, respectively, which are not subject to forfeiture risk.
A summary of the movements in shares relating to outstanding awards granted under the restricted share plans for the year ended 31 December 2013 is as follows:
The weighted average fair value of restricted shares, which equals the market price of the shares on the date of the grant, was CHF 50 and CHF 67 in 2012 and 2013, respectively.
Board level Performance Share PlanIn 2010, the Group granted a share plan for the Chairman and one Vice Chairman of the Board of Directors. Since 2011 no more plan was granted. The plan has a requisite service period of three years and is settled in shares. The plan is measured based on Swiss Reʼs Total Shareholder Return (TSR), representing the share price performance plus paid dividend in any performance period, against a selected peer group. The final number of shares to be released upon vesting can vary between 0% and 150% of the original grant. The fair value of the 2010 plan was based on the share price as of the date of grant, which was CHF 53.60. The 2010 plan vested in 2013.
2013Weighted average
exercise price in CHF
Number of options
outstanding as of 1 January 72 958 902options sold 68 –713 772options forfeited or expired 76 –145 130Outstanding as of 31 December 89 100 000Exercisable as of 31 December 89 100 000
Weighted average grant date fair value in CHF Number of shares
Non-vested at 1 January 50 486 372Granted 76 305 993Delivery of restricted shares 46 –256 302Forfeitures 59 –7 089Outstanding as of 31 December 67 528 974
202 Swiss Re 2013 Financial Report
FiNaNCial StatEmENtS | NoTES To THE GRoUP FINANCIAl STATEMENTS

long-term incentive PlanBetween 2006 and 2011, the Group annually granted a long-term Incentive plan (lTI) to selected employees with a three-year vesting period. The requisite service period as well as the maximum contractual term for each plan is three years and the final payment, if any, occurs at the end of this performance measurement period. The plans include a payout factor which was derived from Return on Equity (RoE) and Earnings per Share (EPS) targets over the vesting period. The payout ratio can vary between 0 and 2 and the final payment for each plan will depend on whether the performance targets have been achieved over the plan period. The fair values of the plans are based on stochastic models which consider the likelihood of achieving performance targets and the impact of dividends.
The 2010 lTI grant was settled in shares in March 2013. The payout factor was driven by average RoE and average EPS over the vesting period. The share price used for measurement is based on the date of grant and was CHF 48.15.
As of 31 December 2013 the 2011 lTI grant was outstanding. The plan is expected to be settled in shares in March 2014. The payout factor is driven by average RoE and average EPS over the vesting period. The unit grant date fair value was CHF 39.39.
For the year ended 31 December 2013, the outstanding units were as follows:
leadership Performance Plan During 2011 the Compensation Committee reviewed the existing long-term incentive scheme, and in March 2012, the lTI was replaced by a new plan called the leadership Performance Plan (lPP). The lPP plans are expected to be settled in shares, and the requisite service as well as the maximum contractual term are three years. At grant date the award is split equally into two underlying components - Restricted Share Units (RSU) and Performance Share Units (PSU). The RSU component is measured against a RoE performance condition and will vest within a range of 0–100%. The PSU is based on relative total shareholder return, measured against a pre-defined basket of peers and will vest within a range of 0–200%. The fair values of both components are measured separately, based on stochastic models.
The fair value assumptions included in the grant valuation are based on market estimates for dividends (and an additional special dividend of CHF 4.00 for the lPP 2013) and the risk free rate based on the average of the 5-year US government rate taken monthly over each annual period in the performance period. This resulted in risk free rates between 1.0% and 2.3% for lPP 2012 and lPP 2013.
For the lPP 2012, the grant date fair value of the RSU component is CHF 42.00 and of the PSU component CHF 35.60. For the lPP 2013, the grant date fair value of the RSU component is CHF 61.19 and of the PSU component CHF 52.59.
For the year ended 31 December 2013, the outstanding units were as follows:
lTI 2010 lTI 2011
Non-vested at 1 January 961 350 928 505Forfeitures –54 710Vested1 –961 350Outstanding as of 31 December 0 873 795
1 Refers to the number of units before the application of the payout factor
lPP 2012 lPP 2013RSU PSU RSU PSU
Non-vested at 1 January 482 775 569 180Granted 356 560 414 955Forfeitures –24 135 –28 460 –6 355 –7 390Outstanding as of 31 December 458 640 540 720 350 205 407 565
Swiss Re 2013 Financial Report 203
FiNaNCial StatEmENtS | NoTES To THE GRoUP FINANCIAl STATEMENTS

Unrecognised compensation costsAs of 31 December 2013, the total unrecognised compensation cost (net of forfeitures) related to non-vested, share-based compensation awards was USD 56 million and the weighted average period over which that cost is expected to be recognised is 1.8 years.
The number of shares authorised for the Group’s share-based payments to employees was 8 172 503 and 5 538 418 as of 31 December 2012 and 2013, respectively.
Employee Participation PlanThe Group’s Employee Participation Plan consists of a savings scheme lasting two or three years. Employees combine regular savings with the purchase of either actual or tracking options. The Group contributes to the employee savings over the period of the plan.
At maturity, either the employee receives shares or cash equal to the accumulated savings balance, or the employee may elect to exercise the options.
In 2012, 1 664 419 options were issued to employees. From 2013 onwards, the Employee Participation Plan was discontinued and no more options were issued. In 2012 and 2013, the Group contributed USD 41 million and USD 34 million, respectively, to the outstanding plans.
Global Share Participation Plan In June 2013 Swiss Re introduced the Global Share Participation Plan, which is a share purchase plan that was rolled out for the benefit of employees of companies within the Group. Swiss Re makes a financial contribution to participants in the Plan, by matching the commitment that they make during the plan cycle with additional Swiss Re shares.
If the employee is still employed by Swiss Re at the end of a plan cycle, the employee will receive an additional number of shares equal to 30% of the total number of purchased and dividend shares held at that time. In 2013, Swiss Re contributed USD 3 million to the plan and authorised 28 218 shares as of 31 December 2013.
204 Swiss Re 2013 Financial Report
FiNaNCial StatEmENtS | NoTES To THE GRoUP FINANCIAl STATEMENTS

14 Compensation, participations and loans of members of governing bodies
The disclosure requirements under Swiss Company law in respect of management compensation to the members of the Board of Directors and of the Executive Committee of the Group, as well as to closely related persons, are detailed on pages 246–251 of the Annual Report of Swiss Re ltd.
Swiss Re 2013 Financial Report 205
FiNaNCial StatEmENtS | NoTES To THE GRoUP FINANCIAl STATEMENTS
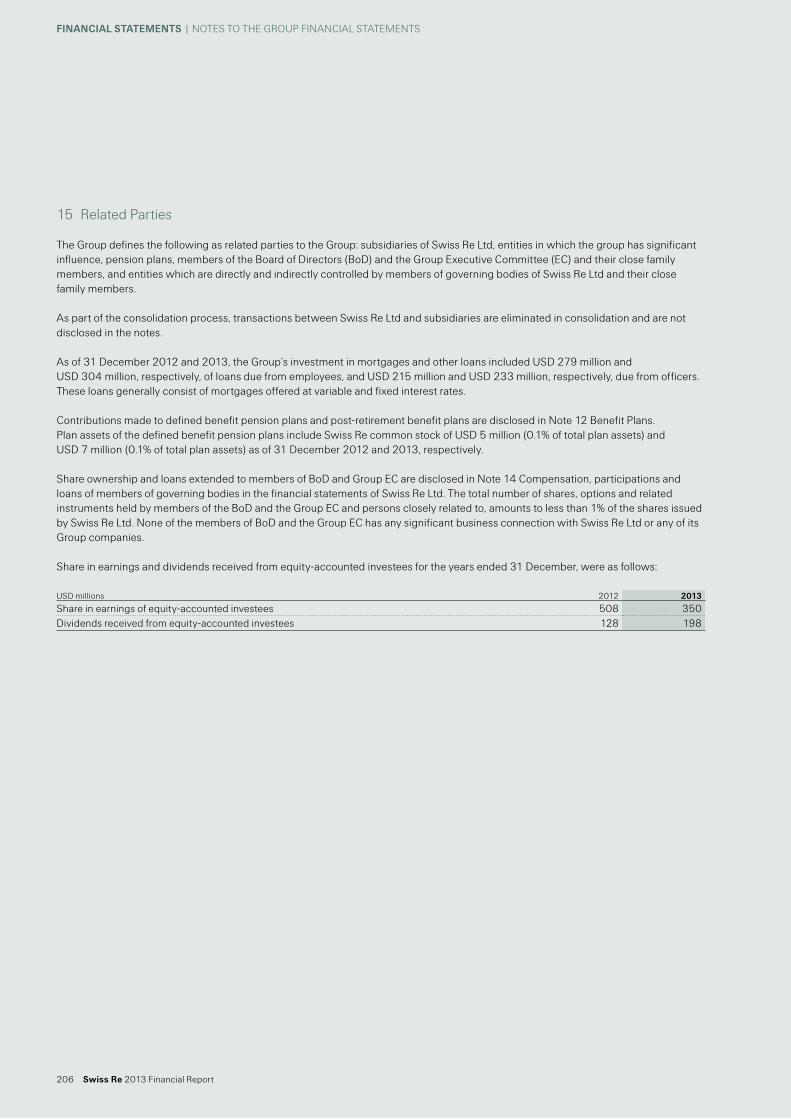
15 Related Parties
The Group defines the following as related parties to the Group: subsidiaries of Swiss Re ltd, entities in which the group has significant influence, pension plans, members of the Board of Directors (BoD) and the Group Executive Committee (EC) and their close family members, and entities which are directly and indirectly controlled by members of governing bodies of Swiss Re ltd and their close family members.
As part of the consolidation process, transactions between Swiss Re ltd and subsidiaries are eliminated in consolidation and are not disclosed in the notes.
As of 31 December 2012 and 2013, the Group’s investment in mortgages and other loans included USD 279 million and USD 304 million, respectively, of loans due from employees, and USD 215 million and USD 233 million, respectively, due from officers. These loans generally consist of mortgages offered at variable and fixed interest rates.
Contributions made to defined benefit pension plans and post-retirement benefit plans are disclosed in Note 12 Benefit Plans. Plan assets of the defined benefit pension plans include Swiss Re common stock of USD 5 million (0.1% of total plan assets) and USD 7 million (0.1% of total plan assets) as of 31 December 2012 and 2013, respectively.
Share ownership and loans extended to members of BoD and Group EC are disclosed in Note 14 Compensation, participations and loans of members of governing bodies in the financial statements of Swiss Re ltd. The total number of shares, options and related instruments held by members of the BoD and the Group EC and persons closely related to, amounts to less than 1% of the shares issued by Swiss Re ltd. None of the members of BoD and the Group EC has any significant business connection with Swiss Re ltd or any of its Group companies.
Share in earnings and dividends received from equity-accounted investees for the years ended 31 December, were as follows:
USD millions 2012 2013
Share in earnings of equity-accounted investees 508 350Dividends received from equity-accounted investees 128 198
206 Swiss Re 2013 Financial Report
FiNaNCial StatEmENtS | NoTES To THE GRoUP FINANCIAl STATEMENTS

16 Commitments and contingent liabilities
Leasing commitmentsAs part of its normal business operations, the Group enters into a number of lease agreements. Such agreements, which are operating leases, total the following obligations for the next five years and thereafter:
The following schedule shows the composition of total rental expenses for all operating leases as of 31 December (except those with terms of a month or less that were not renewed):
Other commitmentsAs a participant in limited and other investment partnerships, the Group commits itself to making available certain amounts of investment funding, callable by the partnerships for periods of up to 10 years. The total commitments remaining uncalled as of 31 December 2013 were USD 3 359 million.
The Group enters into a number of contracts in the ordinary course of reinsurance and financial services business which, if the Group’s credit rating and/or defined statutory measures decline to certain levels, would require the Group to post collateral or obtain guarantees. The contracts typically provide alternatives for recapture of the associated business.
Legal proceedingsIn the normal course of business operations, the Group is involved in various claims, lawsuits and regulatory matters. In the opinion of management, the disposition of these matters is not expected to have a material adverse effect on the Group’s business, consolidated financial position or results of operations.
As of 31 December 2013 USD millions
2014 822015 772016 722017 662018 54After 2018 319Total operating lease commitments 670Less minimum non-cancellable sublease rentals –51Total net future minimum lease commitments 619
USD millions 2012 2013
Minimum rentals 61 64Sublease rental income –2 –1Total 59 63
Swiss Re 2013 Financial Report 207
FinanciaL STaTemenTS | NoTeS To The GRoUp FINANCIAL STATeMeNTS

This page intentionally left blank
208 Swiss Re 2013 Financial Report
FinanciaL STaTemenTS | NoTeS To The GRoUp FINANCIAL STATeMeNTS

17 Information on business segments
The Group provides reinsurance and insurance throughout the world through its business segments. The business segments are determined by the organisational structure and by the way in which management reviews the operating performance of the Group.
The Group presents four core operating business segments: property & Casualty Reinsurance, Life & health Reinsurance, Corporate Solutions and Admin Re®. The presentation of each segment’s balance sheet is closely aligned to the segment legal entity structure. The assignment of assets and liabilities for entities that span more than one segment are determined by considering local statutory requirements, legal and other constraints, the economic view of duration and currency requirements of the reinsurance business written, and the capacity of the segments to absorb risks. Interest expense is incurred from the segment’s capital funding position. The tax position of the operating segments is derived from legal entity tax obligations, subject to Group tax considerations.
Accounting policies applied by the business segments are in line with those described in the summary of significant accounting policies (please refer to Note 1 to the Group’s annual consolidated financial statements).
The Group operating segments are outlined below.
Property & casualty Reinsurance and Life & Health ReinsuranceReinsurance consists of two segments, property & Casualty and Life & health. The Reinsurance Business Unit operates globally, both through brokers and directly with clients, and provides a large range of solutions for risk and capital management. Clients include insurance companies and mutual as well as public sector and governmental entities. In addition to traditional reinsurance solutions, the Business Unit offers insurance-linked securities and other insurance-related capital market products in both property & Casualty and Life & health.
property & Casualty includes the business lines property, casualty including motor, and specialty. Life & health includes the life and health sub-segments.
corporate SolutionsCorporate Solutions offers innovative insurance capacity to mid-sized and large multinational corporations across the globe. offerings range from standard risk transfer covers and multi-line programmes, to customised solutions tailored to the needs of clients. Corporate Solutions serves customers from over 40 offices worldwide.
admin Re®Through Admin Re®, Swiss Re acquires closed blocks of in-force life and health insurance business, either through reinsurance or corporate acquisition, and typically assumes responsibility for administering the underlying policies. The administration of the business may be managed directly or, where appropriate, in partnership with a third party. Since 1998, Swiss Re has acquired more than 50 blocks of business spanning a range of product types. It currently operates in the UK, US and the Netherlands.
Group itemsItems not allocated to the business segments are included in the “Group items” column, which encompasses Swiss Re Ltd, the Group holding company, the former Legacy business in run-off, principal Investments and certain Treasury units. The holding company charges trademark licence fees to the operating segments which are reported as other revenues. Certain administrative expenses of the corporate centre functions that are not recharged to the operating segments are reported as Group items.
consolidationSegment information is presented net of external and internal retrocession and other intra-group arrangements. The Group total is obtained after elimination of intra-group transactions in the “Consolidation” column. This includes significant intra-group reinsurance arrangements, recharge of trademark licence fees, and intersegmental funding.
Swiss Re 2013 Financial Report 209
FinanciaL STaTemenTS | NoTeS To The GRoUp FINANCIAL STATeMeNTS

a) Business segments – income statementFor the year ended 31 December
2012 USD millions
property & Casualty Reinsurance
Life & health Reinsurance
Corporate Solutions Admin Re® Group items Consolidation Total
Revenuespremiums earned 12 329 9 050 2 284 992 6 24 661Fee income from policyholders 72 713 785Net investment income – non-participating 1 451 1 365 109 1 548 18 –18 4 473Net realised investment gains/losses – non-participating 259 562 142 –89 73 947Net investment result – unit-linked and with-profit 222 2 348 2 570other revenues 95 1 1 3 385 –297 188Total revenues 14 134 11 272 2 536 5 515 482 –315 33 624
expensesClaims and claim adjustment expenses –6 306 –1 448 –14 5 –7 763Life and health benefits –6 787 –2 086 –5 –8 878Return credited to policyholders –271 –2 688 –2 959Acquisition costs –2 316 –1 787 –300 –142 –3 –4 548other expenses –1 325 –833 –449 –457 –403 250 –3 217Interest expenses –111 –586 –53 –51 65 –736Total expenses –10 058 –10 264 –2 197 –5 426 –471 315 –28 101
income before income tax expense 4 076 1 008 339 89 11 0 5 523Income tax expense/benefit –934 –231 –143 101 82 –1 125net income before attribution of non-controlling interests 3 142 777 196 190 93 0 4 398
Income attributable to non-controlling interests –134 –7 –141net income after attribution of non-controlling interests 3 008 777 196 183 93 0 4 257
Interest on contingent capital instruments –18 –38 –56net income attributable to common shareholders 2 990 739 196 183 93 0 4 201
Claims ratio in % 51.2 63.4 53.1expense ratio in % 29.5 32.8 30.0Combined ratio in % 80.7 96.2 83.1Management expense ratio in % 7.9operating margin in % 8.6
210 Swiss Re 2013 Financial Report
FinanciaL STaTemenTS | NoTeS To The GRoUp FINANCIAL STATeMeNTS

Business segments – income statementFor the year ended 31 December
2013 USD millions
property & Casualty Reinsurance
Life & health Reinsurance
Corporate Solutions Admin Re® Group items Consolidation Total
Revenuespremiums earned 14 542 9 967 2 922 844 1 28 276Fee income from policyholders 56 486 542Net investment income – non-participating 1 098 1 442 98 1 180 150 –21 3 947Net realised investment gains/losses – non-participating 184 269 150 201 –38 766Net investment result – unit-linked and with-profit 249 3 098 3 347other revenues 61 2 1 307 –347 24Total revenues 15 885 11 983 3 172 5 810 420 –368 36 902
expensesClaims and claim adjustment expenses –7 884 –1 773 2 –9 655Life and health benefits –8 075 –1 506 –9 581Return credited to policyholders –286 –3 392 –3 678Acquisition costs –2 761 –1 698 –406 –30 –4 895other expenses –1 472 –946 –601 –441 –356 308 –3 508Interest expenses –207 –544 –1 –46 –22 60 –760Total expenses –12 324 –11 549 –2 781 –5 415 –376 368 –32 077
income/loss before income tax expense 3 561 434 391 395 44 0 4 825Income tax expense/benefit –249 –30 –111 28 50 –312net income/loss before attribution of non-controlling interests 3 312 404 280 423 94 0 4 513
Income attributable to non-controlling interests –1 –1 –2net income/loss after attribution of non-controlling interests 3 311 404 279 423 94 0 4 511
Interest on contingent capital instruments –19 –48 –67net income/loss attributable to common shareholders 3 292 356 279 423 94 0 4 444
Claims ratio in % 54.2 60.6 55.3expense ratio in % 29.1 34.5 30.0Combined ratio in % 83.3 95.1 85.3Management expense ratio in % 8.3operating margin in % 5.2
Swiss Re 2013 Financial Report 211
FinanciaL STaTemenTS | NoTeS To The GRoUp FINANCIAL STATeMeNTS

Business segments – balance sheetAs of 31 December 2012
2012 USD millions
property & Casualty Reinsurance
Life & health Reinsurance
Corporate Solutions Admin Re® Group items Consolidation Total
assetsFixed income securities 31 115 31 366 4 616 21 608 143 88 848equity securities 2 360 303 578 3 530 3 774other investments 11 893 3 178 107 1 774 6 180 –7 088 16 044Short-term investments 10 005 5 053 1 549 1 557 481 18 645Investments for unit-linked and with-profit business 842 24 659 25 501Cash and cash equivalents 6 904 1 412 978 1 472 71 10 837Deferred acquisition costs 1 103 2 713 219 2 2 4 039Acquired present value of future profits 1 358 1 665 3 023Reinsurance recoverable 5 583 2 447 9 440 469 –7 830 10 109other reinsurance assets 12 419 8 631 2 901 3 459 3 –2 639 24 774Goodwill 2 018 2 057 17 4 092other1 10 059 4 554 927 1 165 132 –5 020 11 817Total assets 93 459 63 914 21 332 57 833 7 542 –22 577 221 503
LiabilitiesUnpaid claims and claim adjustment expenses 48 465 9 505 12 258 1 247 21 –7 826 63 670Liabilities for life and health policy benefits 17 439 216 18 469 –7 36 117policyholder account balances 1 466 27 883 29 349other reinsurance liabilities 12 543 1 709 4 913 713 8 –3 106 16 780Short-term debt 3 799 1 529 634 1 245 –3 595 3 612Long-term debt 3 779 12 461 46 16 286other1 12 503 11 466 903 2 225 2 562 –7 996 21 663Total liabilities 81 089 55 575 18 290 51 171 3 882 –22 530 187 477
Shareholders’ equity 12 356 8 339 3 032 6 662 3 660 –47 34 002
Non-controlling interests 14 10 24Total equity 12 370 8 339 3 042 6 662 3 660 –47 34 026
Total liabilities and equity 93 459 63 914 21 332 57 833 7 542 –22 577 221 503
1 The Group updated its balance sheet presentation of deferred tax assets and liabilities. Deferred tax assets and liabilities are presented on a gross basis as per the first quarter 2013. The comparative period has been adjusted accordingly and is consistent with the relevant income tax disclosure in the notes to the financial statements in the prior year.
212 Swiss Re 2013 Financial Report
FinanciaL STaTemenTS | NoTeS To The GRoUp FINANCIAL STATeMeNTS

Business segments – balance sheetAs of 31 December 2013
2013 USD millions
property & Casualty Reinsurance
Life & health Reinsurance
Corporate Solutions Admin Re® Group items Consolidation Total
assetsFixed income securities 24 986 29 588 4 644 20 014 64 79 296equity securities 4 017 1 333 981 1 360 7 691other investments 10 080 3 179 169 1 800 5 561 –5 905 14 884Short-term investments 13 297 4 113 1 595 1 474 510 20 989Investments for unit-linked and with-profit business 988 26 227 27 215Cash and cash equivalents 5 288 166 562 1 748 308 8 072Deferred acquisition costs 1 591 2 845 319 1 4 756Acquired present value of future profits 1 451 2 086 3 537Reinsurance recoverable 4 752 1 756 8 228 323 –6 732 8 327other reinsurance assets 11 457 9 286 2 422 3 475 3 –1 967 24 676Goodwill 2 057 2 035 17 4 109other 8 938 3 759 988 919 207 –4 843 9 968Total assets 86 463 60 499 19 925 58 067 8 013 –19 447 213 520
LiabilitiesUnpaid claims and claim adjustment expenses 45 578 9 869 11 549 1 205 15 –6 732 61 484Liabilities for life and health policy benefits 17 392 232 18 415 –6 36 033policyholder account balances 1 595 29 582 31 177other reinsurance liabilities 11 591 2 116 4 355 620 6 –2 433 16 255Short-term debt 798 3 730 646 1 285 –2 641 3 818Long-term debt 4 700 10 627 –605 14 722other 10 523 8 940 1 010 1 795 1 775 –6 989 17 054Total liabilities 73 190 54 269 17 146 52 263 3 081 –19 406 180 543
Shareholders’ equity 13 256 6 230 2 771 5 804 4 932 –41 32 952
Non-controlling interests 17 8 25Total equity 13 273 6 230 2 779 5 804 4 932 –41 32 977
Total liabilities and equity 86 463 60 499 19 925 58 067 8 013 –19 447 213 520
Swiss Re 2013 Financial Report 213
FinanciaL STaTemenTS | NoTeS To The GRoUp FINANCIAL STATeMeNTS

b) Property & casualty Reinsurance business segment – by line of businessFor the year ended 31 December
2012 USD millions property Casualty Specialty Total
Premiums earned 5 795 4 630 1 904 12 329
expensesClaims and claim adjustment expenses –2 832 –2 818 –656 –6 306Acquisition costs –781 –1 128 –407 –2 316other expenses –687 –406 –232 –1 325Total expenses before interest expenses –4 300 –4 352 –1 295 –9 947
Underwriting result 1 495 278 609 2 382
Net investment income 1 451Net realised investment gains/losses 259other revenues 95Interest expenses –111income before income tax expenses 4 076
Claims ratio in % 48.9 60.9 34.4 51.2expense ratio in % 25.3 33.1 33.6 29.5Combined ratio in % 74.2 94.0 68.0 80.7
214 Swiss Re 2013 Financial Report
FinanciaL STaTemenTS | NoTeS To The GRoUp FINANCIAL STATeMeNTS

Property & casualty Reinsurance business segment – by line of businessFor the year ended 31 December
2013 USD millions property Casualty Specialty Total
Premiums earned 6 945 5 366 2 231 14 542
expensesClaims and claim adjustment expenses –3 342 –3 563 –979 –7 884Acquisition costs –883 –1 408 –470 –2 761other expenses –764 –495 –213 –1 472Total expenses before interest expenses –4 989 –5 466 –1 662 –12 117
Underwriting result 1 956 –100 569 2 425
Net investment income 1 098Net realised investment gains/losses 184other revenues 61Interest expenses –207income before income tax expenses 3 561
Claims ratio in % 48.1 66.4 43.9 54.2expense ratio in % 23.7 35.5 30.6 29.1Combined ratio in % 71.8 101.9 74.5 83.3
Swiss Re 2013 Financial Report 215
FinanciaL STaTemenTS | NoTeS To The GRoUp FINANCIAL STATeMeNTS

c) Life & Health Reinsurance business segment – by line of business For the year ended 31 December
2012 USD millions Life health Total
Revenuespremiums earned 6 176 2 874 9 050Fee income from policyholders 72 72Net investment income – non-participating 899 466 1 365Net investment income – unit-linked and with-profit 32 32Net realised investment gains/losses – unit-linked and with-profit 190 190Net realised investment gains/losses – insurance-related derivatives –147 –147other revenues 1 1Total revenues before non-participating realised gains/losses 7 223 3 340 10 563
expensesLife and health benefits –4 625 –2 162 –6 787Return credited to policyholders –271 –271Acquisition costs –1 299 –488 –1 787other expenses –613 –220 –833Total expenses before interest expenses –6 808 –2 870 –9 678
Operating income 415 470 885
Net realised investment gains/losses – non-participating and excluding insurance-related derivatives 709Interest expenses –586income before income tax expenses 1 008
Management expense ratio in % 8.6 6.6 7.9operating margin1 in % 5.9 14.1 8.6
1 operating margin is calculated as operating income divided by total operating revenues. Total operating revenues are total revenues excluding unit-linked and with-profit revenues.
216 Swiss Re 2013 Financial Report
FinanciaL STaTemenTS | NoTeS To The GRoUp FINANCIAL STATeMeNTS

Life & Health Reinsurance business segment – by line of business For the year ended 31 December
2013 USD millions Life health Total
Revenuespremiums earned 6 678 3 289 9 967Fee income from policyholders 56 56Net investment income – non-participating 915 527 1 442Net investment income – unit-linked and with-profit 39 39Net realised investment gains/losses – unit-linked and with-profit 210 210Net realised investment gains/losses – insurance-related derivatives –123 6 –117other revenues 0Total revenues before non-participating realised gains/losses 7 775 3 822 11 597
expensesLife and health benefits –5 216 –2 859 –8 075Return credited to policyholders –286 –286Acquisition costs –1 207 –491 –1 698other expenses –685 –261 –946Total expenses before interest expenses –7 394 –3 611 –11 005
Operating income 381 211 592
Net realised investment gains/losses – non-participating and excluding insurance-related derivatives 386Interest expenses –544income before income tax expenses 434
Management expense ratio in % 9.0 6.8 8.3operating margin1 in % 5.1 5.5 5.2
1 operating margin is calculated as operating income divided by total operating revenues. Total operating revenues are total revenues excluding unit-linked and with-profit revenues.
Swiss Re 2013 Financial Report 217
FinanciaL STaTemenTS | NoTeS To The GRoUp FINANCIAL STATeMeNTS

d) net premiums earned and fee income from policyholders by geographyNet premiums earned and fee income from policyholders by regions for the years ended 31 December
Net premiums earned and fee income from policyholders by country for the years ended 31 December
Net premiums earned and fee income from policyholders are allocated by country based on the underlying contract.
USD millions 2012 2013
United States 7 493 9 084United Kingdom 3 316 3 466Australia 1 705 2 056China 1 880 2 045France 2 110 1 624Canada 1 196 1 379Germany 1 063 1 296Ireland 591 832Japan 714 764Italy 439 547Netherlands 448 457other 4 491 5 268Total 25 446 28 818
USD millions 2012 2013
Americas 9 579 11 468europe (including Middle east and Africa) 10 686 11 347Asia-pacific 5 181 6 003Total 25 446 28 818
218 Swiss Re 2013 Financial Report
FinanciaL STaTemenTS | NoTeS To The GRoUp FINANCIAL STATeMeNTS

This page intentionally left blank
Swiss Re 2013 Financial Report 219
FinanciaL STaTemenTS | NoTeS To The GRoUp FINANCIAL STATeMeNTS

18 Significant subsidiaries and equity investees
method of consolidationf fulle equityfv fair value1 Net asset value instead of share capital
Significant subsidiaries and equity investeesShare capital
(USD millions)Share capital
(ChF millions)Affiliation in % as of
31.12.2013Method of
consolidation
europe
BelgiumSwiss Re Treasury (Belgium) N.V., Brussels 0 0 100 f
DenmarkSwiss Re Denmark Services A/S, Copenhagen 0 0 100 f
GermanySwiss Re Germany AG, Unterföhring bei München 62 55 100 f
irelandSwiss Re International Treasury (Ireland) Ltd., Dublin 0 0 100 f
Liechtensteinelips Life AG, Vaduz 14 12 100 felips Versicherungen AG, Vaduz 6 5 100 f
LuxembourgSwiss Re europe holdings S.A., Luxembourg 145 129 100 fSwiss Re europe S.A., Luxembourg 482 429 100 fSwiss Re Finance (Luxembourg) S.A., Luxembourg 0 0 100 fSwiss Re Funds (Lux) I, Senningerberg1 8 547 7 600 100 fSwiss Re International Se, Luxembourg 251 223 100 f
maltaBodensee Limited, Sliema 1 136 1 010 49 fv
netherlandsAlgemene Levensherverzekering Maatschappij N.V., Amsterdam 1 1 100 f
Switzerlandeuropean Reinsurance Company of Zurich Ltd, Zurich 291 258 100 fSwiss Re Asset Management Geneva SA, Geneva 0 0 100 fSwiss Re Corporate Solutions Ltd, Zurich 119 106 100 fSwiss Re Direct Investments Company Ltd, Zurich 0 0 100 fSwiss Re Investments holding Company Ltd, Zurich 0 0 100 fSwiss Re Investments Company Ltd, Zurich 1 1 100 fSwiss Re Life Capital Ltd, Zurich 0 0 100 fSwiss Re principal Investments Company Ltd, Zurich 0 0 100 fSwiss Reinsurance Company Ltd, Zurich 32 29 100 f
220 Swiss Re 2013 Financial Report
FinanciaL STaTemenTS | NoTeS To The GRoUp FINANCIAL STATeMeNTS

Share capital (USD millions)
Share capital (ChF millions)
Affiliation in % as of 31.12.2013
Method of consolidation
United KingdomAdmin Re UK Limited, Shropshire 121 108 100 fReassure Limited, Shropshire 435 387 100 fSwiss Re Capital Markets Limited, London 60 53 100 fSwiss Re GB Limited, London 0 0 100 fSwiss Re Investment Management Limited, London 0 0 100 fSwiss Re Services Limited, London 4 3 100 fSwiss Re Specialised Investments holdings (UK) Limited, London 2 1 100 fSwiss Re Specialty Insurance (UK) Limited, London 30 27 100 fThe palatine Insurance Company Limited, London 12 11 100 f
americas and caribbean
Barbadoseuropean Finance Reinsurance Company Ltd., Bridgetown 5 4 100 feuropean International Reinsurance Company Ltd., Bridgetown 1 1 100 fGasper Funding Corporation, Bridgetown 17 15 100 fMilvus I Reassurance Limited, Bridgetown 0 0 100 fSwiss Re (Barbados) Finance Limited, Bridgetown 994 884 100 f
BermudaCoRe Reinsurance Company Limited, hamilton 0 0 100 fGroup Ark Insurance holdings Limited, hamilton 235 209 14 fvSwiss Re Global Markets Limited, hamilton 0 0 100 fSwiss Re Capital Management (Bermuda) Ltd., hamilton 0 0 100 fSwiss Re Investments (Bermuda) Ltd., hamilton 0 0 100 f
BrazilSwiss Re Brasil Resseguros S.A., Sao paulo 51 45 100 fSwiss Re Corporate Solutions Brasil Seguros S.A., Sao paulo 38 34 84 f
cayman islandsAmpersand Investments (UK) Limited, George Town 584 519 100 fSwiss Re Strategic Investments UK Limited, George Town 0 0 100 f
Swiss Re 2013 Financial Report 221
FinanciaL STaTemenTS | NoTeS To The GRoUp FINANCIAL STATeMeNTS

Share capital (USD millions)
Share capital (ChF millions)
Affiliation in % as of 31.12.2013
Method of consolidation
United StatesAurora National Life Assurance Company, Wethersfield 0 0 100 fFacility Insurance Corporation, Austin 0 0 100 fFacility Insurance holding Corporation, Dallas 0 0 100 fFirst Specialty Insurance Corporation, Jefferson City 5 4 100 fNorth American Capacity Insurance Company, Manchester 4 4 100 fNorth American elite Insurance Company, Manchester 4 3 100 fNorth American Specialty Insurance Company, Manchester 5 4 100 fRialto Re I Inc., Burlington 0 0 100 fSR Corporate Solutions America holding Corporation, Wilmington 0 0 100 fSterling Re Inc., Burlington 0 0 100 fSwiss Re America holding Corporation, Wilmington 0 0 100 fSwiss Re Atrium Corporation, Wilmington 1 0 100 fSwiss Re Capital Markets Corporation, New York 0 0 100 fSwiss Re Financial products Corporation, Wilmington 2 116 1 882 100 fSwiss Re Financial Services Corporation, Wilmington 0 0 100 fSwiss Re Life & health America holding Company, Wilmington 0 0 100 fSwiss Re Life & health America Inc., hartford 4 4 100 fSwiss Re partnership holding, LLC, Dover 368 327 100 fSwiss Re Risk Solutions Corporation, Wilmington 0 0 100 fSwiss Re Solutions holding Corporation, Wilmington 9 8 100 fSwiss Re Treasury (US) Corporation, Wilmington 0 0 100 fSwiss Reinsurance America Corporation, Armonk 6 5 100 fWashington International Insurance Company, Manchester 4 4 100 fWestport Insurance Corporation, Jefferson City 6 6 100 f
africa
South africaSwiss Re Life and health Africa Limited, Cape Town 0 0 100 f
asia-Pacific
australiaSwiss Re Australia Ltd, Sydney 667 593 100 fSwiss Re Life & health Australia Limited, Sydney 787 700 100 f
chinaAlltrust Insurance Company of China Limited, Shanghai 126 112 5 fv
indiaSwiss Re Shared Services (India) private Ltd., Bangalore 2 2 100 f
VietnamVietnam National Reinsurance Corporation, hanoi 32 28 25 e
222 Swiss Re 2013 Financial Report
FinanciaL STaTemenTS | NoTeS To The GRoUp FINANCIAL STATeMeNTS

This page intentionally left blank
Swiss Re 2013 Financial Report 223
FinanciaL STaTemenTS | NoTeS To The GRoUp FINANCIAL STATeMeNTS

19 Variable interest entities
Swiss Re Group enters into arrangements with variable interest entities (VIes) in the normal course of business. The involvement ranges from being a passive investor to designing, structuring and managing the VIes. The variable interests held by the Group arise as a result of the Group’s involvement in certain insurance-linked and credit-linked securitisations, swaps in trusts, debt financing and other entities which meet the definition of a VIe.
When analysing the status of an entity, the Group mainly assesses if (1) the equity is sufficient to finance the entity’s activities without additional subordinated financial support, (2) the equity holders have the right to make significant decisions affecting the entity’s operations and (3) the holders of the voting rights substantively participate in the gains and losses of the entity. When one of these criteria is not met, the entity is considered a VIe and needs to be assessed for consolidation under the VIe section of the Consolidation Topic.
The party that has a controlling financial interest is called the primary beneficiary and consolidates the VIe. An enterprise is deemed to have a controlling financial interest if it has both of the following: the power to direct the activities of the VIe that most significantly impact the entity’s economic performance; and the obligation to absorb losses of the entity that could potentially be significant to the VIe or the right to receive benefits from the
entity that could potentially be significant to the VIe.
The Group assesses for all its variable interests in VIes whether it has a controlling financial interest in these entities and, thus, is the primary beneficiary. For this, the Group identifies the activities that most significantly impact the entity’s performance and determines whether the Group has the power to direct those activities. In conducting the analysis, the Group considers the purpose, the design and the risks that the entity was designed to create and pass through to its variable interest holders. In a second step, the Group assesses if it has the obligation to absorb losses or if it has the right to receive benefits of the VIe that could potentially be significant to the entity. If both criteria are met, the Group has a controlling financial interest in the VIe and consolidates the entity.
Whenever facts and circumstances change, a review is undertaken of the impact these changes could have on the consolidation assessment previously performed. When the assessment might be impacted, a reassessment to determine the primary beneficiary is performed.
224 Swiss Re 2013 Financial Report
FinanciaL STaTemenTS | NoTeS To The GRoUp FINANCIAL STATeMeNTS

insurance-linked and credit-linked securitisationsThe insurance-linked and credit-linked securitisations transfer pre-existing insurance or credit risk to the capital markets through the issuance of insurance-linked or credit-linked securities. In insurance-linked securitisations, the securitisation vehicle assumes the insurance risk through insurance or derivative contracts. In credit-linked securitisations, the securitisation vehicle assumes the credit risk through credit default swaps. The securitisation vehicle generally retains the issuance proceeds as collateral. The collateral held predominantly consists of investment-grade securities.
Typically, the variable interests held by the Group arise through ownership of insurance-linked and credit-linked securities, or through protection provided under a total return swap for the principal of the collateral held by the securitisation vehicle.
Generally, the activities of a securitisation vehicle are pre-determined at formation. There are substantially no ongoing activities during the life of the VIe that could significantly impact the economic performance of the vehicle. Consequently, the main focus to identify the primary beneficiary is on the activities performed and decisions made when the VIe was designed. Typically, the Group is considered the primary beneficiary of a securitisation vehicle when the Group acts as a sponsor of risk passed to the VIe and enters at the same time into a total return swap with the VIe to protect the VIe’s assets from market risk. Under the total return swap, the Group would incur losses if some or all of the securities held as collateral in the securitisation vehicle decline in value or default. Therefore, the Group’s maximum exposure to loss equals the principal amount of the collateral protected under the total return swap.
As of 31 December 2013, the total assets of the insurance-linked and credit-linked securitisation vehicles in which the Group holds variable interests but is not the primary beneficiary were USD 2 470 million.
Swaps in trustsThe Group provides risk management services to certain asset securitisation trusts which qualify as VIes. As the involvement of the Group is limited to interest rate and foreign exchange derivatives, Swiss Re does not have power to direct any activities of the trusts and therefore does not qualify as primary beneficiary of any of these trusts. These activities are in run-off.
Debt financing vehiclesDebt financing vehicles issue preference shares or loan notes to provide the Group with funding. The Group is partially exposed to the asset risk by holding equity rights or by protecting some of the assets held by the VIes via guarantees or derivative contracts. The assets held by the VIes consist of investment-grade securities, structured products, hedge fund units, derivatives and others.
The Group consolidates certain debt financing vehicles as it has power over the investment management in the vehicles, which is considered to be the activity that most significantly impacts the entities' economic performance. In addition, the Group absorbs the variability of the investment return so that both criteria for a controlling financial interest are met.
As of 31 December 2013, the total assets of the debt financing vehicles in which the Group holds variable interests but is not the primary beneficiary were USD 2 081 million. The total assets of the vehicles in which the Group is the primary beneficiary were USD 6 708 million.
investment vehiclesInvestment vehicles are private equity limited partnerships, in which the Group is invested as part of its investment strategy. Typically, the Group’s variable interests arise through limited partner ownership interests in the vehicles. The Group does not own the general partners of the limited partnerships, and does not have any significant kick-out or participating rights. Therefore the Group lacks power over the relevant activities of the vehicles and, consequently, does not qualify as the primary beneficiary. The Group is exposed to losses when the values of the investments held by the vehicles decrease. The maximum exposure to loss equals the carrying amount of the ownership interest.
As of 31 December 2013, the total assets of investment vehicles in which the Group holds variable interests but is not the primary beneficiary were USD 2 499 million. The total assets of the vehicles in which the Group is the primary beneficiary were USD 8 million.
Swiss Re 2013 Financial Report 225
FinanciaL STaTemenTS | NoTeS To The GRoUp FINANCIAL STATeMeNTS

OtherThe VIes in this category were created for various purposes. Generally, the Group is exposed to the asset risk of the VIes by holding an equity stake in the VIe or by guaranteeing a part or the entire asset value to third-party investors. A significant portion of the Group’s exposure is either retroceded or hedged. The assets held by the VIes consist mainly of residential real estate and other.
As of 31 December 2013, the total assets of other VIes in which the Group holds variable interests but is not the primary beneficiary were USD 1 739 million. The total assets of the vehicles in which the Group is the primary beneficiary were USD 82 million.
The Group did not provide financial or other support to any VIes during 2013 that it was not previously contractually required to provide.
consolidated ViesThe following table shows the total assets and liabilities on the Group’s balance sheet relating to VIes of which the Group is the primary beneficiary as of 31 December:
2012 2013USD millions Carrying value Whereof restricted: Carrying value Whereof restricted:
Fixed income securities available-for-sale 6 896 6 896 6 490 6 490Short-term investments 610 610 61 61other invested assets 258 258 8Cash and cash equivalents 177 177 162 162Accrued investment income 44 44 60 60other assets 19 1 17Total assets 8 004 7 986 6 798 6 773
Carrying valueWhereof limited
recourse: Carrying valueWhereof limited
recourse:
Short-term debt 504 504 62 62Accrued expenses and other liabilities 76 76 20 20Long-term debt 5 328 5 328 5 414 5 414Total liabilities 5 908 5 908 5 496 5 496
226 Swiss Re 2013 Financial Report
FinanciaL STaTemenTS | NoTeS To The GRoUp FINANCIAL STATeMeNTS

non-consolidated ViesThe following table shows the total assets and liabilities in the Group’s balance sheet related to VIes in which the Group held a variable interest but was not the primary beneficiary as of 31 December:
The following table shows the Group’s assets, liabilities and maximum exposure to loss related to VIes in which the Group held a variable interest but was not the primary beneficiary as of 31 December:
The assets and liabilities for the swaps in trusts represent the positive and negative fair values of the derivatives the Group has entered into with the trusts. Liabilities are recognised for certain debt financing VIes when losses occur. To date, the respective debt financing VIes have not incurred any losses. Liabilities of USD 555 million recognised for the “other” category relate mainly to collateral received.
USD millions 2012 2013
Fixed income securities:Available-for-sale 72 71Trading 12 15
other invested assets 1 724 1 568Total assets 1 808 1 654
Short-term debt 399 417Accrued expenses and other liabilities 385 422Total liabilities 784 839
2012 2013
USD millions Total assets Total liabilities
Maximum exposure
to loss
Difference between exposure
and liabilities Total assets Total liabilities
Maximum exposure
to loss
Difference between exposure
and liabilities
Insurance-linked/credit-linked securitisations 212 842 842 72 90 90Swaps in trusts 149 240 –1 – 96 284 –1 –Debt financing 395 29 29 407 30 30Investment vehicles 829 829 829 853 853 853other 223 544 1 814 1 270 226 555 1 897 1 342Total 1 808 784 –1 – 1 654 839 –1 –
1 The maximum exposure to loss for swaps in trusts cannot be meaningfully quantified due to their derivative character.
Swiss Re 2013 Financial Report 227
FinanciaL STaTemenTS | NoTeS To The GRoUp FINANCIAL STATeMeNTS

20 Restructuring provision
In 2013, the Group set up total provisions of USD 46 million, and released USD 2 million.
The increase of the provision in the property & Casualty Reinsurance business segment of USD 46 million is mostly related to leaving benefits.
Changes in restructuring provisions are disclosed in the “other expenses” line in the Group’s income statement.
For the years ended 31 December, restructuring provision developed as follows:
2012 USD millions
property & Casualty Reinsurance
Life & health Reinsurance
Corporate Solutions Admin Re® Group items Total
Balance as of 1 January 43 2 9 54Increase in provision 7 2 9Release of provision –4 –4Costs incurred –14 –1 –15Balance as of 31 December 32 1 0 11 0 44
2013 USD millions
property & Casualty Reinsurance
Life & health Reinsurance
Corporate Solutions Admin Re® Group items Total
Balance as of 1 January 32 1 11 44Increase in provision 46 46Release of provision –2 –2Costs incurred –12 –1 –1 –14Balance as of 31 December 64 0 0 10 0 74
228 Swiss Re 2013 Financial Report
FinanciaL STaTemenTS | NoTeS To The GRoUp FINANCIAL STATeMeNTS

21 Risk assessment
The Board of Directors is ultimately responsible for the Group’s governance principles and policies; these include the Group Risk policy, which establishes both the guiding principles of risk management as well as the overall risk tolerance of the Group.
The Board of Directors generally deals with risk management through two committees: The Finance and Risk Committee is responsible for reviewing the Group Risk policy and capacity limits, as well as for monitoring
risk tolerance and reviewing top risk issues and exposures. The Audit Committee is responsible for overseeing internal controls and compliance procedures.
The Group executive Committee (Group eC) implements the risk management framework through four sub-committees: The Group Risk and Capital Committee has responsibility for establishing the Group’s Risk Governance Framework, including setting
and monitoring risk capacity limits and determining changes to the internal risk and capital measurement methodology. It also oversees Swiss Re’s economic value measurement framework, including the principles for the allocation of capital and funding resources.
The Group Asset-Liability Committee oversees the management of Swiss Re’s balance sheet, in particular its liquidity, capital, and funding positions and related policies.
The Group products and Limits Committee determines Swiss Re’s product policy and underwriting standards, sets transaction limits, and decides on large or non-standard transactions.
The Group Regulatory Committee is the central information and coordination platform for regulatory matters and compliance. It ensures a consistent approach to external communication on regulatory issues.
The Group Chief Risk officer (CRo), who is a member of the Group eC, reports directly to the Group Ceo as well as to the Board's Finance and Risk Committee. The Group CRo is a member of the four Group eC committees, serving as the chairman of both the Group Risk and Capital Committee and the Group Regulatory Committee. In addition, the Group CRo leads the Group’s Risk Management function, which is responsible for risk oversight and control across the Group.
The Group Risk Management function is comprised of central departments providing shared services (such as Risk Reporting), along with dedicated departments for the Reinsurance, Corporate Solutions, and Admin Re® Business Units.
each of these Business Unit departments has a dedicated Chief Risk officer who reports directly to the Group CRo, with a secondary reporting line to the respective Business Unit Ceo. The Business Unit CRos are responsible for risk oversight in their respective Business Units, establishing the proper risk governance to ensure efficient risk identification, assessment, and control. There are also Regional CRos (Americas, Asia, and eMeA) with reporting duties to the Reinsurance regional management teams. They also provide functional support to the Regional presidents.
For Swiss Re’s major legal entities, the Business Unit CRos are supported by designated legal entity CRos who are responsible for overseeing specific risk management issues that arise at the legal entity level.
The central departments support both the Group CRo and the Business Unit CRos in discharging their oversight responsibilities. They do so by providing specialised risk category expertise and accumulation control, risk modelling and reporting services, regulatory relations management, and central risk governance framework development. The central departments also oversee Group liquidity and capital adequacy and maintain the Group frameworks for controlling these risks throughout Swiss Re.
While in Reinsurance the setting of the reserves is performed by valuation actuaries working with the Business Management Unit, in Corporate Solutions and Admin Re® actuarial management is an integral part of Risk Management. The monitoring of reserves for the three Business Units is provided by a dedicated Actuarial Control Unit within Risk Management.
Swiss Re 2013 Financial Report 229
FinanciaL STaTemenTS | NoTeS To The GRoUp FINANCIAL STATeMeNTS

Senior managers of Business and corporate Units are responsible for managing operational risks in their areas of activity, based on a centrally coordinated methodology. Their self-assessments are reviewed and challenged by dedicated operational risk managers. Risk management experts also review Swiss Re’s underwriting decision processes.
Risk management activities are also supported by Group Internal Audit and Compliance. The Group Internal Audit department carries out independent, objective assessments of the adequacy and effectiveness of internal control systems. It evaluates the execution of processes within Swiss Re, including those within Risk Management.
The Compliance function is principally responsible for overseeing Swiss Re’s compliance with applicable laws, regulations, rules, and the Code of Conduct, as well as managing compliance risk. It assists the Board of Directors, the Group eC and management in discharging their respective duties to identify, mitigate, and manage compliance risks.
230 Swiss Re 2013 Financial Report
FinanciaL STaTemenTS | NoTeS To The GRoUp FINANCIAL STATeMeNTS

This page intentionally left blank
Swiss Re 2013 Financial Report 231
FinanciaL STaTemenTS | NoTeS To The GRoUp FINANCIAL STATeMeNTS

Report of the statutory auditorto the General Meeting ofSwiss Re LtdZurich
Report of the statutory auditor on the consolidated financial statementsAs statutory auditor, we have audited the consolidated financial statements of Swiss Re Ltd, which comprise the balance sheet, income statement, cash flow statement, statement of changes in shareholders’ equity, comprehensive income and notes (pages 130 to 230), for the year ended 31 December 2013.
Board of Directors’ responsibilityThe Board of Directors is responsible for the preparation and fair presentation of the consolidated financial statements in accordance with accounting principles generally accepted in the United States of America (US GAAp) and the requirements of Swiss law. This responsibility includes designing, implementing and maintaining an internal control system relevant to the preparation and fair presentation of consolidated financial statements that are free from material misstatement, whether due to fraud or error. The Board of Directors is further responsible for selecting and applying appropriate accounting policies and making accounting estimates that are reasonable in the circumstances.
auditor’s responsibilityour responsibility is to express an opinion on these consolidated financial statements based on our audit. We conducted our audit in accordance with Swiss law, Swiss Auditing Standards and auditing standards generally accepted in the United States of America. Those standards require that we plan and perform the audit to obtain reasonable assurance whether the consolidated financial statements are free from material misstatement.
An audit involves performing procedures to obtain audit evidence about the amounts and disclosures in the consolidated financial statements. The procedures selected depend on the auditor’s judgment, including the assessment of the risks of material misstatement of the consolidated financial statements, whether due to fraud or error. In making those risk assessments, the auditor considers the internal control system relevant to the entity’s preparation and fair presentation of the consolidated financial statements in order to design audit procedures that are appropriate in the circumstances, but not for the purpose of expressing an opinion on the effectiveness of the entity’s internal control system. An audit also includes evaluating the appropriateness of the accounting policies used and the reasonableness of accounting estimates made, as well as evaluating the overall presentation of the consolidated financial statements. We believe that the audit evidence we have obtained is sufficient and appropriate to provide a basis for our audit opinion.
OpinionIn our opinion, the consolidated financial statements for the year ended 31 December 2013 present fairly, in all material respects, the financial position, the results of operations and the cash flows in accordance with accounting principles generally accepted in the United States of America (US GAAp) and comply with Swiss law.
RepoRT oF The STATUToRY AUDIToR
232 Swiss Re 2013 Financial Report
FinanciaL STaTemenTS

Report on other legal requirementsWe confirm that we meet the legal requirements on licensing according to the Auditor oversight Act (AoA) and independence (article 728 Co and article 11 AoA) and that there are no circumstances incompatible with our independence.
In accordance with article 728a paragraph 1 item 3 Co and Swiss Auditing Standard 890, we confirm that an internal control system exists which has been designed for the preparation of consolidated financial statements according to the instructions of the Board of Directors.
We recommend that the consolidated financial statements submitted to you be approved.
pricewaterhouseCoopers AG
Alex Finn Bret GriffinAudit expertAuditor in charge
Zürich, 17 March 2014
Swiss Re 2013 Financial Report 233
FinanciaL STaTemenTS | RepoRT oF The STATUToRY AUDIToR

USD millions 20041,3 20053 20062,3 20072,3 20082,3 20092,3 20102 20112 20122,4 2013
income statement
Revenuespremiums earned 23 607 21 622 23 526 26 337 23 577 22 664 19 652 21 300 24 661 28 276Fee income 708 701 794 746 847 918 876 785 542Net investment income 3 895 4 934 6 370 8 893 7 331 6 399 5 422 5 469 5 302 4 735Net realised investment gains/losses 895 2 793 1 679 –615 –8 677 875 2 783 388 2 688 3 325Trading revenues 351 278other revenues 195 228 223 251 249 178 60 50 188 24Total revenues 28 943 30 563 32 499 35 660 23 226 30 963 28 835 28 083 33 624 36 902
expensesClaims and claim adjustment expenses –11 109 –11 866 –9 405 –10 035 –9 222 –8 336 –7 254 –8 810 –7 763 –9 655Life and health benefits –7 482 –6 970 –7 647 –9 243 –8 381 –8 639 –8 236 –8 414 –8 878 –9 581Return credited to policyholders –2 427 –2 253 –1 763 2 611 –4 597 –3 371 –61 –2 959 –3 678Acquisition costs –5 072 –4 766 –4 845 –5 406 –4 950 –4 495 –3 679 –4 021 –4 548 –4 895Amortisation of goodwill –222other operating costs and expenses –2 358 –2 477 –3 679 –4 900 –4 358 –3 976 –3 620 –3 902 –3 953 –4 268Total expenses –26 243 –28 506 –27 829 –31 347 –24 300 –30 043 –26 160 –25 208 –28 101 –32 077
income/loss before income tax expense 2 700 2 057 4 670 4 313 –1 074 920 2 675 2 875 5 523 4 825Income tax expense –715 –205 –1 033 –853 411 –221 –541 –77 –1 125 –312net income/loss before attribution of non-controlling interests 1 985 1 852 3 637 3 460 –663 699 2 134 2 798 4 398 4 513
Income/loss attributable to non-controlling interests –154 –172 –141 –2net income after attribution of non-controlling interests 1 985 1 852 3 637 3 460 –663 699 1 980 2 626 4 257 4 511
Interest on contingent capital instruments –203 –1 117 0 –56 –67net income/loss attributable to common shareholders 1 985 1 852 3 637 3 460 –663 496 863 2 626 4 201 4 444
Balance sheet
assetsInvestments 94 998 99 094 167 303 201 221 154 053 151 341 156 947 162 224 152 812 150 075other assets 67 203 68 817 71 317 70 198 71 322 81 407 71 456 63 675 68 691 63 445Total assets 162 201 167 911 238 620 271 419 225 375 232 748 228 403 225 899 221 503 213 520
LiabilitiesUnpaid claims and claim adjustment expenses 54 189 54 447 77 829 78 195 70 944 68 412 64 690 64 878 63 670 61 484Liabilities for life and health policy benefits 38 025 23 583 36 779 44 187 37 497 39 944 39 551 39 044 36 117 36 033Unearned premiums 5 055 4 980 6 574 6 821 7 330 6 528 6 305 8 299 9 384 10 334other liabilities 43 409 61 953 80 802 95 172 73 366 73 336 72 524 65 850 62 020 57 970Long-term debt 4 657 4 440 11 337 18 898 17 018 19 184 18 427 16 541 16 286 14 722Total liabilities 145 335 149 403 213 321 243 273 206 155 207 404 201 497 194 612 187 477 180 543
Shareholders’ equity 16 866 18 508 25 299 28 146 19 220 25 344 25 342 29 590 34 002 32 952
Non-controlling interests 1 564 1 697 24 25Total equity 16 866 18 508 25 299 28 146 19 220 25 344 26 906 31 287 34 026 32 977
earnings/losses per share in USD 6.42 5.98 10.75 9.94 –2.00 1.46 2.52 7.68 11.85 12.97earnings/losses per share in ChF 8.00 7.44 13.49 11.95 –2.61 1.49 2.64 6.79 11.13 12.04
1 Numbers are based on the Group’s previous accounting standards.2 Trading revenues are included in net investment income; long-term debt also includes debt positions from former Financial Markets.3 The Group changed its reporting currency from ChF into USD in 2010. periods prior to 2010 have been translated to USD for informational purposes only based on the
Group’s average exchange rates for the income statements and year-end rates for the balance sheets.4 The Group updated its balance sheet presentation of deferred tax assets and liabilities. Deferred tax assets and liabilities are presented on a gross basis as per the first quarter
2013. The comparative period has been adjusted accordingly and is consistent with the relevant income tax disclosure in the notes to the financial statements in the prior year.
GRoUp FINANCIAL YeARS 2004–2013
234 Swiss Re 2013 Financial Report
FinanciaL STaTemenTS
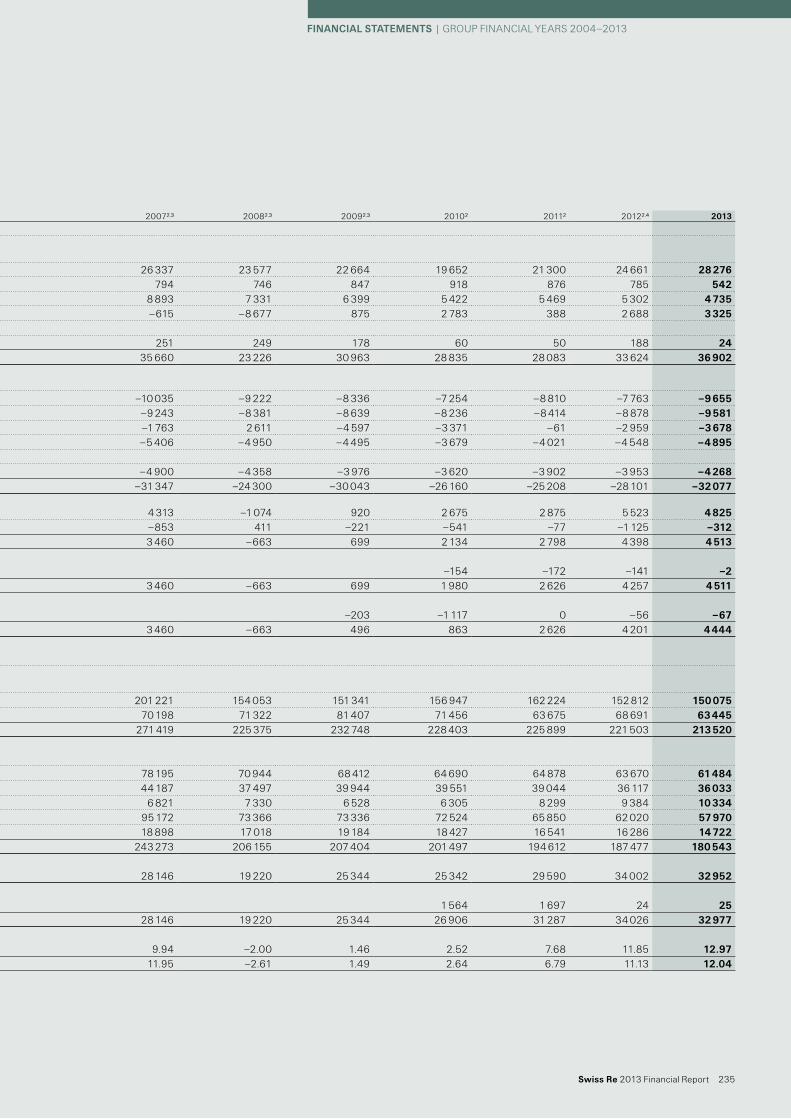
USD millions 20041,3 20053 20062,3 20072,3 20082,3 20092,3 20102 20112 20122,4 2013
income statement
Revenuespremiums earned 23 607 21 622 23 526 26 337 23 577 22 664 19 652 21 300 24 661 28 276Fee income 708 701 794 746 847 918 876 785 542Net investment income 3 895 4 934 6 370 8 893 7 331 6 399 5 422 5 469 5 302 4 735Net realised investment gains/losses 895 2 793 1 679 –615 –8 677 875 2 783 388 2 688 3 325Trading revenues 351 278other revenues 195 228 223 251 249 178 60 50 188 24Total revenues 28 943 30 563 32 499 35 660 23 226 30 963 28 835 28 083 33 624 36 902
expensesClaims and claim adjustment expenses –11 109 –11 866 –9 405 –10 035 –9 222 –8 336 –7 254 –8 810 –7 763 –9 655Life and health benefits –7 482 –6 970 –7 647 –9 243 –8 381 –8 639 –8 236 –8 414 –8 878 –9 581Return credited to policyholders –2 427 –2 253 –1 763 2 611 –4 597 –3 371 –61 –2 959 –3 678Acquisition costs –5 072 –4 766 –4 845 –5 406 –4 950 –4 495 –3 679 –4 021 –4 548 –4 895Amortisation of goodwill –222other operating costs and expenses –2 358 –2 477 –3 679 –4 900 –4 358 –3 976 –3 620 –3 902 –3 953 –4 268Total expenses –26 243 –28 506 –27 829 –31 347 –24 300 –30 043 –26 160 –25 208 –28 101 –32 077
income/loss before income tax expense 2 700 2 057 4 670 4 313 –1 074 920 2 675 2 875 5 523 4 825Income tax expense –715 –205 –1 033 –853 411 –221 –541 –77 –1 125 –312net income/loss before attribution of non-controlling interests 1 985 1 852 3 637 3 460 –663 699 2 134 2 798 4 398 4 513
Income/loss attributable to non-controlling interests –154 –172 –141 –2net income after attribution of non-controlling interests 1 985 1 852 3 637 3 460 –663 699 1 980 2 626 4 257 4 511
Interest on contingent capital instruments –203 –1 117 0 –56 –67net income/loss attributable to common shareholders 1 985 1 852 3 637 3 460 –663 496 863 2 626 4 201 4 444
Balance sheet
assetsInvestments 94 998 99 094 167 303 201 221 154 053 151 341 156 947 162 224 152 812 150 075other assets 67 203 68 817 71 317 70 198 71 322 81 407 71 456 63 675 68 691 63 445Total assets 162 201 167 911 238 620 271 419 225 375 232 748 228 403 225 899 221 503 213 520
LiabilitiesUnpaid claims and claim adjustment expenses 54 189 54 447 77 829 78 195 70 944 68 412 64 690 64 878 63 670 61 484Liabilities for life and health policy benefits 38 025 23 583 36 779 44 187 37 497 39 944 39 551 39 044 36 117 36 033Unearned premiums 5 055 4 980 6 574 6 821 7 330 6 528 6 305 8 299 9 384 10 334other liabilities 43 409 61 953 80 802 95 172 73 366 73 336 72 524 65 850 62 020 57 970Long-term debt 4 657 4 440 11 337 18 898 17 018 19 184 18 427 16 541 16 286 14 722Total liabilities 145 335 149 403 213 321 243 273 206 155 207 404 201 497 194 612 187 477 180 543
Shareholders’ equity 16 866 18 508 25 299 28 146 19 220 25 344 25 342 29 590 34 002 32 952
Non-controlling interests 1 564 1 697 24 25Total equity 16 866 18 508 25 299 28 146 19 220 25 344 26 906 31 287 34 026 32 977
earnings/losses per share in USD 6.42 5.98 10.75 9.94 –2.00 1.46 2.52 7.68 11.85 12.97earnings/losses per share in ChF 8.00 7.44 13.49 11.95 –2.61 1.49 2.64 6.79 11.13 12.04
1 Numbers are based on the Group’s previous accounting standards.2 Trading revenues are included in net investment income; long-term debt also includes debt positions from former Financial Markets.3 The Group changed its reporting currency from ChF into USD in 2010. periods prior to 2010 have been translated to USD for informational purposes only based on the
Group’s average exchange rates for the income statements and year-end rates for the balance sheets.4 The Group updated its balance sheet presentation of deferred tax assets and liabilities. Deferred tax assets and liabilities are presented on a gross basis as per the first quarter
2013. The comparative period has been adjusted accordingly and is consistent with the relevant income tax disclosure in the notes to the financial statements in the prior year.
Swiss Re 2013 Financial Report 235
FinanciaL STaTemenTS | GRoUp FINANCIAL YeARS 2004–2013

Swiss Re Ltd (the Company), domiciled in Zurich, Switzerland, is the ultimate holding company of the Swiss Re Group. Its principal activity is the holding of investments in Swiss Re Group companies.
Income statementNet income for 2013 amounted to CHF 2 707 million (2012: CHF 2 718 million) and was mostly driven by cash dividends from subsidiaries and affiliated companies of CHF 2 641 million. In addition, Swiss Reinsurance Company Ltd transferred to the Company its investment in Swiss Re Principal Investments Company Ltd through a dividend in kind of CHF 805 million, which resulted in a valuation adjustment to the Company’s investment in Swiss Reinsurance Company Ltd of the same amount.
The Company earned trademark license fees of CHF 284 million and incurred administrative expenses of CHF 174 million, of which CHF 148 million were charges for services provided by Swiss Reinsurance Company Ltd. In addition, the Company incurred other expenses of CHF 117 million, including changes in the provision for currency fluctuation and realised foreign exchange losses of CHF 112 million, and capital and indirect taxes of CHF 5 million.
AssetsTotal assets increased from CHF 19 961 million as of 31 December 2012 to CHF 20 116 million as of 31 December 2013.
Investments in subsidiaries and affiliated companies increased from CHF 16 351 million as of 31 December 2012 to CHF 17 117 million as of 31 December 2013 due to capital contributions made to subsidiaries of Swiss Re Principal Investments Company Ltd and Swiss Re Investments Holding Company Ltd.
As of 31 December 2013, the Company held short-term loans of CHF 1 774 million (2012: CHF 2 710 million) granted to Swiss Reinsurance Company Ltd. The decrease was mainly related to a partial funding of dividends to shareholders and aforementioned capital contributions.
LiabilitiesTotal liabilities increased from CHF 7 million as of 31 December 2012 to CHF 26 million as of 31 December 2013, mainly due to higher payables to subsidiaries and affiliated companies and accrued expenses.
Shareholders’ equityShareholders’ equity increased from CHF 19 954 million as of 31 December 2012 to CHF 20 090 million as of 31 December 2013, mainly driven by the inclusion of net income for 2013 of CHF 2 707 million, mostly offset by dividends to shareholders of CHF 2 571 million.
Legal reserves from capital contributions decreased from CHF 7 994 million as of 31 December 2012 to CHF 5 423 million as of 31 December 2013, reflecting the payment of dividends to shareholders of CHF 2 571 million.
ANNuAL RePoRTSwISS Re LTD
236 Swiss Re 2013 Financial Report
FInAncIAL StAtementS | SwISS Re LTD

INCome STATemeNTSwISS Re LTDFor the years ended 31 December
CHF millions Notes 2012 2013
RevenuesInvestment income 2 9 674 3 521Trademark license fees 231 284other revenues 0 0total revenues 9 905 3 805
expenses Administrative expenses 3 –161 –174Investment expenses 2 –6 961 –806other expenses –57 –117total expenses –7 179 –1 097 Income before income tax expense 2 726 2 708Income tax expense –8 –1net income 2 718 2 707
The accompanying notes are an integral part of Swiss Re Ltd’s financial statements.
Swiss Re 2013 Financial Report 237
FInAncIAL StAtementS | SwISS Re LTD

BALANCe SHeeTSwISS Re LTDAs of 31 December
Assets
The accompanying notes are an integral part of Swiss Re Ltd’s financial statements.
CHF millions Notes 2012 2013
current assetsCash and cash equivalents 163 66Short-term investments 4 61 364Loans to subsidiaries and affiliated companies 2 710 1 774Receivables from subsidiaries and affiliated companies 40 53other receivables and accrued income 9 1total current assets 2 983 2 258 non-current assetsInvestments in subsidiaries and affiliated companies 5 16 351 17 117own shares 6 627 741total non-current assets 16 978 17 858
total assets 19 961 20 116
238 Swiss Re 2013 Financial Report
FInAncIAL StAtementS | SwISS Re LTD

Liabilities and shareholders’ equity
The accompanying notes are an integral part of Swiss Re Ltd’s financial statements.
CHF millions Notes 2012 2013
Liabilities Short-term liabilities Payables to subsidiaries and affiliated companies – 7other liabilities and accrued expenses 0 14total short-term liabilities 0 21
Long-term liabilities Provisions 7 5total long-term liabilities 7 5 total liabilities 7 26
Shareholders’ equity 7Share capital 8, 9 37 37other legal reserves 8 304 8 238Reserve for own shares 882 948Legal reserves from capital contributions 10 7 994 5 423other reserves – 2 730Retained earnings brought forward 19 7Net income for the financial year 2 718 2 707 total shareholders’ equity 19 954 20 090 total liabilities and shareholders’ equity 19 961 20 116
Swiss Re 2013 Financial Report 239
FInAncIAL StAtementS | SwISS Re LTD
Financial statements | SwiSS Re Ltd
1 Significant accounting principles
Basis of presentationOn 1 January 2013, new Swiss accounting and financial reporting legislation entered into force based on partial revisions of the Swiss Code of Obligations. Based on the transitional provisions, the new provisions have to be implemented for annual accounts from the 2015 financial year onwards, at the latest. therefore, Swiss Re Ltd’s financial statements for the 2013 financial year have been prepared based on the accounting provisions of the Swiss Code of Obligations in effect until 31 december 2012.
time periodthe financial year 2013 comprises the accounting period from 1 January 2013 to 31 december 2013.
Use of estimates in the preparation of annual accountsthe preparation of the annual accounts requires management to make estimates and assumptions that affect the reported amounts of assets, liabilities, revenues and expenses as well as the related disclosures. Actual results could differ from these estimates.
Foreign currency translationAssets and liabilities denominated in foreign currencies are converted into Swiss francs at year-end exchange rates with the exception of participations, which are maintained in Swiss francs at historical exchange rates. income and expenses are converted into Swiss francs at average exchange rates for the reporting year.
cash and cash equivalentsCash and cash equivalents include cash at bank, short-term deposits and certain investments in money-market funds with an original maturity of three months or less. Such current assets are held at nominal value.
short-term investmentsShort-term investments contain investments with an original maturity between three months and one year. Such investments are carried at cost, less necessary and legally permissible depreciation.
Receivables from subsidiaries and affiliated companies/Other receivablesthese assets are carried at nominal value. Value adjustments are recorded where the expected recovery value is lower than the nominal value.
accrued incomeAccrued income includes other expenditures incurred during the financial year but relating to a subsequent financial year, and revenues relating to the current financial year but which are receivable in a subsequent financial year.
investments in subsidiaries and affiliated companiesthese assets are carried at cost, less necessary and legally permissible depreciation.
Own sharesOwn shares are carried at cost, less necessary and legally permissible depreciation.
loans to subsidiaries and affiliated companiesLoans to subsidiaries and affiliated companies are carried at nominal value. Value adjustments are recorded where the expected recovery value is lower than the nominal value.
Payables to subsidiaries and affiliated companies/Other liabilitiesthese liabilities are carried at nominal value.
accrued expensesAccrued expenses consist of both income received before the balance sheet date but relating to a subsequent financial year, and charges relating to the current financial year but which are payable in a subsequent financial year.
NOteSSwiSS Re Ltd
240 swiss Re 2013 Financial Report

Financial statements | SwiSS Re Ltd
Provisionsthe provision for taxation represents an estimate of taxes payable in respect of the reporting year.
the provision for currency fluctuation comprises the net effect of foreign exchange gains and losses arising from the revaluation of the opening balance sheet and the translation adjustment of the income statement from average to closing exchange rates at year-end. these net impacts are recognised in the income statement over a period of up to three years. where the provision for currency fluctuation is insufficient to absorb net foreign exchange losses for the financial year, the provision for currency fluctuation is reduced to zero and the excess foreign exchange loss is recognised in the income statement.
Foreign exchange transaction gains and lossesForeign exchange gains and losses arising from foreign exchange transactions are recognised in the income statement and reported in other expenses or other income, respectively.
Dividends from subsidiaries and affiliated companiesdividends from subsidiaries and affiliated companies are recognised as revenue in the year in which they are declared.
capital and indirect taxesCapital and indirect taxes related to the financial year are included in other expenses. Value-added taxes are included in the respective expense lines in the income statement.
income tax expenseAs a holding company incorporated in Switzerland, Swiss Re Ltd is exempt from income taxation at cantonal/communal level. On federal level, dividends from subsidiaries and affiliated companies are indirectly exempt from income taxation (participation relief). However, income tax is payable on trademark license fees charged to certain subsidiaries and affiliated companies.
swiss Re 2013 Financial Report 241

Financial statements | SwiSS Re Ltd
2 investment income and expenses
3 Administrative expenses and personnel information
Swiss Re Ltd receives management and other services from Swiss Reinsurance Company Ltd and has no employees of its own.
4 Securities lending
As of 31 december 2013, securities of CHF 334 million were lent to Group companies under securities lending agreements, whereas in 2012 securities of CHF 9 million were lent to Group companies. As of 31 december 2013 and 2012, there were no securities lent to third parties.
5 investments in subsidiaries and affiliated companies
As of 31 december 2013 and 2012, Swiss Re Ltd held the following investments in subsidiaries and affiliated companies:
as of 31 December 2013 domicile Affiliation Share capital
Swiss Reinsurance Company Ltd Zurich 100% CHF 34.4 millionSwiss Re Corporate Solutions Ltd Zurich 100% CHF 100.0 millionSwiss Re Life Capital Ltd Zurich 100% CHF 0.1 millionSwiss Re investments Holding Company Ltd Zurich 100% CHF 0.1 millionSwiss Re Principal investments Company Ltd Zurich 100% CHF 0.1 millionSwiss Re Specialised investments Holdings (UK) Ltd London 100% GBP 1.0 million
As of 31 december 2012 domicile Affiliation Share capital
Swiss Reinsurance Company Ltd Zurich 100% CHF 34.4 millionSwiss Re Corporate Solutions Ltd Zurich 100% CHF 100.0 millionSwiss Re Life Capital Ltd Zurich 100% CHF 0.1 millionSwiss Re investments Holding Company Ltd Zurich 100% CHF 0.1 millionSwiss Re Specialised investments Holdings (UK) Ltd London 100% GBP 1.0 million
CHF millions 2012 2013
Cash dividends from subsidiaries and affiliated companies 3 836 2 641dividends in-kind from subsidiaries and affiliated companies 5 810 805Realised gains on sale of investments 19 61income from short-term investments 0 0income from loans to subsidiaries and affiliated companies 9 13investment management income 0 1Other interest revenues 0 0investment income 9 674 3 521
CHF millions 2012 2013
Valuation adjustments on investments in subsidiaries and affiliated companies –6 960 –805Realised losses on sale of investments 0 0investment management expenses –1 –1Other interest expenses 0 0investment expenses –6 961 –806
242 swiss Re 2013 Financial Report

Financial statements | SwiSS Re Ltd
6 Own shares
As of 31 december 2013, Swiss Re Ltd and its subsidiaries held 28 512 910 (2012: 27 560 372) of Swiss Re Ltd’s own shares, of which Swiss Re Ltd owned directly 25 685 817 (2012: 24 765 932) shares.
in the year under report, 5 998 405 (2012: 4 100 174) own shares were purchased at an average price of CHF 78.85 (2012: CHF 49.53) and 5 044 780 (2012: 3 897 216) own shares were sold at an average price of CHF 72.95 (2012: CHF 61.15).
7 Change in shareholders’ equity
8 Major shareholders
As of 31 december 2013, there were three shareholders with a participation exceeding the 3% threshold of Swiss Re Ltd’s share capital:
in addition, Swiss Re Ltd held, as of 31 december 2013, directly and indirectly 28 512 910 (2012: 27 560 372) own shares, representing 7.69% (2012: 7.43%) of voting rights and share capital. Swiss Re Ltd cannot exercise the voting rights of own shares held.
CHF millions 2012 2013
Opening balance of shareholders’ equity 18 268 19 954dividend payments for the previous year –1 032 –2 5711Net income for the financial year 2 718 2 707shareholders’ equity as of 31 December before proposed dividend payments 19 954 20 090Proposed dividend payments –2 574 –2 7382shareholders’ equity as of 31 December after proposed dividend payments 17 380 17 352
1 Since the Board of directors’ proposal for allocation of disposable profit, included in the Annual Report 2012, the number of registered shares eligible for dividend, at the dividend payment date of 17 April 2013, decreased due to the transfer of 340 411 shares for employee participation purposes from eligible to not eligible for dividend. this resulted in a lower dividend of CHF 3 million, compared to the Board of directors’ proposal, and in higher legal reserves from capital contributions by the same amount.
2 details on the proposed dividend payments for the financial year 2013 are disclosed on page 253.
Shareholder Number of shares % of voting rights and share capital Creation of the obligation to notify
Franklin Resources, inc. 18 277 452 4.93 2 August 2012Berkshire Hathaway inc. 11 262 000 3.10 10 June 2011BlackRock, inc. 11 134 246 3.09 26 September 2011
swiss Re 2013 Financial Report 243

Financial statements | SwiSS Re Ltd
9 Conditional capital and authorised capital
As of 31 december 2013, Swiss Re Ltd had the following conditional capital and authorised capital:
conditional capital for equity-linked Financing instrumentsthe share capital of the Company shall be increased by an amount not exceeding CHF 5 000 000 through the issuance of a maximum of 50 000 000 registered shares, payable in full, each with a nominal value of CHF 0.10, through the voluntary or mandatory exercise of conversion and/or option rights granted in connection with bonds or similar instruments including loans or other financial instruments by the Company or Group companies (hereinafter collectively the “equity-Linked Financing instruments”). existing shareholders’ subscription rights are excluded.
authorised capitalthe Board of directors is authorised to increase the share capital of the Company at any time up to 10 April 2015 by an amount not exceeding CHF 8 500 000 through the issuance of up to 85 000 000 registered shares, payable in full, each with a nominal value of CHF 0.10. increases by underwriting as well as partial increases are permitted. the date of issue, the issue price, the type of contribution and any possible acquisition of assets, the date of dividend entitlement as well as the expiry or allocation of non exercised subscription rights will be determined by the Board of directors.
with respect to a maximum of CHF 5 000 000 through the issuance of up to 50 000 000 registered shares, payable in full, each with a nominal value of CHF 0.10, out of the total amount of authorised capital referred to above, the subscription rights of shareholders may not be excluded.
with respect to a maximum of CHF 3 500 000 through the issuance of up to 35 000 000 registered shares, payable in full, each with a nominal value of CHF 0.10, out of the total amount of authorised capital referred to above, the Board of directors may exclude or restrict the subscription rights of the existing shareholders for the use of shares in connection with (i) mergers, acquisitions (including take-over) of companies, parts of companies or holdings, equity stakes (participations) or new investments planned by the Company and/or Group companies, financing or re-financing of such mergers, acquisitions or new investments, the conversion of loans, securities or equity securities, and/or (ii) improving the regulatory capital position of the Company or Group companies in a fast and expeditious manner if the Board of directors deems it appropriate or prudent to do so (including by way of private placements).
Joint provision for conditional capital for equity-linked Financing instruments and for the above-mentioned authorised capitalthe total of registered shares issued from the authorised capital, where the existing shareholders’ subscription rights were excluded, and from the shares issued from conditional capital, where the existing shareholders’ advance subscription rights on the equity-Linked Financing instruments were excluded, may not exceed 74 000 000 registered shares up to 10 April 2015.
10 Legal reserves from capital contributions
CHF millions 2012 2013
Opening balance of legal reserves from capital contributions 8 995 7 994Reclassification to other reserves for dividend payments –1 032 –2 571Additions to legal reserves from capital contributions 31 –legal reserves from capital contributions as of 31 December 7 994 5 423thereof confirmed by the Swiss Federal Tax Administration1 7 802 5 231
1 Under current Swiss tax legislation, the amount of legal reserves from capital contributions, which has been confirmed by the Swiss Federal tax Administration, can be paid out as dividends exempt from Swiss withholding tax, and for Swiss resident individual shareholders holding shares in private wealth also exempt from Swiss income taxes.
244 swiss Re 2013 Financial Report

Financial statements | SwiSS Re Ltd
11 Release of undisclosed reserves
in the year under report, undisclosed reserves on investments or on provisions were released by a net amount of CHF 16 million (2012: no net release).
12 Risk assessment
Article 663b sub-para. 12 of the Swiss Code of Obligations requires disclosure of information on the performance of a risk assessment.
the identification, assessment and control of risk exposures of Swiss Re Ltd on a stand-alone basis are integrated in and covered by Swiss Re’s Group risk management organisation and processes.
details are disclosed on page 229 to 230.
swiss Re 2013 Financial Report 245
Financial statements | SwiSS Re Ltd
13 Compensation, participations and loans of members of governing bodies
the section below is in line with articles 663bbis and 663c para. 3 of the Swiss Code of Obligations, which require disclosure of the elements of compensation paid to Swiss Re’s Board of directors and Group executive Committee (Group eC), as well as their shareholdings and loans.
compensation for acting members of governing bodiesArticle 663bbis of the Swiss Code of Obligations requires disclosure of total compensation paid to members of the Board of directors and the Group eC. Compensation to members of the Board of directors and the highest paid member of the Group eC is shown by individual. For a description of the compensation elements of this, see page 105, Compensation.
compensation of the Group ecAggregate compensation for members of the Group eC was:
the table above covers payments to 12 members in 2013, of whom all were employed for the full year. the 2012 payments cover 16 members, of whom seven were employed for the full year.
the value of the Value Alignment incentive (VAi) is based on the nominal amount of the grant. Subsequently, a disbursement factor, which can vary between 50% and 150%, is applied based on the economic results of the Group. the VAi disclosed in the table above assumes a disbursement factor of 100% at grant date. For a description of the VAi plan see page 116, Compensation.
in 2012, the previous Long term incentive plan (Lti) was replaced by the Leadership Performance Plan (LPP). the LPP grants made in 2012, 2013 and 2014 are generally expected to be settled in shares. For LPP 2012, 2013 and 2014 the vesting and performance measurement period is three years. For LPP 2014, an additional two year holding requirement applies for all Group eC and GMB members. At grant, the award is split equally into two underlying components: Restricted Share Units (RSU) and Performance Share Units (PSU). the RSU component is measured against a Roe performance condition and will vest within a range of 0–100%. the PSU component is based on relative total shareholder return, measured against a pre-defined basket of peers and will vest within a range of 0–200%. the fair values of both components are measured separately, based on stochastic models. For further information on the LPP award, see page 117, Compensation.
16 members9 12 membersCHF thousands1 2012 2013
Base salary and allowances 2,3 12 985 12 984Funding of pension benefits 1 656 1 914total fixed compensation 14 641 14 898Cash Annual Performance incentive 4,5 12 394 10 072Value Alignment incentive (VAi) 8 359 8 532Long-term incentives (LPP)6 12 400 11 400total variable compensation 33 153 30 004total fixed and variable compensation7 47 794 44 902Compensation due to members leaving8 2 268total compensation 50 062 44 902
1 the company contributions to social security systems paid by Swiss Re in line with applicable laws amounted to CHF 4 961 777 in 2012 and CHF 3 116 428 in 2013. the table shows gross amounts.
2 Allowances consist of housing, schooling, lump sum expenses, child and similar allowances.3 For 2012, notional loan interest of CHF 8 265 for one Group eC member was not included. For 2013, the notional loan interest is included.4 For 2012, does not include sign-on bonuses in the amount of CHF 1.4 million as payments were made prior to joining the Group eC. 5 A post-award adjustment was made in 2013 in respect of one employee for the 2012 performance year. this incremental amount of CHF 220 000 related to duties prior to
joining the Group eC which is not included in the table above.6 disclosure reflects all awards within a compensation cycle eg the 2013 value reflects the fair value of LPP granted in March 2014.7 includes payments reflecting the time in the role as Group eC members.8 Covers legally or contractually required payments for members who were in the role for only a part of the reporting period.9 Represents incumbents and not positions.
246 swiss Re 2013 Financial Report

Financial statements | SwiSS Re Ltd
For US GAAP and statutory reporting purposes, VAi and long-term incentive awards are accrued over the period during which they are earned. For the purpose of the disclosure required of this note, the value of awards granted is included as compensation in the year of performance, for the years 2013 and 2012 respectively.
each member of the Group eC (including the Group CeO) participates in a defined contribution pension scheme. the funding of pension benefits shown in the table on pages 246 and 247 reflects the actual employer contributions.
Highest paid member of the Group ecin 2013, Michel M. Liès, CeO, was the highest paid member of the Group eC. the compensation of the Group CeOs for the respective periods was:
CHF thousands1 20122 2013
Base salary and allowances 1 663 1 639Funding of pension benefits 175 177total fixed compensation 1 838 1 816Cash Annual Performance incentive 1 450 1 600Value Alignment incentive 1 450 1 600Long-term incentives3 2 000 2 000total variable compensation 4 900 5 200total compensation 6 738 7 016
1 the company contributions to social security systems paid by Swiss Re in line with applicable laws amounted to CHF 613 490 in 2012 and CHF 491 381 in 2013. the table shows gross amounts.
2 For 2012, includes one month for the former Group CeO, Stefan Lippe, and 11 months for the current Group CeO, Michel M. Liès.3 disclosure reflects all awards within a compensation cycle e.g. the 2013 value reflects the fair value of LPP granted in March 2014.
swiss Re 2013 Financial Report 247

Financial statements | SwiSS Re Ltd
compensation of the Board of DirectorsGroup fees for the members of the Board of directors are delivered as 60% in cash and a mandatory 40% in Swiss Re shares with a four-year blocking period.
the share prices as of 12 April 2012 of CHF 57.15 and as of 9 April 2013 of CHF 78.10 were used for calculating the number of shares awarded to the members of the Board of directors based on the amount of the fee for 2012 and 2013, respectively.
individual compensation for the members of the Board of directors was:
in 2009 and 2010, the Chairman and the then Vice Chairman received half of their fees in the form of a three-year performance share plan and the balance in cash. the performance share plan was measured against total relative shareholder return (tSR). the 2009 and 2010 performance shares were granted at a reference price of CHF 36.00 and CHF 53.60, respectively. the final number of shares released after three years could vary between 0% and 150% depending on the relative total shareholder return against a peer group. the Group did not grant a performance share plan from 2011 onwards. the plans were settled in 2012 and 2013 respectively.
compensation for former members of governing bodiesin 2012, in the context of the outstanding mortgages and loans not at market rates for former members as well as of risk benefits, the equivalent of approximately CHF 60 000 was provided to three former members of the Group eC as a benefit in kind. No other compensation was paid to former members of the Group eC in 2012.
during 2013, payments in the total amount of CHF 1.1 million were made to seven former members of the Group eC. this amount includes a pro-rata base salary payment, company contributions to social security and pension systems paid by Swiss Re in line with applicable laws, benefits in the context of the outstanding mortgages and loans not at market rates, risk benefits as well as company commitments for tax related services.
CHF thousands1,2 total 2012
Fees and allowances in cash
Fees in blocked shares total 2013
walter B. Kielholz, Chairman 5 137 2 988 1 976 4 964Mathis Cabiallavetta, Vice Chairman3 2 556 1 482 988 2 470Renato Fassbind, Vice Chairman4 461 302 202 504Jakob Baer, Chairman of the Audit Committee 807 484 323 807Raymund Breu, Member 360 201 134 335Raymond K.F. Ch’ien, Member 360 212 141 353John R. Coomber, Member5 495 248 161 409Mary Francis, Member6 120 80 200Rajna Gibson Brandon, Member 335 197 131 328C. Robert Henrikson, Chairman of the Compensation Committee7 306 257 171 428Malcolm d. Knight, Member 332 212 141 353Hans Ulrich Maerki, Member 328 197 131 328Carlos e. Represas, Member8 385 273 111 384Jean-Pierre Roth, Member 284 166 111 277Robert A. Scott, former Chairman of the Compensation Committee9 145total 12 291 7 339 4 801 12 140
1 Compensation for the members of the Board of directors includes fixed fees and allowances both in cash and shares. No sign-on or severance payments are made.2 the company contributions to social security systems paid by Swiss Re in line with applicable laws amounted to CHF 1 294 292 in 2012 and CHF 1 282 026 in 2013.
the table shows gross amounts.3 Chairman of the Finance and Risk Committe since 13 April 2012, Chairman of the investment Committee.4 elected to Vice Chairman as of 13 April 2012.5 Chairman of the Finance and Risk Committe until 13 April 2012.6 elected to Swiss Re’s Board of directors at the Annual General Meeting of 10 April 2013.7 elected to Swiss Re’s Board of directors at the Annual General Meeting of 13 April 2012.8 includes fees for duties on the board of US Group companies.9 term of office expired as of 13 April 2012 and did not stand for re-election due to retirement.
248 swiss Re 2013 Financial Report

Financial statements | SwiSS Re Ltd
Group ec and Board of Directors share ownership, options and related instrumentsshare ownershipthe disclosure below is in line with article 663c para. 3 of the Swiss Code of Obligations, which requires disclosure of share ownership, options and related instruments individually for each member of the Board of directors and the Group eC.
the number of shares held as of 31 december were:
Members of the Group eC 2012 2013
Michel M. Liès, Group CeO1 129 562 171 947Guido Fürer, Group Chief investment Officer2 1 500 21 253Agostino Galvagni, CeO Corporate Solutions 69 371 108 060Jean-Jacques Henchoz, CeO Reinsurance eMeA 12 287 16 335Christian Mumenthaler, CeO Reinsurance 50 000 50 984Moses Ojeisekhoba, CeO Reinsurance Asia3 1 139 8 583George Quinn, Group CFO 57 987 96 506Matthias weber, Group Chief Underwriting Officer4 24 237 38 592thomas wellauer, Group Chief Operating Officer 16 714 17 708total 362 797 529 968
1 Appointed to the Group eC as of 1 February 2012.2 Appointed to the Group eC as of 1 November 2012.3 Appointed to the Group eC as of 15 March 2012.4 Appointed to the Group eC as of 1 April 2012.
Members of the Board of directors 2012 2013
walter B. Kielholz, Chairman 290 230 399 490Mathis Cabiallavetta, Vice Chairman1 54 546 109 177Renato Fassbind, Vice Chairman2 5 073 7 655Jakob Baer, Chairman of the Audit Committee 40 568 44 699Raymund Breu, Member 34 310 36 024Raymond K.F. Ch’ien, Member 13 240 15 048John R. Coomber, Member3 138 134 140 200Mary Francis, Member4 1 027Rajna Gibson Brandon, Member 24 368 26 047C. Robert Henrikson, Chairman of the Compensation Committee5 2 144 4 339Malcolm d. Knight, Member 5 857 7 665Hans Ulrich Maerki, Member 23 915 25 594Carlos e. Represas, Member 7 479 8 900Jean-Pierre Roth, Member 5 341 6 762total 645 205 832 627
1 Since 13 April 2012.2 elected to Vice Chairman as of 13 April 2012.3 Chairman of the Finance and Risk Committe until 13 April 2012.4 elected to Swiss Re’s Board of directors at the Annual General Meeting of 10 April 2013. 5 elected to Swiss Re’s Board of directors at the Annual General Meeting of 13 April 2012.
swiss Re 2013 Financial Report 249

Financial statements | SwiSS Re Ltd
Restricted sharesSwiss Re grants restricted share units on an ad hoc basis that are subject to a vesting period with a risk of forfeiture during the vesting period.
the following unvested restricted shares were held by members of the Group eC as of 31 december:
the remaining restricted share units granted to Moses Ojeisekhoba, CeO Reinsurance Asia, vest in 2014. For the years ended 31 december 2012 and 2013, the members of the Board of directors did not hold any restricted shares.
Performance sharesin 2009 and 2010, the Chairman and the then Vice Chairman received half their fees in the form of a performance share plan with a three-year vesting period. the Group did not grant any such plans from 2011 onwards.
the number of performance units outstanding as of 31 december 2012 were 55 971 for walter B. Kielholz, Chairman, and 27 986 for Mathis Cabiallavetta, Vice Chairman. the plan vested in 2013 and therefore no more units were outstanding as of 31 december 2013.
Vested optionsthe following vested options were held by members of Group governing bodies as of 31 december:
the vested options held by members of Group governing bodies as of 31 december 2012 and 2013 will expire between 2013–2015 and 2014–2015, respectively. the underlying exercise price for the outstanding option series has been adjusted for the special dividend payout in 2013.
the stock options shown in the table above for the members of the Board of directors were awarded at a period when the recipients were still members of Swiss Re’s executive management.
Number of optionsMembers of the Group eC 2012 2013
weighted average strike price in CHF as of grant date 82.32 83.92Michel M. Liès, Group CeO1 66 000 42 000Guido Fürer, Group Chief investment Officer2 7 500 7 500George Quinn, Group CFO 26 000 20 000Matthias weber, Group Chief Underwriting Officer3 9 500 7 000total 109 000 76 500
1 Appointed to the Group eC as of 1 February 2012.2 Appointed to the Group eC as of 1 November 2012.3 Appointed to the Group eC as of 1 April 2012.
Number of optionsMembers of the Board of directors 2012 2013
weighted average strike price in CHF as of grant date 86.26 83.04walter B. Kielholz, Chairman 40 000 40 000John R. Coomber, Member1 210 000 130 000total 250 000 170 000
1 Chairman of the Finance and Risk Committe until 13 April 2012.
Members of the Group eC 2012 2013
weighted average share price in CHF as of grant date 53.10 53.10Moses Ojeisekhoba, CeO Reinsurance Asia1 13 093 5 693total 13 093 5 693
1 Appointed to the Group eC as of 15 March 2012.
250 swiss Re 2013 Financial Report

Financial statements | SwiSS Re Ltd
loans to members of governing bodiesthe following tables provides an overview of loans to members of governing bodies as of 31 december:
the loan shown in the table above for the member of the Board of directors was established when the recipient was still a member of Swiss Re’s executive management.
in general, credit is secured against real estate or pledged shares. the terms and conditions of loans and mortgages are typically the same as those available to all employees of the Swiss Re Group in their particular locations to the extent possible. For example, in Switzerland fixed-rate mortgages have a maturity of five years and interest rates that correspond to the five-year Swiss franc swap rate plus a margin of 10 basis points.
Swiss based variable-rate mortgages have no agreed maturity dates. the basic preferential interest rates equal the corresponding interest rates applied by the Zurich Cantonal Bank minus one percentage point. to the extent that fixed or floating interest rates are preferential, such values were factored into the compensation sums given to the governing body members.
Related parties transactionsdisclosure in this note covers members of the Group eC and the Board of directors as indicated, and for both includes related parties to the extent applicable. Such related parties cover spouses, partners, children and other dependents or closely linked persons. in 2013, no compensation was paid to any related party.
CHF thousands 2012 2013
total mortgages and loans to members of the Group eC1 3 710 3 956Highest mortgages and loans to an individual member of the Group eC:
Christian Mumenthaler, CeO Reinsurance 2 143 1 919total mortgages and loans not at market conditions to former members of the Group eC 4 300 4 300Mortgages and loans to members of the Board of directors
walter B. Kielholz, Chairman 2 000 2 000
1 For 2012, a loan to one member of the Group eC of USd 800 000 was not included. For 2013, a remaining loan of USd 550 000 is included.
swiss Re 2013 Financial Report 251

Financial statements | SwiSS Re Ltd
this page intentionally left blank
252 swiss Re 2013 Financial Report

Financial statements | SwiSS Re Ltd
the Board of directors proposes to the Annual General Meeting to be held in Zurich on 11 April 2014 to approve the following allocations and dividend payments:
Dividendsif the Board of directors’ proposal for allocations and dividend payments is accepted, a regular dividend of CHF 3.85 per share and an additional special dividend of CHF 4.15 per share will be paid on 22 April 2014 from other reserves after prior reclassification of legal reserves from capital contributions.
Zurich, 17 March 2014
PRoPoSAL FoR ALLoCAtion oF diSPoSABLe PRoFit
CHF millions 2012 2013
Retained earnings brought forward 19 7net income for the financial year 2 718 2 707Disposable profit 2 737 2 714Allocation to other reserves –2 730 –2 710Retained earnings after allocation 7 4
CHF millions 2012 2013
other reserves brought forward – 2 730Allocation from retained earnings 2 730 2 710Reclassification of legal reserves from capital contributions into other reserves 2 5741 2 7382Regular dividend payment out of other reserves –1 2011 –1 3182Special dividend payment out of other reserves –1 3731 –1 4202Other reserves after allocations and dividend payments 2 730 5 440
1 Since the Board of directors’ proposal for allocation of disposable profit, included in the Annual Report 2012, the number of registered shares eligible for dividend, at the dividend payment date of 17 April 2013, decreased due to the transfer of 340 411 shares for employee participation purposes from eligible to not eligible for dividend. this resulted in a lower dividend of CHF 3 million, compared to the Board of directors’ proposal, and in higher legal reserves from capital contributions by the same amount.
2 the Board of directors’ proposal to the Annual General Meeting of 11 April 2014, is subject to the actual number of shares outstanding and eligible for dividend.
Share structure per 31 december 2013number of
registered sharesnominal
capital in CHF
eligible for dividend1 342 195 633 34 219 563not eligible for dividend 28 511 298 2 851 130
total shares issued 370 706 931 37 070 693
1 the Board of directors’ proposal to the Annual General Meeting of 11 April 2014, is subject to the actual number of shares outstanding and eligible for dividend.
swiss Re 2013 Financial Report 253

Financial statements | SwiSS Re Ltd
RePoRt oF tHe StAtutoRy AuditoR
Report of the statutory auditor to the General Meeting of Swiss Re Ltd Zurich
Report of the statutory auditor on the Financial statementsAs statutory auditor, we have audited the financial statements of Swiss Re Ltd, which comprise the income statement, balance sheet and notes (pages 237 to 252), for the year ended 31 december 2013.
Board of Directors’ Responsibilitythe Board of directors is responsible for the preparation of the financial statements in accordance with the requirements of Swiss law and the Company’s articles of incorporation. this responsibility includes designing, implementing and maintaining an internal control system relevant to the preparation of financial statements that are free from material misstatement, whether due to fraud or error. the Board of directors is further responsible for selecting and applying appropriate accounting policies and making accounting estimates that are reasonable in the circumstances.
Auditor’s Responsibilityour responsibility is to express an opinion on these financial statements based on our audit. we conducted our audit in accordance with Swiss law and Swiss Auditing Standards. those standards require that we plan and perform the audit to obtain reasonable assurance whether the financial statements are free from material misstatement.
An audit involves performing procedures to obtain audit evidence about the amounts and disclosures in the financial statements. the procedures selected depend on the auditor’s judgment, including the assessment of the risks of material misstatement of the financial statements, whether due to fraud or error. in making those risk assessments, the auditor considers the internal control system relevant to the entity’s preparation of the financial statements in order to design audit procedures that are appropriate in the circumstances, but not for the purpose of expressing an opinion on the effectiveness of the entity’s internal control system. An audit also includes evaluating the appropriateness of the accounting policies used and the reasonableness of accounting estimates made, as well as evaluating the overall presentation of the financial statements. we believe that the audit evidence we have obtained is sufficient and appropriate to provide a basis for our audit opinion.
Opinionin our opinion, the financial statements for the year ended 31 december 2013 comply with Swiss law and the Company’s articles of incorporation.
Report on other legal requirementswe confirm that we meet the legal requirements on licensing according to the Auditor oversight Act (AoA) and independence (article 728 Co and article 11 AoA) and that there are no circumstances incompatible with our independence.
in accordance with article 728a paragraph 1 item 3 Co and Swiss Auditing Standard 890, we confirm that an internal control system exists which has been designed for the preparation of financial statements according to the instructions of the Board of directors.
we further confirm that the proposal for allocation of disposable profit complies with Swiss law and the Company’s articles of incorporation. we recommend that the financial statements submitted to you be approved.
PricewaterhouseCoopers Ltd
Alex Finn Bret Griffin Audit expert Auditor in charge
Zurich, 17 March 2014
254 swiss Re 2013 Financial Report

Financial statements | SwiSS Re Ltd
this page intentionally left blank
swiss Re 2013 Financial Report 255

256 Swiss Re 2013 Financial Report

General informationHeadquartered in Zurich, Switzerland, Swiss Re has operations across the globe. Our corporate structure allows us to sharpen our client focus, improve transparency and accountability, increase capital efficiency and operate with greater flexibility.
258 Glossary264 Cautionary note on
forward-looking statements266 Note on risk factors272 Business contact details273 Corporate calendar
Swiss Re 2013 Financial Report 257
GeNeRal iNfoRmatioN | IntROductIOn
GeNeRal iNfoRmatioN
GlOSSaRy
Risk that arises when a large number of individual risks are correlated such that a single event will affect many or all of these risks.
that portion of an insurance premium which represents the cost of obtaining the insurance business: it includes the intermediaries’ commission, the company’s sales expense and other related expenses.
Business unit through which Swiss Re acquires closed blocks of in-force life and health insurance business, either through reinsurance or corporate acquisition, and typically assumes responsibility for administering the underlying policies.
Securities backed by notes or receivables against assets such as auto loans, credit cards, royalties, student loans and insurance.
Management of a business in a way that coordinates decisions on assets and liabilities. Specifically, the ongoing process of formulating, implementing, monitoring and revising strategies related to assets and liabilities in an attempt to achieve financial objectives for a given set of risk tolerances and constraints.
Insurance of accident and liability risks, as well as hull damage, connected with the operation of aircraft.
the ratio of ordinary shareholders’ equity to the number of common shares entitled to dividend.
Insurance covering the loss of earnings resulting from, and occurring after, destruction of property; also known as “loss of profits” or “business income protection insurance”.
Maximum amount of risk that can be accepted in insurance. capacity also refers to the amount of insurance coverage allocated to a particular policyholder or in the marketplace in general.
Branch of insurance – mainly comprising accident and liability business – which is separate from property, engineering and life insurance.
Risk-based securities that allow insurance and reinsurance companies to transfer peak insurance risks, including natural catastrophes, to institutional investors in the form of bonds. catastrophe bonds help to spread peak exposures (see insurance-linked securities).
Insurance that is reinsured: the passing of the insurer’s risks to the reinsurer against payment of a premium. the insurer is referred to as the ceding company or cedent.
demand by an insured for indemnity under an insurance contract.
activities in connection with the investigation, settlement and payment of claims from the time of their occurrence until settlement.
all claims payments plus the adjustment in the outstanding claims provision of a business year and claim adjustment expenses.
Sum of claims paid, change in the provisions for unpaid claims and claim adjustment expenses in relation to premiums earned.
accumulation risk
acquisition costs
admin Re®
asset-backed security
asset-liability management (alm)
aviation insurance
Book value per share
Business interruption
Capacity
Casualty insurance
Catastrophe bonds
Cession
Claim
Claims handling
Claims incurred and claim adjustment expenses
Claims ratio
258 Swiss Re 2013 Financial Report

GeNeRal iNfoRmatioN | GlOSSaRy
arrangement by which a number of insurers and/or reinsurers share a risk.
the ratio is a combination of the non-life claims ratio and the expense ratio.
Remuneration paid by the insurer to its agents, brokers or intermediaries, or by the reinsurer to the insurer, for costs in connection with the acquisition and administration of insurance business.
the termination of a reinsurance contract by agreement of the parties on the basis of one or more lump sum payments by the reinsurer which extinguish its liability under the contract. the payment made by the reinsurer commonly relates to incurred losses under the contract.
Insurance and reinsurance protection of one or more specific risk exposures based on a contractual agreement.
Insurance against financial losses sustained through the failure, for commercial reasons, of policyholders’ clients to pay for goods or services supplied to them.
applies to derivative products. difference in the value of two options, when the value of the one sold exceeds the value of the one bought.
liability insurance for directors and officers of an entity, providing cover for their personal legal liability towards shareholders, creditors, employees and others arising from wrongful acts such as errors and omissions.
Insurance against the incapacity to exercise a profession as a result of sickness or other infirmity.
Portion of a company’s profit allocated to each outstanding share of common stock. Earnings per share is calculated by dividing net income by the weighted average number of common shares outstanding during the period.
Sum of acquisition costs and other operating costs and expenses, in relation to premiums earned.
a feature of variable annuity business. the benefit is a predetermined minimum amount that the beneficiary will receive upon the death of the insured.
Globally Systemically Important Insurers.
Generic term applying to all types of insurance indemnifying or reimbursing for losses caused by bodily injury or sickness or for expenses of medical treatment necessitated by sickness or accidental bodily injury.
Provision for claims incurred but not reported by the balance sheet date. In other words, it is anticipated that an event will affect a number of policies, although no claims have been made so far, and is therefore likely to result in liability for the insurer.
Bonds for which the payment of interest and/or principal depends on the occurrence or severity of an insurance event. the underlying risk of the bond is a peak or volume insurance risk.
Coinsurance
Combined ratio
Commission
Commutation
Cover
Credit insurance
Credit spreads
Directors’ and officers’ liability insurance (D&o)
Disability insurance
earnings per share (ePS)
expense ratio
Guaranteed minimum death benefit (GmDB)
G-Siis
Health insurance
incurred but not reported (iBNR)
insurance-linked securities (ilS)
Swiss Re 2013 Financial Report 259

GeNeRal iNfoRmatioN | GlOSSaRy
Section of cover in a non-proportional reinsurance programme in which total coverage is divided into a number of consecutive layers starting at the retention or attachment point of the ceding company up to the maximum limit of indemnity. Individual layers may be placed with different insurers or reinsurers.
Insurance for damages that a policyholder is obliged to pay because of bodily injury or property damage caused to another person or entity based on negligence, strict liability or contractual liability.
Insurance that provides for the payment of a sum of money upon the death of the insured, or upon the insured surviving a given number of years, depending on the terms of the policy. In addition, life insurance can be used as a means of investment or saving.
the risk to which a pension fund or life insurance company could be exposed as a result of higher-than-expected payout ratios. Increasing life expectancy trends among policyholders and pensioners can result in payout levels that are higher than originally accounted for.
line of insurance which includes coverage for property in transit (cargo), means of transportation (except aircraft and motor vehicles), offshore installations and valuables, as well as liabilities associated with marine risks and professions.
adjustment of the book value or collateral value of a security, portfolio or account that reflects its current market value.
line of insurance which offers coverage for property, accident and liability losses involving motor vehicles.
Receivables related to deposit accounting contracts (contracts which do not meet risk transfer requirements) less payables related to deposit contracts.
all classes of insurance business excluding life insurance.
Form of reinsurance in which coverage is not in direct proportion to the original insurer’s loss; instead the reinsurer is liable for a specified amount which exceeds the insurer’s retention; also known as “excess of loss reinsurance”.
the operating margin is calculated as operating result divided by total operating revenues. the operating result is before interest expenses, taxes and net realised gains/losses.
Premiums earned plus net investment income plus other revenues.
Risk arising from failure of operational processes, internal procedures and controls leading to financial loss.
the payment, or one of the periodical payments, a policyholder agrees to make for an insurance policy.
Premiums an insurance company has recorded as revenues during a specific accounting period.
layer
liability insurance
life insurance
longevity risk
marine insurance
mark-to-market
motor insurance
Net reinsurance assets
Non-life insurance
Non-proportional reinsurance
operating margin ratio
operating revenues
operational risk
Premium
Premiums earned
260 Swiss Re 2013 Financial Report

GeNeRal iNfoRmatioN | GlOSSaRy
Premiums for all policies sold during a specific accounting period.
Insurance covering the liability of the manufacturer or supplier of goods for damage caused by their products.
liability insurance cover which protects professional specialists such as physicians, architects, engineers, lawyers, accountants and others against third-party claims arising from activities in their professional field; policies and conditions vary according to profession.
collective term for fire and business interruption insurance as well as burglary, fidelity guarantee and allied lines.
Form of reinsurance arrangement in which the premiums earned and the claims incurred of the cedent are shared proportionally by the cedent and the reinsurer.
Intangible asset primarily arising from the purchase of life and health insurance companies or portfolios.
Form of proportional reinsurance in which a defined percentage of the premiums earned and the claims incurred by the cedent in a specific line is reinsured for a given period. Quota share reinsurance arrangements represent a sharing of business in a fixed ratio or proportion.
Insurance which lowers the risk carried by primary insurance companies. Reinsurance includes various forms such as facultative, financial, non-proportional, proportional, quota share, surplus and treaty reinsurance.
amount required to be carried as a liability in the financial statements of an insurer or reinsurer to provide for future commitments under outstanding policies and contracts.
amount of risk which the policyholder or insurer does not insure or reinsure but keeps for its own account.
amount of the risk accepted by the reinsurer which is then passed on to other reinsurance companies.
net income as a percentage of time-weighted shareholders’ equity.
Operating income as a percentage of average invested assets. Invested assets include investments, cash and cash equivalents, securities in transit, financial liabilities and exclude policy loans and certain Group items.
condition in which there is a possibility of injury or loss; also used by insurance practitioners to indicate the property insured or the peril insured against.
Management tool for the comprehensive identification and assessment of risks based on knowledge and experience in the fields of natural sciences, technology, economics and statistics.
net investment income on fixed income positions, including coupon income and amortisation, as a percentage of the cost of the securities.
Premiums written
Product liability insurance
Professional indemnity insurance
Property insurance
Proportional reinsurance
Present value of future profits (PVfP)
Quota share reinsurance
Reinsurance
Reserves
Retention
Retrocession
Return on equity
Return on investments
Risk
Risk management
Running yield
Swiss Re 2013 Financial Report 261

GeNeRal iNfoRmatioN | GlOSSaRy
Financial transaction in which future cash flows from assets (or insurable risks) are pooled, converted into tradable securities and transferred to capital market investors. the assets are commonly sold to a special-purpose entity, which purchases them with cash raised through the issuance of beneficial interests (usually debt instruments) to third-party investors.
new regulatory framework for Eu re/insurance solvency rules scheduled to replace the current Solvency I regime. Introducing a comprehensive, economic and risk-based regulation, Solvency II includes prudential requirements on solvency capital, risk modelling, supervisory control and disclosure.
Form of reinsurance that protects the ceding insurer against an aggregate amount of claims over a period, in excess of either a stated amount or a specified percentage of estimated benefit costs. an example of this is employer stop-loss (ESl) coverage, which is used by uS companies to cap losses on self-funded group health benefit programmes. the stop-loss can apply to specific conditions or aggregate losses.
Sureties and guarantees issued to third parties for the fulfilment of contractual liabilities.
Form of proportional reinsurance in which risks are reinsured above a specified amount.
Switzerland already introduced an economic and risk-based insurance regulation, similar to the objectives of the Solvency II project in the Eu. Since 2008, all insurance and reinsurance companies writing business in Switzerland have had to implement the SSt, and since 1 January 2011, the SSt-based target capital requirement is in force and companies must achieve economic solvency.
See “Value at risk”.
Operating income plus net unrealised gains/losses on available-for-sale securities as a percentage of average invested assets. Invested assets include investments, cash and cash equivalents, securities in transit, financial liabilities and exclude policy loans and certain Group items.
Participation of the reinsurer in certain sections of the insurer’s business as agreed by treaty, as opposed to single risks.
Premiums earned less the sum of claims paid, change in the provision for unpaid claims and claim adjustment expenses and expenses (acquisition costs and other operating costs and expenses).
Part of written premium (paid or owed) which relates to future coverage and for which services have not yet been provided; this is carried in an unearned premium reserve and may be refundable if the contract is cancelled before expiry.
a life insurance contract which provides policyholder funds which are linked to an underlying investment product or fund. the performance of the policyholder funds is borne by the policyholder.
Securitisation
Solvency ii
Stop-loss reinsurance
Surety insurance
Surplus reinsurance
Swiss Solvency test (SSt)
tail VaR
total return on investments
treaty reinsurance
Underwriting result
Unearned premium
Unit-linked policy
262 Swiss Re 2013 Financial Report

GeNeRal iNfoRmatioN | GlOSSaRy
united States Generally accepted accounting Principles are the accounting rules, as issued by the Financial accounting Standards Board (FaSB), its predecessors and other bodies, used to prepare financial statements for publicly traded companies in the united States.
traditional uS life business subject to the naIc Valuation of life Insurance Model Regulation or new york Regulation 147 (collectively: ‘Regulation XXX’). Regulation XXX states that business retained in the uS does not require collateral, provided the reinsurer is licensed in the state of the company ceding business; however, business retroceded to a foreign reinsurer is subject to collateral (apart from funds withheld).
Maximum possible loss in market value of an asset portfolio within a given time span and at a given confidence level. 99% VaR measures the level of loss likely to be exceeded in only one year out of a hundred, while 99.5% VaR measures the loss likely to be exceeded in only one year out of two hundred. 99% tail VaR estimates the average annual loss likely to occur with a frequency of less than once in one hundred years.
an insurance contract that has additional amounts added to the sum insured, or paid/credited separately to the policyholder as a bonus, which result from a share of the profit generated by the with-profits insurance funds, including these funds’ interests in other blocks of business.
Some of the terms included in the glossary are explained in more detail in note 1 to the Group financial statements.
Swiss Re uses some of the term definitions provided by the glossary of the International association of Insurance Supervisors (IaIS).
US GaaP
US XXX term insurance
Value at risk (VaR)
With-profit policy
Swiss Re 2013 Financial Report 263

GeNeRal iNfoRmatioN
cautIOnaRy nOtE On FORwaRd-lOOkInG StatEMEntS
certain statements and illustrations contained herein are forward-looking. these statements (including as to plans, objectives, targets and trends) and illustrations provide current expectations of future events based on certain assumptions and include any statement that does not directly relate to a historical fact or current fact.
Forward-looking statements typically are identified by words or phrases such as “anticipate”, “assume”, “believe”, “continue”, “estimate”, “expect”, “foresee”, “intend”, “may increase”, “may fluctuate” and similar expressions, or by future or conditional verbs such as “will”, “should”, “would” and “could”. these forward-looking statements involve known and unknown risks, uncertainties and other factors, which may cause Swiss Re’s actual results of operations, financial condition, solvency ratios, liquidity position or prospects to be materially different from any future results of operations, financial condition, solvency ratios, liquidity position or prospects expressed or implied by such statements or cause Swiss Re to not achieve its published targets. Such factors include, among others: instability affecting the global financial system and developments related thereto; deterioration in global economic conditions; Swiss Re’s ability to maintain sufficient liquidity and access to capital markets,
including sufficient liquidity to cover potential recapture of reinsurance agreements, early calls of debt or debt-like arrangements and collateral calls due to actual or perceived deterioration of Swiss Re’s financial strength or otherwise;
the effect of market conditions, including the global equity and credit markets, and the level and volatility of equity prices, interest rates, credit spreads, currency values and other market indices, on Swiss Re’s investment assets;
changes in Swiss Re’s investment result as a result of changes in its investment policy or the changed composition of its investment assets, and the impact of the timing of any such changes relative to changes in market conditions;
uncertainties in valuing credit default swaps and other credit-related instruments; possible inability to realise amounts on sales of securities on Swiss Re’s balance sheet
equivalent to their mark-to-market values recorded for accounting purposes; the outcome of tax audits, the ability to realise tax loss carryforwards and the ability to
realise deferred tax assets (including by reason of the mix of earnings in a jurisdiction or deemed change of control), which could negatively impact future earnings;
the possibility that Swiss Re’s hedging arrangements may not be effective; the lowering or loss of one of the financial strength or other ratings of one or more
Swiss Re companies, and developments adversely affecting Swiss Re’s ability to achieve improved ratings;
the cyclicality of the reinsurance industry; uncertainties in estimating reserves;
264 Swiss Re 2013 Financial Report

GeNeRal iNfoRmatioN | cautIOnaRy nOtE On FORwaRd-lOOkInG StatEMEntS
uncertainties in estimating future claims for purposes of financial reporting, particularly with respect to large natural catastrophes, as significant uncertainties may be involved in estimating losses from such events and preliminary estimates may be subject to change as new information becomes available;
the frequency, severity and development of insured claim events; acts of terrorism and acts of war; mortality, morbidity and longevity experience; policy renewal and lapse rates; extraordinary events affecting Swiss Re’s clients and other counterparties, such as
bankruptcies, liquidations and other credit-related events; current, pending and future legislation and regulation affecting Swiss Re or its ceding
companies and the interpretation of legislation or regulations; legal actions or regulatory investigations or actions, including those in respect of
industry requirements or business conduct rules of general applicability; changes in accounting standards; significant investments, acquisitions or dispositions, and any delays, unexpected costs
or other issues experienced in connection with any such transactions; changing levels of competition; and operational factors, including the efficacy of risk management and other internal
procedures in managing the foregoing risks.
these factors are not exhaustive. Swiss Re operates in a continually changing environment and new risks emerge continually. Readers are cautioned not to place undue reliance on forward-looking statements. Swiss Re undertakes no obligation to publicly revise or update any forward-looking statements, whether as a result of new information, future events or otherwise.
this communication is not intended to be a recommendation to buy, sell or hold securities and does not constitute an offer for the sale of, or the solicitation of an offer to buy, securities in any jurisdiction, including the united States. any such offer will only be made by means of a prospectus or offering memorandum, and in compliance with applicable securities laws.
Swiss Re 2013 Financial Report 265

GeNeRal iNfoRmatioN
nOtE On RISk FactORS
General impact of adverse market conditions the recent temporary federal government shutdown in the united States and politicised discussions over increasing the u.S. debt limit, the market reaction to prospects of a tapering of the Federal Reserve’s asset purchase programme, and recent pessimistic global growth forecasts by the Organisation of Economic cooperation and development and the International Monetary Fund, among others, highlight the continued uncertainties around the post-crisis recovery and the risks that the world economy continues to face. In the European union, it remains unclear whether proposals for a single resolution mechanism and other components of a banking union, as well as actions of the European central Bank or the outcome of the upcoming European parliament elections, will create the conditions necessary for increased bank lending and greater economic growth. the volatility in the financial and credit markets could increase the severity and duration of economic recession, cause more economic turmoil in the near term, cause further disruptions in the global financial markets and impact foreign currency exchange rates. these uncertainties could be exacerbated by the uncertainty over the pace and extent of future economic growth in emerging markets. these developments in turn could have an adverse impact on the investment results of Swiss Re ltd (“Swiss Re”) and its direct or indirect subsidiaries (collectively, the “Group” or the “Swiss Re Group”), the Group’s ability to access the capital markets and the bank funding market, the ability of counterparties to meet their obligations to the Group and the short-term outlook for the life insurance industry, particularly in north america and Europe, with a corresponding negative impact on the Group’s life & Health business.
the foregoing developments could have material adverse effects on the Group’s industry and on the Group.
Regulatory changesSwiss Re and its subsidiaries are subject to Group supervision, and some of its subsidiaries are regulated in a number of jurisdictions in which they conduct business. new legislation as well as changes to existing legislation have been proposed and/or recently adopted in a number of jurisdictions that are expected to alter, in a variety of ways, the manner in which the financial services industry is regulated. although it is difficult to predict which proposals will become law and when and how new legislation ultimately will be implemented by regulators (including in respect of the extraterritorial effect of reforms), it is likely that significant aspects of existing regulatory regimes governing financial services will change. these include changes as to which governmental bodies regulate financial institutions, changes in the way financial institutions generally are regulated, enhanced governmental authority to take control over operations of financial institutions, restrictions on the conduct of certain lines of business, changes in the way financial institutions account for transactions and securities positions, changes in disclosure obligations and changes in the way rating agencies rate the creditworthiness and financial strength of financial institutions.
although early regulatory efforts were focused primarily on banking institutions, there is a noticeable trend to extend the scope of proposals beyond banks to cover insurance and reinsurance operations. legislative initiatives directly impacting the Group’s industry include the establishment of a pan-European regulator for insurance companies, the European Insurance and Occupational Pension authority (the “EIOPa”), which has the power to overrule national regulators in certain circumstances. In addition, Swiss Re as a Group is subject to the Swiss Solvency test, and will be subject to Solvency II, which is expected to enter into force 1 January 2016. In the united States, as a possible step towards federal oversight of insurance, the uS congress created the Federal Insurance Office within the department of treasury and, more recently, as a result of the Solvency Modernization Initiative of the national association of Insurance commissioners, we are experiencing greater uS scrutiny of our global operations and more extensive reporting
266 Swiss Re 2013 Financial Report

GeNeRal iNfoRmatioN | nOtE On RISk FactORS
obligations. In addition, provisions of the wall Street Reform and consumer Protection act of 2010, as well as provisions in the proposed European Market Infrastructure Regulation and proposed changes to the Markets in Financial Instruments directive (MiFId), in respect of derivatives could have a significant impact on the Group.
Other changes remain focused principally on banking institutions, but some could have direct applicability to insurance or reinsurance operations and others could have a general impact on the regulatory landscape for financial institutions, which might indirectly impact our capital requirements and/or required reserve levels or have other direct or indirect effects on the Group. changes are particularly likely to impact financial institutions designated as “systemically important”, a designation which is expected to result in enhanced regulatory supervision and heightened capital, liquidity and diversification requirements under evolving reforms. there is an emerging focus on classifying certain insurance companies as systemically important as well. the Group could be designated as a global systemically important financial institution. Separately, the International association of Insurance Supervisors, an international body that represents insurance regulators and supervisors, published a methodology for identifying global systemically important insurers (G-SIIs) and a framework for supervision of internationally active insurance groups. Initial designation of insurers as G-SIIs took place in July 2013, and initial designation of reinsurers as G-SIIs is expected in July 2014. the Group could be subject to one or both of the resulting regimes, once implemented. In particular, the Group believes that there is a reasonable likelihood that it will be designated as a G-SII when the initial reinsurer designations are issued.
Significant policy decisions on a range of regulatory changes that could affect us and our operations remain undecided. the Group cannot predict which legislative and regulatory initiatives ultimately will be enacted or promulgated, what the scope and content of these initiatives ultimately will be, when they will be effective and what the implications will be for the industry, in general, and for the Group, in particular. certain of these initiatives could have a material impact on the Group’s business.
In addition, regulatory changes could occur in areas of broader application, such as competition policy and tax laws. changes in tax laws, for example, could increase the taxes the Group pays, the attractiveness of products offered by the Group, the Group’s investment activities and the value of deferred tax assets. any number of these changes could apply to the Group and its operations. these changes, or inconsistencies between the various regimes that apply or will apply to the Group, could increase the costs of doing business, reduce access to liquidity, limit the scope of business or affect the competitive balance, or could make reinsurance less attractive to primary insurers.
market riskVolatility and disruption in the global financial markets can expose the Group to significant financial and capital markets risk, including changes in interest rates, credit spreads, equity prices and foreign currency exchange rates, which may adversely impact the Group’s financial condition, results of operations, liquidity and capital position. the Group’s exposure to interest rate risk is primarily related to the market price and cash flow variability associated with changes in interest rates. Exposure to credit spreads primarily relates to market price and cash flow variability associated with changes in credit spreads. when credit spreads widen, the net unrealised loss position of the Group’s investment portfolio can increase, as could other-than-temporary impairments. with respect to equity prices, the Group is exposed to changes in the level and volatility of equity prices, as they affect the value of equity securities themselves as well as the value of securities or instruments that derive their value from a particular equity security, a basket of equity securities or a stock index. the Group is also subject to equity price risk to the extent that the values of life-related benefits under certain products and life contracts, most notably variable annuity business, are tied to financial market values; to the extent market values fall, the financial exposure on guarantees related to these contracts would
Swiss Re 2013 Financial Report 267

GeNeRal iNfoRmatioN | nOtE On RISk FactORS
increase to the extent this exposure is not hedged. while the Group has discontinued writing new variable annuity business and has in place an extensive hedging programme covering its existing variable annuity business that it believes is sufficient, certain risks cannot be hedged, including actuarial risks, basis risk and correlation risk. Exposure to foreign exchange risk arises from exposures to changes in spot prices and forward prices as well as to volatile movements in exchange rates.
these risks can have a significant effect on investment returns and market values of securities positions, which in turn may affect both the Group’s results of operations and financial condition. the Group continues to focus on asset-liability management for its investment portfolio, but pursuing even this strategy has its risks – including possible mismatch – that in turn can lead to reinvestment risk. the Group seeks to manage the risks inherent in its investment portfolio by repositioning the portfolio from time to time, as needed, and to reduce risk and fluctuations through the use of hedges and other risk management tools.
Credit riskIf the credit markets were again to deteriorate and further asset classes were to be impacted, the Group could experience further losses. changes in the market value of the underlying securities and other factors impacting their price could give rise to market value losses. If the credit markets were to deteriorate again, the Group could also face further write-downs in other areas of its portfolio, including other structured instruments, and the Group and its counterparties could once again face difficulties in valuing credit-related instruments. differences in opinion with respect to valuations of credit-related instruments could result in legal disputes among the Group and its counterparties as to their respective obligations, the outcomes of which are difficult to predict and could be material.
liquidity risksthe Group’s business requires, and its clients expect, that it has sufficient capital and sufficient liquidity to meet its reinsurance obligations, and that this would continue to be the case following the occurrence of any foreseeable event or series of events, including extreme catastrophes, that would trigger insurance or reinsurance coverage obligations. the Group’s uses of funds include obligations arising in its reinsurance business (including claims and other payments as well as insurance provision repayments due to portfolio transfers, securitisations and commutations), which may include large and unpredictable claims (including catastrophe claims), funding of capital requirements and operating costs, payment of principal and interest on outstanding indebtedness and funding of acquisitions. the Group also has unfunded capital commitments in its private equity and hedge fund investments, which could result in funding obligations at a time when it is subject to liquidity constraints. In addition, the Group has potential collateral requirements in connection with a number of reinsurance arrangements, the amounts of which may be material and the meeting of which could require the Group to liquidate cash equivalents or other securities. the Group manages liquidity and funding risks by focusing on the liquidity stress that is likely to result from extreme capital markets scenarios or from extreme loss events, or combinations of the two. Generally, the ability to meet liquidity needs could be adversely impacted by factors that the Group cannot control, such as market dislocations or interruptions, adverse economic conditions, severe disruption in the financial and worldwide credit markets and the related increased constraints on the availability of credit; changes in interest rates, foreign exchange rates and credit spreads; or by perceptions among market participants of the extent of the Group’s liquidity needs.
the Group may not be able to secure new sources of liquidity or funding, should projected or actual liquidity fall below levels it requires. the ability to meet liquidity needs through asset sales may be constrained by market conditions and the related stress on valuations, and through third-party funding may be limited by constraints on the general
268 Swiss Re 2013 Financial Report

GeNeRal iNfoRmatioN | nOtE On RISk FactORS
availability of credit and willingness of lenders to lend. In addition, the Group’s ability to meet liquidity needs may also be constrained by regulatory requirements that require regulated entities to maintain or increase regulatory capital, or that restrict intra-group transactions, the timing of dividend payments from subsidiaries or the fact that certain assets may be encumbered or otherwise non-tradable. Failure to meet covenants in lending arrangements could give rise to collateral-posting or defaults, and further constrain access to liquidity. Finally, any adverse ratings action could trigger a need for further liquidity (for example, by triggering termination provisions or collateral delivery requirements in contracts to which the Group is a party) at a time when the Group’s ability to obtain liquidity from external sources is limited by such ratings action.
Counterparty risksthe Group’s general exposure to counterparty risk was heightened during the credit crisis, and this risk could still be exacerbated to the extent defaults, or concerns about possible defaults, by certain market participants trigger more systemic concerns about liquidity. losses due to defaults by counterparties, including issuers of investment securities (which include structured securities) or derivative instrument counterparties, could adversely affect the Group. In addition, trading counterparties, counterparties under swaps and other derivative contracts, and financial intermediaries may default on their obligations due to bankruptcy, insolvency, lack of liquidity, adverse economic conditions, operational failure, fraud or other reasons, which could also have a material adverse effect on the Group.
the Group could also be adversely affected by the insolvency of, or other credit constraints affecting, counterparties in its reinsurance operations. Moreover, the Group could be adversely affected by liquidity issues at ceding companies or at third parties to whom the Group has retroceded risk, and such risk could be exacerbated to the extent any such exposures are concentrated.
Risks relating to credit rating downgradesRatings are an important factor in establishing the competitive position of reinsurance companies, and market conditions could increase the risk of downgrade. third-party rating agencies assess and rate the financial strength of reinsurers and insurers. these ratings are intended to measure a company’s ability to repay its obligations and are based upon criteria established by the rating agencies.
the Group’s ratings reflect the current opinion of the relevant rating agencies. One or more of its ratings could be downgraded or withdrawn in the future. Rating agencies may increase the frequency and scope of ratings reviews, revise their criteria or take other actions that may negatively impact the Group’s ratings. In addition, changes to the process or methodology of issuing ratings, or the occurrence of events or developments affecting the Group, could make it more difficult for the Group to achieve improved ratings, which it would otherwise have expected.
as claims paying and financial strength ratings are key factors in establishing the competitive position of reinsurers, a decline in ratings alone could make reinsurance provided by the Group less attractive to clients relative to reinsurance from competitors with similar or stronger ratings. a decline in ratings could also cause the loss of clients who are required by either policy or regulation to purchase reinsurance only from reinsurers with certain ratings. a decline in ratings could also impact the availability and terms of unsecured financing and obligate the Group to provide collateral or other guarantees in the course of its reinsurance business or trigger early termination of funding arrangements. any rating downgrades could also have a material adverse impact on the Group’s costs of borrowing and limit its access to the capital markets. Further negative ratings action could also impact reinsurance contracts.
Swiss Re 2013 Financial Report 269

GeNeRal iNfoRmatioN | nOtE On RISk FactORS
legal and regulatory risksIn the ordinary course of business, the Group is involved in lawsuits, arbitrations and other formal and informal dispute resolution procedures, the outcomes of which determine rights and obligations under insurance, reinsurance and other contractual agreements. From time to time, the Group may institute, or be named as a defendant in, legal proceedings, and the Group may be a claimant or respondent in arbitration proceedings. these proceedings could involve coverage or other disputes with ceding companies, disputes with parties to which the Group transfers risk under reinsurance arrangements, disputes with other counterparties or other matters. the Group cannot predict the outcome of any of the foregoing, which could be material for the Group.
the Group is also involved, from time to time, in investigations and regulatory proceedings, certain of which could result in adverse judgments, settlements, fines and other outcomes. the number of these investigations and proceedings involving the financial services industry has increased in recent years, and the potential scope of these investigations and proceedings has also increased, not only in respect of matters covered by the Group’s direct regulators, but also in respect of compliance with broader business conduct rules, such as market abuse regulations, anti-bribery legislation, anti-money laundering legislation and trade sanctions legislation. the Group also is subject to audits and challenges from time to time by tax authorities, which could result in increases in tax costs, changes to internal structures and interests and penalties. the Group could be subject to risks arising from alleged, or actual, violations of any of the foregoing, and could also be subject to risks arising from potential employee misconduct, including non-compliance with internal policies and procedures. Substantial legal liability could materially adversely affect the Group’s business, financial condition or results of operations or could cause significant reputational harm, which could seriously affect its business.
insurance, operational and other risksas part of the Group’s ordinary course of operations, the Group is subject to a variety of risks, including risks that reserves may not adequately cover future claims and benefits, risks that catastrophic events (including hurricanes, windstorms, floods, earthquakes, acts of terrorism, man-made disasters such as industrial accidents, explosions, and fires, and pandemics) may expose the Group to unexpected large losses (and related uncertainties in estimating future claims in respect of such events); changes in the insurance industry that affect ceding companies, particularly those that further increase their sensitivity to counterparty risk; competitive conditions; cyclicality of the industry; risks related to emerging claims and coverage issues (including, for example, trends to establish stricter building standards, which can lead to higher industry losses for earthquake cover based on higher replacement values); risks arising from the Group’s dependence on policies, procedures and expertise of ceding companies; risks related to investments in emerging markets; and risks related to the failure of operational systems and infrastructure. In addition, the occurrence of future risks that the Group’s risk management procedures fail to identify or anticipate could have a material adverse effect on the Group. any of the foregoing, as well as other concerns in respect of the Group’s business, could also give rise to reputational risk.
270 Swiss Re 2013 Financial Report

GeNeRal iNfoRmatioN | nOtE On RISk FactORS
Use of models; accounting mattersthe Group is subject to risks relating to the preparation of estimates and assumptions that management uses, for example, as part of its risk models as well as those that affect the reported amounts of assets, liabilities, revenues and expenses in the Group’s financial statements, including assumed and ceded business. For example, the Group estimates premiums pending receipt of actual data from ceding companies, and such actual data could deviate from the Group’s estimates. In addition, particularly with respect to large natural catastrophes, it may be difficult to estimate losses, and preliminary estimates may be subject to a high degree of uncertainty and change as new information becomes available. deterioration in market conditions could have an adverse impact on assumptions used for financial reporting purposes, which could affect possible impairment of present value of future profits, fair value of assets and liabilities, deferred acquisition costs or goodwill. to the extent that management’s estimates or assumptions prove to be incorrect, it could have a material impact on underwriting results (in the case of risk models) or on reported financial condition or results of operations, and such impact could be material.
the Group’s results may be impacted by changes in accounting standards, or changes in the interpretation of accounting standards. the Group’s results may also be impacted if regulatory authorities take issue with any conclusions the Group may reach in respect of accounting matters. changes in accounting standards could impact future reported results or require restatement of past reported results.
the Group uses non-GaaP financial measures in its external reporting, including in this report. these measures are not prepared in accordance with uS GaaP or any other comprehensive set of accounting rules or principles, and should not be viewed as a substitute for measures prepared in accordance with uS GaaP. Moreover, these may be different from or otherwise inconsistent with non-GaaP financial measures used by other companies. these measures have inherent limitations, are not required to be uniformly applied and are not audited.
Risks related to the Swiss Re corporate structureSwiss Re is a holding company, a legal entity separate and distinct from its subsidiaries, including Swiss Reinsurance company ltd. as a holding company with no operations of its own, Swiss Re is dependent upon dividends and other payments from Swiss Reinsurance company ltd and its other principal operating subsidiaries.
Swiss Re 2013 Financial Report 271

GeNeRal iNfoRmatioN
BuSInESS cOntact dEtaIlS
Swiss Re has over 60 office locations in more than 20 countries. For a full list of our office locations and service offerings, please visit swissre.com
Head officeSwiss Re ltdMythenquai 50/60, P.O. Box, 8022 Zurich, Switzerlandtelephone +41 43 285 2121
investor Relationstelephone +41 43 285 4444Fax +41 43 282 [email protected]
media Relationstelephone +41 43 285 7171Fax +41 43 282 [email protected]
Share Registertelephone +41 43 285 6810Fax +41 43 282 [email protected]
americas
armonk175 king Streetarmonk, new york 10504telephone +1 914 828 8000
overland Park5200 Metcalf avenueOverland Park, kS 66202telephone +1 913 676 5200
New York55 East 52nd Streetnew york, ny 10055telephone +1 212 317 5400
toronto150 king Street westtoronto, Ontario M5H 1J9 telephone +1 416 408 0272
mexico CityInsurgentes Sur 1898, Piso 8torre Siglumcolonia FloridaMéxico, d.F. 01030telephone +52 55 5322 8400
Calabasas26050 Mureau Roadcalabasas, ca 91302 telephone +1 818 878 9500
São Pauloavenida Paulista, 500Bela VistaSão Paulo, SP 01310-000telephone +55 11 3371 6570
europe (incl. middle east and africa)
ZurichMythenquai 50/608022 Zurichtelephone +41 43 285 2121
london30 St Mary axelondonEc3a 8EPtelephone +44 20 7933 3000
munichdieselstraße 1185774 unterföhring bei Münchentelephone +49 89 3844-0
Cape town2nd FloorBeechwood Housethe BoulevardSearle Streetcape town, 7925telephone +27 21 469 8400
madridPaseo de la castellana, 95 planta 18 Edificio torre Europa28046 Madrid telephone +34 91 598 1726
Paris11–15, rue Saint-Georges75009 Paristelephone +33 1 43 18 30 00
RomeVia dei Giuochi Istmici, 40 00135 Rometelephone +39 063 239 3652telephone +39 335 792 0697
asia-Pacific
Hong Kong61 / F central Plaza18 Harbour RoadG.P.O. Box 2221wanchai, Hktelephone +852 2827 4345
Sydney level 29, 363 George StreetSydney nSw 2000telephone +61 2 8295 9500
Singapore1 Raffles PlaceOuB centreSingapore 048616telephone +65 6532 2161
Beijing23rd Floor, East tower, twin towers,no. B12, Jian Guo Men wai avenuechao yang districtBeijing 100022telephone +86 10 6563 8888
tokyoOtemachi First Square 9F5 –1 Otemachi 1 chomechiyoda-kutokyo 100-0004telephone +81 3 3272 287
mumbaiunit 701–702, 7th Floor tower ‘a’Peninsula corporate ParkGanpatrao kadam Marglower ParelMumbai 400 013telephone +91 22 6661 2121
272 Swiss Re 2013 Financial Report

GeNeRal iNfoRmatioN
cORPORatE calEndaR
key dates
11 april 2014150th annual General Meeting 7 may 2014First quarter 2014 results
6 august 2014Second quarter 2014 results
7 November 2014third quarter 2014 results
For more information see swissre.com/investors/events
For Swiss Re’s online annual Report see swissre.com/annualreport
Swiss Re 2013 Financial Report 273

© 2014 Swiss Re. all rights reserved.
title: 2013 Financial Report
design: addison corporate Marketing, london Swiss Re corporate Real Estate & logistics/ Media Production, Zurich
Photography: Swiss Re (cover, pg 1) Geri krischker (pgs 7, 9, 73–77, 81/01, 02, 88/01, 02, 89/01, 03, 90/03) Printing: Multicolor Print aG, Baar
this report is printed on sustainably produced paper and climate neutral. the wood used comes from forests certified to 100% by the Forest Stewardship council (FSc).
Original version in English.
the 2013 annual Report is also available in German.
the web version of the 2013 annual Report is available at: www.swissre.com/annualreport
Order no: 1490793_14_en
3/14, 6 000 en