Embed Size (px)
Citation preview
2013 CRO Quality Benchmarking – Phase II/III Service Providers
©2013 Industry Standard Research www.ISRreports.com
PREVIEW
www.ISRreports.com ©2013 | Preview of: 2013 CRO Quality Benchmarking – Phase II/III Service Providers 2 2
act with confidence
Report Objective
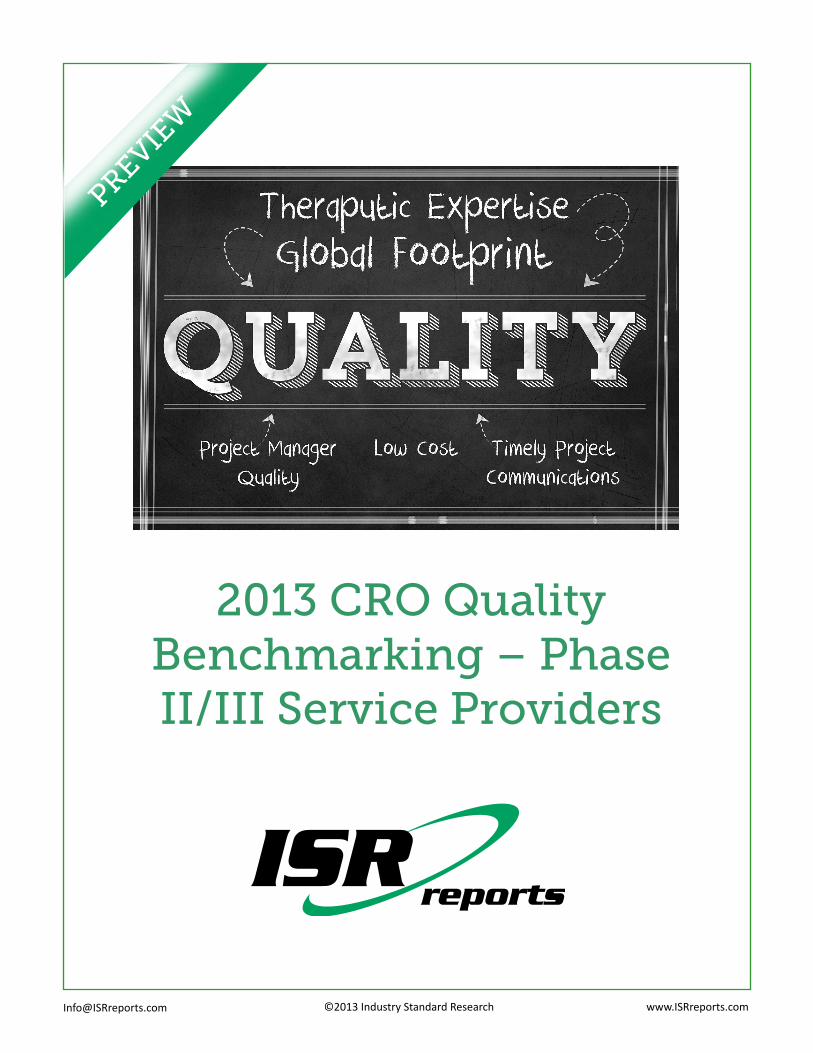
Industry Standard Research’s (ISR) “2013 CRO Quality Benchmarking – Phase II/III Service Providers” report
provides pharmaceutical sponsors and clinical service providers with an independent and comprehensive
analysis of CRO service quality and clinical outsourcing of Phase II/III clinical trial services.
In its 5th year, ISR continues to believe this annual report is the single most comprehensive source for data on the
topic of CRO delivery quality and customer loyalty.
248pages
157respondents
+350 charts and graphs
1. Phase II/III Outsourcing Behaviors • Growth of clinical outsourcing• Anticipated future outsourcing activities for next 12 months
2. Sponsors’ Attitudes, Beliefs, and Intentions about Service Providers• Perceived leaders• Proposal volume• Service Provider usage• Cost experiences• Future usage preference
3. Service Provider Performance and Scorecards across Attributes• See page 3 of this preview for more details
4. Segment Selection Rubrics and CROs to Short List5. Summary Outcome Measures: Service Variability and Customer Loyalty6. Company Service Quality Profiles
Major Sections:
What you will learn in this report:• Performance of 29 Phase II/III CROs, measured across 26 critical dimensions of service quality • How sponsors make their clinical outsourcing decisions, including which service attributes drive
selection • Attitudes, beliefs, and intentions for future outsourcing
How you can use this report:• For buyers of clinical research service, this report offers insight into CRO service quality and
empowers you to make smarter clinical outsourcing decisions by providing evaluation and selection tools.
• For clinical service providers, this critical report offers insight into your service quality, your competitors’ quality, buyers’ needs, CRO selection criteria, paths to differentiation, and clinical outsourcing trends and forecasts.
Valuable for:Clinical Operations, Outsourcing, Service Provider Marketing and Business Development
www.ISRreports.com ©2013 | Preview of: 2013 CRO Quality Benchmarking – Phase II/III Service Providers 3 3
act with confidence
ISR’s Service Provider Performance and Scorecards
Characteristics Measured
Companies Included
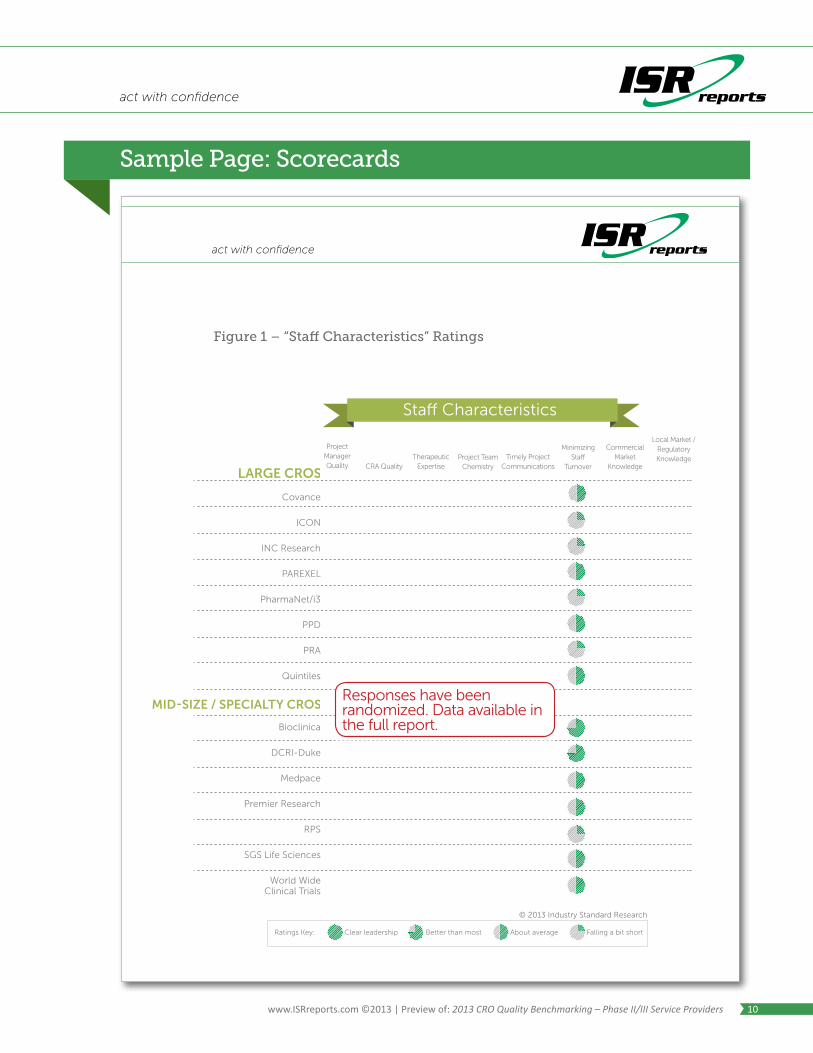
Staff Characteristics• Project Manager Quality /
Experience• CRA Quality / Experience• Therapeutic Expertise of the
Project Team• Project Team Chemistry• Timely Project Communications• Staff Turnover• Commercial Market Knowledge• Local Market / Regulatory
Knowledge
Operational Excellence• Up-front Contingency Planning
and Trial Risk Management• Speed of Site Start-up• Data Quality• Network of Sites and Investigators• Meeting Overall Project Timelines• Meeting Database Lock Timelines• Meeting First Patient – First Visit
Timelines• Offers Innovative Solutions• Speed of Sites / Investigator
Recruitment• Patient / Volunteer Recruitment
Strategy• Positive Experience with Service
Provider• Access to Real-time Data
Organizational & Finance Characteristics• Breadth of Services• Global Footprint• Low Cost• Minimizing Change Orders• Overall Value• Financial Strength and Stability
• Accenture• Aptiv Solutions• Bioclinica• Charles River• Chiltern• Clinsys • Cognizant• Covance• Davita Clinical Research• DCRI-Duke
• Encorium• Eurofins• ICON• INC Research• Medpace• Novella• Paragon• PAREXEL• PharmaNet/i3• PPD
• PRA• Premier Research• Quintiles• Rho• RPS• SGS Life Sciences• Tata• Theorem• World Wide Clinical Trials
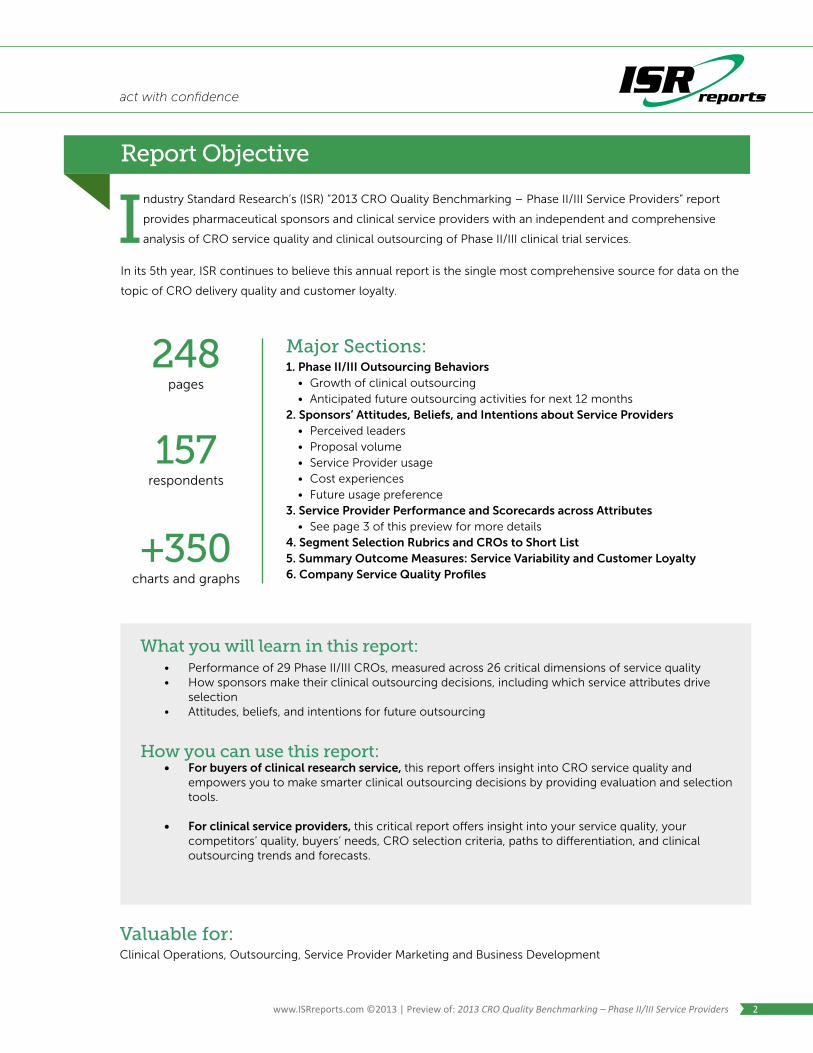
ISR’s report includes 470 service provider evaluations of 29 CROs across 26 critical characteristics associated with
service quality. Of these 29 service providers, 15 received full profiles (bolded below, based on respondent usage).
www.ISRreports.com ©2013 | Preview of: 2013 CRO Quality Benchmarking – Phase II/III Service Providers 4 4
act with confidence
Table of Contents
Copyright and Usage GuidelinesIntroductionMethodologyRespondent Demographics and Qualifications
Participant Years of Industry ExperienceParticipant GeographyParticipant Company SizeNumber of Ratings per Company
Major sectionsStudy findings
Outsourcing Behaviors, Attitudes, Beliefs, and Intentions
Growth in Clinical OutsourcingIndustry Leaders – Open Ended QuestionIndustry Leaders – Prompted ResponsesReceived ProposalsService Provider UsageService Provider PreferenceMost Important Service Provider AttributesService Provider Attributes Gaining Importance
Service Provider Performance and Scorecards across Attributes
Figure 1 – “Staff Characteristics” RatingsFigure 2 – “Operational Excellence” RatingsFigure 3 – “Organizational and Finance” RatingsPerformance Summary by Category
Segment Selection Rubrics and CROs to Short ListFigure 4 – Selection Rubric for Buyers Who Emphasize Excellence in Project Management
Figure 5 – Selection Rubric for Buyers Who Emphasize Operational IndependenceFigure 6 – Selection Rubric for Buyers Who Emphasize Low Cost / ValueFigure 7 – Selection Rubric for Buyers Who Emphasize Global Trials
Summary Outcome Measures: SVI™ and Customer Loyalty
Summary of SVI™Service Provider Customer Loyalty – A compilation of Overall Satisfaction, Willingness to Recommend, and Likelihood to Use AgainCustomer Loyalty – Large Service ProvidersComparing Loyalty by CRO Size Segment
Company Service Quality ProfilesBioclinica Profile – Service VariabilityBioclinica Profile - Average Customer ExperienceBioclinica Profile - Performance vs. Attribute Importance
Bioclinica Profile - Customer LoyaltyBioclinica Profile HighlightsCovance Profile – Service VariabilityCovance Profile - Average Customer ExperienceCovance Profile - Performance vs. Attribute ImportanceCovance Profile - Customer LoyaltyCovance Profile HighlightsDCRI-Duke Profile – Service VariabilitDCRI-Duke Profile - Average Customer ExperienceDCRI-Duke Profile - Performance vs. Attribute ImportanceDCRI-Duke Profile - Customer LoyaltyDCRI-Duke Profile HighlightsICON Profile – Service VariabilityICON Profile - Average Customer ExperienceICON Profile - Performance vs. Attribute ImportanceICON Profile - Customer LoyaltyICON Profile HighlightsINC Research Profile – Service VariabilityINC Research Profile - Average Customer ExperienceINC Research Profile - Performance vs. Attribute ImportanceINC Research Profile - Customer LoyaltyINC Research Profile HighlightsMedpace Profile – Service VariabilityMedpace Profile - Average Customer ServiceMedpace Profile - Performance vs. Attribute ImportanceMedpace Profile - Customer LoyaltyMedpace Profile HighlightsPAREXEL Profile – Service VariabilityPAREXEL Profile - Average Customer ExperiencePAREXEL Profile - Performance vs. Attribute ImportancePAREXEL Profile - Customer LoyaltyPAREXEL Profile HighlightsPharmaNet/i3 Profile – Service VariabilityPharmaNet/i3 Profile - Average Customer ExperiencePharmaNet/i3 Profile - Performance vs. Attribute ImportancePharmaNet/i3 Profile - Customer LoyaltyPharmaNet/i3 Profile HighlightsPPD Profile – Service Variability
(1 of 4)

www.ISRreports.com ©2013 | Preview of: 2013 CRO Quality Benchmarking – Phase II/III Service Providers 5 5
act with confidence
Table of Contents
PPD Profile - Average Customer ExperiencePPD Profile - Performance vs. Attribute ImportancePPD Profile - Customer LoyaltyPPD Profile HighlightsPRA Profile – Service VariabilityPRA Profile - Average Customer ExperiencePRA Profile - Performance vs. Attribute ImportancePRA Profile - Customer LoyaltyPRA Profile HighlightsPremier Research Profile – Service VariabilityPremier Research Profile - Average Customer ExperiencePremier Research Profile - Performance vs. Attribute ImportancePremier Research Profile - Customer LoyaltyPremier Research Profile HighlightsQuintiles Profile – Service VariabilityQuintiles Profile - Average Customer ExperienceQuintiles Profile - Performance vs. Attribute ImportanceQuintiles Profile - Customer LoyaltyQuintiles Profile HighlightsRPS Profile – Service VariabilityRPS Profile - Average Customer ExperienceRPS Profile - Performance vs. Attribute ImportanceRPS Profile - Customer LoyaltyRPS Profile HighlightsSGS Life Sciences Profile – Service VariabilitySGS Life Sciences Profile - Average Customer ExperienceSGS Life Sciences Profile - Performance vs. Attribute ImportanceSGS Life Sciences Profile - Customer LoyaltySGS Life Sciences Profile HighlightsWorldwide Clinical Trials Profile – Service VariabilityWorldwide Clinical Trials Profile - Average Customer ExperienceWorldwide Clinical Trials Profile - Performance vs. Attribute ImportanceWorldwide Clinical Trials Profile – Customer LoyaltyWorldwide Clinical Trials Profile Highlights
Study DataOutsourcing Behaviors, Attitudes, Beliefs, and Intentions: Supporting Data
Industry Leaders Received ProposalsPast 12 Months of Outsourcing GrowthNext 12 Months of Outsourcing GrowthMost Important Service Provider AttributesService Provider Attributes Gaining ImportanceService Provider UsageService Provider PreferenceBest Service Provider at DifferentiationService Provider Cost Experience
Summary Outcome Measures: Supporting DataSummary of SVI™Service Provider Loyalty – A compilation of Overall Satisfaction, Willingness to Recommend, and Likelihood to Use AgainService Provider Loyalty – Large Service ProvidersService Provider Loyalty - Company Size Overall Satisfaction with Service ProvidersWillingness to Recommend Service Providers Likelihood to Use Service Providers Again
All Service Provider DataAccenture Use and SatisfactionAccenture Performance against Expectations Accenture Average Customer ExperienceAptiv Use and SatisfactionAptiv Performance against ExpectationsAptiv Average Customer ExperienceBioclinica Use and SatisfactionBioclinica Performance against ExpectationsBioclinica Average Customer ExperienceBioclinica Performance vs. Attribute ImportanceBioclinica SVI™Charles River Use and SatisfactionCharles River Performance against ExpectationsCharles River Average Customer ExperienceChiltern Use and SatisfactionChiltern Performance against ExpectationsChiltern Average Customer ExperienceClinsys Use and SatisfactionClinsys Performance against ExpectationsClinsys Average Customer ExperienceCognizant Use and SatisfactionCognizant Performance against ExpectationsCognizant Average Customer ExperienceCovance Use and SatisfactionCovance Average customer Experience
(2 of 4)
www.ISRreports.com ©2013 | Preview of: 2013 CRO Quality Benchmarking – Phase II/III Service Providers 6 6
act with confidence
Table of Contents
Covance Performance vs. Attribute ImportanceCovance SVI™Davita Clinical Research Use and SatisfactionDavita Clinical Research Performance against ExpectationsDavita Clinical Research Average Customer ExperienceDCRI-Duke Use and SatisfactionDCRI-Duke Performance against ExpectationsDCRI-Duke Average Customer ExperienceDCRI-Duke Performance vs. Attribute ImportanceDCRI-Duke SVI™Encorium Use and SatisfactionEncorium Performance against ExpectationsEncoriumEurofins Use and SatisfactionEurofins Performance against ExpectationsEurofinsICON Use and SatisfactionICON Average Customer ExperienceICON Performance vs. Attribute ImportanceICON SVI™INC Research Use and SatisfactionINC Research Performances against ExpectationsINC Average Customer ExperienceINC Research Performance vs. Attribute ImportanceINC Research SVI™Medpace Use and SatisfactionMedpaceMedpace Performance vs. Attribute ImportanceMedpace SVI™Novella Use and SatisfactionNovella Performance against ExpectationsNovella Average Customer ExperienceParagon Use and SatisfactionParagon Performance against ExpectationsParagon Average Customer ExperiencePAREXEL Use and SatisfactionPAREXEL Average Customer ExperiencePAREXEL Performance vs. Attribute ImportancePAREXEL SVI™PharmaNet/ i3 Use and SatisfactionPharmaNet/ i3 Average Customer Experience
PharmaNet/ i3 Performance vs. Attribute ImportancePharmaNet/ i3 SVI™PPD Use and SatisfactionPPD Average Customer ExperiencePPD Performance vs. Attribute ImportancePPD SVI™PRA Use and SatisfactionPRA Performance against ExpectationsPRA Average Customer ExperiencePRA Performance vs. Attribute ImportancePRA SVI™Premier Research Use and SatisfactionPremier Research Average Customer ExperiencePremier Research Performance vs. Attribute ImportancePremier Research SVI™Quintiles Use and SatisfactionQuintiles Average Customer ExperienceQuintiles Performance vs. Attribute ImportanceQuintiles SVI™Rho Use and SatisfactionRho Performance against ExpectationsRho Average Customer ExperienceRPS Use and Satisfaction RPS Performance against ExpectationsRPS Average Customer ExperienceRPS Performance vs. Attribute ImportanceRPS SVI™SGS Life Sciences Use and SatisfactionSGS Life Sciences Performance against ExpectationsSGS Life SciencesSGS Life Sciences Performance vs. Attribute ImportanceSGS Life Sciences SVI™Tata Use and SatisfactionTata Performance against ExpectationsTata Average Customer ExperienceTheorem (formerly Omnicare) Use and SatisfactionTheorem (formerly Omnicare) Performance against ExpectationsTheorem (formerly Omnicare) Average Customer ExperienceWorldwide Clinical Trials Use and SatisfactionWorldwide Clinical Trials Performance against Expectations
(3 of 4)
www.ISRreports.com ©2013 | Preview of: 2013 CRO Quality Benchmarking – Phase II/III Service Providers 7 7
act with confidence
Table of Contents
Worldwide Clinical Trials Average Customer ExperienceWorldwide Clinical Trials Performance vs. Attribute ImportanceWorldwide Clinical Trials SVI™
Cross-service Provider PerformanceBreadth of ServicesCommercial Market KnowledgeCRA qualityData qualityFinancial strength/ stabilityGlobal footprintLocal market / Regulatory knowledgeLow CostMeeting first patient / first visit timelinesMeeting overall project timelinesMinimization of change order Minimizing staff turnoverNetwork of sites/ investigatorsOffered innovative solutionsPatient/ volunteer recruitment strategyPositive experience with service providerProject manager qualityProject team chemistrySpeed of site / Investigator recruitmentSpeed of site start-upTechnology for real-time access to dataTherapeutic expertiseTimely project communicationsUp-front contingency planning, risk management
Respondent DemographicsCompany Primary Area of ResponsibilityOutsourcing ResponsibilityJob TitlePhase ResponsibilityInvolvement in Clinical Development ProcessYears in the IndustryLocationTherapeutic Area
Sample Data PointsLower cost or faster recruitmentSite selection and recruitment guaranteesExecution or design expertise and experience - CurrentlyExecution or design expertise and experience – 3 years from now
About Industry Standard Research
(4 of 4)
www.ISRreports.com ©2013 | Preview of: 2013 CRO Quality Benchmarking – Phase II/III Service Providers 8 8
act with confidence
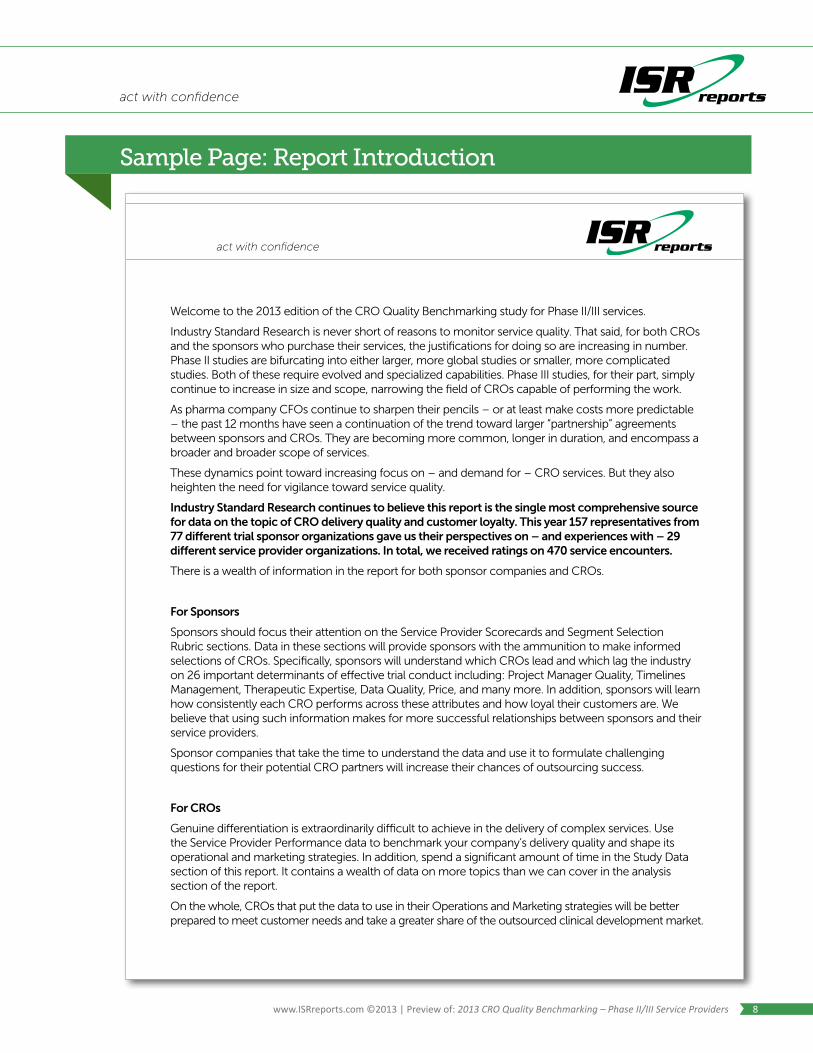
Sample Page: Report Introduction
act with confidence
www.ISRreports.com ©2013 | 2013 CRO Quality Benchmarking – Phase II/III Service Providers 2
Covance
ICON
INC Research
PAREXEL
PharmaNet/i3
PPD
PRA
Quintiles
Bioclinica
DCRI-Duke
Medpace
Premier Research
RPS
SGS Life Sciences
World Wide Clinical Trials
Minimizing Sta�
TurnoverCRA QualityProject Team
ChemistryTherapeutic
ExpertiseTimely Project
Communications
Commercial Market
Knowledge
Project Manager Quality
Sta� Characteristics
Ratings Key: Clear leadership Better than most About average Falling a bit short
Local Market / Regulatory Knowledge
Figure 1 – “Staff Characteristics” Ratings
Responses have been randomized. Data available in the full report.
© 2013 Industry Standard Research
Welcome to the 2013 edition of the CRO Quality Benchmarking study for Phase II/III services.
Industry Standard Research is never short of reasons to monitor service quality. That said, for both CROs and the sponsors who purchase their services, the justifications for doing so are increasing in number. Phase II studies are bifurcating into either larger, more global studies or smaller, more complicated studies. Both of these require evolved and specialized capabilities. Phase III studies, for their part, simply continue to increase in size and scope, narrowing the field of CROs capable of performing the work.
As pharma company CFOs continue to sharpen their pencils – or at least make costs more predictable – the past 12 months have seen a continuation of the trend toward larger “partnership” agreements between sponsors and CROs. They are becoming more common, longer in duration, and encompass a broader and broader scope of services.
These dynamics point toward increasing focus on – and demand for – CRO services. But they also heighten the need for vigilance toward service quality.
Industry Standard Research continues to believe this report is the single most comprehensive source for data on the topic of CRO delivery quality and customer loyalty. This year 157 representatives from 77 different trial sponsor organizations gave us their perspectives on – and experiences with – 29 different service provider organizations. In total, we received ratings on 470 service encounters.
There is a wealth of information in the report for both sponsor companies and CROs.
For Sponsors
Sponsors should focus their attention on the Service Provider Scorecards and Segment Selection Rubric sections. Data in these sections will provide sponsors with the ammunition to make informed selections of CROs. Specifically, sponsors will understand which CROs lead and which lag the industry on 26 important determinants of effective trial conduct including: Project Manager Quality, Timelines Management, Therapeutic Expertise, Data Quality, Price, and many more. In addition, sponsors will learn how consistently each CRO performs across these attributes and how loyal their customers are. We believe that using such information makes for more successful relationships between sponsors and their service providers.
Sponsor companies that take the time to understand the data and use it to formulate challenging questions for their potential CRO partners will increase their chances of outsourcing success.
For CROs
Genuine differentiation is extraordinarily difficult to achieve in the delivery of complex services. Use the Service Provider Performance data to benchmark your company’s delivery quality and shape its operational and marketing strategies. In addition, spend a significant amount of time in the Study Data section of this report. It contains a wealth of data on more topics than we can cover in the analysis section of the report.
On the whole, CROs that put the data to use in their Operations and Marketing strategies will be better prepared to meet customer needs and take a greater share of the outsourced clinical development market.
www.ISRreports.com ©2013 | Preview of: 2013 CRO Quality Benchmarking – Phase II/III Service Providers 9 9
act with confidence
act with confidence
www.ISRreports.com ©2013 | 2013 CRO Quality Benchmarking – Phase II/III Service Providers 4
www.isrreports.com ©2013| 2013 CRO Benchmarking Report – Phase II/III58
(0.04) (0.29) (0.29) (0.29)
(0.17) (0.21) (0.29) (0.33)
(0.13) (0.33) (0.42)
(0.54) (0.42)
(0.29) (0.33) (0.33) (0.46) (0.38) (0.46) (0.13)
(0.38) (0.42) (0.33) (0.04) (0.13) (0.21)
(2.00) (1.50) (1.00) (0.50) 0.00 0.50 1.00 1.50 2.00
0%
20%
40%
60%
80%
100%
Greatly Missed ExpectaZons
Somewhat Missed ExpectaZons
Met ExpectaZons Somewhat Exceeded
ExpectaZons
Greatly Exceeded ExpectaZons
INC Research "Ideal" distribution
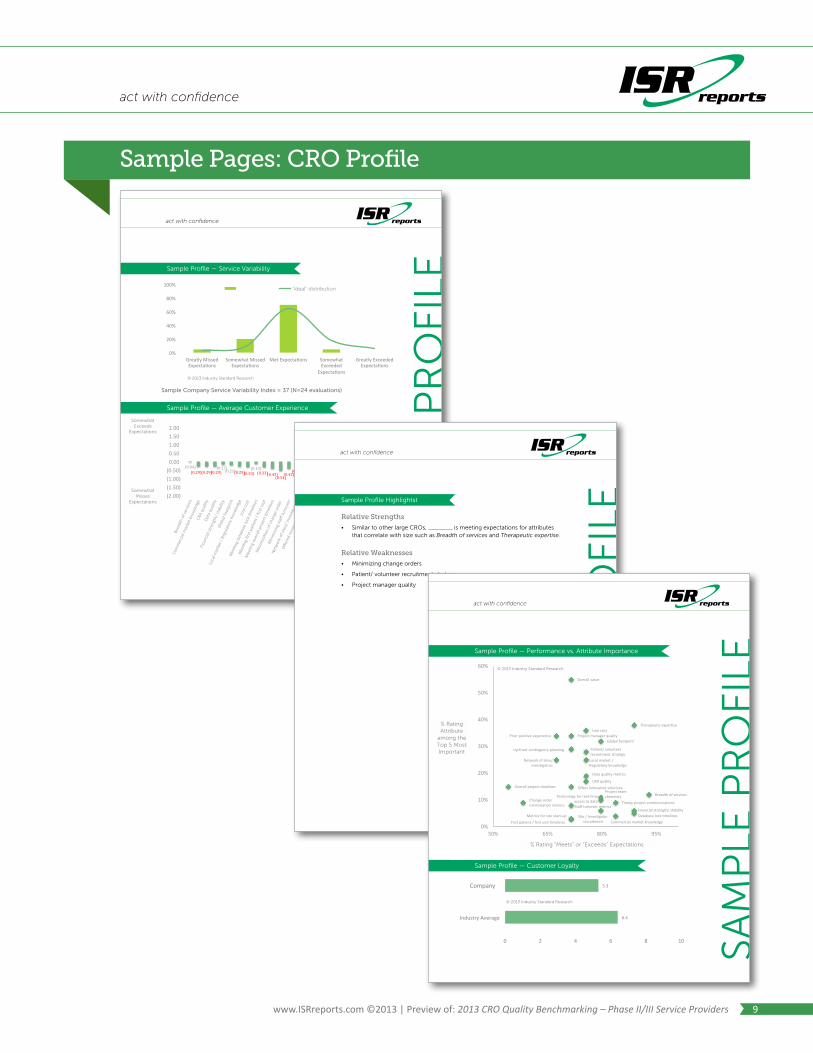
INC Research Profi le – Service Variabil ity
INC Research Service Variabil ity Index = 37 (N = 24 evaluations)
INC Research Profi le - Average Customer Experience
Somewhat Exceeds
Expectations
Somewhat Misses
Expectations
Sample Profile — Service Variability
Sample Profile — Average Customer Experience
Sample Company Service Variability Index = 37 (N=24 evaluations)
© 2013 Industry Standard Research
© 2013 Industry Standard Research
act with confidence
www.ISRreports.com ©2013 | 2013 CRO Quality Benchmarking – Phase II/III Service Providers 6
Sample Profile Highlightst
Relative Strengths
• Similar to other large CROs, ________ is meeting expectations for attributes that correlate with size such as Breadth of services and Therapeutic expertise.
Relative Weaknesses
• Minimizing change orders
• Patient/ volunteer recruitment strategy
• Project manager quality
act with confidence
www.ISRreports.com ©2013 | 2013 CRO Quality Benchmarking – Phase II/III Service Providers 5
www.isrreports.com ©2013| 2013 CRO Benchmarking Report – Phase II/III59
6.4
5.3
0 2 4 6 8 10
Industry Average
INC Research
[CELLRANGE]
[CELLRANGE]
[CELLRANGE]
[CELLRANGE]
[CELLRANGE] [CELLRANGE]
[CELLRANGE]
[CELLRANGE]
[CELLRANGE]
[CELLRANGE]
[CELLRANGE]
[CELLRANGE]
[CELLRANGE]
[CELLRANGE]
[CELLRANGE]
[CELLRANGE]
[CELLRANGE]
[CELLRANGE] [CELLRANGE]
[CELLRANGE]
[CELLRANGE]
[CELLRANGE]
[CELLRANGE] [CELLRANGE]
[CELLRANGE]
[CELLRANGE]
0%
10%
20%
30%
40%
50%
60%
50% 65% 80% 95%
INC Research Profi le - Performance vs. Attr ibute Importance
INC Research Profi le - Customer Loyalty
% Rating “Meets” or “Exceeds” Expectations
% Rating Attribute
among the Top 5 Most Important
% Rating Attribute
among the Top 5 Most Important
Sample Profile — Performance vs. Attribute Importance
Sample Profile — Customer Loyalty
www.isrreports.com ©2013| 2013 CRO Benchmarking Report – Phase II/III 59
6.4
5.3
0 2 4 6 8 10
Industry Average
INC Research
Overall project timelines
Change order minimization metrics
Network of sites/ investigators
Prior positive experience
First patient / first visit timelinesMetrics for site start-up
Staff turnover metrics
Offers innovative solutions
Up-front contingency planning
Project manager quality
Overall value
CRA quality
Data quality metrics
Local market / Regulatory knowledge
Patient/ volunteer recruitment strategy
Low cost
Site / Investigator recruitment
Technology for real-time access to data
Project team chemistry
Global footprint
Commercial market knowledge
Timely project communications
Database lock timelinesFinancial strength/ stability
Therapeutic expertise
Breadth of services
0%
10%
20%
30%
40%
50%
60%
50% 65% 80% 95%
INC Research Profile - Performance vs. Attribute Importance
INC Research Profile - Customer Loyalty
% Rating “Meets” or “Exceeds” Expectations
% Rating Attribute
among the Top 5 Most Important
% Rating Attribute
among the Top 5 Most Important
© 2013 Industry Standard Research
© 2013 Industry Standard Research
Sample Pages: CRO Profile
Company
www.ISRreports.com ©2013 | Preview of: 2013 CRO Quality Benchmarking – Phase II/III Service Providers 10 10
act with confidence
Sample Page: Scorecards
act with confidence
www.ISRreports.com ©2013 | 2013 CRO Quality Benchmarking – Phase II/III Service Providers 2
Covance
ICON
INC Research
PAREXEL
PharmaNet/i3
PPD
PRA
Quintiles
Bioclinica
DCRI-Duke
Medpace
Premier Research
RPS
SGS Life Sciences
World Wide Clinical Trials
Minimizing Sta�
TurnoverCRA QualityProject Team
ChemistryTherapeutic
ExpertiseTimely Project
Communications
Commercial Market
Knowledge
Project Manager Quality
Sta� Characteristics
Ratings Key: Clear leadership Better than most About average Falling a bit short
Local Market / Regulatory Knowledge
Figure 1 – “Staff Characteristics” Ratings
Responses have been randomized. Data available in the full report.
© 2013 Industry Standard Research

www.ISRreports.com ©2013 | Preview of: 2013 CRO Quality Benchmarking – Phase II/III Service Providers 11 11
act with confidence
Sample Page: Outsourcing Behaviors
act with confidence
www.ISRreports.com ©2013 | 2013 CRO Quality Benchmarking – Phase II/III Service Providers 3
If preference drives less than half of service purchase decisions, what drives the rest? ISR’s data would suggest that sponsors are making a ________ judgment that is more important than any other drivers. But looking one level deeper will probably allow readers to understand what drives the assessment of ________. At that level ISR finds ________, ________, and ________ to be the dominant drivers of project decisions...
Most Important Service Provider Attributes
“Please review the following attributes and select the 5 most important to you when selecting a provider for Phase II/III services.” (Base = 157)
“Among the following attributes, please select the 1 most important to you when selecting a provider for Phase II/III services.” (Base =157)
• Local market / regulatory knowledge• Offers innovative solutions• Breadth of services• Project team chemistry• Detailed plan for timely project
communications• Metrics for site / investigator
recruitment• Financial strength / stability
• Metrics for database lock timelines• Commercial market knowledge• Technology for real-time access to data• Change order minimization metrics• Staff turnover metrics• Metrics for site start-up• Metrics for first patient / first visit
timelines
Other attributes measured:
29%
38%
34%
34%
12%
28%
55%
25%
15%
36%
32%
19%
17%
6%
8%
10%
13%
4%
4%
26%
4%
4%
4%
4%
4%
3%
0% 25% 50% 75%
Up-‐front con6ngency planning, risk management
Therapeu6c exper6se
Project manager quality
Prior posi6ve experience with service provider
Perceived overall value
Pa6ent/ volunteer recruitment strategy
Overall value
Network of sites/ inves6gators
Metrics for mee6ng overall project 6melines
Low cost
Global footprint
Data quality metrics
CRA quality
Most Important
Top 5
© 2013 Industry Standard Research
Responses have been randomized. Data available in the full report.
www.ISRreports.com ©2013 | Preview of: 2013 CRO Quality Benchmarking – Phase II/III Service Providers 12 12
act with confidence
Sample Page: Outsourcing Behaviors
www.isrreports.com ©2013| 2013 CRO Benchmarking Report – Phase II/III 246
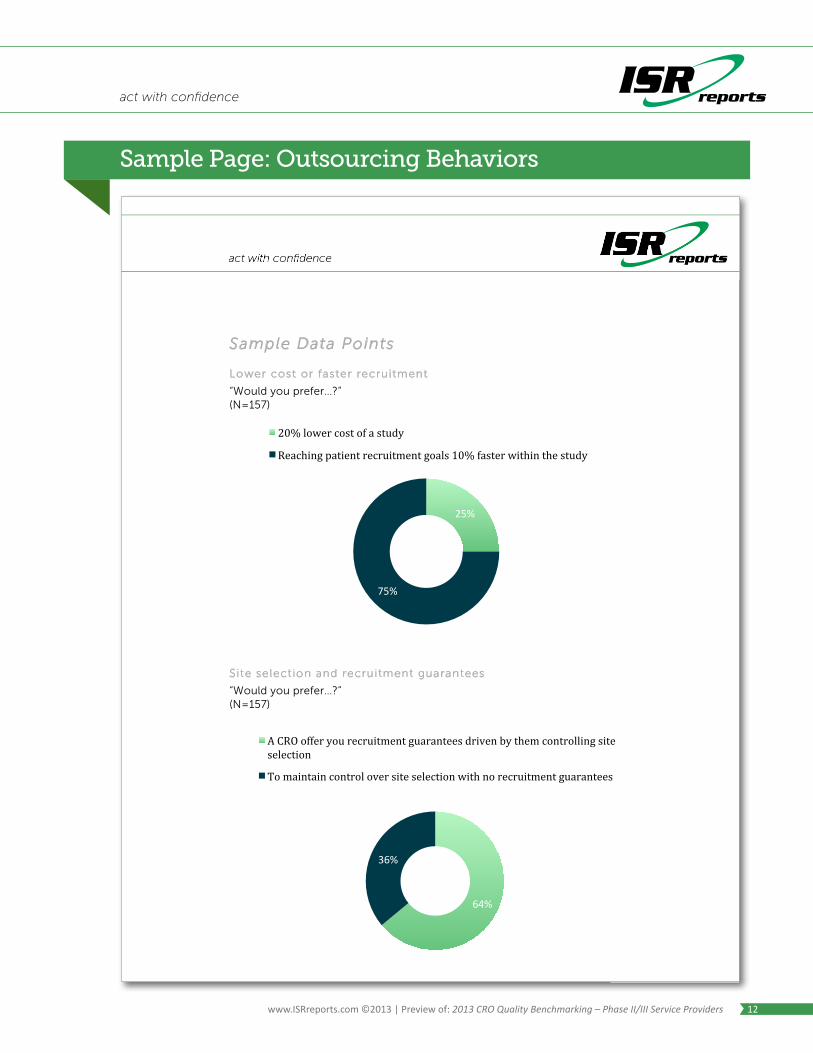
64%
36%
A CRO offer you recruitment guarantees driven by them controlling site selection
To maintain control over site selection with no recruitment guarantees
Sample Data Points
Lower cost or faster recruitment
“Would you prefer…?” (N=157)
Site selection and recruitment guarantees
“Would you prefer…?” (N=157)
25%
75%
20% lower cost of a study
Reaching patient recruitment goals 10% faster within the study
www.ISRreports.com ©2013 | Preview of: 2013 CRO Quality Benchmarking – Phase II/III Service Providers 12 12
act with confidence
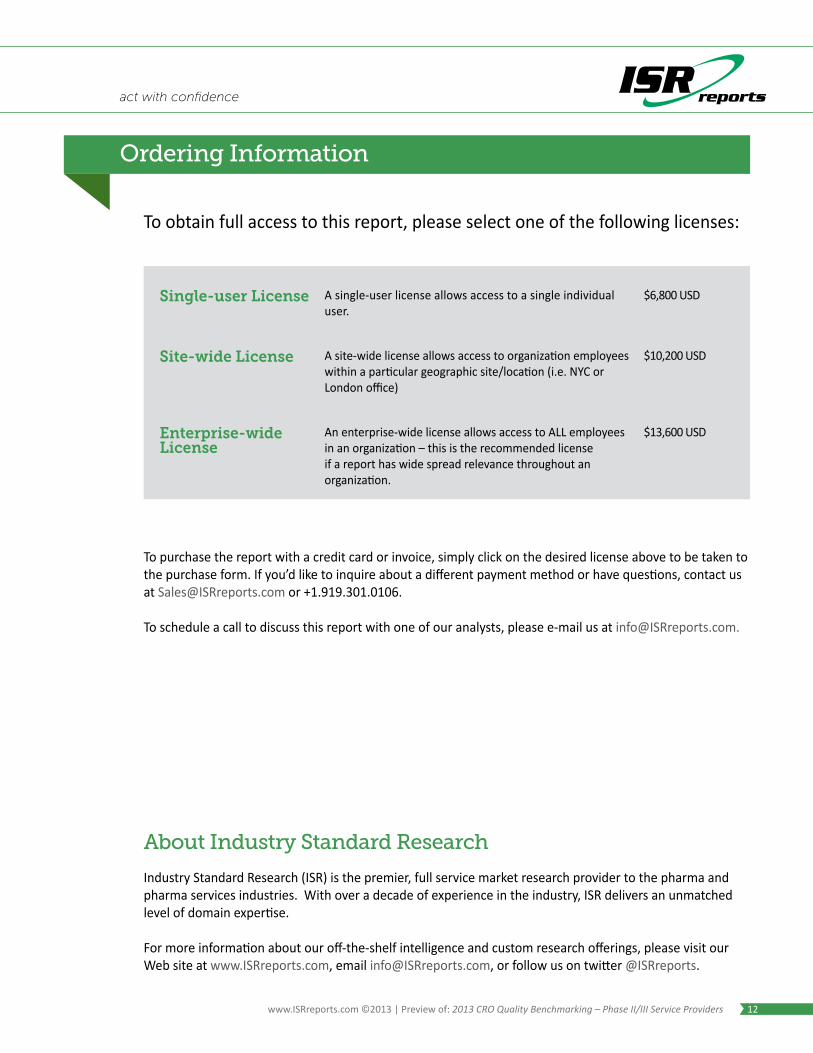
To obtain full access to this report, please select one of the following licenses:
To purchase the report with a credit card or invoice, simply click on the desired license above to be taken to the purchase form. If you’d like to inquire about a different payment method or have questions, contact us at [email protected] or +1.919.301.0106.
To schedule a call to discuss this report with one of our analysts, please e-mail us at [email protected].
Ordering Information
Single-user License A single-user license allows access to a single individual user.
$6,800 USD
Site-wide License A site-wide license allows access to organization employees within a particular geographic site/location (i.e. NYC or London office)
$10,200 USD
Enterprise-wide License
An enterprise-wide license allows access to ALL employees in an organization – this is the recommended license if a report has wide spread relevance throughout an organization.
$13,600 USD
Industry Standard Research (ISR) is the premier, full service market research provider to the pharma and pharma services industries. With over a decade of experience in the industry, ISR delivers an unmatched level of domain expertise.
For more information about our off-the-shelf intelligence and custom research offerings, please visit our Web site at www.ISRreports.com, email [email protected], or follow us on twitter @ISRreports.
About Industry Standard Research
![Sodality Summary - cro-srd.co.jpENG] CSIA SMO Brochure.pdf · Providing and performing high quality SMO/CRO services in accordance with ICH-GCP and local regulations in Vietnam. Especially](https://img.pdfslide.us/doc/110x75/5ed3b10c7f3dc53cc40cac62/sodality-summary-cro-srdcojp-eng-csia-smo-providing-and-performing-high.jpg)


![CRO PROS Leveraging call analytics for conversion rate optimisation [CRO]](https://img.pdfslide.us/doc/110x75/587213291a28ab3f188b59ad/cro-pros-leveraging-call-analytics-for-conversion-rate-optimisation-cro.jpg)