Embed Size (px)
Citation preview

2013 AnnualReport
32

We turn great fabrics into work of art with aesthetic touches, since the first day that we founded. While celebrating our 40th year, today, we enjoy the pride of being among the top five fabric manufacturers in the world.
54

ART OF WOOL. FOR 40 YEARS!
fashion
76
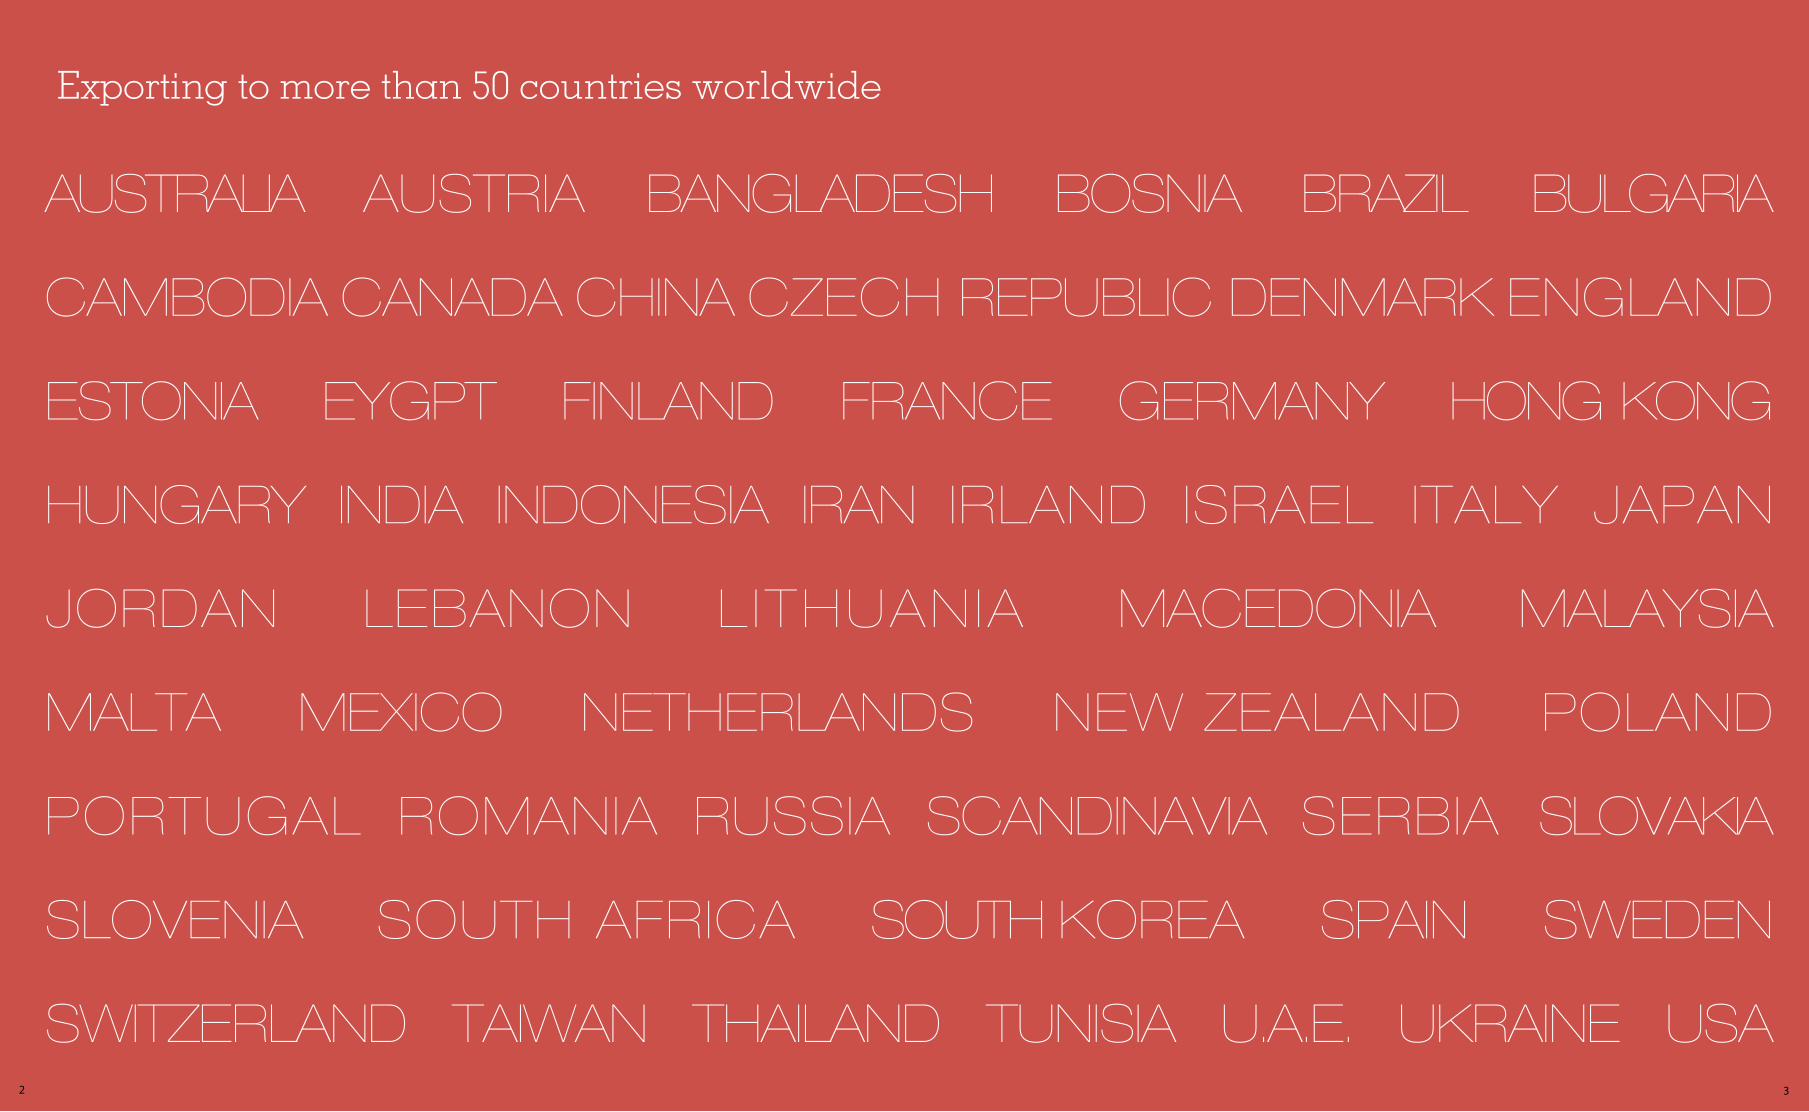
AGENDACONTENTS
09 Agenda
12-13 Letter from the Chairman
14-15 Board of Directors
18-19 Letter from the General Manager
20-21 Top Management
22-23 Management
24-25 Yünsa Time Tunnel
26-27 Mission – Vision
28-29 Auditors’ Opinion on the
Annual Report
32-33 Art of Being Leader In Every Corner
of the World
34-35 Yünsa in the World
38-39 Products
40-41 Research and Development
42-43 Environmental Policy
44-45 Sales
46-47 Activities
48 Risk Management and Internal Control Mechanism
49 Committees
50 Policy of Remuneration for Board of Directors and Top Level Directors
51 Other Issues Related with the Activities
52 Profit Distribution Policy and Proposal for Profit Distribution
53-59 Corporate Governance Principles Compliance Report
60-124 Independent Auditor’s Report
AGENDA OF ORDINARY GENERAL ASSEMBLY MEETING
ON MARCH 28, 2014
1. Opening and election of Chairman’s Panel.
2. Reading and discussing the Annual Report of
Board of Directors for the year 2013.
3. Reading and discussing the Auditors’ Report
for the year 2013.
4. Informing General Assembly about donations
and aids provided during 2013.
5. Approval of profit distribution policy.
6. Reading, discussing and approval of the financial statements of the year 2013.
7. Releasing Members of Board of Directors due to their activities in 2013.
8. Determination of the method, distribution and earning share rates of the profit of the year 2013.
9. Determination of the limit of the donations to be made by company in the year 2014.
10. Election of Auditor.
98

ART OF BRANDING!
1110

Dear Stakeholders,
2013 was a year during which Turkish economy slowed down, the stagnation in Europe resumed and correspondingly, the competition heightened in wool fabric industry.
Despite of such negative economic conditions, Yünsa has doubled its profit and achieved an important success. As our company especially increased his share in A and A+ upper segment as well as achievements of important savings through operational efficiency incentive is important factors behind this success.
Celebrating its 40th year, our company is one of the most dynamic companies of our "Innovative and Entrepreneurial Industry Group". In 2014, while competitive market conditions continues to prevail, Yünsa targets at furthering its turnover and profitability to upper levels especially by launching new strategic business collaborations and business excellence incentives.
On behalf of our Board of Directors, I'd like to thank and present my respects to our employees who raise the added value and claim of Yünsa in the industry with their commitments, to our customers, suppliers and all stakeholders due to their confidence in our company.
Mehmet Nurettin PEKARUN
LETTER FROM THE CHAIRMAN
"ART OF GROWTH WITH SOUND STRATEGIES!"
1312
BOARD OF DIRECTORS Mehmet Nurettin PEKARUNChairman of the Board Of DirectorsMehmet Pekarun received his Industrial Engineering degree from Bogazici University, and later obtained his MBA, with Finance and Strategy Specialization, from Purdue University. Mr. Pekarun started his career in 1993, at General Electric’s (GE) Transportation Systems division in the USA. Between 1996 and 1999, he worked as a Finance Manager responsible for Turkey, Greece, and Eastern Europe at GE’s Healthcare division in Europe. Between 1999 and 2000, He worked as the General Manager of GE Lighting Turkey. Between 2000 and 2005, he moved to GE Healthcare’s Europe, Middle East, and Africa headquarter, first working as General Manager, Business Development, and then as General Manager, Medical Accessories. Mr. Pekarun was appointed as the Chief Executive Officer of Kordsa Global on March 1, 2006, and as the President of Sabancı Holding’s Tire, Reinforcement Materials, and Automotive Strategic Business Unit on 20 September 2010. Tire, Reinforcement Materials, and Automotive Strategic Business Unit was restructured as of March 1, 2011 and he is currently the President of Industry Strategic Business Unit.
Mehmet GÖÇMENVice Chairman of the Board of DirectorsBorn in 1957, Mehmet Göçmen completed his post graduate degree in Industrial Engineering and Operational Research at Syracuse University in the USA after completing his BA Degree at METU Industrial Engineering and his High School education at Galatasaray High School. He began his professional career at Çelik Halat ve Tel San. AŞ in 1983.Mr. Göçmen later worked as General Manager at Lafarge Ekmel Beton AŞ and Business Development and Public Affairs Vice Chairman position at Lafarge Turkey between 1996 and 2002. Between June 2003 and July 2008,Mr. Göçmen served as General Manager at Akçansa and he was appointed as Executive Vice President of Human Resources of Sabancı Holding on August 1, 2008. In addition Mr. Göçmen has been appointed as The President of Cement Strategic Business Unit as of July 20, 2009. In 2010, he resigned from Executive Vice President of Human Resources position and he is currently the President of Cement Strategic Business Unit.
Mevlüt AYDEMİRMember of the Board of Directors Born in 1948 in Erzincan, Mevlüt Aydemir graduated from İstanbul University, Faculty of Economics. He worked for the Ministry of Finance as a Public Accountant between 1972 and 1981. He has carried out various functions at Sabancı Holding since 1981, and served as a member of board of directors in the group companies. He has been a member of the Board of Directors of Sabancı Holding since May 2010. Barış ORANMember of the Board of DirectorsGraduated from Bogazici University Business Administration Department, Barış Oran has a MBA degree in University of Georgia. Began his career as an auditor in Price Waterhouse Coopers in 1995, Oran carried out functions in first audit and finance and treasury/capital markets in Sara Lee Corp. Chicago IL between the years 1998 and 2003. Between 2003 and 2006, he served as Senior Manager at Ernst and Young responsible for first Minneapolis, MN, then in Europe, Middle East, Africa and India Regions. In 2006, he began his career in Kordsa Global and served as Internal Control Director, Global
Finance Director and CFO, respectively. In 2011, appointed as H.Ö. Sabancı Holding Finance Director, since 2012, Oran has been the Head of H.Ö. Sabancı Holding Planning, Reporting and Financing Department, Members of Brisa, Enerjisa Production, Teknosa and Temsa Board of Directors.
Hüsnü PAÇACIOĞLU Member of the Board of DirectorsHüsnü Paçacıoğlu earned his BSC in Industry Management from Middle East Technical University (Ankara, Turkey) in 1963. Between 1964-1968 he served as the Investment Specialist in Karabük Iron and Steel Works Enterprises and as Public Relations and Ankara Region Manager, Public Sector Sales Director, Professional and Technical Services Manager and Deputy General Manager in charge of Marketing, Sales, Products and Services (in chronological order) at IBM Turk between 1968-1996.
Mr. Hüsnü Paçacıoğlu took over the position of General Secretary in Sabancı University in 1996 and held this position until 2005. Between 2006 and 2011, he served as Vice President of Board of Trustees and General Manager of the Hacı Ömer Sabancı Foundation (Sabancı Foundation).
He is currently members of Sabancı Foundation Board of Trustee and Executive Board since July 1, 2011, except his General Manager duty.
Paçacıoğlu is the founding member of Safranbolu Culture and Tourism Foundation, Hisar Education Foundation and member of Board of Trustees of Spastic Children Foundation of Turkey (TSÇV) and Chairman and CEO of TSÇV and member of Information Foundation of Turkey.
Mehmet KAHYAMember of the Board of DirectorsReceived his double major BS, with Cum Laude in Chemical Engineering and Economics from Yale University Mehmet Kaya has MBA on Finance, Marketing and Operations Research, with honor, from Kellogg Graduate School of Management.
Began his career as Sasa Management Services Chief in Sabancı Holding, Mehmet Kaya founded and presided MKM Inernational (Netherland) and Sibernetik Systems. Again joined as Vice President of Automotive Group, Mehmet Kaya served as Temsa Vice President and President, Toyotosa Vice President as well as Member of Sabancı Holding Planning and Direction Council and Board Members of Temsa Toyotasa, Susa and Sapeksa.
Mehmet Kahya served as Managing Member and Vice Chairman of CarnaudMetalbox and then President of Uzel Machinery and Executive Board Member of Uzel Holding, Vice President of DYO General Directorate and Paint Group, Member of Executive Board of Sarten Packaging, Vice Chairman of Gierlings Velpor and President of Assan Aluminuim.
He is currently providing services in the fields of strategies, restructuring, profitability cycle, growth, acquisition and merger projects in the KRONUS company founded by him as well as serves as independent member of Board of Members of Yaşar Holding, Altınyunus, DYO, Viking Kağıt, Çimsa, Sasa, Yünsa and as consultant in Board of Directors and Executive Boards of Farplas Group.
"ART OF TEAMING, IN AN IMPECCABLE HARMONY!"
1514

ART OF DEVELOPING INNOVATIVE IDEAS!
1716
LETTER FROM THE GENERAL MANAGER
Dear Valuable Stakeholders,
For our company, the year 2013 was a year during which operational productivity and business processes are improved and reinforced and under the challenging competitive conditions, competitive advantages are heightened to turn these conditions into opportunities. Growing by creating alternative markets and segments in line with changing market conditions and growth trends ranked at the top priority among our targets. During 2013, serious problems both in the world and Turkey prevailed and world economy entered in a new transformation period. This transformation with USA in the center brought along a gradual growth in advanced markets and slowing growth in developing markets.
Especially announcements of the USA Central Bank caused serious volatility in financial markets and crisis continued in European Union. Developments related with the growth rate of China are curiously monitored by all markets across the world. 2013 was a year of instabilities in Turkey as well as we see our economy is affected due to the social and political events as well as crises in the world. Depreciation of TRY, rising TRY interest rates, increasing exchange rates are among the most important indicators of them. Nevertheless economic growth higher than the year 2012 is a pleasing development.
In 2013, where we focused on sustainable growth by creating value in Textile industry, we concentrated on productivity increasing works by reviewing our entire operational processes. For this purpose, we achieved cost saving and production increase by speeding up the Total Productivity Management (TPM) Projects. As a result of extending our productivity projects in the energy field, we received ISO 50001 Energy Management System ISO 50001 Certificate; we took an important step in energy efficient management at the international standards.
Once we look into operations of our company in 2013, it is seen that our results are satisfactory in terms of both financial and organizational performance. In regard to our 2013 financial performance, we see that our turnover is TRY 270 million, our net profit is TRY 15,5 million, around doubled the 2012's.
Generally 2013 was a year where competition considerably heightened and market conditions became difficult. In such a year, we focused on especially A/A+ up segments and women segment sales in order to differentiate us from our competitors. The level that we reached demonstrates success of our sales strategies. Running up the World Leadership, Yünsa protected his position as the largest player of the wool and wool-mix fabric export of Turkey and the largest wool fabric producer in Europe with its rich design team, ability to serve different markets, fast solutions customized to clients, fast delivery and much product variety. One of the important issues of 2013 for Yünsa is the international collaborations that we entered into. I think we will continue to see the positive effects of the mutual works that we continued with the important and large players of the Textile industry.
Another important issue we experienced in 2013 is the strike period during August. Due to the failure of reaching agreement on collective bargaining between Turkish Textile Employers Union, in which our company is a member, and Turkish Textile Knitting and Clothing Employees Union, strike has been an issue in 28 textile companies including our company. At the end of 9 days of strike, agreement has been reached and peaceful work environment is restored in our factory. After strike, an internal communication structure is launched in order to reinforce our communication with our entire employees.
In 2014 the fluctuations that will occur in interest, raw material prices, exchange rates, and elections in our country will render successful risk management and productivity much more important. With our works in risk management and productivity fields, 2014 will be a year for Yünsa, where our profitability and sustainable growth continues.
We target 2014 for Yünsa to be a year of growth in every field. Again to achieve higher profitability especially thanks to the sales we target at A+ and woman fabric segments is also among our priority goals. For this purpose, we consider that international collaborations launched in 2013 will play an important role. Continuous improvement and sustainable profitable growth will also be among our priorities in 2014.
Celebrating 40th year in 2013, Yünsa brings into life the art of success with his knowledge and experience so far. With our experience, we continue to add value in our industry, in our country as well as all of our stakeholders. Of course, we owe our success to all Yünsa employees. I sincerely thank and present my regards to my colleagues for their committed and ever-increasing successful works; our shareholders who place confidence and support in our company as well as our all other stakeholders.
F. Cem ÇELİKOĞLU
"ART OF SUCCESS, WITH KNOWLEDGE AND EXPERIENCE!"
1918
F. Cem ÇELİKOĞLUGeneral ManagerBorn in 1962, Cem Çelikoğlu graduated from METU Faculty of Administrative Sciences, Department of International Relations. He has been working for our company since 17.12.1987 and was appointed as the General Manager of the Company on 01.12.2002.
Semih UTKUChief Financial OfficerBorn in 1962, Semih Utku graduated from University of Baltimore with a BS degree in Business Administration-Finance. He joined our company on 01.06.1999 and he has been working as the Chief Financial Officer since 01.01.2000.
Derya KINIKChief Technical OfficerBorn in 1957, Derya Kınık graduated from Manchester University with BS and MS degrees in Textile Engineering. He joined our company on 01.04.1999 and he has been working as the Chief Technical Officer since 01.05.2000.
Bora BİRGİNChief Sales and Marketing OfficerBorn in 1973. Bora Birgin graduated from University of Nottingham, Department of Industrial Economics. He received his master’s degree at UMIST. He has been working for the company since 19.03.1998 and was appointed as the Chief Sales and Marketing Officer on 12.07.2010.
Muhammet EKENProduction DirectorBorn in 1968. Muhammet Eken graduated from Istanbul Technical University, Textile Engineering with BS degree and received his master’s degree at UMIST. He has been working for our company since 15.06.1995 and was appointed to his current position on 01.04.2011.
TOP MANAGEMENT
"ART OF MAKING DREAMS INTO REALITY!"
2120
Mehmet Kemal AKINWarping and Weaving ManagerBorn in 1967. Mehmet Kemal Akın graduated from Ege University, Department of Textile Engineering. He has been working for our company since 01.10.1990 and was appointed to his current position on 10.11.2005.
D. Hakan AYDINLIKChief DesignerBorn in 1965. Hakan Aydınlık graduated from the Marmara University, Faculty of Fine Arts. He has been working for our company since 03.07.1989 and was appointed to his current position on 01.12.1997.
Görkem AYGÜNMarketing Manager Born in 1976. Görkem Aygün graduated from the Ankara University, Department of Business Administration. He has been working for our company since 01.09.2010 and was appointed to his current position on 15.04.2013.
Uğur BAŞDAŞQuality Control ManagerBorn in 1974. Uğur Başdaş graduated from the Çukurova University, Department of Industrial Engineering. He has been working as Quality Control Manager for our company since 11.11.2013.
Ömer ÇOBANFinishing Mill ManagerBorn in 1970, Ömer Çoban graduated Yıldız Teknik University Department of Chemical Engineering. He has been working in his current position since 12.11.2012.
Gülden DOĞANMarketing ManagerBorn in 1969. Gülden Doğan graduated from İstanbul University, Department of Chemical Engineering. She has been working as Marketing Manager for our company since 07.09.2010.
Melik ERDİNÇSupply ManagerBorn in 1970. Melik Erdinç graduated from Istanbul University, Business Administration Department and received his master’s degree in Finance – Management at Fairleigh Dickinson University. He has been working for our company since 26.07.1999 and was appointed to his current position on 01.01.2003.
Aslıhan Ece İRTİŞFinance ManagerBorn in 1976. Aslıhan Ece İrtiş graduated from Bilkent University, Department of International Relations. She has been working for our company since 03.10.2005 and was appointed to her current position on 01.01.2013.
Hakan KONUŞKANProduction Planning ManagerBorn in 1968, Hakan Konuskan graduated from Boğaziçi University, Department of Industrial Engineering. He has been working for our company since 01.11.1993 and was appointed to his current position on 01.04.2013.
Serhat ÖDÜKMarketing ManagerBorn in 1977. Serhat Ödük graduated from Boğaziçi University, Department of Political Science and International Relations. He has been working for our company since 30.04.2007 and was appointed to his current position on 12.07.2010.
Tamer ÖZKANMarketing ManagerBorn in 1971. Tamer Özkan graduated from Bilkent University, Department of Economics. He has been working as Marketing Manager for our company since 15.04.2013.
Engin SARIBÜYÜKSpinning Mill ManagerBorn in 1981. Engin Sarıbüyük graduated from Ege University, Department of Textile Engineering. He received his master’s degree from Sabanci University. He has been working for our company since 27.12.2005 and was appointed to his current position on 01.04.2011.
Tamer TOKHuman Resources ManagerBorn in 1967. Tamer Tok graduated from Ankara University, Faculty of Political Sciences, Department of Business Administration. He has been working for our company since 01.04.1996 and was appointed to his current position on 29.12.2006.
Murat YILDIRIMResearch and Development Manager Born in 1968. Murat Yıldırım graduated from Uludağ University, Department of Textile Engineering. He has been working for our company since 19.07.1993 and was appointed to his current position on 01.04.2013
MANAGEMENT
"ART OF CREATING DIFFERENCE, WITH A PROFESSIONAL TEAM!"
2322
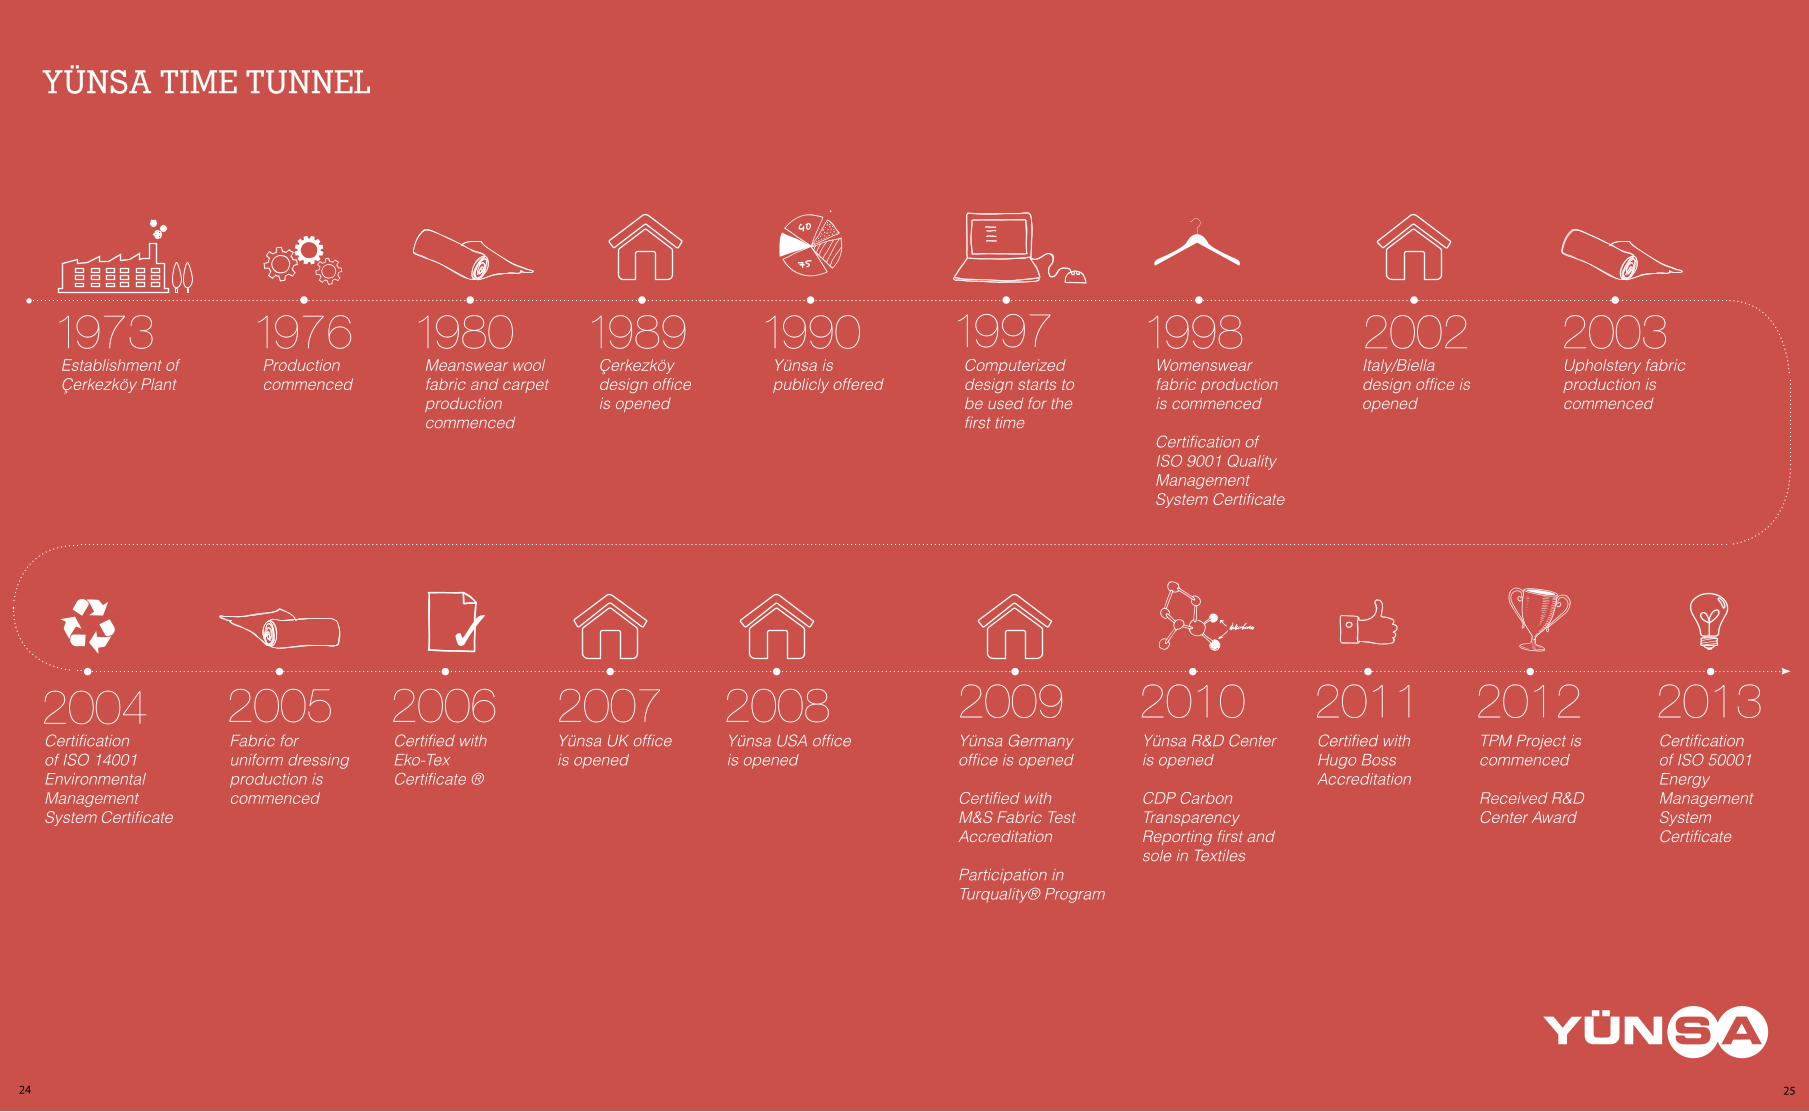
Establishment of Çerkezköy Plant
Certification of ISO 14001 Environmental Management System Certificate
Fabric for uniform dressing production is commenced
Certified with Eko-Tex Certificate ®
Yünsa UK office is opened
Yünsa USA office is opened
Yünsa Germany office is opened
Certified with M&S Fabric Test Accreditation
Participation in Turquality® Program
Yünsa R&D Center is opened
CDP Carbon Transparency Reporting first and sole in Textiles
Certified with Hugo Boss Accreditation
TPM Project is commenced
Received R&D Center Award
Certification of ISO 50001 Energy Management System Certificate
Productioncommenced
Meanswear wool fabric and carpet production commenced
Çerkezköy design office is opened
Yünsa is publicly offered
Computerized design starts to be used for the first time
Italy/Biella design office is opened
Upholstery fabric production is commenced
Womenswear fabric production is commenced
Certification of ISO 9001 Quality Management System Certificate
YÜNSA TIME TUNNEL
2524

To be a leader organization which creates value and is preferred for its pioneer and challengingapproach in different areas of textile.
MISSION
VISIONTo grow by making a difference in textile
products and services and be a global power.
2726
To Board of Directors of Yünsa Yünlü Sanayi ve Ticaret AŞ
1. As a part of our independent audit work, we evaluated whether the financial details and assessments and descriptions of Board of Directors contained in the annual activity report of Yünsa Yünlü Sanayi ve Ticaret AŞ (‘’Group’’) issued as of December 31st, 2013 is consistent with independently-audited financial statement with same date.
2. The issuance of the annual activity report subject to the report according to the Regulation on Identification of the Minimum Contents of the Annual Activity Report of Companies is under the responsibility of the Company Management.
3. Our responsibility as independent auditing company is to provide our opinions on the consistency of financial details contained in the annual activity report with consolidated financial statement subject of independent auditor report dated March 5th, 2014. Our evaluation is in accordance with the principles and procedures concerning issuing and publishing the annual activity report pursuant to the Turkish Code of Commerce ("TCC") No 6102. These regulations set forth the planning and executing reasonable assurance whether there is a material error in relation with the consistency of financial data contained in the annual activity report with the independently audited consolidated financial statements and data obtained by independent auditor during the audit.
We believe in that our assessments constitute a reasonable and sufficient basis for development of our opinion.
4. According to our opinion, financial details contained in the annual activity report annexed and assessments and descriptions of Board of Directors indicates a consistency with consolidated financial statement dated December 31st 2013 undergone independent audit of Yünsa Yünlü Sanayi ve Ticaret AŞ and affiliated partnerships.
Güney Independent Audit and Public Accountant Financial Advisory Inc. A member firm of Ernst & Young Global Limited
Metin Canaoğlulları, SMMMExecutive Auditor
March 5th, 2014 İstanbul, Türkiye
AUDITORS’ OPINION ON THE ANNUAL REPORT
2928

fashion
ART OF CAPTURING
ESSENCE OF FASHION, WITH GENUINE
TOUCHES!ART OF CAPTURING ESSENCE OF FASHION, WITH GENUINE TOUCHES!
3130

As the largest wool fabric producer in Europe and Turkey, Yünsa combines the technology and design in its fabrics and guides the fabric fashion. As a Turkish brand with 100% local capital, he seamlessly pursues its wool fabric productions under the world leadership vision.
Exporting over 50 countries, and having an international network with its affiliates in Germany, Italy, UK and USA and agencies in over 20 countries, Yünsa serves to world-leading clothing brands.
Yünsa also continued to invest in his brand in the year 2013 and protected its brand value through international shows, promotion and advertisement activities. For Yünsa, 2013 was a year where the focus is on sustainable profitable growth as well as high efficiency. Performing works in line with such focus areas, Yünsa expanded its markets in 2013 and delivered its products to much more people. The TPM (Total Productive Management) project, one of the best methodologies in this field, on the basis of profitability and efficiency targets of the company in 2012 began to be applied in our business. With this project, our target is primarily to identify and eliminate all losses of our business and, when losses are minimized, to increase efficiency and therefore profitability by improving all business parameters through implementing further development actions. TPM project increasingly continued to be in place in 2013.
Participating in many international shows from New York to London, Munich to Paris, Moscow to Shanghai in 2013, Yünsa demonstrated both its own brand as well as the level achieved by Turkish Textile in the most important platforms of textile and fashion world.
Yünsa which participates in Turquality®, which is the first and sole state-supported branding program, is entitled to receive the support for the second five-years with the works carried out in relation with its brand. Therefore, with Turquality® program, he demonstrates the power of Turkish brand in the world textile industry.
Celebrating 40th year in 2013, Yünsa offer customers the fabrics, which are higher quality and produced with higher productive and develop both R&D projects and product and processes and maintains works in order to ensure excellent customer satisfaction under the vision of World leadership. Yünsa will continue in 2014 the branding works in order to announce its leader position in the industry, differences he created and quality understanding to both domestic and foreign markets.
ART OF BEING LEADER IN EVERY CORNER OF THE WORLD
3332

Affiliates
YUNSA Germany GmbH
YUNSA Italia SRL
YUNSA UK LIMITED
YUNSA USA Inc.
AgenciesAustria, Canada, China, Czech Republic, Finland, France, Germany, Italy, Japan, Korea, Russia, Serbia, Singapore, Slovakia, South Africa, Spain, Sweden, Tunisia, USA
FactoryÇerkezköy, Turkey
Design OfficesBiella, ItalyÇerkezköy, Turkey
EXPORTING TO MORE THAN 50 COUNTRIES WORLDWIDE
3534

ART OF FULFILLING
THE AMBITIONS WITH AN ENDLESS
CARE!
FEELING
successful
3736
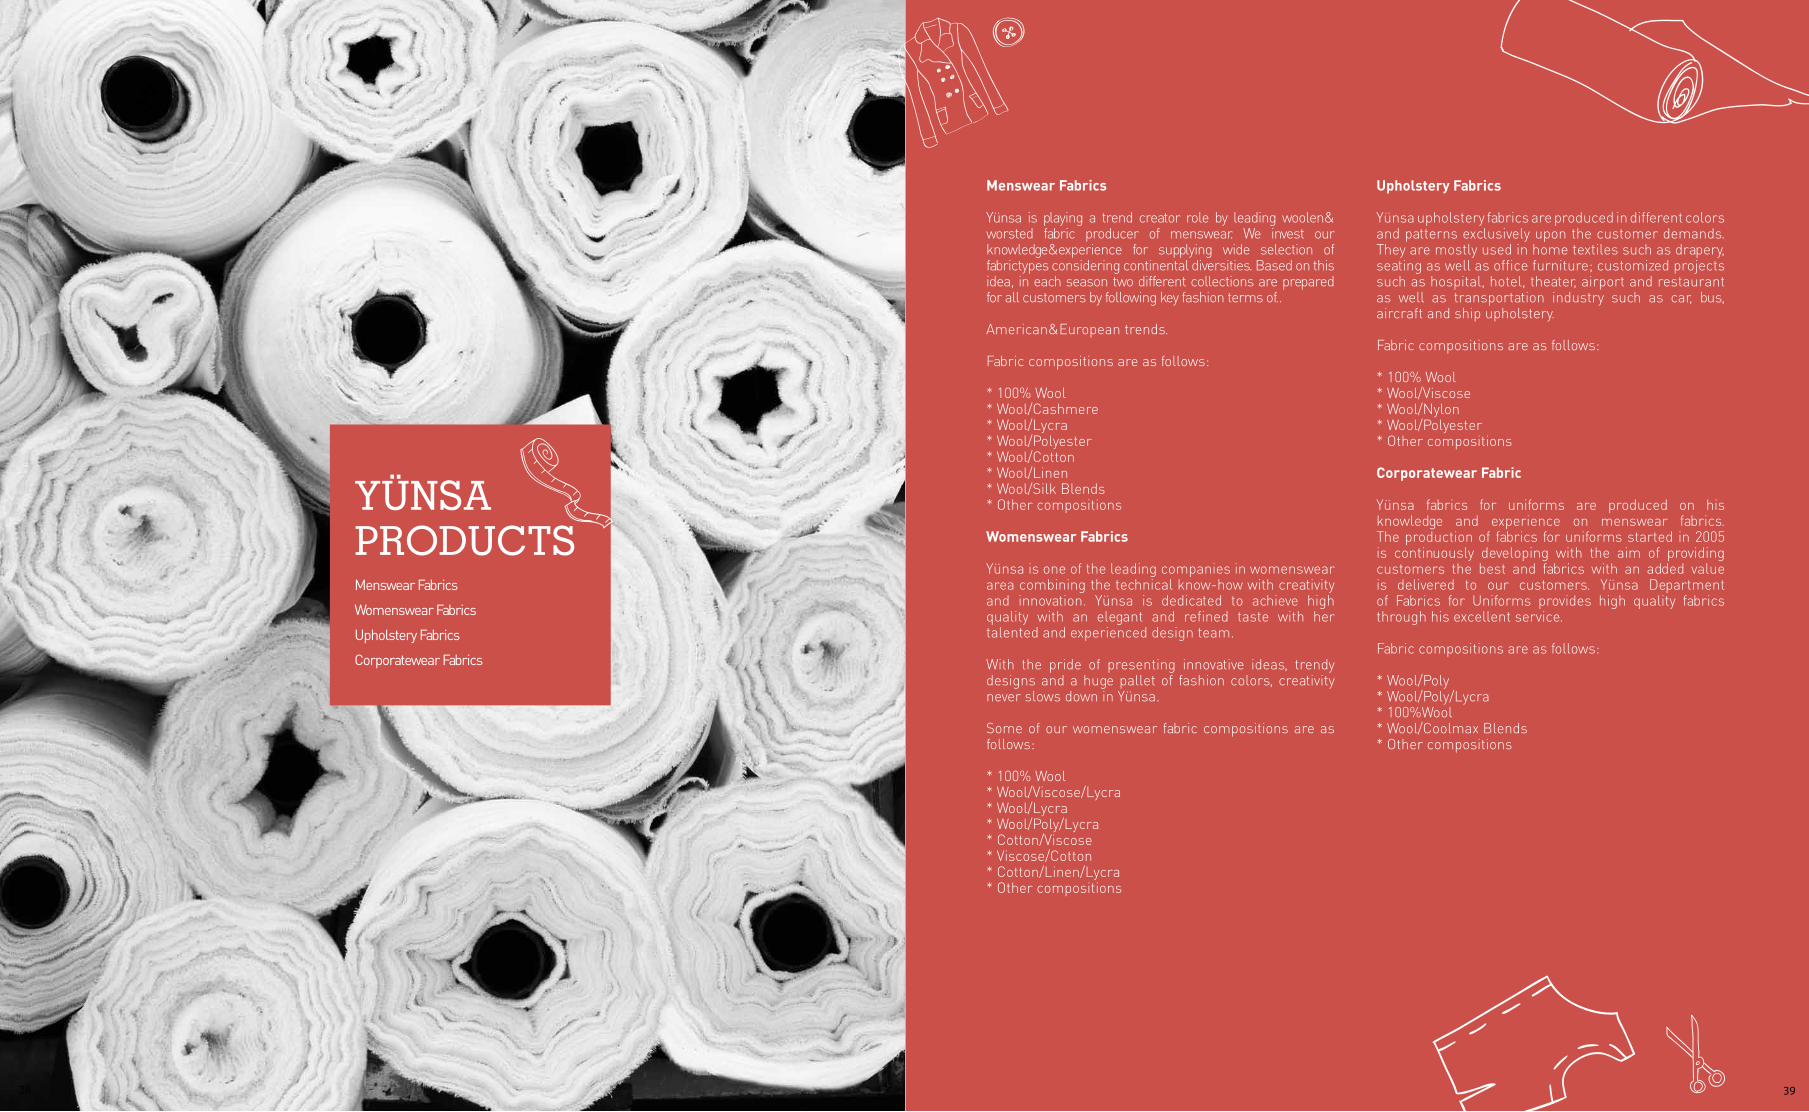
Menswear Fabrics
Yünsa is playing a trend creator role by leading woolen&worsted fabric producer of menswear. We invest our knowledge&experience for supplying wide selection of fabrictypes considering continental diversities. Based on this idea, in each season two different collections are prepared for all customers by following key fashion terms of..
American&European trends.
Fabric compositions are as follows:
* 100% Wool* Wool/Cashmere * Wool/Lycra* Wool/Polyester* Wool/Cotton* Wool/Linen* Wool/Silk Blends * Other compositions
Womenswear Fabrics
Yünsa is one of the leading companies in womenswear area combining the technical know-how with creativity and innovation. Yünsa is dedicated to achieve high quality with an elegant and refined taste with her talented and experienced design team.
With the pride of presenting innovative ideas, trendy designs and a huge pallet of fashion colors, creativity never slows down in Yünsa.
Some of our womenswear fabric compositions are as follows:
* 100% Wool * Wool/Viscose/Lycra* Wool/Lycra * Wool/Poly/Lycra* Cotton/Viscose * Viscose/Cotton * Cotton/Linen/Lycra* Other compositions
Upholstery Fabrics
Yünsa upholstery fabrics are produced in different colors and patterns exclusively upon the customer demands. They are mostly used in home textiles such as drapery, seating as well as office furniture; customized projects such as hospital, hotel, theater, airport and restaurant as well as transportation industry such as car, bus, aircraft and ship upholstery.
Fabric compositions are as follows:
* 100% Wool * Wool/Viscose * Wool/Nylon* Wool/Polyester * Other compositions
Corporatewear Fabric
Yünsa fabrics for uniforms are produced on his knowledge and experience on menswear fabrics. The production of fabrics for uniforms started in 2005 is continuously developing with the aim of providing customers the best and fabrics with an added value is delivered to our customers. Yünsa Department of Fabrics for Uniforms provides high quality fabrics through his excellent service.
Fabric compositions are as follows:
* Wool/Poly * Wool/Poly/Lycra* 100%Wool * Wool/Coolmax Blends* Other compositions
YÜNSA PRODUCTSMenswear Fabrics
Womenswear Fabrics
Upholstery Fabrics
Corporatewear Fabrics
3938
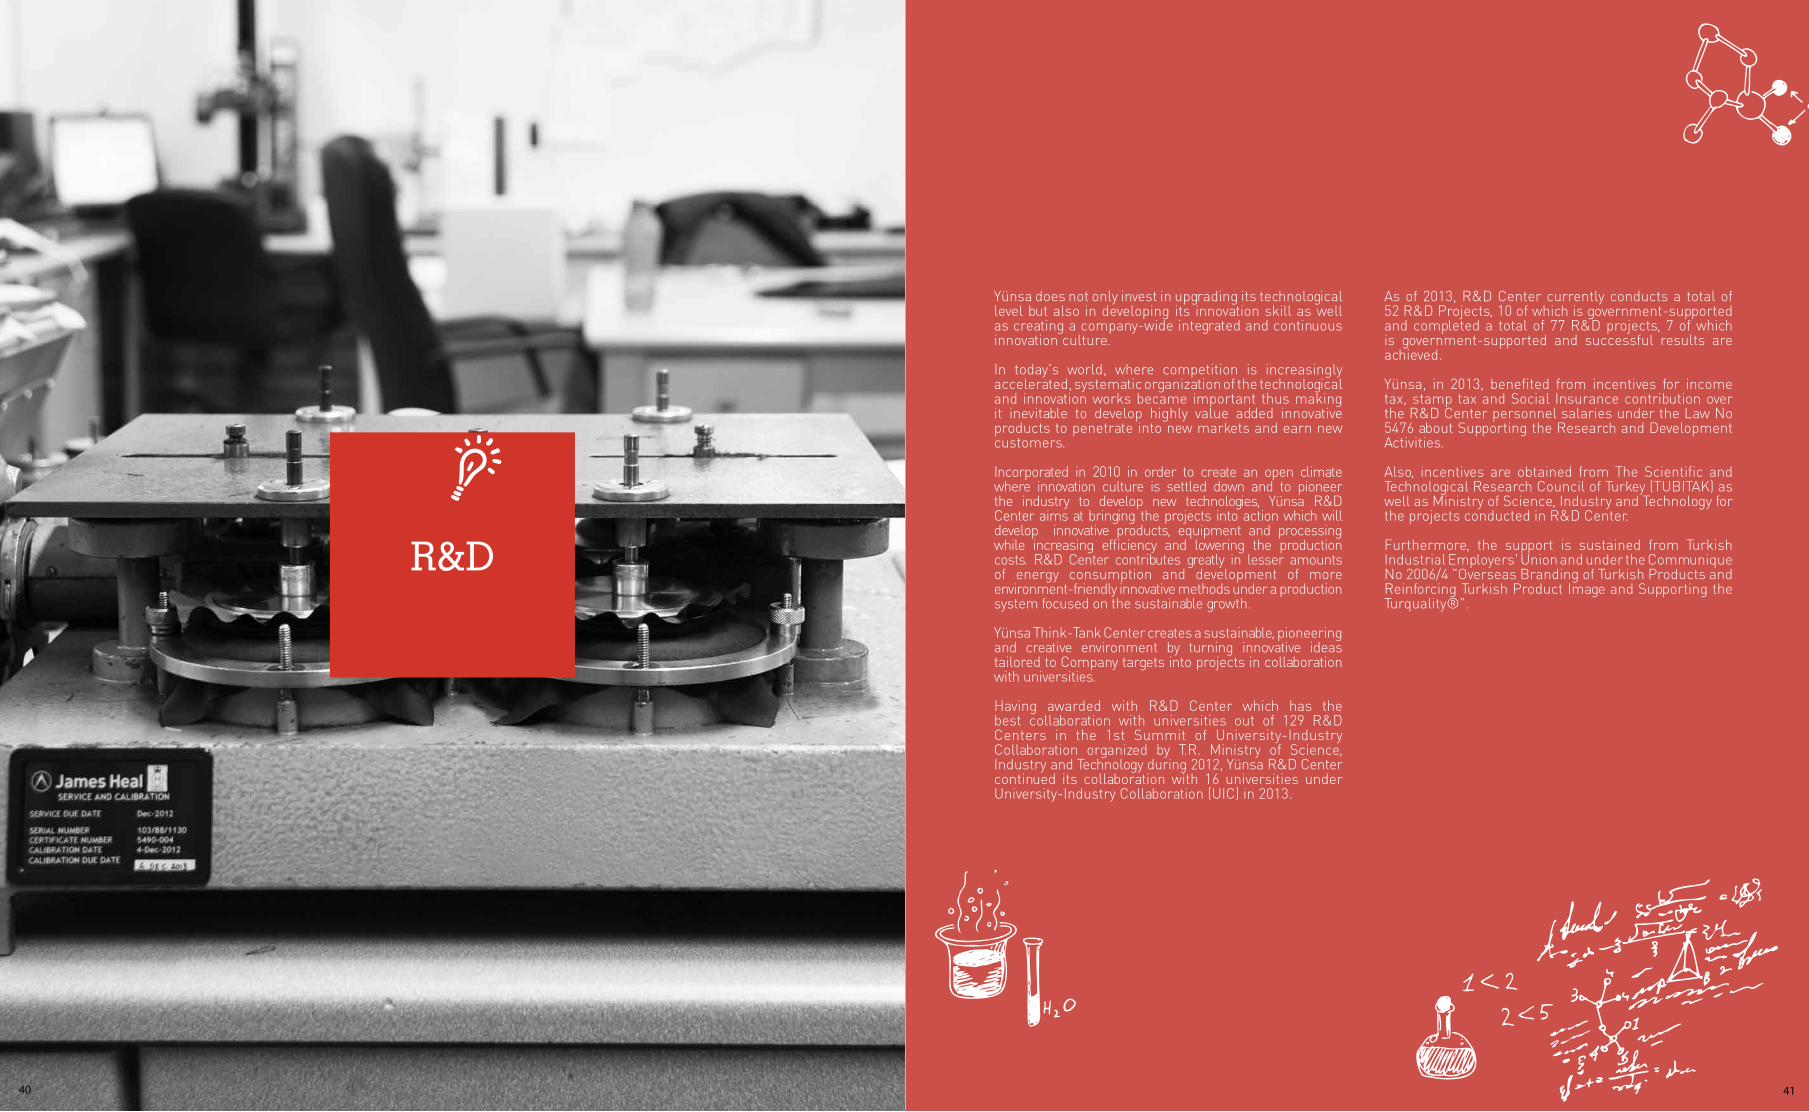
Yünsa does not only invest in upgrading its technological level but also in developing its innovation skill as well as creating a company-wide integrated and continuous innovation culture.
In today's world, where competition is increasingly accelerated, systematic organization of the technological and innovation works became important thus making it inevitable to develop highly value added innovative products to penetrate into new markets and earn new customers.
Incorporated in 2010 in order to create an open climate where innovation culture is settled down and to pioneer the industry to develop new technologies, Yünsa R&D Center aims at bringing the projects into action which will develop innovative products, equipment and processing while increasing efficiency and lowering the production costs. R&D Center contributes greatly in lesser amounts of energy consumption and development of more environment-friendly innovative methods under a production system focused on the sustainable growth.
Yünsa Think-Tank Center creates a sustainable, pioneering and creative environment by turning innovative ideas tailored to Company targets into projects in collaboration with universities.
Having awarded with R&D Center which has the best collaboration with universities out of 129 R&D Centers in the 1st Summit of University-Industry Collaboration organized by T.R. Ministry of Science, Industry and Technology during 2012, Yünsa R&D Center continued its collaboration with 16 universities under University-Industry Collaboration (UIC) in 2013.
As of 2013, R&D Center currently conducts a total of 52 R&D Projects, 10 of which is government-supported and completed a total of 77 R&D projects, 7 of which is government-supported and successful results are achieved.
Yünsa, in 2013, benefited from incentives for income tax, stamp tax and Social Insurance contribution over the R&D Center personnel salaries under the Law No 5476 about Supporting the Research and Development Activities.
Also, incentives are obtained from The Scientific and Technological Research Council of Turkey (TUBITAK) as well as Ministry of Science, Industry and Technology for the projects conducted in R&D Center.
Furthermore, the support is sustained from Turkish Industrial Employers' Union and under the Communique No 2006/4 "Overseas Branding of Turkish Products and Reinforcing Turkish Product Image and Supporting the Turquality®".
R&D
4140

Yünsa, in addition to its contribution to the country's economy and its wider employment opportunities, is also a brand that is sensitive to the environment, which is the world's most precious value. It shows its respect to the environment by the projects it develops, the standards it implements and its use of natural resources in the most efficient way.
CDP (Carbon Disclosure Project)
Yünsa has shown its awareness about climate change and announced greenhouse gas emissions publicly by CDP. Yünsa, as the first firm in the textile sector, continued to disclosure in 2013 and was among 3 volunteered companies in Turkey.
ISO 14001
Yünsa has been applying the ISO 14001 Environmental Management System since 2004. In this context, our impacts on the environment are evaluated and measures are being taken for the mitigation/elimination of these impacts.
Eco-Tex ® Standard 100
Eco-Tex® Standard 100 for textile products is a standard worldwide test and certification system at all stages of process for raw materials, intermediate, and final products. Yünsa, which wants to provide seamless services to its customers in terms of health, has also renewed its Eco-Tex ® 100 certificate in 2013. In our production processes, no chemicals that are prohibited are used and our suppliers are also being closely monitored in this regard.
Waste Separation
Entire waste that arises during our processes are separated and sent to the licensed disposal/recycle institutions.
Clean Manufacturing
In 2013, Yünsa devised the Clean Manufacturing Plan and commenced the operations under this plan. Under this scope, the best manufacturing methods are identified and applied, which will minimize damages on the environment. In this regard, R&D project is initiated to recycle waste water into the production after its treatment and related works continue.
Natural Resource Use
Various R&D projects have been started in order to optimize the use of natural resources and reduce the environmental impact.
Environmental Training
Under the title “Single Point Training” environmental awareness training is continued in 2013 with the target of increasing awareness of workers on this issue.
Revision
All environmental activities are monitored at the monthly Environmental Meetings with the Participation of Assistant General Manager and necessary source is allocated. In the “Good Morning Quality Meetings” environmental issues are being reviewed on a daily basis and relevant actions are taken.
Awareness of Waste Companies
Waste companies are assessed in terms of ISO 9001, 14001 and other quality standards and environmental legislation in audits each year; areas for improvements are determined and companies are encouraged to take actions on deficiencies identified. These firms are provided with the trainings on environment and workplace safety and these trainings are audited as well as we contribute in their developments on these subjects.
COIZ – Çerkezköy Organized Industrial Zone – Environment Committee
Yünsa is an active member of Environmental Committee established by COIZ. The objective of the committee is to enable all companies registered under the COIZ reaching better levels in environmental issues and having knowledge about the good application examples as shared by the companies.
ISO 50001
Due to the increasing importance of energy and energy management, today, the energy efficiency has reached a critical position. Therefore, having speeded up his works in the energy efficiency, Yünsa's activities in this field is certified with ISO 50001 Energy Management System Certificate.
ENVIRONMENTAL POLICY
4342
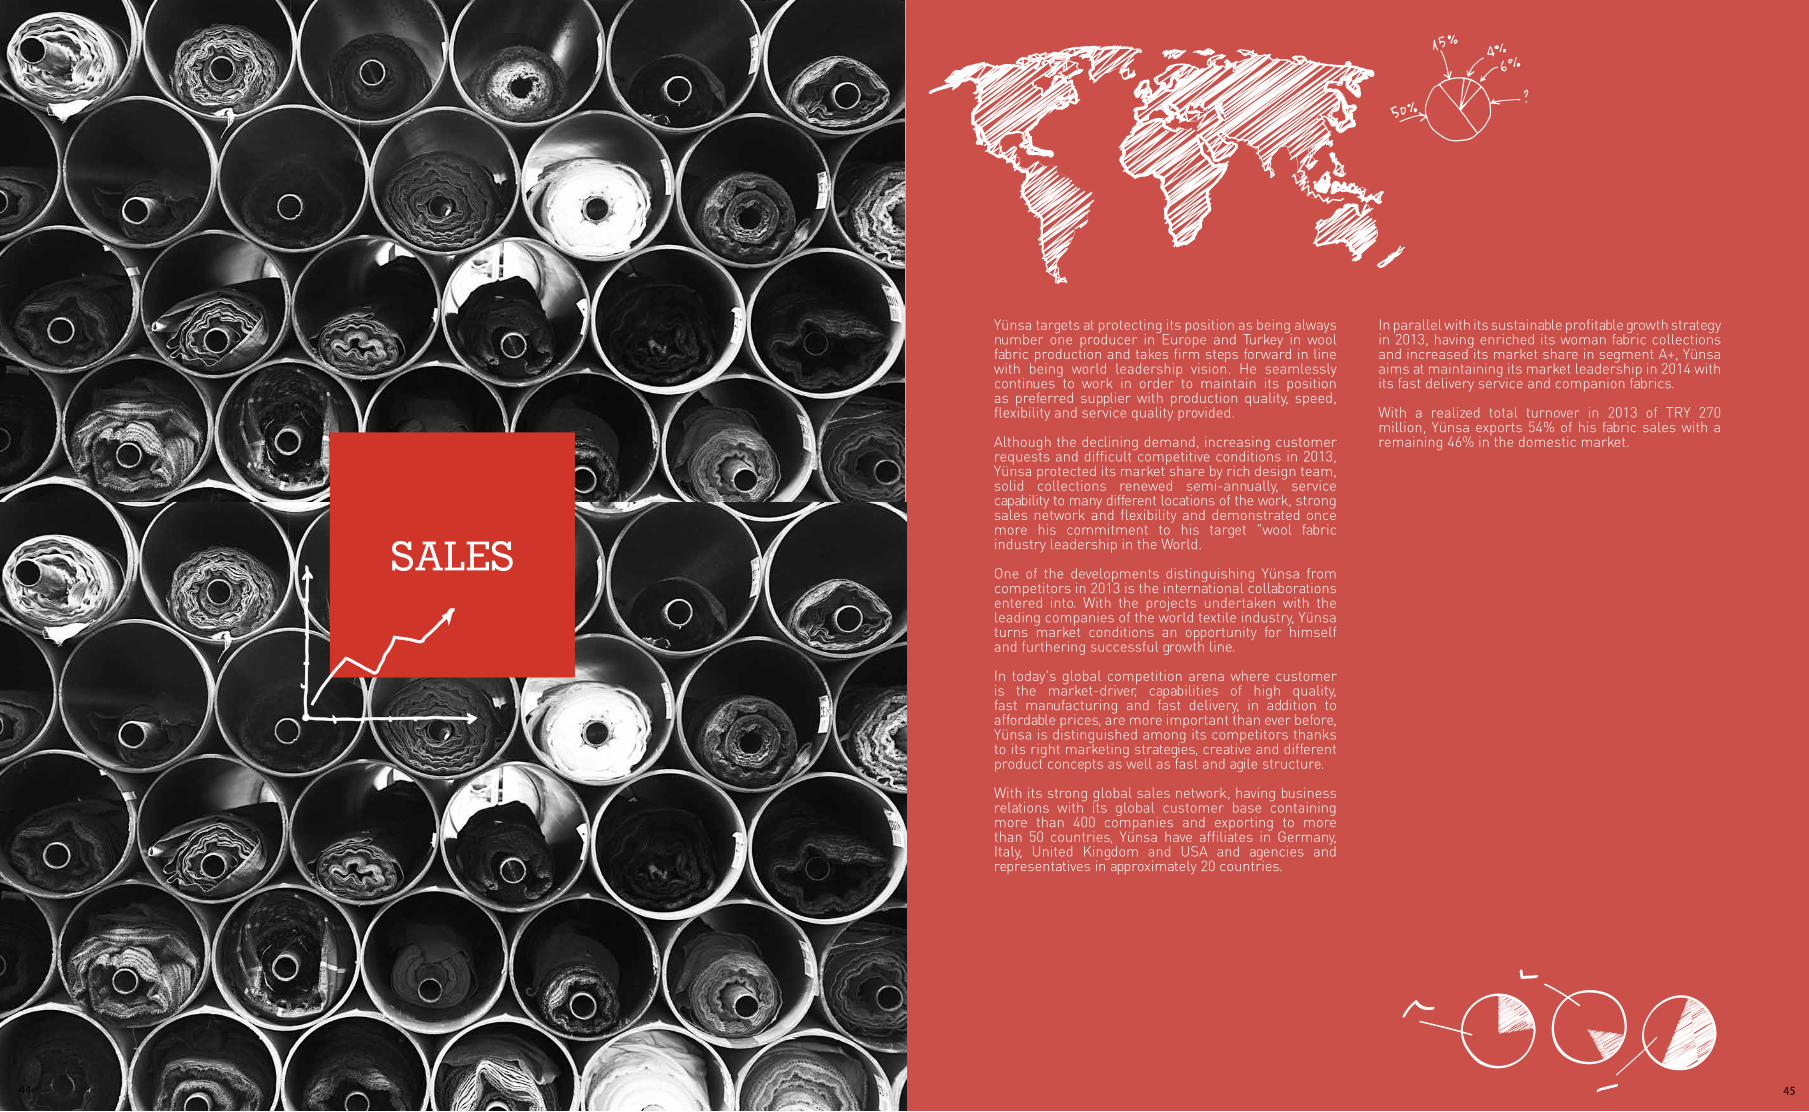
Yünsa targets at protecting its position as being always number one producer in Europe and Turkey in wool fabric production and takes firm steps forward in line with being world leadership vision. He seamlessly continues to work in order to maintain its position as preferred supplier with production quality, speed, flexibility and service quality provided.
Although the declining demand, increasing customer requests and difficult competitive conditions in 2013, Yünsa protected its market share by rich design team, solid collections renewed semi-annually, service capability to many different locations of the work, strong sales network and flexibility and demonstrated once more his commitment to his target "wool fabric industry leadership in the World.
One of the developments distinguishing Yünsa from competitors in 2013 is the international collaborations entered into. With the projects undertaken with the leading companies of the world textile industry, Yünsa turns market conditions an opportunity for himself and furthering successful growth line.
In today's global competition arena where customer is the market-driver, capabilities of high quality, fast manufacturing and fast delivery, in addition to affordable prices, are more important than ever before, Yünsa is distinguished among its competitors thanks to its right marketing strategies, creative and different product concepts as well as fast and agile structure.
With its strong global sales network, having business relations with its global customer base containing more than 400 companies and exporting to more than 50 countries, Yünsa have affiliates in Germany, Italy, United Kingdom and USA and agencies and representatives in approximately 20 countries.
In parallel with its sustainable profitable growth strategy in 2013, having enriched its woman fabric collections and increased its market share in segment A+, Yünsa aims at maintaining its market leadership in 2014 with its fast delivery service and companion fabrics.
With a realized total turnover in 2013 of TRY 270 million, Yünsa exports 54% of his fabric sales with a remaining 46% in the domestic market.
SALES
4544
A. Investments
1. Developments in Investments
In 2013, investments worth USD 663.063 were made for domestic and imported goods’ subsidized investments in accordance with the Investment Subsidy Certificate number 102221, dated 03.08.2011 and granted by Ministry of Economy, General Directorate of Incentives Implementation and Foreign Direct Investment and investments worth USD 43.296 were made for domestic and imported goods’ subsidized investments in accordance with the Investment Subsidy Certificate number B 108901, dated 29.08.2013, investments worth USD 39.608 were made for domestic and imported goods’ subsidized investments in accordance with the Investment Subsidy Certificate number 112140, dated 10.10.2013.
Taking into consideration other unsubsidized investments, the Company’s investments reached approximately US$ 3 million on a USD basis and TL 5,8 million on a TRY basis in 2013.
2. Investment Incentives
In 2013, the Company benefited from the subsidies such as customs tax exemption and VAT exemption in accordance with its subsidy certificate.
B. Donations
Our company donated TRY 9.583,25 to various Turkish foundations and associations’ not-for-profit during 2013.
2013 Annual Change
Turnover (TRY) 269.932.278
Gross Profit (TRY) 62.130.337
EBIT (TRY) 34.524.711
C. Developments in Annual Turnover and Profitability
ACTIVITIES
2013
Textile (TRY) 255.832.163
Ready- to- wear (TRY) 14.100.115
Breakdown of net fabric sales in 2013:
Annual Change
(+) % 6
(-) % 1
% 6
% 21
% 167
I. Financial Structure Ratios Total Liabilities / Total Assets 0,67 0,66 0,69Equity / Total Assets 0,33 0,34 0,31Borrowing Ratio 2,07 1,93 2,25
II. Liquidity Ratios Current Ratio 1,11 1,14 1,13Acid-Test Ratio 0,53 0,62 0,68
III. Profitability Ratios (%) Gross Profit Margin %27 %20 %23Net Profit Margin %7 %3 %6Earning Per Share %49 %26 %53
2. Base Ratios
2011 2012 2013
4746
RISK MANAGEMENT AND INTERNAL CONTROL MECHANISM
COMMITTEES
Risk assessment and internal control mechanism is applied at every level of the Company.
Our Company implements a company-wide Corporate Risk Management with the understanding that Risks also Involve Opportunities in order to manage the risks in the most effective manner. Yünsa Corporate Risk Management is a planned, adaptable, consistent and ongoing process structured in the Company in order to identify and decide the measurements and strategies against, by defining, the factors creating threat and opportunity in achievement of Company targets.
Company risks are followed up through main risk indicators as specified by the Holding and Company. These indicators are continuously monitored and reported periodically. The necessary actions for managing the risks as indicated by the main risk indicators are taken by the Company under the coordination of Sabancı Holding.
Company devised the Risk Management Policy which defines the risk management understanding, strategies, methods and approaches and role and responsibilities as well as creates a common language across the Company. Under this policy, to better identify, measure and manage the risks, a Risk Management Unit is established in the Company.
Risk Management Unit, within the framework of policies, standards and procedures approved by Company management, determines main and critical risks of the company, works with risk managers to make recommendations in order to reduce, eliminate or transfer the risks involved, follows action plans of departments, realizes studies to determine the Company's risk appetite and follows whether risks are managed within the framework of this appetite. Risk management unit continues these activities with full support, responsibility and active participation of the company's employees.
Corporate Governance Committee also performs the function of Committee for Earlier Diagnosis of the Risk. Corporate Governance Committee, in this frame, carries out works in order to diagnose earlier the risks which will jeopardize the existence, development and continuity of the Company and to apply the measurements necessary for the risks identified and to manage the risk and reviews the risk management systems at least annually.
Company houses an Internal Audit Unit for conducting audits, investigations and examinations in order to safeguard the rights and interests of the Company, to develop suggestions against internal and external risks.
Company Internal Audit Unit reports periodically and directly to the Audit Committee of the Company consisting of Independent Members of Board of Directors, due to the principle of independence. Internal audit mechanism is under the responsibility of top management and reviewed regularly by Internal Audit Unit of the Company.
The duties of the Internal Audit Unit are to check the reliability and accuracy of financial statements of the Company as well as affiliates, to ensure that operations are performed in compliance with laws and ethical rules adopted by the Company, to furnish assurances to minimize the current and potential risks to the reasonable levels by having them identified upon analyzing the processes with a view to increase the operational effectiveness and productivity.
AUDIT COMMITTEE
Audit Committee consists of two persons who do not have direct executive functions, are knowledgeable and experienced on financial matters as well as independent members of Board of Directors. The chairman of Audit Committee is Mehmet Kaya, Independent Member of Board of Directors, and member of Audit Committee is Hüsnü Paçacıoğlu, Independent Member of Board of Directors. The mandate of the committee members are the same as the term of company’s Board of Directors.
Chairman and Member of Audit Committee are appointed by Board of Directors. The reporting works of Audit Committee are executed by Internal Audit Unit of the Company. Reporter is designated by Chairman of Audit Committee. The necessary resources for Audit Committee to function and any kind of support are provided by Board of Directors.
The function of the Audit Committee is to inform Board of Directors of accounting system of the Company, financial reporting, public disclosure of financial data, functioning and effectiveness of the internal audit system and independent audit and support Company's works in compliance with laws and regulations, notably Legislation of Capital Market Board, principles of corporate management and ethical rules of the company and perform the function of supervision on the said issues.
Audit Committee submits Chairman of the Board its activities, determinations and suggestions it come up with in relation with the function and responsibility area.
Audit Committee convenes in Head Quarter of the Company or another place upon invitation of Chairman of Audit Committee at least quarterly totaling at least four meetings.
Committee may be called to extraordinary meeting by Chairman of the Board or Chairman of the Committee. It may hold meetings with a specific agenda with auditor and managers.
Audit Committee convened four times in 2013, examined the audit reports, approved the audit schedule, submitted Board of Directors its reports on accuracy and authenticity of the financial statement to be publicly disclosed.
CORPORATE MANAGEMENT COMMITTEE
The Chairman of Corporate Management Committee, consisting of two persons, is Hüsnü Paçacıoğlu, Independent Member of the Board and its Member is Barış Oran, Member of the Board. The mandate of the committee members are the same as the term of Yünsa Yünlü Sanayi ve Ticaret AŞ’s Board of Directors. The objective of the Corporate Management Committee is to furnish suggestions which will render Corporate Management Principles of the Company to be harmonized with internationally recognized as well as Capital Market Board-defined corporate management principles and provide advices to ensure materialization and implementation of these principles, to monitor the compliance of the Company to these principles and perform improvement activities on these matters.
Committee observes and identifies if Corporate Management Principles are implemented in the company. If not, its justification, and interest conflicts arising due to the failure in complete compliance with these principles and advises Board of Directors about improvements in corporate management implementations.
Committee, furthermore, performs the functions of Nomination Committee, and Remuneration Committee, as stipulated in Corporate Management Principles.
Meeting agenda is determined by the Chairman of the Committee. Members and shareholders submit Chairman of Corporate Management Committee of the matters that they wish to be included in the agenda via reporters.
Meetings are convened in a place and date to be seen fit by the Chairman at least four times a year. At the beginning of each year, the annual meeting schedule of Corporate Management Committee is prepared by Chairman of the Committee and announced to all members. Management Committee documents and keeps records of all the works he performed and submits Board of Directors the reports containing all information about its works and meeting result. The persons who will be regarded as fit by Chairman may attend in meetings.
Any kind of resource and supports necessary for Committee to function are provided by the Board of Directors.
EARLY RISK DIAGNOSIS COMMITTEE
Early Risk Diagnosis Committee is constituted by Board of Directors in order to diagnose early any kind of risks including strategic, operational, financial and other which may jeopardize the presence, development and continuity of the Yünsa Yünlü Sanayi ve Ticaret AŞ and implement the measurements and remedies necessary to do so and manage the risk.
The Chairman of Early Risk Diagnosis Committee is appointed among the independent members by Board of Directors of the Company. Committee is composed of, except for Chairman, at least one Member elected by Board of Directors. Committee is chaired by Independent Board Member Hüsnü Paçacıoğlu and its Member is Board Member Barış Oran. The tenure of the Committee Members is in parallel with tenure of the Company Board Members.
Early Risk Diagnosis Committee carries out works in order to define the risks which may jeopardize the presence, development and continuity of the company, to create the models and management systems for avoiding the crisis, to implement the necessary measurements related with early diagnosis, identification, risks and manage the risk.
It reviews the risk management systems at least once a year and observes the implementation of the applications related with the risk management in compliance with the Committee Resolutions.
Meeting agenda is determined by Committee Chairman. Board of Directors and Committee members notify Committee Chairman of the topics that they wanted to be included in agenda. Committee may invite any manager to meeting and receive his/her opinions.
4948
OTHER ISSUES RELATED WITH THE OPERATIONS During 2013, no lawsuit is filed against our Company, which may considerably impact the financial status and operations of the Company.
Further, no administrative or judicial sanction is imposed on our Company and Members of Executive Board on the basis of acts in violation with legislative provisions during the term.
Company does not have share acquired by himself.
Company does not have capital market instrument issued during January 01 - December 31, 2013.
No private audit has been made in our Company during January 01 - December 31, 2013. Under the public audit, on the basis of articles 10th and 73rd of Custom Code No 4458, audit of "Later Control and Risky Actions Control" under the 2012 "Later Control Program" enforced by Ministry Customs and Commerce.
Targets and annual performance of our Company is discussed in Ordinary General Assembly convened during the year as well as information provided our shareholders about the markets and evaluations in our markets. No extraordinary general assembly is convened during the year.
Monthly financial status reports of the company are presented to Sabancı Holding Industry Group President by General Manager and Vice General Manager responsible for Financial Affairs. Information is provided to Board of Directors in Board of Directors' Meeting regularly convened and explanations are made about the financial results, realization level of the planned activities, and Company’s status against the strategic targets determined.
Pursuant to Article 199 of TCC No 6120, information about all sales and purchase and other actions made by Yünsa Yünlü San. ve Tic AŞ and subsidiaries, dominant partner and subsidiaries of dominant partner.
The actions made is appropriate to its precedents in line with the dominant Company explanations in relevant articles of TCC No 6102 and no loss is incurred due to being included in company group.
In the report dated 27.02.2014 issued by Board of Directors of Yünsa Yünlü Sanayi ve Ticaret AŞ the conclusion is arrived that in all actions made during 2013 by Yünsa Yünlü San. ve Tic. AŞ with subsidiaries, dominant partner and subsidiaries of dominant partner, all legal actions and measurements are taken under the responsibilities specified in Article 199 of TCC No 6102 and responsibilities given to Board of Directors.
COLLECTIVE AGREEMENT APPLICATIONS
Upon failure of reaching agreement in 23rd Period Collective Bargaining negotiations between Turkish Textile Knitting and Clothing Employees Union and Turkish Textile Industry Employers' Union, strike was went out in our
Company between 15.08.2013 and 23.08.2013. Negotiations made between parties are resulted in agreement at the date of 23.08.2013 and a new Group Collective Agreement for 36 months is signed and entered into force in 01.04.2013 to expire in 31.03.2016.
RIGHTS AND BENEFITS PROVIDED TO PERSONNEL AND EMPLOYEES
Various benefits is being provided to our personnel, under job evaluation and salary policies, such as base salary, gratuity, performance-based variable premium, private health insurance, individual pension contribution, accident and life insurance, annual leave above legal requirements and social leaves. On the other hand, Company vehicle, initiatives to use various communication means, additional benefits to our personnel enrolled in master and doctorate programs are our applications under this scope.
Furthermore, our employees, member to employee union, can benefit from various social aids depending on the monthly routine or realization status under the framework defined in collective bargaining.
ARTICLES OF ASSOCIATION AMENDMENTS MADE DURING THE PERIOD
In order to comply with Turkish Code of Commerce No 6102, Capital Market Code No 6362 and secondary legislations, pursuant to amendment text approved with permission letters No 29833736-110.03.02-481-2013 dated 01.03.2013 of Capital Market Board, permission letter No 67300147/431.02-3088-270798-2458-1491 dated 05.03.2013 of TR Ministry of Customs and Commerce, Articles No 1, 2, 3, 4, 6, 7, 9, 10, 11, 12, 13, 14, 15, 16, 17, 18, 19, 20, 21, 22, 23, 24, 25, 26, 27, 29, 30, 31, 33, 34, 36 and 37 of Articles of Association and Articles 8, 32 and 35 thereof are removed. Said amendments are registered on 08.04.2013.
INDEPENDENT AUDIT COMPANY REPLACEMENT
In the Ordinary General Assembly Meeting dated March 26, 2013, upon the proposal of Audit Committee and recommendation decision of Board of Directors, in line with the principles determined with Turkish Code of Commerce No 6102 and Capital Market Code No 6362, Güney Bağımsız Denetim ve Serbest Muhasebeci Mali Müşavirlik AS (Member of Ernst and Young) is approved by our shareholders to be independent audit company in order to carry out auditing the financial reports in account period of the year 2013 as well as other activities in these codes.
POLICY OF REMUNERATION FOR BOARD OF DIRECTORS AND TOP LEVEL DIRECTORS
This policy document defines the remuneration system and applications for our Board Members and top level directors having administrative responsibilities under the provisions of Capital Market Board.
A fixed remuneration, applicable for every Board Member is determined in the ordinary meeting of General Assembly every year.
Remuneration is paid to executive Board Members under the policy determined for the top level directors as follows.
In remuneration of the independent Members of Board of Directors, no remuneration plan can be used based on Company performance.
Remuneration is paid to Members of Board of Directors on pro-rata basis by taking their commission period from their appointment to release dates. The expenses of members of board of directors incurred by them due to their contributions in Company (travel, phone, insurance etc. expenses) can be met by the Company.
Remuneration of the top level directors consists of two components as fixed and performance payments.
Our remuneration policy is arranged and applied in line with the criteria such as remuneration and vested benefits, fairness, objectivity, promoting high performance, competitive, rewarding and motivating.
Main targets of our remuneration policy is to determine the remuneration by stressing on the business size, performance, work-contribution, knowledge/skill and competences, motivation of the employees by sustaining intra- and inter-company remuneration balance and competitiveness in the market and increasing the commitments and retention of workforce with suitable competence which will enable our Company to reach our targets.
''Job Family Model'', we implemented in our Company, defines the organizational roles, examples of basic responsibilities, performance indicators, knowledge/skill/experience and competences and our remuneration policy is based on an objective system founded on Job Family Model.
The aim of the ‘’Variable Salary Management’’ in our Company is again to encourage our employees to perform outstandingly by awarding the success and to embed a target-focused performance culture in our Company in order to support our employees in meeting the budget targets of our Company and achieving business results over their targets.
To support the salary management with additional benefits, "vested benefits" are dealt with as an important part of total award management. Vested benefits we offer contain such principles as appropriateness to market conditions, competitiveness and fairness.
5150
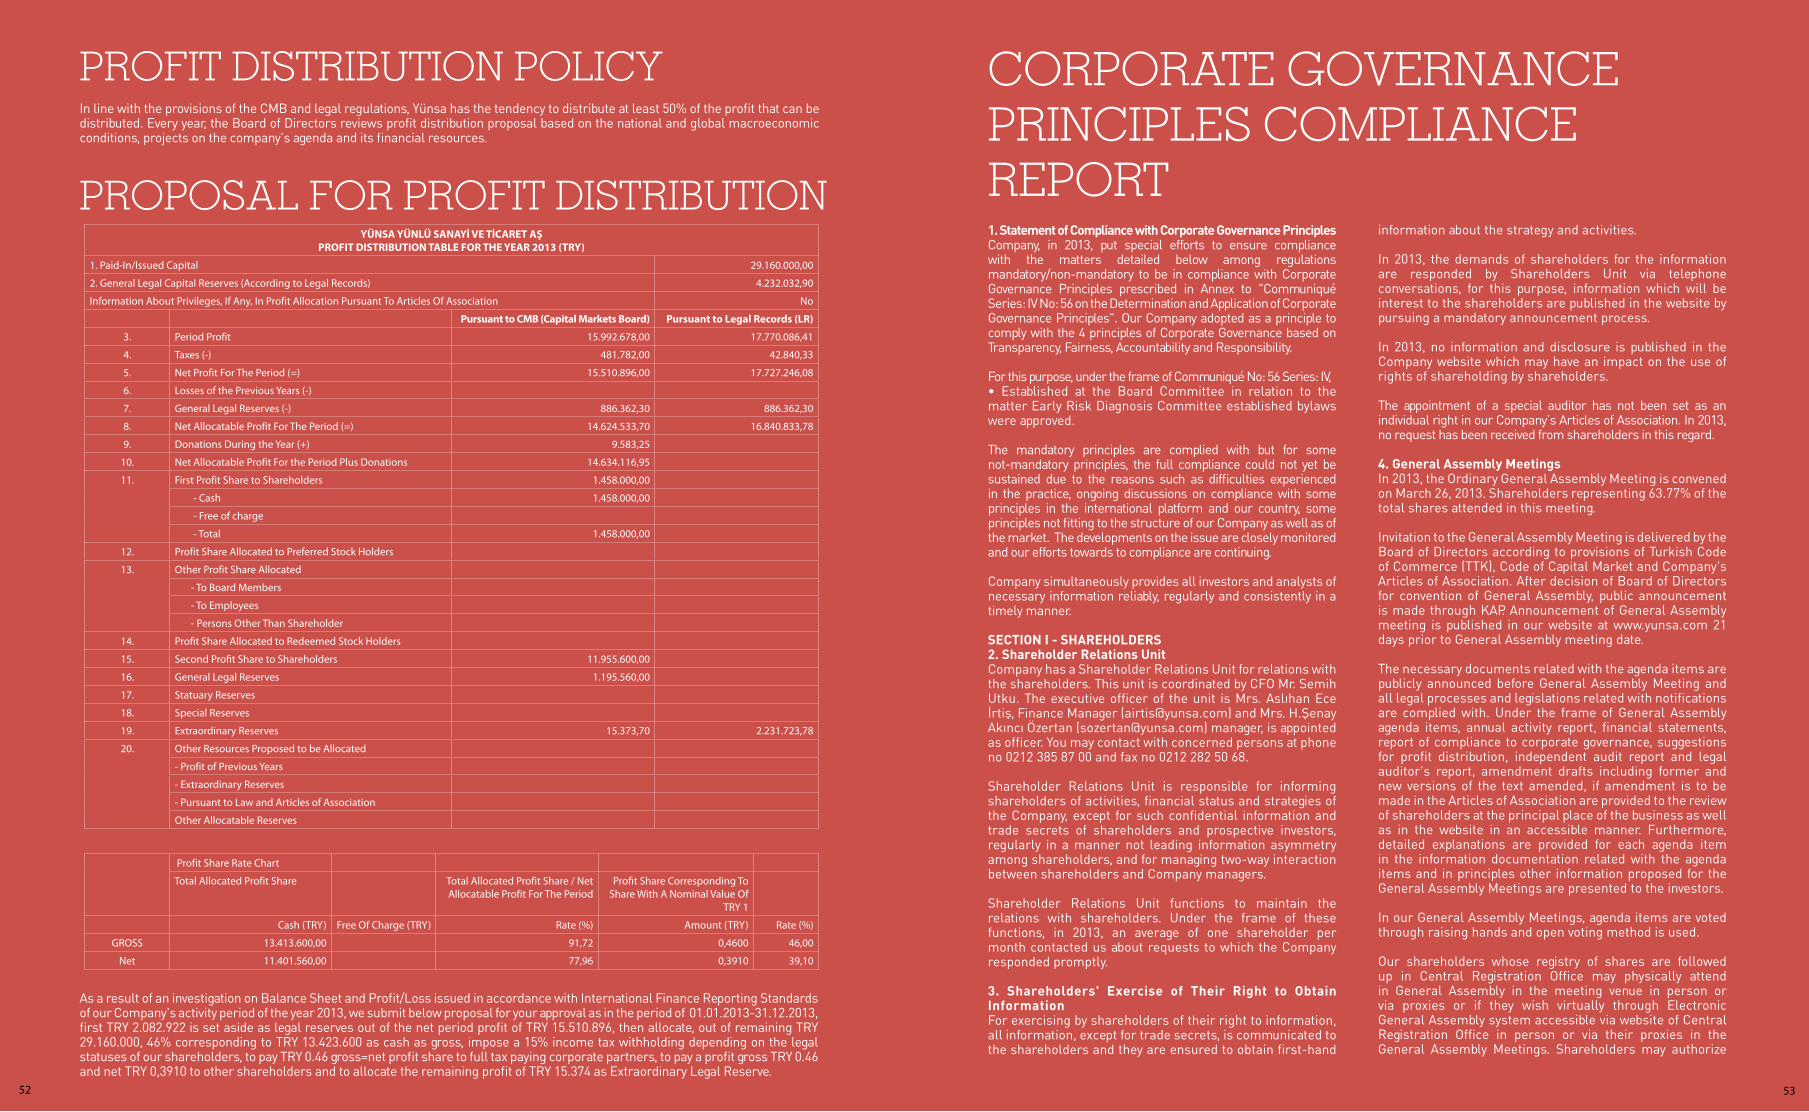
As a result of an investigation on Balance Sheet and Profit/Loss issued in accordance with International Finance Reporting Standards of our Company's activity period of the year 2013, we submit below proposal for your approval as in the period of 01.01.2013-31.12.2013, first TRY 2.082.922 is set aside as legal reserves out of the net period profit of TRY 15.510.896, then allocate, out of remaining TRY 29.160.000, 46% corresponding to TRY 13.423.600 as cash as gross, impose a 15% income tax withholding depending on the legal statuses of our shareholders, to pay TRY 0.46 gross=net profit share to full tax paying corporate partners, to pay a profit gross TRY 0.46 and net TRY 0,3910 to other shareholders and to allocate the remaining profit of TRY 15.374 as Extraordinary Legal Reserve.
In line with the provisions of the CMB and legal regulations, Yünsa has the tendency to distribute at least 50% of the profit that can be distributed. Every year, the Board of Directors reviews profit distribution proposal based on the national and global macroeconomic conditions, projects on the company's agenda and its financial resources.
PROFIT DISTRIBUTION POLICY
PROPOSAL FOR PROFIT DISTRIBUTION YÜNSA YÜNLÜ SANAYİ VE TİCARET AŞ
PROFIT DISTRIBUTION TABLE FOR THE YEAR 2013 (TRY)
1. Paid-In/Issued Capital 29.160.000,00
2. General Legal Capital Reserves (According to Legal Records) 4.232.032,90
Information About Privileges, If Any, In Profit Allocation Pursuant To Articles Of Association No
Pursuant to CMB (Capital Markets Board) Pursuant to Legal Records (LR)
3. Period Profit 15.992.678,00 17.770.086,41
4. Taxes (-) 481.782,00 42.840,33
5. Net Profit For The Period (=) 15.510.896,00 17.727.246,08
6. Losses of the Previous Years (-)
7. General Legal Reserves (-) 886.362,30 886.362,30
8. Net Allocatable Profit For The Period (=) 14.624.533,70 16.840.833,78
9. Donations During the Year (+) 9.583,25
10. Net Allocatable Profit For the Period Plus Donations 14.634.116,95
11. First Profit Share to Shareholders 1.458.000,00
- Cash 1.458.000,00
- Free of charge
- Total 1.458.000,00
12. Profit Share Allocated to Preferred Stock Holders
13. Other Profit Share Allocated
- To Board Members
- To Employees
- Persons Other Than Shareholder
14. Profit Share Allocated to Redeemed Stock Holders
15. Second Profit Share to Shareholders 11.955.600,00
16. General Legal Reserves 1.195.560,00
17. Statuary Reserves
18. Special Reserves
19. Extraordinary Reserves 15.373,70 2.231.723,78
20. Other Resources Proposed to be Allocated
- Profit of Previous Years
- Extraordinary Reserves
- Pursuant to Law and Articles of Association
Other Allocatable Reserves
Profit Share Rate Chart
Total Allocated Profit Share Total Allocated Profit Share / Net Allocatable Profit For The Period
Profit Share Corresponding To Share With A Nominal Value Of
TRY 1
Cash (TRY) Free Of Charge (TRY) Rate (%) Amount (TRY) Rate (%)
GROSS 13.413.600,00 91,72 0,4600 46,00
Net 11.401.560,00 77,96 0,3910 39,10
CORPORATE GOVERNANCE PRINCIPLES COMPLIANCE REPORT 1. Statement of Compliance with Corporate Governance Principles Company, in 2013, put special efforts to ensure compliance with the matters detailed below among regulations mandatory/non-mandatory to be in compliance with Corporate Governance Principles prescribed in Annex to "Communiqué Series: IV No: 56 on the Determination and Application of Corporate Governance Principles". Our Company adopted as a principle to comply with the 4 principles of Corporate Governance based on Transparency, Fairness, Accountability and Responsibility.
For this purpose, under the frame of Communiqué No: 56 Series: IV, • Established at the Board Committee in relation to the matter Early Risk Diagnosis Committee established bylaws were approved.
The mandatory principles are complied with but for some not-mandatory principles, the full compliance could not yet be sustained due to the reasons such as difficulties experienced in the practice, ongoing discussions on compliance with some principles in the international platform and our country, some principles not fitting to the structure of our Company as well as of the market. The developments on the issue are closely monitored and our efforts towards to compliance are continuing.
Company simultaneously provides all investors and analysts of necessary information reliably, regularly and consistently in a timely manner.
SECTION I - SHAREHOLDERS 2. Shareholder Relations Unit Company has a Shareholder Relations Unit for relations with the shareholders. This unit is coordinated by CFO Mr. Semih Utku. The executive officer of the unit is Mrs. Aslıhan Ece İrtiş, Finance Manager ([email protected]) and Mrs. H.Şenay Akıncı Özertan ([email protected]) manager, is appointed as officer. You may contact with concerned persons at phone no 0212 385 87 00 and fax no 0212 282 50 68.
Shareholder Relations Unit is responsible for informing shareholders of activities, financial status and strategies of the Company, except for such confidential information and trade secrets of shareholders and prospective investors, regularly in a manner not leading information asymmetry among shareholders, and for managing two-way interaction between shareholders and Company managers.
Shareholder Relations Unit functions to maintain the relations with shareholders. Under the frame of these functions, in 2013, an average of one shareholder per month contacted us about requests to which the Company responded promptly.
3. Shareholders' Exercise of Their Right to Obtain Information For exercising by shareholders of their right to information, all information, except for trade secrets, is communicated to the shareholders and they are ensured to obtain first-hand
information about the strategy and activities. In 2013, the demands of shareholders for the information are responded by Shareholders Unit via telephone conversations, for this purpose, information which will be interest to the shareholders are published in the website by pursuing a mandatory announcement process.
In 2013, no information and disclosure is published in the Company website which may have an impact on the use of rights of shareholding by shareholders.
The appointment of a special auditor has not been set as an individual right in our Company’s Articles of Association. In 2013, no request has been received from shareholders in this regard.
4. General Assembly MeetingsIn 2013, the Ordinary General Assembly Meeting is convened on March 26, 2013. Shareholders representing 63.77% of the total shares attended in this meeting.
Invitation to the General Assembly Meeting is delivered by the Board of Directors according to provisions of Turkish Code of Commerce (TTK), Code of Capital Market and Company's Articles of Association. After decision of Board of Directors for convention of General Assembly, public announcement is made through KAP. Announcement of General Assembly meeting is published in our website at www.yunsa.com 21 days prior to General Assembly meeting date.
The necessary documents related with the agenda items are publicly announced before General Assembly Meeting and all legal processes and legislations related with notifications are complied with. Under the frame of General Assembly agenda items, annual activity report, financial statements, report of compliance to corporate governance, suggestions for profit distribution, independent audit report and legal auditor's report, amendment drafts including former and new versions of the text amended, if amendment is to be made in the Articles of Association are provided to the review of shareholders at the principal place of the business as well as in the website in an accessible manner. Furthermore, detailed explanations are provided for each agenda item in the information documentation related with the agenda items and in principles other information proposed for the General Assembly Meetings are presented to the investors.
In our General Assembly Meetings, agenda items are voted through raising hands and open voting method is used.
Our shareholders whose registry of shares are followed up in Central Registration Office may physically attend in General Assembly in the meeting venue in person or via proxies or if they wish virtually through Electronic General Assembly system accessible via website of Central Registration Office in person or via their proxies in the General Assembly Meetings. Shareholders may authorize
5352
their proxies through Electronic General Assembly System or with a notarized power of attorney, or power of attorneys annexed with signatory circulars attested by a notary public. Shareholders may authorize their proxies through Electronic General Assembly System as well as may have themselves represented in the meeting with the power of attorney form, available in our Company head quarters and via Company website at www.yunsa.com, completed, signed and notarized or with the aforementioned power of attorney form accompanied with their signatory circulars attested by a notary public.
General Assembly Meeting to be convened physically may be attended by real person shareholders upon presentation of their ID Cards, by legal person shareholders upon ID cards of persons authorized to represent and bind the legal person together with their authorization documents, by proxies of real and legal persons upon their power of attorneys, by proxies who are authorized through Electronic General Assembly System upon their ID cards and signing the attendees list.
Our General Assembly Meetings are convened in the principal place of business. Our Articles of Association, when necessary, allows for meetings to be convened in other places within the provincial territory where head quarter is located or in the place where industrial plant of the Company is located upon the decision of Board of Directors.
Our meeting minutes are available via our website at www.yunsa.com and via www.kap.gov.tr and at Electronic General Assembly System page in Central Registration Agency. Furthermore, these minutes are available for review of our shareholders in the head quarter and provided upon request.
Information about donations and aids provided during the period are presented in a separate item of agenda in the General Assembly.
5. Voting Rights and Minority Rights Articles of Association does not envisage privileged voting rights.
Our Company places importance on the exercise of minority rights in accordance with provisions of Turkish Code of Commerce and Code of Capital Market and no criticism or complaint received in this regard in 2013.
6. Profit Share Right The Profit Distribution Policy of our Company is as follows:
Company every year distributes at least 50% of profits that can be distributable as profit in cash to the shareholders in accordance with Capital Market Legislations and other regulations. This Policy is reviewed every year by Board of Directors based on the national and global economic conditions, projects on the Company's agenda and its financial resources.
A Report of 2013 contained a separate section on the proposal for profit distribution which was communicated to shareholders and publicly announced in the Company's website before the General Assembly.
During 2013, Company distributed dividends at an amount of TRY 6.531.840. Company distributes the profits within the period as prescribed by the law. Company does not prescribe privileges in participation in profit distribution pursuant to
provisions of Company's Articles of Association. 7. Transfer of SharesCompany's Articles of Association does not prescribe any provision which restricts the transfer of the shares.
SECTION II - PUBLIC DISCLOSURE AND TRANSPARENCY 8. Information Disclosure Policy Company has a Disclosure Policy in place as prescribed by CMB's Corporate Governance Principles. The relevant policy is publicly disclosed via Company's website and KAP. Disclosure Policy prescribes which information will publicly be disclosed through which means and at what frequency and by whom. The announcement of the reports issued in line with International Financial Reporting Standards was made within the periods prescribed by Capital Market Board. In this line, Company publicly announces regularly via website of our Company and Public Information Platform, independently audited semi-annual and year-end consolidated reports prepared in line with International Financial Reporting Standards (IFRS) as well as non-audited 1st quarter and 3rd quarter consolidated reports and particular situations which must be publicly disclosed pursuant to CMB legislation and within periods as stipulated by CMB.
Vice General Manager- Financial Affairs is responsible for the implementation of the Disclosure Policy.
Financial Affairs, Vice General Manager is responsible for the announcement in special cases of the Company. In 2013, 15 different special case announcements were made and since announcement was within its legal period, no sanctions were enforced.
Information to be publicly disclosed are announced in KAP and our Company's website in timely, correctly, completely, comprehensible, interpretable and easily accessible manner.
On the other hand, a "list of persons who can access to internal information" is prepared to ensure that necessary care is exercised on the rules concerning use of the internal information and the staff appearing on the list signed and delivered a statement that they are aware of their obligations to protect and not to abuse such information, and care is being exercised on obtaining statements of each new persons included in the list.
9. Company's Website and Its Contents Company has a corporate website in place. Its URL address is www.yunsa.com. Important information published in the website is also published in English.
In order to ensure comprehensive information relay to current and prospective investors as well as intermediaries, website contains a separate section as "Investor Relations" and "Information Society Services" section.
With the Regulation on Websites to be published by the Capital Companies published at 31.05.2013 on Official Gazette issued by Ministry of Customs and Commerce as well as the first sub-article of Article 1524 of TCC, procedures and principles concerning the website publication as well as allocating a section to the publication of the announcements which must legally be made by Company as well as information society services. E-Company provided by MKK: ensured that uploading the content to be announced pursuant to Article
1524 of TCC by making use of the companies information portal platform service to the company-exclusive pages with secure electronic signature and time stamp and keeping the content upload in secure environment and keeping the content accessible and archiving in a secure manner.
Information prescribed by CMB's Corporate Governance Principles is published in the website. The rules concerning the administration of the website are provided in our "Disclosure Policy".
Some of the headings published in the website are as follows:
• Details about corporate identity • Vision and mission • Information about Members of Board of Directors and Top Level Management • Company's shareholding composition• CMB Special Case Announcements • Company's Articles of Association • Commercial registry information• Financial information • Meeting date, agenda, explanations about items of agenda of General Meeting • General Assembly meeting minute and list of attendees • Corporate Governance applications and harmonization report • Profit distribution policy • Information disclosure policy
10. Annual Report Company annual report is prepared in accordance with legal arrangements to ensure public informed of company activities completely, accurately in a timely manner.
SECTION III - STAKEHOLDERS 11. Informing Stakeholders Stakeholders are informed of Company-related facts through public disclosures made under the relevant legislation. Public disclosures are made by means of either press conferences or speeches through media. Detailed information disclosures in our General Assembly meetings as well as in our website, our comprehensive annual report, our press statements, our transparent disclosure policy and applications, furthermore, informs not only our shareholders but also all stakeholders.
Company's employees are also informed through meetings held on their specialization areas and on other related fields and through seminars and training programs as well as through information sent via e-mail. There is a portal for employees, which enables them to have access to any kind of required information and document.
Stakeholders may submit the transactions in violation of legislation and Company's Ethics Rules to Head of Audit Department and Head of Ethics which will forward it to the Audit Committee via e-mail at [email protected] published in the company's website.
12. Participation of Stakeholders in Management The employees participate in management through periodic company meetings (at least two times annually) such as the annual target setting and performance evaluation, quality, environmental, job security, self-evaluation, communication, improvement and excellence meetings as well as various project groups and questionnaires for business life evaluation. Thanks to feedback mechanism, employees provide their feedbacks to management and
their colleagues and the results are discussed in various management meetings and accordingly actions plans are devised for necessary changes. Participation of shareholders in management is ensured through General Assembly meetings, periodical supplier meetings, questionnaires and participation of customers is through regular customer meetings and visits. With these approaches, they are driven to participate in and contribute to effective management of the Company.
13. Human Resources Policy Our Company's Human Resource is provided below and published in the website at, www.yunsa.com. Human Resources activities are coordinated by HR Manager Mr. Tamer Tok and it includes recruitment and qualified workforce attraction, performance management, career and succession management, personal and organizational development, salary-reward and fringe benefits management, labor relations-legislation, health-safety and work-environment, general services management processes.
Our Human Resources Policy
Aware of the fact that its most important asset to succeed in the changing future is its human resources, the Company has the objective of maintaining a working environment where:
• An environment where employees are proud of being in, they demonstrate their creativity and suggestions and expectations are taken into account, • There is an environment based on mutual trust and open communication, where ethical values are appreciated.• The employees are proud to be a part of the company, • The employees can manifest their creativity,• There is an environment based on mutual trust and open communication, successes are appreciated, and Individuals take responsibility to reach common objectives.
For these purposes;• In order to ensure the continuity of Company success, we constantly review our organization, human resources, system and processes and structure them in line with our needs. • We select and employ the human resource which will lead our Company to the future with equal opportunity principle among the people who have our Company values, has high development potential, flexible and positively contributes in changes. • We create development environment and opportunity for our employees to realize their continuous development and capabilities. • We monitor the performance with fair, systematized, understandable and measurable performance systems where our employees understand individual contributions in Company targets and our managers undertake the development responsibility. • We award the contribution, success and performance of our employees in line with the value they contribute in our organization. • We develop applications in order to create and widespread a culture which increases the employee motivation and commitment, participatory, transparent, accountable, valuing difference and creativity.
Job descriptions, performance management process and reward criteria for the Company employees are defined and announced to all employees. Said documents are accessible via electronic document system.
5554
The employees have not filed any complaints about discrimination in or before 2013.
14. Ethical Rules and Social Responsibility Company executes its activities under the frame of SA Ethical Rules created by Sabancı Group. Business Ethics are publicly disclosed and published on the Company's website. Employees are informed of rules via publication in the company's intranet portal, circulation of printed manuals to all employees as well as information courses on the issue. Furthermore, every year-end, employees update their knowledge about rules of business ethics via e-learning program and renew their commitment to rules business ethics by completing a "Business Ethics Compatibility Declaration".
In addition to its valuable contributions in the national economy as well as its extensive employment opportunities, Yünsa is also an environmentally-conscious brand, the most precious value of the earth. Company, on all occasions, shows his respect to the nature with the standards implemented and projects which save natural resources.
Yünsa continued to demonstrate his consciousness about Climate Change in 2013 and publicly disclosed his greenhouse gas emissions through Carbon Disclosure Project (CDP). As a first in the textile industry, Yünsa continued to report in 2013 and listed among 3 companies in Turkey which voluntarily disclosed greenhouse gas emissions.
Yünsa have been applying ISO 14001 Environmental Management System since 2004. In this framework, Company evaluates its environmental impacts and takes measures to minimize or eliminate these impacts.
In 2012, Yünsa devised the Clean Manufacturing Plan and commenced the operations under this plan. Under this scope, the best manufacturing methods are identified and applied, which will minimize damages on the environment. In this regard, R&D project is initiated to recycle the waste water into the production after its treatment and related works continue.
Eko-Text® Standard 100 is a worldwide standardized test and certification system addressed to all raw materials, derivate and final products across all stages of textile processing. Yünsa intends to supply healthy products and for this purpose, renewed his Eko-Tex® 100 certificate in 2013. No prohibited chemical is used in the production processes and we closely monitor our suppliers in this regard in a close collaboration with them.
All manufacturing wastes are classified and delivered to the licensed disposal/recycling companies.
Dust and gas emission measurements for factory chimneys are regularly checked by accredited institutions and reported to the Ministry of Environment and Urban Planning.
Our plant treats its waste waters in order to prevent the pollution of above- and underground waters. Also rain-water and reusable effluent is collected to be used for the irrigation of Greenfield sites of our plant.
As an indication of the Company’s respect to nature and social responsibility awareness, Yünsa planted saplings in Istanbul-Edirne highway Çerkezköy junction and in Çerkezköy-Saray highway Büyükçavuşlu location under reforestation projects to contribute to a better future.
Planting, watering and maintenance works of all forest area are carried out by Yünsa by the corporate volunteerism.
As part of his social responsibility, dividend contributions made to Hacı Ömer Sabancı Foundation and donations to schools, health centers, foundations and associations in Çerkezköy where our plant is, offering internship positions to approximately 60 students every year and hiring disabled individuals or ex-convicts are examples of social responsibility activities.
At Yünsa, periodic trainings are given to employees at all levels in order to increase environmental awareness, support environmental management and turn environmental management into a form of doing business. Within social responsibility dimension of environmental awareness, trainings are given to employees in 2013.
Every year, in audits made on waste treatment plants, evaluations are made in respect of quality standards and environmental legislation and accordingly areas to improve are determined and measurements are taken which will ensure them to take actions against their shortcomings. These firms are provided with the trainings on environment and workplace safety and these trainings are audited as well as we contribute in their developments on these subjects.
All work safety and environment activities are monitored through monthly review meetings with participation of top management and necessary investments are planned and applied.
SECTION IV- BOARD OF DIRECTORS 15. The Structure and Composition of the Board of DirectorsCompany's Board of Directors observes the compliance of Company's activities with legislation, Articles of Association, internal regulations and policies adopted and represents and manages the Company with his strategic decisions by considering the risk, growth and returns of the Company as well as observing our long-term interests.
Composition of our Board of Directors complies with the principles prescribed by the Capital Market Board. Chairman and General Manager Positions are assigned to different persons. Members of the Board of Directors are as follows with the distinction of executive and non-executive as well as independent member.
Mehmet Nurettin PEKARUNChairman – (Executive) (26 March 2013 – March 2015)Mehmet Pekarun received his Industrial Engineering degree from Boğaziçi University, and later obtained his MBA, with Finance and Strategy Specialization, from Purdue University. Mr. Pekarun started his career in 1993, at General Electric’s (GE) Transportation Systems division in the USA. Between 1996 and 1999, he worked as a Finance Manager responsible for Turkey, Greece, and Eastern Europe at GE’s Healthcare division in Europe. Between 1999 and 2000, he worked as the General Manager of GE Lighting Turkey. Between 2000 and 2005, he moved to GE Healthcare’s Europe, Middle East, and Africa headquarter, first working as General Manager, Business Development, and then as General Manager, Medical Accessories. Mr. Pekarun was appointed as the Chief Executive Officer of Kordsa Global on March 1, 2006, and as the President of Sabancı Holding’s Tire, Reinforcement Materials, and Automotive Strategic Business Unit on 20 September 2010. Tire, Reinforcement Materials, and
Automotive Strategic Business Unit was restructured as of March 1, 2011 and he is currently the President of Industry Strategic Business Unit.
Mehmet GÖÇMENVice Chairman of the Board of Directors – (Executive)(26 March 2013 – March 2015)Born in 1957, Mehmet Göçmen completed his post graduate degree in Industrial Engineering and Operational Research at Syracuse University in the USA after completing his BA Degree at METU Industrial Engineering and his High School education at Galatasaray High School. He began his professional career at Çelik Halat ve Tel San. AŞ in 1983. Mr. Göçmen later worked as General Manager at Lafarge Ekmel Beton AŞ and Business Development and Public Affairs Vice Chairman position at Lafarge Turkey between 1996 and 2002. Between June 2003 and July 2008, Mr. Göçmen served as General Manager at Akçansa and he was appointed as Executive Vice President of Human Resources of Sabancı Holding on August 1, 2008. In addition Mr. Göçmen has been appointed as The President of Cement Strategic Business Unit as of July 20, 2009. In 2010, he resigned from Executive Vice President of Human Resources position and he is currently the President of Cement Strategic Business Unit.
Mevlüt AYDEMİRBoard Member – (Non-executive)(26 March 2013 – March 2015)Born in 1948 in Erzincan, Mevlüt Aydemir graduated from İstanbul University, Faculty of Economics. He worked for the Ministry of Finance as a Public Accountant between 1972 and 1981. He has carried out various functions at Sabancı Holding since 1981, and served as a member of board of directors in the group companies. He has been a member of the Board of Directors of Sabancı Holding since May 2010.
Barış ORAN Board Member – (Non-executive)(26 March 2013 – March 2015)Graduated from Boğaziçi University Business Administration Department, Barış Oran has a MBA degree in University of Georgia. Began his career as an auditor in Price Waterhouse Coopers in 1995, Oran carried out functions in first audit and finance and treasury/capital markets in Sara Lee Corp. Chicago IL between the years 1998 and 2003. Between 2003 and 2006, he served as Senior Manager at Ernst and Young responsible for first Minneapolis, MN, then in Europe, Middle East, Africa and India Regions. In 2006, he began his career in Kordsa Global and served as Internal Control Director, Global Finance Director and CFO, respectively. In 2011, appointed as H.Ö. Sabancı Holding Finance Director, since 2012, Oran has been the Head of H.Ö. Sabancı Holding Planning, Reporting and Financing Department, Members of Brisa, Enerjisa Production, Teknosa and Temsa Board of Directors.
Hüsnü PAÇACIOĞLUBoard Member – (Independent)(18 April 2012 – March 2015)Hüsnü Paçacıoğlu earned his BSC in Industry Management from Middle East Technical University (Ankara, Turkey) in 1963. Between 1964-1968 he served as the Investment Specialist in Karabük Iron and Steel Works Enterprises and as Public Relations and Ankara Region Manager, Public Sector Sales Director, Professional and Technical Services Manager and Deputy General Manager in charge of Marketing, Sales, Products and Services (in chronological order) at IBM Turk between 1968-1996.
Mr. Hüsnü Paçacıoğlu took over the position of General Secretary in Sabancı University in 1996 and held this position until 2005. Between 2006 and 2011, he served as Vice President of Board of Trustees and General Manager of the Hacı Ömer Sabancı Foundation (Sabancı Foundation). He is currently members of Sabancı Foundation Board of Trustee and Executive Board since July 1, 2011, except his General Manager duty.
Paçacıoğlu is the founding member of Safranbolu Culture and Tourism Foundation, Hisar Education Foundation and member of Board of Trustees of Spastic Children Foundation of Turkey (TSÇV) and Chairman and CEO of TSÇV and member of Information Foundation of Turkey.
Mehmet KAHYABoard Member – (Independent)(18 April 2012 – March 2015)Received his double major BS, with Cum Laude in Chemical Engineering and Economics from Yale University Mehmet Kahya has MBA on Finance, Marketing and Operations Research, with honor, from Kellogg Graduate School of Management.
Began his career as Sasa Management Services Chief in Sabancı Holding, Mehmet Kahya founded and presided MKM Inernational (Netherland) and Sibernetik Systems. Again joined as Vice President of Automotive Group, Mehmet Kahya served as Temsa Vice President and President, Toyotosa Vice President as well as Member of Sabancı Holding Planning and Direction Council and Board Members of Temsa Toyotasa, Susa and Sapeksa.
Mehmet Kahya served as Managing Member and Vice Chairman of CarnaudMetalbox and then President of Uzel Machinery and Executive Board Member of Uzel Holding, Vice President of DYO General Directorate and Paint Group, Member of Executive Board of Sarten Packaging, Vice Chairman of Gierlings Velpor and President of Assan Aluminuim.
He is currently providing services in the fields of strategies, restructuring, profitability cycle, growth, acquisition and merger projects in the KRONUS Company founded by him as well as serves as independent member of Board of Members of Yaşar Holding, Altınyunus, DYO, Viking Kağıt, Çimsa, Sasa, Yünsa and as consultant in Board of Directors and Executive Boards of Farplas Group.
Fahreddin Cem ÇELİKOĞLUGeneral Manager- (Executive) Born in 1962, Cem Çelikoğlu graduated from METU Faculty of Administrative Sciences, Department of International Relations. He has been working in our Company since 17.12.1987 and appointed as General Manager of the Company on 01.12.2002.
The members of the Board of Directors have been permitted by the General Assembly to carry out all transactions set out by the Articles 395 and 396 of the Turkish Commercial Code.
Board Members are elected for 3 years by General Assembly on April 18, 2012.
With the report dated March 22, 2012 prepared and submitted by Audit Committee to Board of Directors, two independent members were nominated and their statements on fulfillment of the independency criteria were received and provided.
5756
The duties of the Internal Audit Unit are to check the reliability and accuracy of financial statements of the Company as well as affiliates, to ensure that operations are performed in compliance with laws and ethical rules adopted by the Company, to furnish assurances to minimize the current and potential risks to the reasonable levels by having them identified upon analyzing the processes with a view to increase the operational effectiveness and productivity and control whether the activities in the business is carried out in accordance with the predefined standards, policies and targets.
19. Company's Strategic Objectives The company’s mission and vision were determined by the Board of Directors, and disclosed to the public on its website, www.yunsa.com.
Board of Directors sets the strategic objectives for three years in consultation with Top Management. It approves the annual budgets prepared under the frame of these strategic objectives.
Board of Directors has exact knowledge about the implementation of the decisions taken through comparative presentations delivered by Top Management in the meetings. The presentations also communicate Board of Directors a comparison of same periods of past years in addition to budgeted and actual comparison of the current year.
20. Financial Rights Form and conditions of any kind of rights, benefits and remunerations of the Members of Board of Directors are defined in the Articles of Association. General Assembly determines the remunerations and fees of the Chairman and Board Members.
The payments made to the top managers are disclosed to the public in our footnotes of Financial Statements.
The remuneration of independent board members does not make use of payment plans based on share stock options or Company performance.
In 2013, Company has not lent money to any Board Member, and has not provided credit to them, and has not prolonged the terms of existing loans and credits, and has not improved borrowing conditions, and has not extended credit under the name of personal credit means through a third person or has not provided warranties such as guarantee in their favour.
16. The Operating Principles of the Board of DirectorsBoard of Directors meets when the Company’s business and transactions necessitate it and executes its activities in a transparent, fair, accountable and responsible manner and in doing so, observes the long-term interests of the Company.
In 2013, the Company’s Board of Directors held a total of 21 meetings; 4 of these were held after obtaining one-on-one approvals and 17 after obtaining written approvals according to the provisions of the Turkish Commercial Code and the Articles of Association. Operation principles of Board of Directors, meeting and decision quorums are executed on the basis of provisions of Company's Articles of Association. Every member has a one voting right in meetings of Board of Directors. The agenda of the meetings of Board of Directors are determined as a result of consultations among Chairman, current Board Members and General Manager. The duties of the Secretariat are carried out by the Office of the Deputy General Manager for Financial Affairs. The Secretariat is responsible for information sharing and communication about meeting agendas and for preparing the meeting minutes.
In 2013, there were no dissenting opinions concerning the decisions taken by the members of the Board of Directors.
17. The Number, Structure and Independence of the Committees Established by the Board of DirectorsBoard of Directors makes use of the committee works while executing his duties and responsibilities. The decisions held by committees as a result of their works are submitted as suggestions to Board of Directors and final decision is given by Board of Directors.
In Board of Directors, Audit Committee, Corporate Management Committee and Early Risk Diagnosis Committee are established.
Committees;
Corporate Governance Committee monitors the compliance of Company with Corporate Governance Principles, gives remedial suggestions and observes the operations of Shareholder Relations Unit. Corporate Governance Committee, also, executes the functions of "Nomination Committee" and "Remuneration Committee".
The Head of Corporate Governance Committee is Hüsnü Paçacıoğlu (Independent Board Member) and member is Barış Oran. Corporate Governance Committee is met for 4 times during the year and discussed the issues such as monitoring the corporate governance principles, earlier risk diagnosis and human resources.
Head of Audit Committee is Mehmet Kahya and member is Hüsnü Paçacıoğlu, who are also Independent Board Members. Audit Committee executes the duties envisaged by CMB legislations for the audit committee and held 4 meetings during the year. It audits company's accounting system, public disclosure of financial data, independent audit and the operation and effectiveness of internal control system of the Company.
With the Resolution No 953 Dated July 4th, 2013 of Board of Directors of our Company, it is resolved on establishing Early Risk Diagnosis Committee and its removal from Corporate Management Committee and approval of the by-law of Early Risk Diagnosis under the Article 4.5 Committees in
the Board of Directors of Communique on Determination and Application of Corporate Management Principles Series: IV No: 56 of Capital Market Board. In order to chair this committee, Independent Board Member Hüsnü Paçacıoğlu and Barış Oran is assigned as member. 2 meetings are held after the establishment date in 2013.
Early Risk Diagnosis Committee carries out works in order to define the risks which may jeopardize the presence, development and continuity of the Company, to create the models and management systems for avoiding the crisis, to implement the necessary measurements related with early diagnosis, identification, risks and manage the risk and risk management systems are reviewed at least once a year. 18. Risk Management and Internal Control MechanismOur Company implements a company-wide Corporate Risk Management with the understanding that risks also involve opportunities in order to manage the risks in the most effective manner. Yünsa Corporate Risk Management is a planned, adaptable, consistent and ongoing process structured in the Company in order to identify and decide the measurements and strategies against, by defining, the factors creating threat and opportunity in achievement of company targets.
Company risks are followed up through main risk indicators as specified by the Holding and Company. These indicators are continuously monitored and reported periodically. The necessary actions for managing the risks as indicated by the main risk indicators are taken by the Company under the coordination of Sabancı Holding.
Company devised the Risk Management Policy which defines the risk management understanding, strategies, methods and approaches and role and responsibilities as well as creates a common language across the Company. Under this policy, to identify measure and manage the risks better, a Risk Management Unit is established in the company.
Risk Management Unit, within the framework of policies, standards and procedures approved by Company Management, determines main and critical risks of the company, works with risk managers to make recommendations in order to reduce, eliminate or transfer the risks involved, follows action plans of departments, realizes studies to determine the Company's risk appetite and follows whether risks are managed within the framework of this appetite. Risk management unit continues these activities with full support, responsibility and active participation of the company's employees.
By placing importance on the risk management, Yünsa constantly continued to create value for shareholders in 2013 and demonstrated a performance of sustainable growth.
Company houses an Internal Audit Unit for conducting audits, investigations and examinations in order to safeguard the rights and interests of the Company, to develop suggestions against internal and external risks.
Company Internal Audit Unit reports directly periodically the Audit Committee composed of Independent Board Members under the Company organization due to its independency principle and performs the duties assigned to them by Board of Directors under the current Audit Committee By-Law. Internal audit mechanism is under the responsibility of top management and reviewed regularly by Internal Audit Unit of the Company.
5958
YÜNSA YÜNLÜ SANAY‹ VE T‹CARET
ANON‹M Í‹RKET‹AND ITS
SUBSIDIARIESConsolidated Financial Statements As
of December 31, 2013 Together With Independent Auditors’ Report
6160
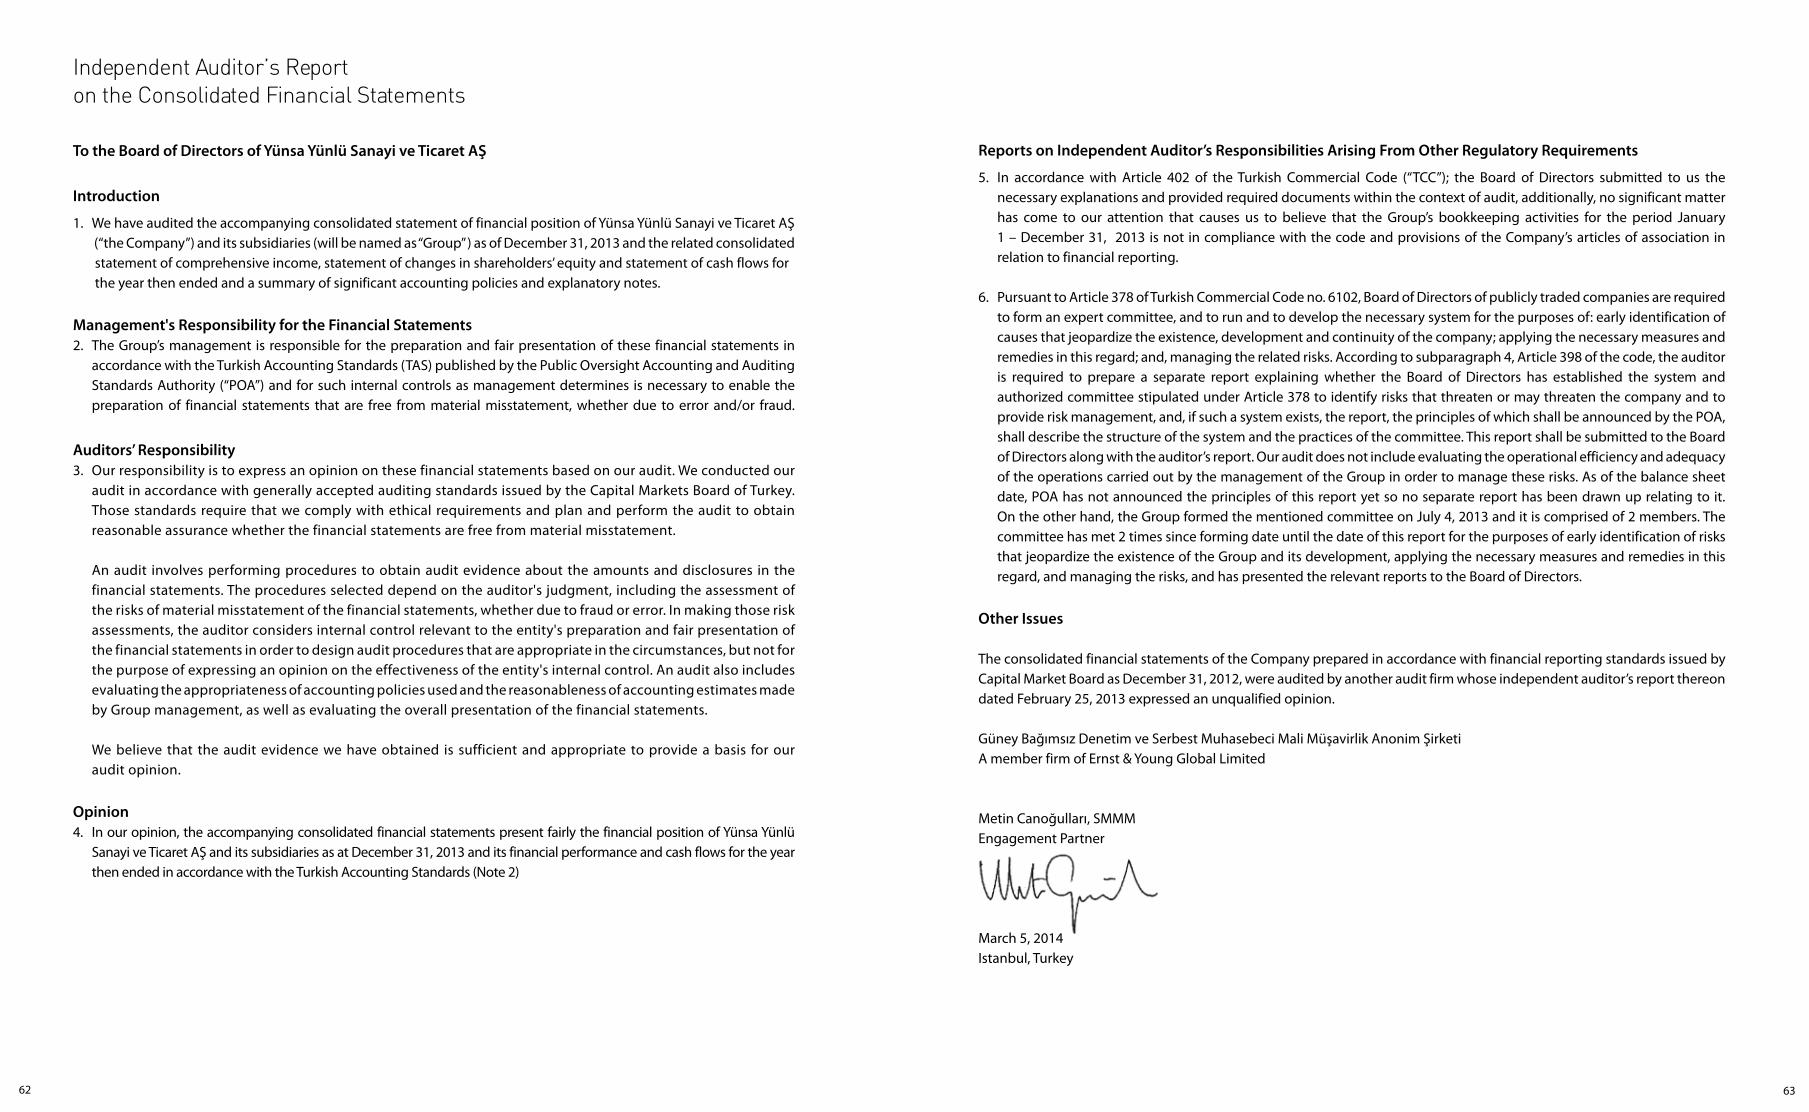
To the Board of Directors of Yünsa Yünlü Sanayi ve Ticaret AŞ
Introduction
1. We have audited the accompanying consolidated statement of financial position of Yünsa Yünlü Sanayi ve Ticaret AŞ (“the Company”) and its subsidiaries (will be named as ‘‘Group’’ ) as of December 31, 2013 and the related consolidated statement of comprehensive income, statement of changes in shareholders’ equity and statement of cash flows for the year then ended and a summary of significant accounting policies and explanatory notes.
Management's Responsibility for the Financial Statements 2. The Group’s management is responsible for the preparation and fair presentation of these financial statements in accordance with the Turkish Accounting Standards (TAS) published by the Public Oversight Accounting and Auditing Standards Authority (“POA”) and for such internal controls as management determines is necessary to enable the preparation of financial statements that are free from material misstatement, whether due to error and/or fraud.
Auditors’ Responsibility3. Our responsibility is to express an opinion on these financial statements based on our audit. We conducted our audit in accordance with generally accepted auditing standards issued by the Capital Markets Board of Turkey. Those standards require that we comply with ethical requirements and plan and perform the audit to obtain reasonable assurance whether the financial statements are free from material misstatement.
An audit involves performing procedures to obtain audit evidence about the amounts and disclosures in the financial statements. The procedures selected depend on the auditor's judgment, including the assessment of the risks of material misstatement of the financial statements, whether due to fraud or error. In making those risk assessments, the auditor considers internal control relevant to the entity's preparation and fair presentation of the financial statements in order to design audit procedures that are appropriate in the circumstances, but not for the purpose of expressing an opinion on the effectiveness of the entity's internal control. An audit also includes evaluating the appropriateness of accounting policies used and the reasonableness of accounting estimates made by Group management, as well as evaluating the overall presentation of the financial statements.
We believe that the audit evidence we have obtained is sufficient and appropriate to provide a basis for our audit opinion.
Opinion4. In our opinion, the accompanying consolidated financial statements present fairly the financial position of Yünsa Yünlü Sanayi ve Ticaret AŞ and its subsidiaries as at December 31, 2013 and its financial performance and cash flows for the year then ended in accordance with the Turkish Accounting Standards (Note 2)
Reports on Independent Auditor’s Responsibilities Arising From Other Regulatory Requirements
5. In accordance with Article 402 of the Turkish Commercial Code (“TCC”); the Board of Directors submitted to us the necessary explanations and provided required documents within the context of audit, additionally, no significant matter has come to our attention that causes us to believe that the Group’s bookkeeping activities for the period January 1 – December 31, 2013 is not in compliance with the code and provisions of the Company’s articles of association in relation to financial reporting.
6. Pursuant to Article 378 of Turkish Commercial Code no. 6102, Board of Directors of publicly traded companies are required to form an expert committee, and to run and to develop the necessary system for the purposes of: early identification of causes that jeopardize the existence, development and continuity of the company; applying the necessary measures and remedies in this regard; and, managing the related risks. According to subparagraph 4, Article 398 of the code, the auditor is required to prepare a separate report explaining whether the Board of Directors has established the system and authorized committee stipulated under Article 378 to identify risks that threaten or may threaten the company and to provide risk management, and, if such a system exists, the report, the principles of which shall be announced by the POA, shall describe the structure of the system and the practices of the committee. This report shall be submitted to the Board of Directors along with the auditor’s report. Our audit does not include evaluating the operational efficiency and adequacy of the operations carried out by the management of the Group in order to manage these risks. As of the balance sheet date, POA has not announced the principles of this report yet so no separate report has been drawn up relating to it. On the other hand, the Group formed the mentioned committee on July 4, 2013 and it is comprised of 2 members. The committee has met 2 times since forming date until the date of this report for the purposes of early identification of risks that jeopardize the existence of the Group and its development, applying the necessary measures and remedies in this regard, and managing the risks, and has presented the relevant reports to the Board of Directors.
Other Issues
The consolidated financial statements of the Company prepared in accordance with financial reporting standards issued by Capital Market Board as December 31, 2012, were audited by another audit firm whose independent auditor’s report thereon dated February 25, 2013 expressed an unqualified opinion.
Güney Bağımsız Denetim ve Serbest Muhasebeci Mali Müşavirlik Anonim ŞirketiA member firm of Ernst & Young Global Limited
Metin Canoğulları, SMMMEngagement Partner
March 5, 2014Istanbul, Turkey
Independent Auditor’s Reporton the Consolidated Financial Statements
6362
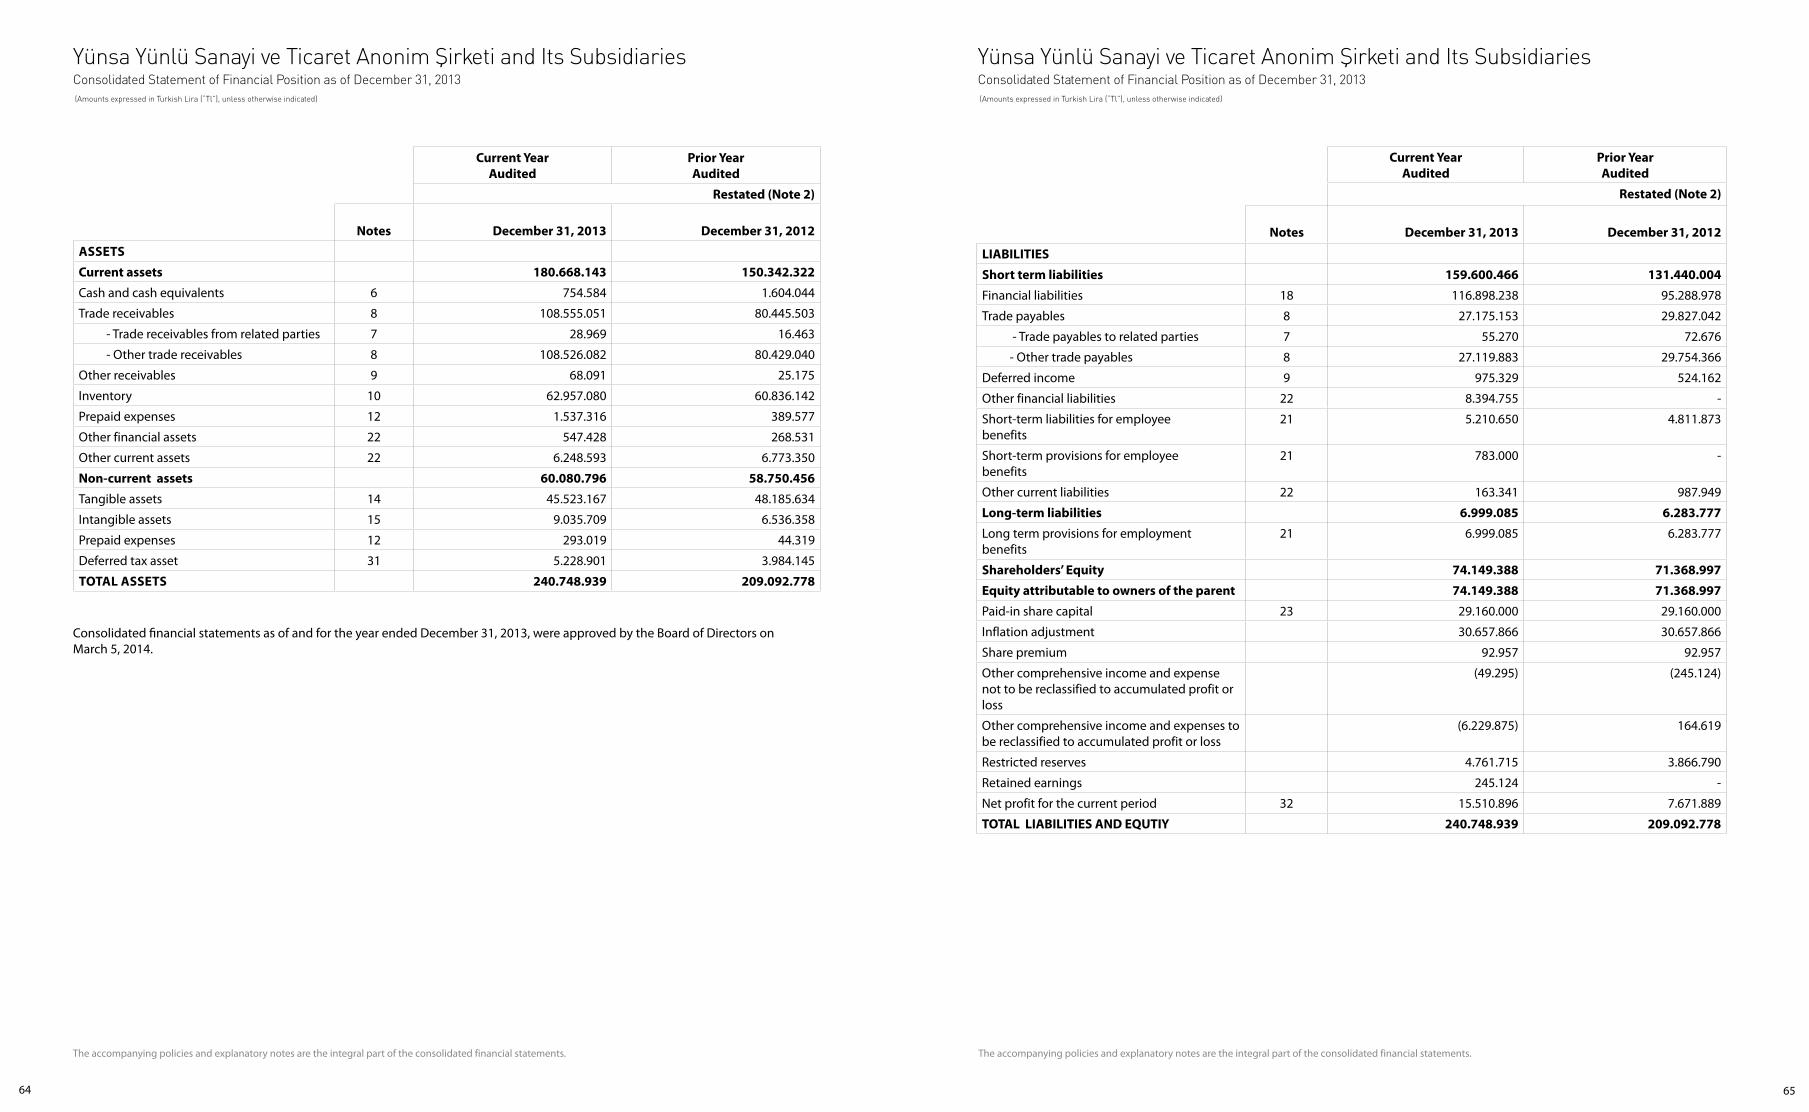
The accompanying policies and explanatory notes are the integral part of the consolidated financial statements.
Current YearAudited
Prior YearAudited
Restated (Note 2)
Notes December 31, 2013 December 31, 2012
ASSETS
Current assets 180.668.143 150.342.322
Cash and cash equivalents 6 754.584 1.604.044
Trade receivables 8 108.555.051 80.445.503
- Trade receivables from related parties 7 28.969 16.463
- Other trade receivables 8 108.526.082 80.429.040
Other receivables 9 68.091 25.175
Inventory 10 62.957.080 60.836.142
Prepaid expenses 12 1.537.316 389.577
Other financial assets 22 547.428 268.531
Other current assets 22 6.248.593 6.773.350
Non-current assets 60.080.796 58.750.456
Tangible assets 14 45.523.167 48.185.634
Intangible assets 15 9.035.709 6.536.358
Prepaid expenses 12 293.019 44.319
Deferred tax asset 31 5.228.901 3.984.145
TOTAL ASSETS 240.748.939 209.092.778
The accompanying policies and explanatory notes are the integral part of the consolidated financial statements.
Current YearAudited
Prior YearAudited
Restated (Note 2)
Notes December 31, 2013 December 31, 2012
LIABILITIES
Short term liabilities 159.600.466 131.440.004
Financial liabilities 18 116.898.238 95.288.978
Trade payables 8 27.175.153 29.827.042
- Trade payables to related parties 7 55.270 72.676
- Other trade payables 8 27.119.883 29.754.366
Deferred income 9 975.329 524.162
Other financial liabilities 22 8.394.755 -
Short-term liabilities for employeebenefits
21 5.210.650 4.811.873
Short-term provisions for employeebenefits
21 783.000 -
Other current liabilities 22 163.341 987.949
Long-term liabilities 6.999.085 6.283.777
Long term provisions for employmentbenefits
21 6.999.085 6.283.777
Shareholders’ Equity 74.149.388 71.368.997
Equity attributable to owners of the parent 74.149.388 71.368.997
Paid-in share capital 23 29.160.000 29.160.000
Inflation adjustment 30.657.866 30.657.866
Share premium 92.957 92.957
Other comprehensive income and expensenot to be reclassified to accumulated profit or loss
(49.295) (245.124)
Other comprehensive income and expenses to be reclassified to accumulated profit or loss
(6.229.875) 164.619
Restricted reserves 4.761.715 3.866.790
Retained earnings 245.124 -
Net profit for the current period 32 15.510.896 7.671.889
TOTAL LIABILITIES AND EQUTIY 240.748.939 209.092.778
Consolidated financial statements as of and for the year ended December 31, 2013, were approved by the Board of Directors onMarch 5, 2014.
Yünsa Yünlü Sanayi ve Ticaret Anonim Şirketi and Its SubsidiariesConsolidated Statement of Financial Position as of December 31, 2013 (Amounts expressed in Turkish Lira (“Tl”), unless otherwise indicated)
Yünsa Yünlü Sanayi ve Ticaret Anonim Şirketi and Its SubsidiariesConsolidated Statement of Financial Position as of December 31, 2013 (Amounts expressed in Turkish Lira (“Tl”), unless otherwise indicated)
6564
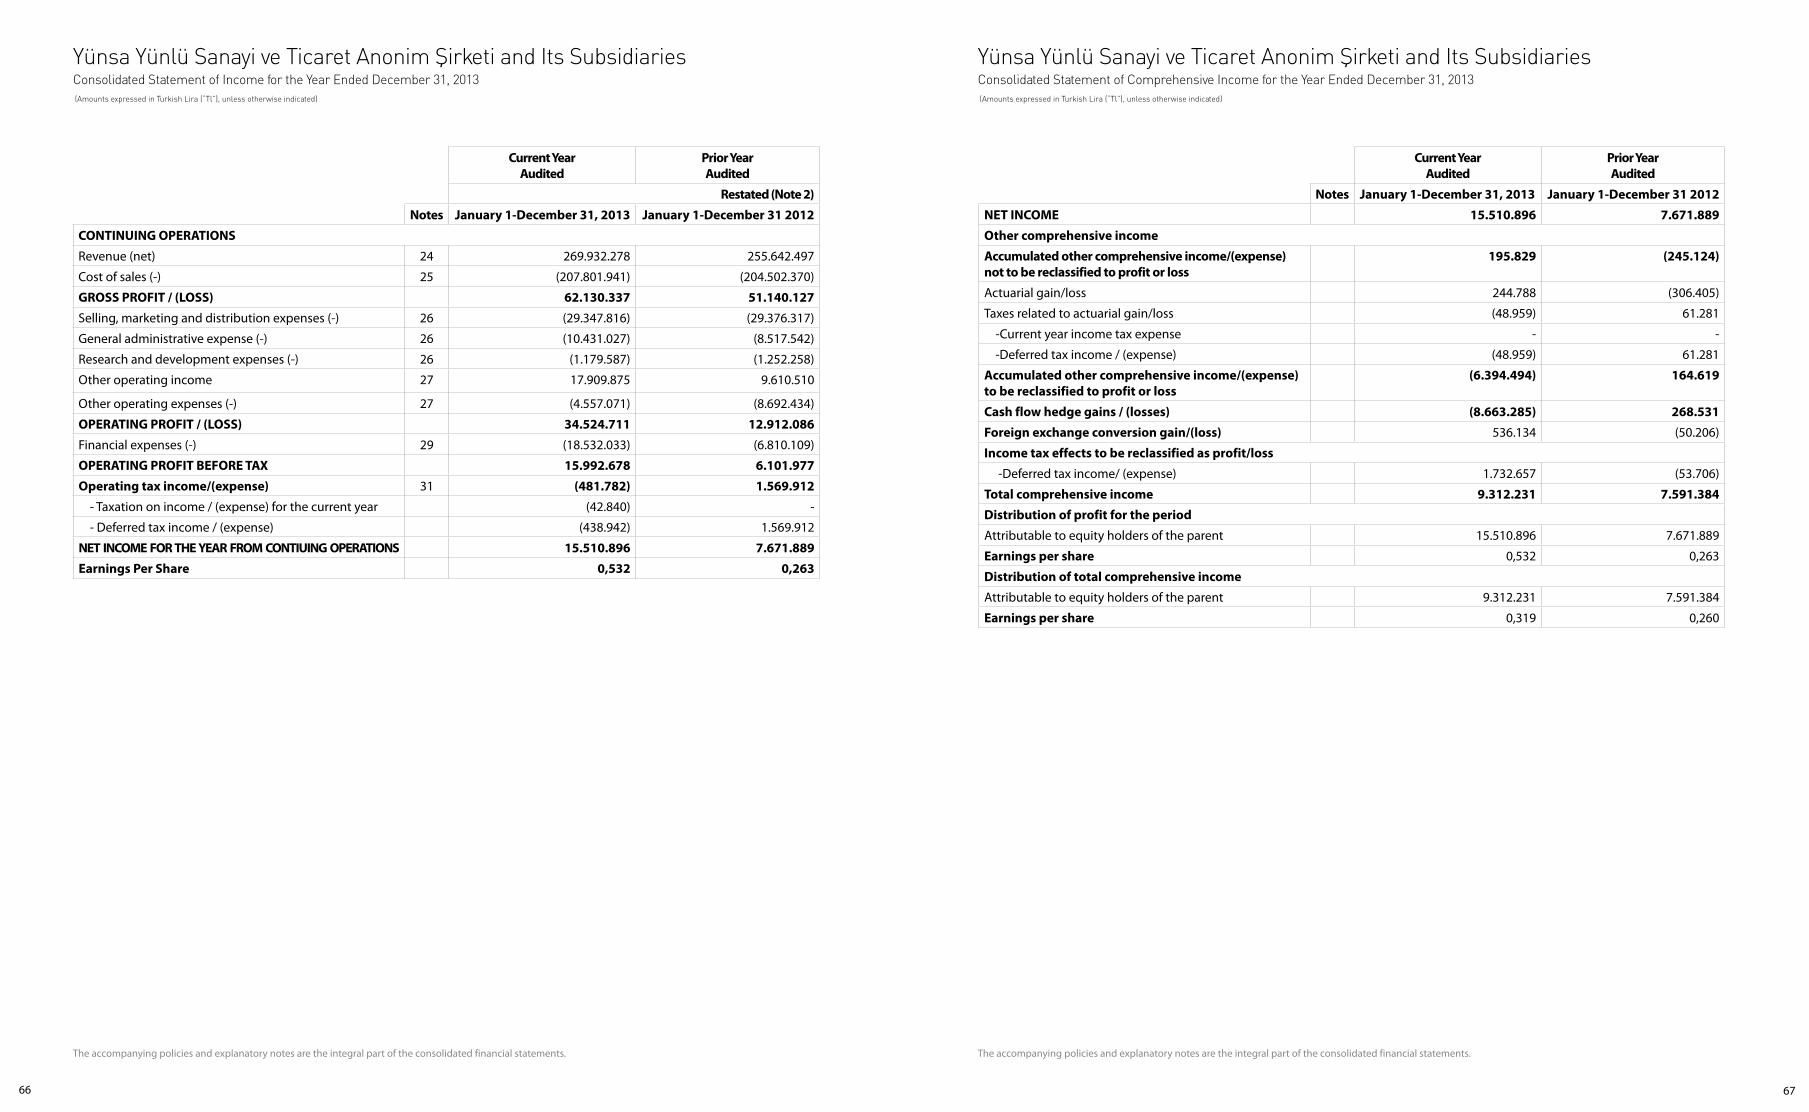
The accompanying policies and explanatory notes are the integral part of the consolidated financial statements.
Current YearAudited
Prior YearAudited
Restated (Note 2)
Notes January 1-December 31, 2013 January 1-December 31 2012
CONTINUING OPERATIONS
Revenue (net) 24 269.932.278 255.642.497
Cost of sales (-) 25 (207.801.941) (204.502.370)
GROSS PROFIT / (LOSS) 62.130.337 51.140.127
Selling, marketing and distribution expenses (-) 26 (29.347.816) (29.376.317)
General administrative expense (-) 26 (10.431.027) (8.517.542)
Research and development expenses (-) 26 (1.179.587) (1.252.258)
Other operating income 27 17.909.875 9.610.510
Other operating expenses (-) 27 (4.557.071) (8.692.434)
OPERATING PROFIT / (LOSS) 34.524.711 12.912.086
Financial expenses (-) 29 (18.532.033) (6.810.109)
OPERATING PROFIT BEFORE TAX 15.992.678 6.101.977
Operating tax income/(expense) 31 (481.782) 1.569.912
- Taxation on income / (expense) for the current year (42.840) -
- Deferred tax income / (expense) (438.942) 1.569.912
NET INCOME FOR THE YEAR FROM CONTIUING OPERATIONS 15.510.896 7.671.889
Earnings Per Share 0,532 0,263
Current YearAudited
Prior YearAudited
Notes January 1-December 31, 2013 January 1-December 31 2012
NET INCOME 15.510.896 7.671.889
Other comprehensive income
Accumulated other comprehensive income/(expense) not to be reclassified to profit or loss
195.829 (245.124)
Actuarial gain/loss 244.788 (306.405)
Taxes related to actuarial gain/loss (48.959) 61.281
-Current year income tax expense - -
-Deferred tax income / (expense) (48.959) 61.281
Accumulated other comprehensive income/(expense) to be reclassified to profit or loss
(6.394.494) 164.619
Cash flow hedge gains / (losses) (8.663.285) 268.531
Foreign exchange conversion gain/(loss) 536.134 (50.206)
Income tax effects to be reclassified as profit/loss
-Deferred tax income/ (expense) 1.732.657 (53.706)
Total comprehensive income 9.312.231 7.591.384
Distribution of profit for the period
Attributable to equity holders of the parent 15.510.896 7.671.889
Earnings per share 0,532 0,263
Distribution of total comprehensive income
Attributable to equity holders of the parent 9.312.231 7.591.384
Earnings per share 0,319 0,260
The accompanying policies and explanatory notes are the integral part of the consolidated financial statements.
Yünsa Yünlü Sanayi ve Ticaret Anonim Şirketi and Its SubsidiariesConsolidated Statement of Income for the Year Ended December 31, 2013 (Amounts expressed in Turkish Lira (“Tl”), unless otherwise indicated)
Yünsa Yünlü Sanayi ve Ticaret Anonim Şirketi and Its SubsidiariesConsolidated Statement of Comprehensive Income for the Year Ended December 31, 2013 (Amounts expressed in Turkish Lira (“Tl”), unless otherwise indicated)
6766
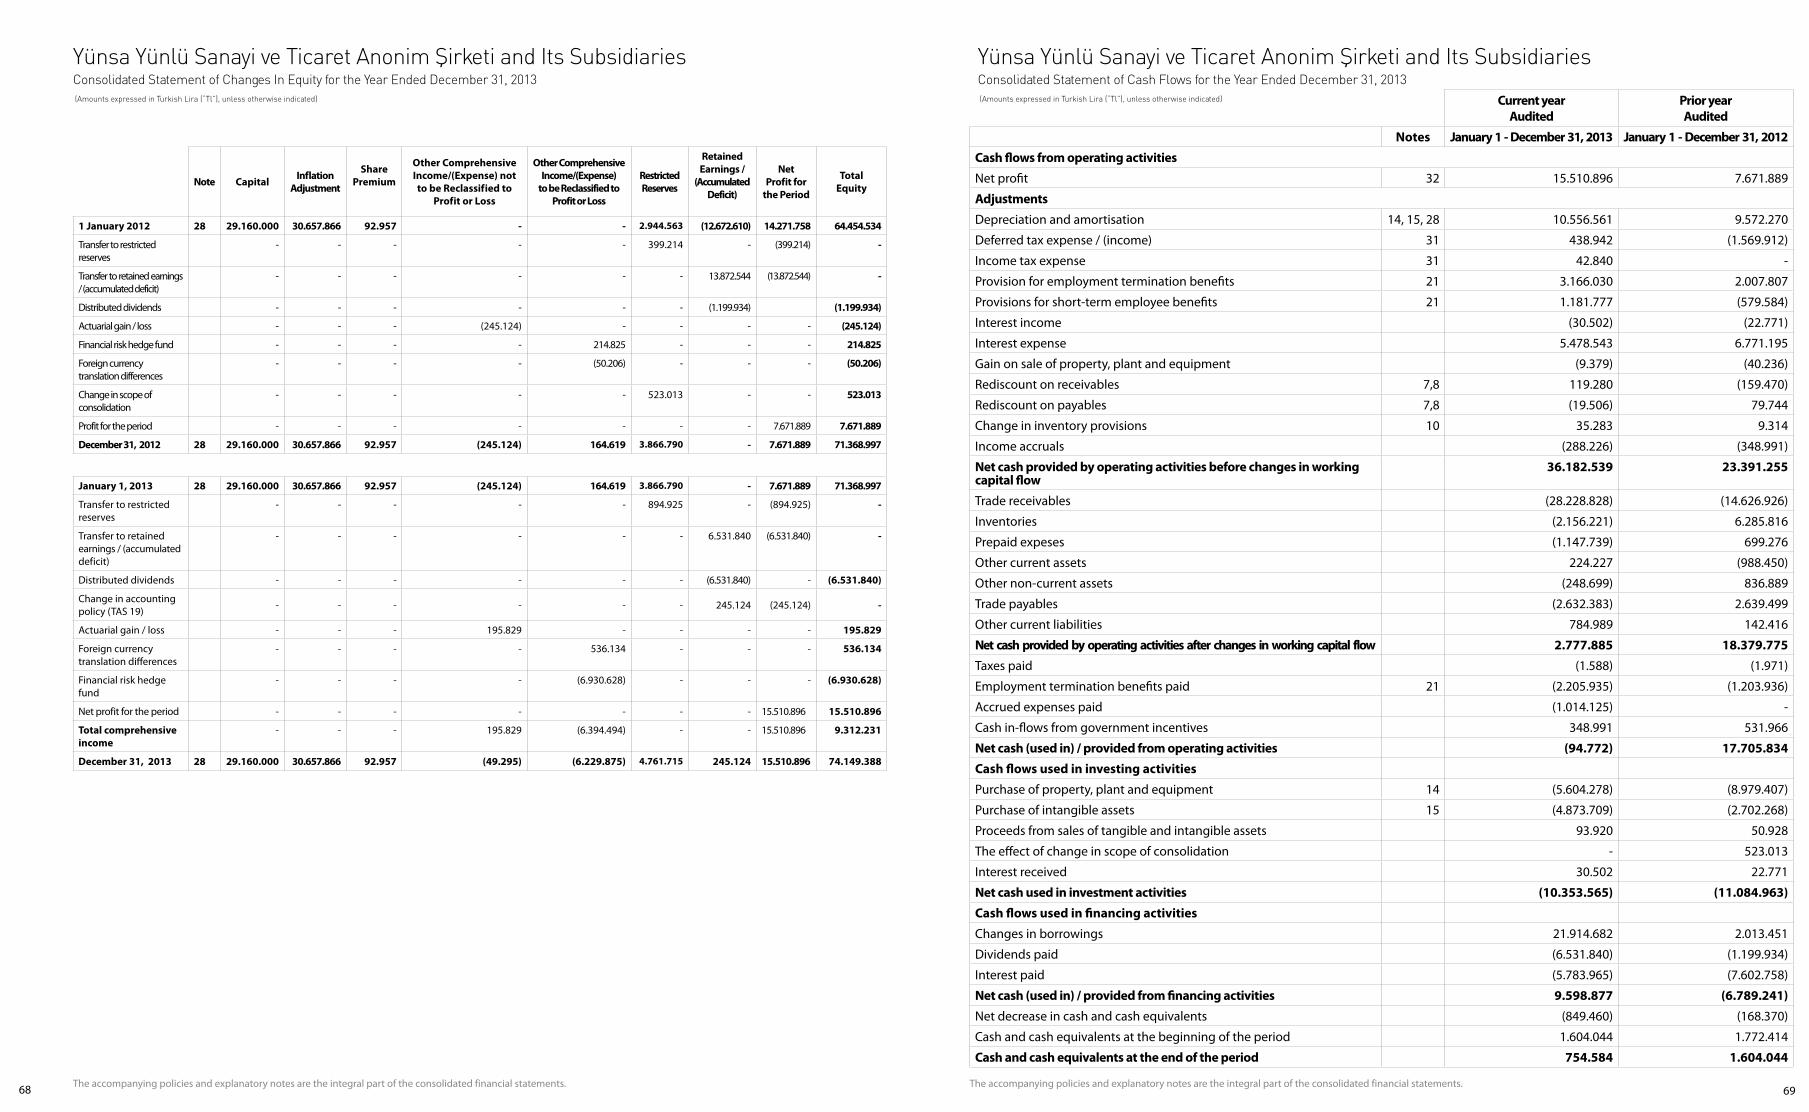
Note Capital Inflation Adjustment
SharePremium
Other Comprehensive Income/(Expense) not to be Reclassified to
Profit or Loss
Other Comprehensive Income/(Expense)
to be Reclassified to Profit or Loss
RestrictedReserves
RetainedEarnings /
(Accumulated Deficit)
NetProfit for
the Period
TotalEquity
1 January 2012 28 29.160.000 30.657.866 92.957 - - 2.944.563 (12.672.610) 14.271.758 64.454.534
Transfer to restricted reserves
- - - - - 399.214 - (399.214) -
Transfer to retained earnings / (accumulated deficit)
- - - - - - 13.872.544 (13.872.544) -
Distributed dividends - - - - - - (1.199.934) (1.199.934)
Actuarial gain / loss - - - (245.124) - - - - (245.124)
Financial risk hedge fund - - - - 214.825 - - - 214.825
Foreign currencytranslation differences
- - - - (50.206) - - - (50.206)
Change in scope ofconsolidation
- - - - - 523.013 - - 523.013
Profit for the period - - - - - - - 7.671.889 7.671.889
December 31, 2012 28 29.160.000 30.657.866 92.957 (245.124) 164.619 3.866.790 - 7.671.889 71.368.997
January 1, 2013 28 29.160.000 30.657.866 92.957 (245.124) 164.619 3.866.790 - 7.671.889 71.368.997
Transfer to restricted reserves
- - - - - 894.925 - (894.925) -
Transfer to retained earnings / (accumulated deficit)
- - - - - - 6.531.840 (6.531.840) -
Distributed dividends - - - - - - (6.531.840) - (6.531.840)
Change in accounting policy (TAS 19) - - - - - - 245.124 (245.124) -
Actuarial gain / loss - - - 195.829 - - - - 195.829
Foreign currencytranslation differences
- - - - 536.134 - - - 536.134
Financial risk hedge fund
- - - - (6.930.628) - - - (6.930.628)
Net profit for the period - - - - - - - 15.510.896 15.510.896
Total comprehensive income
- - - 195.829 (6.394.494) - - 15.510.896 9.312.231
December 31, 2013 28 29.160.000 30.657.866 92.957 (49.295) (6.229.875) 4.761.715 245.124 15.510.896 74.149.388
The accompanying policies and explanatory notes are the integral part of the consolidated financial statements. The accompanying policies and explanatory notes are the integral part of the consolidated financial statements.
Current year Audited
Prior yearAudited
Notes January 1 - December 31, 2013 January 1 - December 31, 2012
Cash flows from operating activities
Net profit 32 15.510.896 7.671.889
Adjustments
Depreciation and amortisation 14, 15, 28 10.556.561 9.572.270
Deferred tax expense / (income) 31 438.942 (1.569.912)
Income tax expense 31 42.840 -
Provision for employment termination benefits 21 3.166.030 2.007.807
Provisions for short-term employee benefits 21 1.181.777 (579.584)
Interest income (30.502) (22.771)
Interest expense 5.478.543 6.771.195
Gain on sale of property, plant and equipment (9.379) (40.236)
Rediscount on receivables 7,8 119.280 (159.470)
Rediscount on payables 7,8 (19.506) 79.744
Change in inventory provisions 10 35.283 9.314
Income accruals (288.226) (348.991)
Net cash provided by operating activities before changes in working capital flow
36.182.539 23.391.255
Trade receivables (28.228.828) (14.626.926)
Inventories (2.156.221) 6.285.816
Prepaid expeses (1.147.739) 699.276
Other current assets 224.227 (988.450)
Other non-current assets (248.699) 836.889
Trade payables (2.632.383) 2.639.499
Other current liabilities 784.989 142.416
Net cash provided by operating activities after changes in working capital flow 2.777.885 18.379.775
Taxes paid (1.588) (1.971)
Employment termination benefits paid 21 (2.205.935) (1.203.936)
Accrued expenses paid (1.014.125) -
Cash in-flows from government incentives 348.991 531.966
Net cash (used in) / provided from operating activities (94.772) 17.705.834
Cash flows used in investing activities
Purchase of property, plant and equipment 14 (5.604.278) (8.979.407)
Purchase of intangible assets 15 (4.873.709) (2.702.268)
Proceeds from sales of tangible and intangible assets 93.920 50.928
The effect of change in scope of consolidation - 523.013
Interest received 30.502 22.771
Net cash used in investment activities (10.353.565) (11.084.963)
Cash flows used in financing activities
Changes in borrowings 21.914.682 2.013.451
Dividends paid (6.531.840) (1.199.934)
Interest paid (5.783.965) (7.602.758)
Net cash (used in) / provided from financing activities 9.598.877 (6.789.241)
Net decrease in cash and cash equivalents (849.460) (168.370)
Cash and cash equivalents at the beginning of the period 1.604.044 1.772.414
Cash and cash equivalents at the end of the period 754.584 1.604.044
Yünsa Yünlü Sanayi ve Ticaret Anonim Şirketi and Its SubsidiariesConsolidated Statement of Cash Flows for the Year Ended December 31, 2013 (Amounts expressed in Turkish Lira (“Tl”), unless otherwise indicated)
Yünsa Yünlü Sanayi ve Ticaret Anonim Şirketi and Its SubsidiariesConsolidated Statement of Changes In Equity for the Year Ended December 31, 2013 (Amounts expressed in Turkish Lira (“Tl”), unless otherwise indicated)
6968

1- GROUP’S ORGANISATION AND NATURE OF OPERATIONS
Yünsa Yünlü Sanayi ve Ticaret AŞ (“Company”) and its subsidiaries (named as “Group”), Yünsa Yünlü Sanayi ve Ticaret AŞ is the parent company, which owns/controls the majority of the shares, consists of four subsidiaries.
Yünsa Yünlü Sanayi ve Ticaret AŞ (“Company”) was established in June 21, 1973.The Company was established for the manufacturing, marketing and selling wool textile products. Company’s main shareholder is Hacı Ömer Sabancı Holding AŞ The shares of the Group’s main shareholder are quoted on Borsa İstanbul AŞ and traded in the national market.
As of December 31, 2013 average number of personnel is 1.750 (December 31, 2012: 1.859).
The Company is registered in Turkey and the address of the registered office is Sabancı Center Kule 2, 34330 4.Levent, İstanbul.
As of December 31,2013 Yünsa Yünlü Sanayi ve Ticaret AŞ’s in scope of consolidation as subsidiaries (the ‘’Subsidiaries’’), directly and indirectly with the business of the capital shares are as follows:
Dividends paid:Group dividend payment made in the current period was TL 6.531.840.
Approval of the financial statements:The financial statements have been approved by the Board of Directors and authorized for issue on March 5, 2014.
December 31, 2013 and 2012
Subsidiaries Direct Ownership Ratio %
Indirect Ownership Ratio % Field of Activity
Yünsa Germany Gmbh 100 100 Marketing-Sales
Yünsa Italia SRL 100 100 Marketing-Sales
Yünsa UK Limited 100 100 Marketing-Sales
Yünsa USA Inc. 100 100 Marketing-Sales
2 - BASIS OF PRESENTATION OF FINANCIAL STATEMENTS
2.1 Basis of preparation of financial statements and significant accounting policies
The financial statements and disclosures have been prepared in accordance with the communiqué numbered II-14,1 “Communiqué on the Principles of Financial Reporting In Capital Markets” (the Communiqué) announced by the Capital Markets Board (“CMB”) (hereinafter will be referred to as “the CMB Reporting Standards”) on 13 June 2013 which is published on Official Gazette numbered 28676. In accordance with article 5th of the CMB Reporting Standards, companies should apply Turkish Accounting Standards/Turkish Financial Reporting Standards (TAS/TFRS) and interpretations regarding these standards as adopted by the Public Oversight Accounting and Auditing Standards Authority of Turkey (“POA”).
The Company keeps its books in Turkish Lira (TL) pursuant to the commercial and financial regulations effective in Turkey and the provisions of the Uniform Chart of Accounts (UCA) promulgated by the Ministry of Finance. The financial statements are based on the legal records of the Company and expressed in TL based in historical cost except for derivative financial instruments which are measured at fair value and prepared after being subject to certain adjustments and classifications in order to fairly present the financial position of the Company in accordance wit the CMB Accounting Standards.
Functional currency The financial statements of each company of the Group have been presented in the currency prevailing in the basic economic environment in which they operate (functional currency). The financial position and results of operations of each company have been denominated in TL which is the prevailing currency of the Company and the presentation currency for the consolidated financial statements.
As of December 31, 2013, the functional currency of the Group’s subsidiaries is Euro and US Dollars respectively, and the reporting currency is TL. The translation differences resulting from these consolidated subsidiaries are included in the foreign currency translation differences account under equity.
Basis of consolidationThe consolidated financial statements are controlled by the Company or include jointly controlled entity’s financial statements. Control of an entity so as to obtain benefits from its activities on the financial and operational policies that are provided with the power to control.
The results of the acquired or disposed subsidiaries during the year,are included in the consolidated statement of income, after the date of acquisition or up to the date of disposal. If necessary, the financial statements of the subsidiary companies have been changed, in order to apply the same accounting policies within the Group. All intra-group transactions, balances, income and expenses are eliminated on consolidation.
In net assets of consolidated subsidiaries to minority interests (non-controlling interest) are identified separately from the Group's equity therein. Minority shares consist of the first business combinations that occur in these shares from the date of the merger with the changes in equity of the minority interests of the amount.
When a company purchased by the Group, the assets and liabilities of the relevant subsidiary, are measured at fair value as of the date of acquisition. Minority share is obtained by calculating the fair values of assets and liabilities in the ratio of non controlling interests. The operating results of the subsidiaries acquired or disposed during the period, are included in the consolidated statement of income, starting from the date of acquisition or up to the date of the sale.
In the event the Company's purchase payment price is over the value of the underlying net assets, goodwill arises during the consolidation. After reassessment, the acquired company's assets, liabilities and contingent liabilities of the Group's share in the net fair value exceeds the costs associated with business combinations, the excess amount is recognized in the income statement.
Yünsa Yünlü Sanayi ve Ticaret Anonim Şirketi and Its SubsidiariesNotes to the Consolidated Financial Statements as of December 31, 2013 (Amounts expressed in Turkish Lira (“Tl”), unless otherwise indicated)
Yünsa Yünlü Sanayi ve Ticaret Anonim Şirketi and Its SubsidiariesNotes to the Consolidated Financial Statements as of December 31, 2013 (Amounts expressed in Turkish Lira (“Tl”), unless otherwise indicated)
7170

Changes in the share capital of the Group's existing subsidiaries are:
In the Group's ownership interests in subsidiaries that do not result in loss of control are accounted for as equity transactions changes. The Group's shares of non-controlling share of the book value of subsidiaries are adjusted to reflect changes in share. Non-controlling interests are adjusted by the difference between the amount of the consideration paid or received and the fair value, are accounted directly in equity as a share of the Group.
In case of the Group's loss of the control of a subsidiary, after sales profit / loss, i) with the sum of the sales price and the remaining share of the fair value ii) the subsidiary's assets (including goodwill) and liabilities and non-controlling share of the previous carrying amount of the difference between is calculated.The subsidiary's assets valuation at fair value and revalued amounts and in case of the accounting of the related cumulative gain / loss in other comprehensive income recognition and accumulated in equity, in case of other comprehensive income previously recognized in equity and collected amounts, are recorded by the accounting methods to be used on the assumption that the Company has sold related assets. (e.g., in accordance with the relevant IFRS standards, profit / loss transfer or transfers directly to retained earnings).
After the subsidiary's sale, the fair value of date of the remaining investment’s loss of control, IAS 39 Financial Instruments: Recognition and Measurement standards identified under the initial accounting for the fair value or as in applicable cases where a subsidiary or a jointly controlled business investment is considered as the cost value in initial recognition.
2.2 Change in accounting policies
The new standards, amendments and interpretations
The accounting policies adopted in preparation of the financial statements as at December 31, 2013 are consistent with those of the previous financial year, except for the adoption of new and amended TFRS and TFRIC interpretations effective as of January 1, 2013. The effects of these standards and interpretations on the Group’s financial position and performance have been disclosed in the related paragraphs.
The new standards, amendments and interpretations which are effective as at January 1, 2013 are as follows:
TFRS 7 Financial instruments: disclosures – offsetting financial assets and financial liabilities (amendment)
The amendment requires the disclosure of the rights of the entity relating to the offsetting of the financial instruments and some information about the related regulations (eg. collateral agreements).
New disclosures would provide users of financial statements with information that is useful in;
i) Evaluating the effect or potential effect of netting arrangements on an entity’s financial position and,ii) Analyzing and comparing financial statements prepared in accordance with TFRS and other generally accepted accounting standards.
New disclosures have to be provided for all the financial instruments in the balance sheet that have been offset according to TAS 32. Such disclosures are applicable to financial instruments in the balance sheet that have not been offset according to TAS 32 but are available for offsetting according to main applicable offsetting regulations or other financial instruments that are subject to a similar agreement. The amendment affects disclosures only and did not have any impact on the consolidated financial statements of the Group.
TAS 1 Presentation of financial statements (amended) – presentation of items of other comprehensive income
The amendments change only the grouping of items presented in other comprehensive income. Items that could be reclassified (or ‘recycled’) to profit or loss at a future point in time would be presented separately from items which will never be reclassified. The amendment affects presentation only and did not have an impact on the financial position or performance of the Group.
TAS 19 Employee benefits (amendment)
Numerous changes or clarifications are made under the amended standard. Among these numerous amendments, the most important changes are removing the corridor mechanism, for determined benefit plans recognizing actuarial gain/(loss) under other comprehensive income and making the distinction between short-term and other long-term employee benefits based on expected timing of settlement rather than employee entitlement. The Group used to recognize the actuarial gain and loss in profit and loss statement before this amendment. The retrospective effects of the amendment to recognise actuarial gain and loss in the comprehensive income statement are disclosed in Note 2.6. Additionally, based on the amendment in the presentation of short term employee benefits, vacation pay liability formerly presented in the short term provisions has been retrospectively reclassified to long term provisions and calculated based on actuarial method.
TAS 27 Separate financial statements (amended)
As a consequential amendment to TFRS 10 and TFRS 12, the POA also amended TAS 27, which is now limited to accounting for subsidiaries, jointly controlled entities, and associates in separate financial statements. This amendment did not have any impact on the financial position or performance of the Group.
TAS 28 Investments in associates and joint ventures (amended)
As a consequential amendment to TFRS 11 and TFRS 12, the POA also amended TAS 28, which has been renamed TAS 28 Investments in Associates and Joint Ventures, to describe the application of the equity method accounting in joint ventures in addition to associates. Transitional requirement of this amendment is similar to TFRS 11. This amendment did not have an impact on the financial position or performance of the Group.
TFRS 10 Consolidated financial statements
TFRS10, TAS 27 Consolidated and Separate Financial Statements that addresses the accounting for consolidated financial statements. A new definition of “control” is introduced, which is used to determine which entities are consolidated. This is a principle based standard and require preparers of financial statements to exercise significant judgment. This amendment does not have an impact on the financial position or performance of the Group.
TFRS 11 Joint arrangements
The standard describes the accounting for joint ventures and joint operations with joint control. Among other changes introduced, under the new standard, proportionate consolidation is not permitted for joint ventures. This standard did not have an impact on the financial position or performance of the Group.
Yünsa Yünlü Sanayi ve Ticaret Anonim Şirketi and Its SubsidiariesNotes to the Consolidated Financial Statements as of December 31, 2013 (Amounts expressed in Turkish Lira (“Tl”), unless otherwise indicated)
Yünsa Yünlü Sanayi ve Ticaret Anonim Şirketi and Its SubsidiariesNotes to the Consolidated Financial Statements as of December 31, 2013 (Amounts expressed in Turkish Lira (“Tl”), unless otherwise indicated)
7372

TFRS 12 Disclosure of interests in other entities
TFRS 12 includes all of the requirements that are related to disclosures of an entity’s interests in subsidiaries, joint arrangements, associates and structured entities. The group discloses the related explanations in Note 1.
TFRS 13 Fair value measurement
The new Standard provides guidance on how to measure fair value under TFRS but does not change when an entity is required to use fair value. It is a single source of guidance under TFRS for all fair value measurements. The new standard also brings new disclosure requirements for fair value measurements. The new disclosures are only required for periods beginning after TFRS 13 is adopted. Comparative disclosures for prior periods are not required. The amendment did not have any impact on the financial position or performance of the Group.
TFRIC 20 Stripping costs in the production phase of a surface mine
The Interpretation clarifies when production stripping should lead to the recognition of an asset and how that asset should be measured, both initially and in subsequent periods. The interpretation did not have any impact on the financial position or performance of the Group.
Transition guidance (amendments to TFRS 10, TFRS 11 and TFRS 12)
The amendments change the transition guidance to provide further relief from full retrospective application. The date of initial application is defined as ‘the beginning of the annual reporting period in which TFRS 10 is applied for the first time’. The assessment of whether control exists is made at ‘the date of initial application’ rather than at the beginning of the comparative period. If the control assessment is different between TFRS 10 and TAS 27/SIC-12, retrospective adjustments should be determined. However, if the control assessment is the same, no retrospective application is required. If more than one comparative period is presented, additional relief is given to require only one period to be restated. For the same reasons TASB has also amended TFRS 11 Joint Arrangements and TFRS 12 Disclosure of Interests in Other Entities to provide transition relief. These amendments did not have an impact on the consolidated financial statements of the Group.
Improvements to TFRSs
Annual Improvements to TFRSs – 2009 – 2011 Cycle, which contains amendments to its standards, is effective for annual periods beginning on or after 1 January 2013. This project did not have an impact on the financial position or performance of the Group.
TAS 1 Financial statement presentation
Clarifies the difference between voluntary additional comparative information and the minimum required comparative information.
TAS 16 Property, plant and equipment
Clarifies that major spare parts and servicing equipment that meet the definition of property, plant and equipment are not inventory.
TAS 32 Financial instruments: Presentation
Clarifies that income taxes arising from distributions to equity holders are accounted for in accordance with TAS 12 Income Taxes. The amendment removes existing income tax requirements from TAS 32 and requires entities to apply the requirements in TAS 12 to any income tax arising from distributions to equity holders.
TAS 34 Financial reporting
Clarifies the requirements in IAS 34 relating to segment information for total assets and liabilities for each reportable segment. Total assets and liabilities for a particular reportable segment need to be disclosed only when the amounts are regularly provided to the chief operating decision maker and there has been a material change in the total amount disclosed in the group’s previous annual financial statements for that reportable segment.
Standards issued but not yet effective and not early adopted
Standards, interpretations and amendments to existing standards that are issued but not yet effective up to the date of issuance of the financial statements are as follows. The Group will make the necessary changes if not indicated otherwise, which will be affecting the financial statements and disclosures, after the new standards and interpretations become in effect.
TAS 32 Financial instruments: Presentation - offsetting financial assets and financial liabilities (amended)
The amendments clarify the meaning of “currently has a legally enforceable right to set-off” and also clarify the application of the TAS 32 offsetting criteria to settlement systems (such as central clearing house systems) which apply gross settlement mechanisms that are not simultaneous. These amendments are to be retrospectively applied for annual periods beginning on or after January 1, 2014. The Company does not expect that these amendments will have significant impact on the financial position or performance of the Group.
TFRS 9 Financial instruments – Classification and measurement
As amended in December 2011, the new standard is effective for annual periods beginning on or after January 1, 2015. Phase 1 of TFRS 9 introduces new requirements for classifying and measuring financial instruments. The amendments made to TFRS 9 will mainly affect the classification and measurement of financial assets and measurement of fair value option (FVO) liabilities and requires that the change in fair value of a FVO financial liability attributable to credit risk is presented under other comprehensive income. Early adoption is permitted. The Group is in the process of assessing the impact of the amendment on financial position or performance of the Group.
TFRIC Interpretation 21 levies
The interpretation clarifies that an entity recognizes a liability for a levy when the activity that triggers payment, as identified by the relevant legislation, occurs. It also clarifies that a levy liability is accrued progressively only if the activity that triggers payment occurs over a period of time, in accordance with the relevant legislation. For a levy that is triggered upon reaching a minimum threshold, the interpretation clarifies that no liability should be recognized before the specified minimum threshold is reached. The interpretation is effective for annual periods beginning on or after January 1, 2014, with early application permitted. Retrospective application of this interpretation is required. The Group does not expect that this amendment will have any impact on the financial position or performance of the Group.
Yünsa Yünlü Sanayi ve Ticaret Anonim Şirketi and Its SubsidiariesNotes to the Consolidated Financial Statements as of December 31, 2013 (Amounts expressed in Turkish Lira (“Tl”), unless otherwise indicated)
Yünsa Yünlü Sanayi ve Ticaret Anonim Şirketi and Its SubsidiariesNotes to the Consolidated Financial Statements as of December 31, 2013 (Amounts expressed in Turkish Lira (“Tl”), unless otherwise indicated)
7574
The new standards, amendments and interpretations that are issued by the International Accounting Standards Board (IASB) but not issued by POA
The following standards, interpretations and amendments to existing IFRS standards are issued by the IASB but not yet effective up to the date of issuance of the financial statements. However, these standards, interpretations and amendments to existing IFRS standards are not yet adapted/issued to TFRS by the POA, thus they do not constitute part of TFRS. The Group will make the necessary changes to its financial statements after the new standards and interpretations are issued and become effective under TFRS.
IFRS 10 Consolidated financial statements (amendment)
IFRS 10 is amended to provide an exception to the consolidation requirement for entities that meet the definition of an investment entity. The exception to consolidation requires investment entities to account for subsidiaries at fair value through profit or loss in accordance with IFRS 9. The amendment will not have any impact on the financial position or performance of the Group.
IAS 36 Impairment of assets - Recoverable amount disclosures for non-financial assets (amendment)
As a consequential amendment to IFRS 13 Fair Value Measurement, some of the disclosure requirements in IAS 36 Impairment of Assets regarding measurement of the recoverable amount of impaired assets is modified. The amendments required additional disclosures about the measurement of impaired assets (or a Company of assets) with a recoverable amount based on fair value less costs of disposal. The amendments are to be applied retrospectively for annual periods beginning on or after 1 January 2014. Implementation of the IFRS13, enable to use earlier. The Group does not expect that this amendment will have any impact on the financial position or performance of the Group.
TAS 39 Financial instruments: Recognition and measurement - novation of derivatives and continuation of hedge accounting (amendment)
In June 2013, the IASB issued amendments to TAS 39 Financial Instruments: Recognition and Measurement that provides a narrow exception to the requirement for the discontinuation of hedge accounting in circumstances when a hedging instrument is required to be novated to a central counterparty as a result of laws or regulations. The amendments are to be applied retrospectively for annual periods beginning on or after January 1, 2014.The Group does not expect that this amendment will have any impact on the financial position or performance of the Group.
IFRS 9 Financial instruments – Hedge accounting and amendments to IFRS 9, IFRS 7 and IAS 39 -IFRS 9 (2013)
In November 2013, the IASB issued a new version of IFRS 9, which includes the new hedge accounting requirements and some related amendments to IAS 39 and IFRS 7. Entities may make an accounting policy choice to continue to apply the hedge accounting requirements of IAS 39 for all of their hedging transactions. The standard does not have a mandatory effective date, but it is still available for application; a new mandatory effective date will be set when the IASB completes the impairment phase of its project on the accounting for financial instruments. The Group is in the process of assessing the impact of the amendment on financial position or performance of the Group.
Improvements to IFRS
In December 2013, the IASB issued two cycles of Annual Improvements to IFRSs – 2010–2012 Cycle and IFRSs – 2011–2013 Cycle. Other than the amendments that only affect the standards’ Basis for Conclusions, the changes are effective as of July 1, 2014.
Annual improvements to IFRSs – 2010–2012 cycle
IFRS 2 Share-based payment
Definitions relating to vesting conditions have changed and performance condition and service condition are defined in order to clarify various issues. The amendment is effective prospectively.
IFRS 3 Business combinations Contingent consideration in a business acquisition that is not classified as equity is subsequently measured at fair value through profit or loss whether or not it falls within the scope of IFRS 9 Financial Instruments. The amendment is effective for business combinations prospectively.
IFRS 8 Operating segments
The changes are as follows: i) Operating segments may be combined/aggregated if they are consistent with the core principle of the standard. ii) The reconciliation of segment assets to total assets is only required to be disclosed if the reconciliation is reported to the chief operating decision maker. The amendments are effective retrospectively.
IFRS 13 Fair value measurement decision requirements
As clarified in the Basis for Conclusions, short-term receivables and payables with no stated interest rates can be held at invoice amounts when the effect of discounting is immaterial. The amendments are effective immediately.
IAS 16 Property, plant and equipment and IAS 38 intangible assets
The amendment to IAS 16.35(a) and IAS 38.80(a) clarifies that revaluation can be performed, as follows: i) Adjust the gross carrying amount of the asset to market value or ii) determine the market value of the carrying amount and adjust the gross carrying amount proportionately so that the carrying amount equals to the market value. The amendment is effective retrospectively.
IAS 24 Related party disclosures
The amendment clarifies that a management entity – an entity that provides key management personnel services – is a related party subject to the related party disclosures. The amendment is effective retrospectively.
Annual improvements to IFRSs – 2011–2013 cycle
IFRS 3 Business combinations
The amendment clarifies that: i) Joint arrangements are outside the scope of IFRS 3, not just joint ventures ii) The scope exception applies only to the accounting in the financial statements of the joint arrangement itself. The amendment is effective prospectively.
IFRS 13 Fair value measurement
The portfolio exception in IFRS 13 can be applied to the contracts not just financial assets and financial liabilities. The amendment is effective prospectively.
Yünsa Yünlü Sanayi ve Ticaret Anonim Şirketi and Its SubsidiariesNotes to the Consolidated Financial Statements as of December 31, 2013 (Amounts expressed in Turkish Lira (“Tl”), unless otherwise indicated)
Yünsa Yünlü Sanayi ve Ticaret Anonim Şirketi and Its SubsidiariesNotes to the Consolidated Financial Statements as of December 31, 2013 (Amounts expressed in Turkish Lira (“Tl”), unless otherwise indicated)
7776
IAS 40 Investment property
The amendment clarifies the interrelationship of IFRS 3 and IAS 40 when classifying property as investment property or owner-occupied property. The amendment is effective prospectively. Group does not expect that these amendments will have any impact on the financial position or performance of the Group.
IFRS 14 – Temporary standard on regulatory deferral accounts
In January 2014, the IASB issued this standard. IFRS 14 permits first-time adopter rate regulated entities to continue to recognise amounts related to rate regulation in accordance with their previous GAAP requirements when they adopt IFRS. Existing IFRS preparers are prohibited from adopting this Standard. The Standard will be applied on a full retrospective basis and is effective for annual periods beginning on or after 1 January 2016. Earlier application is permitted. The Standard is not applicable for the Group and will not have an impact on the financial position or performance of the Group.
Resolutions promulgated by the Public Oversight Authority
In addition to those mentioned above, the POA has promulgated the following resolutions regarding the implementation of Turkish Accounting Standards. “The financial statement examples and user guide” became immediately effective at its date of issuance; however, the other resolutions shall become effective for the annual reporting periods beginning after December 31,2012.
2013-1 Financial statement examples and user guide
The POA promulgated “financial statement examples and user guide” on May 20, 2013 in order to ensure the uniformity of financial statements and facilitate their audit. The financial statement examples within this framework were published to serve as an example to financial statements to be prepared by companies obliged to apply Turkish Accounting Standards, excluding financial institutions established to engage in banking, insurance, private pensions or capital market. The Group has made the classification stated in Note 2.2 in order to comply with the requirements of this regulation.
2013-2 Accounting of combinations under common control
In accordance with the resolution it has been decided that i) combination of entities under common control should be recognized using the pooling of interest method, ii) and thus, goodwill should not be included in the financial statements and iii) while using the pooling of interest method, the financial statements should be prepared as if the combination has taken place as of the beginning of the reporting period in which the common control occurs and should be presented comparatively from the beginning of the reporting period in which the common control occurred. This resolution did not have any impact on the financial statements of the Group.
2013-3 Accounting of redeemed share certificates
Clarification has been provided on the conditions and circumstances when the redeemed share certificates shall be recognized as a financial liability or equity based financial instruments. This resolution did not have any impact on the financial statements of the Group.
2013-4 Accounting of cross shareholding investments
If a subsidiary of an entity holds shares of the entity then this is defined as cross shareholding investment. Accounting of this cross investment is assessed based on the type of the investment and different recognition principles adopted accordingly. With this resolution, this topic has been assessed under three main headings below and the recognition principles for each one of them has been determined.
i) The subsidiary holding the equity based financial instruments of the parent, ii) The associates or joint ventures holding the equity based financial instruments of the parent iii) The parent’s equity based financial instruments are held by an entity, which is accounted as an investment within the scope of TAS 39 and TFRS 9 by the parent.
This resolution did not have any impact on the financial statements of the Group.
Comparative information and Adjustment of prior periods' financial statements
Group's financial statements have been prepared comparatively with the prior year, in order to enable the determination of financial position and performance. Current period financial statements are reclassified in order to maintain consistency with the presentation of the comparative information when necessary and important differences are explained.
Actuarial gains / losses, that arise from the benefits provided to employees as part of changes made in the standard related to employee benefits, are recognized in equity.This application beginning on or after January 1, 2013 and is effective for annual periods application has been applied retrospectively. Group, on December 31, 2012 income statement "general and administrative expenses" and "Deferred tax income / expense" account the 245.124 TL amount (net deferred tax effect) as actuarial loss 2012 net income for the period in the netting for employee termination benefits, the fund is classified under actuarial gains and losses.
Dated June 7, 2013 and 20/670 numbered meeting decisions taken in accordance with the Capital Markets Financial Reporting in the Communiqué on Principles Regarding covered by the capital market institutions March 31, 2013 after the end of the interim period from an enacted financial statements, examples and user guide has been published. Enacted financial statements in accordance with the Group's statement of financial position in a variety of formats reclassifications have been made. In the financial statements of the Group on December 31, 2012 the classifications are:
- Other current assets amounting to TL 420.939 displayed in the account of prepaid expenses in the statement of financial position as a separate account,
- Group shown in other payables amounting to TL 3.517.049 due to personnel, taxes and other deductions are reclassified in benefits provided to employees within the scope of the debt,
As of December 31, 2012, Group's statement of comprehensive income reclassifications made are:
- Located in the finance income account group relating to trade receivables and payables in foreign exchange gains amounting to TL 8.319.377, into other income from operations,
- Financial expenses related to trade receivables and payables accounts to the group exchange losses in the amount of TL 7.586.158 from operations have been reclassified to other expenses.
Yünsa Yünlü Sanayi ve Ticaret Anonim Şirketi and Its SubsidiariesNotes to the Consolidated Financial Statements as of December 31, 2013 (Amounts expressed in Turkish Lira (“Tl”), unless otherwise indicated)
Yünsa Yünlü Sanayi ve Ticaret Anonim Şirketi and Its SubsidiariesNotes to the Consolidated Financial Statements as of December 31, 2013 (Amounts expressed in Turkish Lira (“Tl”), unless otherwise indicated)
7978
2.3 Summary of significant accounting policies
The consolidated financial statements of the significant accounting policies used in the preparation are summarized below:
a) Revenue
Sales revenues are recorded on the basis of actualization of the delivery, the reliable calculation of the revenue's amount & the expected amount of the transaction-related economic benefits received or to be taken of the consideration over the fair value, inflow for the Group. Net sales, sales returns, calculated after deducting discounts and commissions have been found.
Revenue from the proceeds of the sale of goods, is recognized when all the following conditions are met:
• Thetransferoftheallsignificantrisks&rewardsoftheownershiptothebuyer,• Therelatedownershipofthegroup&lackofeffectivecontroloverthegoodssoldofthecontinuousmanagerialinvolvement,• Thereliablemeasurementoftherevenueamount,• Possibleeconomicbenefitsassociatedwiththetransactionflowtotheentity,• Incurredorexpectedincurredtransactioncostsmustbemeasuredreliably.
Retail sales are made in cash or by credit card. Revenue recorded, including credit card processing fees in gross amounts.
Other revenues earned by the Group, are recognized on the following basis:
Rent and royalty income - on accrual basisInterest income - on the basis of the effective interest methodDividend income - dividends in the period when the right to collect occurs
b) Related parties
a) A person or a member of that person's close family is related to the Company in the following cases:
Concerned person’s;
(i) Having control or joint control over the company, (ii) In case of having significant influence over the company, (iii) In case of being a member of the Company of Company’s main ownership’s key management personnel,
b) If any of the following conditions are met, the entity is counted as related with the Company:
(i) In case of, Entity & the Company are members of the same group. (ii) In case of entity is another company's subsidiary or joint venture (or in case of a membership of a groups' member) (iii) In case of both the companies having a business partnership with the same third party, (iv) One of the companies having a business partnership with a third party and the other company is a subsidiary of of that third party, (v) In case of having Entity’s, Company’s or the associated Company's employees having a post-employment defined benefit plans (In case of Company has such a plan, the sponsoring companies are also related with the Company.) (vi) Company's control or jointly controlled by a person identified in the article (a), (vii) A person who is identified as in (a) article,at (i) part, in the presence of a significant impact on a person's business or such entity (or of a parent of these businesses) in the case of being a member of the key management personnel.
c) Inventories
Inventories are stated at the lower of cost and net realizable value. Costs, including an appropriate portion of fixed and variable overhead expenses, are assigned to inventories held by the method most appropriate to the particular class of inventory, with the majority being valued on weighted average basis. Net realizable value represents the estimated selling price less all estimated costs of completion and costs necessary to make a sale. When the net realizable value of inventory is less than cost, the inventory is written down to the net realizable value and the expense is included in statement of income/(loss) in the period the write-down or loss occurred. When the circumstances that previously caused inventories to be written down below cost no longer exist or when there is clear evidence of an increase in net realizable value because of changed economic circumstances, the amount of the write-down is reversed. The reversal amount is limited to the amount of the original write-down.
d) Financial instruments
Financial assets
The fair value through profit or loss classified as financial assets and the fair value of recognized at fair market value except those financial assets and purchase transactions directly attributable expenditure for the total amount is recognized. In accordance with the timeframe investment instruments, established by the concerning market condition of delivery that is connected to a contract as a result of purchase or sale of financial assets and the related assets, are recognized or are derecognized on the trade date.
Financial assets are classified into the following specified categories: financial assets as ‘at fair value through profit or loss’ (FVTPL), ‘held-to-maturity investments’, ‘available-for-sale’ (AFS) financial assets and ‘loans and receivables’. The classification depends on the nature and purpose of the financial assets and is determined at the time of initial recognition
The effective interest method
The effective interest rate method, is the calculation of the amortized cost of a financial asset and distribution of the related interest income to the related period. Effective interest rate is the rate for the expected life of the financial instrument or, if it is appropriate, a shorter period of time of the total estimated future cash receipts through the related financial asset is the rate that exactly discounts to net present value. At fair value through profit or loss Financial assets are classified as financial assets and the related income is calculated by using the effective interest method.
Financial assets that are the reflections of the fair value through profit or loss
Financial assets that are held for trading are the assets which reflect the fair value in the income statement. A financial asset for the purpose of selling in the short term, it is categorized under this subject. Financial risk derivatives are designated as an effective protective instrument mentioned that constitute the fair value of financial assets at fair value through profit or loss are classified as financial assets. Assets, in this category, are classified as current assets.
Financial assets held to maturity
The Group's intent and ability to hold to maturity, which is fixed or determinable payments and fixed maturity debt instruments, are classified as investments held to maturity. Held-to-maturity investments are recorded at amortized cost using effective interest method less impairment and the related revenue is calculated after deducting the effective interest method. Financial Assets available for sale
Available-for-sale financial assets are defined as (a) assets which are not held-to-maturity financial assets” or (b) financial assets that are not financial assets held for trading. Available-for-sale financial assets are subsequently re-measured at fair value.
Yünsa Yünlü Sanayi ve Ticaret Anonim Şirketi and Its SubsidiariesNotes to the Consolidated Financial Statements as of December 31, 2013 (Amounts expressed in Turkish Lira (“Tl”), unless otherwise indicated)
Yünsa Yünlü Sanayi ve Ticaret Anonim Şirketi and Its SubsidiariesNotes to the Consolidated Financial Statements as of December 31, 2013 (Amounts expressed in Turkish Lira (“Tl”), unless otherwise indicated)
8180
Financial liabilities
The Group's financial liabilities and equity instruments, are classified according to the substance of contractual arrangements, and based on the definitions of a financial liability and equity instrument.
It’s a financial instrument that represent the right of the remaining assets’ contract depending on the equity, after deducting all of the Group’s liabilities. Specific financial liabilities and equity for the applied accounting policies for financial instruments are stated below.
Financial liabilities at fair value through profit or loss or other financial liabilities are classified as financial liabilities.
Financial liabilities concerning fair value valuation difference profit or loss
Financial liabilities concerning fair value valuation difference profit or loss, is recorded at fair value and in every report period it is revalued as of balance sheet date value. The change in the fair value is accounted in the income statement.The net gain or loss recognized in income statement, stated financial liabilities include the amount of interest paid.
Other financial liabilities
Other financial liabilities, including borrowings, net of transaction costs are accounted for at fair value.
Other financial liabilities are subsequently calculated on the effective interest rate method, with interest expense using the effective interest is recognized at amortized cost.
The effective interest rate method of calculating the amortized cost of a financial liability and of allocating interest expense over the relevant period to the period related.
The effective interest rate is the rate for the expected life of the financial instrument or, if appropriate, a shorter period of time, the estimated future cash payments net present value of the related financial liabilities is the rate that discounts.
Derivative financial instruments and hedge accounting
The group's activities, mainly due to changes in foreign exchange rates and interest rates, which is exposed to financial risks. Group, on specific binding commitments and forecasted exchange rate fluctuations depending to transactions to hedge its financial risks associated with derivative financial instruments (primarily foreign currency forward contracts) are used.
The Group does not use derivative financial instruments for speculative purposes. Derivative financial instruments are calculated at fair value on the contract date and it is recalculated using the fair value in subsequent reporting periods.
Future cash flows are determined as hedging derivatives that are active on this issue and the changes in the fair value of the ineffective portion directly in equity is recognized directly in income statement.
The group's bounding commitments to foreign exchange risk protection policy, classifies the stated risk as a cash flow hedge. In the recognition of an asset or liability that do not result in hedging transactions, in the periods that the amounts in equity affects the hedged item's the income statement, are recognized in the income statement. The derivative financial instruments that do not meet the requirements for changes for the hedging acoounting, are recorded in income statement when they create a fair value change.
Financial hedge accounting is concluded when the hedging instrument usage period expired, sold or used, or the requirements for hedge accounting could not meet the case.Cumulative gain or loss arising from hedging instrument at the related period will be booked to equity until the expected gain/loss transaction to be completed. If a hedged transaction does not occur, the net cumulative gain or loss recognized in equity, is recorded as profit or loss for the period.
When fair value calculations, based on market prices, cannot be obtained reliably, the available-for-sale financial assets are carried at amortized cost using the effective interest method. Profit and loss related to available-for-sale financial assets are included in the income statement for the related period. The changes in fair value of these assets are presented in equity accounts. In the case that the related asset is disposed of or impaired, the amount in equity accounts is transferred to the income statement as profit/loss. Impairment provisions, which result from investments on equity instruments classified as available-for-sale financial assets and which are recognized in the income statement cannot be derecognized from the income statement in the subsequent periods. Except for equity instruments defined as available-for-sale, if the loss on impairment decreases in the subsequent period and if this decrease is attributable to an event occurring after the recognition of the impairment loss, previously recognized impairment loss may be derecognized in the income statement.
Borrowings and receivables
Trade and other receivables and loans with fixed or determinable payments , that are not traded, are classified in this category. Loans are shown at amortized cost using the effective interest method, less any impairment losses are measured.
Impairments in financial assets
Financial asset are assessed at each balance sheet date whether there is any objective evidence that a financial asset or a group of financial assets is impaired. A financial asset or a group of financial assets is deemed to be impaired if, and only if, there is objective evidence of impairment as a result of one or more events that had occurred after the initial recognition of the asset and that loss event has an impact on the estimated future cash flows of the financial asset or the group of financial assets that can be reliably estimated. For loans and receivables impairment loss has been incurred the amount of the loss is measured as the difference between the asset’s carrying amount and the present value of estimated future cash flows.
Except for trade receivables, which is reduced through the use of an allowance account, impairment on all other financial assets are directly written off in the related account. In case trade receivables cannot be collected, the related amount is written off from allowance account. The change in allowance account is accounted in the income statement.
Except ready for sale equity instruments, if the impairment losses in next period decreases and the decrease in impairment loss is recognized, then the previously recognized impairment loss for investment at the date the impairment is reversed, in case of the impairment have not been recognized at any time. It is cancelled without exceeding the amortized cost, is reversed in the income statement.
An increase, after the decrease in the fair vaue of ready to sale equity instruments, is directly accounted in equity.
Cash and cash equivalents
Cash and cash equivalents comprise cash on hand and demand deposits and other short-term highly liquid investments which their maturities are three months or less from date of acquisition and readily convertible to a known amount of cash and are subject to an insignificant risk of changes in value.
Yünsa Yünlü Sanayi ve Ticaret Anonim Şirketi and Its SubsidiariesNotes to the Consolidated Financial Statements as of December 31, 2013 (Amounts expressed in Turkish Lira (“Tl”), unless otherwise indicated)
Yünsa Yünlü Sanayi ve Ticaret Anonim Şirketi and Its SubsidiariesNotes to the Consolidated Financial Statements as of December 31, 2013 (Amounts expressed in Turkish Lira (“Tl”), unless otherwise indicated)
8382
e) Tangible assets
Tangible assets are carried at acquisition cost less accumulated depreciation and impairment loss if exists. Depreciation is provided over adjusted costs on a straight-line basis over the economic useful lives. Since lands are considered as to have an indefinite useful life, they are not subject to depreciation.
The depreciation periods for property, plant and equipment, which approximate the economic useful lives of such assets, are as follows:
Resulting from disposal of tangible assets or tangible assets withdrawn from service, the sales proceeds and the gain or loss determined as the difference between the asset's carrying amount and are included in the income statement.
The impairment test is performed when the book value of the assets that are subject to amortization, is not possible to recover.The provision for impairment is recorded if the asset's carrying amount exceeds the recoverable amount. The recoverable amount is the obtained fair value after deducting the cost of sales or is the greater value in use. In order to evaluate the impairment, the assets are grouped at the lowest levels (cash generating units) where there are seperately identifiable cash flows. Non-financial assets that are subject to impairment, are reviewed for possible reversal of the impairment at every reporting period.
Property, plant maintenance and repair expenses incurred, are recognized as expenses.The investment spendings that increase the future benefits by increasing the capacity of the tangible assets, are added to cost of tangible assets.
f) Intangible assets
Intangible assets comprise acquired intellectual property and computer software. They are recorded at acquisition cost and amortized on a straight-line basis over their estimated economic lives for a period not exceeding 5 years from the date of acquisition. Where an indication of impairment exists, the carrying amount of any intangible asset is assessed and written down immediately to its recoverable amount.
Internally generated intangible assets and research and development expenses
Research expenses are recorded in the income statement in the incurred period.
Resulting from development activities (or Intra-group's project at the development phase) ,internally generated intangible assets are only recognized when the following conditions are all met:
• Technicalpossibilitytocompletionoftheintangibleasset’sreadinessforuseortosell,• Havingintentiontosell,operateorcompletionofintangibleassets.• Intangibleassetsthatcanbeusedorsold,• Howtheassetwouldgenerateprobablefutureeconomicbenefitstobecertain,• Theexistenceoftherequiredappropriatetechnical,financialandotherresourcesinordertocompletethedevelopmentof intangible assets, use or sell. The development cost of the asset during the development process to be measured in a reliable way.
Amount of internally generated intangible assets, consist of the intangible assets that meet the requirements of the above mentioned recognition from the moment the total amount of the expenditure is composed. When internally generated intangible assets are not recorded, development expenditure is recognized as an expense in the period in which they create.
After initial recognition, the internally-generated intangible assets are shown as like the purchased separately intangible assets. after reducing the accumulated amortization and accumulated impairment losses. These assets are amortized within 5 years.
g) Borrowing costs
In the case of the assets that are ready for use & sale, are subject to a considerable time seeking (qualifying assets) , the attributable borrowing costs are directly involved in cost of the asset until the related asset is ready for use or sell.
All other borrowing costs are recognized in the income statement in the period they occur.
h) Corporate income taxes
Turkish tax legislation does not permit to file a consolidated tax preparation to parent company and its subsidiary, as reflected in the accompanying financial statements, the tax provision is calculated separately based on each company.
Income tax expense consists of the sum of current tax and deferred tax expense.
Current tax
Current year tax liability is calculated over the part of the taxable profit. There are differences in the income statement, because of it excludes taxable profit, taxable or tax-deductible items in other years that can not be deducted from taxable or tax. The Group's liability for current tax balance sheet date has been enacted or substantively enacted tax rate is calculated.
Deferred tax
Deferred tax liability or asset is determined by, taking into consideration the differences between the assets’ and liabilities’ shown amounts in the financial statements and is determined by calculating the amounts recognized in the legal tax base account the for temporary differences balance sheet liability method of tax effects have been enacted tax rates taking into consideration. Deferred tax liabilities are recognized for all taxable temporary differences, and deferred tax assets from deductible temporary differences, future taxable profits by obtaining benefit from those differences are recognized to the extent that it is probable. Such assets and liabilities, commercial or financial gain / loss on a transaction that affects temporary difference related to goodwill or other assets and liabilities in the financial statements for the first time of receipt (excluding business combinations) is not accounted for if it originates.
Deferred tax liabilities are calculated where the subsidiaries and investments in associates and jointventures' shares are associated with all taxable temporary differences, except the situations where the Group can control the removal of the temporary differences and the situations where this differences has small possibility of removal.
Land and land improvements 10-25Buildings 25-50Machinery, plant and equipment 4-12Motor vehicles 5Furniture and fixtures 3-10Specific costs 5
YEARS
Yünsa Yünlü Sanayi ve Ticaret Anonim Şirketi and Its SubsidiariesNotes to the Consolidated Financial Statements as of December 31, 2013 (Amounts expressed in Turkish Lira (“Tl”), unless otherwise indicated)
Yünsa Yünlü Sanayi ve Ticaret Anonim Şirketi and Its SubsidiariesNotes to the Consolidated Financial Statements as of December 31, 2013 (Amounts expressed in Turkish Lira (“Tl”), unless otherwise indicated)
8584
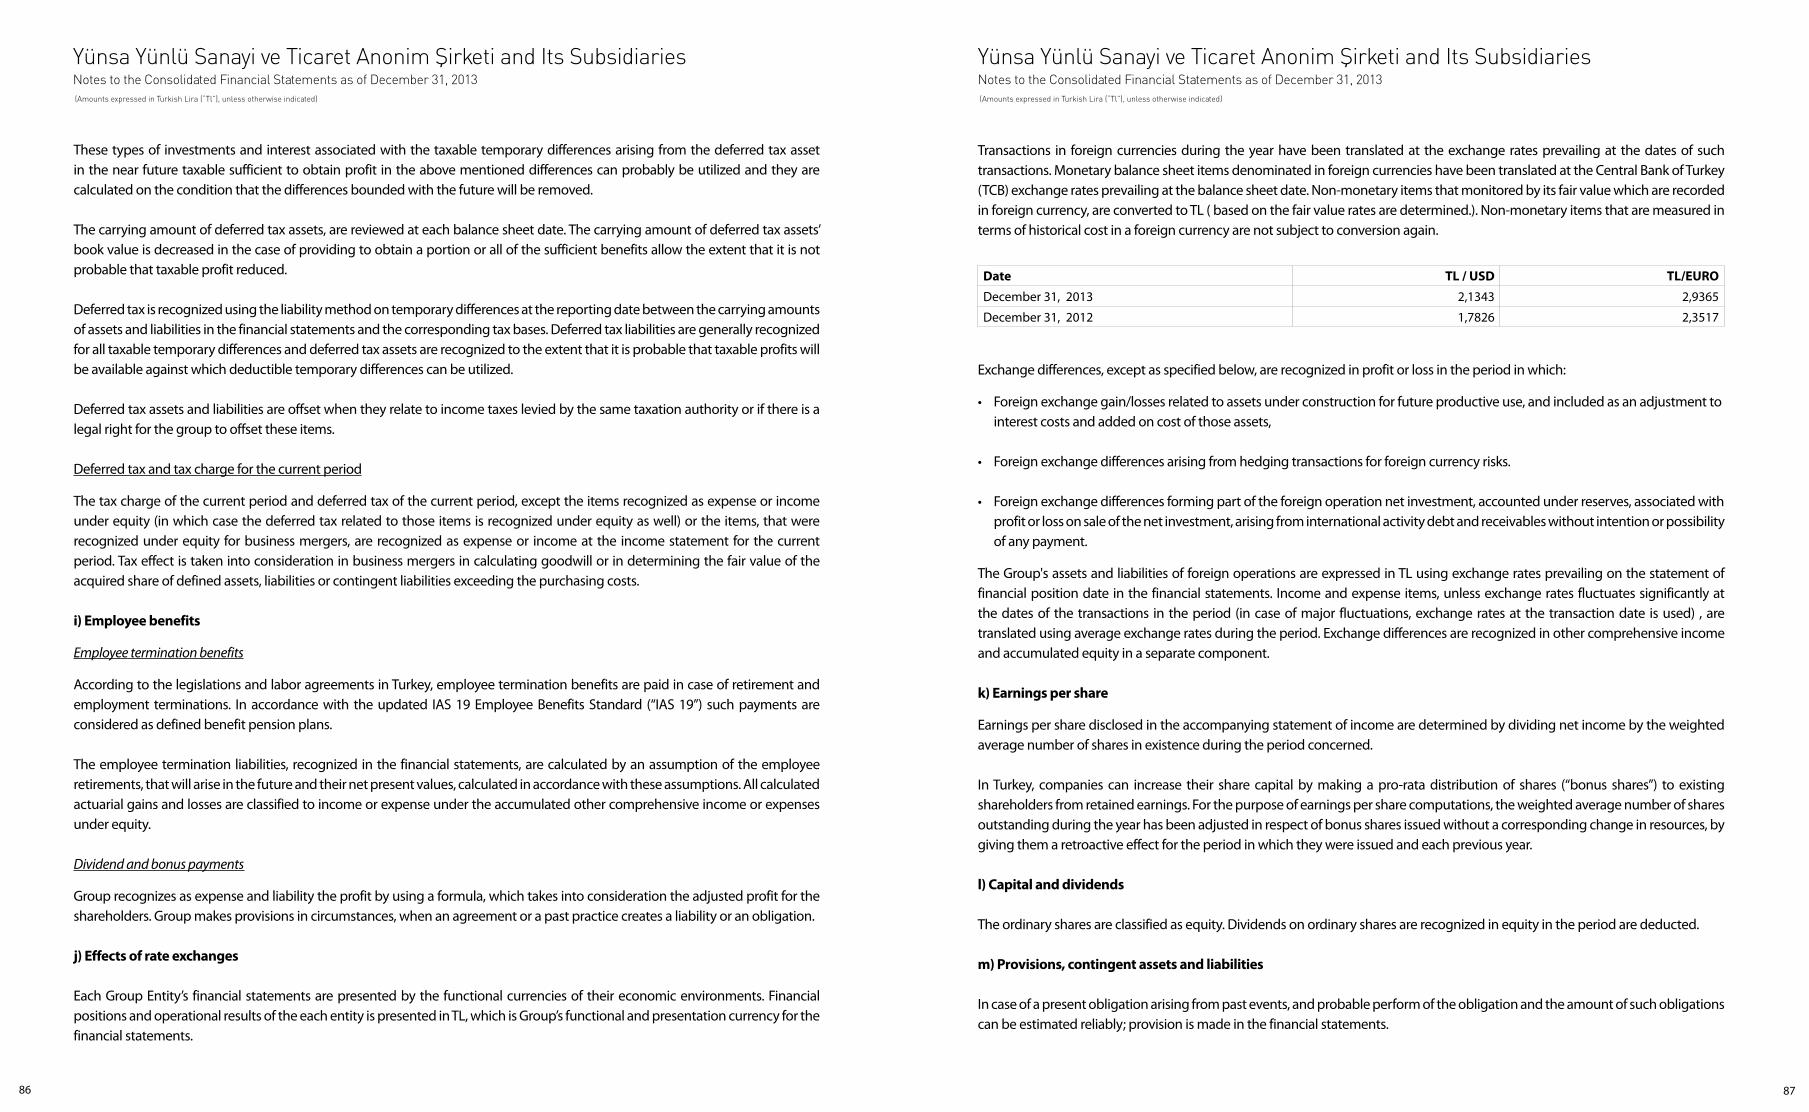
These types of investments and interest associated with the taxable temporary differences arising from the deferred tax asset in the near future taxable sufficient to obtain profit in the above mentioned differences can probably be utilized and they are calculated on the condition that the differences bounded with the future will be removed.
The carrying amount of deferred tax assets, are reviewed at each balance sheet date. The carrying amount of deferred tax assets’ book value is decreased in the case of providing to obtain a portion or all of the sufficient benefits allow the extent that it is not probable that taxable profit reduced.
Deferred tax is recognized using the liability method on temporary differences at the reporting date between the carrying amounts of assets and liabilities in the financial statements and the corresponding tax bases. Deferred tax liabilities are generally recognized for all taxable temporary differences and deferred tax assets are recognized to the extent that it is probable that taxable profits will be available against which deductible temporary differences can be utilized.
Deferred tax assets and liabilities are offset when they relate to income taxes levied by the same taxation authority or if there is a legal right for the group to offset these items.
Deferred tax and tax charge for the current period
The tax charge of the current period and deferred tax of the current period, except the items recognized as expense or income under equity (in which case the deferred tax related to those items is recognized under equity as well) or the items, that were recognized under equity for business mergers, are recognized as expense or income at the income statement for the current period. Tax effect is taken into consideration in business mergers in calculating goodwill or in determining the fair value of the acquired share of defined assets, liabilities or contingent liabilities exceeding the purchasing costs.
i) Employee benefits
Employee termination benefits
According to the legislations and labor agreements in Turkey, employee termination benefits are paid in case of retirement and employment terminations. In accordance with the updated IAS 19 Employee Benefits Standard (“IAS 19”) such payments are considered as defined benefit pension plans.
The employee termination liabilities, recognized in the financial statements, are calculated by an assumption of the employee retirements, that will arise in the future and their net present values, calculated in accordance with these assumptions. All calculated actuarial gains and losses are classified to income or expense under the accumulated other comprehensive income or expenses under equity.
Dividend and bonus payments
Group recognizes as expense and liability the profit by using a formula, which takes into consideration the adjusted profit for the shareholders. Group makes provisions in circumstances, when an agreement or a past practice creates a liability or an obligation.
j) Effects of rate exchanges
Each Group Entity’s financial statements are presented by the functional currencies of their economic environments. Financial positions and operational results of the each entity is presented in TL, which is Group’s functional and presentation currency for the financial statements.
Transactions in foreign currencies during the year have been translated at the exchange rates prevailing at the dates of such transactions. Monetary balance sheet items denominated in foreign currencies have been translated at the Central Bank of Turkey (TCB) exchange rates prevailing at the balance sheet date. Non-monetary items that monitored by its fair value which are recorded in foreign currency, are converted to TL ( based on the fair value rates are determined.). Non-monetary items that are measured in terms of historical cost in a foreign currency are not subject to conversion again.
Exchange differences, except as specified below, are recognized in profit or loss in the period in which:
• Foreignexchangegain/lossesrelatedtoassetsunderconstructionforfutureproductiveuse,andincludedasanadjustmentto interest costs and added on cost of those assets,
• Foreignexchangedifferencesarisingfromhedgingtransactionsforforeigncurrencyrisks.
• Foreignexchangedifferencesformingpartoftheforeignoperationnetinvestment,accountedunderreserves,associatedwith profit or loss on sale of the net investment, arising from international activity debt and receivables without intention or possibility of any payment.
The Group's assets and liabilities of foreign operations are expressed in TL using exchange rates prevailing on the statement of financial position date in the financial statements. Income and expense items, unless exchange rates fluctuates significantly at the dates of the transactions in the period (in case of major fluctuations, exchange rates at the transaction date is used) , are translated using average exchange rates during the period. Exchange differences are recognized in other comprehensive income and accumulated equity in a separate component.
k) Earnings per share
Earnings per share disclosed in the accompanying statement of income are determined by dividing net income by the weighted average number of shares in existence during the period concerned.
In Turkey, companies can increase their share capital by making a pro-rata distribution of shares (“bonus shares”) to existing shareholders from retained earnings. For the purpose of earnings per share computations, the weighted average number of shares outstanding during the year has been adjusted in respect of bonus shares issued without a corresponding change in resources, by giving them a retroactive effect for the period in which they were issued and each previous year.
l) Capital and dividends
The ordinary shares are classified as equity. Dividends on ordinary shares are recognized in equity in the period are deducted.
m) Provisions, contingent assets and liabilities
In case of a present obligation arising from past events, and probable perform of the obligation and the amount of such obligations can be estimated reliably; provision is made in the financial statements.
Date TL / USD TL/EURO
December 31, 2013 2,1343 2,9365
December 31, 2012 1,7826 2,3517
Yünsa Yünlü Sanayi ve Ticaret Anonim Şirketi and Its SubsidiariesNotes to the Consolidated Financial Statements as of December 31, 2013 (Amounts expressed in Turkish Lira (“Tl”), unless otherwise indicated)
Yünsa Yünlü Sanayi ve Ticaret Anonim Şirketi and Its SubsidiariesNotes to the Consolidated Financial Statements as of December 31, 2013 (Amounts expressed in Turkish Lira (“Tl”), unless otherwise indicated)
8786
The amount recognized as a provision is calculated by estimating the expenditure at the balance sheet date in order to fulfill these liabilities, taking into consideration the risks and uncertainties related to the liability.
In case of provision's measurement is calculated by estimated cash flow in order to meet current liability; related provision's book value is equal to the present value of the related cash flows.
In case of the needed economic benefits of provision's required payment is expected (a portion or all) to be paid from a third pary; they are recognized as assets if the following requirements are met: amount to be collected, the appropriate amount to be certainly collected, and reliably measured
n) Reporting of cash flows
In the cash flow statements, are based on cash flow operating for the period, investing and financing activities classified and reported.
Cash flows generating from operating activities shows the the cash flows generating from Group's main operating activities (textiles & garments for sale).
Cash flows related to investing activities shows the Group's cash flows used and obtained in the investment activities (asset investments &financial investments).
Cash flows related to financing activities show the resources used in financing activities of the Group and the repayment of these sources.
Cash and cash equivalents, comprise cash on hand and demand deposits and purchases from the date of maturity of 3 months or less than 3 months, readily convertible to cash, which may be significant changes in value of bearing risk with high liquidity and other short-term investments.
o) Subsequent events
Subsequent events related to the profit announcement or any other financial information disclosed to the public even if they occurred after the balance sheet date, it covers all events between the balance sheet and balance sheet date of authorization for publication.
Group, in case of subsequent events requiring adjustment after balance sheet date, the amounts are corrected according to this new situation in the financial statements.
p) Segmental reporting of financial information
A reportable segment is a section which carries out operation activities by which the entity can acquire proceeds and make expenditures and in which the results of operations are revised regularly by an authority making decisions regarding the operations of the entity in order to make decisions on resources to be allocated to the segment and to evaluate the performance of the segment and on which separate information is available.
Reportable segment information required to be disclosed is an operating segment. An operating segment as a reportable segment should be identified as; the portion of the proceeds of the majority sales acquisitions must be made from group’s external customers from sales acquisition and the proceeds from groups’ external customers and the proceeds from transactions of other segments with other departments, and all internal and external segments arising total revenue at least 10% or, profit or loss segment result of all segments in profit the total results in loss sum of the parts results in absolute terms, which is great at least 10% to hit or its assets all sections of the total assets must be consisting of at least 10% or more.
r) Government grants and incentives
Government incentives are not reflected in the financial statements; without the business fulfilment of the necessary conditions for obtaining that incentive which will and a reasonable assurance that they shall be obtained.
Government grants, intended to meet the costs of these incentives are reflected as an expense in profit or loss in a systematic manner throughout the periods. The government grants as a financing tool, rather than being accounted as a net off item profit or loss, should be associated with the statement of financial position (balance sheet) as unearned income, should be reflected in a systematic manner in profit or loss during the economic life of the related assets.
The Group is supported by the Scientific and Technological Research Council of Turkey (“TUBITAK”). TUBITAK carries out a program to organize and regulate the support of the Republic of Turkey in order to encourage research and technology development activities of industries in Turkey. Within the framework of this program, some part of the development expenses of industrial companies is reimbursed.
Government incentives granted in order to recover the expenses and losses incurred previously or to provide immediate finance support without causing the entity any cost in the future are recognized in profit or loss in the period in which they become collectable. The benefit of the loan taken from the government with an interest rate lower than that of the market is considered as government incentive. The benefit created by this lower interest rate is measured as the difference between the carrying value of the loan in the beginning and the acquired gains.
s) The critical decisions taken while applying the Group's accounting policies
Liability for employee termination benefits
The present values of employee termination liabilities are determined on an actuarial basis using certain assumptions. These assumptions are used in determining the net cost of employee termination liabilities and include the reduction in the rate. The carrying amount effects employee termination liability if any changes occur in these assumptions. Actuarial gains and losses are associated with the income statement in the period in which they arise.
The Group determines the appropriate discount rate at the end of each year. This rate of employee termination liabilities that are necessary for the fulfillment of the present value of estimated future cash outflows used in the calculation (Note 21).
Net realizable value of inventory
Inventories are stated at the lower of cost and net realizable value. The Group Management has determined that the cost of inventories is higher than the realizable value as of the reporting date. The impairment calculation requires management to estimate the future cash flows expected to arise from the sale of inventories and the estimated selling price less all estimated costs
Yünsa Yünlü Sanayi ve Ticaret Anonim Şirketi and Its SubsidiariesNotes to the Consolidated Financial Statements as of December 31, 2013 (Amounts expressed in Turkish Lira (“Tl”), unless otherwise indicated)
Yünsa Yünlü Sanayi ve Ticaret Anonim Şirketi and Its SubsidiariesNotes to the Consolidated Financial Statements as of December 31, 2013 (Amounts expressed in Turkish Lira (“Tl”), unless otherwise indicated)
8988
of completion and costs necessary to make the sale. Based on the estimation made by the Management as of December 31, 2013 the cost of inventories was reduced by TL 212.026 (December 31, 2012: TL 176.743) (Note 10).
Impairment of tangible and intangible assets
December 31, 2011 the tangible and intangible assets are tested for impairment. The recoverable amount is determined by calculating the value in use. The main assumptions used for value in use calculations are discount rates, growth rates, selling prices and direct costs. Discount rate is pre-tax rate that reflects the current market assessments of the time value of money and the risks specific to the asset. The discount rate method used by the Group is the weighted average cost of capital. Growth rate estimates are based on the relevant industry growth. Changes in selling prices and direct costs are based on past experience and future expectations. Calculating the value of the section is evaluated in terms of use. Group, has decreased sales cost from the fair value in the decrease of fair value work for its apparel segment’s building. Other assets have been utilized for value in use calculations. As of December 31, 2013 as a result of the investigation no indication of impairment has been detected.
Deferred tax
The Group statutory tax financial statements prepared in accordance with IFRS financial statements for the temporary differences arising from differences between the deferred tax assets and liabilities are recognized. These differences are usually some tax amounts of revenue and expenses in financial statements prepared in accordance with IFRS is due to take place in different periods. Can be downloaded from the Group's future profits and other deductible temporary differences, are unused tax losses and deferred tax assets. Deferred tax assets partially or fully recoverable amount is estimated under current conditions. During the assessment, projections of future profits, losses incurred in the current period, unused losses and other tax assets expiration dates and potential tax planning strategies were considered. Portable tax loss not exceeding five years , subject to period income can be reduced and the projected period of the Group is the high financial losses that may use the extent of taxable income the possibility of creating in accounting principle of prudence evaluated with the said financial losses deferred tax assets is calculated.
Doubtful receivables
Provision for doubtful receivables of the Group management as of the balance sheet date but current economic conditions existing in the collection risk of future losses on existing receivables that believed to be reflecting the amounts. Value of receivables be impaired while assessing the related companies and key customers outside the debtors' past performance on the market credibility and the balance sheet date the financial statements were approved until the date that performance with renegotiated conditions are taken into account. Provision for doubtful receivables as of the balance sheet date are reflected in Note 8.
Recovery of internally generated intangible assets
Development activities (or intra-group project's development phase) resulting from internally generated intangible assets ,only those assets are technically feasible to ready for use or sale, operating the asset completion, use, or intention to sell , the presence of intangible assets use or sell the facility , the presence of intangible assets probable future economic benefits how to build it can be demonstrated , as well as intangible assets output or the intangible asset itself existence of a market or within the business is to be used intangible assets to be available , the development phase is complete and the material use or sell of the intangible asset must be adequate technically , financial and other resources in the development process of the present and of the expenditures related to the intangible asset can be measured reliably are recognized. In case of internally generated intangible assets are not able to be recorded, development expenditure is recognized as an expense in the period they occur.
During the period, the Group management internally generated intangible assets has re-examine the existence of probable future economic benefits. The Group's management believes that the projects will continue as expected, and analysis of projects is expected to generate similar economic benefits. Management is sure to recover the registered values of the assets, even if economic benefits have decreased. This situation is being closely monitored by management and management of future market activity requires adjustment shall be made in cases where the correction comes.
Provisions
When provisions for lawsuits are reserved, the probabilty of losing the case and loss in case of losing the case is evaluated by the group's legal advisors' opinion, and the best estimates are made by using the data by the group management and the necessary provisions' explanations are located in Note 22.
Fair value of the derivative financial instruments and other financial instruments
Group, calculates the fair value of the financial instruments that do not have an active market by utilizing from market data, taking intto consideration of the similar instruments’ fair value and using discounted cash flow analysis.
3. BUSINESS COMBINATIONS
None. (2012: None).
4. BUSINESS PARTNERSHIPS
None (2012:None).
5. REPORTING BY SEGMENTS
As Group has started to implement the IFRS 8 from 1 January 2009, the operating segments are defined by the Group's decision-making authority regarding the activities regularly revised on internal reports. Group decision-making authority is the general manager and the board of directors.
Group's decision-making authority, examines the results and activities on the product types in order to make decisions about resources to be allocated to the departments and to evaluate the departments' performance. The Group's operating segments on the basis of the distribution of the business segments are as follows: textiles and garments.
Yünsa Yünlü Sanayi ve Ticaret Anonim Şirketi and Its SubsidiariesNotes to the Consolidated Financial Statements as of December 31, 2013 (Amounts expressed in Turkish Lira (“Tl”), unless otherwise indicated)
Yünsa Yünlü Sanayi ve Ticaret Anonim Şirketi and Its SubsidiariesNotes to the Consolidated Financial Statements as of December 31, 2013 (Amounts expressed in Turkish Lira (“Tl”), unless otherwise indicated)
9190
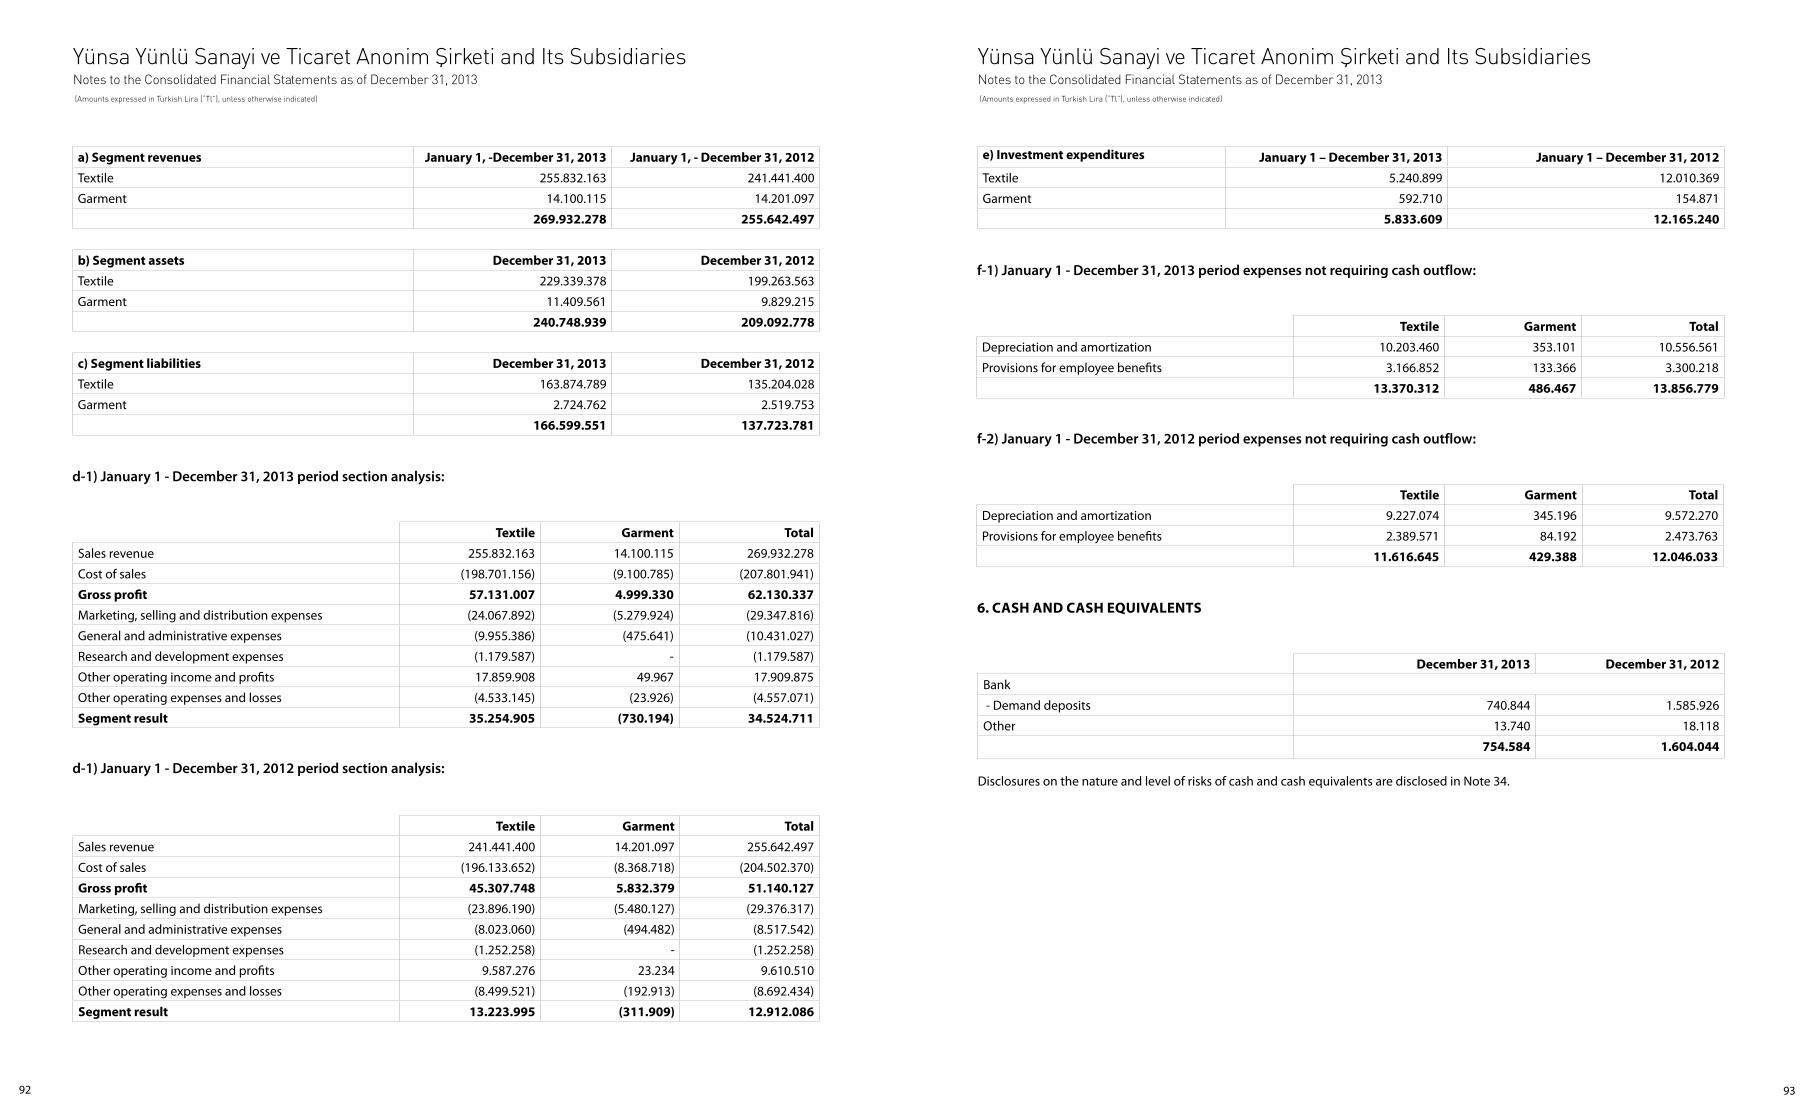
a) Segment revenues January 1, -December 31, 2013 January 1, - December 31, 2012
Textile 255.832.163 241.441.400
Garment 14.100.115 14.201.097
269.932.278 255.642.497
b) Segment assets December 31, 2013 December 31, 2012
Textile 229.339.378 199.263.563
Garment 11.409.561 9.829.215
240.748.939 209.092.778
c) Segment liabilities December 31, 2013 December 31, 2012
Textile 163.874.789 135.204.028
Garment 2.724.762 2.519.753
166.599.551 137.723.781
d-1) January 1 - December 31, 2013 period section analysis:
Textile Garment Total
Sales revenue 255.832.163 14.100.115 269.932.278
Cost of sales (198.701.156) (9.100.785) (207.801.941)
Gross profit 57.131.007 4.999.330 62.130.337
Marketing, selling and distribution expenses (24.067.892) (5.279.924) (29.347.816)
General and administrative expenses (9.955.386) (475.641) (10.431.027)
Research and development expenses (1.179.587) - (1.179.587)
Other operating income and profits 17.859.908 49.967 17.909.875
Other operating expenses and losses (4.533.145) (23.926) (4.557.071)
Segment result 35.254.905 (730.194) 34.524.711
d-1) January 1 - December 31, 2012 period section analysis:
Textile Garment Total
Sales revenue 241.441.400 14.201.097 255.642.497
Cost of sales (196.133.652) (8.368.718) (204.502.370)
Gross profit 45.307.748 5.832.379 51.140.127
Marketing, selling and distribution expenses (23.896.190) (5.480.127) (29.376.317)
General and administrative expenses (8.023.060) (494.482) (8.517.542)
Research and development expenses (1.252.258) - (1.252.258)
Other operating income and profits 9.587.276 23.234 9.610.510
Other operating expenses and losses (8.499.521) (192.913) (8.692.434)
Segment result 13.223.995 (311.909) 12.912.086
e) Investment expenditures January 1 – December 31, 2013 January 1 – December 31, 2012
Textile 5.240.899 12.010.369
Garment 592.710 154.871
5.833.609 12.165.240
f-1) January 1 - December 31, 2013 period expenses not requiring cash outflow:
f-2) January 1 - December 31, 2012 period expenses not requiring cash outflow:
Textile Garment Total
Depreciation and amortization 10.203.460 353.101 10.556.561
Provisions for employee benefits 3.166.852 133.366 3.300.218
13.370.312 486.467 13.856.779
Textile Garment Total
Depreciation and amortization 9.227.074 345.196 9.572.270
Provisions for employee benefits 2.389.571 84.192 2.473.763
11.616.645 429.388 12.046.033
6. CASH AND CASH EQUIVALENTS
Disclosures on the nature and level of risks of cash and cash equivalents are disclosed in Note 34.
December 31, 2013 December 31, 2012
Bank
- Demand deposits 740.844 1.585.926
Other 13.740 18.118
754.584 1.604.044
Yünsa Yünlü Sanayi ve Ticaret Anonim Şirketi and Its SubsidiariesNotes to the Consolidated Financial Statements as of December 31, 2013 (Amounts expressed in Turkish Lira (“Tl”), unless otherwise indicated)
Yünsa Yünlü Sanayi ve Ticaret Anonim Şirketi and Its SubsidiariesNotes to the Consolidated Financial Statements as of December 31, 2013 (Amounts expressed in Turkish Lira (“Tl”), unless otherwise indicated)
9392
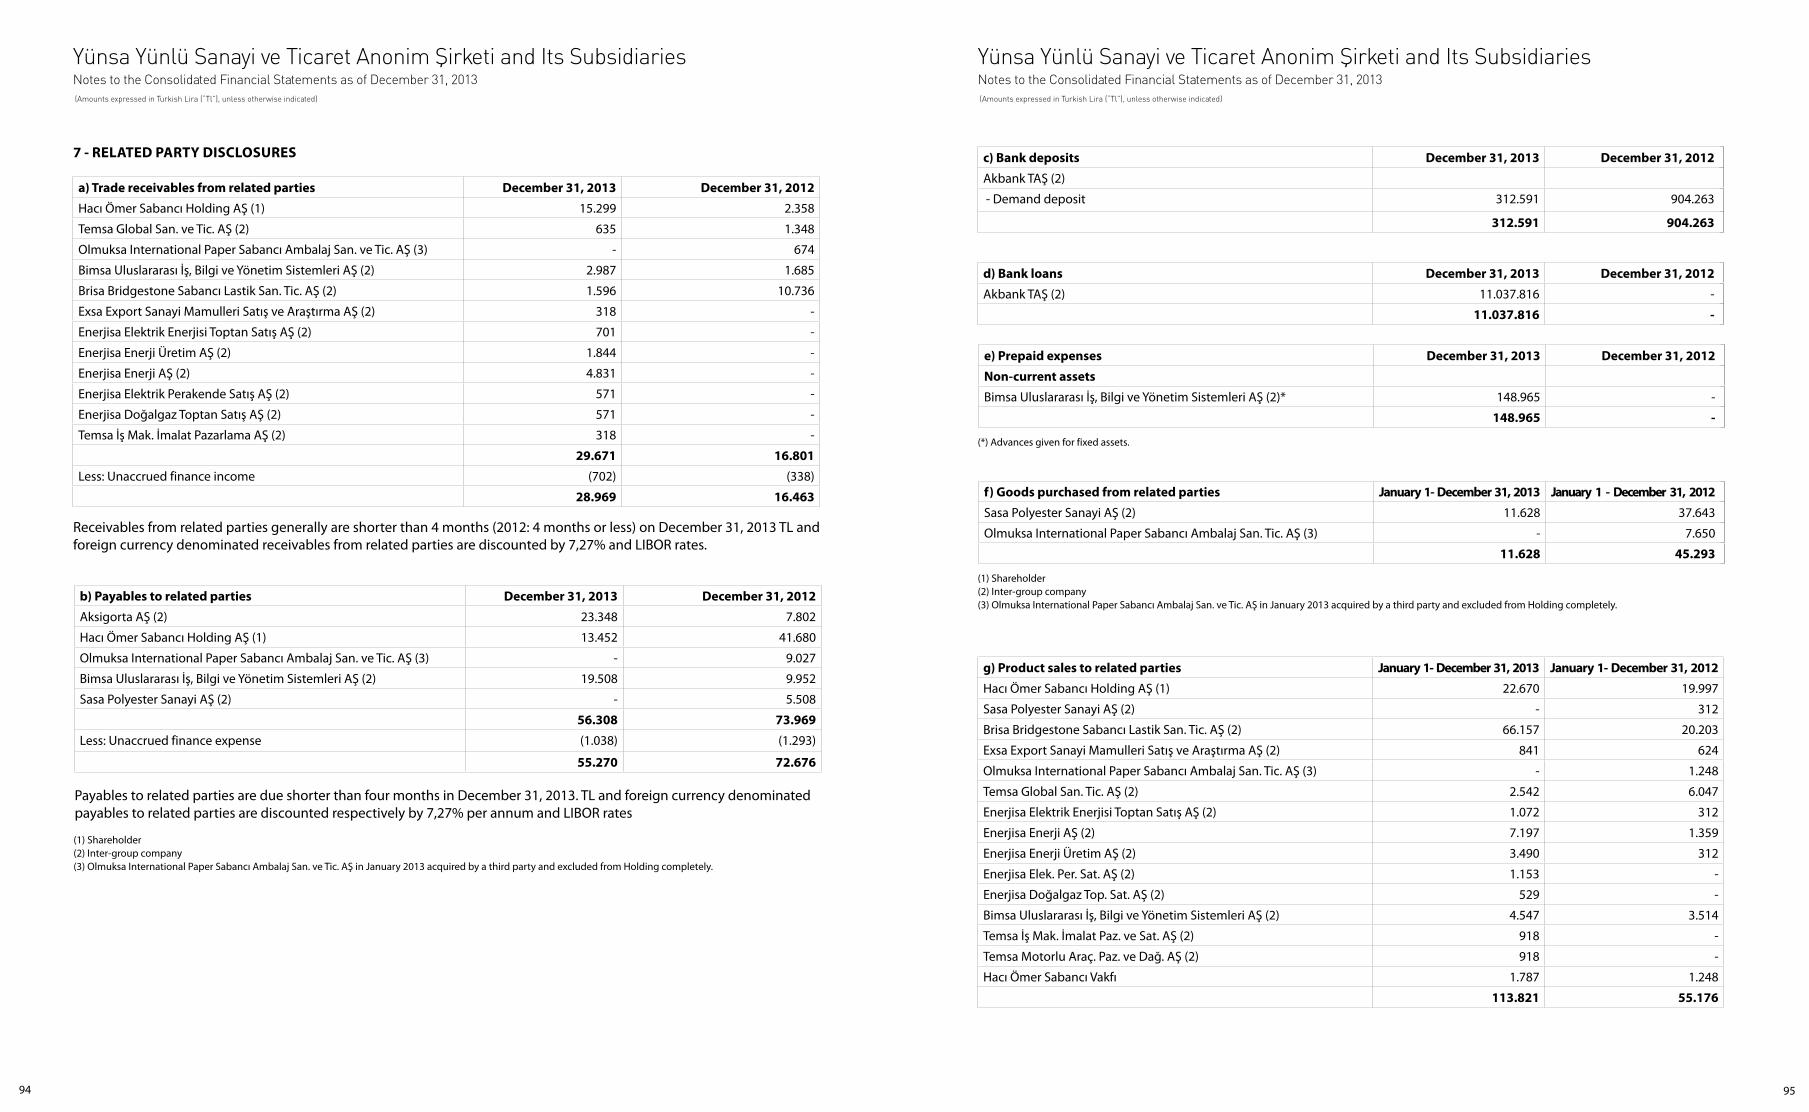
7 - RELATED PARTY DISCLOSURES
a) Trade receivables from related parties December 31, 2013 December 31, 2012
Hacı Ömer Sabancı Holding AŞ (1) 15.299 2.358
Temsa Global San. ve Tic. AŞ (2) 635 1.348
Olmuksa International Paper Sabancı Ambalaj San. ve Tic. AŞ (3) - 674
Bimsa Uluslararası İş, Bilgi ve Yönetim Sistemleri AŞ (2) 2.987 1.685
Brisa Bridgestone Sabancı Lastik San. Tic. AŞ (2) 1.596 10.736
Exsa Export Sanayi Mamulleri Satış ve Araştırma AŞ (2) 318 -
Enerjisa Elektrik Enerjisi Toptan Satış AŞ (2) 701 -
Enerjisa Enerji Üretim AŞ (2) 1.844 -
Enerjisa Enerji AŞ (2) 4.831 -
Enerjisa Elektrik Perakende Satış AŞ (2) 571 -
Enerjisa Doğalgaz Toptan Satış AŞ (2) 571 -
Temsa İş Mak. İmalat Pazarlama AŞ (2) 318 -
29.671 16.801
Less: Unaccrued finance income (702) (338)
28.969 16.463
b) Payables to related parties December 31, 2013 December 31, 2012
Aksigorta AŞ (2) 23.348 7.802
Hacı Ömer Sabancı Holding AŞ (1) 13.452 41.680
Olmuksa International Paper Sabancı Ambalaj San. ve Tic. AŞ (3) - 9.027
Bimsa Uluslararası İş, Bilgi ve Yönetim Sistemleri AŞ (2) 19.508 9.952
Sasa Polyester Sanayi AŞ (2) - 5.508
56.308 73.969
Less: Unaccrued finance expense (1.038) (1.293)
55.270 72.676
Payables to related parties are due shorter than four months in December 31, 2013. TL and foreign currency denominated payables to related parties are discounted respectively by 7,27% per annum and LIBOR rates
Receivables from related parties generally are shorter than 4 months (2012: 4 months or less) on December 31, 2013 TL and foreign currency denominated receivables from related parties are discounted by 7,27% and LIBOR rates.
c) Bank deposits December 31, 2013 December 31, 2012
Akbank TAŞ (2)
- Demand deposit 312.591 904.263
312.591 904.263
d) Bank loans December 31, 2013 December 31, 2012
Akbank TAŞ (2) 11.037.816 -
11.037.816 -
(1) Shareholder(2) Inter-group company(3) Olmuksa International Paper Sabancı Ambalaj San. ve Tic. AŞ in January 2013 acquired by a third party and excluded from Holding completely.
(*) Advances given for fixed assets.
(1) Shareholder(2) Inter-group company(3) Olmuksa International Paper Sabancı Ambalaj San. ve Tic. AŞ in January 2013 acquired by a third party and excluded from Holding completely.
e) Prepaid expenses December 31, 2013 December 31, 2012
Non-current assets
Bimsa Uluslararası İş, Bilgi ve Yönetim Sistemleri AŞ (2)* 148.965 -
148.965 -
f) Goods purchased from related parties January 1- December 31, 2013 January 1 - December 31, 2012
Sasa Polyester Sanayi AŞ (2) 11.628 37.643
Olmuksa International Paper Sabancı Ambalaj San. Tic. AŞ (3) - 7.650
11.628 45.293
g) Product sales to related parties January 1- December 31, 2013 January 1- December 31, 2012
Hacı Ömer Sabancı Holding AŞ (1) 22.670 19.997
Sasa Polyester Sanayi AŞ (2) - 312
Brisa Bridgestone Sabancı Lastik San. Tic. AŞ (2) 66.157 20.203
Exsa Export Sanayi Mamulleri Satış ve Araştırma AŞ (2) 841 624
Olmuksa International Paper Sabancı Ambalaj San. Tic. AŞ (3) - 1.248
Temsa Global San. Tic. AŞ (2) 2.542 6.047
Enerjisa Elektrik Enerjisi Toptan Satış AŞ (2) 1.072 312
Enerjisa Enerji AŞ (2) 7.197 1.359
Enerjisa Enerji Üretim AŞ (2) 3.490 312
Enerjisa Elek. Per. Sat. AŞ (2) 1.153 -
Enerjisa Doğalgaz Top. Sat. AŞ (2) 529 -
Bimsa Uluslararası İş, Bilgi ve Yönetim Sistemleri AŞ (2) 4.547 3.514
Temsa İş Mak. İmalat Paz. ve Sat. AŞ (2) 918 -
Temsa Motorlu Araç. Paz. ve Dağ. AŞ (2) 918 -
Hacı Ömer Sabancı Vakfı 1.787 1.248
113.821 55.176
Yünsa Yünlü Sanayi ve Ticaret Anonim Şirketi and Its SubsidiariesNotes to the Consolidated Financial Statements as of December 31, 2013 (Amounts expressed in Turkish Lira (“Tl”), unless otherwise indicated)
Yünsa Yünlü Sanayi ve Ticaret Anonim Şirketi and Its SubsidiariesNotes to the Consolidated Financial Statements as of December 31, 2013 (Amounts expressed in Turkish Lira (“Tl”), unless otherwise indicated)
9594
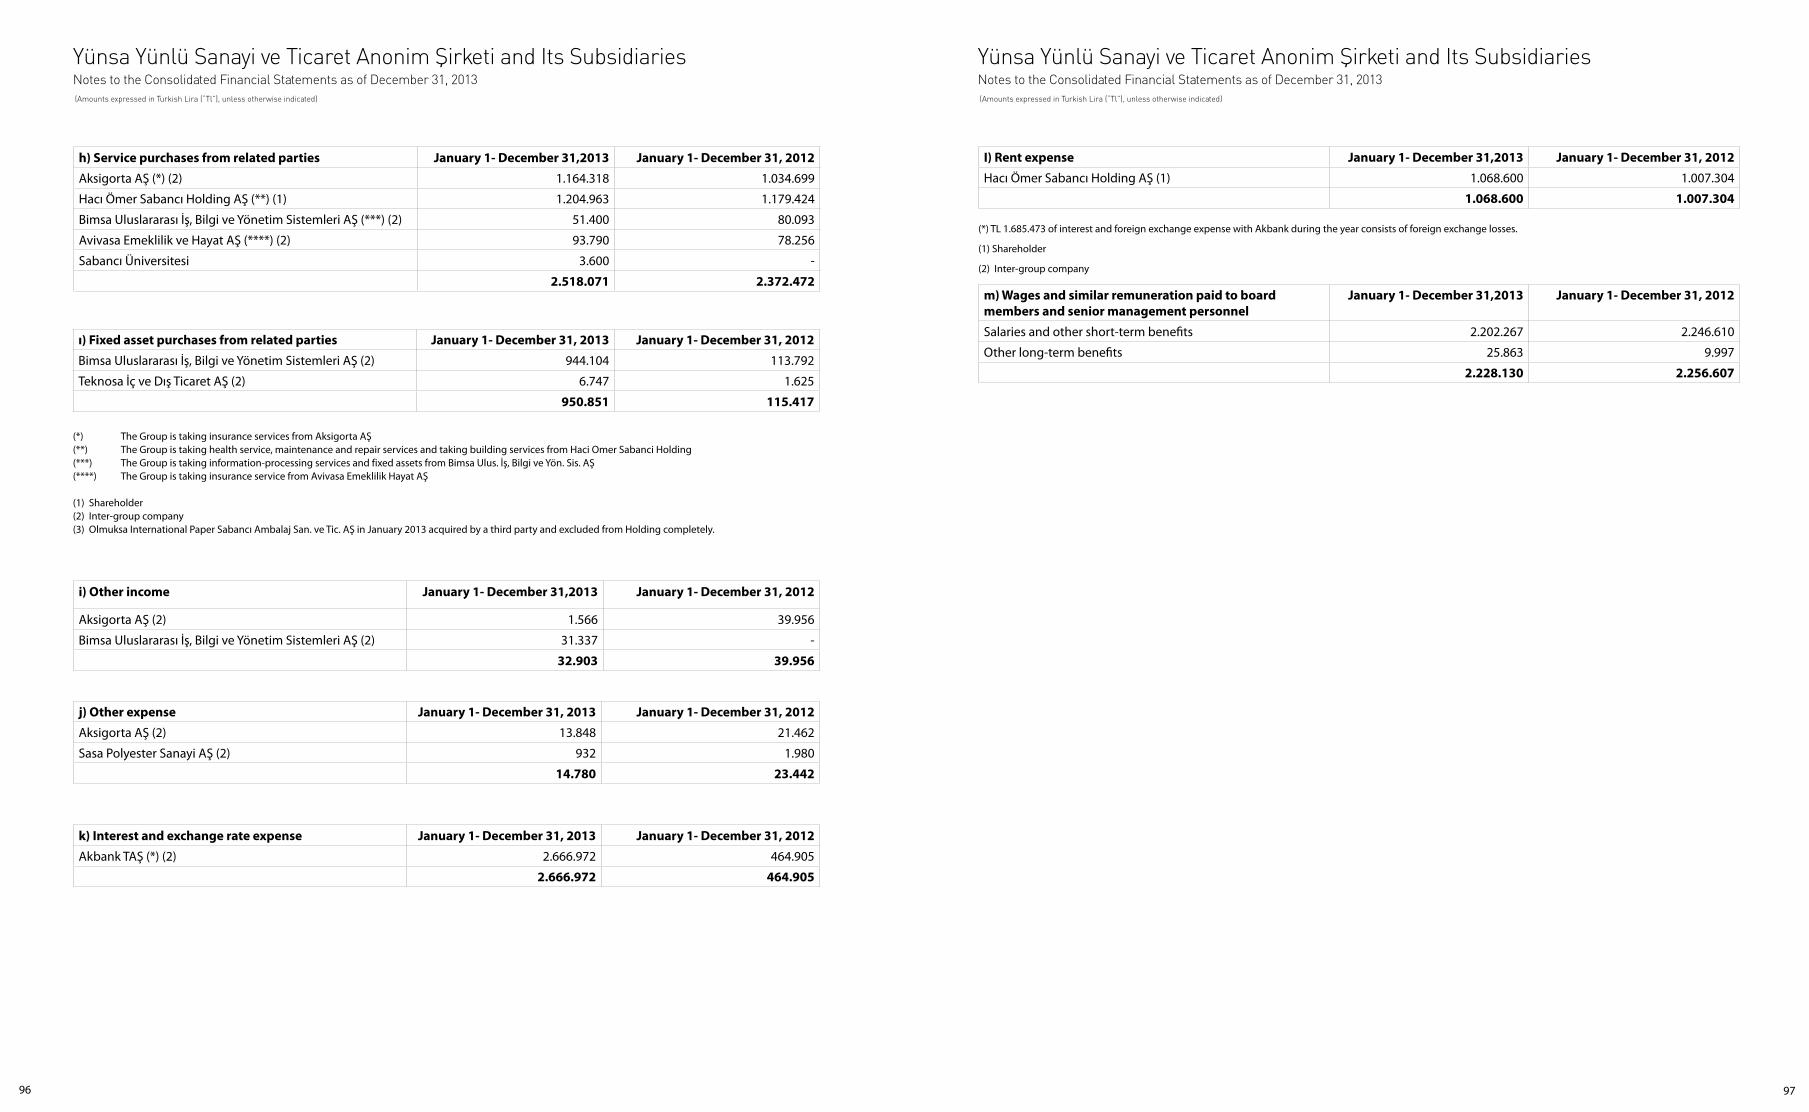
j) Other expense January 1- December 31, 2013 January 1- December 31, 2012
Aksigorta AŞ (2) 13.848 21.462
Sasa Polyester Sanayi AŞ (2) 932 1.980
14.780 23.442
k) Interest and exchange rate expense January 1- December 31, 2013 January 1- December 31, 2012
Akbank TAŞ (*) (2) 2.666.972 464.905
2.666.972 464.905
i) Other income January 1- December 31,2013 January 1- December 31, 2012
Aksigorta AŞ (2) 1.566 39.956
Bimsa Uluslararası İş, Bilgi ve Yönetim Sistemleri AŞ (2) 31.337 -
32.903 39.956
I) Rent expense January 1- December 31,2013 January 1- December 31, 2012
Hacı Ömer Sabancı Holding AŞ (1) 1.068.600 1.007.304
1.068.600 1.007.304
m) Wages and similar remuneration paid to boardmembers and senior management personnel
January 1- December 31,2013 January 1- December 31, 2012
Salaries and other short-term benefits 2.202.267 2.246.610
Other long-term benefits 25.863 9.997
2.228.130 2.256.607
(*) The Group is taking insurance services from Aksigorta AŞ (**) The Group is taking health service, maintenance and repair services and taking building services from Haci Omer Sabanci Holding (***) The Group is taking information-processing services and fixed assets from Bimsa Ulus. İş, Bilgi ve Yön. Sis. AŞ(****) The Group is taking insurance service from Avivasa Emeklilik Hayat AŞ
(1) Shareholder(2) Inter-group company(3) Olmuksa International Paper Sabancı Ambalaj San. ve Tic. AŞ in January 2013 acquired by a third party and excluded from Holding completely.
h) Service purchases from related parties January 1- December 31,2013 January 1- December 31, 2012
Aksigorta AŞ (*) (2) 1.164.318 1.034.699
Hacı Ömer Sabancı Holding AŞ (**) (1) 1.204.963 1.179.424
Bimsa Uluslararası İş, Bilgi ve Yönetim Sistemleri AŞ (***) (2) 51.400 80.093
Avivasa Emeklilik ve Hayat AŞ (****) (2) 93.790 78.256
Sabancı Üniversitesi 3.600 -
2.518.071 2.372.472
ı) Fixed asset purchases from related parties January 1- December 31, 2013 January 1- December 31, 2012
Bimsa Uluslararası İş, Bilgi ve Yönetim Sistemleri AŞ (2) 944.104 113.792
Teknosa İç ve Dış Ticaret AŞ (2) 6.747 1.625
950.851 115.417
Yünsa Yünlü Sanayi ve Ticaret Anonim Şirketi and Its SubsidiariesNotes to the Consolidated Financial Statements as of December 31, 2013 (Amounts expressed in Turkish Lira (“Tl”), unless otherwise indicated)
Yünsa Yünlü Sanayi ve Ticaret Anonim Şirketi and Its SubsidiariesNotes to the Consolidated Financial Statements as of December 31, 2013 (Amounts expressed in Turkish Lira (“Tl”), unless otherwise indicated)
(*) TL 1.685.473 of interest and foreign exchange expense with Akbank during the year consists of foreign exchange losses.
(1) Shareholder
(2) Inter-group company
9796
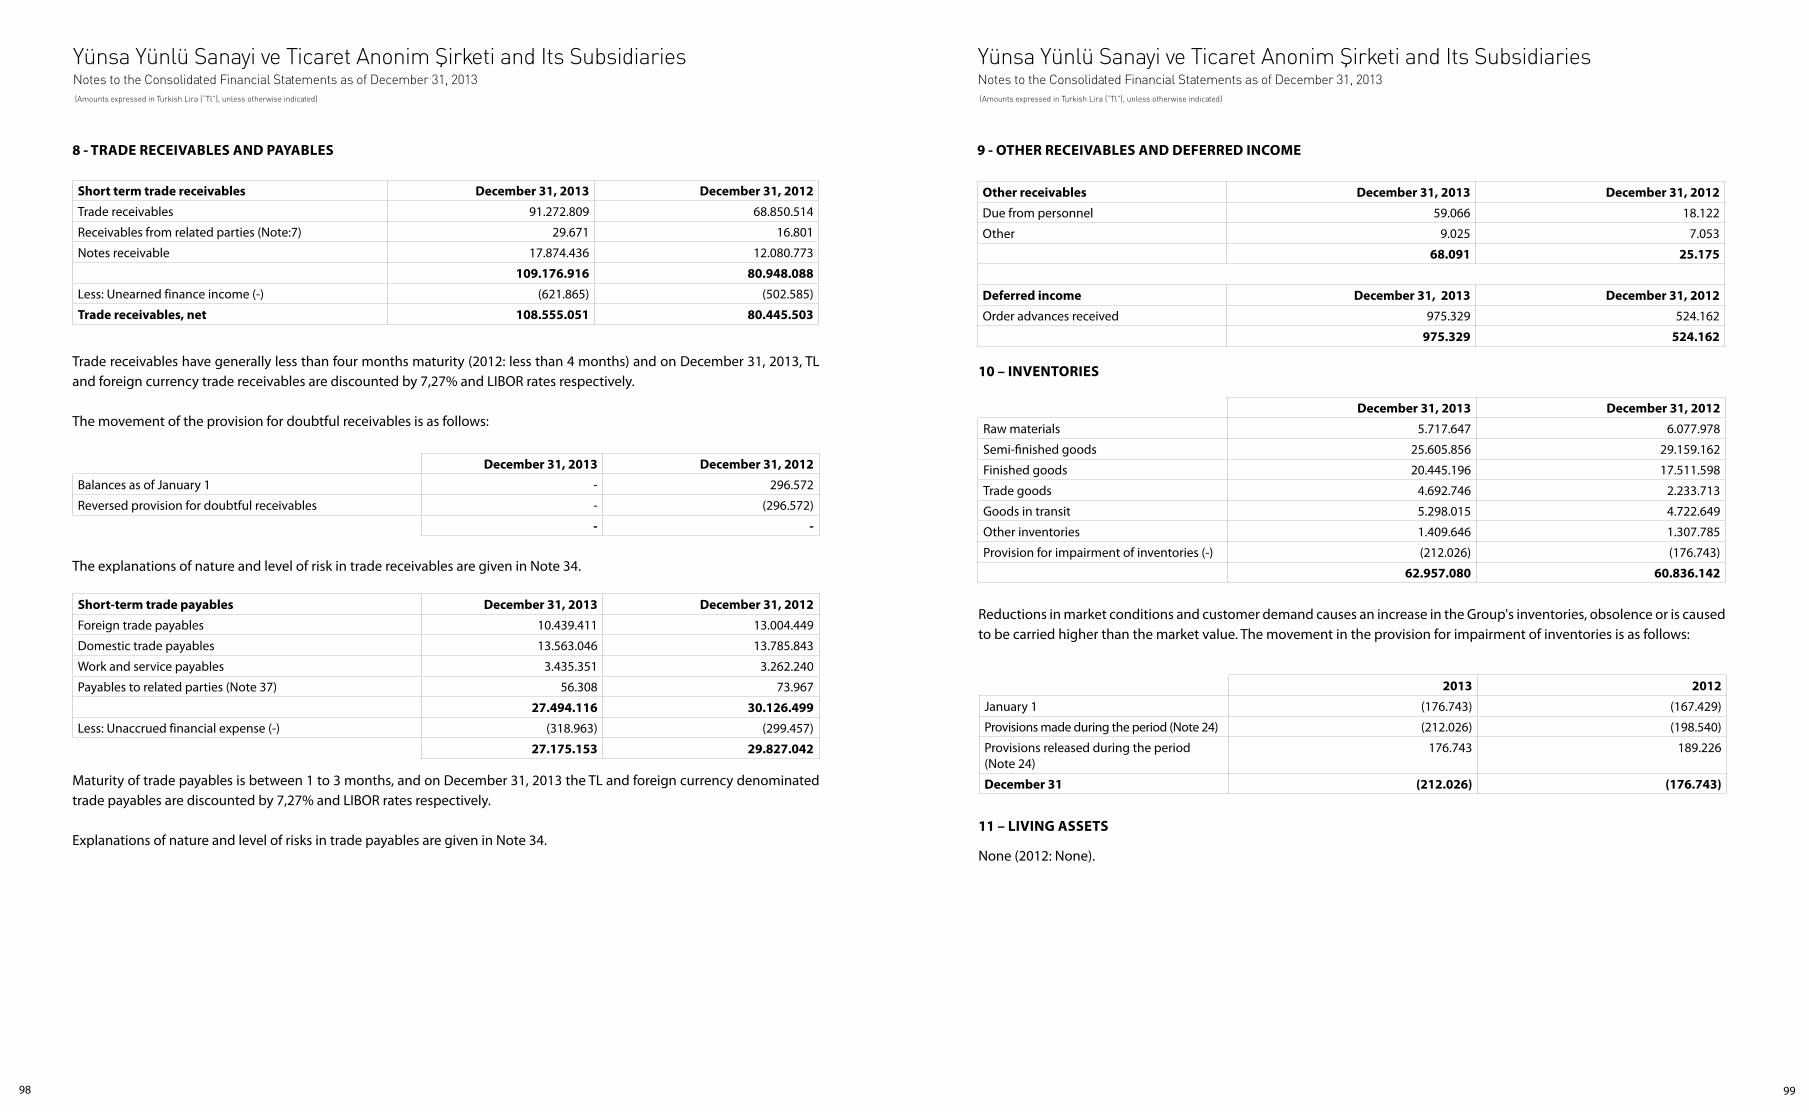
11 – LIVING ASSETS
None (2012: None).
10 – INVENTORIES
Reductions in market conditions and customer demand causes an increase in the Group's inventories, obsolence or is caused to be carried higher than the market value. The movement in the provision for impairment of inventories is as follows:
December 31, 2013 December 31, 2012
Raw materials 5.717.647 6.077.978
Semi-finished goods 25.605.856 29.159.162
Finished goods 20.445.196 17.511.598
Trade goods 4.692.746 2.233.713
Goods in transit 5.298.015 4.722.649
Other inventories 1.409.646 1.307.785
Provision for impairment of inventories (-) (212.026) (176.743)
62.957.080 60.836.142
2013 2012
January 1 (176.743) (167.429)
Provisions made during the period (Note 24) (212.026) (198.540)
Provisions released during the period (Note 24)
176.743 189.226
December 31 (212.026) (176.743)
9 - OTHER RECEIVABLES AND DEFERRED INCOME
Other receivables December 31, 2013 December 31, 2012
Due from personnel 59.066 18.122
Other 9.025 7.053
68.091 25.175
Deferred income December 31, 2013 December 31, 2012
Order advances received 975.329 524.162
975.329 524.162
Trade receivables have generally less than four months maturity (2012: less than 4 months) and on December 31, 2013, TL and foreign currency trade receivables are discounted by 7,27% and LIBOR rates respectively.
The movement of the provision for doubtful receivables is as follows:
December 31, 2013 December 31, 2012
Balances as of January 1 - 296.572
Reversed provision for doubtful receivables - (296.572)
- -
8 - TRADE RECEIVABLES AND PAYABLES
Short term trade receivables December 31, 2013 December 31, 2012
Trade receivables 91.272.809 68.850.514
Receivables from related parties (Note:7) 29.671 16.801
Notes receivable 17.874.436 12.080.773
109.176.916 80.948.088
Less: Unearned finance income (-) (621.865) (502.585)
Trade receivables, net 108.555.051 80.445.503
Maturity of trade payables is between 1 to 3 months, and on December 31, 2013 the TL and foreign currency denominated trade payables are discounted by 7,27% and LIBOR rates respectively.
Explanations of nature and level of risks in trade payables are given in Note 34.
Short-term trade payables December 31, 2013 December 31, 2012
Foreign trade payables 10.439.411 13.004.449
Domestic trade payables 13.563.046 13.785.843
Work and service payables 3.435.351 3.262.240
Payables to related parties (Note 37) 56.308 73.967
27.494.116 30.126.499
Less: Unaccrued financial expense (-) (318.963) (299.457)
27.175.153 29.827.042
The explanations of nature and level of risk in trade receivables are given in Note 34.
Yünsa Yünlü Sanayi ve Ticaret Anonim Şirketi and Its SubsidiariesNotes to the Consolidated Financial Statements as of December 31, 2013 (Amounts expressed in Turkish Lira (“Tl”), unless otherwise indicated)
Yünsa Yünlü Sanayi ve Ticaret Anonim Şirketi and Its SubsidiariesNotes to the Consolidated Financial Statements as of December 31, 2013 (Amounts expressed in Turkish Lira (“Tl”), unless otherwise indicated)
9998
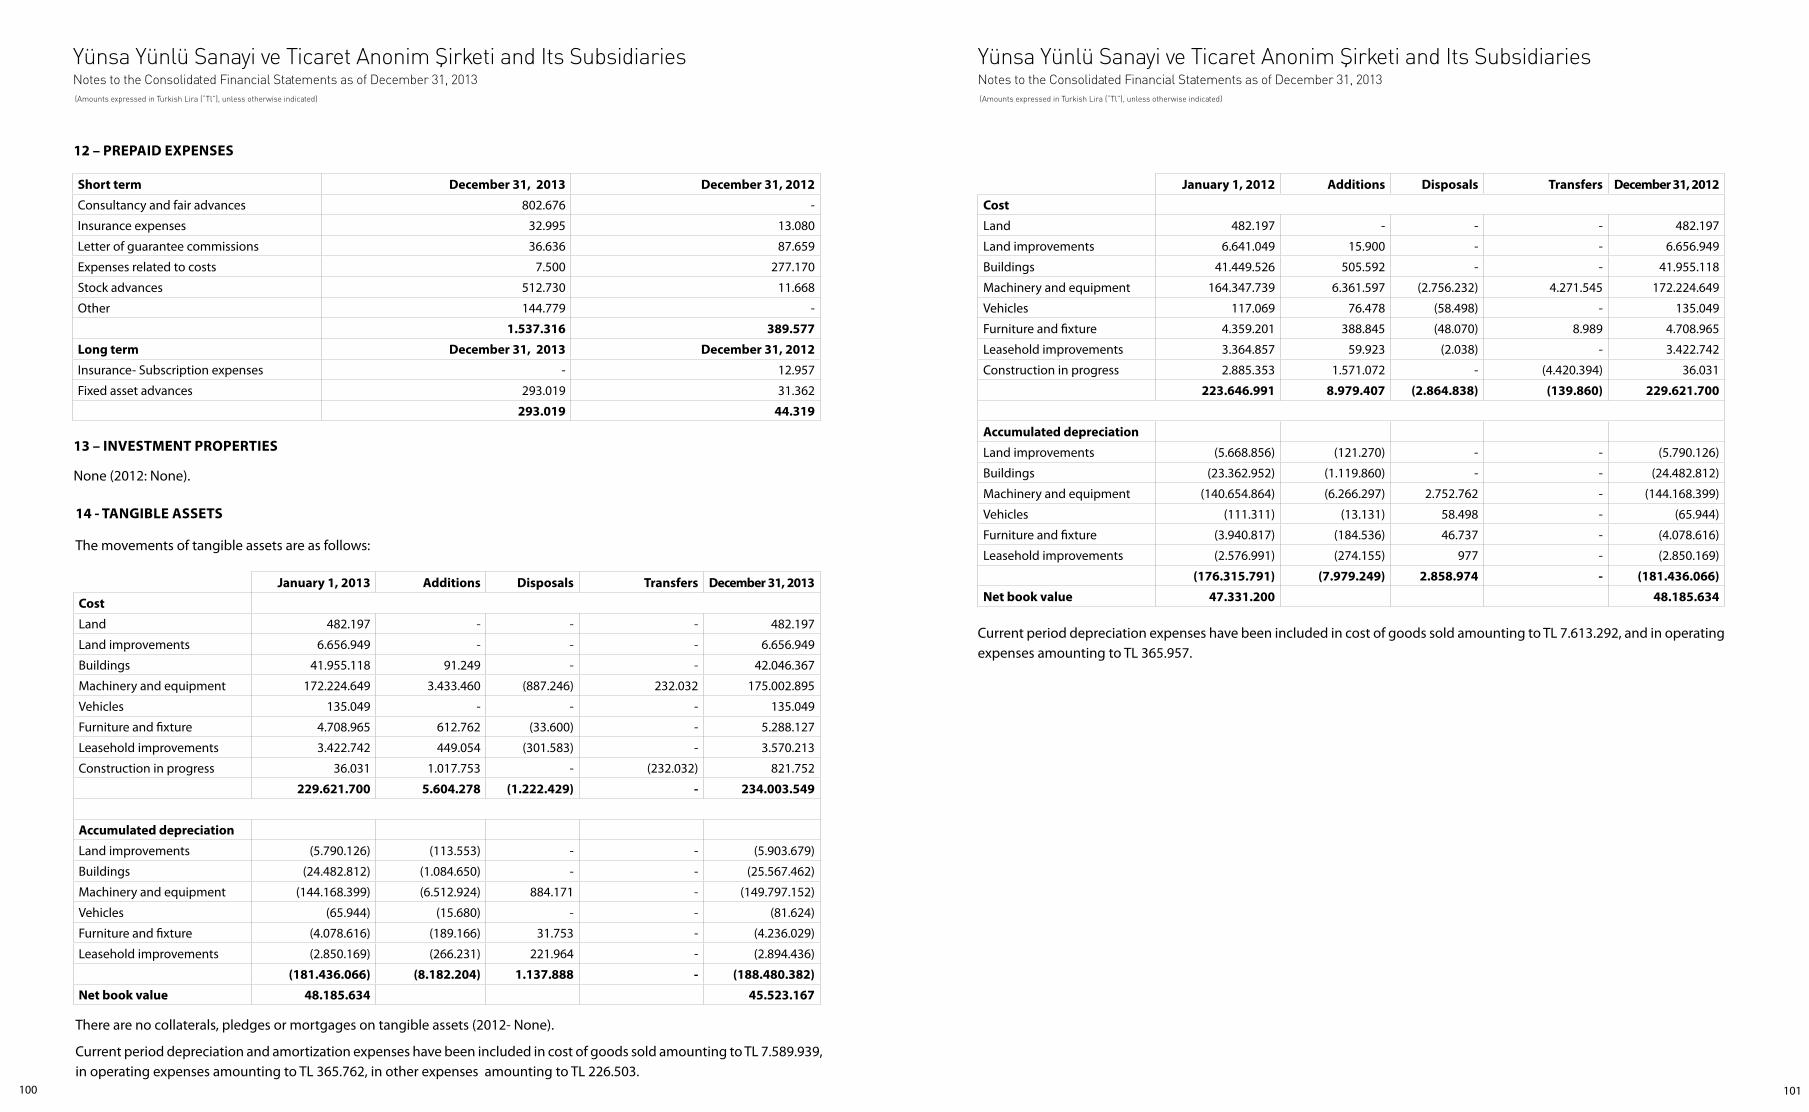
14 - TANGIBLE ASSETS
The movements of tangible assets are as follows:
Current period depreciation expenses have been included in cost of goods sold amounting to TL 7.613.292, and in operating expenses amounting to TL 365.957.
There are no collaterals, pledges or mortgages on tangible assets (2012- None).
Current period depreciation and amortization expenses have been included in cost of goods sold amounting to TL 7.589.939, in operating expenses amounting to TL 365.762, in other expenses amounting to TL 226.503.
January 1, 2012 Additions Disposals Transfers December 31, 2012
Cost
Land 482.197 - - - 482.197
Land improvements 6.641.049 15.900 - - 6.656.949
Buildings 41.449.526 505.592 - - 41.955.118
Machinery and equipment 164.347.739 6.361.597 (2.756.232) 4.271.545 172.224.649
Vehicles 117.069 76.478 (58.498) - 135.049
Furniture and fixture 4.359.201 388.845 (48.070) 8.989 4.708.965
Leasehold improvements 3.364.857 59.923 (2.038) - 3.422.742
Construction in progress 2.885.353 1.571.072 - (4.420.394) 36.031
223.646.991 8.979.407 (2.864.838) (139.860) 229.621.700
Accumulated depreciation
Land improvements (5.668.856) (121.270) - - (5.790.126)
Buildings (23.362.952) (1.119.860) - - (24.482.812)
Machinery and equipment (140.654.864) (6.266.297) 2.752.762 - (144.168.399)
Vehicles (111.311) (13.131) 58.498 - (65.944)
Furniture and fixture (3.940.817) (184.536) 46.737 - (4.078.616)
Leasehold improvements (2.576.991) (274.155) 977 - (2.850.169)
(176.315.791) (7.979.249) 2.858.974 - (181.436.066)
Net book value 47.331.200 48.185.634January 1, 2013 Additions Disposals Transfers December 31, 2013
Cost
Land 482.197 - - - 482.197
Land improvements 6.656.949 - - - 6.656.949
Buildings 41.955.118 91.249 - - 42.046.367
Machinery and equipment 172.224.649 3.433.460 (887.246) 232.032 175.002.895
Vehicles 135.049 - - - 135.049
Furniture and fixture 4.708.965 612.762 (33.600) - 5.288.127
Leasehold improvements 3.422.742 449.054 (301.583) - 3.570.213
Construction in progress 36.031 1.017.753 - (232.032) 821.752
229.621.700 5.604.278 (1.222.429) - 234.003.549
Accumulated depreciation
Land improvements (5.790.126) (113.553) - - (5.903.679)
Buildings (24.482.812) (1.084.650) - - (25.567.462)
Machinery and equipment (144.168.399) (6.512.924) 884.171 - (149.797.152)
Vehicles (65.944) (15.680) - - (81.624)
Furniture and fixture (4.078.616) (189.166) 31.753 - (4.236.029)
Leasehold improvements (2.850.169) (266.231) 221.964 - (2.894.436)
(181.436.066) (8.182.204) 1.137.888 - (188.480.382)
Net book value 48.185.634 45.523.167
13 – INVESTMENT PROPERTIES
None (2012: None).
12 – PREPAID EXPENSES
Short term December 31, 2013 December 31, 2012
Consultancy and fair advances 802.676 -
Insurance expenses 32.995 13.080
Letter of guarantee commissions 36.636 87.659
Expenses related to costs 7.500 277.170
Stock advances 512.730 11.668
Other 144.779 -
1.537.316 389.577
Long term December 31, 2013 December 31, 2012
Insurance- Subscription expenses - 12.957
Fixed asset advances 293.019 31.362
293.019 44.319
Yünsa Yünlü Sanayi ve Ticaret Anonim Şirketi and Its SubsidiariesNotes to the Consolidated Financial Statements as of December 31, 2013 (Amounts expressed in Turkish Lira (“Tl”), unless otherwise indicated)
Yünsa Yünlü Sanayi ve Ticaret Anonim Şirketi and Its SubsidiariesNotes to the Consolidated Financial Statements as of December 31, 2013 (Amounts expressed in Turkish Lira (“Tl”), unless otherwise indicated)
101100

19 - PROVISIONS, CONTINGENT ASSETS AND CONTINGENT LIABILITIES
Guarantees received has been received essentially regarding the sale made from customers. The associated part of letter of guarntee received with financial risks are shown in Note 33. Company's exports are also insured by Turkish Eximbank.
(*) Group, as a result of Research and Development Center application, has been granted to obtain, Industry and Trade Ministry's Research and Development Center Certificate on October 25, 2010 consists of the incentive amount received according to 5746 numbered Research and Development Activities in Support of the Law on the framework provided in the amount of Research and Development Center staff on the wages benefited income Tax, Stamp Tax, Social Security incentives and TUBITAK.
Government incentives, as a finance tool in order to clarify their expenditure item instead of accounting in profit or loss, rather than investment costs reduction as an element statement of financial position (balance sheet) has been associated with and related assets over the useful lives on a systematic basis in profit or loss is recognized.
Contingent assets and liabilities December 31, 2013 December 31, 2012
Bails received and guarantee notes 7.890.646 6.841.770
Received letters of guarantee 5.877.471 4.092.600
Mortgages 655.050 390.050
14.423.167 11.324.420
December 31, 2013 December 31, 2012
R&D projects incentive (*) 2.399.150 1.639.711
2.399.150 1.639.711
18 - FINANCIAL LIABILITIES - BORROWING COSTS
17 - GOVERNMENT INCENTIVES AND GRANTS
Explanations of nature and level of risks in financial liabilities are given in Note 34.
December 31, 2013 December 31, 2012
Weighted average annual effective interest rate %
TLWeighted average
annual effective interest rate %
TL
Short term bank loans
TL borrowings 7,27 59.485.000 7,15 52.230.000
Euro borrowings 2,08 32.464.476 1,96 27.670.102
USD borrowings 2,03 19.140.936 2,78 11.670.682
Pound borrowings 2,90 5.307.481 4,44 2.912.427
Total 116.397.893 94.483.211
Interest accrual 500.345 805.767
116.898.238 95.288.978
16 – GOODWILL
None (2012: None).
15 - INTANGIBLE ASSETS
Current period’s amortization portion amounting to TL 1.553.463 has been included to cost of good sold and TL 39.558 has been included in operating expenses.
There are no collaterals, pledges or mortgages on tangible assets (2012- None).
Current period amortization has been included in the cost of goods sold amounting to TL 2.271.008, TL 49.111 in operating expenses, TL 54.238 has been included in other expenses from operations.
January 1, 2012 Additions Disposals Transfers December 31, 2012
Cost
Rights 334.534 30.503 - - 365.037
Software programs 4.891.528 494.142 (936.405) 139.860 4.589.125
R&D projects 3.763.049 2.177.623 - - 5.940.672
8.989.111 2.702.268 (936.405) 139.860 10.894.834
Accumulated depreciation
Rights (281.212) (17.535) - - (298.747)
Software programs (3.092.316) (765.977) 931.577 - (2.926.716)
R&D projects (323.504) (809.509) - - (1.133.013)
(3.697.032) (1.593.021) 931.577 - (4.358.476)
Net book value 5.292.079 6.536.358
January 1, 2013 Additions Disposals Transfers December 31, 2013
Cost
Rights 365.037 - (13.654) - 351.383
Software programs 4.589.125 1.028.101 (1.745) - 5.615.481
R&D projects inprogress 5.940.672 3.845.608 - - 9.786.280
10.894.834 4.873.709 (15.399) - 15.753.144
Accumulated depreciation
Rights (298.747) (20.847) 13.654 - (305.940)
Software programs (2.926.716) (926.428) 1.745 - (3.851.399)
R&D projects (1.133.013) (1.427.083) - - (2.560.096)
(4.358.476) (2.374.358) 15.399 - (6.717.435)
Net book value 6.536.358 9.035.709
Yünsa Yünlü Sanayi ve Ticaret Anonim Şirketi and Its SubsidiariesNotes to the Consolidated Financial Statements as of December 31, 2013 (Amounts expressed in Turkish Lira (“Tl”), unless otherwise indicated)
Yünsa Yünlü Sanayi ve Ticaret Anonim Şirketi and Its SubsidiariesNotes to the Consolidated Financial Statements as of December 31, 2013 (Amounts expressed in Turkish Lira (“Tl”), unless otherwise indicated)
103102
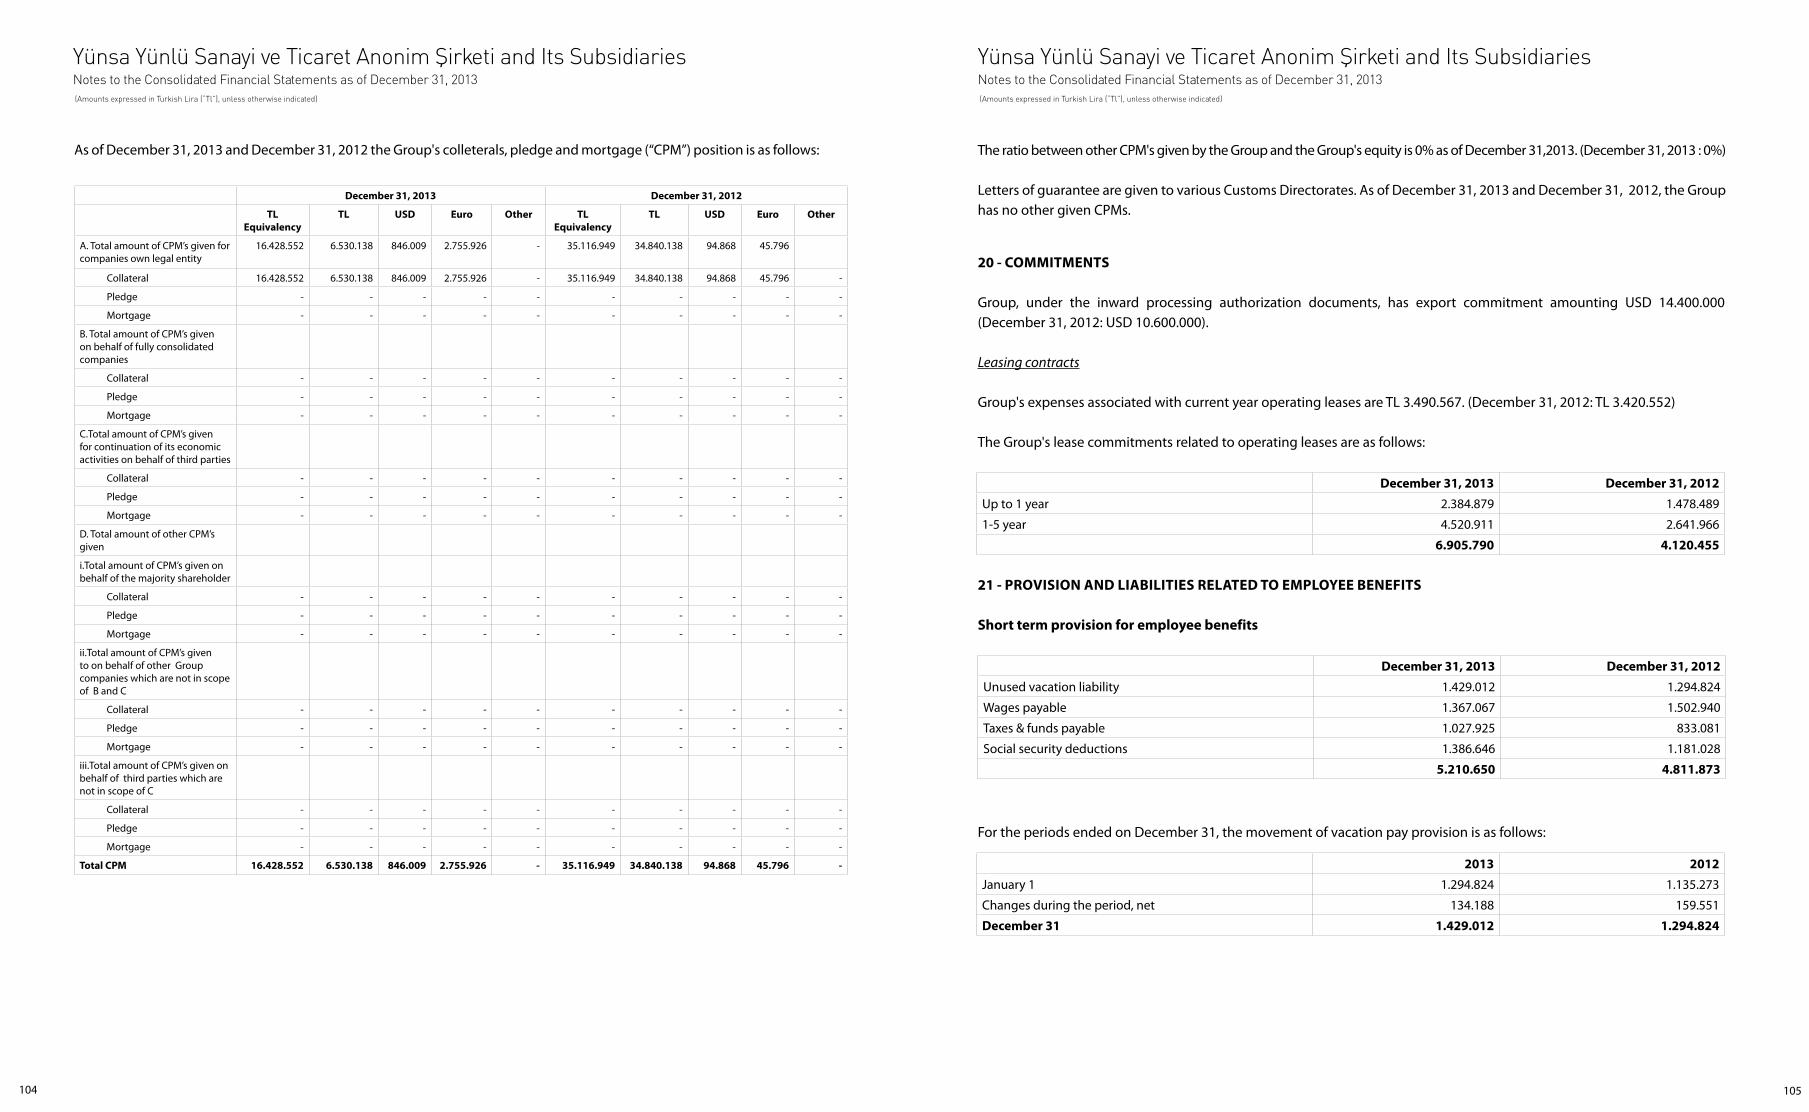
2013 2012
January 1 1.294.824 1.135.273
Changes during the period, net 134.188 159.551
December 31 1.429.012 1.294.824
December 31, 2013 December 31, 2012
Up to 1 year 2.384.879 1.478.489
1-5 year 4.520.911 2.641.966
6.905.790 4.120.455
For the periods ended on December 31, the movement of vacation pay provision is as follows:
December 31, 2013 December 31, 2012
Unused vacation liability 1.429.012 1.294.824
Wages payable 1.367.067 1.502.940
Taxes & funds payable 1.027.925 833.081
Social security deductions 1.386.646 1.181.028
5.210.650 4.811.873
21 - PROVISION AND LIABILITIES RELATED TO EMPLOYEE BENEFITS
Short term provision for employee benefits
20 - COMMITMENTS
Group, under the inward processing authorization documents, has export commitment amounting USD 14.400.000 (December 31, 2012: USD 10.600.000).
Leasing contracts
Group's expenses associated with current year operating leases are TL 3.490.567. (December 31, 2012: TL 3.420.552)
The Group's lease commitments related to operating leases are as follows:
The ratio between other CPM's given by the Group and the Group's equity is 0% as of December 31,2013. (December 31, 2013 : 0%)
Letters of guarantee are given to various Customs Directorates. As of December 31, 2013 and December 31, 2012, the Group has no other given CPMs.
December 31, 2013 December 31, 2012
TL Equivalency
TL USD Euro Other TL Equivalency
TL USD Euro Other
A. Total amount of CPM’s given for companies own legal entity
16.428.552 6.530.138 846.009 2.755.926 - 35.116.949 34.840.138 94.868 45.796
Collateral 16.428.552 6.530.138 846.009 2.755.926 - 35.116.949 34.840.138 94.868 45.796 -
Pledge - - - - - - - - - -
Mortgage - - - - - - - - - -
B. Total amount of CPM’s given on behalf of fully consolidated companies
Collateral - - - - - - - - - -
Pledge - - - - - - - - - -
Mortgage - - - - - - - - - -
C.Total amount of CPM’s given for continuation of its economic activities on behalf of third parties
Collateral - - - - - - - - - -
Pledge - - - - - - - - - -
Mortgage - - - - - - - - - -
D. Total amount of other CPM’s given
i.Total amount of CPM’s given onbehalf of the majority shareholder
Collateral - - - - - - - - - -
Pledge - - - - - - - - - -
Mortgage - - - - - - - - - -
ii.Total amount of CPM’s given to on behalf of other Group companies which are not in scope of B and C
Collateral - - - - - - - - - -
Pledge - - - - - - - - - -
Mortgage - - - - - - - - - -
iii.Total amount of CPM’s given on behalf of third parties which are not in scope of C
Collateral - - - - - - - - - -
Pledge - - - - - - - - - -
Mortgage - - - - - - - - - -
Total CPM 16.428.552 6.530.138 846.009 2.755.926 - 35.116.949 34.840.138 94.868 45.796 -
As of December 31, 2013 and December 31, 2012 the Group's colleterals, pledge and mortgage (“CPM”) position is as follows:
Yünsa Yünlü Sanayi ve Ticaret Anonim Şirketi and Its SubsidiariesNotes to the Consolidated Financial Statements as of December 31, 2013 (Amounts expressed in Turkish Lira (“Tl”), unless otherwise indicated)
Yünsa Yünlü Sanayi ve Ticaret Anonim Şirketi and Its SubsidiariesNotes to the Consolidated Financial Statements as of December 31, 2013 (Amounts expressed in Turkish Lira (“Tl”), unless otherwise indicated)
105104
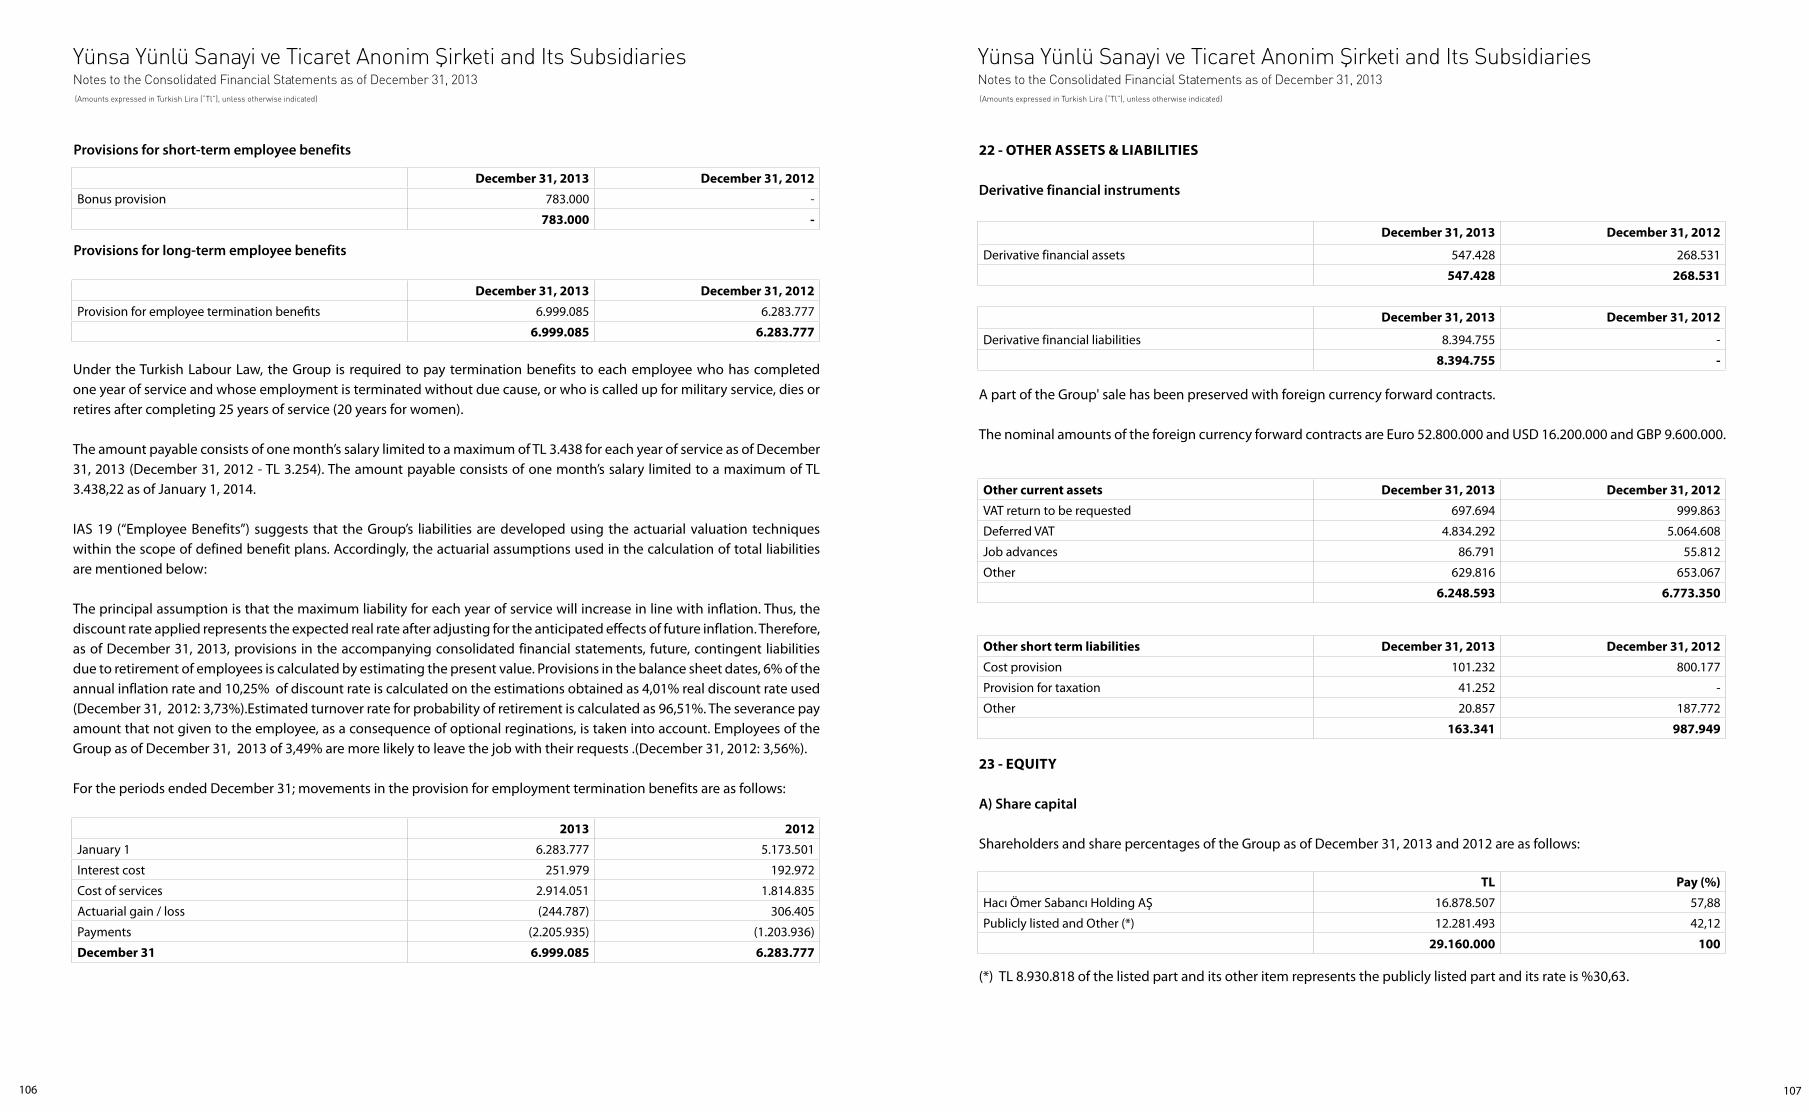
TL Pay (%)
Hacı Ömer Sabancı Holding AŞ 16.878.507 57,88
Publicly listed and Other (*) 12.281.493 42,12
29.160.000 100
2013 2012
January 1 6.283.777 5.173.501
Interest cost 251.979 192.972
Cost of services 2.914.051 1.814.835
Actuarial gain / loss (244.787) 306.405
Payments (2.205.935) (1.203.936)
December 31 6.999.085 6.283.777
December 31, 2013 December 31, 2012
Provision for employee termination benefits 6.999.085 6.283.777
6.999.085 6.283.777
December 31, 2013 December 31, 2012
Bonus provision 783.000 -
783.000 -
Other short term liabilities December 31, 2013 December 31, 2012
Cost provision 101.232 800.177
Provision for taxation 41.252 -
Other 20.857 187.772
163.341 987.949
December 31, 2013 December 31, 2012
Derivative financial liabilities 8.394.755 -
8.394.755 -
December 31, 2013 December 31, 2012
Derivative financial assets 547.428 268.531
547.428 268.531
Other current assets December 31, 2013 December 31, 2012
VAT return to be requested 697.694 999.863
Deferred VAT 4.834.292 5.064.608
Job advances 86.791 55.812
Other 629.816 653.067
6.248.593 6.773.350
23 - EQUITY
A) Share capital
Shareholders and share percentages of the Group as of December 31, 2013 and 2012 are as follows:
Provisions for long-term employee benefits
Provisions for short-term employee benefits 22 - OTHER ASSETS & LIABILITIES
Derivative financial instruments
(*) TL 8.930.818 of the listed part and its other item represents the publicly listed part and its rate is %30,63.
A part of the Group' sale has been preserved with foreign currency forward contracts.
The nominal amounts of the foreign currency forward contracts are Euro 52.800.000 and USD 16.200.000 and GBP 9.600.000.
Under the Turkish Labour Law, the Group is required to pay termination benefits to each employee who has completed one year of service and whose employment is terminated without due cause, or who is called up for military service, dies or retires after completing 25 years of service (20 years for women).
The amount payable consists of one month’s salary limited to a maximum of TL 3.438 for each year of service as of December 31, 2013 (December 31, 2012 - TL 3.254). The amount payable consists of one month’s salary limited to a maximum of TL 3.438,22 as of January 1, 2014.
IAS 19 (“Employee Benefits”) suggests that the Group’s liabilities are developed using the actuarial valuation techniques within the scope of defined benefit plans. Accordingly, the actuarial assumptions used in the calculation of total liabilities are mentioned below:
The principal assumption is that the maximum liability for each year of service will increase in line with inflation. Thus, the discount rate applied represents the expected real rate after adjusting for the anticipated effects of future inflation. Therefore, as of December 31, 2013, provisions in the accompanying consolidated financial statements, future, contingent liabilities due to retirement of employees is calculated by estimating the present value. Provisions in the balance sheet dates, 6% of the annual inflation rate and 10,25% of discount rate is calculated on the estimations obtained as 4,01% real discount rate used (December 31, 2012: 3,73%).Estimated turnover rate for probability of retirement is calculated as 96,51%. The severance pay amount that not given to the employee, as a consequence of optional reginations, is taken into account. Employees of the Group as of December 31, 2013 of 3,49% are more likely to leave the job with their requests .(December 31, 2012: 3,56%).
For the periods ended December 31; movements in the provision for employment termination benefits are as follows:
Yünsa Yünlü Sanayi ve Ticaret Anonim Şirketi and Its SubsidiariesNotes to the Consolidated Financial Statements as of December 31, 2013 (Amounts expressed in Turkish Lira (“Tl”), unless otherwise indicated)
Yünsa Yünlü Sanayi ve Ticaret Anonim Şirketi and Its SubsidiariesNotes to the Consolidated Financial Statements as of December 31, 2013 (Amounts expressed in Turkish Lira (“Tl”), unless otherwise indicated)
107106
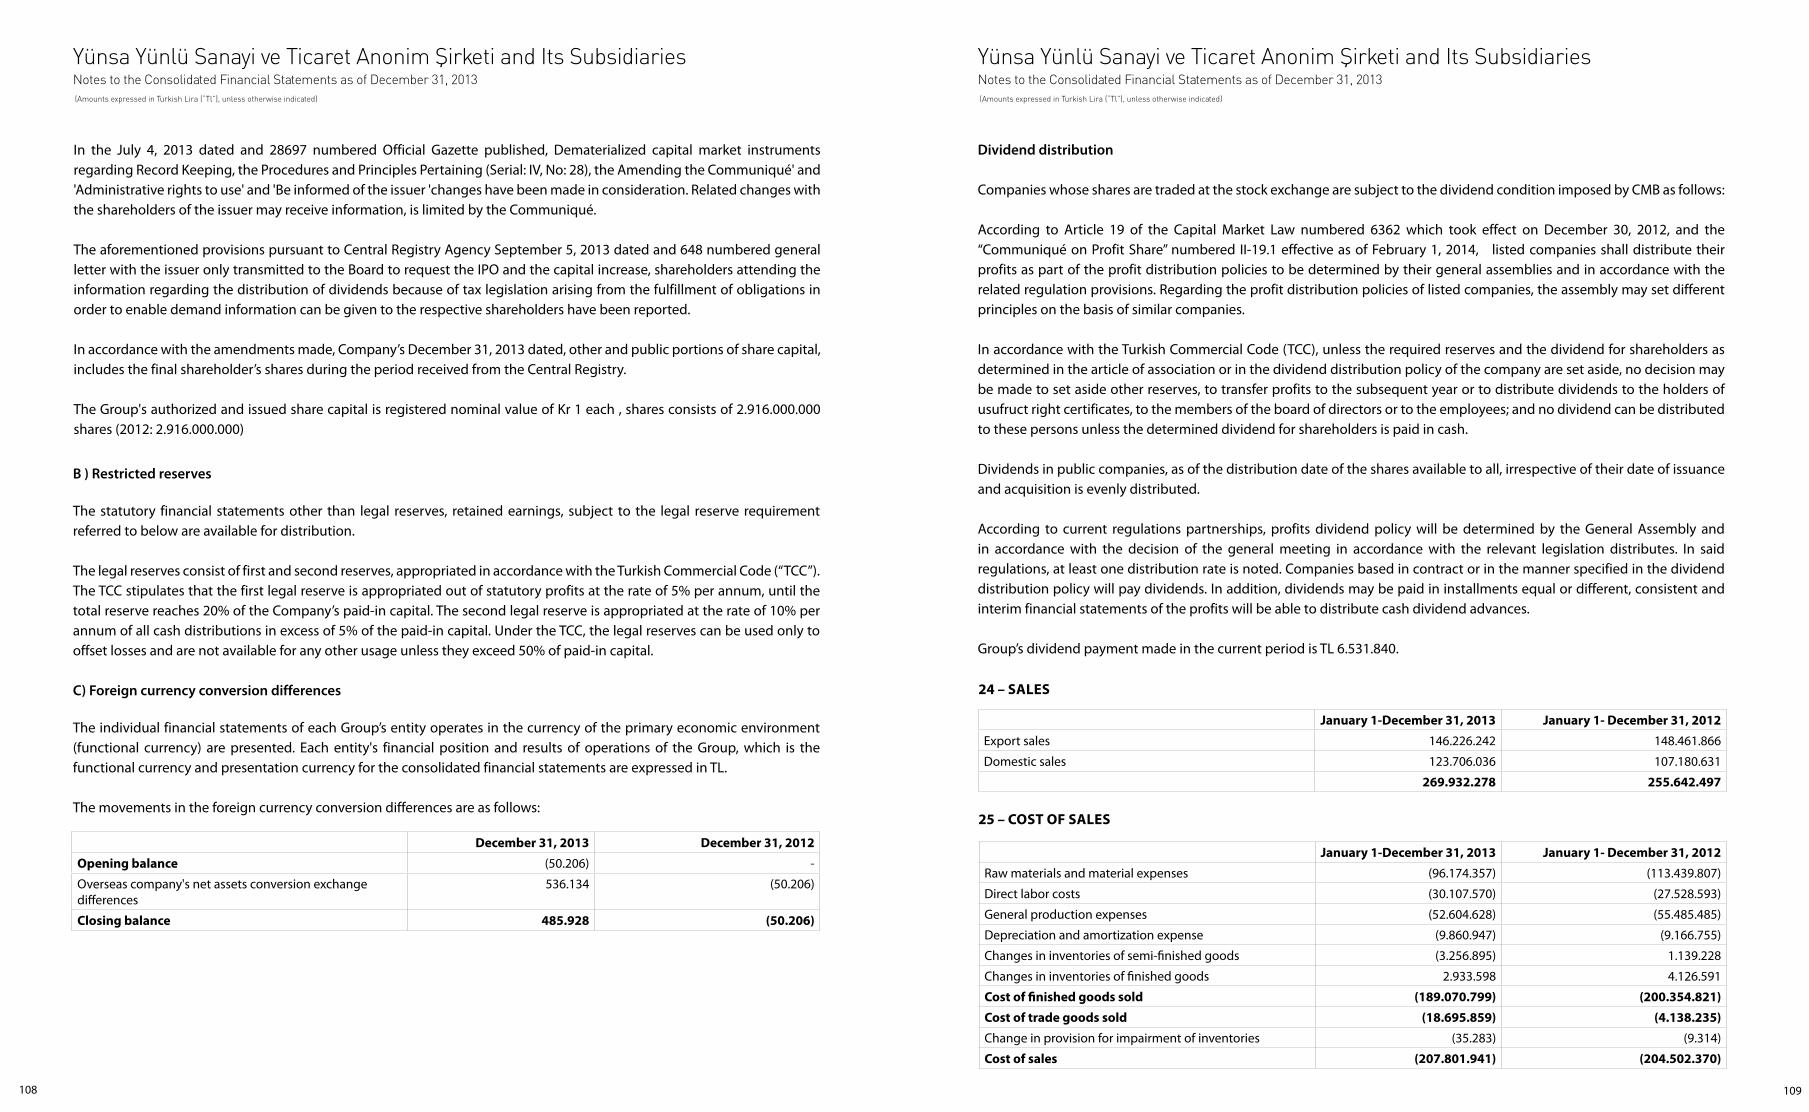
24 – SALES
25 – COST OF SALES
January 1-December 31, 2013 January 1- December 31, 2012
Export sales 146.226.242 148.461.866
Domestic sales 123.706.036 107.180.631
269.932.278 255.642.497
December 31, 2013 December 31, 2012
Opening balance (50.206) -
Overseas company's net assets conversion exchangedifferences
536.134 (50.206)
Closing balance 485.928 (50.206)
January 1-December 31, 2013 January 1- December 31, 2012
Raw materials and material expenses (96.174.357) (113.439.807)
Direct labor costs (30.107.570) (27.528.593)
General production expenses (52.604.628) (55.485.485)
Depreciation and amortization expense (9.860.947) (9.166.755)
Changes in inventories of semi-finished goods (3.256.895) 1.139.228
Changes in inventories of finished goods 2.933.598 4.126.591
Cost of finished goods sold (189.070.799) (200.354.821)
Cost of trade goods sold (18.695.859) (4.138.235)
Change in provision for impairment of inventories (35.283) (9.314)
Cost of sales (207.801.941) (204.502.370)
B ) Restricted reserves
The statutory financial statements other than legal reserves, retained earnings, subject to the legal reserve requirement referred to below are available for distribution.
The legal reserves consist of first and second reserves, appropriated in accordance with the Turkish Commercial Code (“TCC”). The TCC stipulates that the first legal reserve is appropriated out of statutory profits at the rate of 5% per annum, until the total reserve reaches 20% of the Company’s paid-in capital. The second legal reserve is appropriated at the rate of 10% per annum of all cash distributions in excess of 5% of the paid-in capital. Under the TCC, the legal reserves can be used only to offset losses and are not available for any other usage unless they exceed 50% of paid-in capital.
C) Foreign currency conversion differences
The individual financial statements of each Group’s entity operates in the currency of the primary economic environment (functional currency) are presented. Each entity's financial position and results of operations of the Group, which is the functional currency and presentation currency for the consolidated financial statements are expressed in TL.
The movements in the foreign currency conversion differences are as follows:
Dividend distribution
Companies whose shares are traded at the stock exchange are subject to the dividend condition imposed by CMB as follows:
According to Article 19 of the Capital Market Law numbered 6362 which took effect on December 30, 2012, and the “Communiqué on Profit Share” numbered II-19.1 effective as of February 1, 2014, listed companies shall distribute their profits as part of the profit distribution policies to be determined by their general assemblies and in accordance with the related regulation provisions. Regarding the profit distribution policies of listed companies, the assembly may set different principles on the basis of similar companies.
In accordance with the Turkish Commercial Code (TCC), unless the required reserves and the dividend for shareholders as determined in the article of association or in the dividend distribution policy of the company are set aside, no decision may be made to set aside other reserves, to transfer profits to the subsequent year or to distribute dividends to the holders of usufruct right certificates, to the members of the board of directors or to the employees; and no dividend can be distributed to these persons unless the determined dividend for shareholders is paid in cash.
Dividends in public companies, as of the distribution date of the shares available to all, irrespective of their date of issuance and acquisition is evenly distributed.
According to current regulations partnerships, profits dividend policy will be determined by the General Assembly and in accordance with the decision of the general meeting in accordance with the relevant legislation distributes. In said regulations, at least one distribution rate is noted. Companies based in contract or in the manner specified in the dividend distribution policy will pay dividends. In addition, dividends may be paid in installments equal or different, consistent and interim financial statements of the profits will be able to distribute cash dividend advances.
Group’s dividend payment made in the current period is TL 6.531.840.
In the July 4, 2013 dated and 28697 numbered Official Gazette published, Dematerialized capital market instruments regarding Record Keeping, the Procedures and Principles Pertaining (Serial: IV, No: 28), the Amending the Communiqué' and 'Administrative rights to use' and 'Be informed of the issuer 'changes have been made in consideration. Related changes with the shareholders of the issuer may receive information, is limited by the Communiqué.
The aforementioned provisions pursuant to Central Registry Agency September 5, 2013 dated and 648 numbered general letter with the issuer only transmitted to the Board to request the IPO and the capital increase, shareholders attending the information regarding the distribution of dividends because of tax legislation arising from the fulfillment of obligations in order to enable demand information can be given to the respective shareholders have been reported.
In accordance with the amendments made, Company’s December 31, 2013 dated, other and public portions of share capital, includes the final shareholder’s shares during the period received from the Central Registry.
The Group's authorized and issued share capital is registered nominal value of Kr 1 each , shares consists of 2.916.000.000 shares (2012: 2.916.000.000)
Yünsa Yünlü Sanayi ve Ticaret Anonim Şirketi and Its SubsidiariesNotes to the Consolidated Financial Statements as of December 31, 2013 (Amounts expressed in Turkish Lira (“Tl”), unless otherwise indicated)
Yünsa Yünlü Sanayi ve Ticaret Anonim Şirketi and Its SubsidiariesNotes to the Consolidated Financial Statements as of December 31, 2013 (Amounts expressed in Turkish Lira (“Tl”), unless otherwise indicated)
109108
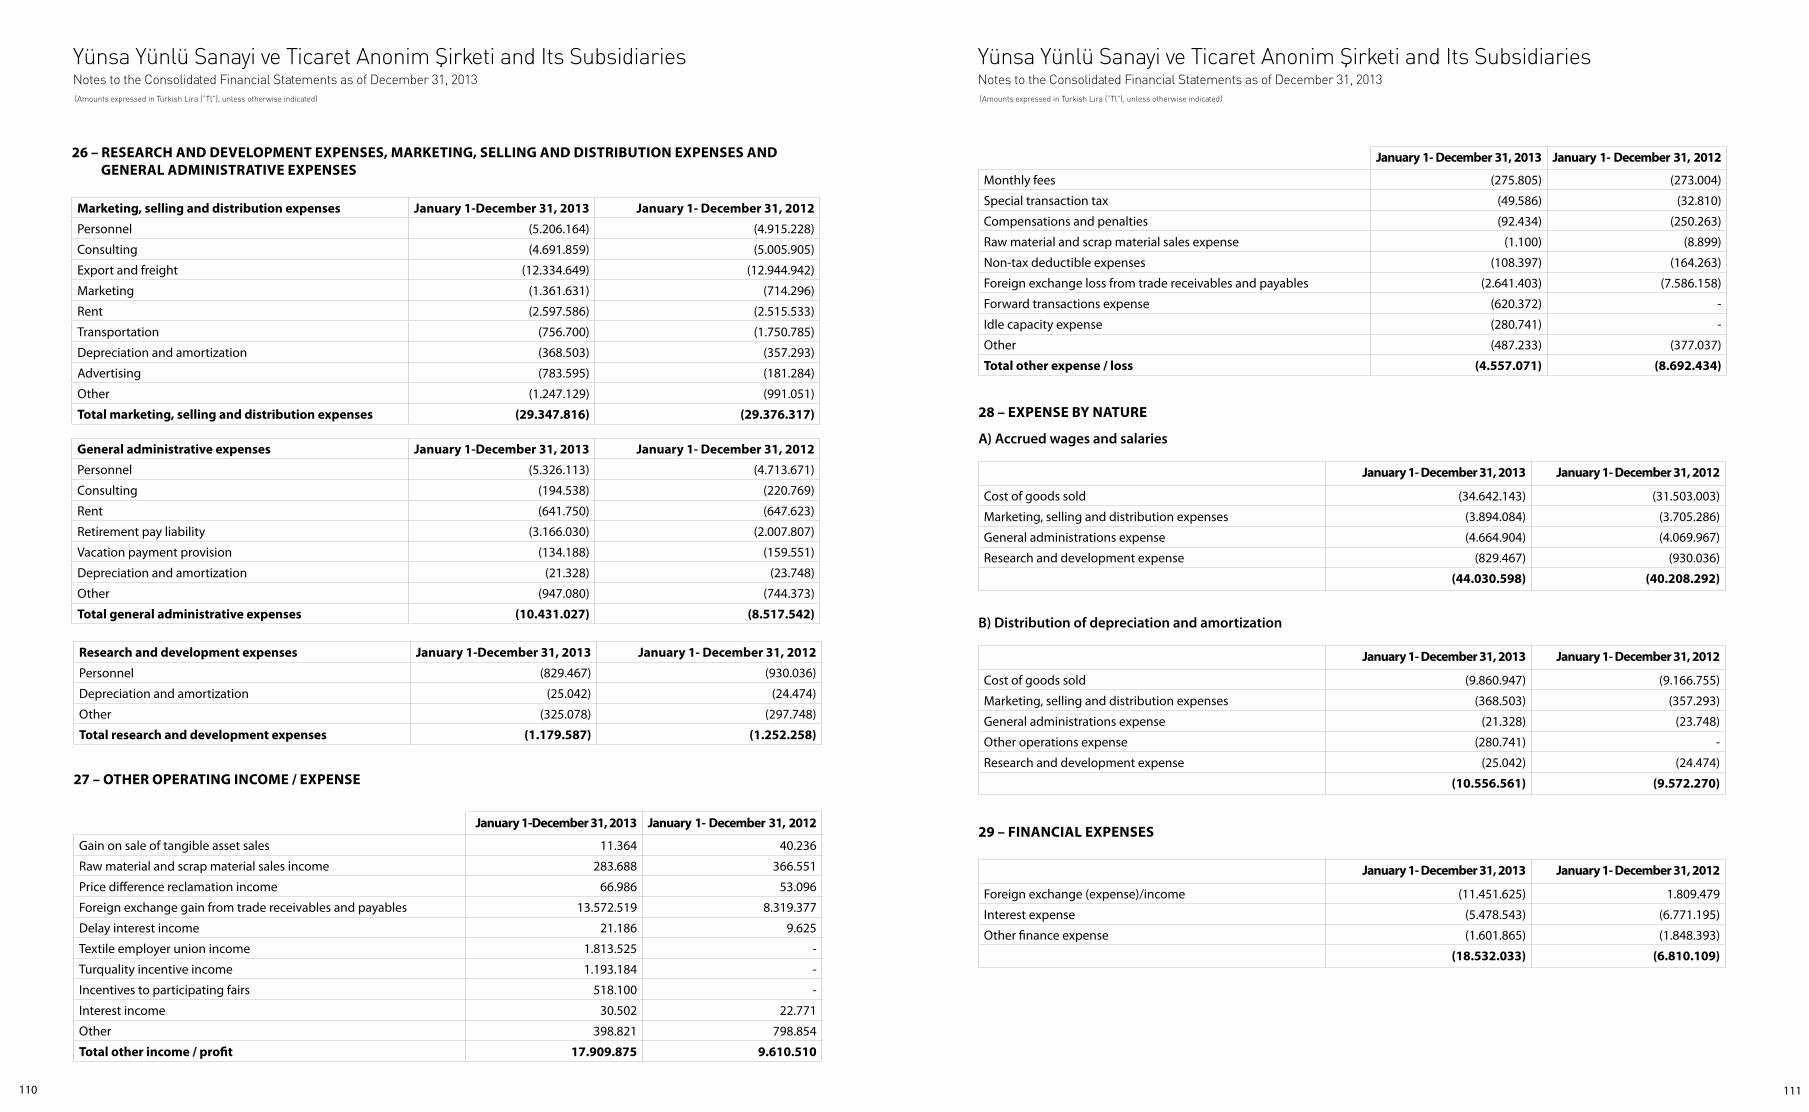
January 1- December 31, 2013 January 1- December 31, 2012
Monthly fees (275.805) (273.004)
Special transaction tax (49.586) (32.810)
Compensations and penalties (92.434) (250.263)
Raw material and scrap material sales expense (1.100) (8.899)
Non-tax deductible expenses (108.397) (164.263)
Foreign exchange loss from trade receivables and payables (2.641.403) (7.586.158)
Forward transactions expense (620.372) -
Idle capacity expense (280.741) -
Other (487.233) (377.037)
Total other expense / loss (4.557.071) (8.692.434)
January 1-December 31, 2013 January 1- December 31, 2012
Gain on sale of tangible asset sales 11.364 40.236
Raw material and scrap material sales income 283.688 366.551
Price difference reclamation income 66.986 53.096
Foreign exchange gain from trade receivables and payables 13.572.519 8.319.377
Delay interest income 21.186 9.625
Textile employer union income 1.813.525 -
Turquality incentive income 1.193.184 -
Incentives to participating fairs 518.100 -
Interest income 30.502 22.771
Other 398.821 798.854
Total other income / profit 17.909.875 9.610.510
27 – OTHER OPERATING INCOME / EXPENSE
Research and development expenses January 1-December 31, 2013 January 1- December 31, 2012
Personnel (829.467) (930.036)
Depreciation and amortization (25.042) (24.474)
Other (325.078) (297.748)
Total research and development expenses (1.179.587) (1.252.258)
29 – FINANCIAL EXPENSES
28 – EXPENSE BY NATURE
B) Distribution of depreciation and amortization
A) Accrued wages and salaries
January 1- December 31, 2013 January 1- December 31, 2012
Foreign exchange (expense)/income (11.451.625) 1.809.479
Interest expense (5.478.543) (6.771.195)
Other finance expense (1.601.865) (1.848.393)
(18.532.033) (6.810.109)
January 1- December 31, 2013 January 1- December 31, 2012
Cost of goods sold (9.860.947) (9.166.755)
Marketing, selling and distribution expenses (368.503) (357.293)
General administrations expense (21.328) (23.748)
Other operations expense (280.741) -
Research and development expense (25.042) (24.474)
(10.556.561) (9.572.270)
January 1- December 31, 2013 January 1- December 31, 2012
Cost of goods sold (34.642.143) (31.503.003)
Marketing, selling and distribution expenses (3.894.084) (3.705.286)
General administrations expense (4.664.904) (4.069.967)
Research and development expense (829.467) (930.036)
(44.030.598) (40.208.292)
General administrative expenses January 1-December 31, 2013 January 1- December 31, 2012
Personnel (5.326.113) (4.713.671)
Consulting (194.538) (220.769)
Rent (641.750) (647.623)
Retirement pay liability (3.166.030) (2.007.807)
Vacation payment provision (134.188) (159.551)
Depreciation and amortization (21.328) (23.748)
Other (947.080) (744.373)
Total general administrative expenses (10.431.027) (8.517.542)
26 – RESEARCH AND DEVELOPMENT EXPENSES, MARkETING, SELLING AND DISTRIBUTION EXPENSES AND GENERAL ADMINISTRATIVE EXPENSES
Marketing, selling and distribution expenses January 1-December 31, 2013 January 1- December 31, 2012
Personnel (5.206.164) (4.915.228)
Consulting (4.691.859) (5.005.905)
Export and freight (12.334.649) (12.944.942)
Marketing (1.361.631) (714.296)
Rent (2.597.586) (2.515.533)
Transportation (756.700) (1.750.785)
Depreciation and amortization (368.503) (357.293)
Advertising (783.595) (181.284)
Other (1.247.129) (991.051)
Total marketing, selling and distribution expenses (29.347.816) (29.376.317)
Yünsa Yünlü Sanayi ve Ticaret Anonim Şirketi and Its SubsidiariesNotes to the Consolidated Financial Statements as of December 31, 2013 (Amounts expressed in Turkish Lira (“Tl”), unless otherwise indicated)
Yünsa Yünlü Sanayi ve Ticaret Anonim Şirketi and Its SubsidiariesNotes to the Consolidated Financial Statements as of December 31, 2013 (Amounts expressed in Turkish Lira (“Tl”), unless otherwise indicated)
111110
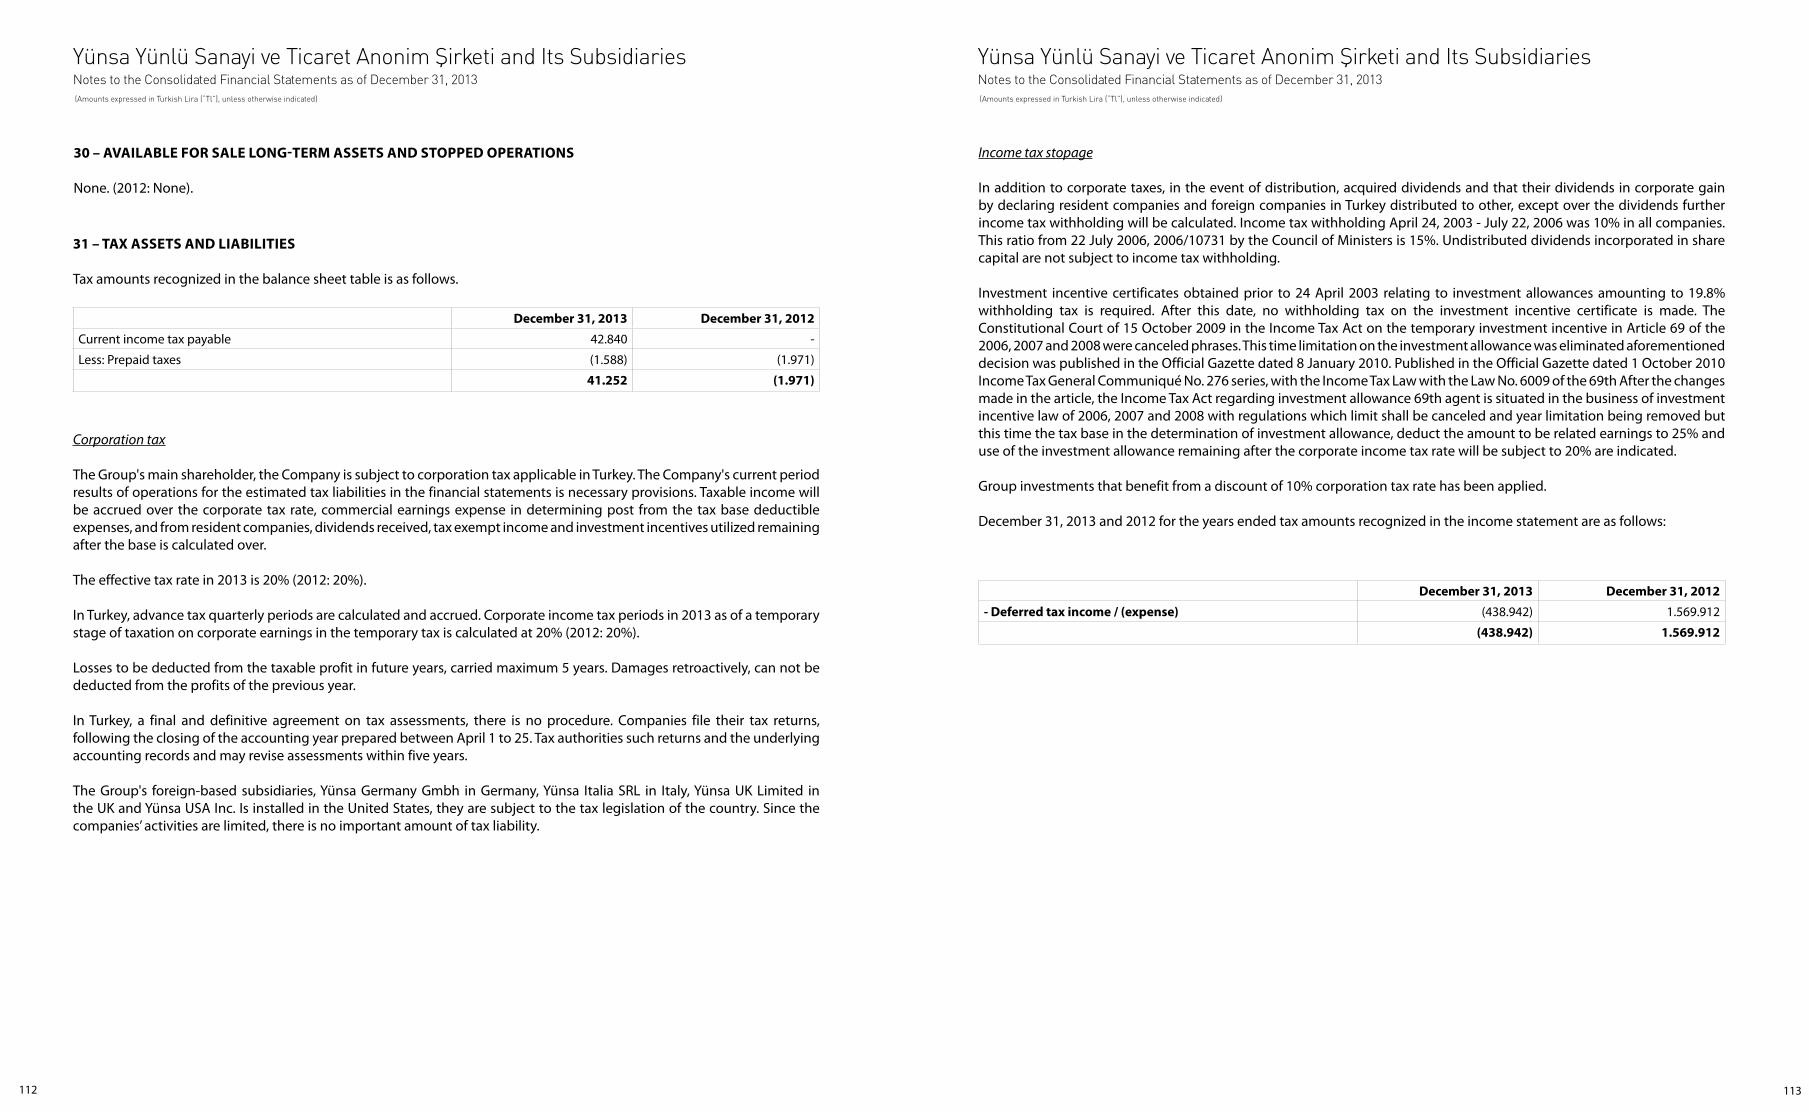
Income tax stopage
In addition to corporate taxes, in the event of distribution, acquired dividends and that their dividends in corporate gain by declaring resident companies and foreign companies in Turkey distributed to other, except over the dividends further income tax withholding will be calculated. Income tax withholding April 24, 2003 - July 22, 2006 was 10% in all companies. This ratio from 22 July 2006, 2006/10731 by the Council of Ministers is 15%. Undistributed dividends incorporated in share capital are not subject to income tax withholding.
Investment incentive certificates obtained prior to 24 April 2003 relating to investment allowances amounting to 19.8% withholding tax is required. After this date, no withholding tax on the investment incentive certificate is made. The Constitutional Court of 15 October 2009 in the Income Tax Act on the temporary investment incentive in Article 69 of the 2006, 2007 and 2008 were canceled phrases. This time limitation on the investment allowance was eliminated aforementioned decision was published in the Official Gazette dated 8 January 2010. Published in the Official Gazette dated 1 October 2010 Income Tax General Communiqué No. 276 series, with the Income Tax Law with the Law No. 6009 of the 69th After the changes made in the article, the Income Tax Act regarding investment allowance 69th agent is situated in the business of investment incentive law of 2006, 2007 and 2008 with regulations which limit shall be canceled and year limitation being removed but this time the tax base in the determination of investment allowance, deduct the amount to be related earnings to 25% and use of the investment allowance remaining after the corporate income tax rate will be subject to 20% are indicated.
Group investments that benefit from a discount of 10% corporation tax rate has been applied.
December 31, 2013 and 2012 for the years ended tax amounts recognized in the income statement are as follows:
Corporation tax
The Group's main shareholder, the Company is subject to corporation tax applicable in Turkey. The Company's current period results of operations for the estimated tax liabilities in the financial statements is necessary provisions. Taxable income will be accrued over the corporate tax rate, commercial earnings expense in determining post from the tax base deductible expenses, and from resident companies, dividends received, tax exempt income and investment incentives utilized remaining after the base is calculated over.
The effective tax rate in 2013 is 20% (2012: 20%).
In Turkey, advance tax quarterly periods are calculated and accrued. Corporate income tax periods in 2013 as of a temporary stage of taxation on corporate earnings in the temporary tax is calculated at 20% (2012: 20%).
Losses to be deducted from the taxable profit in future years, carried maximum 5 years. Damages retroactively, can not be deducted from the profits of the previous year.
In Turkey, a final and definitive agreement on tax assessments, there is no procedure. Companies file their tax returns, following the closing of the accounting year prepared between April 1 to 25. Tax authorities such returns and the underlying accounting records and may revise assessments within five years.
The Group's foreign-based subsidiaries, Yünsa Germany Gmbh in Germany, Yünsa Italia SRL in Italy, Yünsa UK Limited in the UK and Yünsa USA Inc. Is installed in the United States, they are subject to the tax legislation of the country. Since the companies’ activities are limited, there is no important amount of tax liability.
31 – TAX ASSETS AND LIABILITIES
Tax amounts recognized in the balance sheet table is as follows.
December 31, 2013 December 31, 2012
Current income tax payable 42.840 -
Less: Prepaid taxes (1.588) (1.971)
41.252 (1.971)
30 – AVAILABLE FOR SALE LONG-TERM ASSETS AND STOPPED OPERATIONS
None. (2012: None).
December 31, 2013 December 31, 2012
- Deferred tax income / (expense) (438.942) 1.569.912
(438.942) 1.569.912
Yünsa Yünlü Sanayi ve Ticaret Anonim Şirketi and Its SubsidiariesNotes to the Consolidated Financial Statements as of December 31, 2013 (Amounts expressed in Turkish Lira (“Tl”), unless otherwise indicated)
Yünsa Yünlü Sanayi ve Ticaret Anonim Şirketi and Its SubsidiariesNotes to the Consolidated Financial Statements as of December 31, 2013 (Amounts expressed in Turkish Lira (“Tl”), unless otherwise indicated)
113112
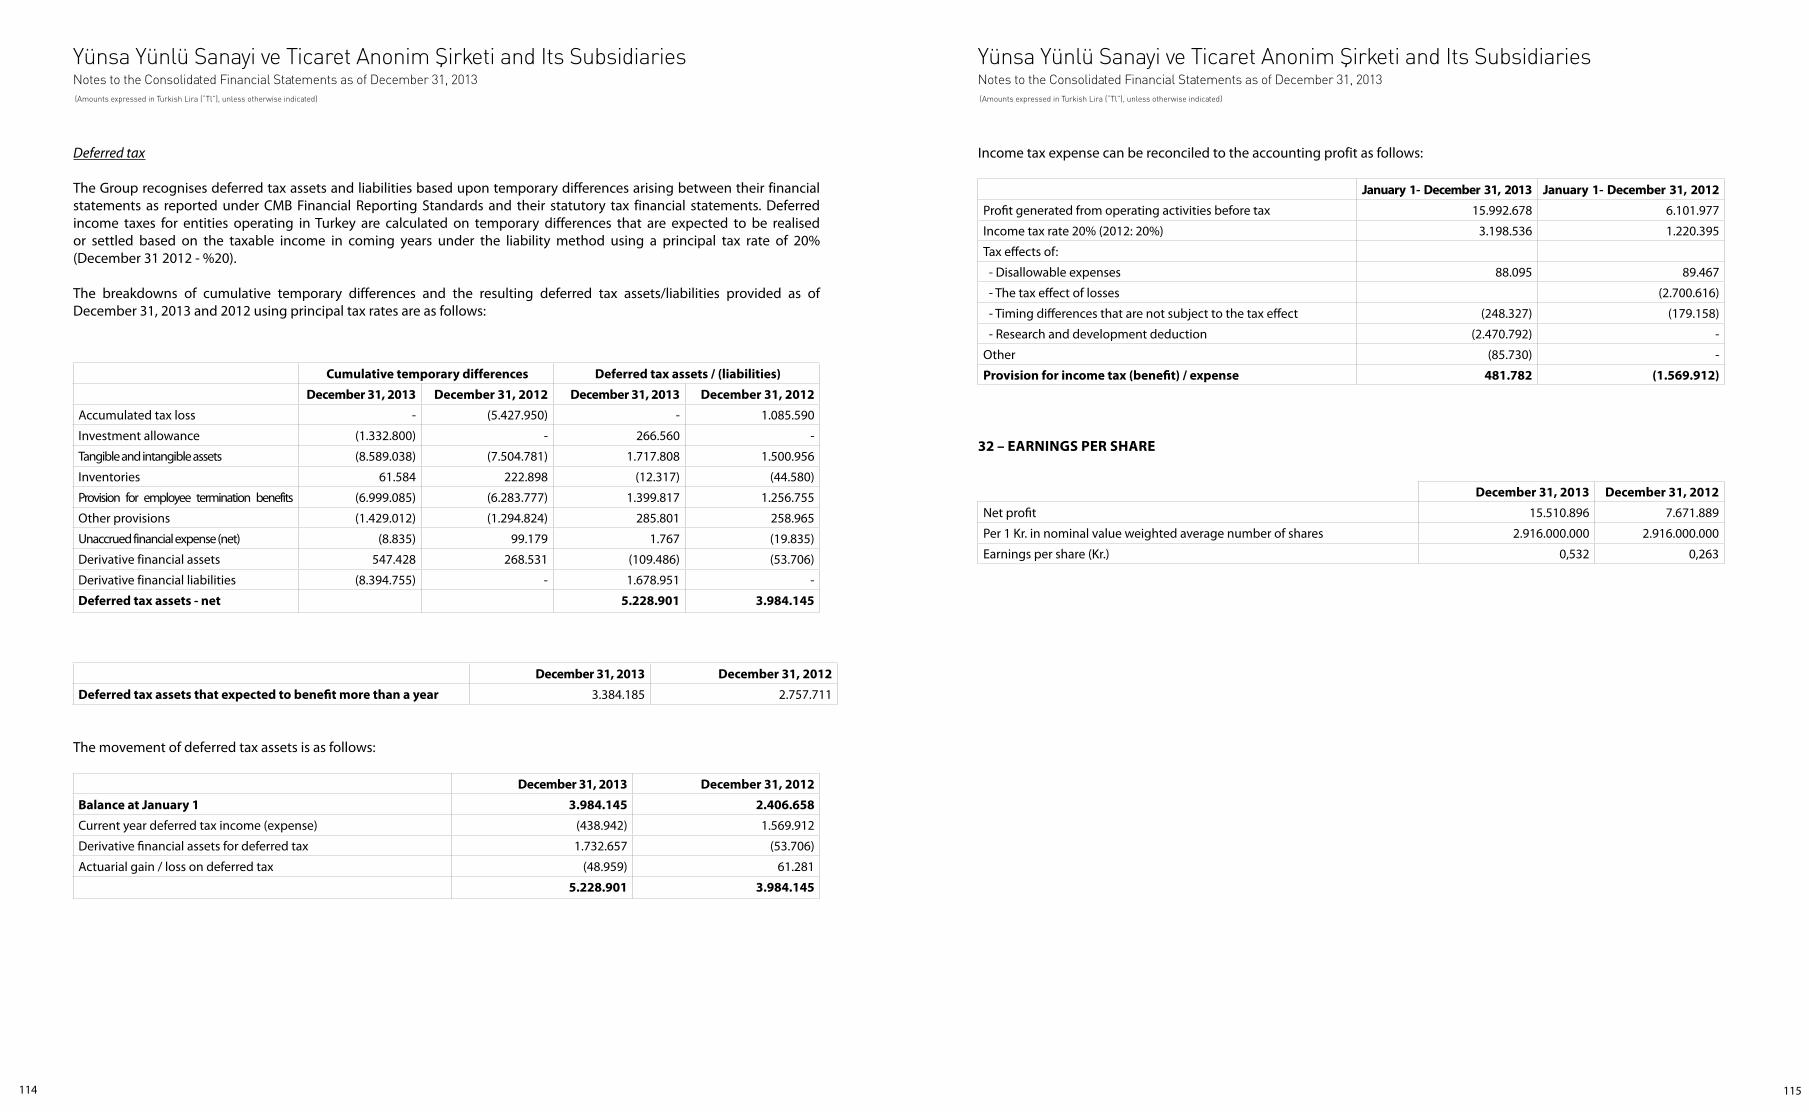
December 31, 2013 December 31, 2012
Net profit 15.510.896 7.671.889
Per 1 Kr. in nominal value weighted average number of shares 2.916.000.000 2.916.000.000
Earnings per share (Kr.) 0,532 0,263
Income tax expense can be reconciled to the accounting profit as follows:
The movement of deferred tax assets is as follows:
32 – EARNINGS PER SHARE
January 1- December 31, 2013 January 1- December 31, 2012
Profit generated from operating activities before tax 15.992.678 6.101.977
Income tax rate 20% (2012: 20%) 3.198.536 1.220.395
Tax effects of:
- Disallowable expenses 88.095 89.467
- The tax effect of losses (2.700.616)
- Timing differences that are not subject to the tax effect (248.327) (179.158)
- Research and development deduction (2.470.792) -
Other (85.730) -
Provision for income tax (benefit) / expense 481.782 (1.569.912)
December 31, 2013 December 31, 2012
Balance at January 1 3.984.145 2.406.658
Current year deferred tax income (expense) (438.942) 1.569.912
Derivative financial assets for deferred tax 1.732.657 (53.706)
Actuarial gain / loss on deferred tax (48.959) 61.281
5.228.901 3.984.145
December 31, 2013 December 31, 2012
Deferred tax assets that expected to benefit more than a year 3.384.185 2.757.711
Deferred tax
The Group recognises deferred tax assets and liabilities based upon temporary differences arising between their financial statements as reported under CMB Financial Reporting Standards and their statutory tax financial statements. Deferred income taxes for entities operating in Turkey are calculated on temporary differences that are expected to be realised or settled based on the taxable income in coming years under the liability method using a principal tax rate of 20% (December 31 2012 - %20).
The breakdowns of cumulative temporary differences and the resulting deferred tax assets/liabilities provided as of December 31, 2013 and 2012 using principal tax rates are as follows:
Cumulative temporary differences Deferred tax assets / (liabilities)
December 31, 2013 December 31, 2012 December 31, 2013 December 31, 2012
Accumulated tax loss - (5.427.950) - 1.085.590
Investment allowance (1.332.800) - 266.560 -
Tangible and intangible assets (8.589.038) (7.504.781) 1.717.808 1.500.956
Inventories 61.584 222.898 (12.317) (44.580)
Provision for employee termination benefits (6.999.085) (6.283.777) 1.399.817 1.256.755
Other provisions (1.429.012) (1.294.824) 285.801 258.965
Unaccrued financial expense (net) (8.835) 99.179 1.767 (19.835)
Derivative financial assets 547.428 268.531 (109.486) (53.706)
Derivative financial liabilities (8.394.755) - 1.678.951 -
Deferred tax assets - net 5.228.901 3.984.145
Yünsa Yünlü Sanayi ve Ticaret Anonim Şirketi and Its SubsidiariesNotes to the Consolidated Financial Statements as of December 31, 2013 (Amounts expressed in Turkish Lira (“Tl”), unless otherwise indicated)
Yünsa Yünlü Sanayi ve Ticaret Anonim Şirketi and Its SubsidiariesNotes to the Consolidated Financial Statements as of December 31, 2013 (Amounts expressed in Turkish Lira (“Tl”), unless otherwise indicated)
115114

Receivables
Credit risks exposed by the types of financial instruments Trade Receivables Other Receivables
December 31, 2012 RelatedParties Third Party Related
Parties Third Party BankDeposits
Derivative Instruments Other
Maximum amount of risk exposed as of reporting date(*) (A+B+C+D+E)
16.463 80.429.040 - 25.175 1.585.926 - -
- Secured portion of the maximum credit risk by guarantees etc. - 26.029.391 - - - - -
A. Net book value of financial assets neither due nor impaired 16.463 75.124.277 - 25.175 1.585.926 - -
B. Net book value of aasets whose conditions renegotiated, otherwise will be classified as past due or impaired
- - - - - - -
C. Net book value of assets past due but not impaired - 5.304.763 - - - - -
- Secured portion covered by guarantees etc. - 3.359.884 - - - - -
D. Net book value of impaired assets - - - - - - -
- Past due (gross book value) - - - - - - -
•Impairmentamount(-) - - - - - - -
•Securedportioncoveredwith guarantees etc. - - - - - - -
- Not due (gross book value) - - - - - - -
•Impairmentamount(-) - - - - - - -
•Thepartcoveredwithguarantees - - - - - - -
E. Off- balance sheet itemsincluding risk - - - - - - -
(*) While determining the related amounts, the factors that increase the credit reliability such as guarantees received, have not been considered.
b.1 Credit risk management
As of December 31,2013, a portion of trade receivables amounting to TL 2.075.725 consist of receivables from credit card slip and maturity up to 3 monts (December 31, 2012: TL 2.295.900).
At balance sheet date, the total amount of overdue receivables and guarantees received for these receivables is as follows:
December 31, 2013 December 31, 2012
Overdue for 1-30 days 1.711.487 1.733.263
Overdue for 1-3 months 1.486.319 1.434.993
Overdue for 3-12 months 663.765 1.584.282
Overdue for 1 year 486.067 552.225
Total past due receivables 4.347.638 5.304.763
Secured portion covered by guarantees etc. 3.921.654 3.359.884
Receivables
Credit risks exposed by the types of financial instruments Trade Receivables Other Receivables
December 31, 2013 Related Parties Third Party Related Parties Third Party Bank Deposits Derivative Instruments Other
Maximum amount of risk exposedas of reporting date(*) (A+B+C+D+E)
28.969 108.526.082 - 68.091 740.844 - -
- Secured portion of the maximum credit risk by guarantees, etc - 49.761.138 - - - - -
A. Net book value of financial assets neither due nor impaired 28.969 104.178.444 - 68.091 740.844 - -
B. Net book value of assets whose conditions renegotiated, otherwise will be classified as past due or impaired
- - - - - - -
C. Net book value of assets past due but not impaired - 4.347.638 - - - - -
- Secured portion covered by guarantees, etc. - 3.921.654 - - - - -
D. Net book value of impaired assets - - - - - - -
- Past due (gross book value) - - - - - - -
•Impairmentamount(-) - - - - - - -
•Securedportioncoveredwith guarantees, etc. - - - - - - -
- Not due (gross book value) - - - - - - -
•Impairmentamount(-) - - - - - - -
•Thepartcoveredwith guarantees - - - - - - -
E. Off- balance sheet items including credit risk - - - - - - -
(*) While determining the related amounts, the factors that increase the credit reliability such as guarantees received, have not been considered.
Guarantees received for the overdue receivables that not reserved any provision
December 31, 2013 December 31, 2012
Export insurance 3.900.372 2.890.782
Guarantees received 21.282 469.102
3.921.654 3.359.884
33 – NATuRe AND exTeNT OF RISkS ARISINg FROM FINANCIAl INSTRuMeNTS
Yünsa Yünlü Sanayi ve Ticaret Anonim Şirketi and Its SubsidiariesNotes to the Consolidated Financial Statements as of December 31, 2013 (Amounts expressed in Turkish Lira (“Tl”), unless otherwise indicated)
Yünsa Yünlü Sanayi ve Ticaret Anonim Şirketi and Its SubsidiariesNotes to the Consolidated Financial Statements as of December 31, 2013 (Amounts expressed in Turkish Lira (“Tl”), unless otherwise indicated)
117116
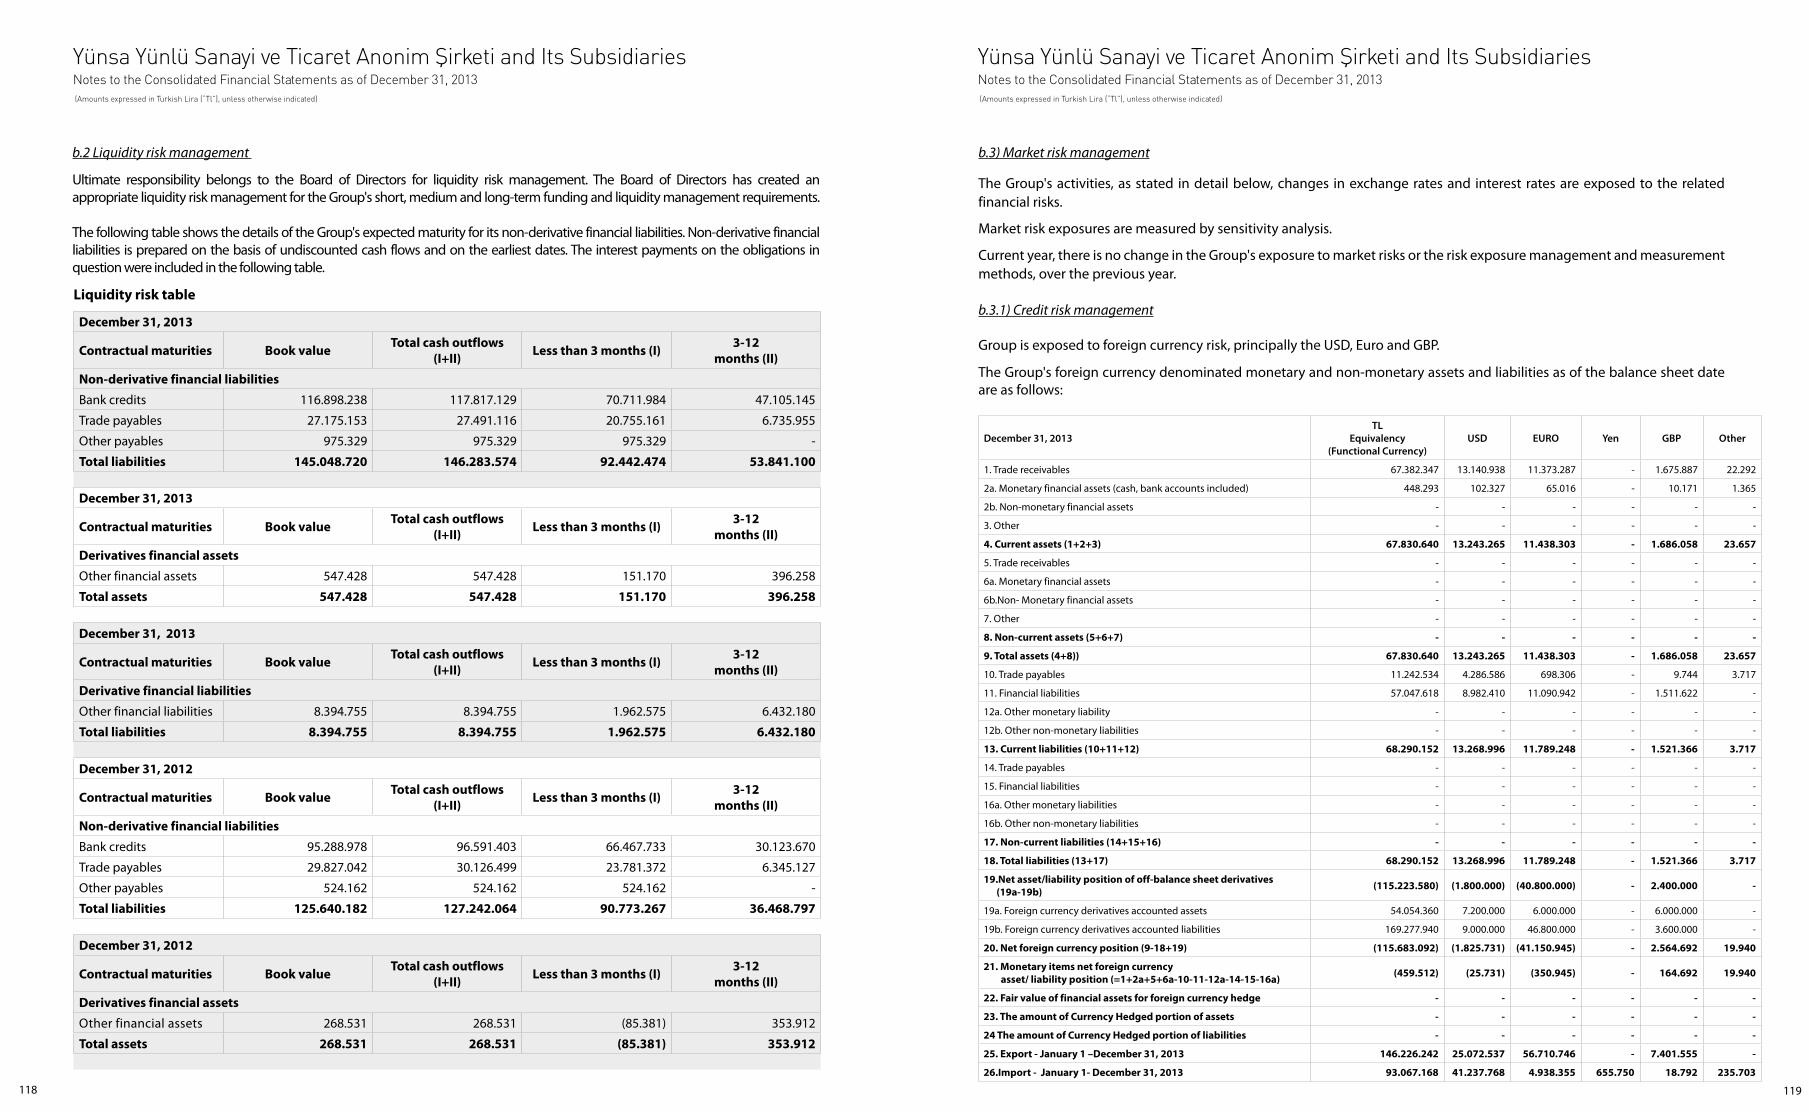
b.3) Market risk management
The Group's activities, as stated in detail below, changes in exchange rates and interest rates are exposed to the related financial risks.
Market risk exposures are measured by sensitivity analysis.
Current year, there is no change in the Group's exposure to market risks or the risk exposure management and measurement methods, over the previous year.
b.3.1) Credit risk management
Group is exposed to foreign currency risk, principally the USD, Euro and GBP.
The Group's foreign currency denominated monetary and non-monetary assets and liabilities as of the balance sheet date are as follows:
December 31, 2013Tl
equivalency(Functional Currency)
uSD euRO Yen gBP Other
1. Trade receivables 67.382.347 13.140.938 11.373.287 - 1.675.887 22.292
2a. Monetary financial assets (cash, bank accounts included) 448.293 102.327 65.016 - 10.171 1.365
2b. Non-monetary financial assets - - - - - -
3. Other - - - - - -
4. Current assets (1+2+3) 67.830.640 13.243.265 11.438.303 - 1.686.058 23.657
5. Trade receivables - - - - - -
6a. Monetary financial assets - - - - - -
6b.Non- Monetary financial assets - - - - - -
7. Other - - - - - -
8. Non-current assets (5+6+7) - - - - - -
9. Total assets (4+8)) 67.830.640 13.243.265 11.438.303 - 1.686.058 23.657
10. Trade payables 11.242.534 4.286.586 698.306 - 9.744 3.717
11. Financial liabilities 57.047.618 8.982.410 11.090.942 - 1.511.622 -
12a. Other monetary liability - - - - - -
12b. Other non-monetary liabilities - - - - - -
13. Current liabilities (10+11+12) 68.290.152 13.268.996 11.789.248 - 1.521.366 3.717
14. Trade payables - - - - - -
15. Financial liabilities - - - - - -
16a. Other monetary liabilities - - - - - -
16b. Other non-monetary liabilities - - - - - -
17. Non-current liabilities (14+15+16) - - - - - -
18. Total liabilities (13+17) 68.290.152 13.268.996 11.789.248 - 1.521.366 3.717
19.Net asset/liability position of off-balance sheet derivatives (19a-19b) (115.223.580) (1.800.000) (40.800.000) - 2.400.000 -
19a. Foreign currency derivatives accounted assets 54.054.360 7.200.000 6.000.000 - 6.000.000 -
19b. Foreign currency derivatives accounted liabilities 169.277.940 9.000.000 46.800.000 - 3.600.000 -
20. Net foreign currency position (9-18+19) (115.683.092) (1.825.731) (41.150.945) - 2.564.692 19.940
21. Monetary items net foreign currency asset/ liability position (=1+2a+5+6a-10-11-12a-14-15-16a) (459.512) (25.731) (350.945) - 164.692 19.940
22. Fair value of financial assets for foreign currency hedge - - - - - -
23. The amount of Currency Hedged portion of assets - - - - - -
24 The amount of Currency Hedged portion of liabilities - - - - - -
25. Export - January 1 –December 31, 2013 146.226.242 25.072.537 56.710.746 - 7.401.555 -
26.Import - January 1- December 31, 2013 93.067.168 41.237.768 4.938.355 655.750 18.792 235.703
b.2 Liquidity risk management
Ultimate responsibility belongs to the Board of Directors for liquidity risk management. The Board of Directors has created an appropriate liquidity risk management for the Group's short, medium and long-term funding and liquidity management requirements.
The following table shows the details of the Group's expected maturity for its non-derivative financial liabilities. Non-derivative financial liabilities is prepared on the basis of undiscounted cash flows and on the earliest dates. The interest payments on the obligations in question were included in the following table.
December 31, 2013
Contractual maturities Book value Total cash outflows (I+II) Less than 3 months (I) 3-12
months (II)
Non-derivative financial liabilities
Bank credits 116.898.238 117.817.129 70.711.984 47.105.145
Trade payables 27.175.153 27.491.116 20.755.161 6.735.955
Other payables 975.329 975.329 975.329 -
Total liabilities 145.048.720 146.283.574 92.442.474 53.841.100
December 31, 2012
Contractual maturities Book value Total cash outflows (I+II) Less than 3 months (I) 3-12
months (II)
Derivatives financial assets
Other financial assets 268.531 268.531 (85.381) 353.912
Total assets 268.531 268.531 (85.381) 353.912
December 31, 2013
Contractual maturities Book value Total cash outflows (I+II) Less than 3 months (I) 3-12
months (II)
Derivatives financial assets
Other financial assets 547.428 547.428 151.170 396.258
Total assets 547.428 547.428 151.170 396.258
December 31, 2013
Contractual maturities Book value Total cash outflows (I+II) Less than 3 months (I) 3-12
months (II)
Derivative financial liabilities
Other financial liabilities 8.394.755 8.394.755 1.962.575 6.432.180
Total liabilities 8.394.755 8.394.755 1.962.575 6.432.180
December 31, 2012
Contractual maturities Book value Total cash outflows (I+II) Less than 3 months (I) 3-12
months (II)
Non-derivative financial liabilities
Bank credits 95.288.978 96.591.403 66.467.733 30.123.670
Trade payables 29.827.042 30.126.499 23.781.372 6.345.127
Other payables 524.162 524.162 524.162 -
Total liabilities 125.640.182 127.242.064 90.773.267 36.468.797
Liquidity risk table
Yünsa Yünlü Sanayi ve Ticaret Anonim Şirketi and Its SubsidiariesNotes to the Consolidated Financial Statements as of December 31, 2013 (Amounts expressed in Turkish Lira (“Tl”), unless otherwise indicated)
Yünsa Yünlü Sanayi ve Ticaret Anonim Şirketi and Its SubsidiariesNotes to the Consolidated Financial Statements as of December 31, 2013 (Amounts expressed in Turkish Lira (“Tl”), unless otherwise indicated)
119118
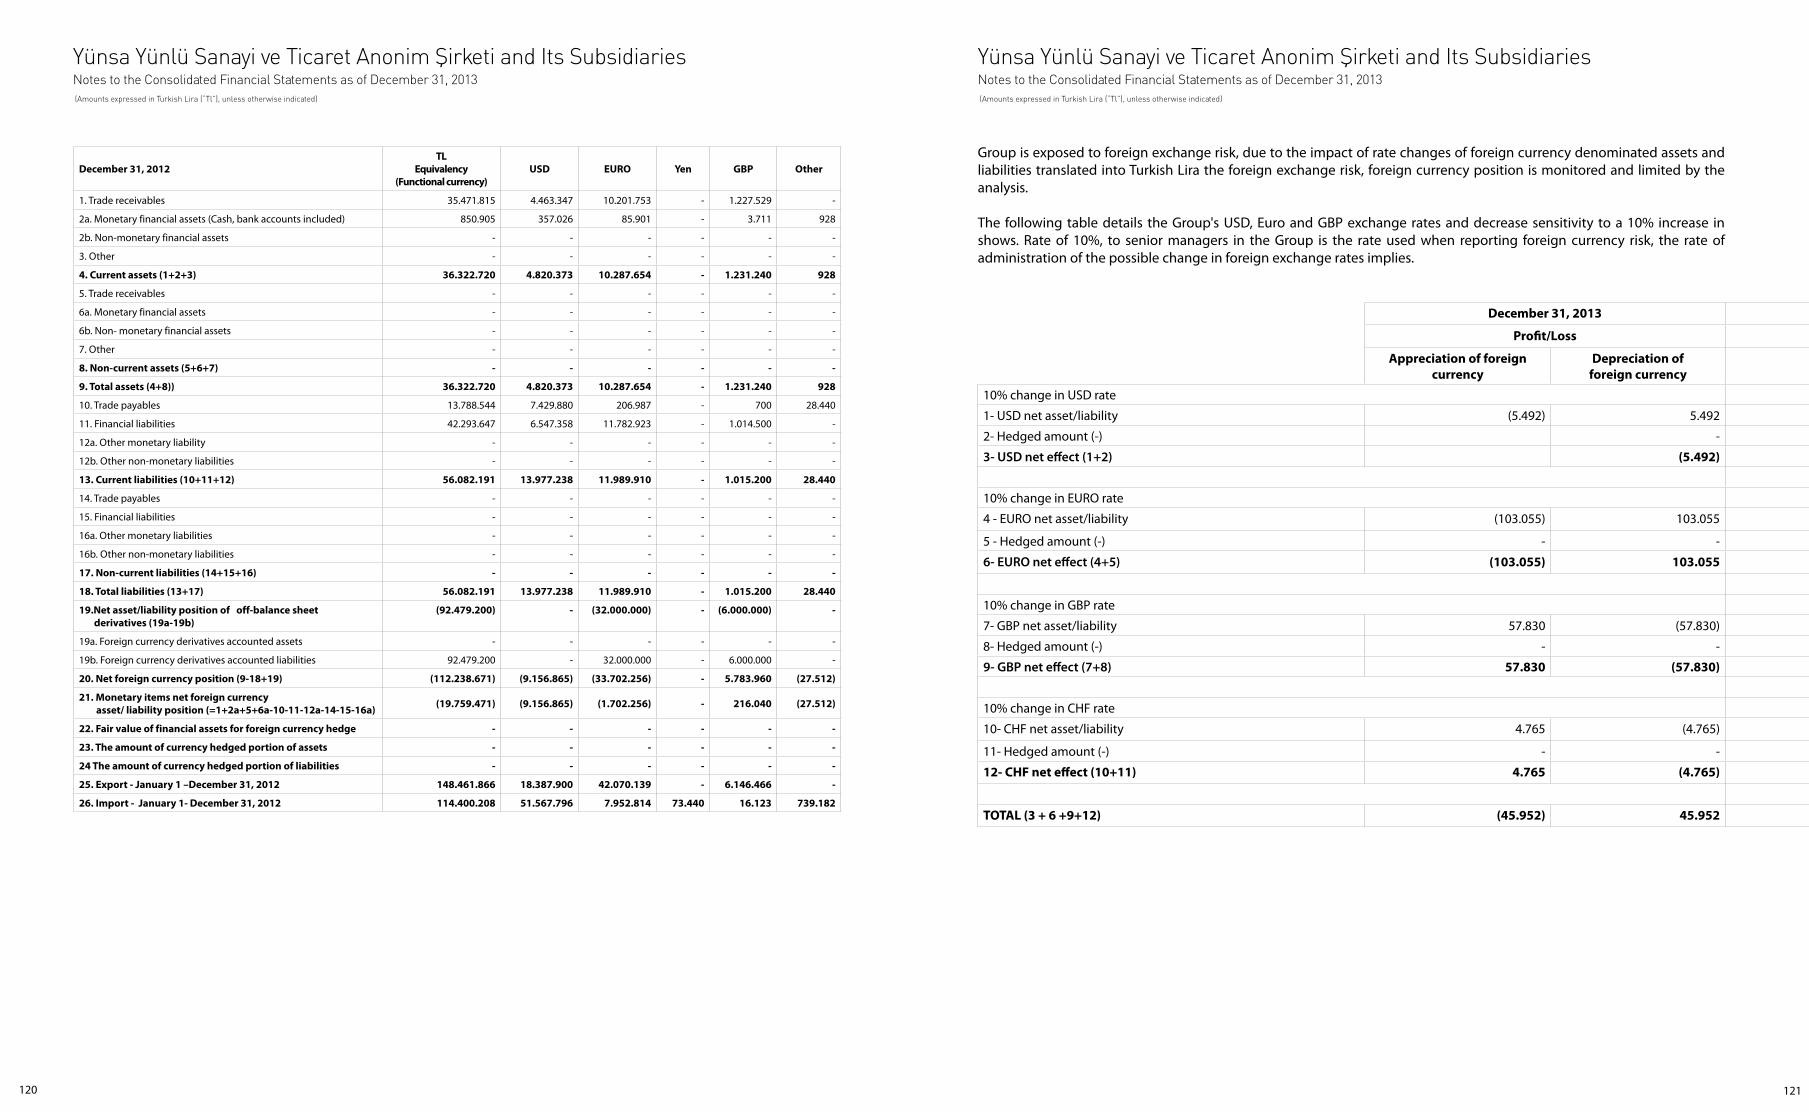
December 31, 2013
Profit/Loss
Appreciation of foreigncurrency
Depreciation of foreign currency
10% change in USD rate
1- USD net asset/liability (5.492) 5.492
2- Hedged amount (-) - -
3- uSD net effect (1+2) (5.492) 5.492
10% change in EURO rate
4 - EURO net asset/liability (103.055) 103.055
5 - Hedged amount (-) - -
6- euRO net effect (4+5) (103.055) 103.055
10% change in GBP rate
7- GBP net asset/liability 57.830 (57.830)
8- Hedged amount (-) - -
9- gBP net effect (7+8) 57.830 (57.830)
10% change in CHF rate
10- CHF net asset/liability 4.765 (4.765)
11- Hedged amount (-) - -
12- CHF net effect (10+11) 4.765 (4.765)
TOTAL (3 + 6 +9+12) (45.952) 45.952
Group is exposed to foreign exchange risk, due to the impact of rate changes of foreign currency denominated assets and liabilities translated into Turkish Lira the foreign exchange risk, foreign currency position is monitored and limited by the analysis.
The following table details the Group's USD, Euro and GBP exchange rates and decrease sensitivity to a 10% increase in shows. Rate of 10%, to senior managers in the Group is the rate used when reporting foreign currency risk, the rate of administration of the possible change in foreign exchange rates implies.
December 31, 2012TL
Equivalency(Functional currency)
USD EURO Yen GBP Other
1. Trade receivables 35.471.815 4.463.347 10.201.753 - 1.227.529 -
2a. Monetary financial assets (Cash, bank accounts included) 850.905 357.026 85.901 - 3.711 928
2b. Non-monetary financial assets - - - - - -
3. Other - - - - - -
4. Current assets (1+2+3) 36.322.720 4.820.373 10.287.654 - 1.231.240 928
5. Trade receivables - - - - - -
6a. Monetary financial assets - - - - - -
6b. Non- monetary financial assets - - - - - -
7. Other - - - - - -
8. Non-current assets (5+6+7) - - - - - -
9. Total assets (4+8)) 36.322.720 4.820.373 10.287.654 - 1.231.240 928
10. Trade payables 13.788.544 7.429.880 206.987 - 700 28.440
11. Financial liabilities 42.293.647 6.547.358 11.782.923 - 1.014.500 -
12a. Other monetary liability - - - - - -
12b. Other non-monetary liabilities - - - - - -
13. Current liabilities (10+11+12) 56.082.191 13.977.238 11.989.910 - 1.015.200 28.440
14. Trade payables - - - - - -
15. Financial liabilities - - - - - -
16a. Other monetary liabilities - - - - - -
16b. Other non-monetary liabilities - - - - - -
17. Non-current liabilities (14+15+16) - - - - - -
18. Total liabilities (13+17) 56.082.191 13.977.238 11.989.910 - 1.015.200 28.440
19.Net asset/liability position of off-balance sheet derivatives (19a-19b)
(92.479.200) - (32.000.000) - (6.000.000) -
19a. Foreign currency derivatives accounted assets - - - - - -
19b. Foreign currency derivatives accounted liabilities 92.479.200 - 32.000.000 - 6.000.000 -
20. Net foreign currency position (9-18+19) (112.238.671) (9.156.865) (33.702.256) - 5.783.960 (27.512)
21. Monetary items net foreign currency asset/ liability position (=1+2a+5+6a-10-11-12a-14-15-16a) (19.759.471) (9.156.865) (1.702.256) - 216.040 (27.512)
22. Fair value of financial assets for foreign currency hedge - - - - - -
23. The amount of currency hedged portion of assets - - - - - -
24 The amount of currency hedged portion of liabilities - - - - - -
25. Export - January 1 –December 31, 2012 148.461.866 18.387.900 42.070.139 - 6.146.466 -
26. Import - January 1- December 31, 2012 114.400.208 51.567.796 7.952.814 73.440 16.123 739.182
Yünsa Yünlü Sanayi ve Ticaret Anonim Şirketi and Its SubsidiariesNotes to the Consolidated Financial Statements as of December 31, 2013 (Amounts expressed in Turkish Lira (“Tl”), unless otherwise indicated)
Yünsa Yünlü Sanayi ve Ticaret Anonim Şirketi and Its SubsidiariesNotes to the Consolidated Financial Statements as of December 31, 2013 (Amounts expressed in Turkish Lira (“Tl”), unless otherwise indicated)
121120

34 – FINANCIAL INSTRUMENTS
Fair value is the amount at which a financial instrument could be exchanged in a current transaction between willing parties, other than in a forced sale or liquidation, and is best evidenced by a quoted market price, if one exists.
The following methods and assumptions used to estimate fair values are used to estimate the fair value of financial instruments:
1) Financial assets
The carrying amounts of foreign currency denominated monetary assets which are translated at year end exchange rates are considered to approximate their fair values.
The carrying values of cash and cash equivalents are estimated to be their fair values since they are short term.
The carrying values of trade receivables are estimated to be their fair values.
2) Monetary liabilities
The fair values of short-term financial liabilities and other financial liabilities are estimated to be at their fair values since they are short term.
Interest Position Table
December 31, 2013 December 31, 2012
Financial Instruments with Floating Interest Rate
Financial assets 547.428 268.531
Financial liabilities 8.394.755 -
b.3.2) Interest rate risk management
Group is exposed to interest rate risk due to Group's borrow funds at both fixed and floating interest rates. Mentioned risk is managed by maintaining an appropriate distribution between the fixed and floating rate borrowings by the Group.
The Group's interest rate sensitive financial instruments are as follows:
At the reporting date, 1% decrease/increase in interest rates and all other variables are held constant:
If as of December 31, 2013, the TL currency denominated interest rate is 1% points higher /lower and all other variables held constant, consists of TL 78.473 pre-tax profit / loss (December 31, 2012: TL 2.685).
December 31, 2012
Profit/Loss
Appreciation of foreign currency
Depreciation of foreign currency
10% change in USD rate
1 – USD net asset/liability (1.632.303) 1.632.303
2- Hedged amount (-) - -
3- uSD net effect (1 +2) (1.632.303) 1.632.303
10% change in EURO rate
4 - EURO net asset/liability (400.320) 400.320
5 - Hedged amount (-) - -
6- euRO net effect (4+5) (400.320) 400.320
10% change in GBP rate
7- GBP net asset/liability 62.021 (62.021)
8- Hedged amount (-) - -
9- gBP net effect (7+8) 62.021 (62.021)
10% change in CHF rate
10- CHF net asset/liability (5.346) 5.346
11- Hedged amount (-) - -
12- CHF net effect (10+11) (5.346) 5.346
TOTAL(3 + 6 +9+12) (1.975.948) 1.975.948
December 31, 2013Loans and receivables
(including cash and cash equivalents
Available for sale financial
assets
Amortized financial liabilities Book value Note
Financial assets
Cash & cash equivalents 754.584 - - 754.584 6
Trade receivables 108.526.082 - - 108.526.082 8
Related party receivables 28.969 - - 28.969 7
Other receivables 68.091 - - 68.091 9
Financial liabilities
Financial liabilities - - 116.898.238 116.898.238 18
Trade payables - - 27.119.883 27.119.883 8
Payables to related parties - - 55.270 55.270 7
Deffered income - - 975.329 975.329 9
Yünsa Yünlü Sanayi ve Ticaret Anonim Şirketi and Its SubsidiariesNotes to the Consolidated Financial Statements as of December 31, 2013 (Amounts expressed in Turkish Lira (“Tl”), unless otherwise indicated)
Yünsa Yünlü Sanayi ve Ticaret Anonim Şirketi and Its SubsidiariesNotes to the Consolidated Financial Statements as of December 31, 2013 (Amounts expressed in Turkish Lira (“Tl”), unless otherwise indicated)
123122
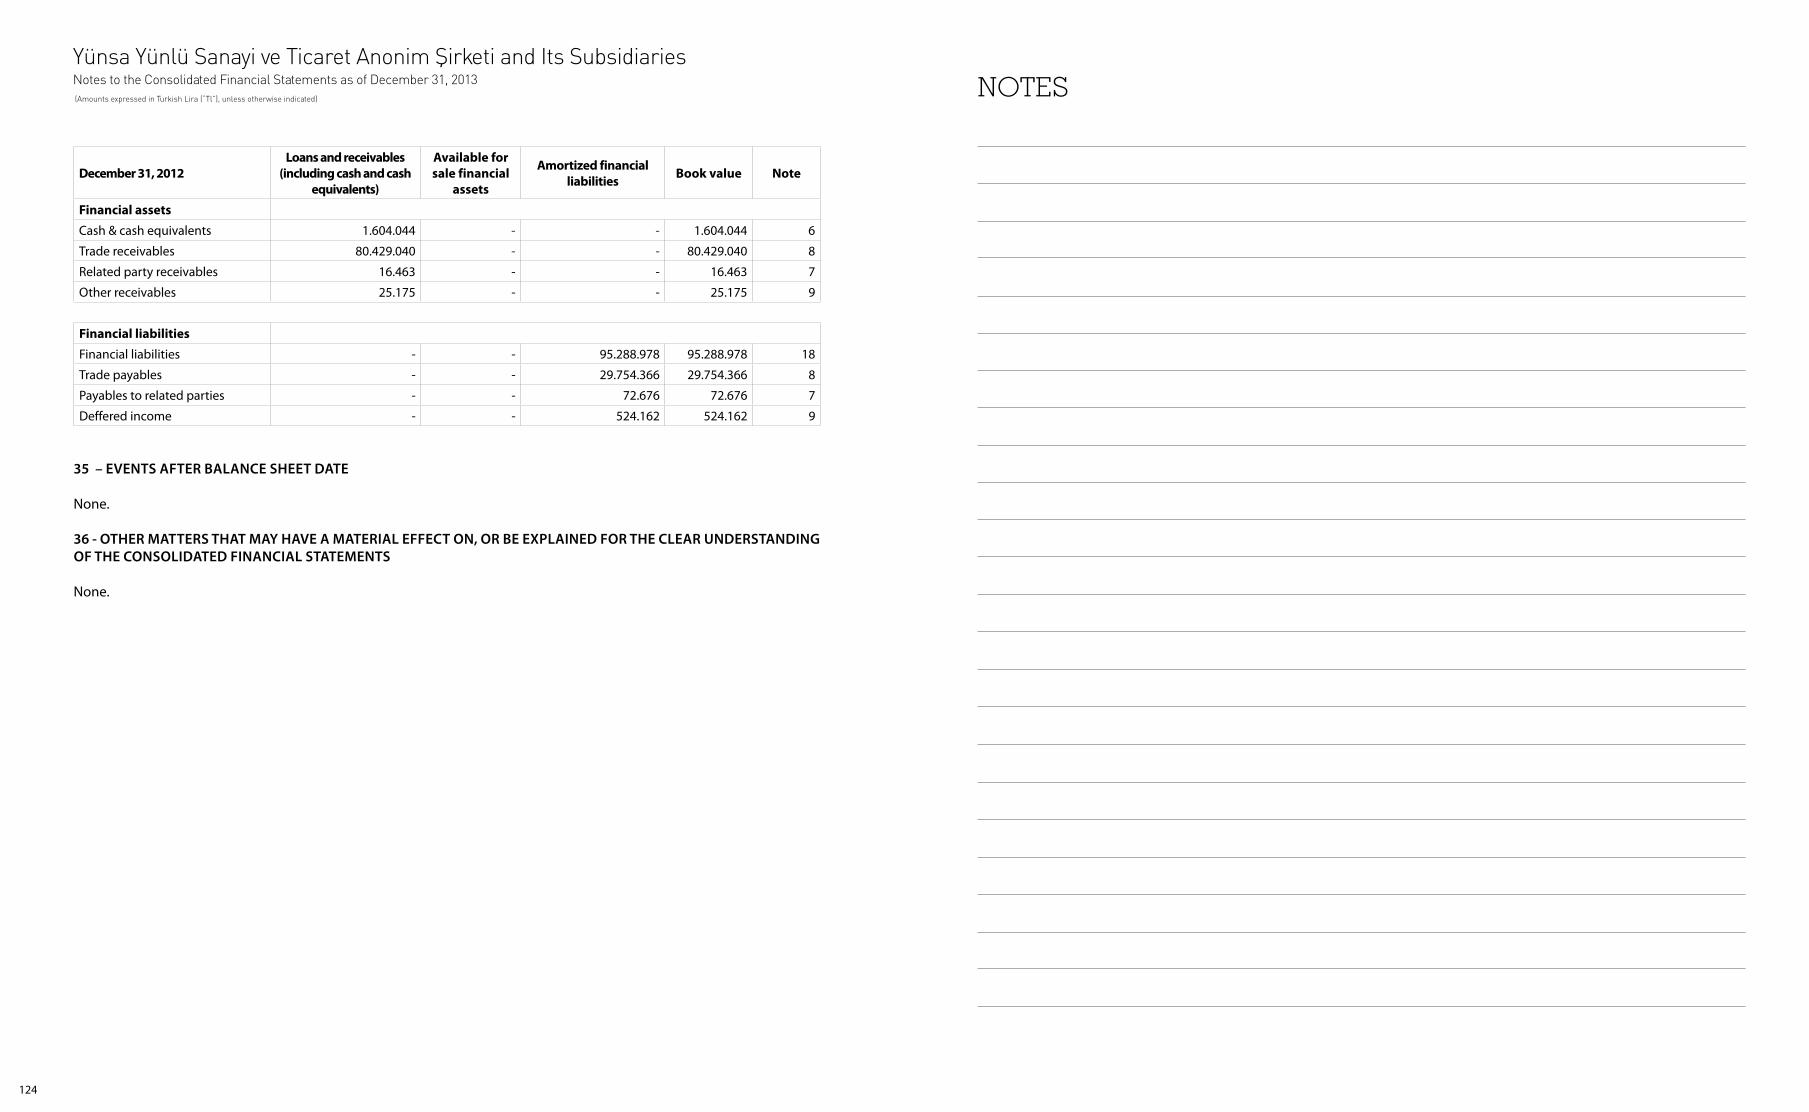
35 – eveNTS AFTeR BAlANCe SheeT DATe
None.
36 - OTheR MATTeRS ThAT MAY hAve A MATeRIAl eFFeCT ON, OR Be exPlAINeD FOR The CleAR uNDeRSTANDINg OF The CONSOlIDATeD FINANCIAl STATeMeNTS
None.
December 31, 2012Loans and receivables
(including cash and cash equivalents)
Available for sale financial
assets
Amortized financial liabilities Book value Note
Financial assets
Cash & cash equivalents 1.604.044 - - 1.604.044 6
Trade receivables 80.429.040 - - 80.429.040 8
Related party receivables 16.463 - - 16.463 7
Other receivables 25.175 - - 25.175 9
Financial liabilities
Financial liabilities - - 95.288.978 95.288.978 18
Trade payables - - 29.754.366 29.754.366 8
Payables to related parties - - 72.676 72.676 7
Deffered income - - 524.162 524.162 9
NOTESYünsa Yünlü Sanayi ve Ticaret Anonim Şirketi and Its SubsidiariesNotes to the Consolidated Financial Statements as of December 31, 2013 (Amounts expressed in Turkish Lira (“Tl”), unless otherwise indicated)
124


![CS301 - Algorithms Fall 2006-2007 Hüsnü Yenigün. CS301 – Algorithms [ Fall 2006-2007 ] 2 Contents About the course Introduction What is an algorithm?](https://img.pdfslide.us/doc/110x75/56649e9f5503460f94ba1a96/cs301-algorithms-fall-2006-2007-huesnue-yeniguen-cs301-algorithms-.jpg)