Embed Size (px)
Citation preview
2013 ANNUAL REPORT
HYUNDAI MARINE&FIREINSURANCE
Hyundai Marine & Fire Insurance Co., Ltd.163 Sejong-daero, Jongno-gu, Seoul, Korea | Tel: (82)1588-5656 | www.hi.co.kr
HYU
ND
AI IN
SUR
AN
CE 2013 ANN
UAL R
EPO
RT
HYU
ND
AI M
AR
INE
&FIR
E INSU
RA
NCE 2013 AN
NU
AL REP
OR
T
03Hyundai Marine & Fire Insurance
(Adj.) Total Shareholders’ Equities
FY2008
FY2012
FY2011
FY2009
FY2010
1,153,595
2,101,924
1,744,234
1,423,800
1,557,248
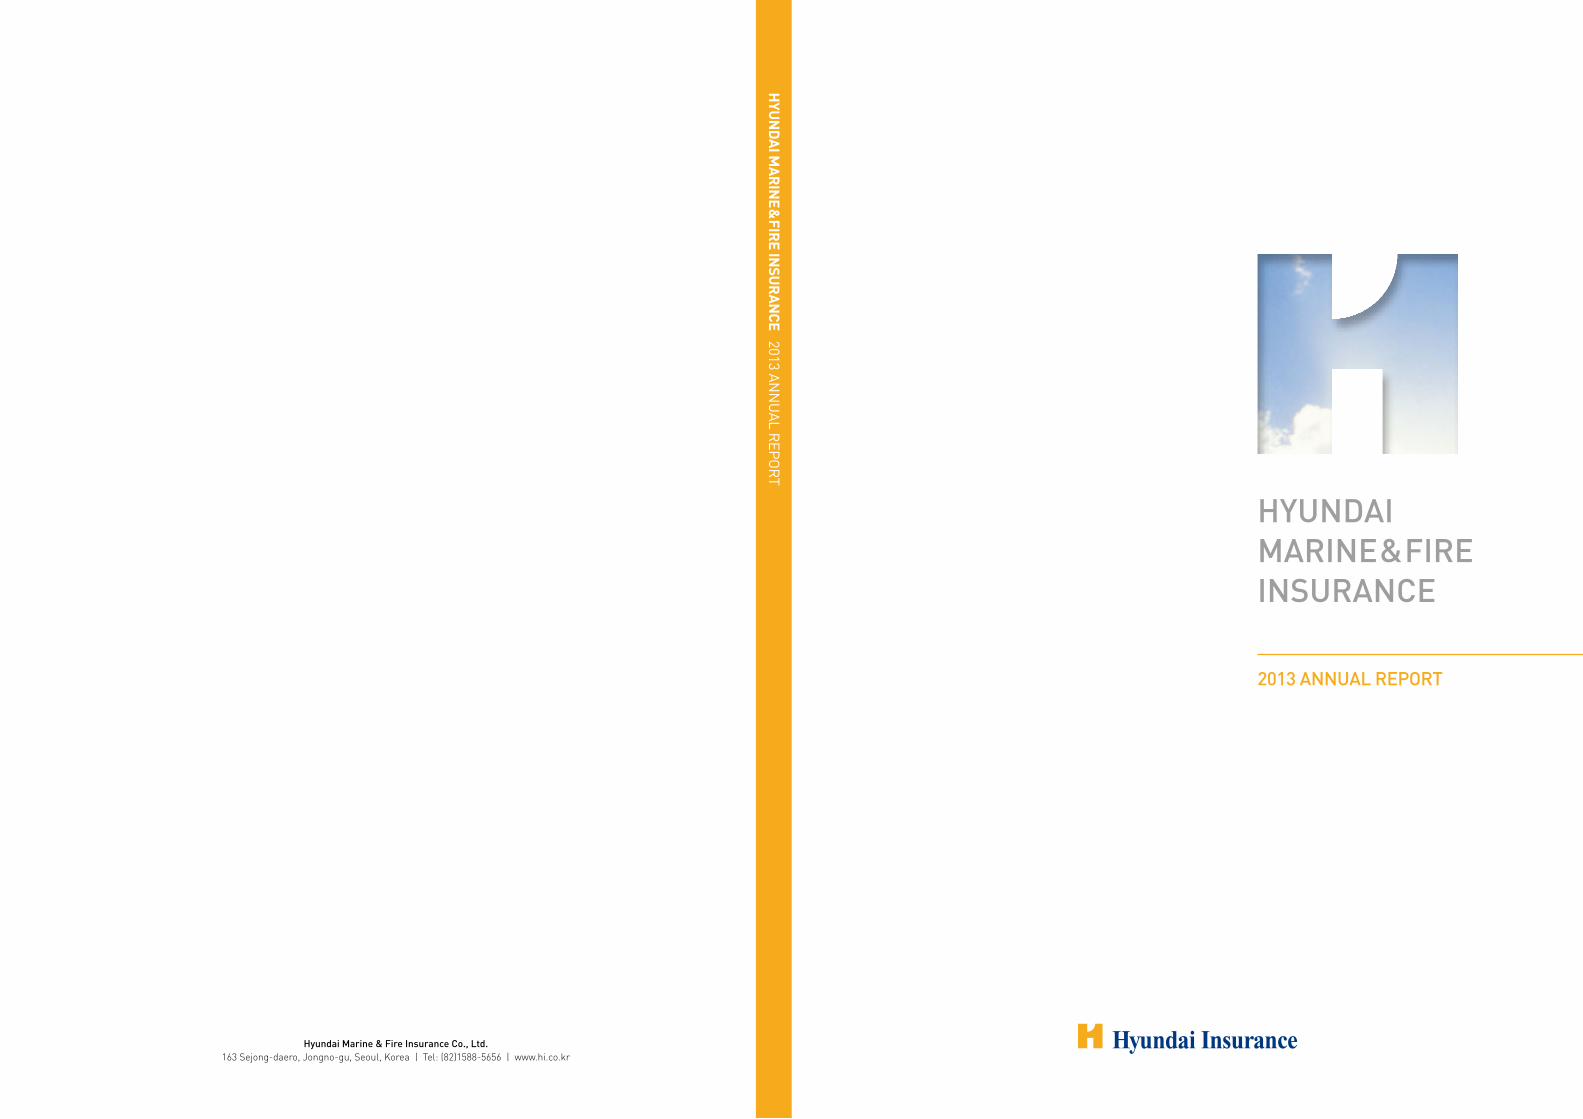
Financial Highlights
FY2010 FY2011
Classification (KRW million) (KRW million) (KRW million) (USD 1,000)
Direct Premium 7,610,424 9,316,657 10,157,664 9,109,461
Net Premium 6,786,492 8,421,672 9,232,199 8,279,498
Earned Premium 6,634,219 8,357,856 9,212,849 8,262,144
Underwriting Income -204,486 30,465 -212,672 -190,726
Investment Income 440,670 520,718 684,884 614,209
Total Operating Income 236,184 551,183 472,212 423,483
Net Income 159,485 392,756 333,381 298,979
(Adj. Net Income) 205,418
Total Assets 13,005,845 17,571,242 20,867,758 18,714,345
Invested Assets 10,313,054 13,422,220 16,290,616 14,609,534
Total Shareholders’ Equities 1,152,819 1,744,234 2,101,924 1,885,019
(Adj. Total Shareholders’ Equities) 1,557,248
FY2012
(Unit: KRW Million)Note) Figures refer to adjusted shareholders’ equities for FY2010 or before and to total shareholders’ equities for FY2011 and after.
Note 1) Based on the exchange rates used for accounting settlement in FY2012: PL basic rate 1,115.07 : U$1 / BS basic rate 1,112.10 : U$1Note 2) K-IFRS was applied from FY2011 on a non-consolidation basis.Note 3) Adjusted net income: Net income + Increase of Catastrophe Reserves / Adjusted shareholders’ equities: Total shareholders’ equities + Catastrophe Reserves
Direct Premium
FY2008
FY2009
FY2010
FY2011
FY2012
5,539,606
6,466,633
7,610,424
9,316,657
10,157,664
Total Assets
FY2008
FY2009
FY2010
FY2011
FY2012
9,487,404
11,093,772
13,005,845
17,571,242
20,867,758
(Adj.) Net Income
FY2008
FY2009
FY2010
FY2011
FY2012
155,421
224,983
205,418
392,756
333,381
Note) Figures refer to adjusted net income for FY2010 or before and to net income for FY2011 or after.
Reliable Hyundai Insurance
Financial Highlights 03
Future Vision 04
Company Overview and Management Philosophy 10
Chairman’s Letter 12
Message from the CEO 14
Business & Financial Summary 16
Vision Hi 2015
Vision Hi 2015 18
Sustainability report Sustainability Management 20
Ethics Management 22
Environment Management 24
Social Contribution Activities 26
Activities for Customer Satisfaction 28
Risk Management Activities 30
FY2012 Management News for Hyundai Insurance 32
Financial Issues
FY2012 Detailed Management Result Report 34
Financial Statements 45
About Hyundai Marine & Fire Insurance
Board of Directors/Executive Directors 108
Organization Chart 110
Subsidiary Companies 112
Company History 113
Global Networks 114
Reliable Hyundai Insurance
Financial Highlights
Future Vision
Company Overview and Management Philosophy
Chairman’s Letter
Message from the CEO
Report on Major Management Results
04 2013 Annual Report 05Hyundai Marine & Fire Insurance
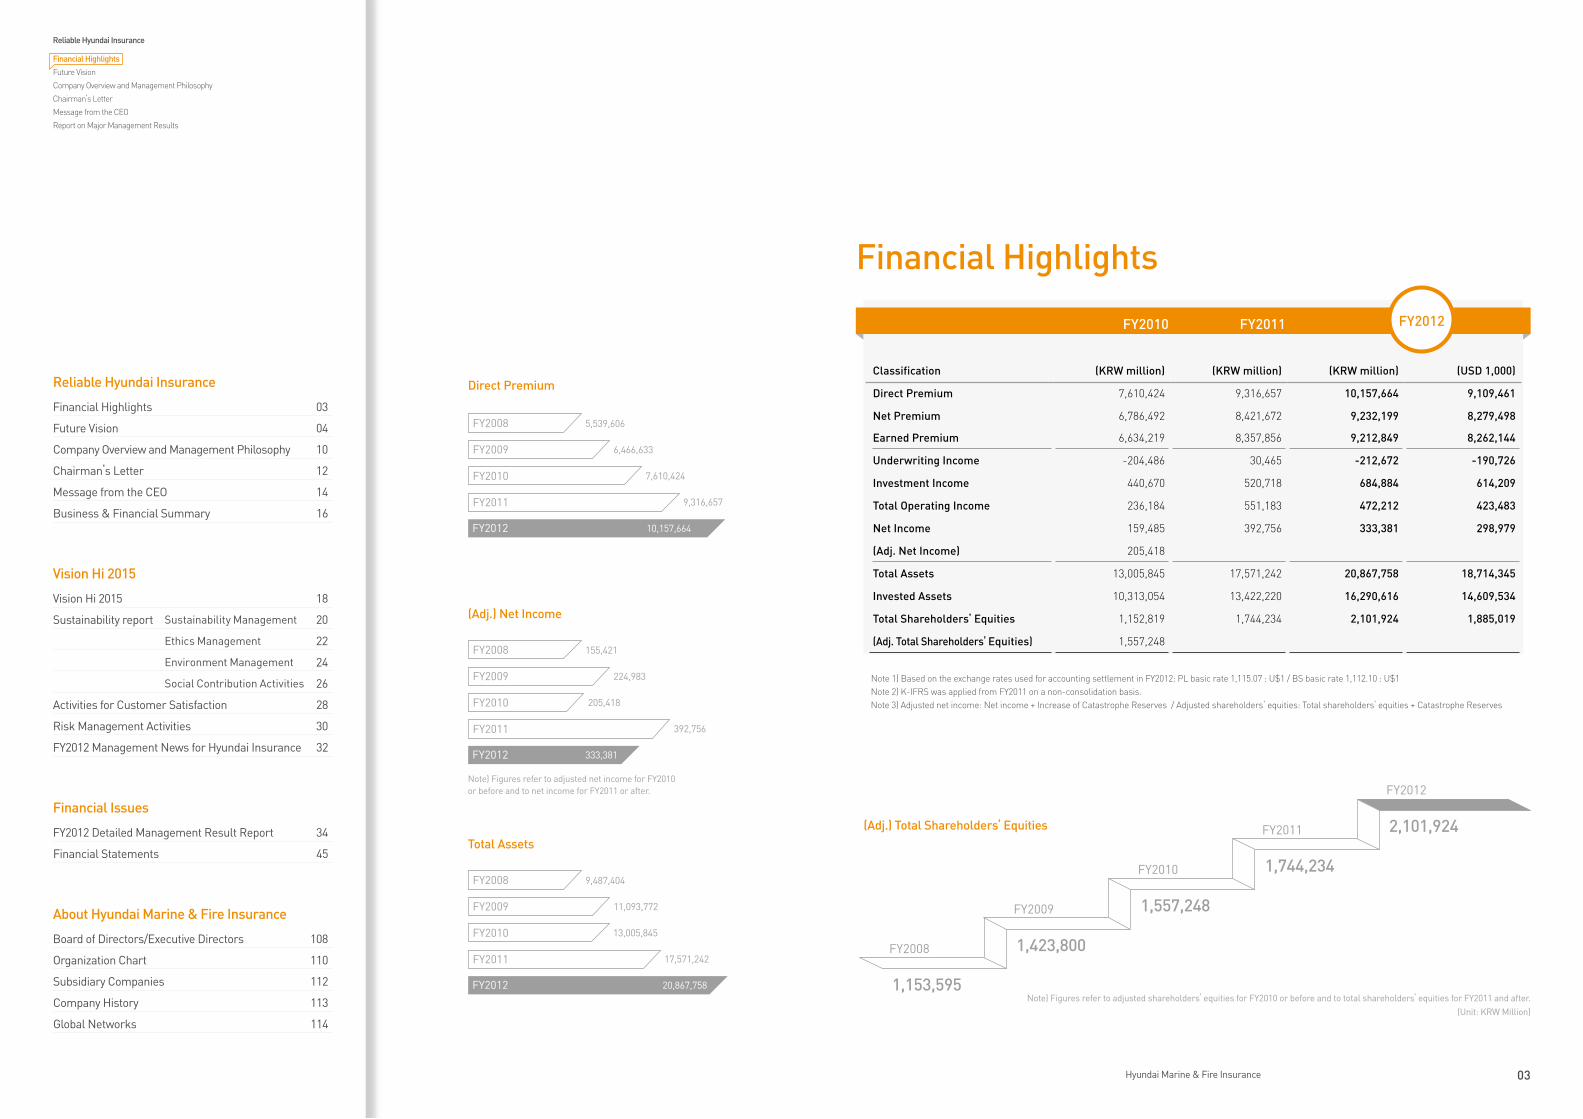
Righteous management
The leading insurance company creating best service for customers by righteous management. We always follow the right path and strive to grow with our customers by providing them with a first-rate service.
We trust in following the right path and believe that it is the best way to repay our customers
for putting their trust in us. We have built up a solid tradition of excellence since our
establishment in 1955 and are refreshing our resolve to provide satisfactory services to all
our customers for the next 100 years based on such a tradition.
Reliable Hyundai Insurance
Financial Highlights
Future Vision
Company Overview and Management Philosophy
Chairman’s Letter
Message from the CEO
Report on Major Management Results

06 2013 Annual Report 07Hyundai Marine & Fire Insurance
Customer satisfaction
Customers’ trust and satisfaction – Our most valuable assets
Hyundai Marine & Fire Insurance will always act as your trusted partner for life.
We conduct first-rate management that leave our customers satisfied by developing
creative products suited to customers’ needs, planning exemplary insurance aimed at
securing our customers a prosperous future, and providing positive and differentiated
compensation.
Reliable Hyundai Insurance
Financial Highlights
Future Vision
Company Overview and Management Philosophy
Chairman’s Letter
Message from the CEO
Report on Major Management Results
08 2013 Annual Report 09Hyundai Marine & Fire Insurance
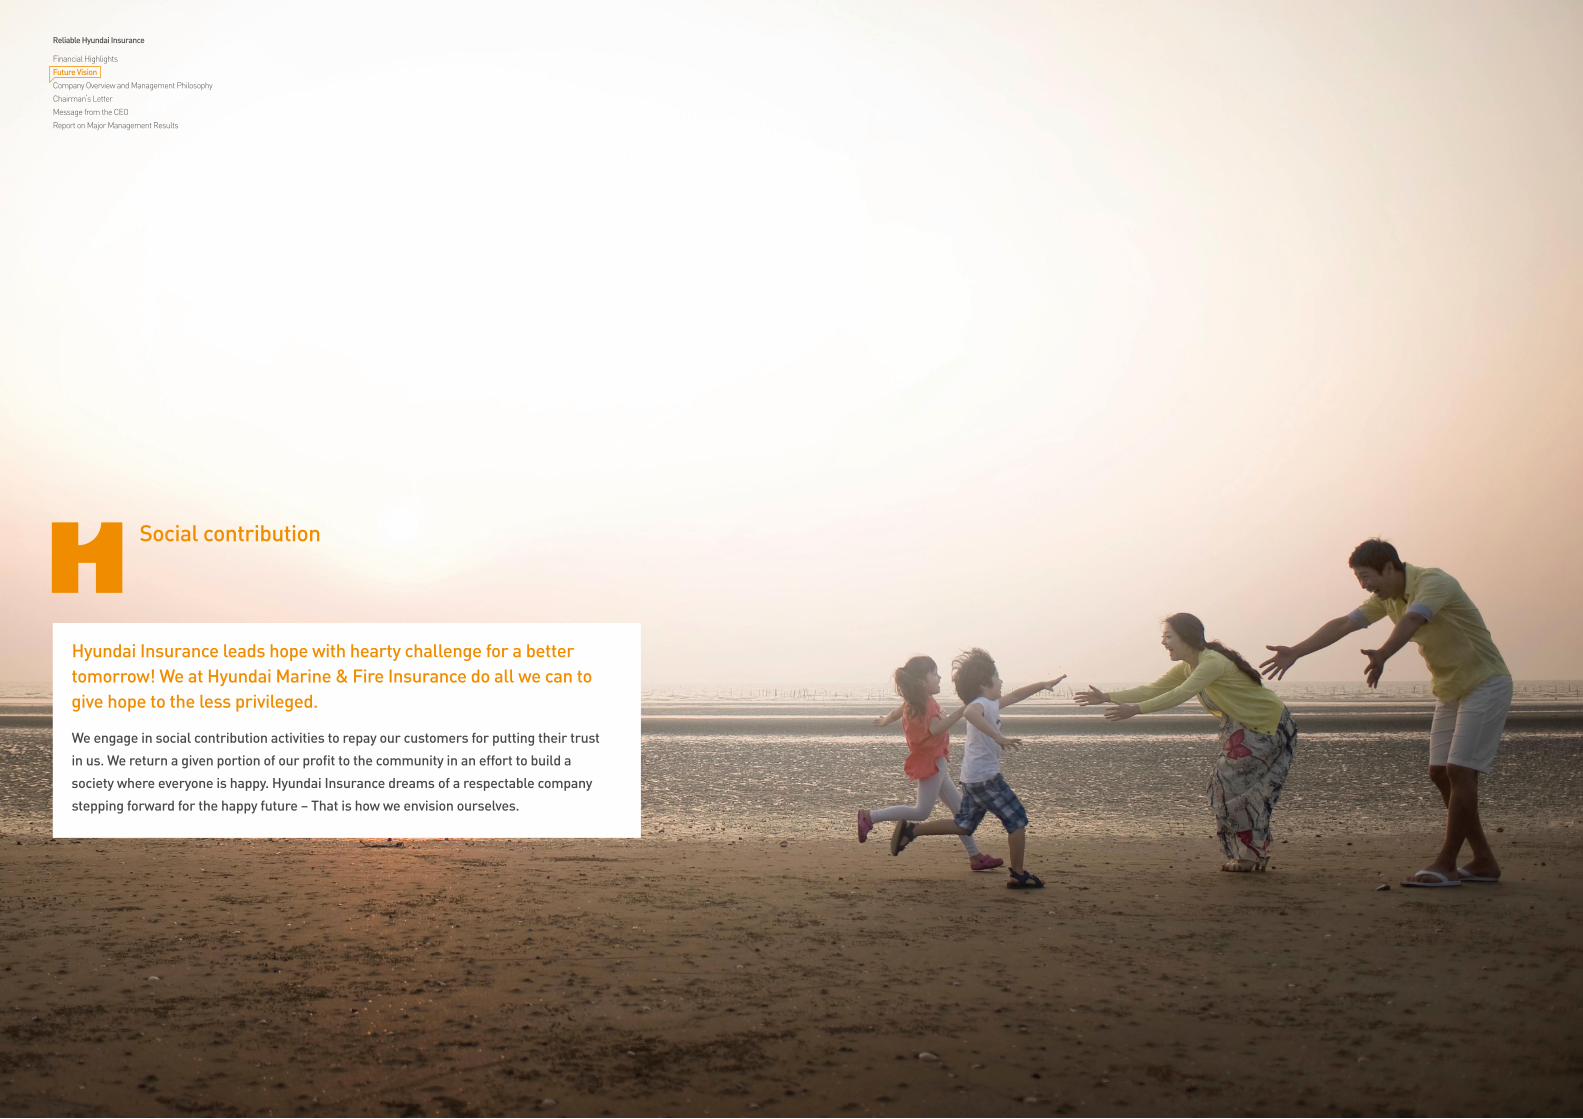
Hyundai Insurance leads hope with hearty challenge for a better tomorrow! We at Hyundai Marine & Fire Insurance do all we can to give hope to the less privileged.
We engage in social contribution activities to repay our customers for putting their trust
in us. We return a given portion of our profit to the community in an effort to build a
society where everyone is happy. Hyundai Insurance dreams of a respectable company
stepping forward for the happy future – That is how we envision ourselves.
Social contribution
Reliable Hyundai Insurance
Financial Highlights
Future Vision
Company Overview and Management Philosophy
Chairman’s Letter
Message from the CEO
Report on Major Management Results
10 2013 Annual Report 11Hyundai Marine & Fire Insurance
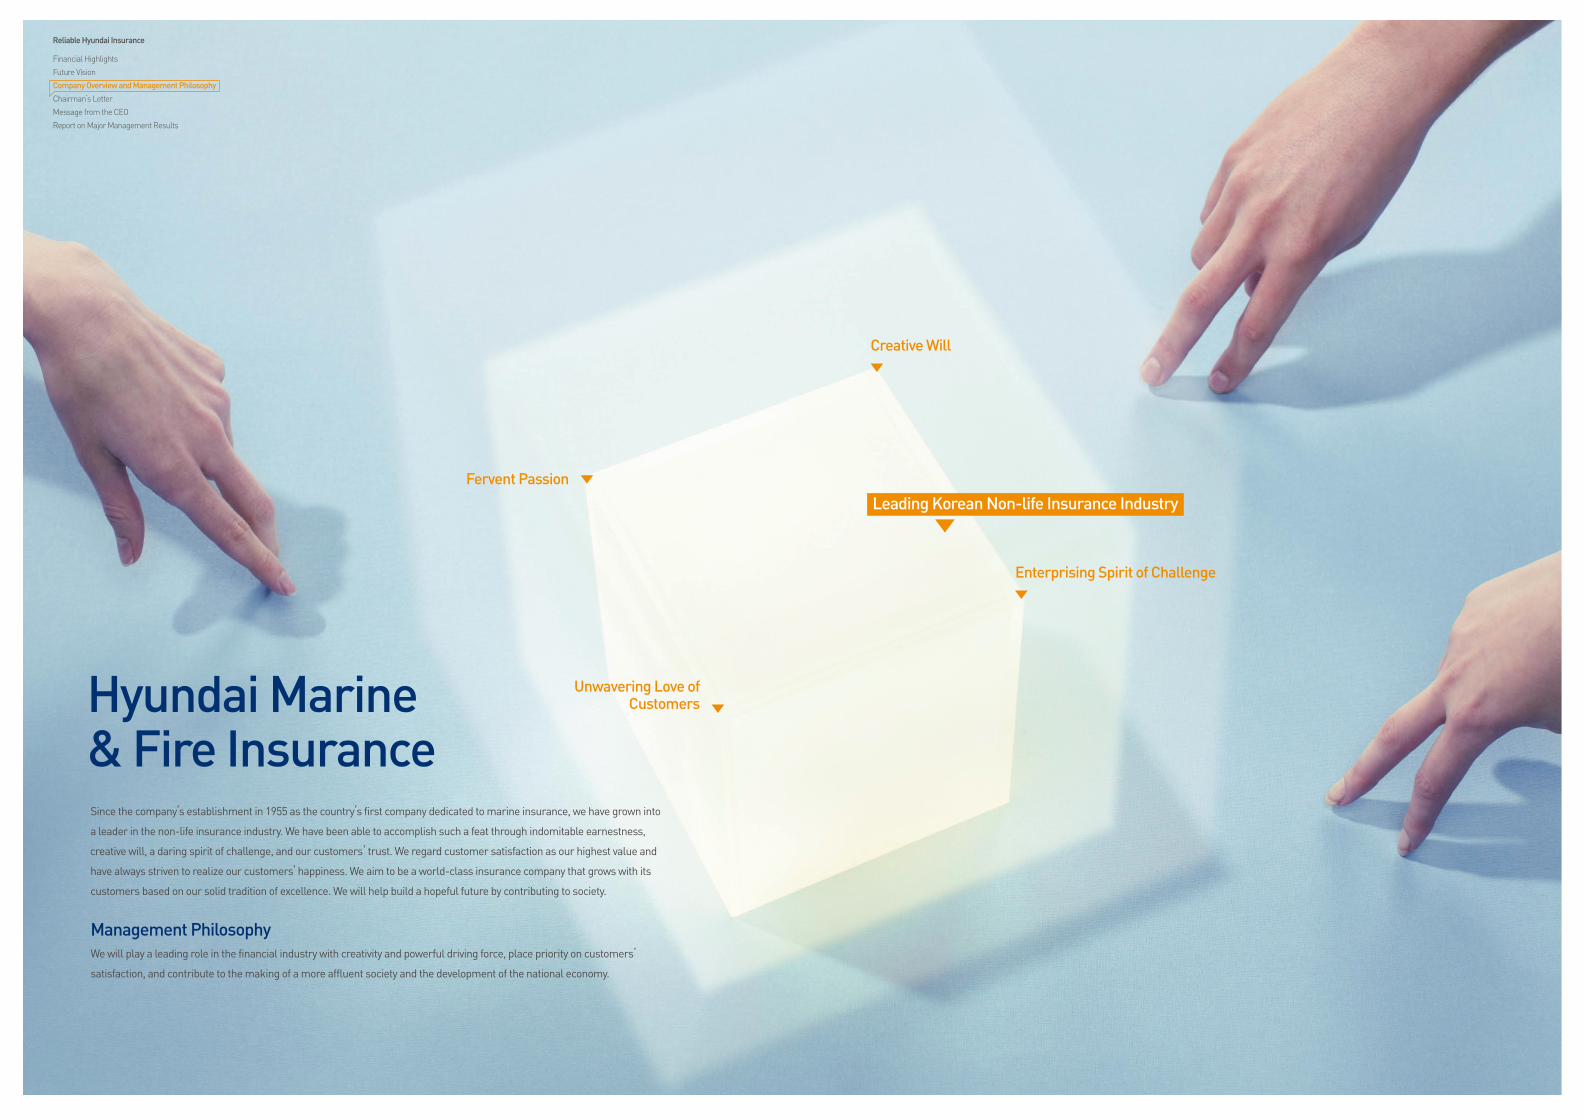
Since the company’s establishment in 1955 as the country’s first company dedicated to marine insurance, we have grown into
a leader in the non-life insurance industry. We have been able to accomplish such a feat through indomitable earnestness,
creative will, a daring spirit of challenge, and our customers’ trust. We regard customer satisfaction as our highest value and
have always striven to realize our customers’ happiness. We aim to be a world-class insurance company that grows with its
customers based on our solid tradition of excellence. We will help build a hopeful future by contributing to society.
Management PhilosophyWe will play a leading role in the financial industry with creativity and powerful driving force, place priority on customers’
satisfaction, and contribute to the making of a more affluent society and the development of the national economy.
Enterprising Spirit of Challenge
Unwavering Love of Customers
Fervent Passion
Creative Will
Hyundai Marine& Fire Insurance
Leading Korean Non-life Insurance Industry
Reliable Hyundai Insurance
Financial Highlights
Future Vision
Company Overview and Management Philosophy
Chairman’s Letter
Message from the CEO
Report on Major Management Results
12 2013 Annual Report 13Hyundai Marine & Fire Insurance
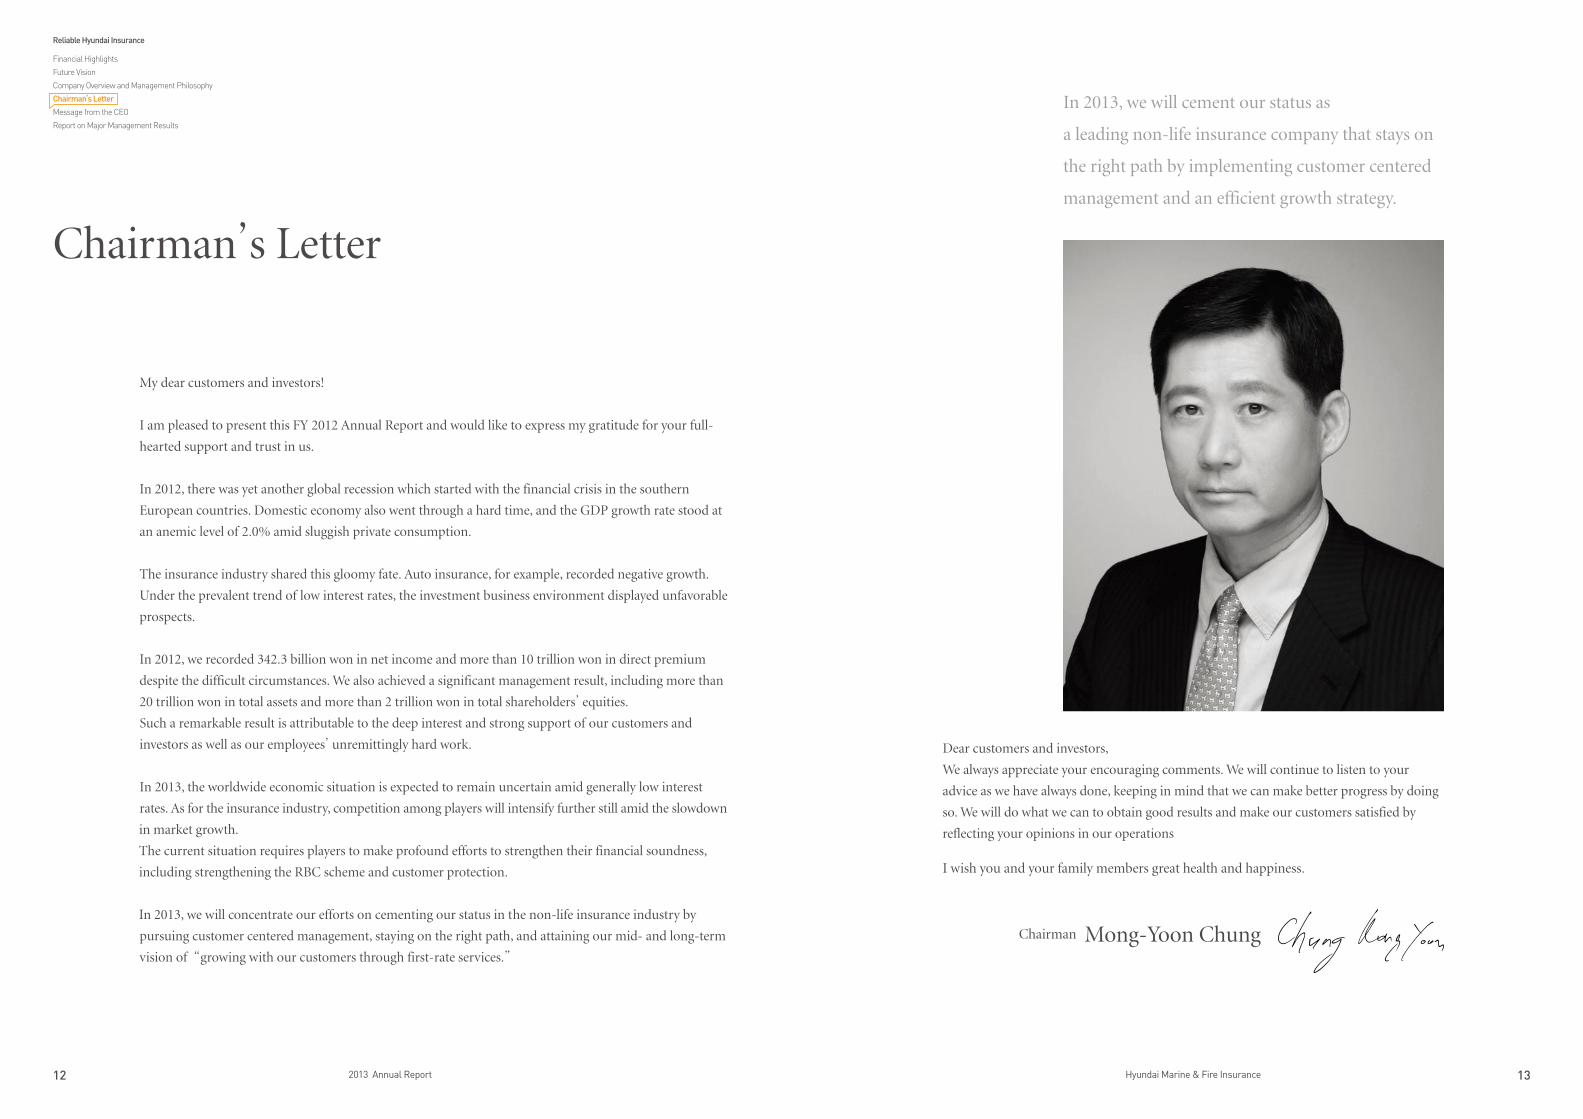
Chairman’s Letter
My dear customers and investors!
I am pleased to present this FY 2012 Annual Report and would like to express my gratitude for your full-
hearted support and trust in us.
In 2012, there was yet another global recession which started with the financial crisis in the southern
European countries. Domestic economy also went through a hard time, and the GDP growth rate stood at
an anemic level of 2.0% amid sluggish private consumption.
The insurance industry shared this gloomy fate. Auto insurance, for example, recorded negative growth.
Under the prevalent trend of low interest rates, the investment business environment displayed unfavorable
prospects.
In 2012, we recorded 342.3 billion won in net income and more than 10 trillion won in direct premium
despite the difficult circumstances. We also achieved a significant management result, including more than
20 trillion won in total assets and more than 2 trillion won in total shareholders’ equities.
Such a remarkable result is attributable to the deep interest and strong support of our customers and
investors as well as our employees’ unremittingly hard work.
In 2013, the worldwide economic situation is expected to remain uncertain amid generally low interest
rates. As for the insurance industry, competition among players will intensify further still amid the slowdown
in market growth.
The current situation requires players to make profound efforts to strengthen their financial soundness,
including strengthening the RBC scheme and customer protection.
In 2013, we will concentrate our efforts on cementing our status in the non-life insurance industry by
pursuing customer centered management, staying on the right path, and attaining our mid- and long-term
vision of “growing with our customers through first-rate services.”
Dear customers and investors,
We always appreciate your encouraging comments. We will continue to listen to your
advice as we have always done, keeping in mind that we can make better progress by doing
so. We will do what we can to obtain good results and make our customers satisfied by
reflecting your opinions in our operations
I wish you and your family members great health and happiness.
Chairman Mong-Yoon Chung
In 2013, we will cement our status as
a leading non-life insurance company that stays on
the right path by implementing customer centered
management and an efficient growth strategy.
Reliable Hyundai Insurance
Financial Highlights
Future Vision
Company Overview and Management Philosophy
Chairman’s Letter
Message from the CEO
Report on Major Management Results
14 2013 Annual Report 15Hyundai Marine & Fire Insurance
Dear customers and investors, We expect to see diverse changes in FY2013.
Uncertainty both in and out of the country will continue to prevail amid
the southern European financial crisis and the economic slowdown of the
United States and China. Low growth and low interest rates will continue
for the time being. It appears that we should take preemptive steps in
conjunction with forthcoming changes in the relevant systems, such as
reducing customer complaints and strengthening the RBC scheme.
To deal with such changes, we will adopt the three following management
guidelines in 2013:
First, we will carry out business based on principle and rules.
Second, we will strengthen our sales capability with the focus on efficiency
and profit. We will ensure that a profit-oriented sales structure takes root.
We will also strive to execute distribution expenses and run the organization
more efficiently.
Third, we will push ahead with the innovation of products and services in
a customer centered way. We will continue to establish a more convenient
business process for customers and enhance the level of customers’
satisfaction with differentiated products and our claims service.
Please rest assured that we will do our best to obtain better management
results by carrying out the said management guidelines thoroughly in 2013.
Thank you.
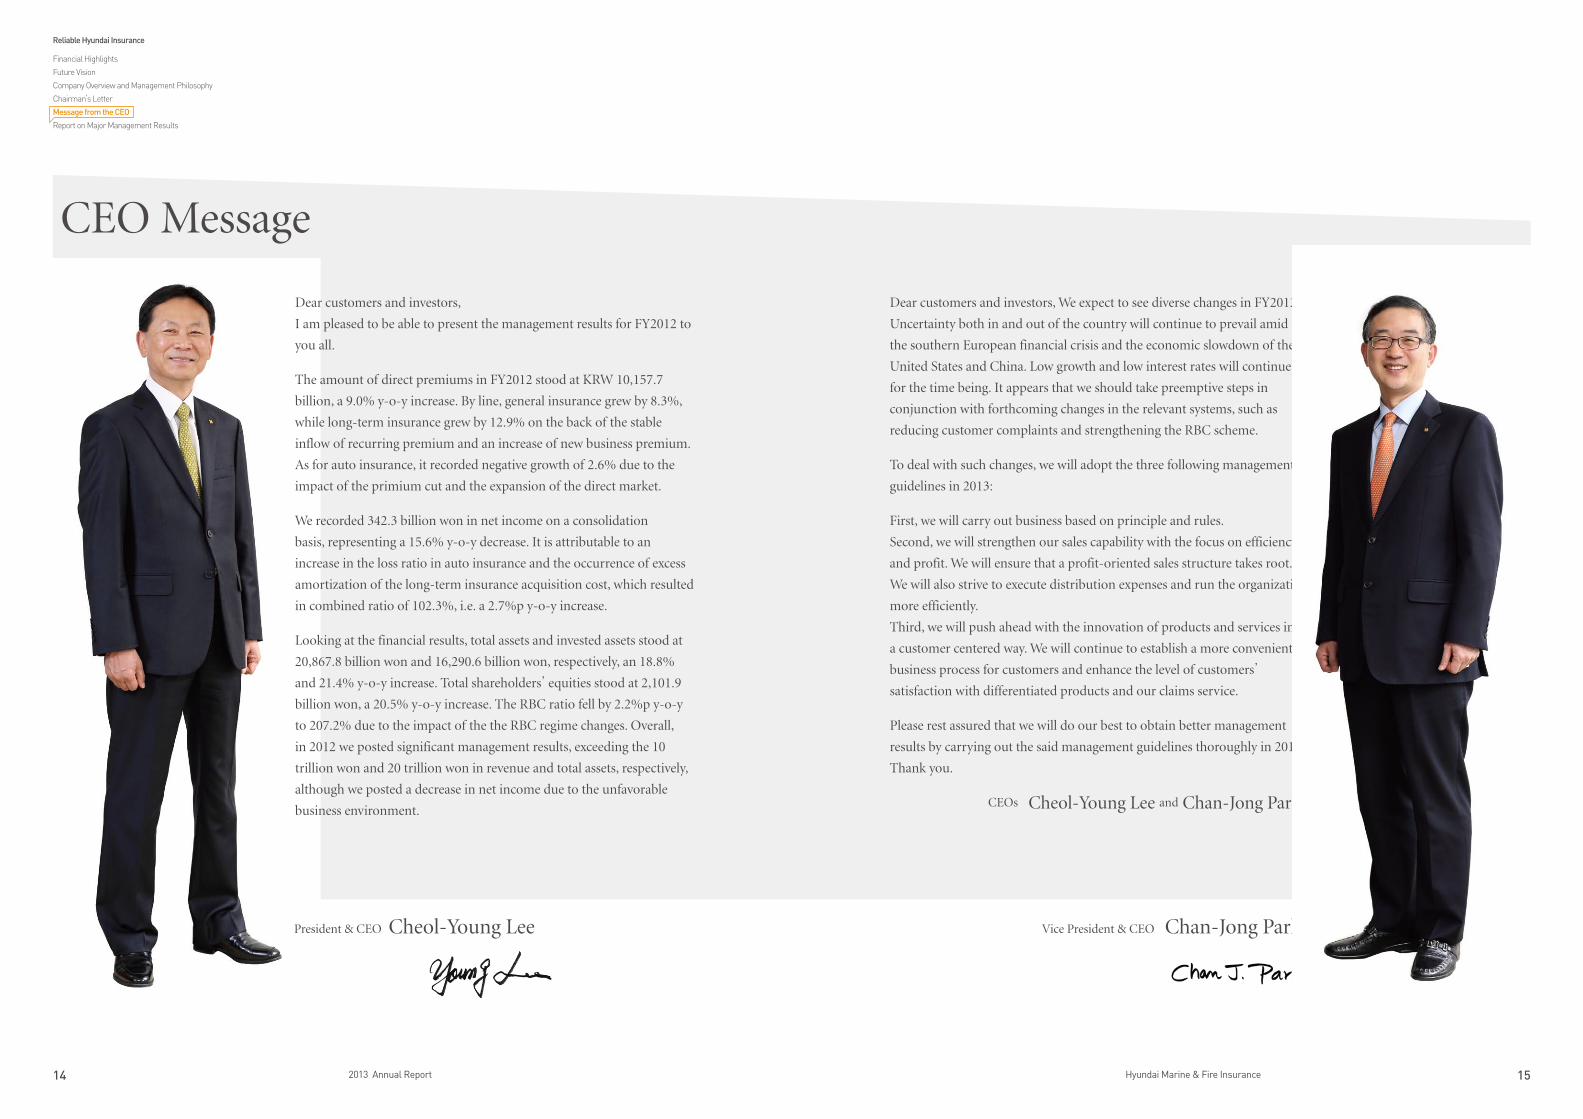
CEO Message
Dear customers and investors,
I am pleased to be able to present the management results for FY2012 to
you all.
The amount of direct premiums in FY2012 stood at KRW 10,157.7
billion, a 9.0% y-o-y increase. By line, general insurance grew by 8.3%,
while long-term insurance grew by 12.9% on the back of the stable
inflow of recurring premium and an increase of new business premium.
As for auto insurance, it recorded negative growth of 2.6% due to the
impact of the primium cut and the expansion of the direct market.
We recorded 342.3 billion won in net income on a consolidation
basis, representing a 15.6% y-o-y decrease. It is attributable to an
increase in the loss ratio in auto insurance and the occurrence of excess
amortization of the long-term insurance acquisition cost, which resulted
in combined ratio of 102.3%, i.e. a 2.7%p y-o-y increase.
Looking at the financial results, total assets and invested assets stood at
20,867.8 billion won and 16,290.6 billion won, respectively, an 18.8%
and 21.4% y-o-y increase. Total shareholders’ equities stood at 2,101.9
billion won, a 20.5% y-o-y increase. The RBC ratio fell by 2.2%p y-o-y
to 207.2% due to the impact of the the RBC regime changes. Overall,
in 2012 we posted significant management results, exceeding the 10
trillion won and 20 trillion won in revenue and total assets, respectively,
although we posted a decrease in net income due to the unfavorable
business environment.CEOs Cheol-Young Lee and Chan-Jong Park
Vice President & CEO Chan-Jong ParkPresident & CEO Cheol-Young Lee
Reliable Hyundai Insurance
Financial Highlights
Future Vision
Company Overview and Management Philosophy
Chairman’s Letter
Message from the CEO
Report on Major Management Results
16 2013 Annual Report 17Hyundai Marine & Fire Insurance
Business & Financial Summary
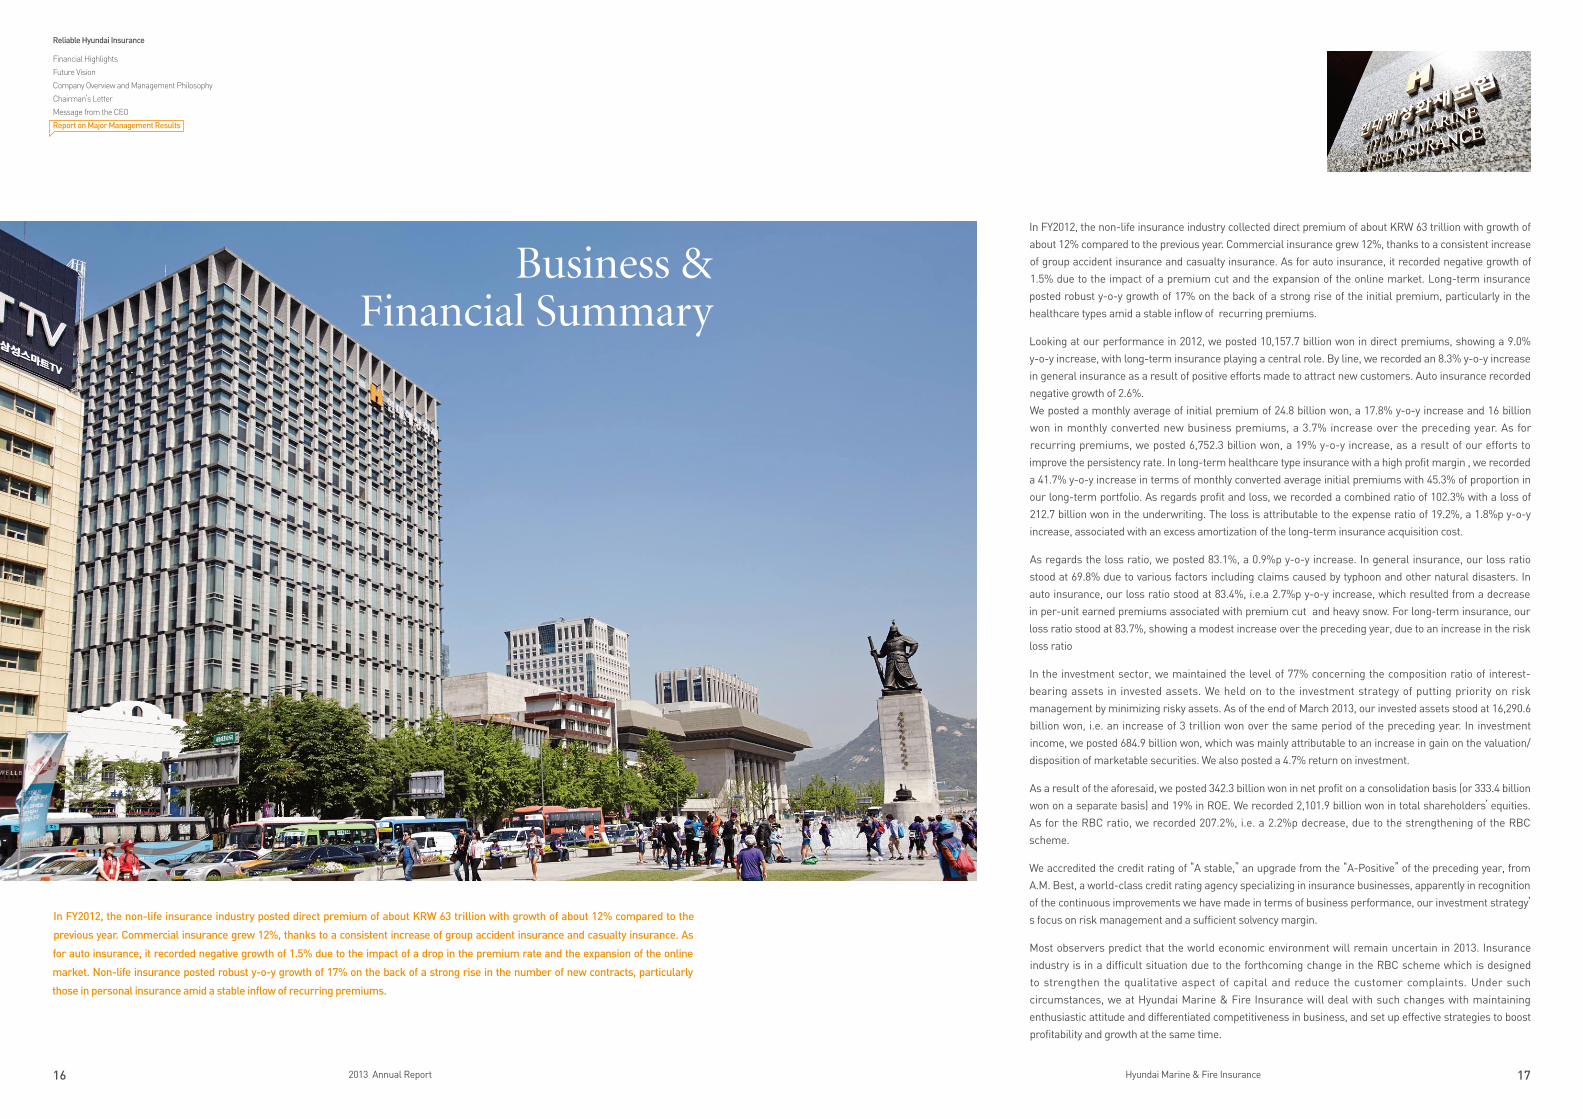
In FY2012, the non-life insurance industry collected direct premium of about KRW 63 trillion with growth of
about 12% compared to the previous year. Commercial insurance grew 12%, thanks to a consistent increase
of group accident insurance and casualty insurance. As for auto insurance, it recorded negative growth of
1.5% due to the impact of a premium cut and the expansion of the online market. Long-term insurance
posted robust y-o-y growth of 17% on the back of a strong rise of the initial premium, particularly in the
healthcare types amid a stable inflow of recurring premiums.
Looking at our performance in 2012, we posted 10,157.7 billion won in direct premiums, showing a 9.0%
y-o-y increase, with long-term insurance playing a central role. By line, we recorded an 8.3% y-o-y increase
in general insurance as a result of positive efforts made to attract new customers. Auto insurance recorded
negative growth of 2.6%.
We posted a monthly average of initial premium of 24.8 billion won, a 17.8% y-o-y increase and 16 billion
won in monthly converted new business premiums, a 3.7% increase over the preceding year. As for
recurring premiums, we posted 6,752.3 billion won, a 19% y-o-y increase, as a result of our efforts to
improve the persistency rate. In long-term healthcare type insurance with a high profit margin , we recorded
a 41.7% y-o-y increase in terms of monthly converted average initial premiums with 45.3% of proportion in
our long-term portfolio. As regards profit and loss, we recorded a combined ratio of 102.3% with a loss of
212.7 billion won in the underwriting. The loss is attributable to the expense ratio of 19.2%, a 1.8%p y-o-y
increase, associated with an excess amortization of the long-term insurance acquisition cost.
As regards the loss ratio, we posted 83.1%, a 0.9%p y-o-y increase. In general insurance, our loss ratio
stood at 69.8% due to various factors including claims caused by typhoon and other natural disasters. In
auto insurance, our loss ratio stood at 83.4%, i.e.a 2.7%p y-o-y increase, which resulted from a decrease
in per-unit earned premiums associated with premium cut and heavy snow. For long-term insurance, our
loss ratio stood at 83.7%, showing a modest increase over the preceding year, due to an increase in the risk
loss ratio
In the investment sector, we maintained the level of 77% concerning the composition ratio of interest-
bearing assets in invested assets. We held on to the investment strategy of putting priority on risk
management by minimizing risky assets. As of the end of March 2013, our invested assets stood at 16,290.6
billion won, i.e. an increase of 3 trillion won over the same period of the preceding year. In investment
income, we posted 684.9 billion won, which was mainly attributable to an increase in gain on the valuation/
disposition of marketable securities. We also posted a 4.7% return on investment.
As a result of the aforesaid, we posted 342.3 billion won in net profit on a consolidation basis (or 333.4 billion
won on a separate basis) and 19% in ROE. We recorded 2,101.9 billion won in total shareholders’ equities.
As for the RBC ratio, we recorded 207.2%, i.e. a 2.2%p decrease, due to the strengthening of the RBC
scheme.
We accredited the credit rating of “A stable,” an upgrade from the “A-Positive” of the preceding year, from
A.M. Best, a world-class credit rating agency specializing in insurance businesses, apparently in recognition
of the continuous improvements we have made in terms of business performance, our investment strategy’
s focus on risk management and a sufficient solvency margin.
Most observers predict that the world economic environment will remain uncertain in 2013. Insurance
industry is in a difficult situation due to the forthcoming change in the RBC scheme which is designed
to strengthen the qualitative aspect of capital and reduce the customer complaints. Under such
circumstances, we at Hyundai Marine & Fire Insurance will deal with such changes with maintaining
enthusiastic attitude and differentiated competitiveness in business, and set up effective strategies to boost
profitability and growth at the same time.
In FY2012, the non-life insurance industry posted direct premium of about KRW 63 trillion with growth of about 12% compared to the
previous year. Commercial insurance grew 12%, thanks to a consistent increase of group accident insurance and casualty insurance. As
for auto insurance, it recorded negative growth of 1.5% due to the impact of a drop in the premium rate and the expansion of the online
market. Non-life insurance posted robust y-o-y growth of 17% on the back of a strong rise in the number of new contracts, particularly
those in personal insurance amid a stable inflow of recurring premiums.
Reliable Hyundai Insurance
Financial Highlights
Future Vision
Company Overview and Management Philosophy
Chairman’s Letter
Message from the CEO
Report on Major Management Results
18 2013 Annual Report 19Hyundai Marine & Fire Insurance
VISION Hi 2015
To realize our new vision, Hyundai Insurance has chosen mid and long-term strategic tasks for each business division
in line with our 4 major management strategy directions and 12 key strategies.
Based on the momentum gathered through the promotion of 47 strategic measures in the preceding year, we selected and pushed
ahead with 45 strategic measures in 2012 in consideration of their importance and urgency among those to be promoted by each division
by 2015. We successfully concluded the one-year-long FY2012 mid- and long-term strategic measures, in which a total of 200-plus
employees took part, through the kickoff in April 2012, interim checks and progress appraisals, and the final report session in March
2013.
The ongoing mid- and long-term strategic measures, which were implemented for successful accomplishment of the company’s Vision
Hi 2015, may reap good results thanks to the positive efforts made by the relevant director and project members in 2012, the second year
of the project, despite the many difficulties, including rapidly changing external conditions. We will continue to push forward with these
measures, positively using our accumulated know-how and reflecting changes in the relevant environment.
We shall bolster basic competitiveness as an insurer to achieve our “Vision Hi 2015” and become a ‘Leading insurance
company creating the best services for customers’ by concentrating all our capabilities on maximizing customer
values along with internally solid growth.
“The leading insurance company creating best service for customers”We at Hyundai Insurance established our mid and long-term vision, “Hi 2010, Insurer with Korea’s Top Competitiveness” and have been
doing our best in all sectors. As a result, we have grown remarkably in business revenue and other fields. Nonetheless, the future is
uncertain because of changes in the business environment including the saturation of the insurance market, entry of new insurers
into the insurance market, continuous sales channel diversification, and consumer protection consolidation trend. These present new
challenges and tasks that we must overcome.
We have established a new mid and long-term vision dubbed “Hi 2015,” proclaiming it both internally and externally in April 2011 to
proactively cope with the upcoming environmental changes and to continuously grow as a company. Under the newly adopted vision,
namely, “the leading insurance company creating best service for customers”, we will provide high-quality insurance products and
services, faithfully holding on to our role of contributing to customers’ happiness and social security as an insurance business, and
continuing to grow accordingly.
To that end, we have set the following mid-and long-term management strategies: strengthening core business competitiveness,
improving business infrastructure, maximizing customer value, and preparing new growth engines. Under these strategies, we will strive
to remain at the top in terms of overall sales, profitability, and competitiveness, push forward with business more efficiently, and continue
to provide services in a way that will enhance the quality of our customers’ lives. We will also strive to continue to grow by strengthening
the basis for new growth and overcoming the limitations of the insurance market.
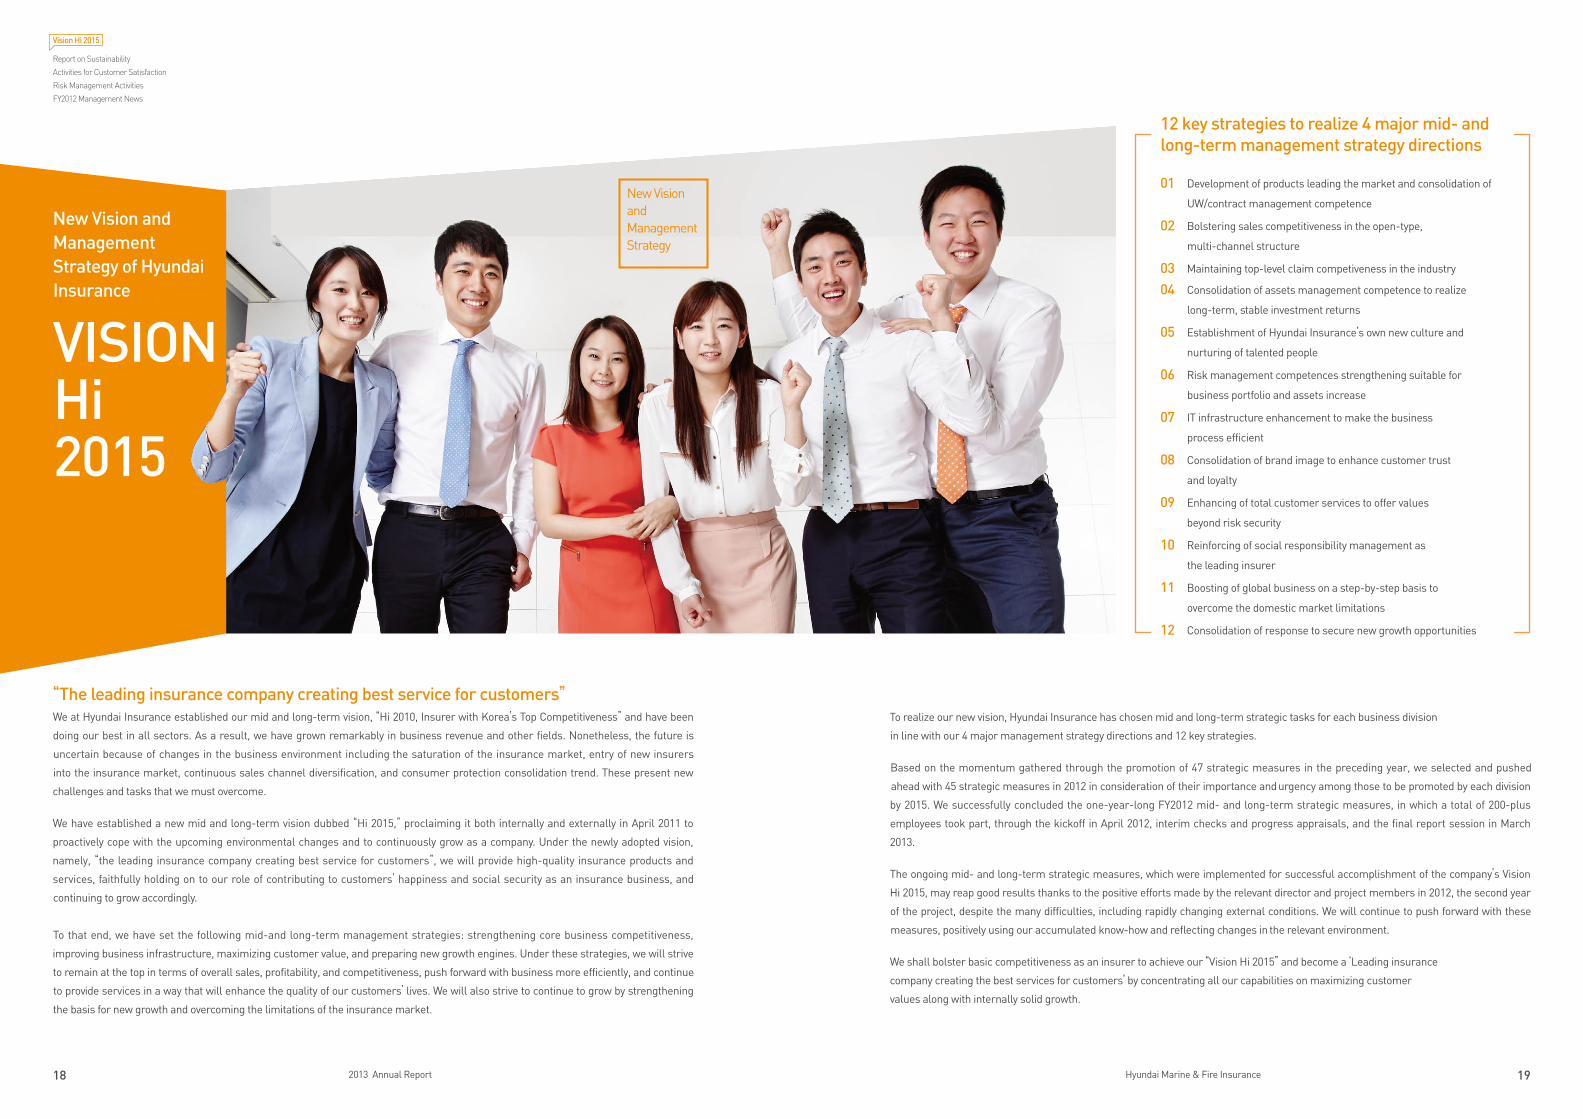
12 key strategies to realize 4 major mid- and long-term management strategy directions
01 Development of products leading the market and consolidation of
UW/contract management competence
02 Bolstering sales competitiveness in the open-type,
multi-channel structure
03 Maintaining top-level claim competiveness in the industry
04 Consolidation of assets management competence to realize
long-term, stable investment returns
05 Establishment of Hyundai Insurance’s own new culture and
nurturing of talented people
06 Risk management competences strengthening suitable for
business portfolio and assets increase
07 IT infrastructure enhancement to make the business
process efficient
08 Consolidation of brand image to enhance customer trust
and loyalty
09 Enhancing of total customer services to offer values
beyond risk security
10 Reinforcing of social responsibility management as
the leading insurer
11 Boosting of global business on a step-by-step basis to
overcome the domestic market limitations
12 Consolidation of response to secure new growth opportunities
New Vision and Management Strategy of Hyundai Insurance
New Vision and Management Strategy
Vision Hi 2015
Report on Sustainability
Activities for Customer Satisfaction
Risk Management Activities
FY2012 Management News
20 2013 Annual Report 21Hyundai Marine & Fire Insurance
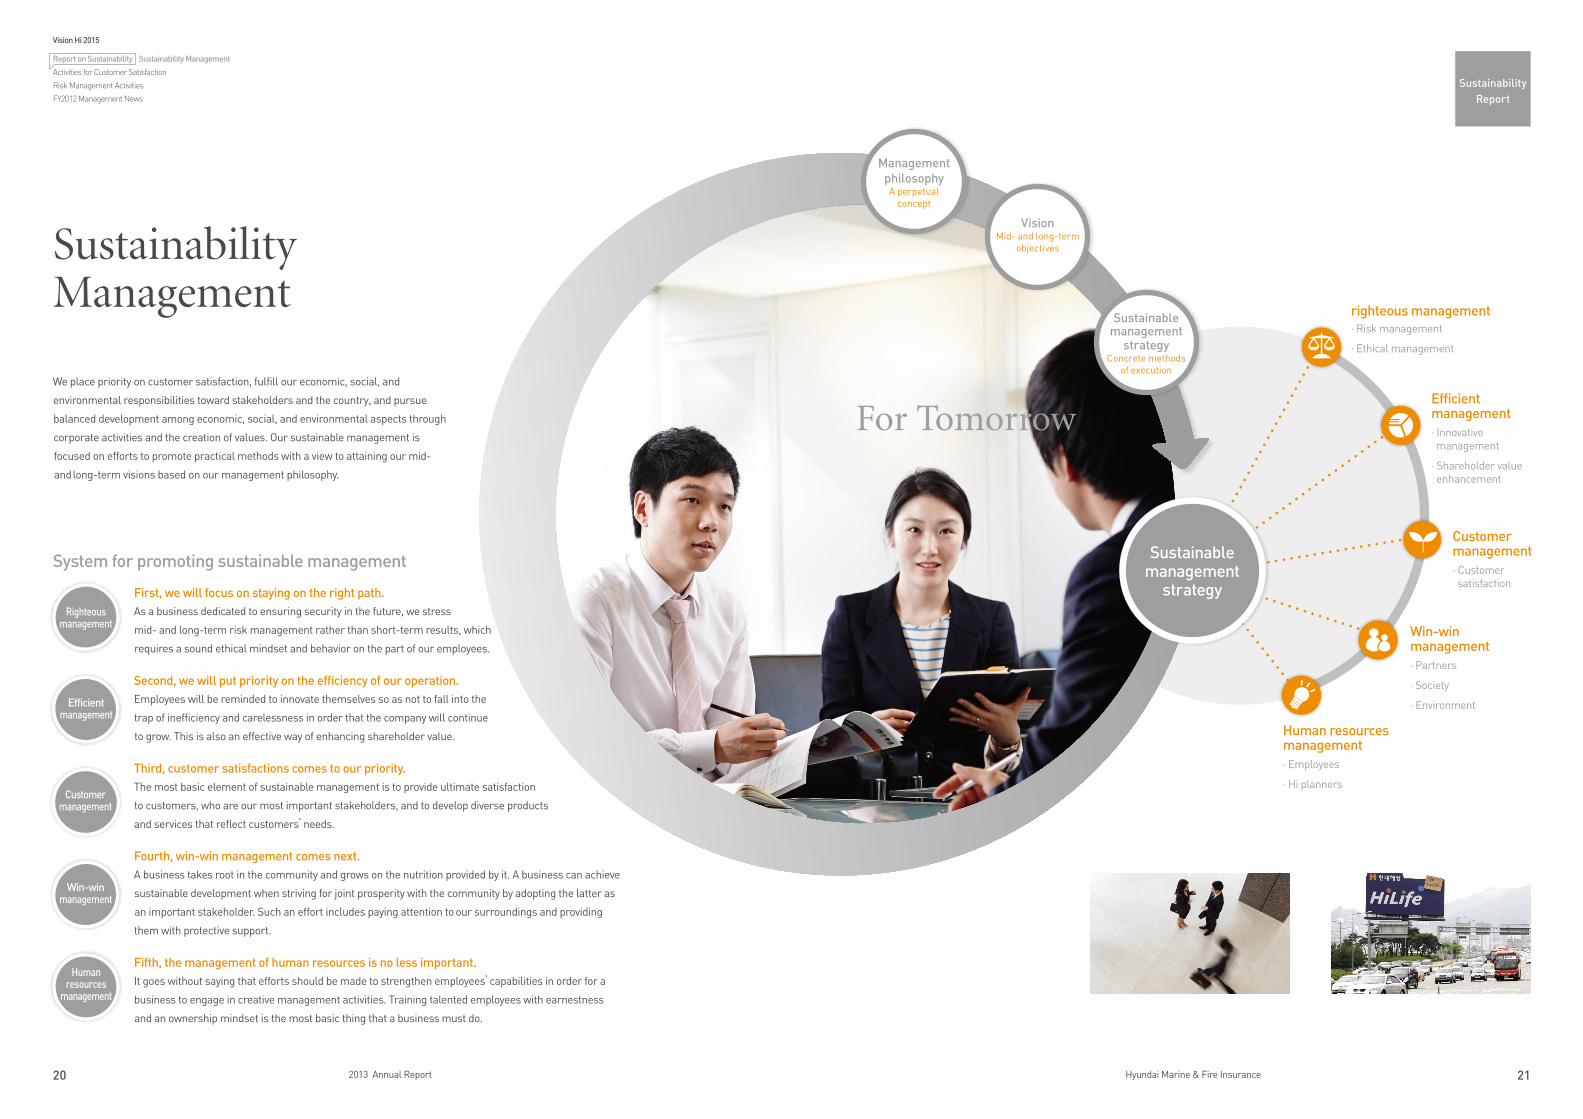
We place priority on customer satisfaction, fulfill our economic, social, and
environmental responsibilities toward stakeholders and the country, and pursue
balanced development among economic, social, and environmental aspects through
corporate activities and the creation of values. Our sustainable management is
focused on efforts to promote practical methods with a view to attaining our mid-
and long-term visions based on our management philosophy.
Sustainable management
strategy
Sustainability Management
First, we will focus on staying on the right path. As a business dedicated to ensuring security in the future, we stress
mid- and long-term risk management rather than short-term results, which
requires a sound ethical mindset and behavior on the part of our employees.
Second, we will put priority on the efficiency of our operation. Employees will be reminded to innovate themselves so as not to fall into the
trap of inefficiency and carelessness in order that the company will continue
to grow. This is also an effective way of enhancing shareholder value.
Third, customer satisfactions comes to our priority. The most basic element of sustainable management is to provide ultimate satisfaction
to customers, who are our most important stakeholders, and to develop diverse products
and services that reflect customers’ needs.
Fourth, win-win management comes next. A business takes root in the community and grows on the nutrition provided by it. A business can achieve
sustainable development when striving for joint prosperity with the community by adopting the latter as
an important stakeholder. Such an effort includes paying attention to our surroundings and providing
them with protective support.
Fifth, the management of human resources is no less important.It goes without saying that efforts should be made to strengthen employees’ capabilities in order for a
business to engage in creative management activities. Training talented employees with earnestness
and an ownership mindset is the most basic thing that a business must do.
System for promoting sustainable management
righteous management· Risk management
· Ethical management
Efficient management· Innovative management
· Shareholder value enhancement
Customer management· Customer satisfaction
Human resources management· Employees
· Hi planners
Win-win management· Partners
· Society
· Environment
VisionMid- and long-term
objectives
Management philosophy
A perpetual concept
Sustainable management
strategyConcrete methods
of execution
Righteousmanagement
Efficient management
Customer management
Win-win management
Human resources
management
For Tomorrow
Vision Hi 2015
Report on Sustainability Sustainability Management
Activities for Customer Satisfaction
Risk Management Activities
FY2012 Management News
Sustainability Report
22 2013 Annual Report 23Hyundai Marine & Fire Insurance
Sustainability Report
Ethics ManagementUnder the motto of ethical management, we carry out management activities in a way that engenders a sense of trust in our customers
and put customer satisfaction, which is a core element of our management philosophy, into practice through the transparent and fair
handling of business. We are committed to developing a corporate culture focusing on fair and free competition. Our business ethics
require that we provide customers and society with affluence and stability. We are building the base for sustainable management through
ethical management.
We have done our best to practice ethical management, fulfilling all our responsibilities and obligations toward customers, employees,
shareholders, subcontractors, country and society based on our Ethics Charter and Code of Conduct. Our Compliance Officer, appointed
by the Board of Directors, deals with matters relating to compliance and internal control so that our ethical management may be
conducted concretely and effectively.
Within the Company, matters relating to ethical management are controlled by the Compliance Department under the instructions of
the Compliance Officer, with a team composed of 139 compliance managers charged with carrying out matters relating to compliance-
related internal control activities.
Compliance programs ● Periodic campaigns are conducted for the continued promotion of ethical management.● Voluntary programs are adopted to ensure fair transactions with the aim of achieving effective management results through fair and free
competition. We observe the competition laws and execute self-regulated fair transaction rules under the control of the Compliance
Officer. We observe The Personal Information Protection Act by enacting the relevant in-house rules and carrying out activities for
checking and improving the relevant system under the control of the Compliance Officer. We have also established a system to prevent
money laundering involving through financial companies.● We regularly carry out company-wide activities relating to ethics, compliance, and accident prevention through ‘Hi-Compliance Day’
(a departmental-level internal control activity) events and operate a system for the evaluation of self-regulated internal control.● Each department is required to designate an employee in charge of compliance so that ethics and compliance-related matters may be
reflected properly in our overall operation. We also strive to enhance the level of employees’ awareness of ethical and compliance-related
issues through educational sessions.
Compliance and ethics management activities
Our Ethics Charter We at Hyundai Marine & Fire Insurance have set the criteria for ethical decision making and behavior as follows based on our
management philosophy and ethical management-related values and hereby resolve to put them into practice at all times:
● We shall deal with all our customers honestly, respect their opinions, put priority on customer satisfaction, and enhance
customer value.
● We shall disclose Company-related information to our shareholders transparently and fairly. We shall protect our shareholders’
rights and interests through sound management.
● We shall develop the corporate culture in such a way as to recognize human dignity and values based on mutual trust, and
adhere firmly to the basics and principles. ● We shall engage in fair and free competition with other businesses and conduct reasonable business transactions for mutual
development and coexistence.
● We shall provide abundance and stability to the community and contribute to the development of society and the country’s
economy by creating jobs and faithfully paying our taxes.
Trust of Hi
Vision Hi 2015
Report on Sustainability Ethics Management
Activities for Customer Satisfaction
Risk Management Activities
FY2012 Management News
24 2013 Annual Report 25Hyundai Marine & Fire Insurance
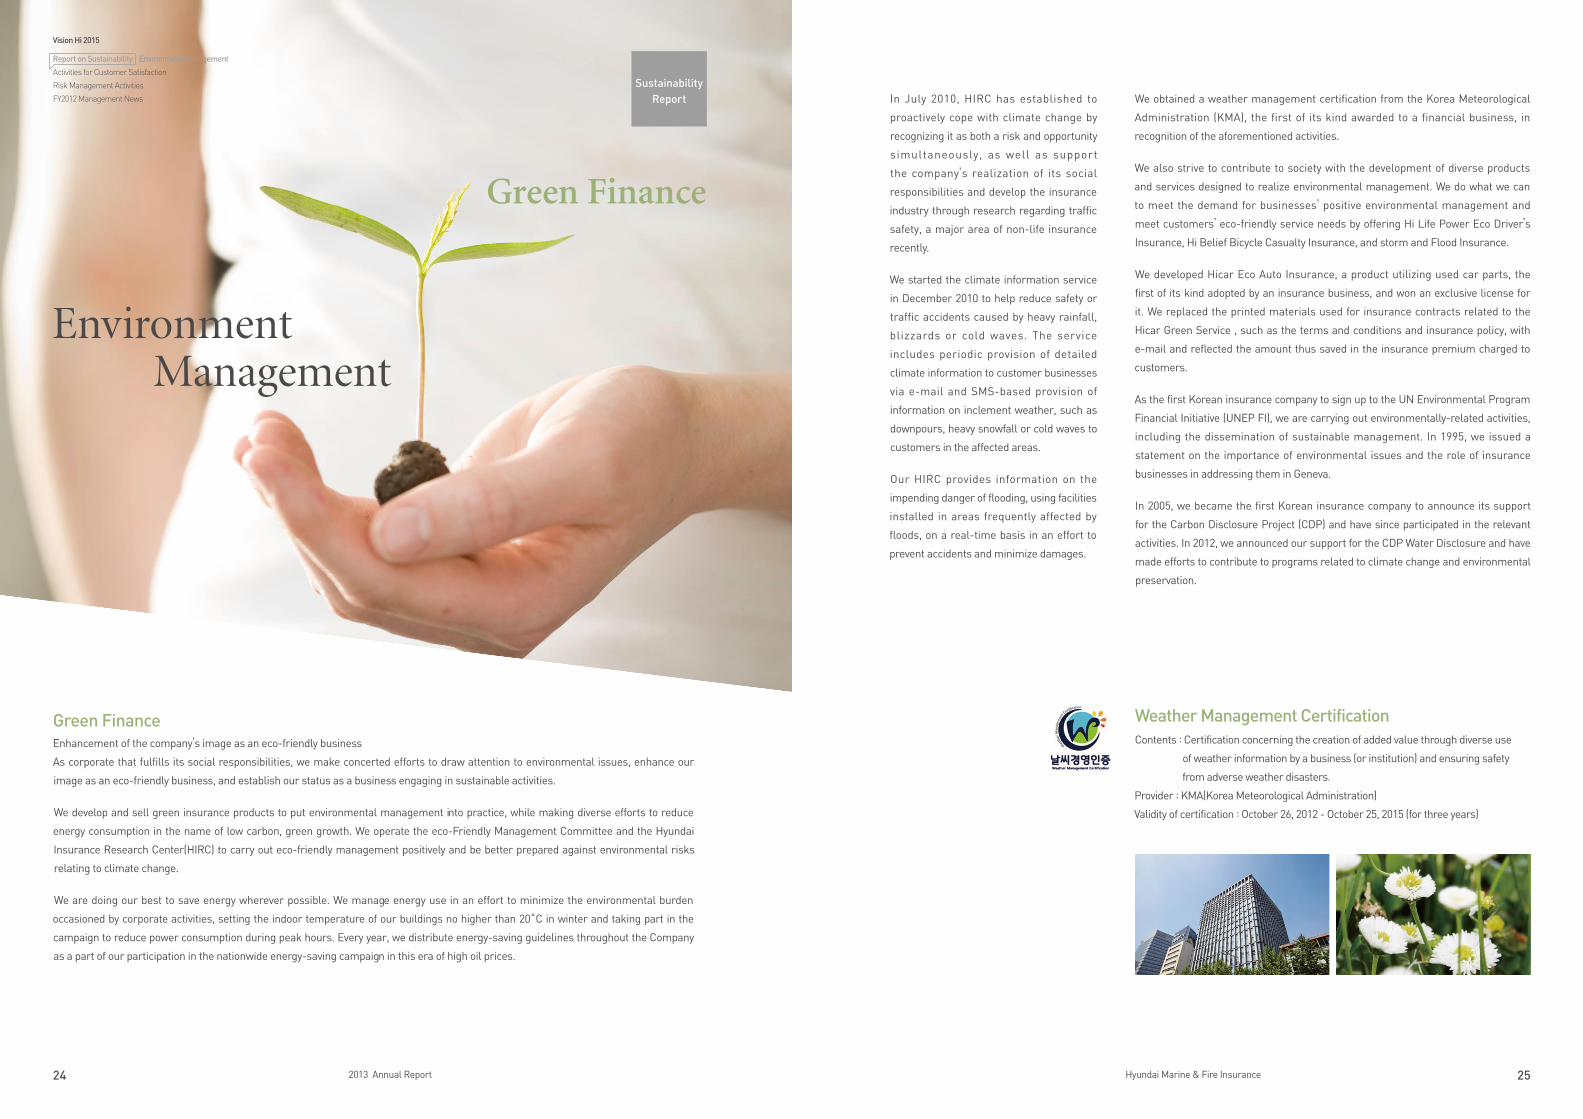
Green FinanceEnhancement of the company’s image as an eco-friendly business
As corporate that fulfills its social responsibilities, we make concerted efforts to draw attention to environmental issues, enhance our
image as an eco-friendly business, and establish our status as a business engaging in sustainable activities.
We develop and sell green insurance products to put environmental management into practice, while making diverse efforts to reduce
energy consumption in the name of low carbon, green growth. We operate the eco-Friendly Management Committee and the Hyundai
Insurance Research Center(HIRC) to carry out eco-friendly management positively and be better prepared against environmental risks
relating to climate change.
We are doing our best to save energy wherever possible. We manage energy use in an effort to minimize the environmental burden
occasioned by corporate activities, setting the indoor temperature of our buildings no higher than 20˚C in winter and taking part in the
campaign to reduce power consumption during peak hours. Every year, we distribute energy-saving guidelines throughout the Company
as a part of our participation in the nationwide energy-saving campaign in this era of high oil prices.
In July 2010, HIRC has established to
proactively cope with climate change by
recognizing it as both a risk and opportunity
simultaneously, as well as support
the company’s realization of its social
responsibilities and develop the insurance
industry through research regarding traffic
safety, a major area of non-life insurance
recently.
We started the climate information service
in December 2010 to help reduce safety or
traffic accidents caused by heavy rainfall,
blizzards or cold waves. The service
includes periodic provision of detailed
climate information to customer businesses
via e-mail and SMS-based provision of
information on inclement weather, such as
downpours, heavy snowfall or cold waves to
customers in the affected areas.
Our HIRC provides information on the
impending danger of flooding, using facilities
installed in areas frequently affected by
floods, on a real-time basis in an effort to
prevent accidents and minimize damages.
Environment Management
Weather Management CertificationContents : Certification concerning the creation of added value through diverse use
of weather information by a business (or institution) and ensuring safety
from adverse weather disasters.
Provider : KMA(Korea Meteorological Administration)
Validity of certification : October 26, 2012 - October 25, 2015 (for three years)
Green Finance
We obtained a weather management certification from the Korea Meteorological
Administration (KMA), the first of its kind awarded to a financial business, in
recognition of the aforementioned activities.
We also strive to contribute to society with the development of diverse products
and services designed to realize environmental management. We do what we can
to meet the demand for businesses’ positive environmental management and
meet customers’ eco-friendly service needs by offering Hi Life Power Eco Driver’s
Insurance, Hi Belief Bicycle Casualty Insurance, and storm and Flood Insurance.
We developed Hicar Eco Auto Insurance, a product utilizing used car parts, the
first of its kind adopted by an insurance business, and won an exclusive license for
it. We replaced the printed materials used for insurance contracts related to the
Hicar Green Service , such as the terms and conditions and insurance policy, with
e-mail and reflected the amount thus saved in the insurance premium charged to
customers.
As the first Korean insurance company to sign up to the UN Environmental Program
Financial Initiative (UNEP FI), we are carrying out environmentally-related activities,
including the dissemination of sustainable management. In 1995, we issued a
statement on the importance of environmental issues and the role of insurance
businesses in addressing them in Geneva.
In 2005, we became the first Korean insurance company to announce its support
for the Carbon Disclosure Project (CDP) and have since participated in the relevant
activities. In 2012, we announced our support for the CDP Water Disclosure and have
made efforts to contribute to programs related to climate change and environmental
preservation.
Vision Hi 2015
Report on Sustainability Environment Management
Activities for Customer Satisfaction
Risk Management Activities
FY2012 Management News
Sustainability Report

26 2013 Annual Report 27Hyundai Marine & Fire Insurance
Sustainability Report
Traffic/safety accident prevention activities We carry out activities aimed at protecting people from the kinds of accidents that can occur in everyday life.
[Hicar women drivers’ class] We run a class for novice women drivers, teaching them how to prevent traffic accidents and
park a car in a small space.
[Hi-Mom 119 class] This class aims to teach children how to avoid accidents in their everyday lives and how to act decisively
in moments of danger.
[Helping children avoid a traffic accident] We run a program aimed at teaching children how to get home safely without a
traffic accident after school. We provide a traffic safety map about the areas close to their school in an effort to help children
avoid traffic accidents. We also carry out other programs, such as the Children’s Traffic Safety Concert, which is designed to
raise awareness of the potential dangers posed by road traffic, particularly where children are concerned.
Support for future generations to follow the path of virtueWe work together with experts to assist young people and
tackle social issues relating to them through the following
programs:
[Very Minor Confessions] This program was set up to prevent
school violence through the invigoration of communication.
It comprises Confessions to Make, which is run online and
offline; a session in which celebrities are invited to discuss
school violence; and Healing Camp, which is designed to heal
victims of school violence or trauma. It is carried out with the
positive participation of students, teachers, and parents.
[T-um Class] This long-term program (a total of 16 sessions
have been conducted so far) aims to develop the personality
of children accommodated in special facilities with the help
of experts. The program helps young people to improve their
sense of pride and sociability and make a plan for a hopeful
future.
We share hope with neighborsWe do our best to help needy neighbors and build a better
future.
[Hi-Life voluntary activities / Disaster Aid Committee] The
Company encourages employees and Hi Planners to engage in
voluntary activities and provides support for their activities. Our
Hi-Life Volunteers, launched in 2005, carry out activities in more
than 30 facilities and national parks nationwide. We also operate
the Disaster Aid Committee to provide relief to the needy.
[Ashoka Support] Hyundai Marine & Fire Insurance is a
founding partner of Ashoka Korea, which is well known for its
discovery of and provision of support to social entrepreneurs.
We concur with Ashoka’s philosophy of pursuing a society in
which more and more people take the initiative with a view
to changing the world. We carry out activities as a partner of
Ashoka Korea based on the belief that our activities will bring
about positive changes in our society.
[Financial donations] Our employees voluntarily donate part
of their monthly salary to provide financial support for children
whose parent(s) have lost their lives in a traffic accident.
[Charity Bazaar] Every year our employees and Hi Planners
donate used articles and sell them at the Charity Bazaar. They
spend the proceeds on helping needy neighbors.
Heart Plus
Social Contribution Activities
Challenge for tomorrow We at Hyundai Marine & Fire Insurance pursue sustainable and shared growth and do our best to fulfill our social responsibilities. We make
a point of returning a given percentage of our profits to society so that all people may live a happier life. We expect that the actions we have
taken to help create a more humane society where people share happiness together will blossom into new hope.
Vision Hi 2015
Report on Sustainability Social Contribution Activities
Activities for Customer Satisfaction
Risk Management Activities
FY2012 Management News
28 2013 Annual Report 29Hyundai Marine & Fire Insurance
7 Heart Service01 Customer Satisfaction Service
02 Automobile Claims (Family Heart Service)
03 Long-Term Insurance Claims (Smart Heart Service)
04 Emergency Mobilizations (Plus Heart Service)
05 Emergency Claims (Speed Heart Service)
06 Call Center (Sense Heart Service)
07 Risk Management Service
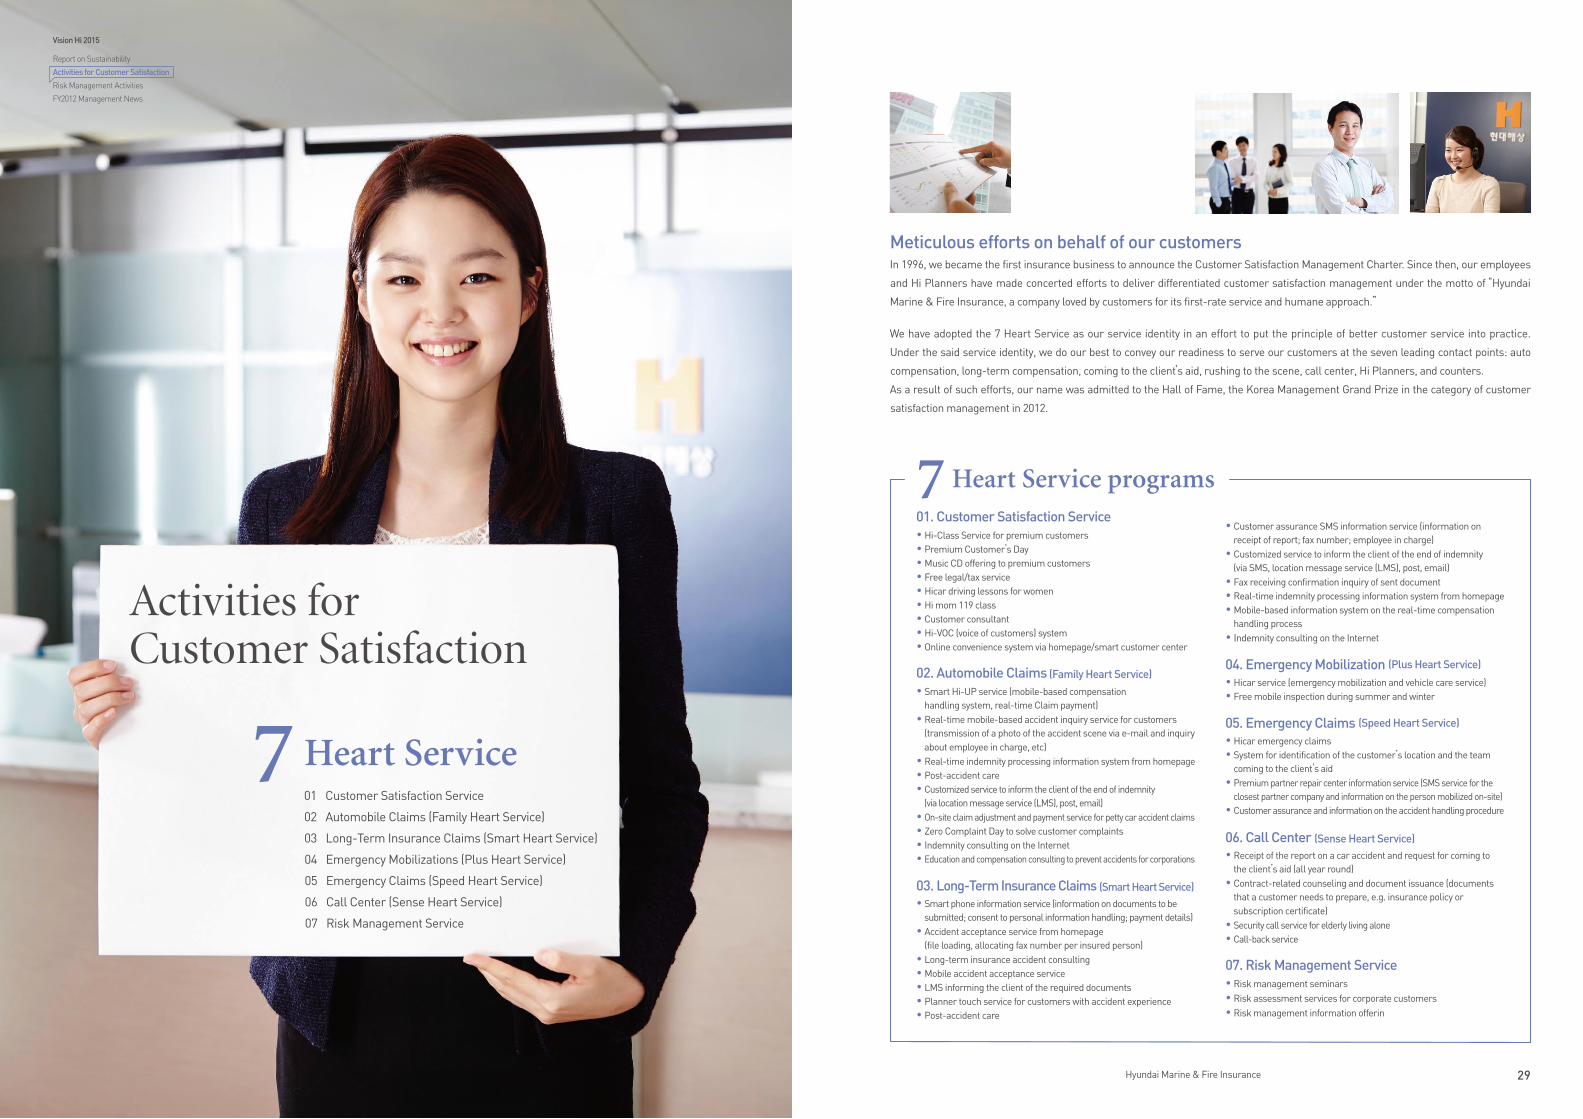
Meticulous efforts on behalf of our customers In 1996, we became the first insurance business to announce the Customer Satisfaction Management Charter. Since then, our employees
and Hi Planners have made concerted efforts to deliver differentiated customer satisfaction management under the motto of “Hyundai
Marine & Fire Insurance, a company loved by customers for its first-rate service and humane approach.”
We have adopted the 7 Heart Service as our service identity in an effort to put the principle of better customer service into practice.
Under the said service identity, we do our best to convey our readiness to serve our customers at the seven leading contact points: auto
compensation, long-term compensation, coming to the client’s aid, rushing to the scene, call center, Hi Planners, and counters.
As a result of such efforts, our name was admitted to the Hall of Fame, the Korea Management Grand Prize in the category of customer
satisfaction management in 2012.
● Customer assurance SMS information service (information on receipt of report; fax number; employee in charge)● Customized service to inform the client of the end of indemnity (via SMS, location message service (LMS), post, email)● Fax receiving confirmation inquiry of sent document ● Real-time indemnity processing information system from homepage● Mobile-based information system on the real-time compensation handling process● Indemnity consulting on the Internet
04. Emergency Mobilization (Plus Heart Service)● Hicar service (emergency mobilization and vehicle care service) ● Free mobile inspection during summer and winter
05. Emergency Claims (Speed Heart Service)● Hicar emergency claims ● System for identification of the customer’s location and the team coming to the client’s aid● Premium partner repair center information service (SMS service for the closest partner company and information on the person mobilized on-site) ● Customer assurance and information on the accident handling procedure
06. Call Center (Sense Heart Service)● Receipt of the report on a car accident and request for coming to the client’s aid (all year round)● Contract-related counseling and document issuance (documents that a customer needs to prepare, e.g. insurance policy or subscription certificate)● Security call service for elderly living alone● Call-back service
07. Risk Management Service● Risk management seminars● Risk assessment services for corporate customers● Risk management information offerin
01. Customer Satisfaction Service● Hi-Class Service for premium customers● Premium Customer’s Day● Music CD offering to premium customers● Free legal/tax service● Hicar driving lessons for women● Hi mom 119 class● Customer consultant● Hi-VOC (voice of customers) system● Online convenience system via homepage/smart customer center
02. Automobile Claims (Family Heart Service)● Smart Hi-UP service (mobile-based compensation handling system, real-time Claim payment)● Real-time mobile-based accident inquiry service for customers (transmission of a photo of the accident scene via e-mail and inquiry about employee in charge, etc)● Real-time indemnity processing information system from homepage● Post-accident care● Customized service to inform the client of the end of indemnity (via location message service (LMS), post, email)● On-site claim adjustment and payment service for petty car accident claims● Zero Complaint Day to solve customer complaints● Indemnity consulting on the Internet● Education and compensation consulting to prevent accidents for corporations
03. Long-Term Insurance Claims (Smart Heart Service)● Smart phone information service (information on documents to be submitted; consent to personal information handling; payment details)● Accident acceptance service from homepage (file loading, allocating fax number per insured person)● Long-term insurance accident consulting● Mobile accident acceptance service● LMS informing the client of the required documents● Planner touch service for customers with accident experience● Post-accident care
7 Heart Service programs
Activities for Customer Satisfaction
Vision Hi 2015
Report on Sustainability
Activities for Customer Satisfaction
Risk Management Activities
FY2012 Management News
30 2013 Annual Report 31Hyundai Marine & Fire Insurance
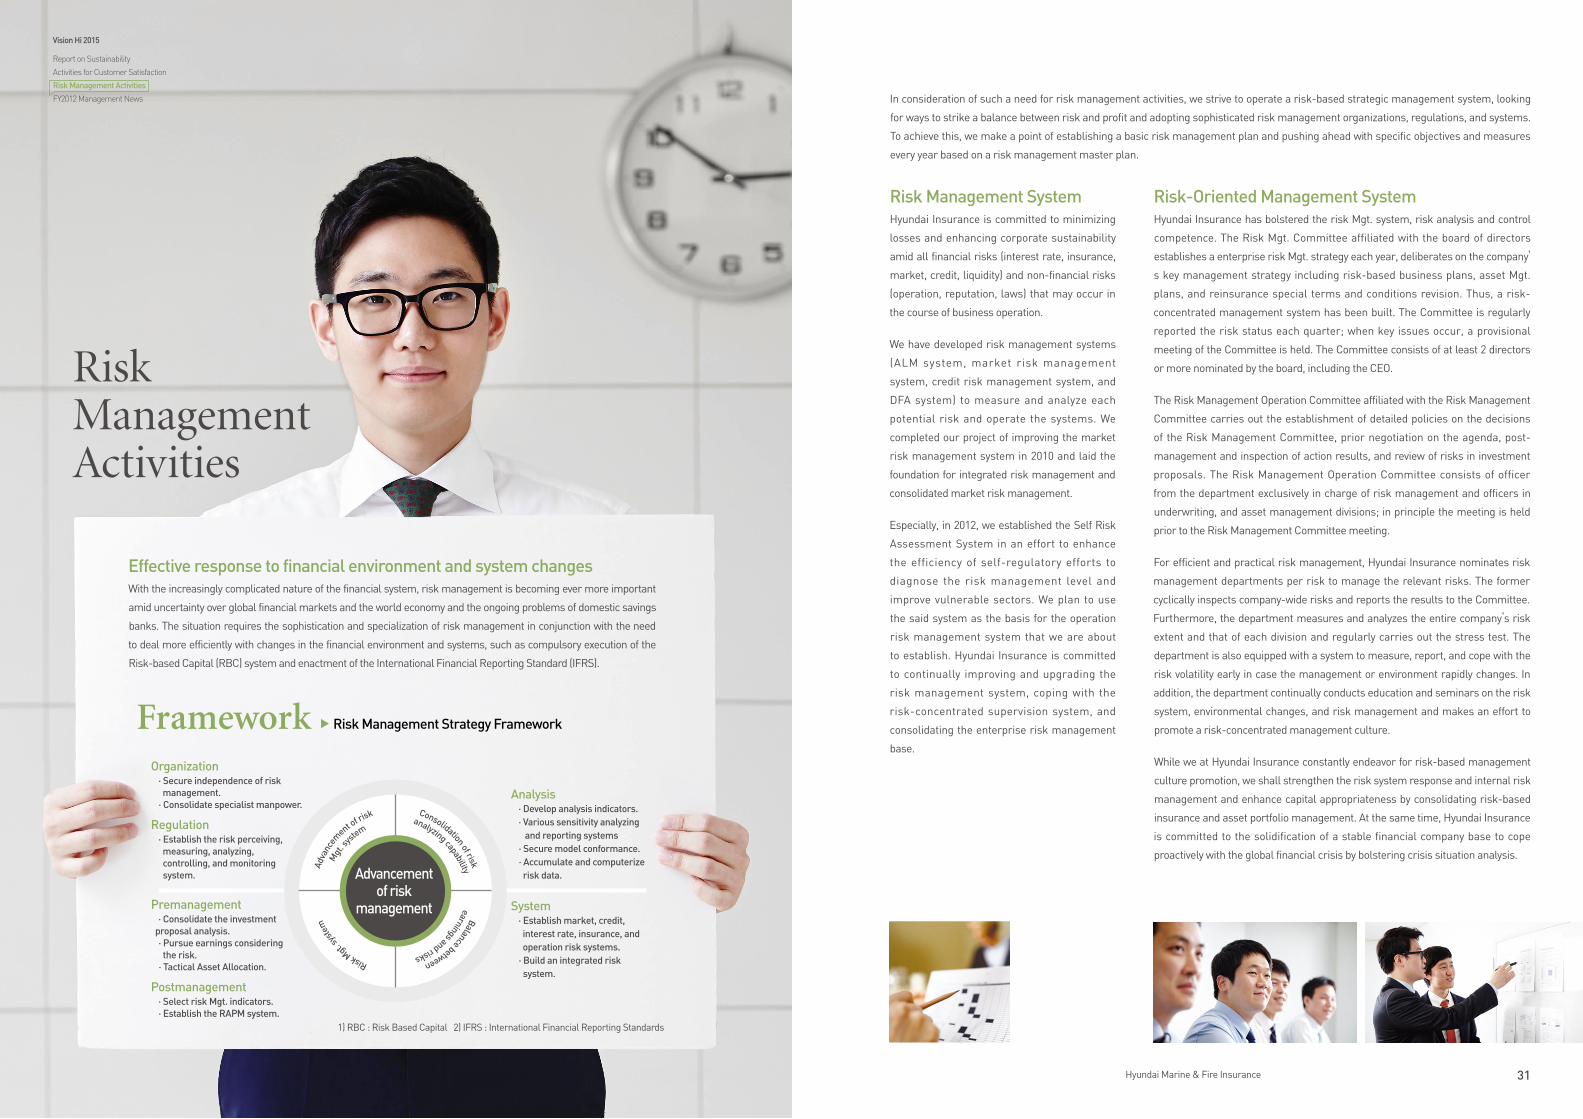
Effective response to financial environment and system changesWith the increasingly complicated nature of the financial system, risk management is becoming ever more important
amid uncertainty over global financial markets and the world economy and the ongoing problems of domestic savings
banks. The situation requires the sophistication and specialization of risk management in conjunction with the need
to deal more efficiently with changes in the financial environment and systems, such as compulsory execution of the
Risk-based Capital (RBC) system and enactment of the International Financial Reporting Standard (IFRS).
Risk Management Activities
1) RBC : Risk Based Capital 2) IFRS : International Financial Reporting Standards
Organization · Secure independence of risk management. · Consolidate specialist manpower.
Regulation · Establish the risk perceiving, measuring, analyzing, controlling, and monitoring system.
Premanagement · Consolidate the investment proposal analysis. · Pursue earnings considering the risk. · Tactical Asset Allocation.
Postmanagement · Select risk Mgt. indicators. · Establish the RAPM system.
Analysis · Develop analysis indicators. · Various sensitivity analyzing and reporting systems · Secure model conformance. · Accumulate and computerize risk data.
System · Establish market, credit, interest rate, insurance, and operation risk systems. · Build an integrated risk system.
Vision Hi 2015
Report on Sustainability
Activities for Customer Satisfaction
Risk Management Activities
FY2012 Management News
Adva
ncem
ent of risk
Mgt
. s
ystem
Risk Mgt. s
yste
m
Consolidation of risk
analyzing capabilityBalance between
earnings and risks
Advancement of risk
management
In consideration of such a need for risk management activities, we strive to operate a risk-based strategic management system, looking
for ways to strike a balance between risk and profit and adopting sophisticated risk management organizations, regulations, and systems.
To achieve this, we make a point of establishing a basic risk management plan and pushing ahead with specific objectives and measures
every year based on a risk management master plan.
Risk Management SystemHyundai Insurance is committed to minimizing
losses and enhancing corporate sustainability
amid all financial risks (interest rate, insurance,
market, credit, liquidity) and non-financial risks
(operation, reputation, laws) that may occur in
the course of business operation.
We have developed risk management systems
(ALM system, market risk management
system, credit risk management system, and
DFA system) to measure and analyze each
potential risk and operate the systems. We
completed our project of improving the market
risk management system in 2010 and laid the
foundation for integrated risk management and
consolidated market risk management.
Especially, in 2012, we established the Self Risk
Assessment System in an effort to enhance
the efficiency of self-regulatory efforts to
diagnose the risk management level and
improve vulnerable sectors. We plan to use
the said system as the basis for the operation
risk management system that we are about
to establish. Hyundai Insurance is committed
to continually improving and upgrading the
risk management system, coping with the
risk-concentrated supervision system, and
consolidating the enterprise risk management
base.
Risk-Oriented Management SystemHyundai Insurance has bolstered the risk Mgt. system, risk analysis and control
competence. The Risk Mgt. Committee affiliated with the board of directors
establishes a enterprise risk Mgt. strategy each year, deliberates on the company’
s key management strategy including risk-based business plans, asset Mgt.
plans, and reinsurance special terms and conditions revision. Thus, a risk-
concentrated management system has been built. The Committee is regularly
reported the risk status each quarter; when key issues occur, a provisional
meeting of the Committee is held. The Committee consists of at least 2 directors
or more nominated by the board, including the CEO.
The Risk Management Operation Committee affiliated with the Risk Management
Committee carries out the establishment of detailed policies on the decisions
of the Risk Management Committee, prior negotiation on the agenda, post-
management and inspection of action results, and review of risks in investment
proposals. The Risk Management Operation Committee consists of officer
from the department exclusively in charge of risk management and officers in
underwriting, and asset management divisions; in principle the meeting is held
prior to the Risk Management Committee meeting.
For efficient and practical risk management, Hyundai Insurance nominates risk
management departments per risk to manage the relevant risks. The former
cyclically inspects company-wide risks and reports the results to the Committee.
Furthermore, the department measures and analyzes the entire company’s risk
extent and that of each division and regularly carries out the stress test. The
department is also equipped with a system to measure, report, and cope with the
risk volatility early in case the management or environment rapidly changes. In
addition, the department continually conducts education and seminars on the risk
system, environmental changes, and risk management and makes an effort to
promote a risk-concentrated management culture.
While we at Hyundai Insurance constantly endeavor for risk-based management
culture promotion, we shall strengthen the risk system response and internal risk
management and enhance capital appropriateness by consolidating risk-based
insurance and asset portfolio management. At the same time, Hyundai Insurance
is committed to the solidification of a stable financial company base to cope
proactively with the global financial crisis by bolstering crisis situation analysis.
▶ Risk Management Strategy FrameworkFramework
32 2013 Annual Report 33Hyundai Marine & Fire Insurance
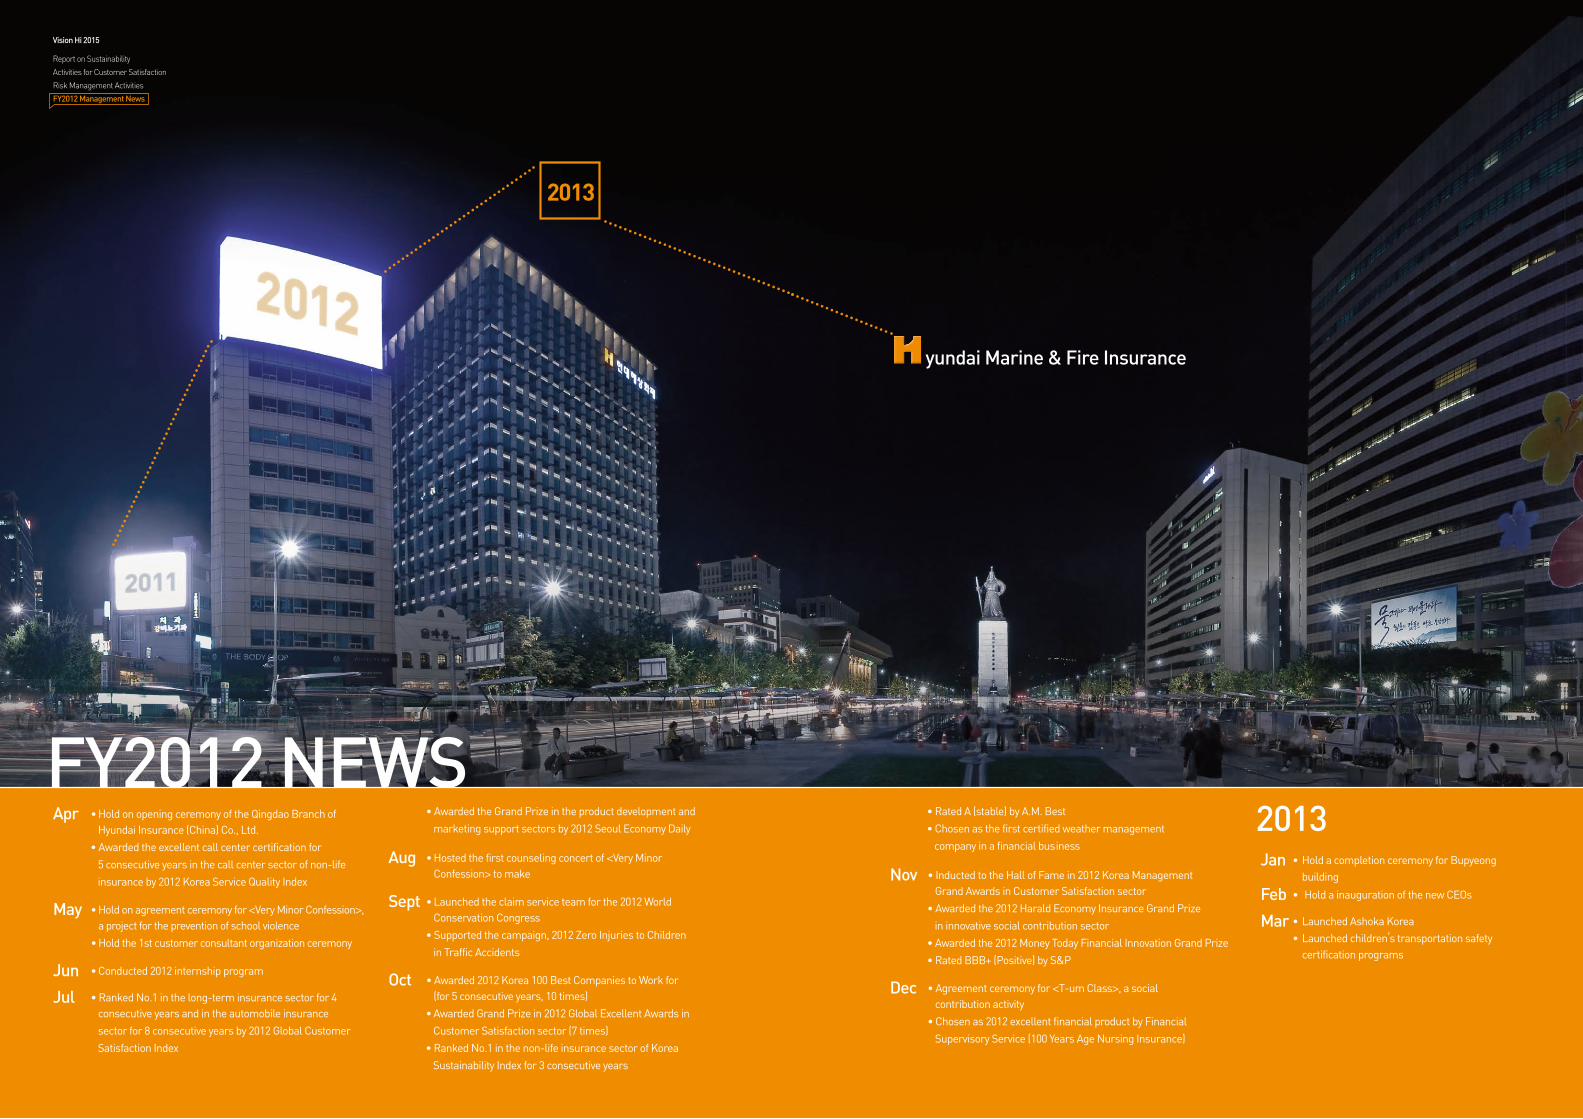
2013Apr • Hold on opening ceremony of the Qingdao Branch of Hyundai Insurance (China) Co., Ltd.
• Awarded the excellent call center certification for
5 consecutive years in the call center sector of non-life
insurance by 2012 Korea Service Quality Index
May • Hold on agreement ceremony for <Very Minor Confession>, a project for the prevention of school violence
• Hold the 1st customer consultant organization ceremony
Jun • Conducted 2012 internship program
Jul • Ranked No.1 in the long-term insurance sector for 4 consecutive years and in the automobile insurance
sector for 8 consecutive years by 2012 Global Customer
Satisfaction Index
Jan • Hold a completion ceremony for Bupyeong building
Feb • Hold a inauguration of the new CEOs
Mar • Launched Ashoka Korea
• Launched children’s transportation safety certification programs
• Awarded the Grand Prize in the product development and
marketing support sectors by 2012 Seoul Economy Daily
Aug • Hosted the first counseling concert of <Very Minor Confession> to make
Sept • Launched the claim service team for the 2012 World Conservation Congress
• Supported the campaign, 2012 Zero Injuries to Children
in Traffic Accidents
Oct • Awarded 2012 Korea 100 Best Companies to Work for (for 5 consecutive years, 10 times)
• Awarded Grand Prize in 2012 Global Excellent Awards in
Customer Satisfaction sector (7 times)
• Ranked No.1 in the non-life insurance sector of Korea
Sustainability Index for 3 consecutive years
• Rated A (stable) by A.M. Best
• Chosen as the first certified weather management
company in a financial business
Nov • Inducted to the Hall of Fame in 2012 Korea Management Grand Awards in Customer Satisfaction sector
• Awarded the 2012 Harald Economy Insurance Grand Prize
in innovative social contribution sector
• Awarded the 2012 Money Today Financial Innovation Grand Prize
• Rated BBB+ (Positive) by S&P
Dec • Agreement ceremony for <T-um Class>, a social contribution activity
• Chosen as 2012 excellent financial product by Financial
Supervisory Service (100 Years Age Nursing Insurance)
FY2012 NEWS
Vision Hi 2015
Report on Sustainability
Activities for Customer Satisfaction
Risk Management Activities
FY2012 Management News
2013
yundai Marine & Fire Insurance
34 2013 Annual Report 35Hyundai Marine & Fire Insurance
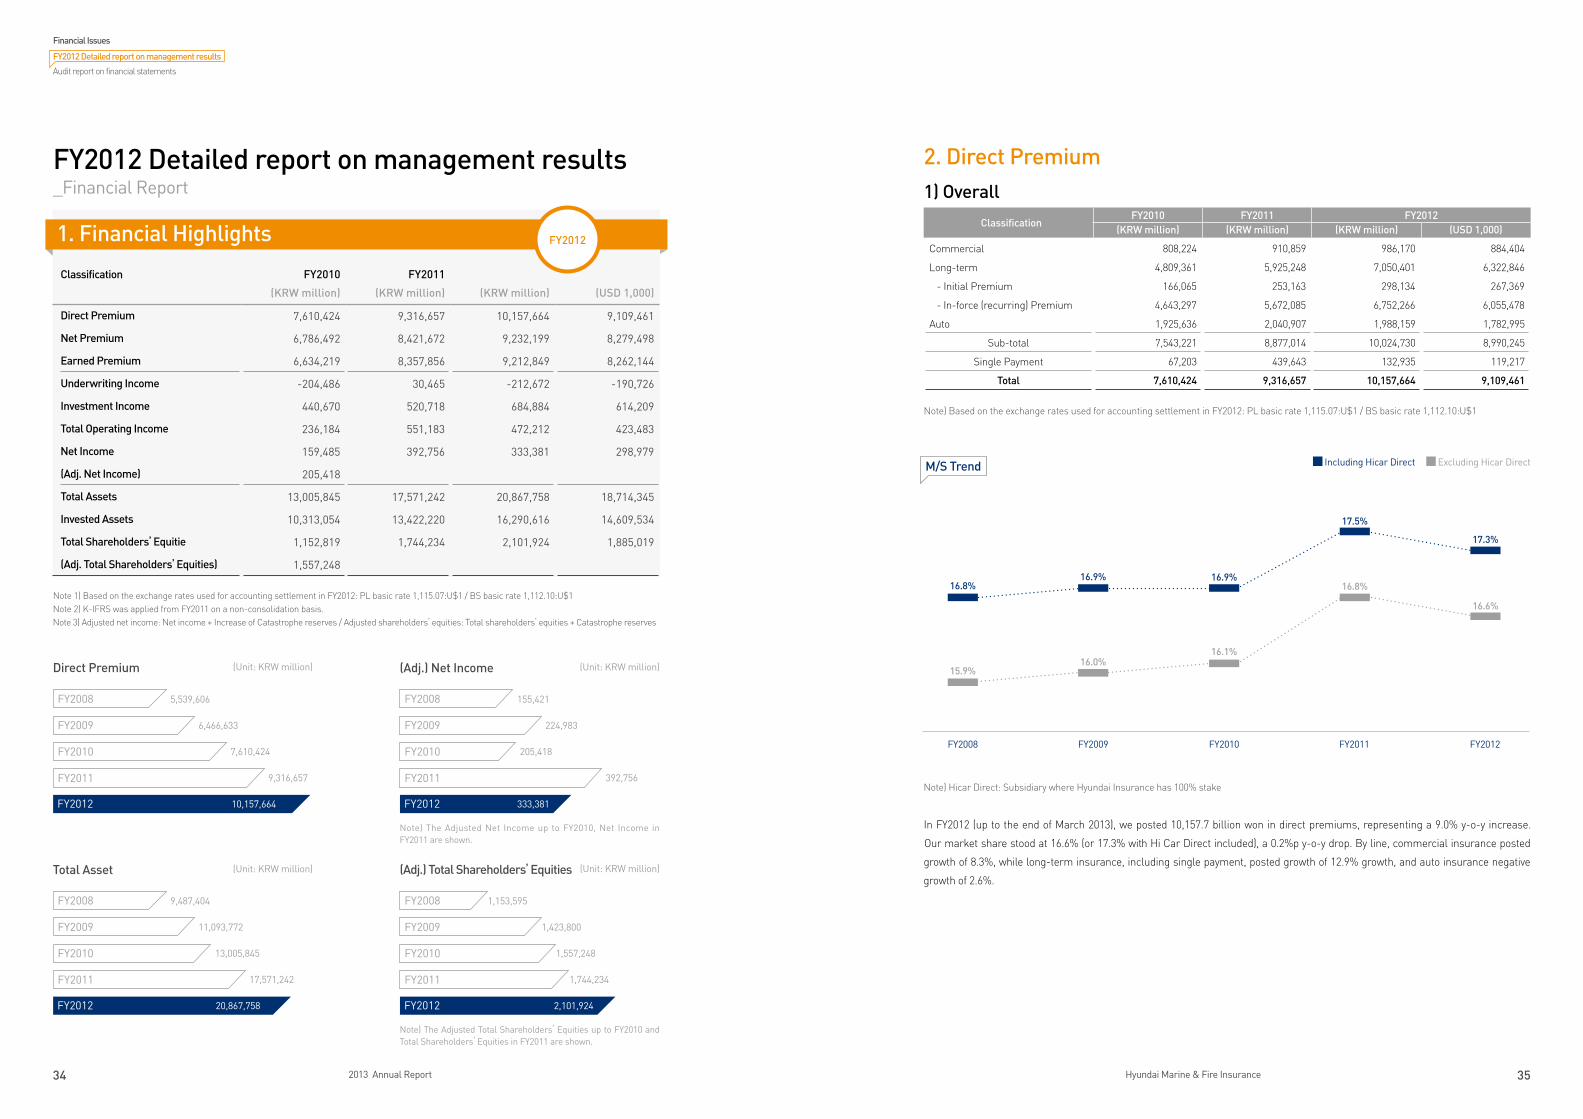
2. Direct Premium1) Overall
Note) Based on the exchange rates used for accounting settlement in FY2012: PL basic rate 1,115.07:U$1 / BS basic rate 1,112.10:U$1
Note) Hicar Direct: Subsidiary where Hyundai Insurance has 100% stake
In FY2012 (up to the end of March 2013), we posted 10,157.7 billion won in direct premiums, representing a 9.0% y-o-y increase.
Our market share stood at 16.6% (or 17.3% with Hi Car Direct included), a 0.2%p y-o-y drop. By line, commercial insurance posted
growth of 8.3%, while long-term insurance, including single payment, posted growth of 12.9% growth, and auto insurance negative
growth of 2.6%.
Classification FY2010 FY2011
(KRW million) (KRW million) (KRW million) (USD 1,000)
Direct Premium 7,610,424 9,316,657 10,157,664 9,109,461
Net Premium 6,786,492 8,421,672 9,232,199 8,279,498
Earned Premium 6,634,219 8,357,856 9,212,849 8,262,144
Underwriting Income -204,486 30,465 -212,672 -190,726
Investment Income 440,670 520,718 684,884 614,209
Total Operating Income 236,184 551,183 472,212 423,483
Net Income 159,485 392,756 333,381 298,979
(Adj. Net Income) 205,418
Total Assets 13,005,845 17,571,242 20,867,758 18,714,345
Invested Assets 10,313,054 13,422,220 16,290,616 14,609,534
Total Shareholders’ Equitie 1,152,819 1,744,234 2,101,924 1,885,019
(Adj. Total Shareholders’ Equities) 1,557,248
FY2012 Detailed report on management results _Financial Report
1. Financial Highlights
Note 1) Based on the exchange rates used for accounting settlement in FY2012: PL basic rate 1,115.07:U$1 / BS basic rate 1,112.10:U$1Note 2) K-IFRS was applied from FY2011 on a non-consolidation basis.Note 3) Adjusted net income: Net income + Increase of Catastrophe reserves / Adjusted shareholders’ equities: Total shareholders’ equities + Catastrophe reserves
FY2012
(Unit: KRW million)Direct Premium
FY2008
FY2009
FY2010
FY2011
FY2012
5,539,606
6,466,633
7,610,424
9,316,657
10,157,664
(Unit: KRW million)(Adj.) Net Income
FY2008
FY2009
FY2010
FY2011
FY2012
155,421
224,983
205,418
392,756
333,381
Note) The Adjusted Net Income up to FY2010, Net Income in FY2011 are shown.
(Unit: KRW million)(Adj.) Total Shareholders’ Equities
FY2008
FY2009
FY2010
FY2011
FY2012
1,153,595
1,423,800
1,557,248
1,744,234
2,101,924
Note) The Adjusted Total Shareholders’ Equities up to FY2010 and Total Shareholders’ Equities in FY2011 are shown.
Total Asset
FY2008
FY2009
FY2010
FY2011
FY2012
9,487,404
11,093,772
13,005,845
17,571,242
20,867,758
(Unit: KRW million)
ClassificationFY2010 FY2011 FY2012
(KRW million) (KRW million) (KRW million) (USD 1,000)
Commercial 808,224 910,859 986,170 884,404
Long-term 4,809,361 5,925,248 7,050,401 6,322,846
- Initial Premium 166,065 253,163 298,134 267,369
- In-force (recurring) Premium 4,643,297 5,672,085 6,752,266 6,055,478
Auto 1,925,636 2,040,907 1,988,159 1,782,995
Sub-total 7,543,221 8,877,014 10,024,730 8,990,245
Single Payment 67,203 439,643 132,935 119,217
Total 7,610,424 9,316,657 10,157,664 9,109,461
M/S Trend Including Hicar Direct Excluding Hicar Direct
16.8%
15.9%
16.9%
16.0%
16.9%
16.1%
17.5%
16.8%
17.3%
16.6%
FY2008 FY2009 FY2010 FY2011 FY2012
Financial Issues
FY2012 Detailed report on management results
Audit report on financial statements
36 2013 Annual Report 37Hyundai Marine & Fire Insurance
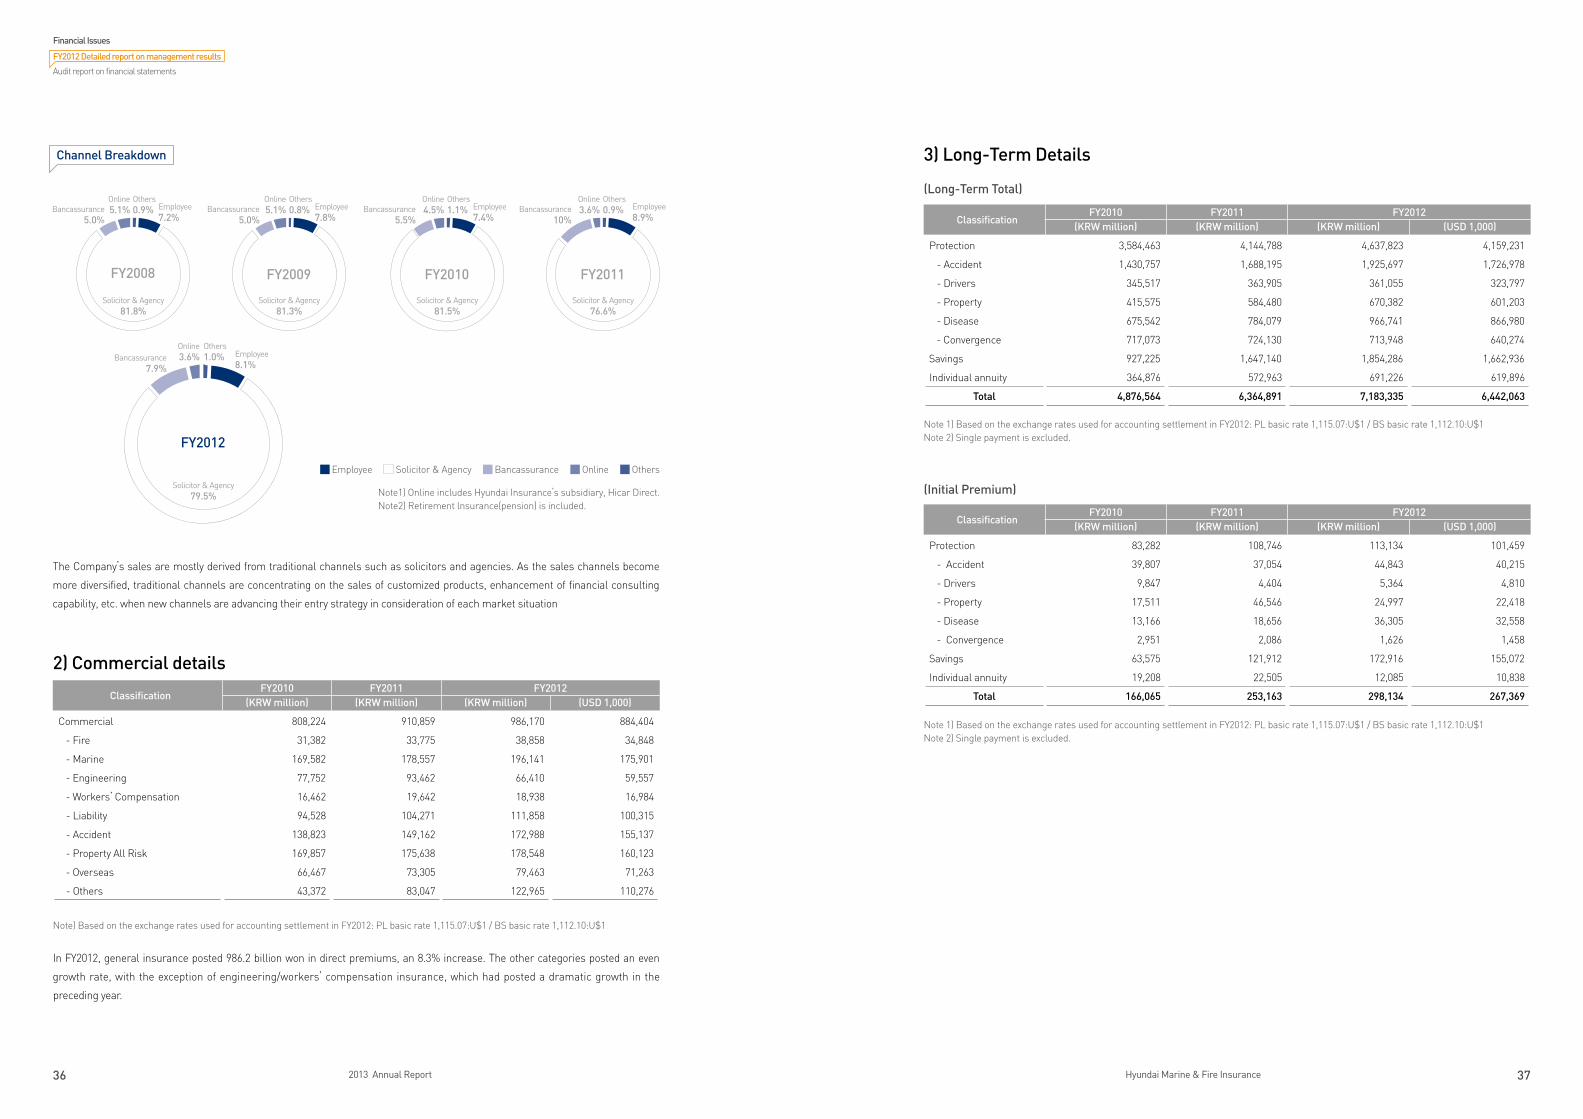
The Company’s sales are mostly derived from traditional channels such as solicitors and agencies. As the sales channels become
more diversified, traditional channels are concentrating on the sales of customized products, enhancement of financial consulting
capability, etc. when new channels are advancing their entry strategy in consideration of each market situation
2) Commercial details
Note) Based on the exchange rates used for accounting settlement in FY2012: PL basic rate 1,115.07:U$1 / BS basic rate 1,112.10:U$1
In FY2012, general insurance posted 986.2 billion won in direct premiums, an 8.3% increase. The other categories posted an even
growth rate, with the exception of engineering/workers’ compensation insurance, which had posted a dramatic growth in the
preceding year.
ClassificationFY2010 FY2011 FY2012
(KRW million) (KRW million) (KRW million) (USD 1,000)
Commercial 808,224 910,859 986,170 884,404
- Fire 31,382 33,775 38,858 34,848
- Marine 169,582 178,557 196,141 175,901
- Engineering 77,752 93,462 66,410 59,557
- Workers’ Compensation 16,462 19,642 18,938 16,984
- Liability 94,528 104,271 111,858 100,315
- Accident 138,823 149,162 172,988 155,137
- Property All Risk 169,857 175,638 178,548 160,123
- Overseas 66,467 73,305 79,463 71,263
- Others 43,372 83,047 122,965 110,276
Channel Breakdown
Employee Solicitor & Agency Bancassurance Online Others
Note1) Online includes Hyundai Insurance’s subsidiary, Hicar Direct. Note2) Retirement lnsurance(pension) is included.
3) Long-Term Details
(Long-Term Total)
Note 1) Based on the exchange rates used for accounting settlement in FY2012: PL basic rate 1,115.07:U$1 / BS basic rate 1,112.10:U$1Note 2) Single payment is excluded.
(Initial Premium)
Note 1) Based on the exchange rates used for accounting settlement in FY2012: PL basic rate 1,115.07:U$1 / BS basic rate 1,112.10:U$1Note 2) Single payment is excluded.
ClassificationFY2010 FY2011 FY2012
(KRW million) (KRW million) (KRW million) (USD 1,000)
Protection 3,584,463 4,144,788 4,637,823 4,159,231
- Accident 1,430,757 1,688,195 1,925,697 1,726,978
- Drivers 345,517 363,905 361,055 323,797
- Property 415,575 584,480 670,382 601,203
- Disease 675,542 784,079 966,741 866,980
- Convergence 717,073 724,130 713,948 640,274
Savings 927,225 1,647,140 1,854,286 1,662,936
Individual annuity 364,876 572,963 691,226 619,896
Total 4,876,564 6,364,891 7,183,335 6,442,063
ClassificationFY2010 FY2011 FY2012
(KRW million) (KRW million) (KRW million) (USD 1,000)
Protection 83,282 108,746 113,134 101,459
- Accident 39,807 37,054 44,843 40,215
- Drivers 9,847 4,404 5,364 4,810
- Property 17,511 46,546 24,997 22,418
- Disease 13,166 18,656 36,305 32,558
- Convergence 2,951 2,086 1,626 1,458
Savings 63,575 121,912 172,916 155,072
Individual annuity 19,208 22,505 12,085 10,838
Total 166,065 253,163 298,134 267,369
FY2009
Others0.8%
Online5.1%Bancassurance
5.0%
Solicitor & Agency81.3%
Employee7.8%
Employee7.2%
Others0.9%
Online5.1%Bancassurance
5.0%
FY2008
Solicitor & Agency81.8%
FY2010
Others1.1%
Online4.5%Bancassurance
5.5%
Solicitor & Agency81.5%
Employee7.4%
FY2011
Others0.9%
Online3.6%Bancassurance
10%
Solicitor & Agency76.6%
Employee8.9%
FY2012
Others1.0%
Online3.6%Bancassurance
7.9%
Solicitor & Agency79.5%
Employee8.1%
Financial Issues
FY2012 Detailed report on management results
Audit report on financial statements
38 2013 Annual Report 39Hyundai Marine & Fire Insurance
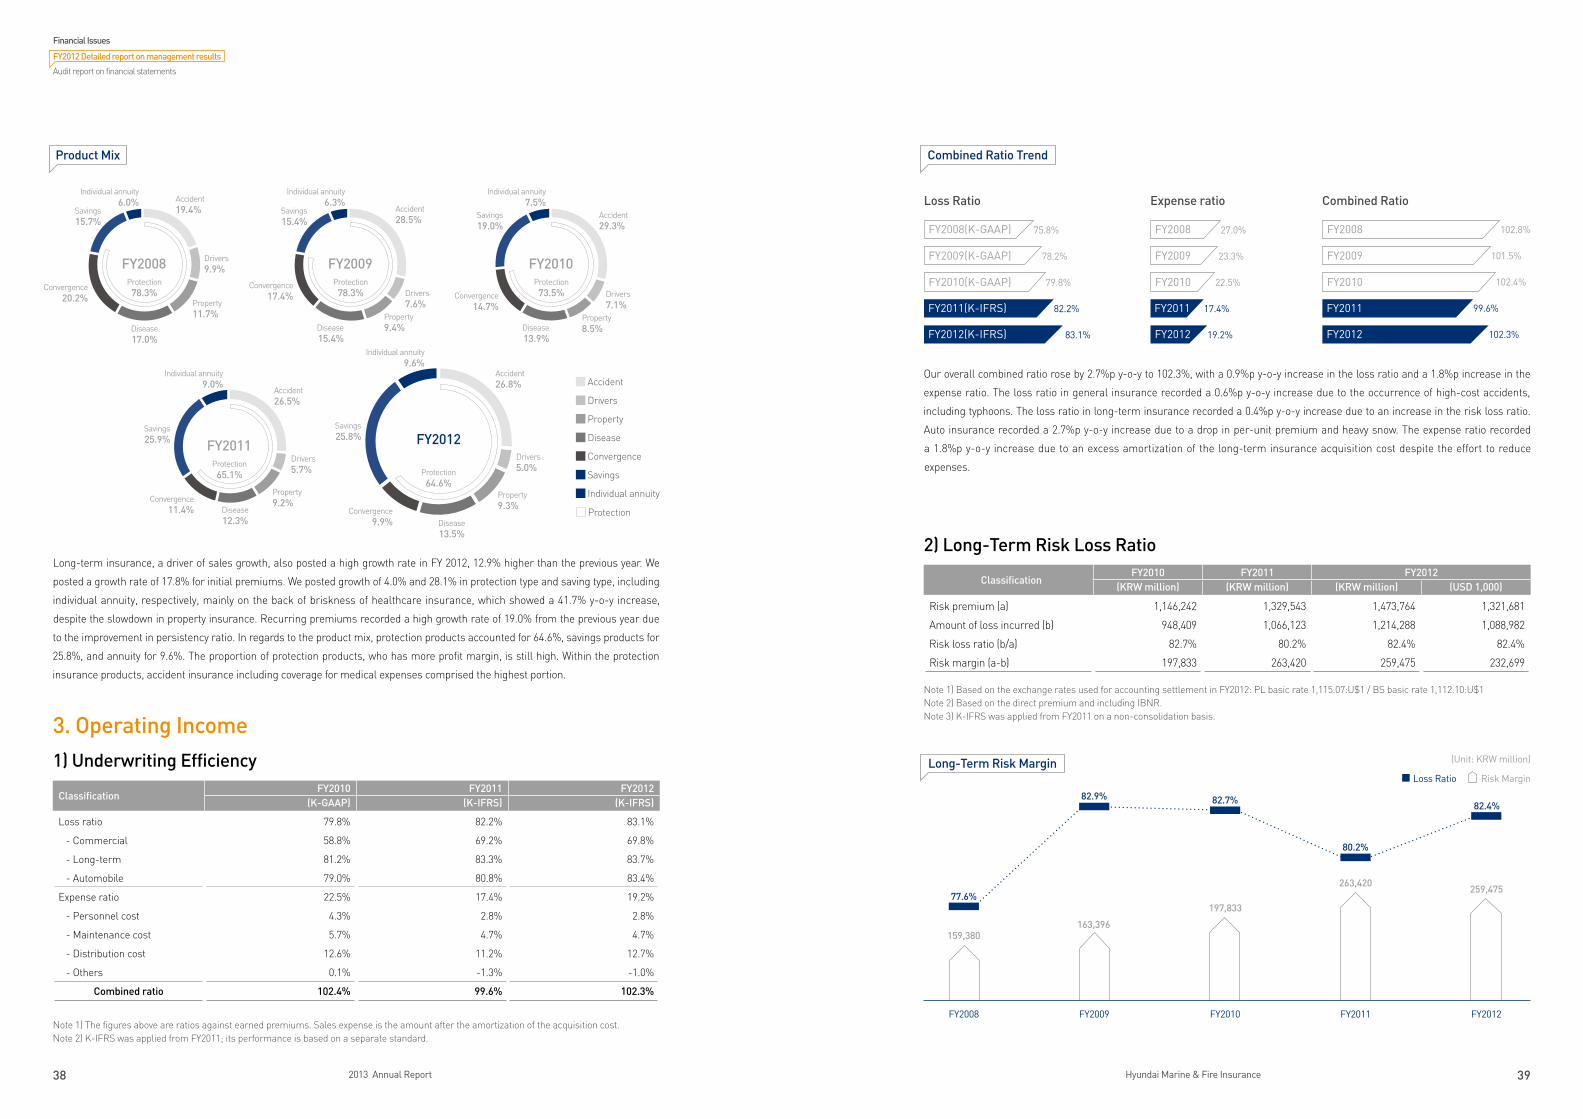
Long-term insurance, a driver of sales growth, also posted a high growth rate in FY 2012, 12.9% higher than the previous year. We
posted a growth rate of 17.8% for initial premiums. We posted growth of 4.0% and 28.1% in protection type and saving type, including
individual annuity, respectively, mainly on the back of briskness of healthcare insurance, which showed a 41.7% y-o-y increase,
despite the slowdown in property insurance. Recurring premiums recorded a high growth rate of 19.0% from the previous year due
to the improvement in persistency ratio. In regards to the product mix, protection products accounted for 64.6%, savings products for
25.8%, and annuity for 9.6%. The proportion of protection products, who has more profit margin, is still high. Within the protection
insurance products, accident insurance including coverage for medical expenses comprised the highest portion.
3. Operating Income1) Underwriting Efficiency
Note 1) The figures above are ratios against earned premiums. Sales expense is the amount after the amortization of the acquisition cost.Note 2) K-IFRS was applied from FY2011; its performance is based on a separate standard.
ClassificationFY2010 FY2011 FY2012
(K-GAAP) (K-IFRS) (K-IFRS)
Loss ratio 79.8% 82.2% 83.1%
- Commercial 58.8% 69.2% 69.8%
- Long-term 81.2% 83.3% 83.7%
- Automobile 79.0% 80.8% 83.4%
Expense ratio 22.5% 17.4% 19.2%
- Personnel cost 4.3% 2.8% 2.8%
- Maintenance cost 5.7% 4.7% 4.7%
- Distribution cost 12.6% 11.2% 12.7%
- Others 0.1% -1.3% -1.0%
Combined ratio 102.4% 99.6% 102.3%
Product Mix
Our overall combined ratio rose by 2.7%p y-o-y to 102.3%, with a 0.9%p y-o-y increase in the loss ratio and a 1.8%p increase in the
expense ratio. The loss ratio in general insurance recorded a 0.6%p y-o-y increase due to the occurrence of high-cost accidents,
including typhoons. The loss ratio in long-term insurance recorded a 0.4%p y-o-y increase due to an increase in the risk loss ratio.
Auto insurance recorded a 2.7%p y-o-y increase due to a drop in per-unit premium and heavy snow. The expense ratio recorded
a 1.8%p y-o-y increase due to an excess amortization of the long-term insurance acquisition cost despite the effort to reduce
expenses.
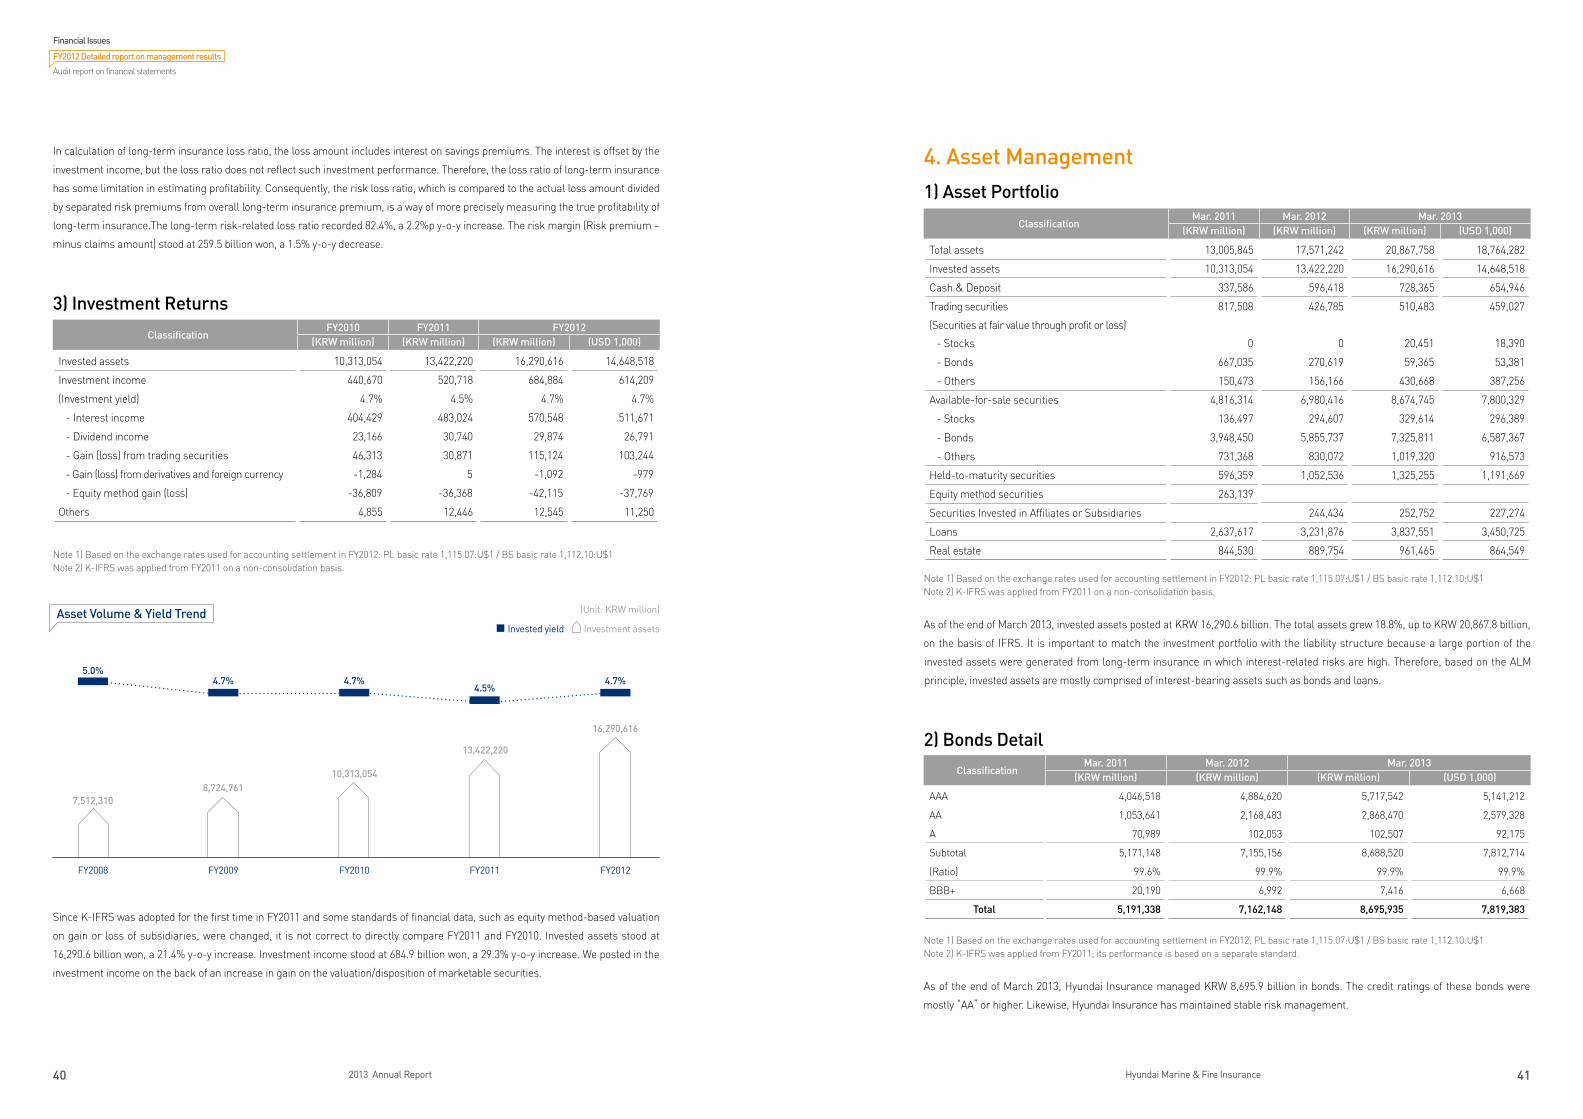
2) Long-Term Risk Loss Ratio
Note 1) Based on the exchange rates used for accounting settlement in FY2012: PL basic rate 1,115.07:U$1 / BS basic rate 1,112.10:U$1Note 2) Based on the direct premium and including IBNR.Note 3) K-IFRS was applied from FY2011 on a non-consolidation basis.
ClassificationFY2010 FY2011 FY2012
(KRW million) (KRW million) (KRW million) (USD 1,000)
Risk premium (a) 1,146,242 1,329,543 1,473,764 1,321,681
Amount of loss incurred (b) 948,409 1,066,123 1,214,288 1,088,982
Risk loss ratio (b/a) 82.7% 80.2% 82.4% 82.4%
Risk margin (a-b) 197,833 263,420 259,475 232,699
Combined Ratio Trend
Loss Ratio
FY2008(K-GAAP)
FY2009(K-GAAP)
FY2010(K-GAAP)
FY2011(K-IFRS)
FY2012(K-IFRS)
75.8%
78.2%
79.8%
82.2%
83.1%
Combined Ratio
FY2008
FY2009
FY2010
FY2011
FY2012
102.8%
101.5%
102.4%
99.6%
102.3%
Expense ratio
FY2008
FY2009
FY2010
FY2011
FY2012
27.0%
23.3%
22.5%
17.4%
19.2%
Accident
Drivers
Property
Disease
Convergence
Savings
Individual annuity
Protection
FY2008
Individual annuity6.0%
Savings15.7%
Convergence20.2%
Disease17.0%
Property11.7%
Drivers9.9%
Accident19.4%
Protection78.3%
FY2012
Individual annuity9.6%
Savings25.8%
Convergence9.9% Disease
13.5%
Property9.3%
Drivers5.0%
Accident26.8%
Protection64.6%
FY2009
Individual annuity6.3%
Savings15.4%
Convergence17.4%
Disease15.4%
Property9.4%
Drivers7.6%
Accident28.5%
Protection78.3%
FY2010
Individual annuity7.5%
Savings19.0%
Convergence14.7%
Disease13.9%
Property8.5%
Drivers7.1%
Accident29.3%
Protection73.5%
FY2011
Individual annuity9.0%
Savings25.9%
Convergence11.4% Disease
12.3%
Property9.2%
Drivers5.7%
Accident26.5%
Protection65.1%
Long-Term Risk Margin (Unit: KRW million)
Risk MarginLoss Ratio
259,47577.6%
82.9% 82.7%
80.2%
82.4%
FY2008 FY2009 FY2010 FY2011 FY2012
159,380163,396
197,833
263,420
Financial Issues
FY2012 Detailed report on management results
Audit report on financial statements
40 2013 Annual Report 41Hyundai Marine & Fire Insurance
In calculation of long-term insurance loss ratio, the loss amount includes interest on savings premiums. The interest is offset by the
investment income, but the loss ratio does not reflect such investment performance. Therefore, the loss ratio of long-term insurance
has some limitation in estimating profitability. Consequently, the risk loss ratio, which is compared to the actual loss amount divided
by separated risk premiums from overall long-term insurance premium, is a way of more precisely measuring the true profitability of
long-term insurance.The long-term risk-related loss ratio recorded 82.4%, a 2.2%p y-o-y increase. The risk margin (Risk premium –
minus claims amount) stood at 259.5 billion won, a 1.5% y-o-y decrease.
3) Investment Returns
Note 1) Based on the exchange rates used for accounting settlement in FY2012: PL basic rate 1,115.07:U$1 / BS basic rate 1,112.10:U$1Note 2) K-IFRS was applied from FY2011 on a non-consolidation basis.
Since K-IFRS was adopted for the first time in FY2011 and some standards of financial data, such as equity method-based valuation
on gain or loss of subsidiaries, were changed, it is not correct to directly compare FY2011 and FY2010. Invested assets stood at
16,290.6 billion won, a 21.4% y-o-y increase. Investment income stood at 684.9 billion won, a 29.3% y-o-y increase. We posted in the
investment income on the back of an increase in gain on the valuation/disposition of marketable securities.
ClassificationFY2010 FY2011 FY2012
(KRW million) (KRW million) (KRW million) (USD 1,000)
Invested assets 10,313,054 13,422,220 16,290,616 14,648,518
Investment income 440,670 520,718 684,884 614,209
(Investment yield) 4.7% 4.5% 4.7% 4.7%
- Interest income 404,429 483,024 570,548 511,671
- Dividend income 23,166 30,740 29,874 26,791
- Gain (loss) from trading securities 46,313 30,871 115,124 103,244
- Gain (loss) from derivatives and foreign currency -1,284 5 -1,092 -979
- Equity method gain (loss) -36,809 -36,368 -42,115 -37,769
Others 4,855 12,446 12,545 11,250
4. Asset Management1) Asset Portfolio
Note 1) Based on the exchange rates used for accounting settlement in FY2012: PL basic rate 1,115.07:U$1 / BS basic rate 1,112.10:U$1Note 2) K-IFRS was applied from FY2011 on a non-consolidation basis.
As of the end of March 2013, invested assets posted at KRW 16,290.6 billion. The total assets grew 18.8%, up to KRW 20,867.8 billion,
on the basis of IFRS. It is important to match the investment portfolio with the liability structure because a large portion of the
invested assets were generated from long-term insurance in which interest-related risks are high. Therefore, based on the ALM
principle, invested assets are mostly comprised of interest-bearing assets such as bonds and loans.
2) Bonds Detail
Note 1) Based on the exchange rates used for accounting settlement in FY2012: PL basic rate 1,115.07:U$1 / BS basic rate 1,112.10:U$1Note 2) K-IFRS was applied from FY2011; its performance is based on a separate standard.
As of the end of March 2013, Hyundai Insurance managed KRW 8,695.9 billion in bonds. The credit ratings of these bonds were
mostly “AA” or higher. Likewise, Hyundai Insurance has maintained stable risk management.
ClassificationMar. 2011 Mar. 2012 Mar. 2013
(KRW million) (KRW million) (KRW million) (USD 1,000)
Total assets 13,005,845 17,571,242 20,867,758 18,764,282
Invested assets 10,313,054 13,422,220 16,290,616 14,648,518
Cash & Deposit 337,586 596,418 728,365 654,946
Trading securities
(Securities at fair value through profit or loss)
817,508 426,785 510,483 459,027
- Stocks 0 0 20,451 18,390
- Bonds 667,035 270,619 59,365 53,381
- Others 150,473 156,166 430,668 387,256
Available-for-sale securities 4,816,314 6,980,416 8,674,745 7,800,329
- Stocks 136,497 294,607 329,614 296,389
- Bonds 3,948,450 5,855,737 7,325,811 6,587,367
- Others 731,368 830,072 1,019,320 916,573
Held-to-maturity securities 596,359 1,052,536 1,325,255 1,191,669
Equity method securities 263,139
Securities Invested in Affiliates or Subsidiaries 244,434 252,752 227,274
Loans 2,637,617 3,231,876 3,837,551 3,450,725
Real estate 844,530 889,754 961,465 864,549
ClassificationMar. 2011 Mar. 2012 Mar. 2013
(KRW million) (KRW million) (KRW million) (USD 1,000)
AAA 4,046,518 4,884,620 5,717,542 5,141,212
AA 1,053,641 2,168,483 2,868,470 2,579,328
A 70,989 102,053 102,507 92,175
Subtotal 5,171,148 7,155,156 8,688,520 7,812,714
(Ratio) 99.6% 99.9% 99.9% 99.9%
BBB+ 20,190 6,992 7,416 6,668
Total 5,191,338 7,162,148 8,695,935 7,819,383
(Unit: KRW million)
FY2008 FY2009 FY2010 FY2011 FY2012
5.0%4.7% 4.7%
4.5%4.7%
7,512,3108,724,761
10,313,054
13,422,220
16,290,616
Asset Volume & Yield TrendInvestment assetsInvested yield
Financial Issues
FY2012 Detailed report on management results
Audit report on financial statements
42 2013 Annual Report 43Hyundai Marine & Fire Insurance
3) Loan Details
As of Mar. 31, 2013
Note 1) Before deducting bad debt reserves and deferred auxiliary revenueNote 2) K-IFRS was applied from FY2011; its performance is based on a separate standard.
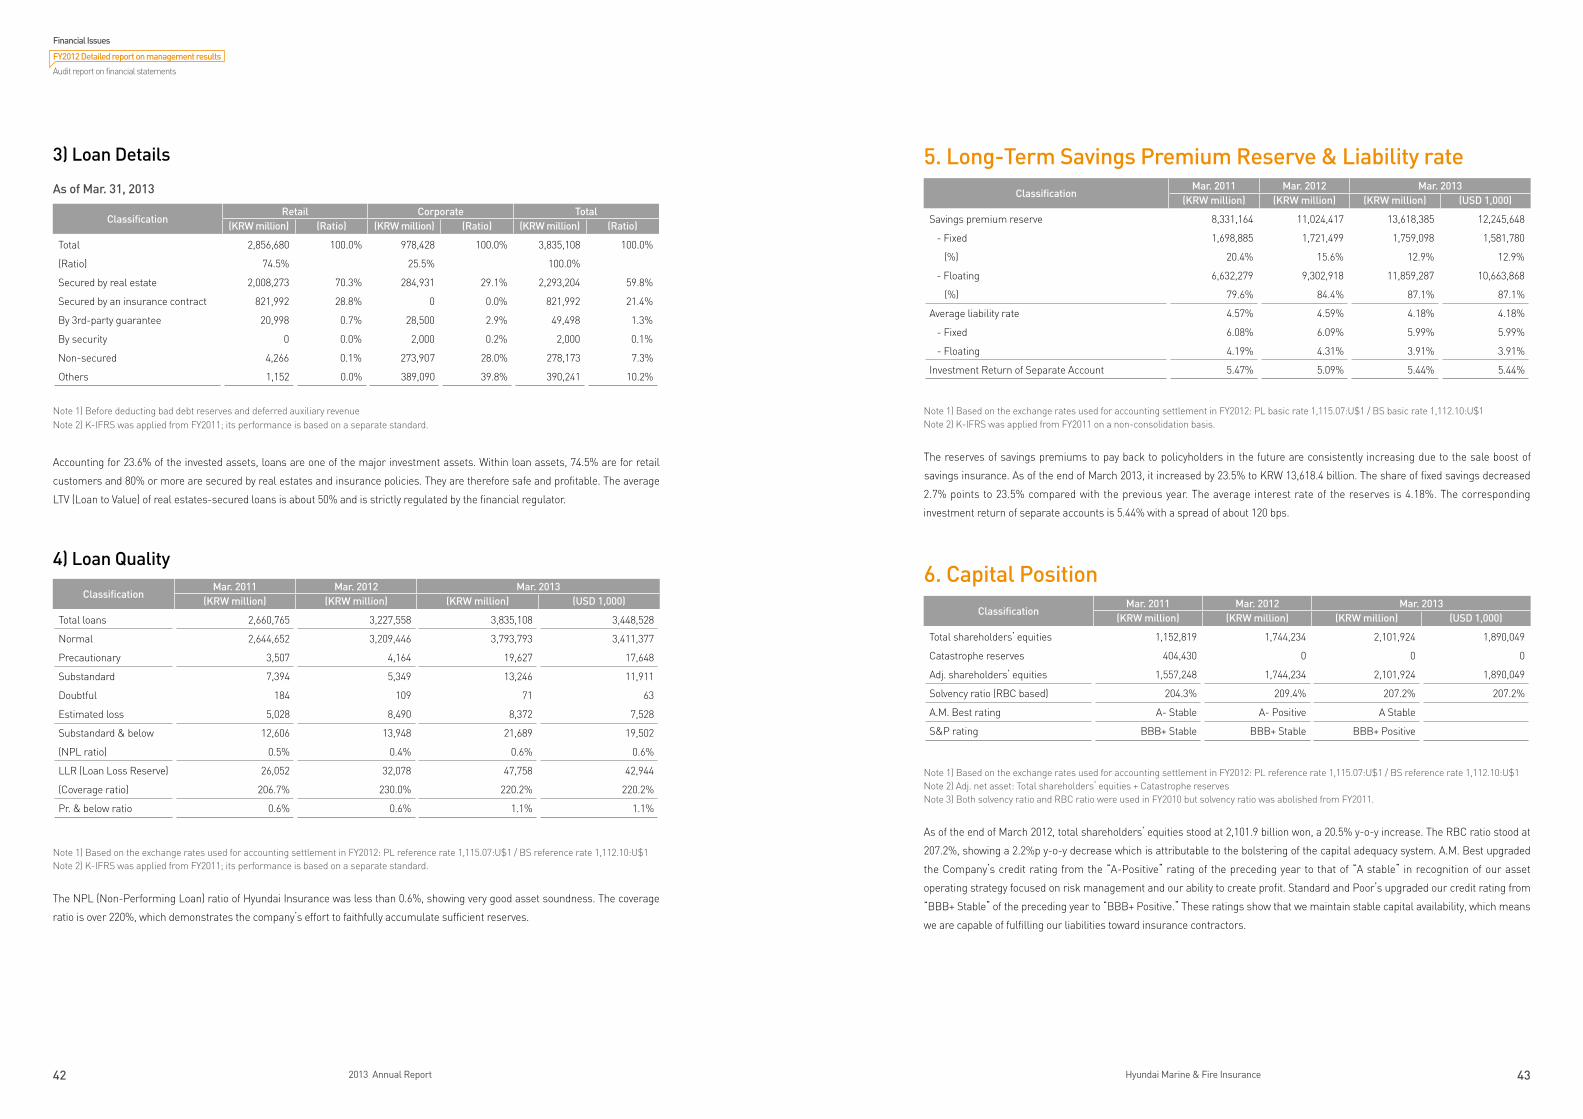
Accounting for 23.6% of the invested assets, loans are one of the major investment assets. Within loan assets, 74.5% are for retail
customers and 80% or more are secured by real estates and insurance policies. They are therefore safe and profitable. The average
LTV (Loan to Value) of real estates-secured loans is about 50% and is strictly regulated by the financial regulator.
4) Loan Quality
Note 1) Based on the exchange rates used for accounting settlement in FY2012: PL reference rate 1,115.07:U$1 / BS reference rate 1,112.10:U$1Note 2) K-IFRS was applied from FY2011; its performance is based on a separate standard.
The NPL (Non-Performing Loan) ratio of Hyundai Insurance was less than 0.6%, showing very good asset soundness. The coverage
ratio is over 220%, which demonstrates the company’s effort to faithfully accumulate sufficient reserves.
ClassificationMar. 2011 Mar. 2012 Mar. 2013
(KRW million) (KRW million) (KRW million) (USD 1,000)
Total loans 2,660,765 3,227,558 3,835,108 3,448,528
Normal 2,644,652 3,209,446 3,793,793 3,411,377
Precautionary 3,507 4,164 19,627 17,648
Substandard 7,394 5,349 13,246 11,911
Doubtful 184 109 71 63
Estimated loss 5,028 8,490 8,372 7,528
Substandard & below 12,606 13,948 21,689 19,502
(NPL ratio) 0.5% 0.4% 0.6% 0.6%
LLR (Loan Loss Reserve) 26,052 32,078 47,758 42,944
(Coverage ratio) 206.7% 230.0% 220.2% 220.2%
Pr. & below ratio 0.6% 0.6% 1.1% 1.1%
ClassificationRetail Corporate Total
(KRW million) (Ratio) (KRW million) (Ratio) (KRW million) (Ratio)
Total 2,856,680 100.0% 978,428 100.0% 3,835,108 100.0%
(Ratio) 74.5% 25.5% 100.0%
Secured by real estate 2,008,273 70.3% 284,931 29.1% 2,293,204 59.8%
Secured by an insurance contract 821,992 28.8% 0 0.0% 821,992 21.4%
By 3rd-party guarantee 20,998 0.7% 28,500 2.9% 49,498 1.3%
By security 0 0.0% 2,000 0.2% 2,000 0.1%
Non-secured 4,266 0.1% 273,907 28.0% 278,173 7.3%
Others 1,152 0.0% 389,090 39.8% 390,241 10.2%
5. Long-Term Savings Premium Reserve & Liability rate
Note 1) Based on the exchange rates used for accounting settlement in FY2012: PL basic rate 1,115.07:U$1 / BS basic rate 1,112.10:U$1Note 2) K-IFRS was applied from FY2011 on a non-consolidation basis.
The reserves of savings premiums to pay back to policyholders in the future are consistently increasing due to the sale boost of
savings insurance. As of the end of March 2013, it increased by 23.5% to KRW 13,618.4 billion. The share of fixed savings decreased
2.7% points to 23.5% compared with the previous year. The average interest rate of the reserves is 4.18%. The corresponding
investment return of separate accounts is 5.44% with a spread of about 120 bps.
6. Capital Position
Note 1) Based on the exchange rates used for accounting settlement in FY2012: PL reference rate 1,115.07:U$1 / BS reference rate 1,112.10:U$1Note 2) Adj. net asset: Total shareholders’ equities + Catastrophe reservesNote 3) Both solvency ratio and RBC ratio were used in FY2010 but solvency ratio was abolished from FY2011.
As of the end of March 2012, total shareholders’ equities stood at 2,101.9 billion won, a 20.5% y-o-y increase. The RBC ratio stood at
207.2%, showing a 2.2%p y-o-y decrease which is attributable to the bolstering of the capital adequacy system. A.M. Best upgraded
the Company’s credit rating from the “A-Positive” rating of the preceding year to that of “A stable” in recognition of our asset
operating strategy focused on risk management and our ability to create profit. Standard and Poor’s upgraded our credit rating from
“BBB+ Stable” of the preceding year to “BBB+ Positive.” These ratings show that we maintain stable capital availability, which means
we are capable of fulfilling our liabilities toward insurance contractors.
ClassificationMar. 2011 Mar. 2012 Mar. 2013
(KRW million) (KRW million) (KRW million) (USD 1,000)
Savings premium reserve 8,331,164 11,024,417 13,618,385 12,245,648
- Fixed 1,698,885 1,721,499 1,759,098 1,581,780
(%) 20.4% 15.6% 12.9% 12.9%
- Floating 6,632,279 9,302,918 11,859,287 10,663,868
(%) 79.6% 84.4% 87.1% 87.1%
Average liability rate 4.57% 4.59% 4.18% 4.18%
- Fixed 6.08% 6.09% 5.99% 5.99%
- Floating 4.19% 4.31% 3.91% 3.91%
Investment Return of Separate Account 5.47% 5.09% 5.44% 5.44%
ClassificationMar. 2011 Mar. 2012 Mar. 2013
(KRW million) (KRW million) (KRW million) (USD 1,000)
Total shareholders’ equities 1,152,819 1,744,234 2,101,924 1,890,049
Catastrophe reserves 404,430 0 0 0
Adj. shareholders’ equities 1,557,248 1,744,234 2,101,924 1,890,049
Solvency ratio (RBC based) 204.3% 209.4% 207.2% 207.2%
A.M. Best rating A- Stable A- Positive A Stable
S&P rating BBB+ Stable BBB+ Stable BBB+ Positive
Financial Issues
FY2012 Detailed report on management results
Audit report on financial statements
44 2013 Annual Report 45Hyundai Marine & Fire Insurance
7. Shareholders’Dividend
Note 1) Based on the exchange rates used for accounting settlement in FY2012: PL basic rate 1,115.07:U$1 / BS basic rate 1,112.10:U$1Note 2) K-IFRS was applied from FY2011; its performance is based on a separate standard.
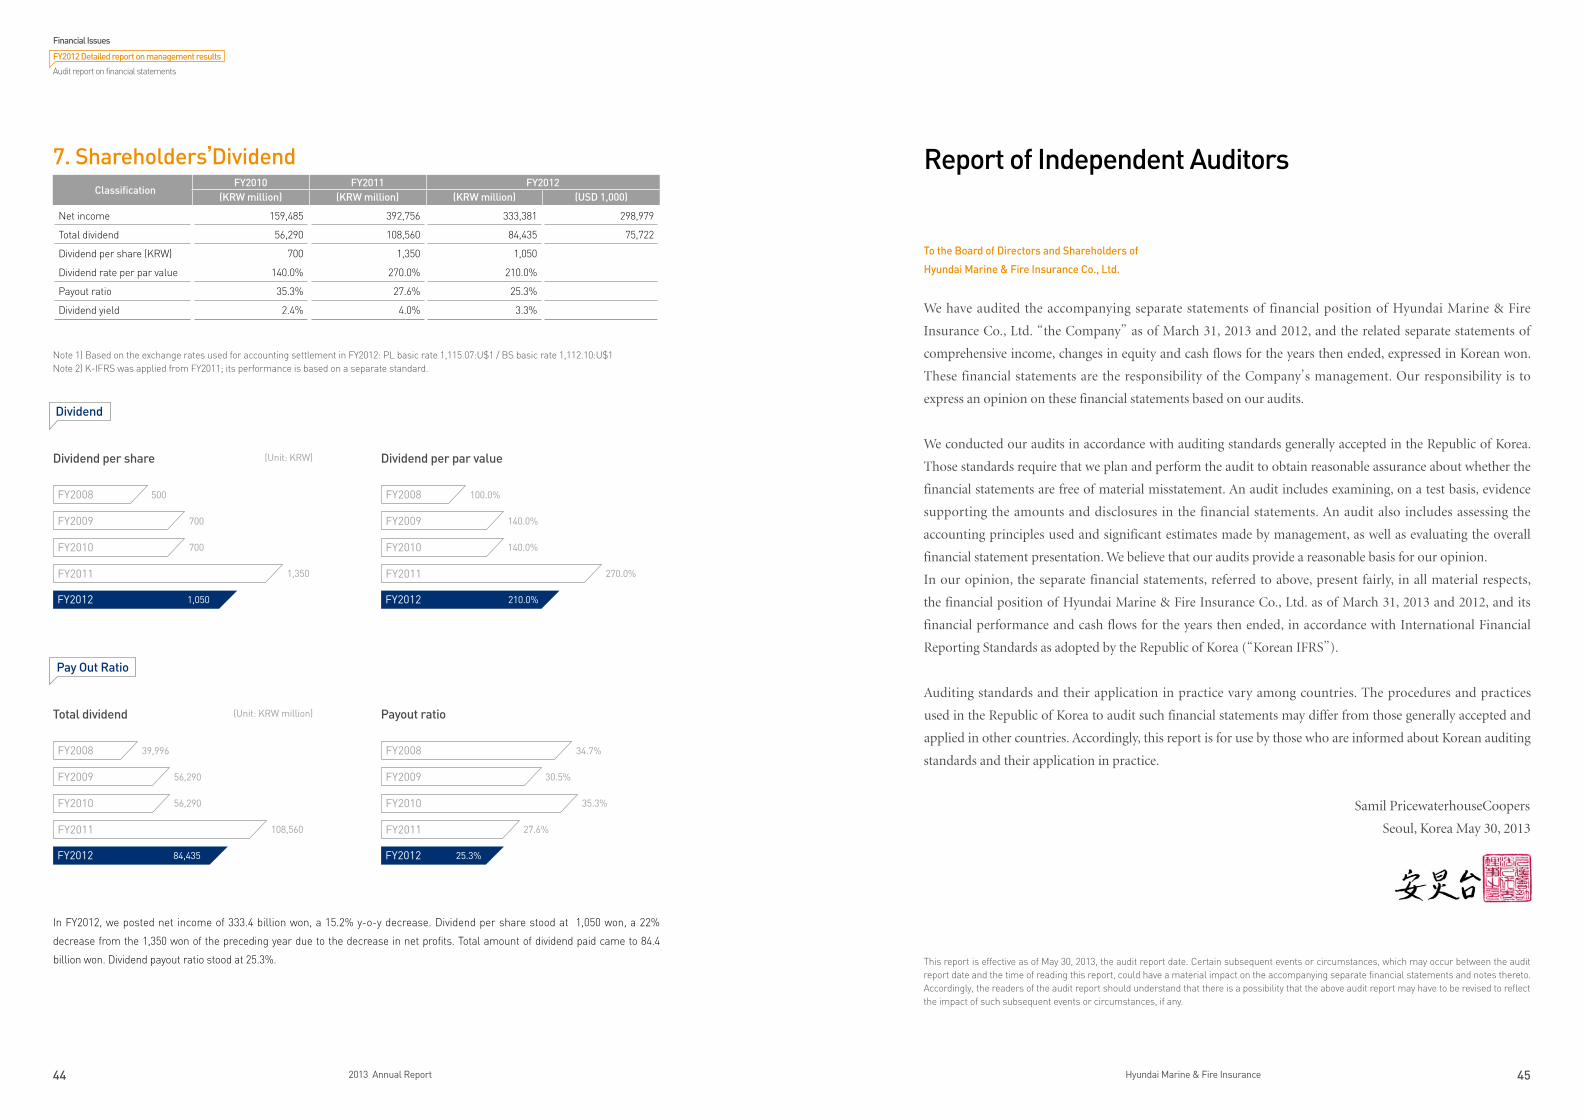
In FY2012, we posted net income of 333.4 billion won, a 15.2% y-o-y decrease. Dividend per share stood at 1,050 won, a 22%
decrease from the 1,350 won of the preceding year due to the decrease in net profits. Total amount of dividend paid came to 84.4
billion won. Dividend payout ratio stood at 25.3%.
ClassificationFY2010 FY2011 FY2012
(KRW million) (KRW million) (KRW million) (USD 1,000)
Net income 159,485 392,756 333,381 298,979
Total dividend 56,290 108,560 84,435 75,722
Dividend per share (KRW) 700 1,350 1,050
Dividend rate per par value 140.0% 270.0% 210.0%
Payout ratio 35.3% 27.6% 25.3%
Dividend yield 2.4% 4.0% 3.3%
Total dividend
FY2008
FY2009
FY2011
FY2012
FY2010
39,996
56,290
56,290
108,560
84,435
Payout ratio
FY2008
FY2009
FY2011
FY2012
FY2010
34.7%
30.5%
35.3%
27.6%
25.3%
Dividend per par value
FY2008
FY2009
FY2011
FY2012
FY2010
100.0%
140.0%
140.0%
270.0%
210.0%
Dividend per share
FY2008
FY2009
FY2011
FY2012
FY2010
500
700
700
1,350
1,050
Dividend
Pay Out Ratio
(Unit: KRW)
(Unit: KRW million)
Report of Independent Auditors
To the Board of Directors and Shareholders of
Hyundai Marine & Fire Insurance Co., Ltd.
We have audited the accompanying separate statements of financial position of Hyundai Marine & Fire
Insurance Co., Ltd. “the Company” as of March 31, 2013 and 2012, and the related separate statements of
comprehensive income, changes in equity and cash flows for the years then ended, expressed in Korean won.
These financial statements are the responsibility of the Company’s management. Our responsibility is to
express an opinion on these financial statements based on our audits.
We conducted our audits in accordance with auditing standards generally accepted in the Republic of Korea.
Those standards require that we plan and perform the audit to obtain reasonable assurance about whether the
financial statements are free of material misstatement. An audit includes examining, on a test basis, evidence
supporting the amounts and disclosures in the financial statements. An audit also includes assessing the
accounting principles used and significant estimates made by management, as well as evaluating the overall
financial statement presentation. We believe that our audits provide a reasonable basis for our opinion.
In our opinion, the separate financial statements, referred to above, present fairly, in all material respects,
the financial position of Hyundai Marine & Fire Insurance Co., Ltd. as of March 31, 2013 and 2012, and its
financial performance and cash flows for the years then ended, in accordance with International Financial
Reporting Standards as adopted by the Republic of Korea (“Korean IFRS”).
Auditing standards and their application in practice vary among countries. The procedures and practices
used in the Republic of Korea to audit such financial statements may differ from those generally accepted and
applied in other countries. Accordingly, this report is for use by those who are informed about Korean auditing
standards and their application in practice.
Samil PricewaterhouseCoopers
Seoul, Korea May 30, 2013
This report is effective as of May 30, 2013, the audit report date. Certain subsequent events or circumstances, which may occur between the audit report date and the time of reading this report, could have a material impact on the accompanying separate financial statements and notes thereto. Accordingly, the readers of the audit report should understand that there is a possibility that the above audit report may have to be revised to reflect the impact of such subsequent events or circumstances, if any.
Financial Issues
FY2012 Detailed report on management results
Audit report on financial statements
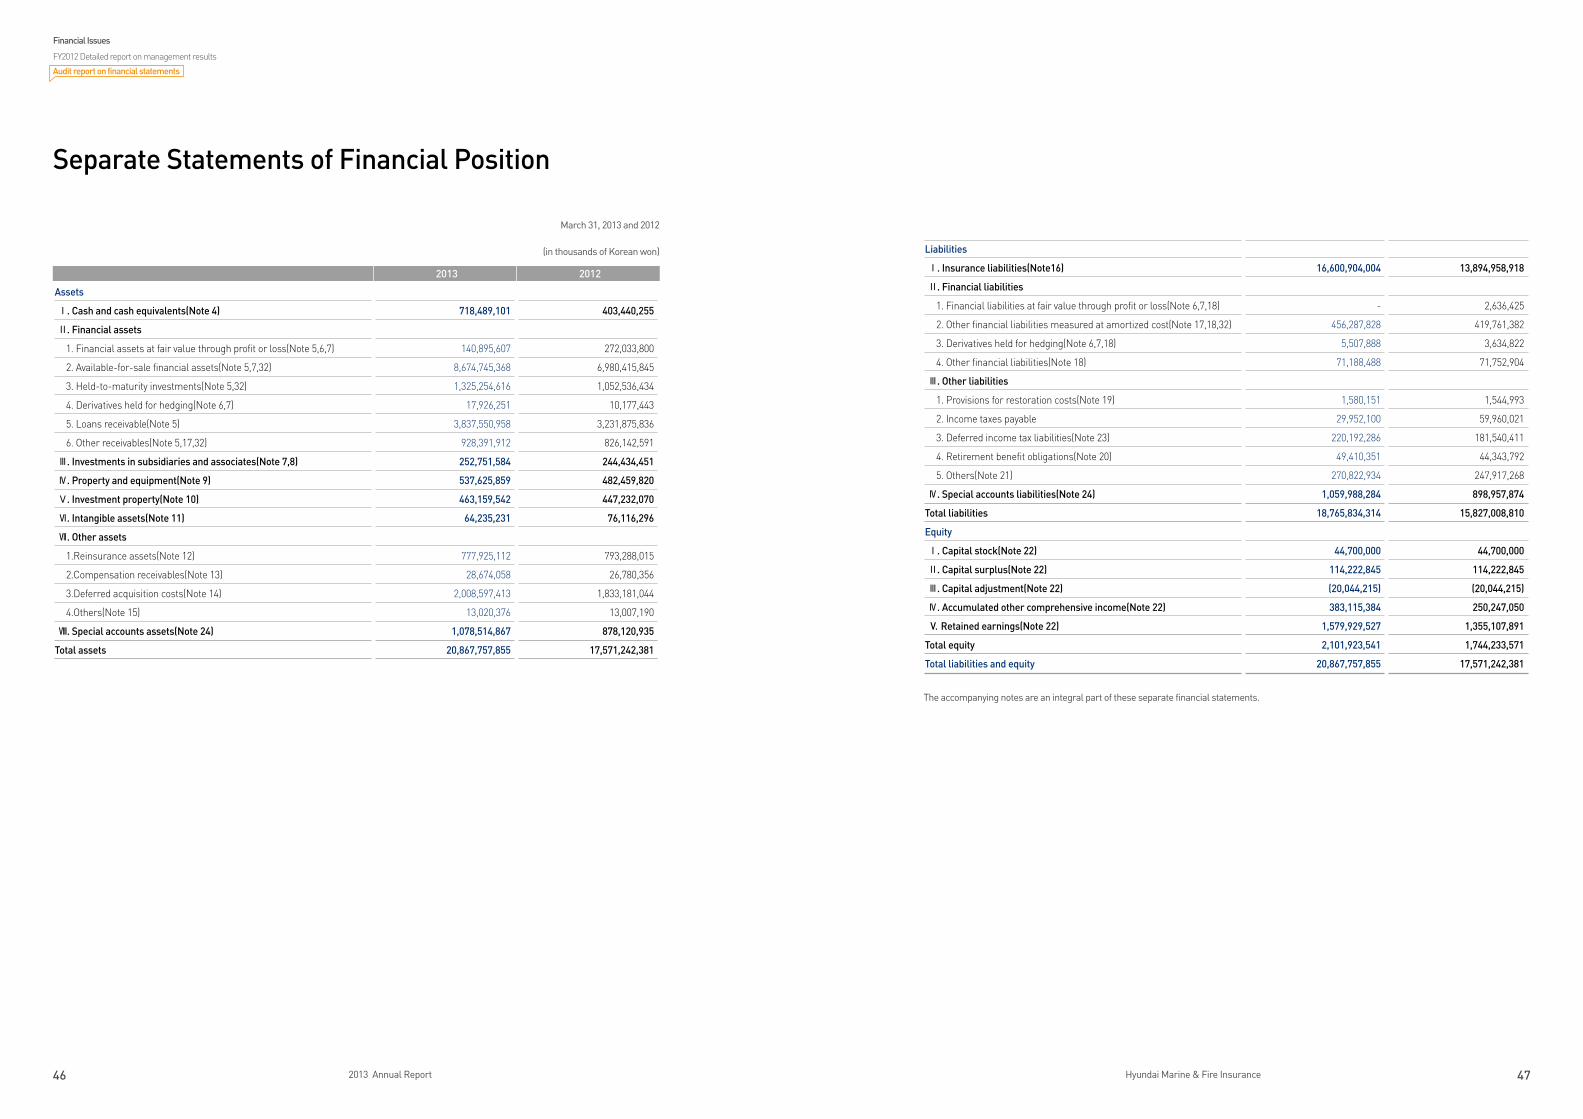
46 2013 Annual Report 47Hyundai Marine & Fire Insurance
2013 2012
Assets
Ⅰ. Cash and cash equivalents(Note 4) 718,489,101 403,440,255
Ⅱ. Financial assets
1. Financial assets at fair value through profit or loss(Note 5,6,7) 140,895,607 272,033,800
2. Available-for-sale financial assets(Note 5,7,32) 8,674,745,368 6,980,415,845
3. Held-to-maturity investments(Note 5,32) 1,325,254,616 1,052,536,434
4. Derivatives held for hedging(Note 6,7) 17,926,251 10,177,443
5. Loans receivable(Note 5) 3,837,550,958 3,231,875,836
6. Other receivables(Note 5,17,32) 928,391,912 826,142,591
Ⅲ. Investments in subsidiaries and associates(Note 7,8) 252,751,584 244,434,451
Ⅳ. Property and equipment(Note 9) 537,625,859 482,459,820
Ⅴ. Investment property(Note 10) 463,159,542 447,232,070
Ⅵ. Intangible assets(Note 11) 64,235,231 76,116,296
Ⅶ. Other assets
1.Reinsurance assets(Note 12) 777,925,112 793,288,015
2.Compensation receivables(Note 13) 28,674,058 26,780,356
3.Deferred acquisition costs(Note 14) 2,008,597,413 1,833,181,044
4.Others(Note 15) 13,020,376 13,007,190
Ⅷ. Special accounts assets(Note 24) 1,078,514,867 878,120,935
Total assets 20,867,757,855 17,571,242,381
Liabilities
Ⅰ. Insurance liabilities(Note16) 16,600,904,004 13,894,958,918
Ⅱ. Financial liabilities
1. Financial liabilities at fair value through profit or loss(Note 6,7,18) - 2,636,425
2. Other financial liabilities measured at amortized cost(Note 17,18,32) 456,287,828 419,761,382
3. Derivatives held for hedging(Note 6,7,18) 5,507,888 3,634,822
4. Other financial liabilities(Note 18) 71,188,488 71,752,904
Ⅲ. Other liabilities
1. Provisions for restoration costs(Note 19) 1,580,151 1,544,993
2. Income taxes payable 29,952,100 59,960,021
3. Deferred income tax liabilities(Note 23) 220,192,286 181,540,411
4. Retirement benefit obligations(Note 20) 49,410,351 44,343,792
5. Others(Note 21) 270,822,934 247,917,268
Ⅳ. Special accounts liabilities(Note 24) 1,059,988,284 898,957,874
Total liabilities 18,765,834,314 15,827,008,810
Equity
Ⅰ. Capital stock(Note 22) 44,700,000 44,700,000
Ⅱ. Capital surplus(Note 22) 114,222,845 114,222,845
Ⅲ. Capital adjustment(Note 22) (20,044,215) (20,044,215)
Ⅳ. Accumulated other comprehensive income(Note 22) 383,115,384 250,247,050
V. Retained earnings(Note 22) 1,579,929,527 1,355,107,891
Total equity 2,101,923,541 1,744,233,571
Total liabilities and equity 20,867,757,855 17,571,242,381
Separate Statements of Financial Position
March 31, 2013 and 2012
(in thousands of Korean won)
The accompanying notes are an integral part of these separate financial statements.
Financial Issues
FY2012 Detailed report on management results
Audit report on financial statements
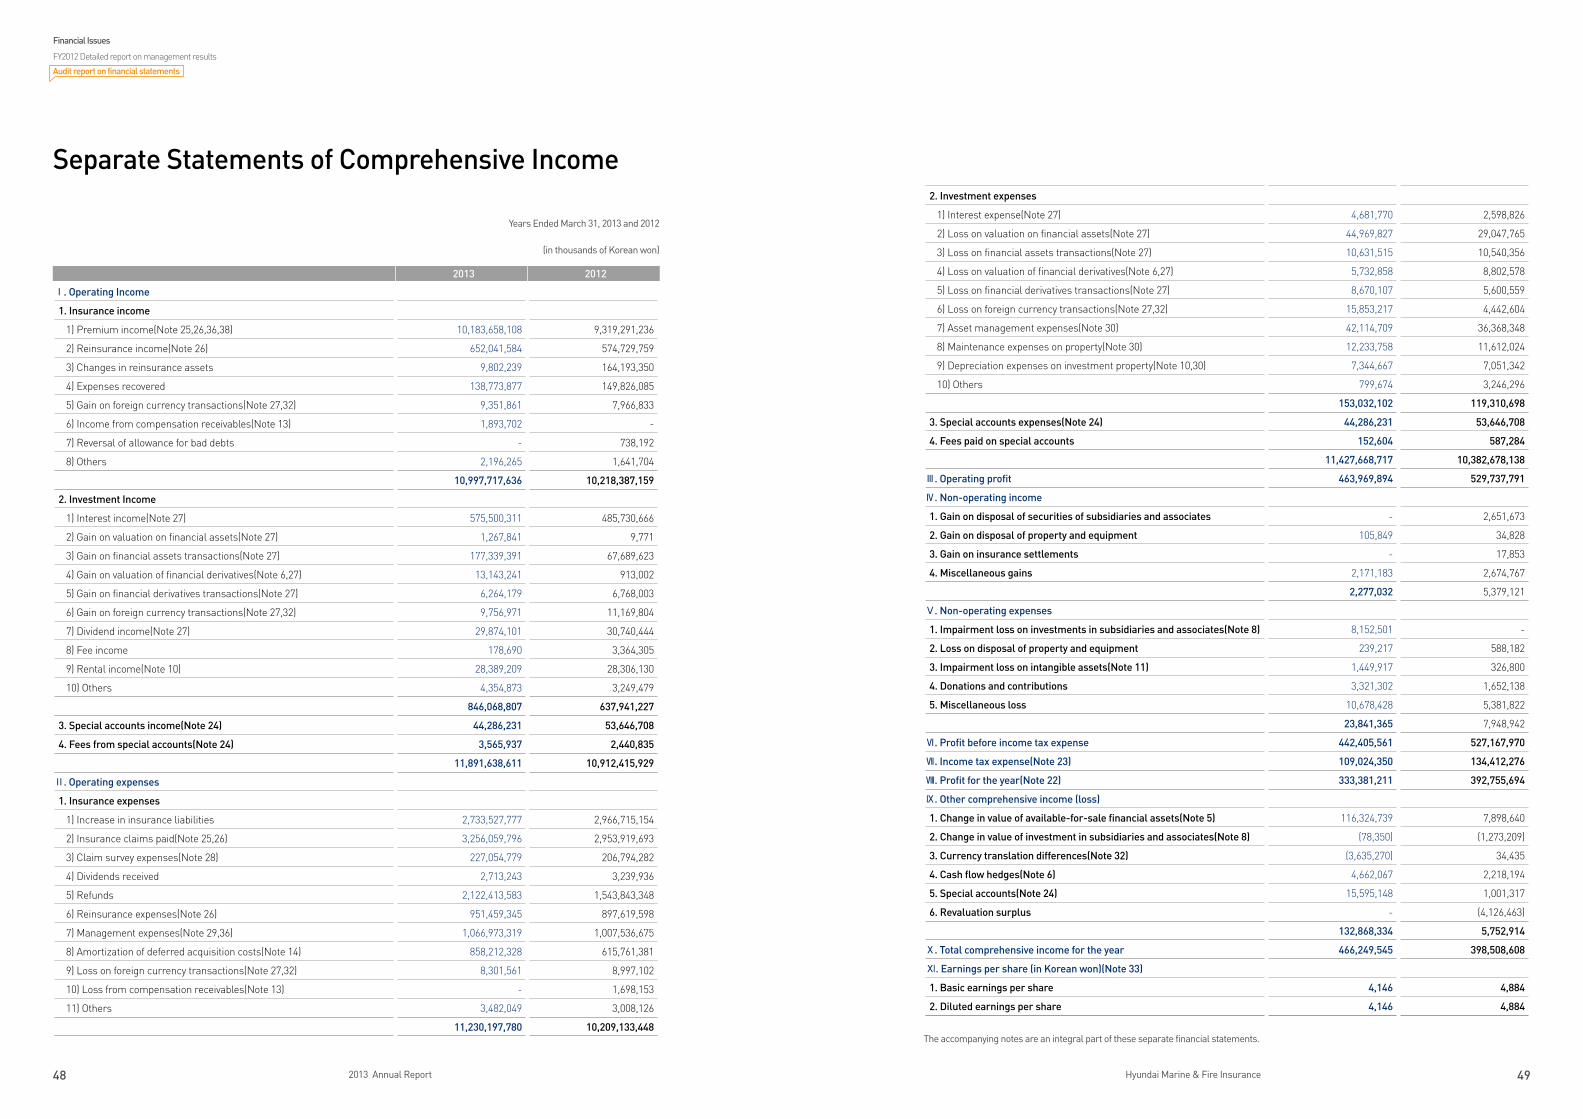
48 2013 Annual Report 49Hyundai Marine & Fire Insurance
2013 2012
Ⅰ. Operating Income
1. Insurance income
1) Premium income(Note 25,26,36,38) 10,183,658,108 9,319,291,236
2) Reinsurance income(Note 26) 652,041,584 574,729,759
3) Changes in reinsurance assets 9,802,239 164,193,350
4) Expenses recovered 138,773,877 149,826,085
5) Gain on foreign currency transactions(Note 27,32) 9,351,861 7,966,833
6) Income from compensation receivables(Note 13) 1,893,702 -
7) Reversal of allowance for bad debts - 738,192
8) Others 2,196,265 1,641,704
10,997,717,636 10,218,387,159
2. Investment Income
1) Interest income(Note 27) 575,500,311 485,730,666
2) Gain on valuation on financial assets(Note 27) 1,267,841 9,771
3) Gain on financial assets transactions(Note 27) 177,339,391 67,689,623
4) Gain on valuation of financial derivatives(Note 6,27) 13,143,241 913,002
5) Gain on financial derivatives transactions(Note 27) 6,264,179 6,768,003
6) Gain on foreign currency transactions(Note 27,32) 9,756,971 11,169,804
7) Dividend income(Note 27) 29,874,101 30,740,444
8) Fee income 178,690 3,364,305
9) Rental income(Note 10) 28,389,209 28,306,130
10) Others 4,354,873 3,249,479
846,068,807 637,941,227
3. Special accounts income(Note 24) 44,286,231 53,646,708
4. Fees from special accounts(Note 24) 3,565,937 2,440,835
11,891,638,611 10,912,415,929
Ⅱ. Operating expenses
1. Insurance expenses
1) Increase in insurance liabilities 2,733,527,777 2,966,715,154
2) Insurance claims paid(Note 25,26) 3,256,059,796 2,953,919,693
3) Claim survey expenses(Note 28) 227,054,779 206,794,282
4) Dividends received 2,713,243 3,239,936
5) Refunds 2,122,413,583 1,543,843,348
6) Reinsurance expenses(Note 26) 951,459,345 897,619,598
7) Management expenses(Note 29,36) 1,066,973,319 1,007,536,675
8) Amortization of deferred acquisition costs(Note 14) 858,212,328 615,761,381
9) Loss on foreign currency transactions(Note 27,32) 8,301,561 8,997,102
10) Loss from compensation receivables(Note 13) - 1,698,153
11) Others 3,482,049 3,008,126
11,230,197,780 10,209,133,448
2. Investment expenses
1) Interest expense(Note 27) 4,681,770 2,598,826
2) Loss on valuation on financial assets(Note 27) 44,969,827 29,047,765
3) Loss on financial assets transactions(Note 27) 10,631,515 10,540,356
4) Loss on valuation of financial derivatives(Note 6,27) 5,732,858 8,802,578
5) Loss on financial derivatives transactions(Note 27) 8,670,107 5,600,559
6) Loss on foreign currency transactions(Note 27,32) 15,853,217 4,442,604
7) Asset management expenses(Note 30) 42,114,709 36,368,348
8) Maintenance expenses on property(Note 30) 12,233,758 11,612,024
9) Depreciation expenses on investment property(Note 10,30) 7,344,667 7,051,342
10) Others 799,674 3,246,296
153,032,102 119,310,698
3. Special accounts expenses(Note 24) 44,286,231 53,646,708
4. Fees paid on special accounts 152,604 587,284
11,427,668,717 10,382,678,138
Ⅲ. Operating profit 463,969,894 529,737,791
Ⅳ. Non-operating income
1. Gain on disposal of securities of subsidiaries and associates - 2,651,673
2. Gain on disposal of property and equipment 105,849 34,828
3. Gain on insurance settlements - 17,853
4. Miscellaneous gains 2,171,183 2,674,767
2,277,032 5,379,121
Ⅴ. Non-operating expenses
1. Impairment loss on investments in subsidiaries and associates(Note 8) 8,152,501 -
2. Loss on disposal of property and equipment 239,217 588,182
3. Impairment loss on intangible assets(Note 11) 1,449,917 326,800
4. Donations and contributions 3,321,302 1,652,138
5. Miscellaneous loss 10,678,428 5,381,822
23,841,365 7,948,942
Ⅵ. Profit before income tax expense 442,405,561 527,167,970
Ⅶ. Income tax expense(Note 23) 109,024,350 134,412,276
Ⅷ. Profit for the year(Note 22) 333,381,211 392,755,694
Ⅸ. Other comprehensive income (loss)
1. Change in value of available-for-sale financial assets(Note 5) 116,324,739 7,898,640
2. Change in value of investment in subsidiaries and associates(Note 8) (78,350) (1,273,209)
3. Currency translation differences(Note 32) (3,635,270) 34,435
4. Cash flow hedges(Note 6) 4,662,067 2,218,194
5. Special accounts(Note 24) 15,595,148 1,001,317
6. Revaluation surplus - (4,126,463)
132,868,334 5,752,914
Ⅹ. Total comprehensive income for the year 466,249,545 398,508,608
ⅩI. Earnings per share (in Korean won)(Note 33)
1. Basic earnings per share 4,146 4,884
2. Diluted earnings per share 4,146 4,884
Separate Statements of Comprehensive Income
Years Ended March 31, 2013 and 2012
(in thousands of Korean won)
The accompanying notes are an integral part of these separate financial statements.
Financial Issues
FY2012 Detailed report on management results
Audit report on financial statements
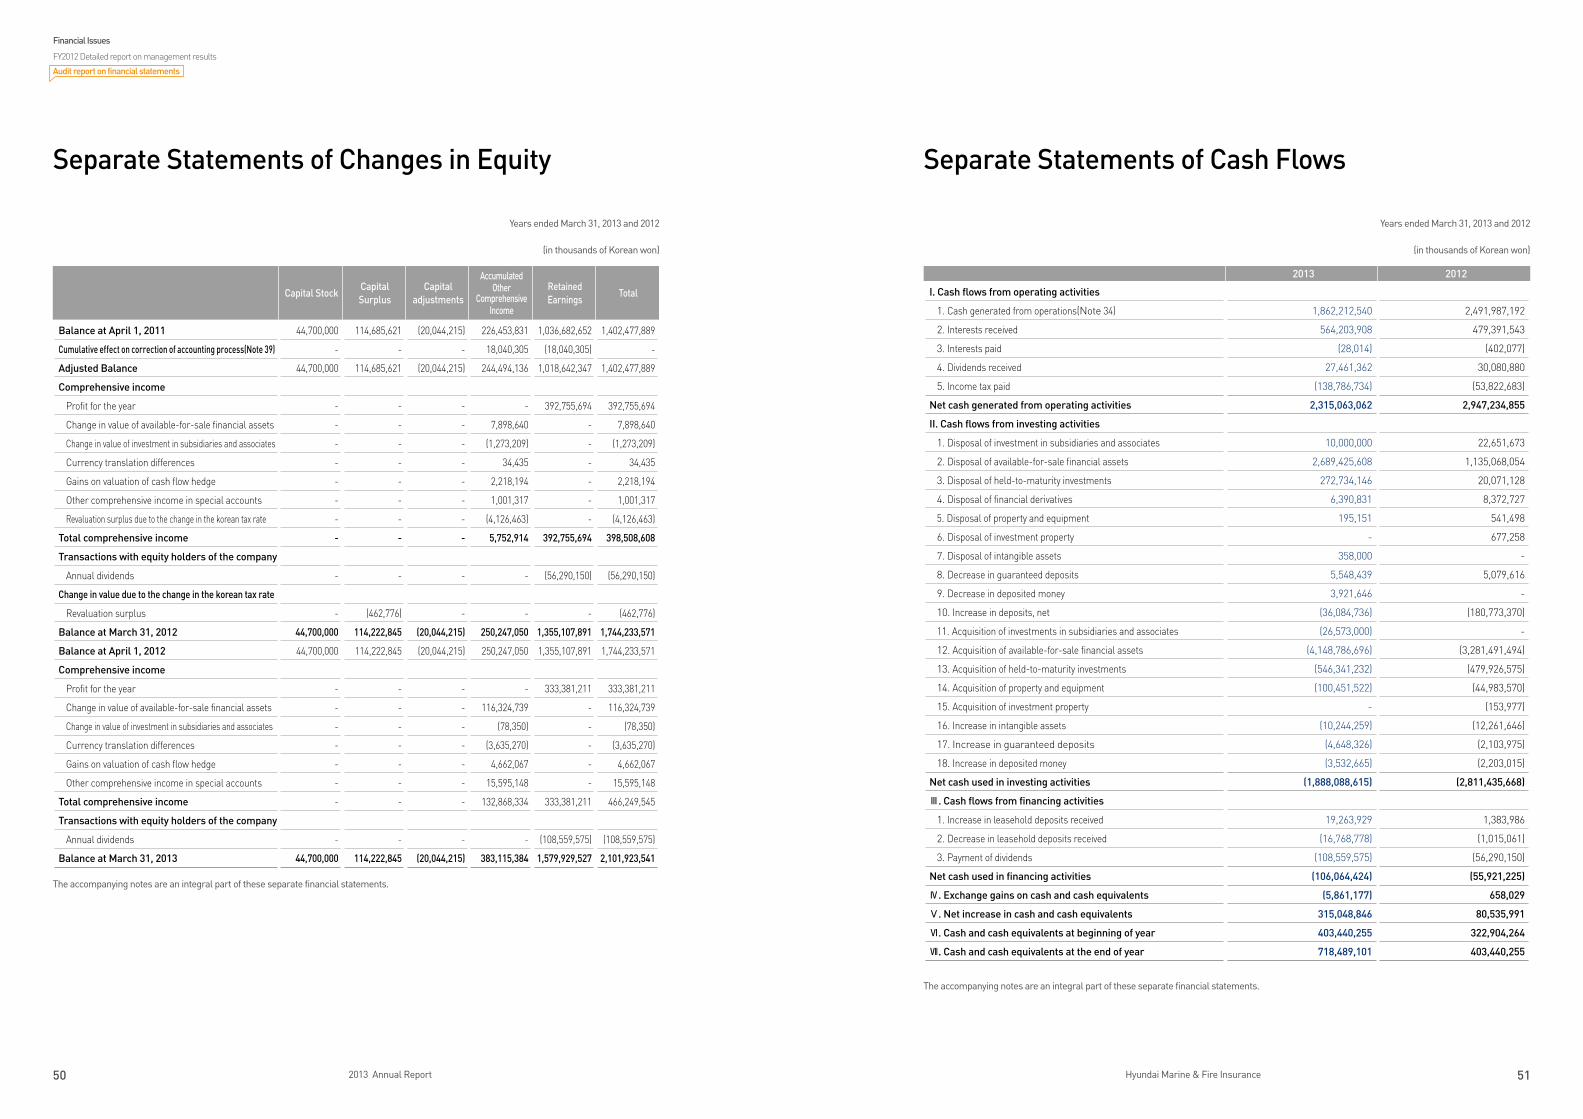
50 2013 Annual Report 51Hyundai Marine & Fire Insurance
Capital StockCapital Surplus
Capital adjustments
Accumulated Other
Comprehensive Income
Retained Earnings
Total
Balance at April 1, 2011 44,700,000 114,685,621 (20,044,215) 226,453,831 1,036,682,652 1,402,477,889
Cumulative effect on correction of accounting process(Note 39) - - - 18,040,305 (18,040,305) -
Adjusted Balance 44,700,000 114,685,621 (20,044,215) 244,494,136 1,018,642,347 1,402,477,889
Comprehensive income
Profit for the year - - - - 392,755,694 392,755,694
Change in value of available-for-sale financial assets - - - 7,898,640 - 7,898,640
Change in value of investment in subsidiaries and associates - - - (1,273,209) - (1,273,209)
Currency translation differences - - - 34,435 - 34,435
Gains on valuation of cash flow hedge - - - 2,218,194 - 2,218,194
Other comprehensive income in special accounts - - - 1,001,317 - 1,001,317
Revaluation surplus due to the change in the korean tax rate - - - (4,126,463) - (4,126,463)
Total comprehensive income - - - 5,752,914 392,755,694 398,508,608
Transactions with equity holders of the company
Annual dividends - - - - (56,290,150) (56,290,150)
Change in value due to the change in the korean tax rate
Revaluation surplus - (462,776) - - - (462,776)
Balance at March 31, 2012 44,700,000 114,222,845 (20,044,215) 250,247,050 1,355,107,891 1,744,233,571
Balance at April 1, 2012 44,700,000 114,222,845 (20,044,215) 250,247,050 1,355,107,891 1,744,233,571
Comprehensive income
Profit for the year - - - - 333,381,211 333,381,211
Change in value of available-for-sale financial assets - - - 116,324,739 - 116,324,739
Change in value of investment in subsidiaries and associates - - - (78,350) - (78,350)
Currency translation differences - - - (3,635,270) - (3,635,270)
Gains on valuation of cash flow hedge - - - 4,662,067 - 4,662,067
Other comprehensive income in special accounts - - - 15,595,148 - 15,595,148
Total comprehensive income - - - 132,868,334 333,381,211 466,249,545
Transactions with equity holders of the company
Annual dividends - - - - (108,559,575) (108,559,575)
Balance at March 31, 2013 44,700,000 114,222,845 (20,044,215) 383,115,384 1,579,929,527 2,101,923,541
Separate Statements of Changes in Equity Separate Statements of Cash Flows
The accompanying notes are an integral part of these separate financial statements.
2013 2012
I. Cash flows from operating activities
1. Cash generated from operations(Note 34) 1,862,212,540 2,491,987,192
2. Interests received 564,203,908 479,391,543
3. Interests paid (28,014) (402,077)
4. Dividends received 27,461,362 30,080,880
5. Income tax paid (138,786,734) (53,822,683)
Net cash generated from operating activities 2,315,063,062 2,947,234,855
II. Cash flows from investing activities
1. Disposal of investment in subsidiaries and associates 10,000,000 22,651,673
2. Disposal of available-for-sale financial assets 2,689,425,608 1,135,068,054
3. Disposal of held-to-maturity investments 272,734,146 20,071,128
4. Disposal of financial derivatives 6,390,831 8,372,727
5. Disposal of property and equipment 195,151 541,498
6. Disposal of investment property - 677,258
7. Disposal of intangible assets 358,000 -
8. Decrease in guaranteed deposits 5,548,439 5,079,616
9. Decrease in deposited money 3,921,646 -
10. Increase in deposits, net (36,084,736) (180,773,370)
11. Acquisition of investments in subsidiaries and associates (26,573,000) -
12. Acquisition of available-for-sale financial assets (4,148,786,696) (3,281,491,494)
13. Acquisition of held-to-maturity investments (546,341,232) (479,926,575)
14. Acquisition of property and equipment (100,451,522) (44,983,570)
15. Acquisition of investment property - (153,977)
16. Increase in intangible assets (10,244,259) (12,261,646)
17. Increase in guaranteed deposits (4,648,326) (2,103,975)
18. Increase in deposited money (3,532,665) (2,203,015)
Net cash used in investing activities (1,888,088,615) (2,811,435,668)
Ⅲ. Cash flows from financing activities
1. Increase in leasehold deposits received 19,263,929 1,383,986
2. Decrease in leasehold deposits received (16,768,778) (1,015,061)
3. Payment of dividends (108,559,575) (56,290,150)
Net cash used in financing activities (106,064,424) (55,921,225)
Ⅳ. Exchange gains on cash and cash equivalents (5,861,177) 658,029
Ⅴ. Net increase in cash and cash equivalents 315,048,846 80,535,991
Ⅵ. Cash and cash equivalents at beginning of year 403,440,255 322,904,264
Ⅶ. Cash and cash equivalents at the end of year 718,489,101 403,440,255
Years ended March 31, 2013 and 2012
(in thousands of Korean won)
Years ended March 31, 2013 and 2012
(in thousands of Korean won)
The accompanying notes are an integral part of these separate financial statements.
Financial Issues
FY2012 Detailed report on management results
Audit report on financial statements
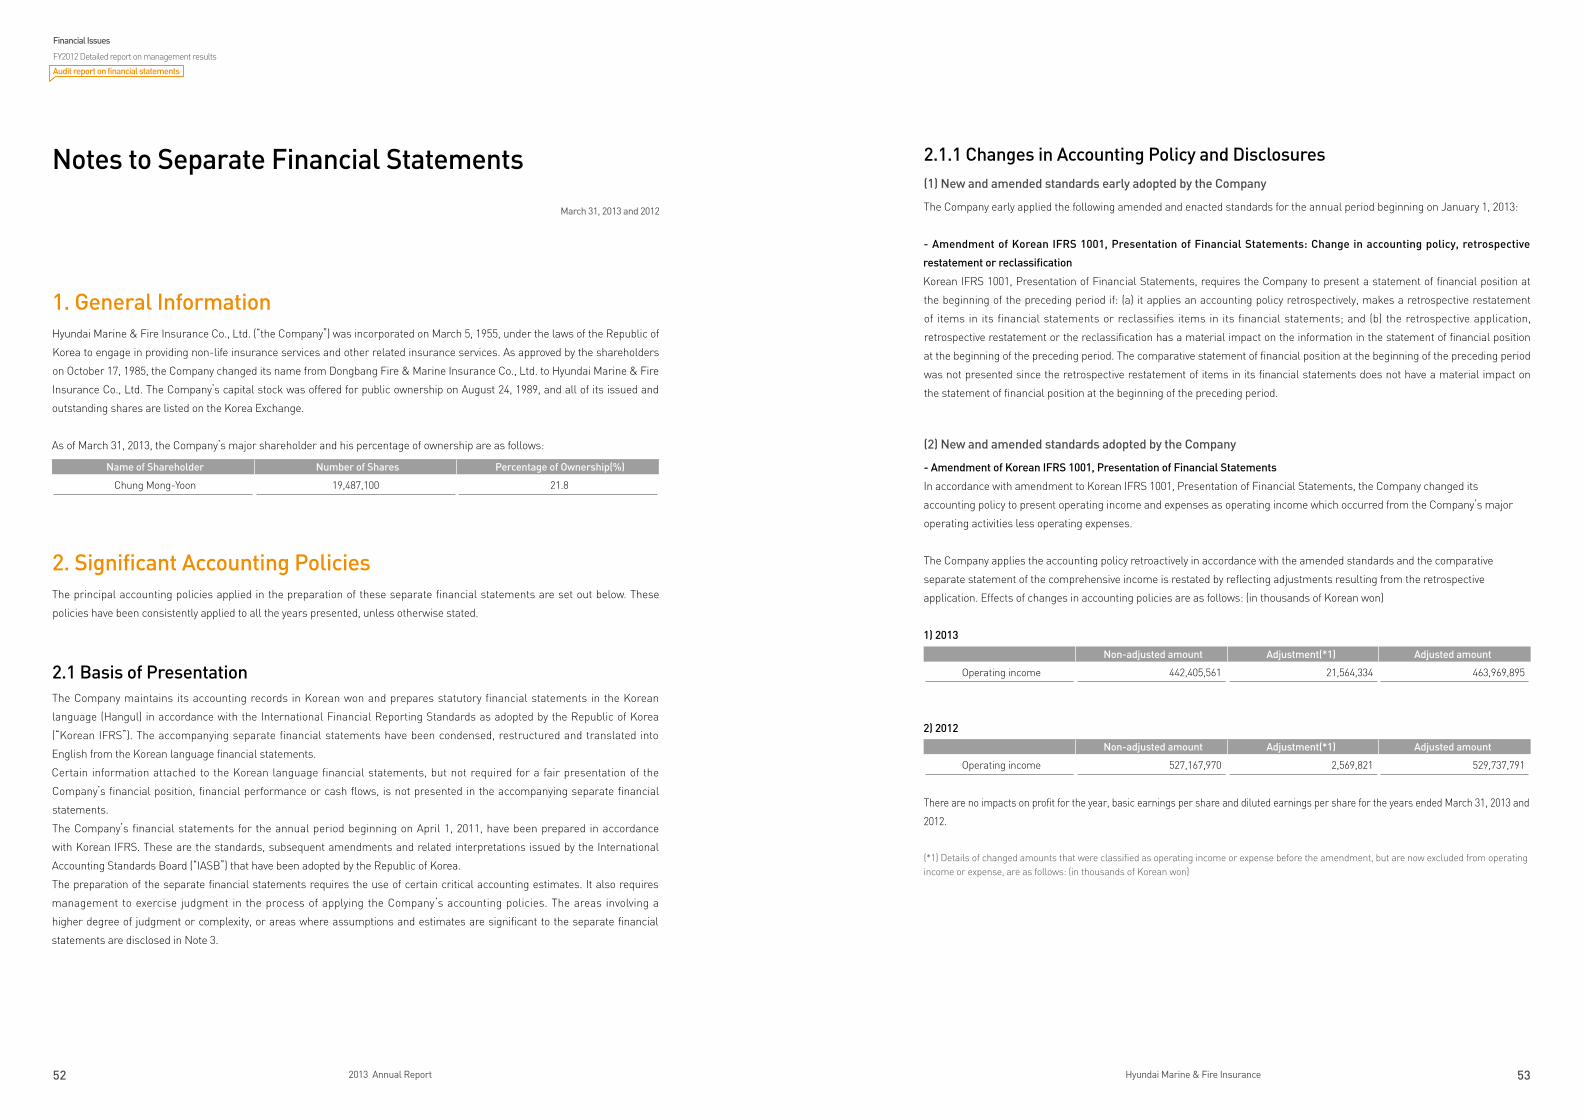
52 2013 Annual Report 53Hyundai Marine & Fire Insurance
Notes to Separate Financial Statements
1. General InformationHyundai Marine & Fire Insurance Co., Ltd. (“the Company”) was incorporated on March 5, 1955, under the laws of the Republic of
Korea to engage in providing non-life insurance services and other related insurance services. As approved by the shareholders
on October 17, 1985, the Company changed its name from Dongbang Fire & Marine Insurance Co., Ltd. to Hyundai Marine & Fire
Insurance Co., Ltd. The Company’s capital stock was offered for public ownership on August 24, 1989, and all of its issued and
outstanding shares are listed on the Korea Exchange.
As of March 31, 2013, the Company’s major shareholder and his percentage of ownership are as follows:
2. Significant Accounting PoliciesThe principal accounting policies applied in the preparation of these separate financial statements are set out below. These
policies have been consistently applied to all the years presented, unless otherwise stated.
2.1 Basis of PresentationThe Company maintains its accounting records in Korean won and prepares statutory financial statements in the Korean
language (Hangul) in accordance with the International Financial Reporting Standards as adopted by the Republic of Korea
(“Korean IFRS”). The accompanying separate financial statements have been condensed, restructured and translated into
English from the Korean language financial statements.
Certain information attached to the Korean language financial statements, but not required for a fair presentation of the
Company’s financial position, financial performance or cash flows, is not presented in the accompanying separate financial
statements.
The Company’s financial statements for the annual period beginning on April 1, 2011, have been prepared in accordance
with Korean IFRS. These are the standards, subsequent amendments and related interpretations issued by the International
Accounting Standards Board (“IASB”) that have been adopted by the Republic of Korea.
The preparation of the separate financial statements requires the use of certain critical accounting estimates. It also requires
management to exercise judgment in the process of applying the Company’s accounting policies. The areas involving a
higher degree of judgment or complexity, or areas where assumptions and estimates are significant to the separate financial
statements are disclosed in Note 3.
2.1.1 Changes in Accounting Policy and Disclosures(1) New and amended standards early adopted by the Company
The Company early applied the following amended and enacted standards for the annual period beginning on January 1, 2013:
- Amendment of Korean IFRS 1001, Presentation of Financial Statements: Change in accounting policy, retrospective
restatement or reclassification
Korean IFRS 1001, Presentation of Financial Statements, requires the Company to present a statement of financial position at
the beginning of the preceding period if: (a) it applies an accounting policy retrospectively, makes a retrospective restatement
of items in its financial statements or reclassifies items in its financial statements; and (b) the retrospective application,
retrospective restatement or the reclassification has a material impact on the information in the statement of financial position
at the beginning of the preceding period. The comparative statement of financial position at the beginning of the preceding period
was not presented since the retrospective restatement of items in its financial statements does not have a material impact on
the statement of financial position at the beginning of the preceding period.
(2) New and amended standards adopted by the Company
- Amendment of Korean IFRS 1001, Presentation of Financial Statements
In accordance with amendment to Korean IFRS 1001, Presentation of Financial Statements, the Company changed its
accounting policy to present operating income and expenses as operating income which occurred from the Company’s major
operating activities less operating expenses.
The Company applies the accounting policy retroactively in accordance with the amended standards and the comparative
separate statement of the comprehensive income is restated by reflecting adjustments resulting from the retrospective
application. Effects of changes in accounting policies are as follows: (in thousands of Korean won)
1) 2013
2) 2012
There are no impacts on profit for the year, basic earnings per share and diluted earnings per share for the years ended March 31, 2013 and
2012.
(*1) Details of changed amounts that were classified as operating income or expense before the amendment, but are now excluded from operating income or expense, are as follows: (in thousands of Korean won)
Name of Shareholder Number of Shares Percentage of Ownership(%)
Chung Mong-Yoon 19,487,100 21.8
March 31, 2013 and 2012
Non-adjusted amount Adjustment(*1) Adjusted amount
Operating income 442,405,561 21,564,334 463,969,895
Non-adjusted amount Adjustment(*1) Adjusted amount
Operating income 527,167,970 2,569,821 529,737,791
Financial Issues
FY2012 Detailed report on management results
Audit report on financial statements
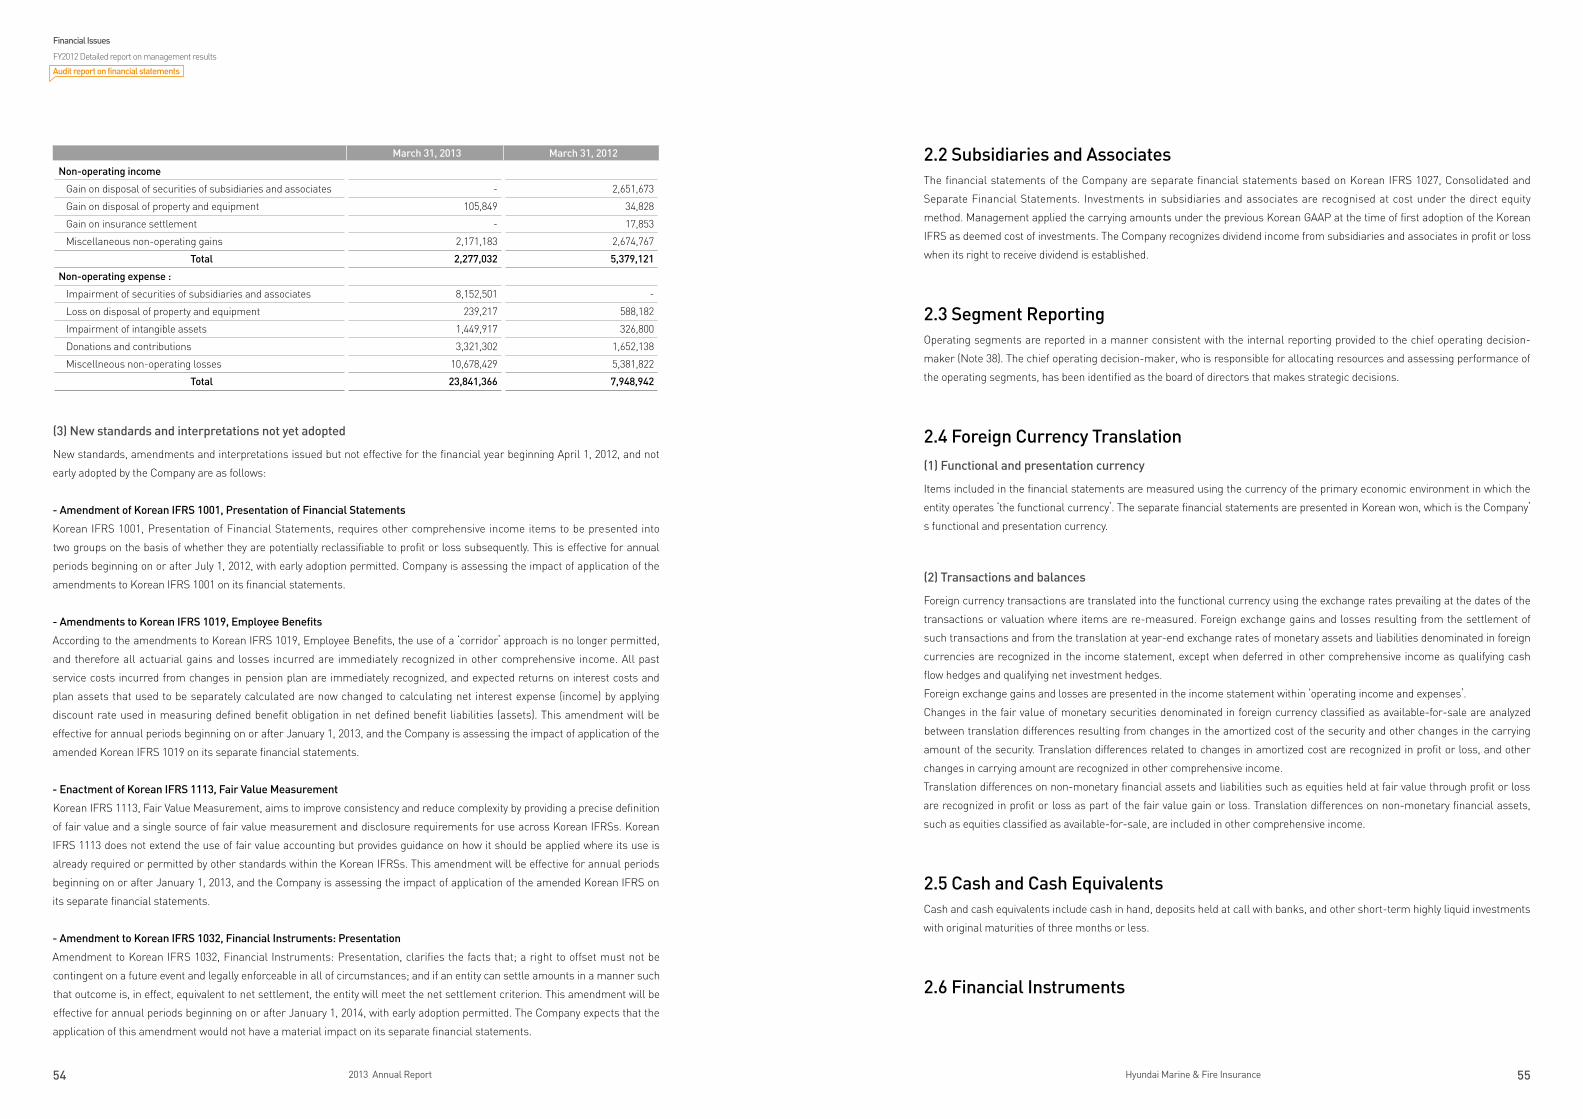
54 2013 Annual Report 55Hyundai Marine & Fire Insurance
(3) New standards and interpretations not yet adopted
New standards, amendments and interpretations issued but not effective for the financial year beginning April 1, 2012, and not
early adopted by the Company are as follows:
- Amendment of Korean IFRS 1001, Presentation of Financial Statements
Korean IFRS 1001, Presentation of Financial Statements, requires other comprehensive income items to be presented into
two groups on the basis of whether they are potentially reclassifiable to profit or loss subsequently. This is effective for annual
periods beginning on or after July 1, 2012, with early adoption permitted. Company is assessing the impact of application of the
amendments to Korean IFRS 1001 on its financial statements.
- Amendments to Korean IFRS 1019, Employee Benefits
According to the amendments to Korean IFRS 1019, Employee Benefits, the use of a ‘corridor’ approach is no longer permitted,
and therefore all actuarial gains and losses incurred are immediately recognized in other comprehensive income. All past
service costs incurred from changes in pension plan are immediately recognized, and expected returns on interest costs and
plan assets that used to be separately calculated are now changed to calculating net interest expense (income) by applying
discount rate used in measuring defined benefit obligation in net defined benefit liabilities (assets). This amendment will be
effective for annual periods beginning on or after January 1, 2013, and the Company is assessing the impact of application of the
amended Korean IFRS 1019 on its separate financial statements.
- Enactment of Korean IFRS 1113, Fair Value Measurement
Korean IFRS 1113, Fair Value Measurement, aims to improve consistency and reduce complexity by providing a precise definition
of fair value and a single source of fair value measurement and disclosure requirements for use across Korean IFRSs. Korean
IFRS 1113 does not extend the use of fair value accounting but provides guidance on how it should be applied where its use is
already required or permitted by other standards within the Korean IFRSs. This amendment will be effective for annual periods
beginning on or after January 1, 2013, and the Company is assessing the impact of application of the amended Korean IFRS on
its separate financial statements.
- Amendment to Korean IFRS 1032, Financial Instruments: Presentation
Amendment to Korean IFRS 1032, Financial Instruments: Presentation, clarifies the facts that; a right to offset must not be
contingent on a future event and legally enforceable in all of circumstances; and if an entity can settle amounts in a manner such
that outcome is, in effect, equivalent to net settlement, the entity will meet the net settlement criterion. This amendment will be
effective for annual periods beginning on or after January 1, 2014, with early adoption permitted. The Company expects that the
application of this amendment would not have a material impact on its separate financial statements.
2.2 Subsidiaries and AssociatesThe financial statements of the Company are separate financial statements based on Korean IFRS 1027, Consolidated and
Separate Financial Statements. Investments in subsidiaries and associates are recognised at cost under the direct equity
method. Management applied the carrying amounts under the previous Korean GAAP at the time of first adoption of the Korean
IFRS as deemed cost of investments. The Company recognizes dividend income from subsidiaries and associates in profit or loss
when its right to receive dividend is established.
2.3 Segment ReportingOperating segments are reported in a manner consistent with the internal reporting provided to the chief operating decision-
maker (Note 38). The chief operating decision-maker, who is responsible for allocating resources and assessing performance of
the operating segments, has been identified as the board of directors that makes strategic decisions.
2.4 Foreign Currency Translation(1) Functional and presentation currency
Items included in the financial statements are measured using the currency of the primary economic environment in which the
entity operates ‘the functional currency’. The separate financial statements are presented in Korean won, which is the Company’
s functional and presentation currency.
(2) Transactions and balances
Foreign currency transactions are translated into the functional currency using the exchange rates prevailing at the dates of the
transactions or valuation where items are re-measured. Foreign exchange gains and losses resulting from the settlement of
such transactions and from the translation at year-end exchange rates of monetary assets and liabilities denominated in foreign
currencies are recognized in the income statement, except when deferred in other comprehensive income as qualifying cash
flow hedges and qualifying net investment hedges.
Foreign exchange gains and losses are presented in the income statement within ‘operating income and expenses’.
Changes in the fair value of monetary securities denominated in foreign currency classified as available-for-sale are analyzed
between translation differences resulting from changes in the amortized cost of the security and other changes in the carrying
amount of the security. Translation differences related to changes in amortized cost are recognized in profit or loss, and other
changes in carrying amount are recognized in other comprehensive income.
Translation differences on non-monetary financial assets and liabilities such as equities held at fair value through profit or loss
are recognized in profit or loss as part of the fair value gain or loss. Translation differences on non-monetary financial assets,
such as equities classified as available-for-sale, are included in other comprehensive income.
2.5 Cash and Cash EquivalentsCash and cash equivalents include cash in hand, deposits held at call with banks, and other short-term highly liquid investments
with original maturities of three months or less.
2.6 Financial Instruments
March 31, 2013 March 31, 2012
Non-operating income
Gain on disposal of securities of subsidiaries and associates - 2,651,673
Gain on disposal of property and equipment 105,849 34,828
Gain on insurance settlement - 17,853
Miscellaneous non-operating gains 2,171,183 2,674,767
Total 2,277,032 5,379,121
Non-operating expense :
Impairment of securities of subsidiaries and associates 8,152,501 -
Loss on disposal of property and equipment 239,217 588,182
Impairment of intangible assets 1,449,917 326,800
Donations and contributions 3,321,302 1,652,138
Miscellneous non-operating losses 10,678,429 5,381,822
Total 23,841,366 7,948,942
Financial Issues
FY2012 Detailed report on management results
Audit report on financial statements
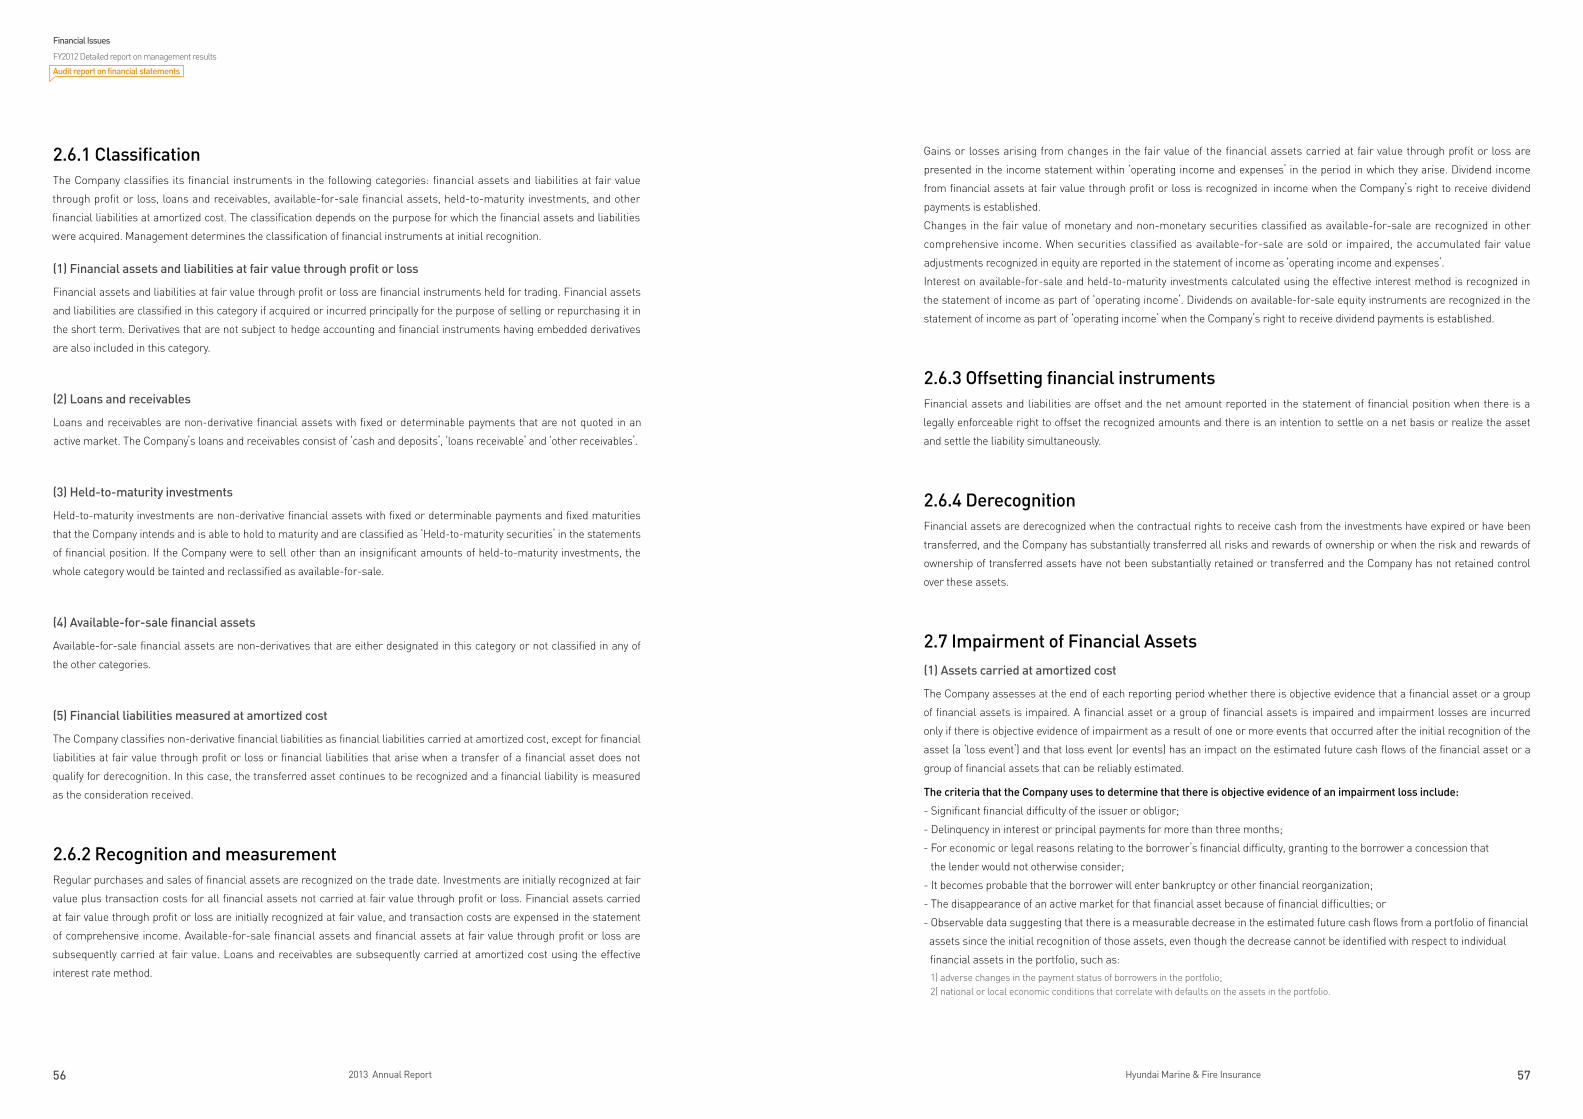
56 2013 Annual Report 57Hyundai Marine & Fire Insurance
2.6.1 ClassificationThe Company classifies its financial instruments in the following categories: financial assets and liabilities at fair value
through profit or loss, loans and receivables, available-for-sale financial assets, held-to-maturity investments, and other
financial liabilities at amortized cost. The classification depends on the purpose for which the financial assets and liabilities
were acquired. Management determines the classification of financial instruments at initial recognition.
(1) Financial assets and liabilities at fair value through profit or loss
Financial assets and liabilities at fair value through profit or loss are financial instruments held for trading. Financial assets
and liabilities are classified in this category if acquired or incurred principally for the purpose of selling or repurchasing it in
the short term. Derivatives that are not subject to hedge accounting and financial instruments having embedded derivatives
are also included in this category.
(2) Loans and receivables
Loans and receivables are non-derivative financial assets with fixed or determinable payments that are not quoted in an
active market. The Company’s loans and receivables consist of ‘cash and deposits’, ‘loans receivable’ and ‘other receivables’.
(3) Held-to-maturity investments
Held-to-maturity investments are non-derivative financial assets with fixed or determinable payments and fixed maturities
that the Company intends and is able to hold to maturity and are classified as ‘Held-to-maturity securities’ in the statements
of financial position. If the Company were to sell other than an insignificant amounts of held-to-maturity investments, the
whole category would be tainted and reclassified as available-for-sale.
(4) Available-for-sale financial assets
Available-for-sale financial assets are non-derivatives that are either designated in this category or not classified in any of
the other categories.
(5) Financial liabilities measured at amortized cost
The Company classifies non-derivative financial liabilities as financial liabilities carried at amortized cost, except for financial
liabilities at fair value through profit or loss or financial liabilities that arise when a transfer of a financial asset does not
qualify for derecognition. In this case, the transferred asset continues to be recognized and a financial liability is measured
as the consideration received.
2.6.2 Recognition and measurementRegular purchases and sales of financial assets are recognized on the trade date. Investments are initially recognized at fair
value plus transaction costs for all financial assets not carried at fair value through profit or loss. Financial assets carried
at fair value through profit or loss are initially recognized at fair value, and transaction costs are expensed in the statement
of comprehensive income. Available-for-sale financial assets and financial assets at fair value through profit or loss are
subsequently carried at fair value. Loans and receivables are subsequently carried at amortized cost using the effective
interest rate method.
Gains or losses arising from changes in the fair value of the financial assets carried at fair value through profit or loss are
presented in the income statement within ‘operating income and expenses’ in the period in which they arise. Dividend income
from financial assets at fair value through profit or loss is recognized in income when the Company’s right to receive dividend
payments is established.
Changes in the fair value of monetary and non-monetary securities classified as available-for-sale are recognized in other
comprehensive income. When securities classified as available-for-sale are sold or impaired, the accumulated fair value
adjustments recognized in equity are reported in the statement of income as ‘operating income and expenses’.
Interest on available-for-sale and held-to-maturity investments calculated using the effective interest method is recognized in
the statement of income as part of ‘operating income’. Dividends on available-for-sale equity instruments are recognized in the
statement of income as part of ‘operating income’ when the Company’s right to receive dividend payments is established.
2.6.3 Offsetting financial instrumentsFinancial assets and liabilities are offset and the net amount reported in the statement of financial position when there is a
legally enforceable right to offset the recognized amounts and there is an intention to settle on a net basis or realize the asset
and settle the liability simultaneously.
2.6.4 DerecognitionFinancial assets are derecognized when the contractual rights to receive cash from the investments have expired or have been
transferred, and the Company has substantially transferred all risks and rewards of ownership or when the risk and rewards of
ownership of transferred assets have not been substantially retained or transferred and the Company has not retained control
over these assets.
2.7 Impairment of Financial Assets(1) Assets carried at amortized cost
The Company assesses at the end of each reporting period whether there is objective evidence that a financial asset or a group
of financial assets is impaired. A financial asset or a group of financial assets is impaired and impairment losses are incurred
only if there is objective evidence of impairment as a result of one or more events that occurred after the initial recognition of the
asset (a ‘loss event’) and that loss event (or events) has an impact on the estimated future cash flows of the financial asset or a
group of financial assets that can be reliably estimated.
The criteria that the Company uses to determine that there is objective evidence of an impairment loss include:
- Significant financial difficulty of the issuer or obligor;
- Delinquency in interest or principal payments for more than three months;
- For economic or legal reasons relating to the borrower’s financial difficulty, granting to the borrower a concession that
the lender would not otherwise consider;
- It becomes probable that the borrower will enter bankruptcy or other financial reorganization;
- The disappearance of an active market for that financial asset because of financial difficulties; or
- Observable data suggesting that there is a measurable decrease in the estimated future cash flows from a portfolio of financial
assets since the initial recognition of those assets, even though the decrease cannot be identified with respect to individual
financial assets in the portfolio, such as:
1) adverse changes in the payment status of borrowers in the portfolio; 2) national or local economic conditions that correlate with defaults on the assets in the portfolio.
Financial Issues
FY2012 Detailed report on management results
Audit report on financial statements
58 2013 Annual Report 59Hyundai Marine & Fire Insurance
Impairment loss is measured as the difference between the assets’ carrying amount and the present value of estimated future
cash flows (excluding future credit losses that have not been incurred) discounted using the initial effective interest rate.
The carrying amount of the asset is reduced by the impairment loss amount and the amount of the loss is recognized in the
statement of comprehensive income. In practice, the Company may measure impairment loss based on the fair value of financial
asset using an observable market price.
If, in a subsequent period, the amount of impairment loss decreases and the decrease can be related objectively to an event
occurring after the impairment was recognized (for example, an improvement in debtor’s credit rating), the reversal of the
previously recognized impairment loss is recognized in the statement of income.
(2) Assets classified as available-for-sale
The Company assesses at the end of each reporting period whether there is objective evidence that a financial asset or a group
of financial assets is impaired. For debt securities, the Company uses the criteria refer to in (a) above. In the case of equity
investments classified as available-for-sale, a significant or prolonged decline in the fair value of the security below its cost, for
example decrease in fair value of the investments by more than 30% from its cost for more than six months, is also evidence
that the asset is impaired. If any such evidence exists for available-for-sale financial assets, the cumulative loss – measured
as the difference between the acquisition cost and the current fair value, less any impairment loss on that financial asset
previously recognized in profit or loss – is removed from equity and recognized in the income statement. Impairment losses
recognized in the separate statement of comprehensive income on equity instruments are not reversed through the statement of
comprehensive income. If, in a subsequent period, the fair value of a debt instrument classified as available-for-sale increases
and the increase can be objectively related to an event occurring after the impairment loss was recognized in profit or loss, the
impairment loss is reversed through the statement of income.
2.8 Derivative Financial Instruments and hedging activitiesDerivatives are initially recognized at fair value on the date a derivative contract is entered into and are subsequently re-
measured at their fair value. The method of recognizing the resulting gain or loss depends on whether the derivative is
designated as a hedging instrument, and if so, the nature of the item being hedged. The resulting gain or loss is recognized in
‘operating income or expenses’.
The Company designates certain derivatives as either:
(1) hedges of the fair value of recognized assets or liabilities or a firm commitment (fair value hedge);
(2) hedges of a particular risk associated with a recognized asset or liability or a highly probable forecast transaction (cash flow
hedge);
The Company documents at the inception of the transaction the relationship between hedging instruments and hedged items,
as well as its risk management objectives and strategy for undertaking various hedging transactions. The Company also
documents its assessment, both at hedge inception and on an ongoing basis, of whether the derivatives that are used in hedging
transactions are highly effective in offsetting changes in fair values or cash flows of hedged items.
The fair values of various derivative instruments used for hedging purposes are disclosed in Note 6. Movements on the hedging
reserve in other comprehensive income are shown in Note 6.
(1) Fair value hedge
Changes in the fair value of derivatives that are designated and qualify as fair value hedges are recorded in the statement of
income, together with any changes in the fair value of the hedged asset or liability that are attributable to the hedged risk. The
gain or loss is recognized in the statement of income within ‘operating income or expenses’.
If the hedge no longer meets the criteria for hedge accounting, the adjustment to the carrying amount of a hedged item for
which the effective interest method is used is amortized to profit or loss over the period to maturity.
(2) Cash flow hedges
The portion of the gain or loss on the hedging instrument that is determined to be an effective hedge is recognized directly in
other comprehensive income and the ineffective portion of the gain or loss on the hedging instrument is recognized in profit
or loss. The associated gains or losses that were previously recognized in other comprehensive income are reclassified from
equity to profit or loss as a reclassification adjustment in the same period or periods during which the hedged forecast cash
flows affects profit or loss. Cash flow hedge accounting is discontinued prospectively if the hedging instrument expires or
sold, terminated or exercised, or the hedge no longer meets the criteria for hedge accounting or the Company revokes the
designation. When the cash flow hedge accounting is discontinued, the cumulative gains or losses on the hedging instrument
that have been recognized in other comprehensive income are reclassified to profit or loss over the period in which the forecast
transaction occurs. If the forecast transaction is no longer expected to occur, the cumulative gains or losses that had been
recognized in other comprehensive income are immediately reclassified to profit or loss.
2.9 Property and EquipmentAll property and equipment are stated at historical cost or deemed cost less accumulated depreciation and accumulated
impairment loss. When the deemed cost is applied, the revaluation amount of property and equipment is considered as fair value
at the date of transition to Korean IFRS and as fair value at the date of the revaluation under the previous standard.
Subsequent costs are included in the asset’s carrying amount or recognized as a separate asset, as appropriate, only when
it is probable that future economic benefits associated with the item will flow to the Company and the cost of the item can be
measured reliably. The carrying amount of the replaced part is derecognized. All other repairs and maintenance are charged to
the statement of comprehensive income during the financial period in which they are incurred.
Land is not depreciated. Depreciation on other assets is calculated using the straight-line method to allocate the difference
between their cost and their residual values over their estimated useful lives, as follows:
The assets’ residual values and useful lives are reviewed, and adjusted if appropriate, at the end of each reporting period. An
asset’s carrying amount is written down immediately to its recoverable amount if the asset’s carrying amount is greater than
its estimated recoverable amount. Gain and losses on disposals are determined by comparing the proceeds with the carrying
amount and are recognized within ‘operating income and expenses’ in the statement of comprehensive income.
2.10 Investment PropertyInvestment property is held to earn rentals or for capital appreciation or both. Investment property also includes property that
is being constructed or developed for future use as investment property. Investment property is measured initially at its cost
including transaction costs incurred in acquiring the asset. After recognition as an asset, investment property is carried at cost
less accumulated depreciation and impairment losses.
Subsequent costs are include in the asset’s carrying amount or recognized as a separate asset, only when it is probable that
future economic benefits associated with the item will flow to the Company and the cost of the item can be measured reliably.
The carrying amount of the replaced part is derecognized. All other repairs and maintenance are charged to the statement of
comprehensive income during the financial period in which they are incurred.
Description Estimated useful life
Buildings 26 - 52 years
Overseas real estate 31 years
Vehicles 5 years
Furniture and fixtures 5 years
Financial Issues
FY2012 Detailed report on management results
Audit report on financial statements
60 2013 Annual Report 61Hyundai Marine & Fire Insurance
Land held for investment is not depreciated. Investment property, except for land, is depreciated using straight-line method over
their useful lives from 26 to 52 years.
The depreciation method, the residual value and the useful life of an asset are reviewed at the end of each financial year and,
if management judges that previous estimates should be adjusted, the change is accounted for as a change in an accounting
estimate.
Gains and losses on disposals are determined by comparing the proceeds with the carrying amount and are recognized within
‘operating income and expenses’ in the statement of comprehensive income.
The fair value of investment property disclosed in Note 10 reflects market conditions at the end of the reporting period, with
adjustment that reflects specific asset’s characteristics, condition and location. The book value for financial reporting purpose is
determined based on the evaluation of the investment property by an independent valuer, who holds a recognized and relevant
professional qualification and has recent experience in the location and category of the investment property being valued.
2.11 Intangible Assets(1) Computer software
Costs associated with maintaining computer software programs are recognized as an expense as incurred. Development costs
that are directly attributable to the design and testing of identifiable and unique software products controlled by the Company are
recognized as intangible assets when the following criteria are met:
- it is technically feasible to complete the software product so that it will be available for use;
- management intends to complete the software product and use or sell it;
- there is an ability to use or sell the software product;
- it can be demonstrated how the software product will generate probable future economic benefits; adequate technical,
financial and other resources to complete the development and to use or sell the software product are available; and
- the expenditure attributable to the software product during its development can be reliably measured.
Directly attributable costs that are capitalized as part of the software product include the software development employee costs
and an appropriate portion of relevant overheads.
Other development expenditures that do not meet these criteria are recognized as an expense as incurred. Development costs
previously recognized as an expense are not recognized as an asset in a subsequent period.
Computer software development costs recognized as assets are amortized over their estimated useful lives, which does not
exceed five years.
(2) Membership rights
Membership rights are regarded as intangible assets with indefinite useful life and not amortized because there is no
foreseeable limit to the period over which the asset is expected be utilized.
(3) Other intangible assets
Separately acquired trademarks and licenses are shown at historical cost. Trademarks and licenses have a finite useful life and
are carried at cost less accumulated amortization. Amortization is calculated using the straight-line method to allocate the cost
of trademarks and licenses over their estimated useful lives of five years.
2.12 Impairment of Non-financial AssetsIntangible assets with indefinite useful lives are not subject to amortization and are tested annually for impairment. Assets that
are subject to amortization are reviewed for impairment whenever events or changes in circumstances indicate that the carrying
amount may not be recoverable. An impairment loss is recognized for the amount by which the asset’s carrying amount exceeds
its recoverable amount. The recoverable amount is the higher of an asset’s fair value less costs to sell and value in use. For
the purposes of assessing impairment, assets are grouped at the lowest levels for which there are separately identifiable cash
flows (cash-generating units). Non-financial assets, other than goodwill, that suffered an impairment are reviewed for possible
reversal of the impairment at each reporting date.
2.13 LeaseLeases of property, plant and equipment where the Company has substantially all the risks and rewards of ownership are
classified as finance leases. Finance leases are capitalized at the lease’s commencement at the lower of the fair value of the
leased property and the present value of the minimum lease payments.
Each lease payment is allocated between the liability and finance charges. The corresponding rental obligations, net of finance
charges, are included in ‘borrowings’. The interest element of the finance cost is charged to the income statement over the lease
period so as to produce a constant periodic rate of interest on the remaining balance of the liability for each period. The property,
plant and equipment acquired under finance leases is depreciated over the shorter of the useful life of the asset and the lease
term.
Leases in which a significant portion of the risks and rewards of ownership are retained by the lessor are classified as operating
leases. Payments made under operating leases (net of any incentives received from the lessor are charged to the statement of
comprehensive income on a straight-line basis over the period of the lease.
2.14 Deferred Acquisition CostIn accordance with Article 31 of Accounting Standards for Insurance Industry and the Article 6-3 of Regulations on Supervision
of Insurance Business (“RSIB”), initial costs arising from long-term insurance contracts sold, excluding any excess amount over
estimated acquisition costs, are deferred and amortized over the term of contracts or seven years, whichever is shorter. For
cancellations, any unamortized portion is written off immediately.
2.15 Classification of Insurance and Investment ContractThe Company classifies a contract under which one party (the insurer) accepts significant insurance risk from another party
(the policyholder) by agreeing to compensate the policyholder if a specified uncertain future event (the insured event) adversely
affects the policyholder as an insurance contract until all rights and obligations are extinguished or expire. After classifying
contract by quantitative basis, Korean IFRS 1104, Insurance Contracts, is applied to insurance contract and financial instruments
that it issues with a discretionary participation feature and Korean IFRS 1039, Financial Instruments : Recognition and
Measurement, is applied to financial instruments that it issues without a discretionary participation feature.
Financial Issues
FY2012 Detailed report on management results
Audit report on financial statements
62 2013 Annual Report 63Hyundai Marine & Fire Insurance
2.16 Insurance LiabilitiesIn accordance with Recognitions on Supervision of Insurance Business (“RSIB”), the Company is required to maintain insurance
liabilities at an amount determined as follows:
(1) Premium Reserves
Premium reserves represent the difference between the present value of claims payable to policyholders and the present value
of net premiums to be collected after the end of reporting period for long-term insurance contracts in effect as of the end of
reporting period.
(2) Reserves for Outstanding Claims
Reserves for outstanding claims represent estimated claims payable for accidents covered by insurance which occurred befor
the end of reporting period and for which the amount of claims payable is not yet determined. The expenses incurred in the
course of settlement of insured events, such as lawsuits, are added to and the claims to be reimbursed through sale of pledged
assets or exercise of reimbursement rights, which are obtained in the course of settlement of the insured event, are deducted
from the reserves.
(3) Unearned Premium Reserves
Unearned premium reserves represent premiums due, but whose recognition is deferred.
(4) Policyholders’ Dividend Reserves
Policyholders’ dividend reserves represent amounts payable to policyholders due to mortality gains, interest gains and expense
gains.
(5) Policyholders’ Profit Dividend Reserves
Pursuant to relevant laws and contracts, the Company may establish policyholders’ profit dividend reserves in accordance with
the operating results of related insurance products. The reserve may be used to pay the participating policyholder dividend or
additional dividend.
2.17 Liability Adequacy TestThe Company assesses at the end of each reporting period whether its recognized insurance liabilities are adequate, using
current estimates of future cash flows under its insurance contracts. The test considers current estimates of all contractual
cash flows, and of related cash flows such as claims handling costs, as well as cash flows resulting from embedded options
and guarantees. If that assessment shows that the carrying amount of its insurance liabilities is inadequate in the light of the
estimated future cash flows, the entire deficiency shall be recognized in profit or loss.
2.18 Claim Adjustment ExpensesClaims and loss adjustment expenses are charged to income as incurred based on the estimated liability for compensation owed
to contract holders or third parties damaged by the contract holders. They include direct and indirect claims settlement costs
and arise from events that have occurred up to the end of the reporting period even if they have not yet been reported to the
Company.
2.19 Compensation ReceivablesCompensation receivables represent recoverable claims arising from accidents. These claims are deducted from insurance
reserves. Compensation receivables are calculated by multiplying the average recovery ratio (recovery amount/net claims) for
the last three years from the prior year’s reporting period date to the amount of net claims for the last year in accordance with
RSIB.
2.20 Reinsurance ContractAccording to Korean IFRS 1104, Insurance Contracts, as a policyholder of reinsurance contracts, the Company shall not offset
reinsurance assets against the related insurance liabilities and income or expense from reinsurance contracts against the
expense or income from the related insurance contracts.
The Company considers whether its reinsurance assets are impaired and if reinsurance assets are impaired, the Company
reduces its carrying amount and recognizes that impairment loss in profit or loss.
2.21 Contingency ReservesNon-life insurance companies reserve a portion of net premium written by line of insurance as contingency reserves, up to
40–50% of the current year earned premiums. These reserves can be used against exceptionally large claims in the future.
2.22 Regulatory Reserve for Credit LossesThe RSIB requires the Company to appropriate, as a legal reserve, an amount for allowance for doubtful accounts which should
be established according to the regulation. The reserve is not available for the payment of cash dividends.
2.23 Special Account Assets and LiabilitiesIn accordance with Article No. 108 of the Insurance Business Law and Article No. 52 of its implementing ordinance, all assets
and liabilities related to retirement benefit insurance are managed and accounted for separately. According to RSIB, the
Company has changed the presentation of special account assets (liabilities). Due from (to) special account has been presented
as a deduction from special liabilities (assets).
2.24 ProvisionsProvisions are recognized when: the Company has a present legal or constructive obligation as a result of past events; it is
probable that an outflow of resources will be required to settle the obligation; and the amount has been reliably estimated.
Provisions are not recognized for future operating losses.
Provisions are measured at the present value of the expenditures expected to be required to settle the obligation using a pre-tax
rate that reflects current market assessments of the time value of money and the risks specific to the obligation. The increase in
the provision due to passage of time is recognized as interest expense.
The Company maintains for the corporate pension policies from general accounts in accordance with RSIB.
Financial Issues
FY2012 Detailed report on management results
Audit report on financial statements
64 2013 Annual Report 65Hyundai Marine & Fire Insurance
2.25 Current and Deferred Income TaxThe tax expense for the period comprises current and deferred tax. Tax is recognized in the statement of comprehensive income,
except to the extent that it relates to items recognized in other comprehensive income or directly in equity. In this case, the tax is
also recognized in other comprehensive income or directly in equity.
Deferred income tax is recognized, using the liability method, on temporary differences arising between the tax bases of assets
and liabilities and their carrying amounts in the separate financial statements. However, deferred tax assets and liabilities are
not recognized if they arise from initial recognition of an asset or liability in a transaction other than a business combination that
at the time of the transaction affects neither accounting nor taxable profit or loss. Deferred income tax is determined using tax
rates and laws that have been enacted or substantially enacted by the statement of financial position date and are expected to
apply when the related deferred income tax asset is realized or the deferred income tax liability is settled.
Deferred income tax assets are recognized only to the extent that it is probable that future taxable profit will be available against
which the temporary differences can be utilized.
Deferred income tax is provided on temporary differences arising on investments in subsidiaries and associates, except for
deferred income tax liability where the timing of the reversal of the temporary difference is controlled by the Company and it is
probable that the temporary difference will not reverse in the foreseeable future.
Deferred income tax assets and liabilities are offset when there is a legally enforceable right to offset current tax assets against
current tax liabilities and when the deferred income taxes assets and liabilities relate to income taxes levied by the same taxation
authority on either the same taxable entity or different taxable entities where there is an intention to settle the balances on a net
basis.
2.26 Employee Benefits (1) Defined benefit liability
The Company operates pension schemes. The schemes are generally funded through payments to insurance companies or
trustee-administered funds, determined by periodic actuarial calculations. The Company has defined benefit plans.
A defined benefit plan is a pension plan that is not a defined contribution plan. Typically defined benefit plans define an amount
of pension benefit that an employee will receive on retirement, usually dependent on one or more factors such as age, years of
service and compensation. The liability recognized in the statement of financial position in respect of defined benefit pension
plans is the present value of the defined benefit obligation at the end of the reporting period less the fair value of plan assets,
together with adjustments for unrecognized past-service costs. The defined benefit obligation is calculated annually by
independent actuaries using the projected unit credit method. The present value of the defined benefit obligation is determined
by discounting the estimated future cash outflows using interest rates of high-quality corporate bonds that are denominated in
the currency in which the benefits will be paid, and that have terms to maturity approximating to the terms of the related pension
obligation.
Actuarial gains and losses arising from experience adjustments and changes in actuarial assumptions are recognized in profit or
loss in the period in which they arise. Past-service costs are recognized immediately in income, while costs are amortized over
the vesting period.
(2) Long-term employee benefits
The Company provides long-term employee benefits, which are entitled to employees with service period for ten years and
above. The expected costs of these benefits are accrued over the period of employment using the same accounting methodology
as used for defined benefit pension plans.
Actuarial gains and losses arising from experience adjustments and changes in actuarial assumptions are recognized in profit
or loss in the period in which they arise. These obligations are valued annually by independent qualified actuaries.
2.27 Share CapitalWhere the Company purchases its own equity share capital (treasury shares), the consideration paid, including any directly
attributable incremental costs is deducted from equity attributable to the Company’s equity holders until the shares are
cancelled or reissued. Where such ordinary shares are subsequently reissued, any consideration received is included in equity
attributable to the Company’s equity holders.
2.28 Revenue RecognitionThe Company recognizes premium income at the due date. However, the revenues from the automobile insurance and long-
term and annuities contracts are recognized at the time of receipt.
2.29 Interest incomeInterest income is recognized using the effective interest method according to the time passed. When a loan and receivable is
impaired, the Company reduces the carrying amount to its recoverable amount and continues unwinding the discount as interest
income. Interest income on impaired loan and receivables is recognized using the original effective interest rate.
2.30 Dividend incomeDividend income is recognized when the right to receive payment is established.
2.31 Dividend DistributionDividend distribution to the Company’s shareholders is recognized as a liability in the financial statements in the period in which
the dividends are approved by the Company’s shareholders.
2.32 Approval of Issuance of the Financial StatementsThe issuance of the March 31, 2013 separate financial statements of the Company was approved by the Board of Directors on
May 15, 2013.
Financial Issues
FY2012 Detailed report on management results
Audit report on financial statements
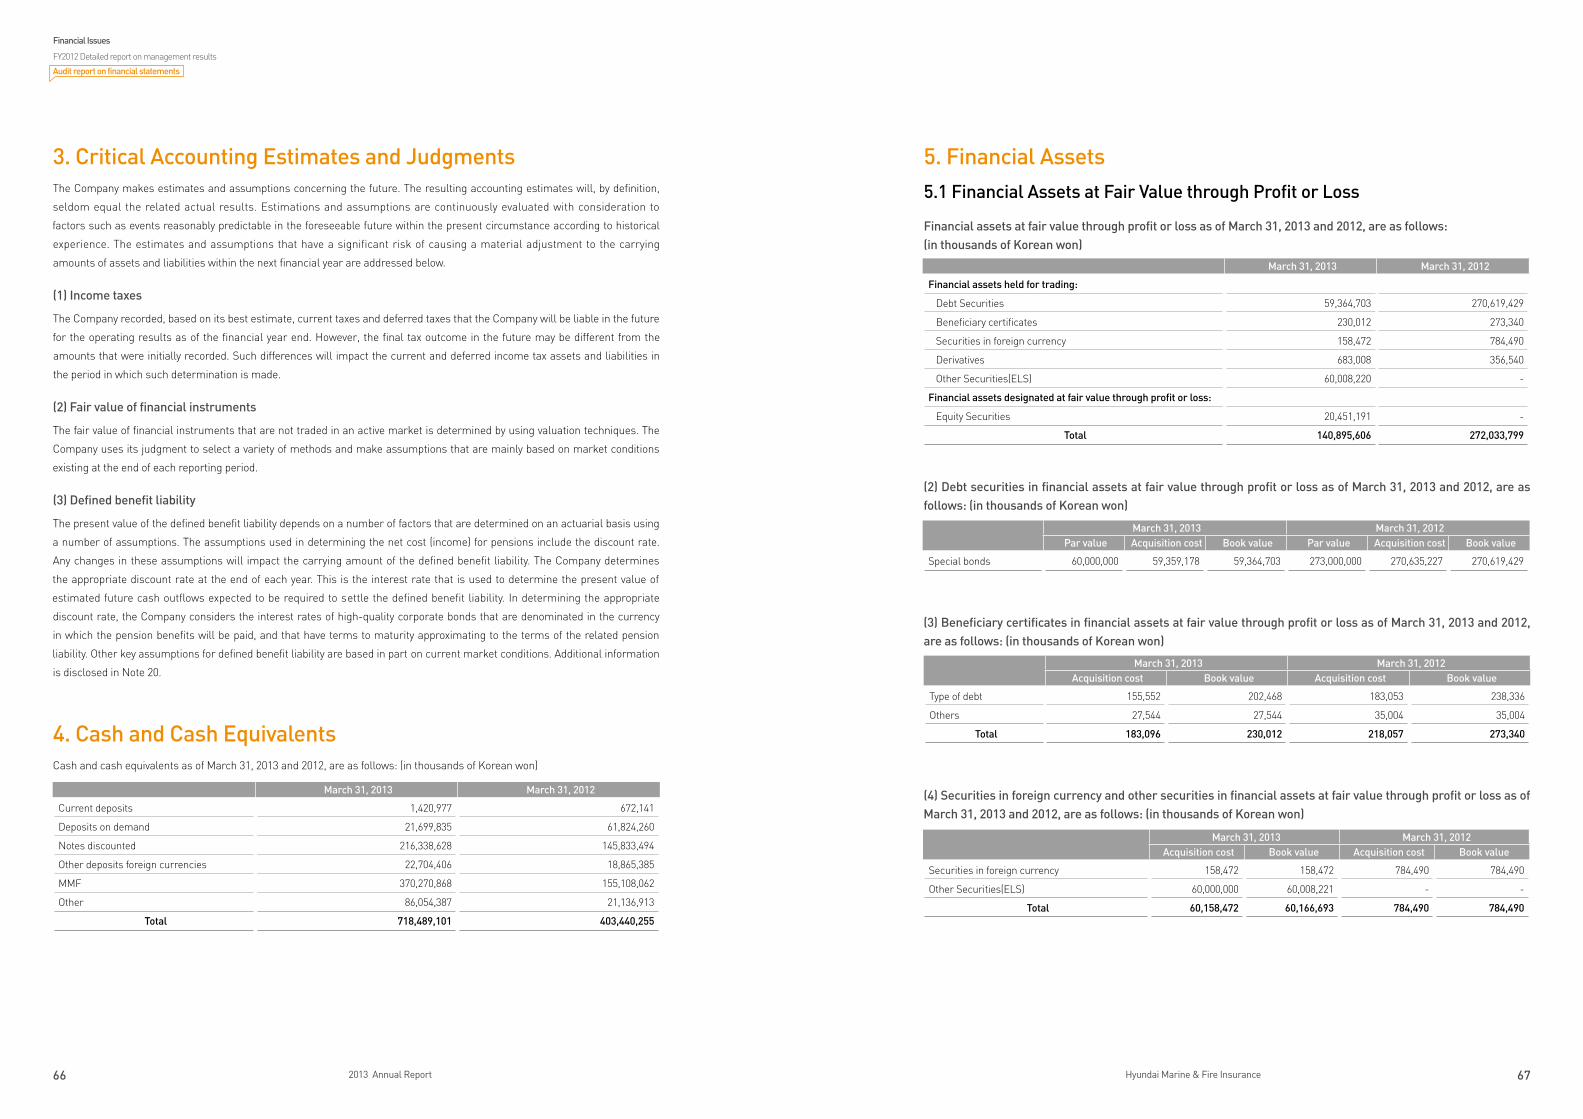
66 2013 Annual Report 67Hyundai Marine & Fire Insurance
5. Financial Assets5.1 Financial Assets at Fair Value through Profit or Loss
Financial assets at fair value through profit or loss as of March 31, 2013 and 2012, are as follows:(in thousands of Korean won)
(2) Debt securities in financial assets at fair value through profit or loss as of March 31, 2013 and 2012, are as follows: (in thousands of Korean won)
(3) Beneficiary certificates in financial assets at fair value through profit or loss as of March 31, 2013 and 2012, are as follows: (in thousands of Korean won)
(4) Securities in foreign currency and other securities in financial assets at fair value through profit or loss as of March 31, 2013 and 2012, are as follows: (in thousands of Korean won)
March 31, 2013 March 31, 2012Acquisition cost Book value Acquisition cost Book value
Type of debt 155,552 202,468 183,053 238,336
Others 27,544 27,544 35,004 35,004
Total 183,096 230,012 218,057 273,340
March 31, 2013 March 31, 2012Acquisition cost Book value Acquisition cost Book value
Securities in foreign currency 158,472 158,472 784,490 784,490
Other Securities(ELS) 60,000,000 60,008,221 - -
Total 60,158,472 60,166,693 784,490 784,490
3. Critical Accounting Estimates and JudgmentsThe Company makes estimates and assumptions concerning the future. The resulting accounting estimates will, by definition,
seldom equal the related actual results. Estimations and assumptions are continuously evaluated with consideration to
factors such as events reasonably predictable in the foreseeable future within the present circumstance according to historical
experience. The estimates and assumptions that have a significant risk of causing a material adjustment to the carrying
amounts of assets and liabilities within the next financial year are addressed below.
(1) Income taxes
The Company recorded, based on its best estimate, current taxes and deferred taxes that the Company will be liable in the future
for the operating results as of the financial year end. However, the final tax outcome in the future may be different from the
amounts that were initially recorded. Such differences will impact the current and deferred income tax assets and liabilities in
the period in which such determination is made.
(2) Fair value of financial instruments
The fair value of financial instruments that are not traded in an active market is determined by using valuation techniques. The
Company uses its judgment to select a variety of methods and make assumptions that are mainly based on market conditions
existing at the end of each reporting period.
(3) Defined benefit liability
The present value of the defined benefit liability depends on a number of factors that are determined on an actuarial basis using
a number of assumptions. The assumptions used in determining the net cost (income) for pensions include the discount rate.
Any changes in these assumptions will impact the carrying amount of the defined benefit liability. The Company determines
the appropriate discount rate at the end of each year. This is the interest rate that is used to determine the present value of
estimated future cash outflows expected to be required to settle the defined benefit liability. In determining the appropriate
discount rate, the Company considers the interest rates of high-quality corporate bonds that are denominated in the currency
in which the pension benefits will be paid, and that have terms to maturity approximating to the terms of the related pension
liability. Other key assumptions for defined benefit liability are based in part on current market conditions. Additional information
is disclosed in Note 20.
4. Cash and Cash EquivalentsCash and cash equivalents as of March 31, 2013 and 2012, are as follows: (in thousands of Korean won)
March 31, 2013 March 31, 2012
Financial assets held for trading:
Debt Securities 59,364,703 270,619,429
Beneficiary certificates 230,012 273,340
Securities in foreign currency 158,472 784,490
Derivatives 683,008 356,540
Other Securities(ELS) 60,008,220 -
Financial assets designated at fair value through profit or loss:
Equity Securities 20,451,191 -
Total 140,895,606 272,033,799
March 31, 2013 March 31, 2012Par value Acquisition cost Book value Par value Acquisition cost Book value
Special bonds 60,000,000 59,359,178 59,364,703 273,000,000 270,635,227 270,619,429
March 31, 2013 March 31, 2012
Current deposits 1,420,977 672,141
Deposits on demand 21,699,835 61,824,260
Notes discounted 216,338,628 145,833,494
Other deposits foreign currencies 22,704,406 18,865,385
MMF 370,270,868 155,108,062
Other 86,054,387 21,136,913
Total 718,489,101 403,440,255
Financial Issues
FY2012 Detailed report on management results
Audit report on financial statements
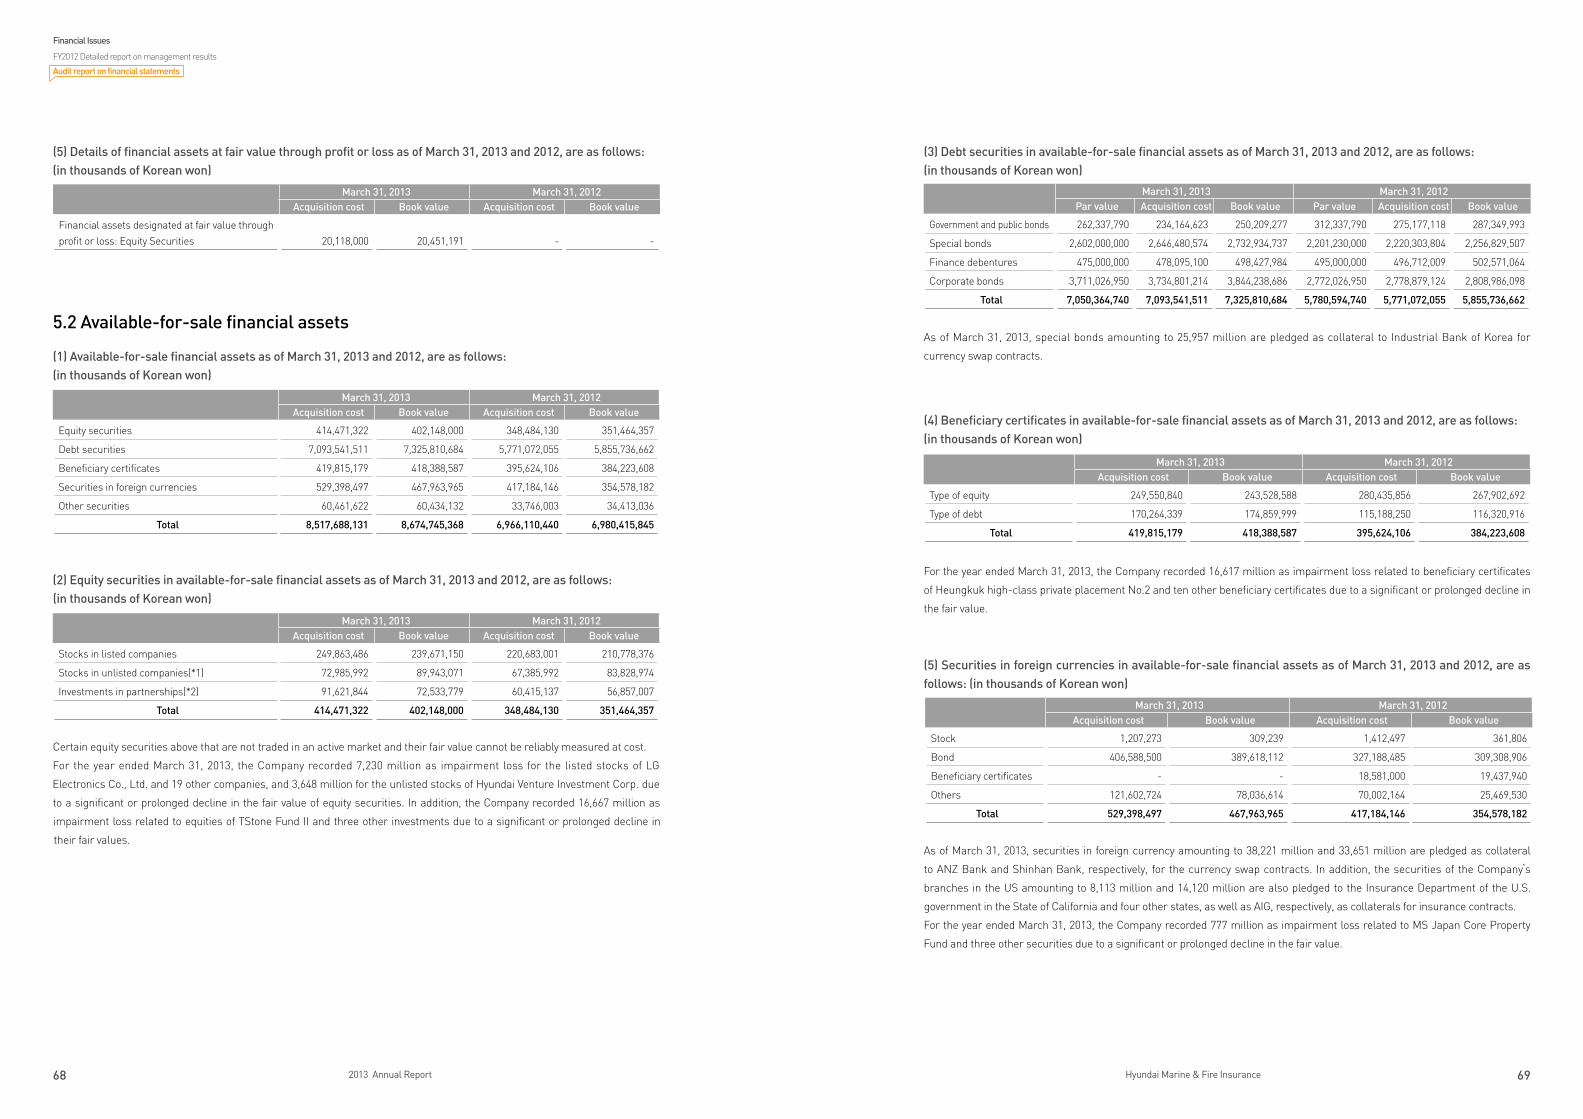
68 2013 Annual Report 69Hyundai Marine & Fire Insurance
(5) Details of financial assets at fair value through profit or loss as of March 31, 2013 and 2012, are as follows:(in thousands of Korean won)
5.2 Available-for-sale financial assets
(1) Available-for-sale financial assets as of March 31, 2013 and 2012, are as follows: (in thousands of Korean won)
(2) Equity securities in available-for-sale financial assets as of March 31, 2013 and 2012, are as follows:(in thousands of Korean won)
Certain equity securities above that are not traded in an active market and their fair value cannot be reliably measured at cost.
For the year ended March 31, 2013, the Company recorded 7,230 million as impairment loss for the listed stocks of LG
Electronics Co., Ltd. and 19 other companies, and 3,648 million for the unlisted stocks of Hyundai Venture Investment Corp. due
to a significant or prolonged decline in the fair value of equity securities. In addition, the Company recorded 16,667 million as
impairment loss related to equities of TStone Fund II and three other investments due to a significant or prolonged decline in
their fair values.
(3) Debt securities in available-for-sale financial assets as of March 31, 2013 and 2012, are as follows:(in thousands of Korean won)
As of March 31, 2013, special bonds amounting to 25,957 million are pledged as collateral to Industrial Bank of Korea for
currency swap contracts.
(4) Beneficiary certificates in available-for-sale financial assets as of March 31, 2013 and 2012, are as follows:(in thousands of Korean won)
For the year ended March 31, 2013, the Company recorded 16,617 million as impairment loss related to beneficiary certificates
of Heungkuk high-class private placement No.2 and ten other beneficiary certificates due to a significant or prolonged decline in
the fair value.
(5) Securities in foreign currencies in available-for-sale financial assets as of March 31, 2013 and 2012, are as follows: (in thousands of Korean won)
As of March 31, 2013, securities in foreign currency amounting to 38,221 million and 33,651 million are pledged as collateral
to ANZ Bank and Shinhan Bank, respectively, for the currency swap contracts. In addition, the securities of the Company’s
branches in the US amounting to 8,113 million and 14,120 million are also pledged to the Insurance Department of the U.S.
government in the State of California and four other states, as well as AIG, respectively, as collaterals for insurance contracts.
For the year ended March 31, 2013, the Company recorded 777 million as impairment loss related to MS Japan Core Property
Fund and three other securities due to a significant or prolonged decline in the fair value.
March 31, 2013 March 31, 2012Acquisition cost Book value Acquisition cost Book value
Financial assets designated at fair value through profit or loss: Equity Securities 20,118,000 20,451,191 - -
March 31, 2013 March 31, 2012Acquisition cost Book value Acquisition cost Book value
Equity securities 414,471,322 402,148,000 348,484,130 351,464,357
Debt securities 7,093,541,511 7,325,810,684 5,771,072,055 5,855,736,662
Beneficiary certificates 419,815,179 418,388,587 395,624,106 384,223,608
Securities in foreign currencies 529,398,497 467,963,965 417,184,146 354,578,182
Other securities 60,461,622 60,434,132 33,746,003 34,413,036
Total 8,517,688,131 8,674,745,368 6,966,110,440 6,980,415,845
March 31, 2013 March 31, 2012Acquisition cost Book value Acquisition cost Book value
Stocks in listed companies 249,863,486 239,671,150 220,683,001 210,778,376
Stocks in unlisted companies(*1) 72,985,992 89,943,071 67,385,992 83,828,974
Investments in partnerships(*2) 91,621,844 72,533,779 60,415,137 56,857,007
Total 414,471,322 402,148,000 348,484,130 351,464,357
March 31, 2013 March 31, 2012Par value Acquisition cost Book value Par value Acquisition cost Book value
Government and public bonds 262,337,790 234,164,623 250,209,277 312,337,790 275,177,118 287,349,993
Special bonds 2,602,000,000 2,646,480,574 2,732,934,737 2,201,230,000 2,220,303,804 2,256,829,507
Finance debentures 475,000,000 478,095,100 498,427,984 495,000,000 496,712,009 502,571,064
Corporate bonds 3,711,026,950 3,734,801,214 3,844,238,686 2,772,026,950 2,778,879,124 2,808,986,098
Total 7,050,364,740 7,093,541,511 7,325,810,684 5,780,594,740 5,771,072,055 5,855,736,662
March 31, 2013 March 31, 2012Acquisition cost Book value Acquisition cost Book value
Type of equity 249,550,840 243,528,588 280,435,856 267,902,692
Type of debt 170,264,339 174,859,999 115,188,250 116,320,916
Total 419,815,179 418,388,587 395,624,106 384,223,608
March 31, 2013 March 31, 2012Acquisition cost Book value Acquisition cost Book value
Stock 1,207,273 309,239 1,412,497 361,806
Bond 406,588,500 389,618,112 327,188,485 309,308,906
Beneficiary certificates - - 18,581,000 19,437,940
Others 121,602,724 78,036,614 70,002,164 25,469,530
Total 529,398,497 467,963,965 417,184,146 354,578,182
Financial Issues
FY2012 Detailed report on management results
Audit report on financial statements
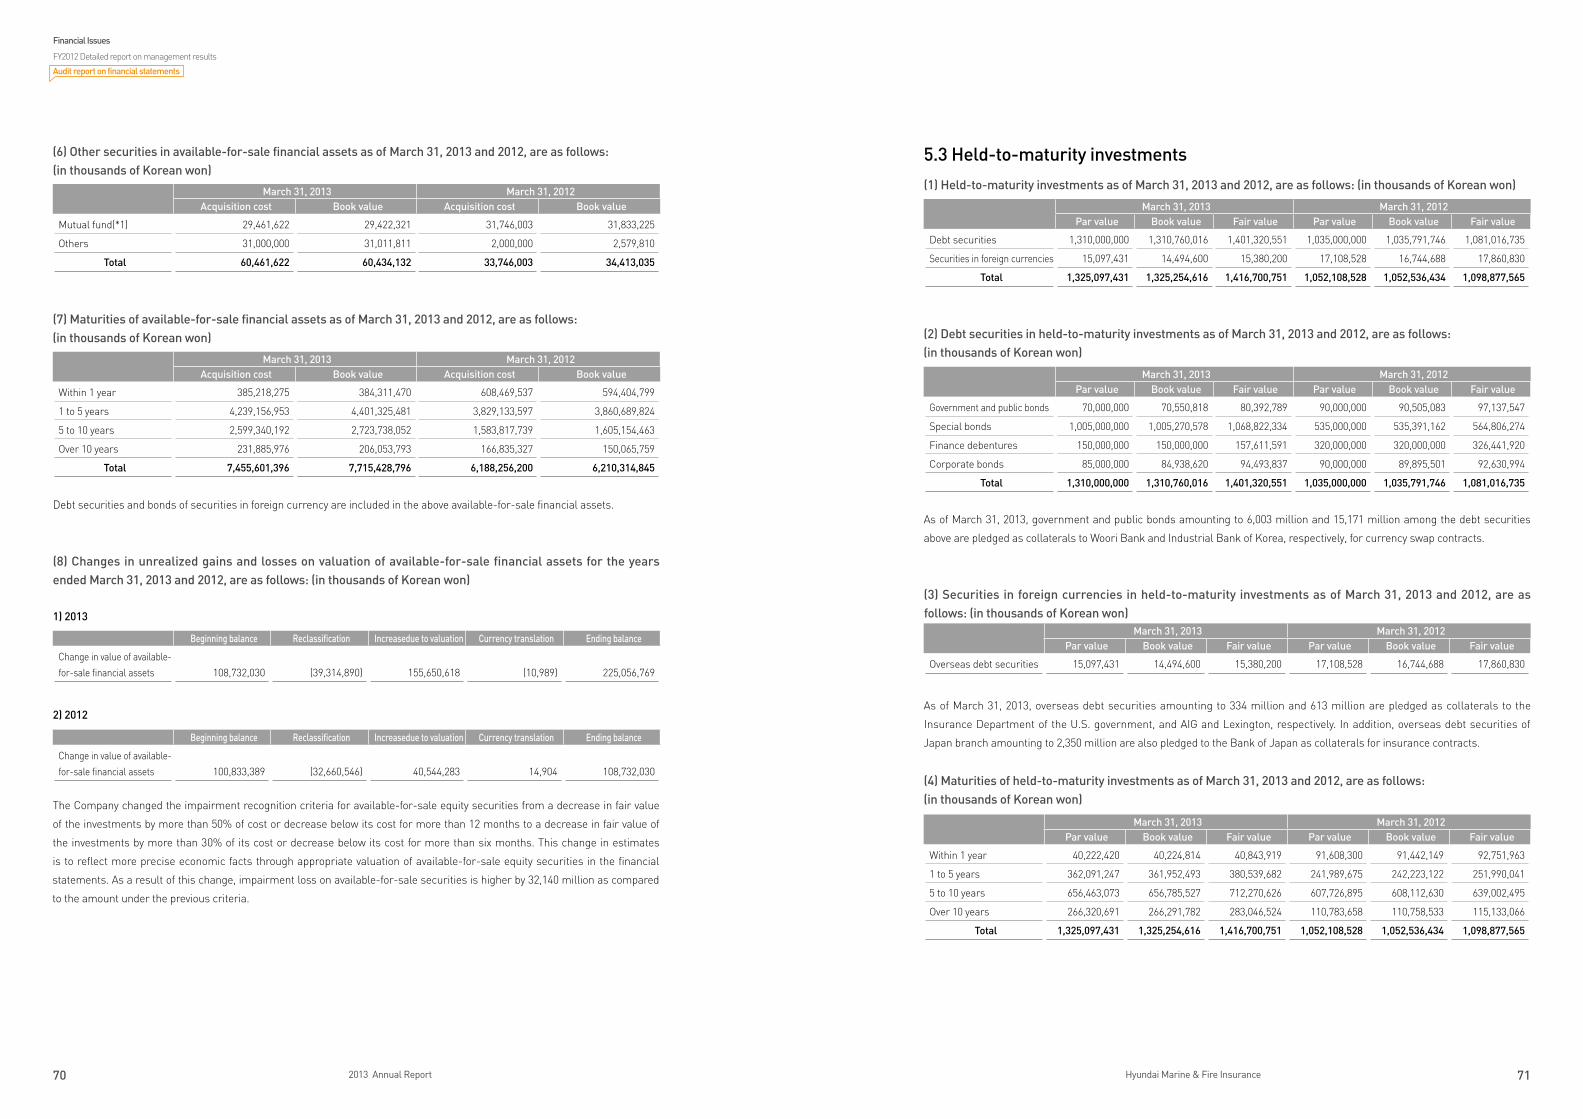
70 2013 Annual Report 71Hyundai Marine & Fire Insurance
5.3 Held-to-maturity investments
(1) Held-to-maturity investments as of March 31, 2013 and 2012, are as follows: (in thousands of Korean won)
(2) Debt securities in held-to-maturity investments as of March 31, 2013 and 2012, are as follows:(in thousands of Korean won)
As of March 31, 2013, government and public bonds amounting to 6,003 million and 15,171 million among the debt securities
above are pledged as collaterals to Woori Bank and Industrial Bank of Korea, respectively, for currency swap contracts.
(3) Securities in foreign currencies in held-to-maturity investments as of March 31, 2013 and 2012, are as follows: (in thousands of Korean won)
As of March 31, 2013, overseas debt securities amounting to 334 million and 613 million are pledged as collaterals to the
Insurance Department of the U.S. government, and AIG and Lexington, respectively. In addition, overseas debt securities of
Japan branch amounting to 2,350 million are also pledged to the Bank of Japan as collaterals for insurance contracts.
(4) Maturities of held-to-maturity investments as of March 31, 2013 and 2012, are as follows: (in thousands of Korean won)
(6) Other securities in available-for-sale financial assets as of March 31, 2013 and 2012, are as follows:(in thousands of Korean won)
(7) Maturities of available-for-sale financial assets as of March 31, 2013 and 2012, are as follows:(in thousands of Korean won)
Debt securities and bonds of securities in foreign currency are included in the above available-for-sale financial assets.
(8) Changes in unrealized gains and losses on valuation of available-for-sale financial assets for the years ended March 31, 2013 and 2012, are as follows: (in thousands of Korean won)
1) 2013
2) 2012
The Company changed the impairment recognition criteria for available-for-sale equity securities from a decrease in fair value
of the investments by more than 50% of cost or decrease below its cost for more than 12 months to a decrease in fair value of
the investments by more than 30% of its cost or decrease below its cost for more than six months. This change in estimates
is to reflect more precise economic facts through appropriate valuation of available-for-sale equity securities in the financial
statements. As a result of this change, impairment loss on available-for-sale securities is higher by 32,140 million as compared
to the amount under the previous criteria.
March 31, 2013 March 31, 2012Acquisition cost Book value Acquisition cost Book value
Mutual fund(*1) 29,461,622 29,422,321 31,746,003 31,833,225
Others 31,000,000 31,011,811 2,000,000 2,579,810
Total 60,461,622 60,434,132 33,746,003 34,413,035
March 31, 2013 March 31, 2012Acquisition cost Book value Acquisition cost Book value
Within 1 year 385,218,275 384,311,470 608,469,537 594,404,799
1 to 5 years 4,239,156,953 4,401,325,481 3,829,133,597 3,860,689,824
5 to 10 years 2,599,340,192 2,723,738,052 1,583,817,739 1,605,154,463
Over 10 years 231,885,976 206,053,793 166,835,327 150,065,759
Total 7,455,601,396 7,715,428,796 6,188,256,200 6,210,314,845
Beginning balance Reclassification Increasedue to valuation Currency translation Ending balance
Change in value of available-for-sale financial assets 108,732,030 (39,314,890) 155,650,618 (10,989) 225,056,769
Beginning balance Reclassification Increasedue to valuation Currency translation Ending balance
Change in value of available-for-sale financial assets 100,833,389 (32,660,546) 40,544,283 14,904 108,732,030
March 31, 2013 March 31, 2012Par value Book value Fair value Par value Book value Fair value
Debt securities 1,310,000,000 1,310,760,016 1,401,320,551 1,035,000,000 1,035,791,746 1,081,016,735
Securities in foreign currencies 15,097,431 14,494,600 15,380,200 17,108,528 16,744,688 17,860,830
Total 1,325,097,431 1,325,254,616 1,416,700,751 1,052,108,528 1,052,536,434 1,098,877,565
March 31, 2013 March 31, 2012Par value Book value Fair value Par value Book value Fair value
Government and public bonds 70,000,000 70,550,818 80,392,789 90,000,000 90,505,083 97,137,547
Special bonds 1,005,000,000 1,005,270,578 1,068,822,334 535,000,000 535,391,162 564,806,274
Finance debentures 150,000,000 150,000,000 157,611,591 320,000,000 320,000,000 326,441,920
Corporate bonds 85,000,000 84,938,620 94,493,837 90,000,000 89,895,501 92,630,994
Total 1,310,000,000 1,310,760,016 1,401,320,551 1,035,000,000 1,035,791,746 1,081,016,735
March 31, 2013 March 31, 2012Par value Book value Fair value Par value Book value Fair value
Overseas debt securities 15,097,431 14,494,600 15,380,200 17,108,528 16,744,688 17,860,830
March 31, 2013 March 31, 2012Par value Book value Fair value Par value Book value Fair value
Within 1 year 40,222,420 40,224,814 40,843,919 91,608,300 91,442,149 92,751,963
1 to 5 years 362,091,247 361,952,493 380,539,682 241,989,675 242,223,122 251,990,041
5 to 10 years 656,463,073 656,785,527 712,270,626 607,726,895 608,112,630 639,002,495
Over 10 years 266,320,691 266,291,782 283,046,524 110,783,658 110,758,533 115,133,066
Total 1,325,097,431 1,325,254,616 1,416,700,751 1,052,108,528 1,052,536,434 1,098,877,565
Financial Issues
FY2012 Detailed report on management results
Audit report on financial statements
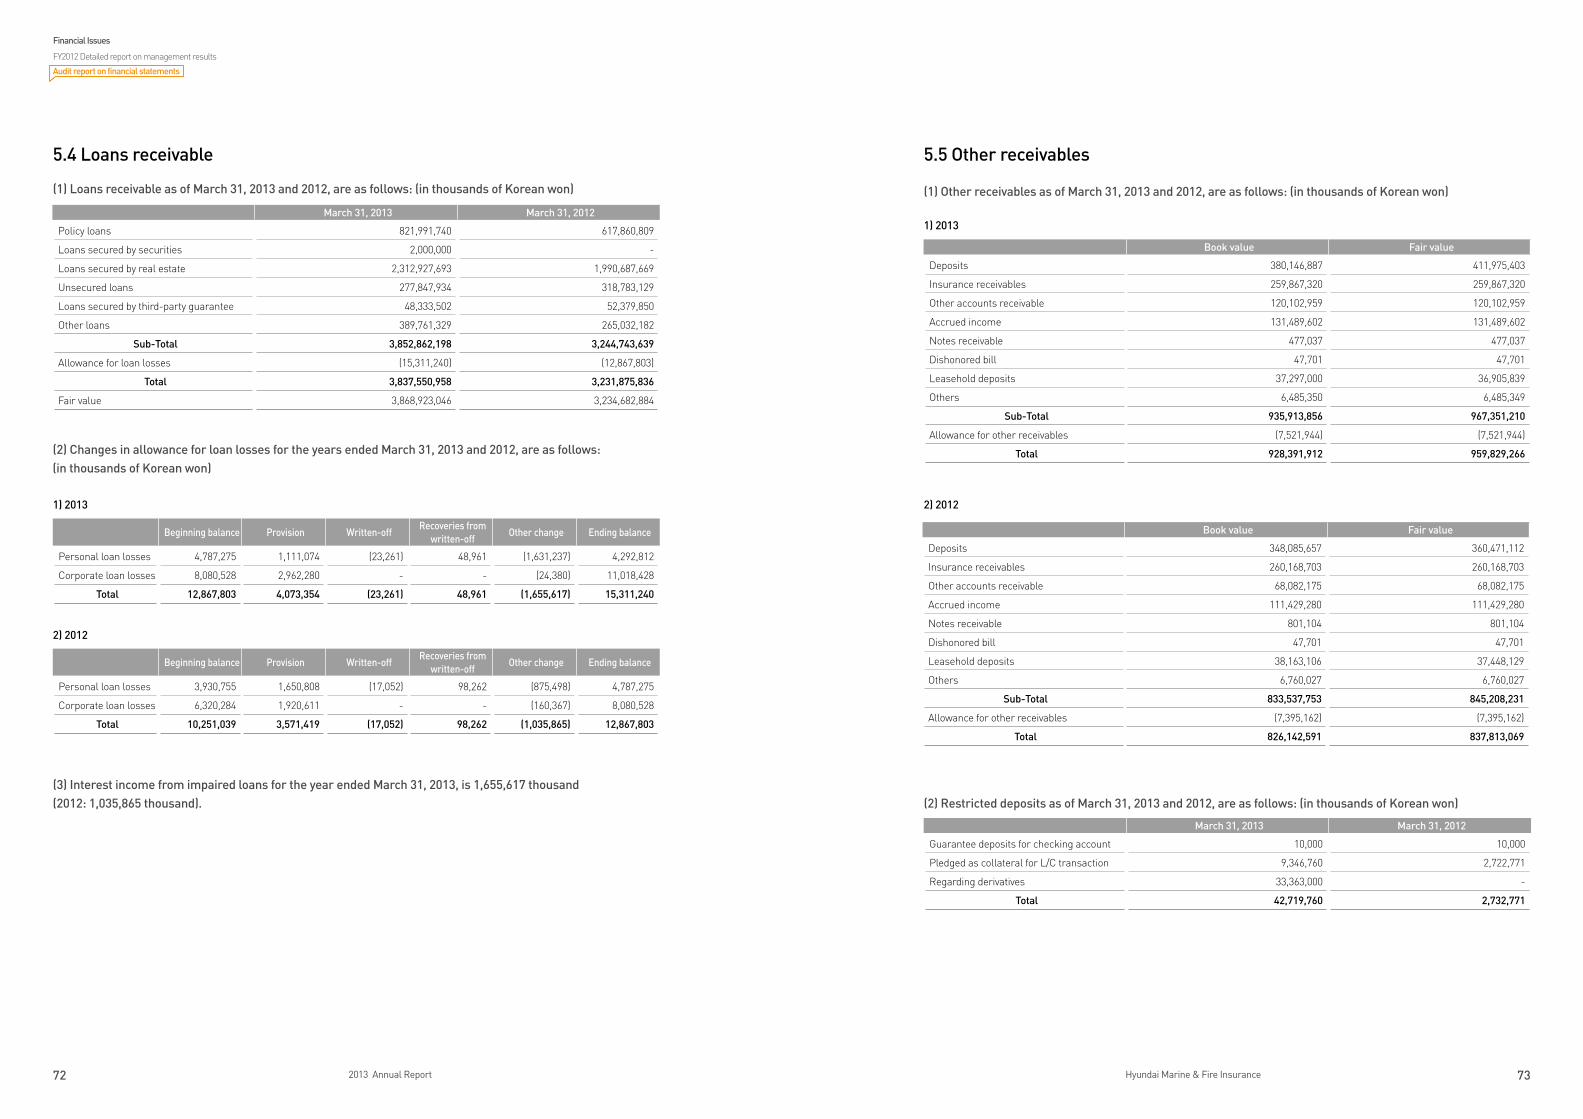
72 2013 Annual Report 73Hyundai Marine & Fire Insurance
5.4 Loans receivable
(1) Loans receivable as of March 31, 2013 and 2012, are as follows: (in thousands of Korean won)
(2) Changes in allowance for loan losses for the years ended March 31, 2013 and 2012, are as follows:(in thousands of Korean won)
1) 2013
2) 2012
(3) Interest income from impaired loans for the year ended March 31, 2013, is 1,655,617 thousand (2012: 1,035,865 thousand).
5.5 Other receivables
(1) Other receivables as of March 31, 2013 and 2012, are as follows: (in thousands of Korean won)
1) 2013
2) 2012
(2) Restricted deposits as of March 31, 2013 and 2012, are as follows: (in thousands of Korean won)
March 31, 2013 March 31, 2012
Policy loans 821,991,740 617,860,809
Loans secured by securities 2,000,000 -
Loans secured by real estate 2,312,927,693 1,990,687,669
Unsecured loans 277,847,934 318,783,129
Loans secured by third-party guarantee 48,333,502 52,379,850
Other loans 389,761,329 265,032,182
Sub-Total 3,852,862,198 3,244,743,639
Allowance for loan losses (15,311,240) (12,867,803)
Total 3,837,550,958 3,231,875,836
Fair value 3,868,923,046 3,234,682,884
Beginning balance Provision Written-offRecoveries from
written-offOther change Ending balance
Personal loan losses 4,787,275 1,111,074 (23,261) 48,961 (1,631,237) 4,292,812
Corporate loan losses 8,080,528 2,962,280 - - (24,380) 11,018,428
Total 12,867,803 4,073,354 (23,261) 48,961 (1,655,617) 15,311,240
Beginning balance Provision Written-offRecoveries from
written-offOther change Ending balance
Personal loan losses 3,930,755 1,650,808 (17,052) 98,262 (875,498) 4,787,275
Corporate loan losses 6,320,284 1,920,611 - - (160,367) 8,080,528
Total 10,251,039 3,571,419 (17,052) 98,262 (1,035,865) 12,867,803
Book value Fair value
Deposits 348,085,657 360,471,112
Insurance receivables 260,168,703 260,168,703
Other accounts receivable 68,082,175 68,082,175
Accrued income 111,429,280 111,429,280
Notes receivable 801,104 801,104
Dishonored bill 47,701 47,701
Leasehold deposits 38,163,106 37,448,129
Others 6,760,027 6,760,027
Sub-Total 833,537,753 845,208,231
Allowance for other receivables (7,395,162) (7,395,162)
Total 826,142,591 837,813,069
Book value Fair value
Deposits 380,146,887 411,975,403
Insurance receivables 259,867,320 259,867,320
Other accounts receivable 120,102,959 120,102,959
Accrued income 131,489,602 131,489,602
Notes receivable 477,037 477,037
Dishonored bill 47,701 47,701
Leasehold deposits 37,297,000 36,905,839
Others 6,485,350 6,485,349
Sub-Total 935,913,856 967,351,210
Allowance for other receivables (7,521,944) (7,521,944)
Total 928,391,912 959,829,266
March 31, 2013 March 31, 2012
Guarantee deposits for checking account 10,000 10,000
Pledged as collateral for L/C transaction 9,346,760 2,722,771
Regarding derivatives 33,363,000 -
Total 42,719,760 2,732,771
Financial Issues
FY2012 Detailed report on management results
Audit report on financial statements
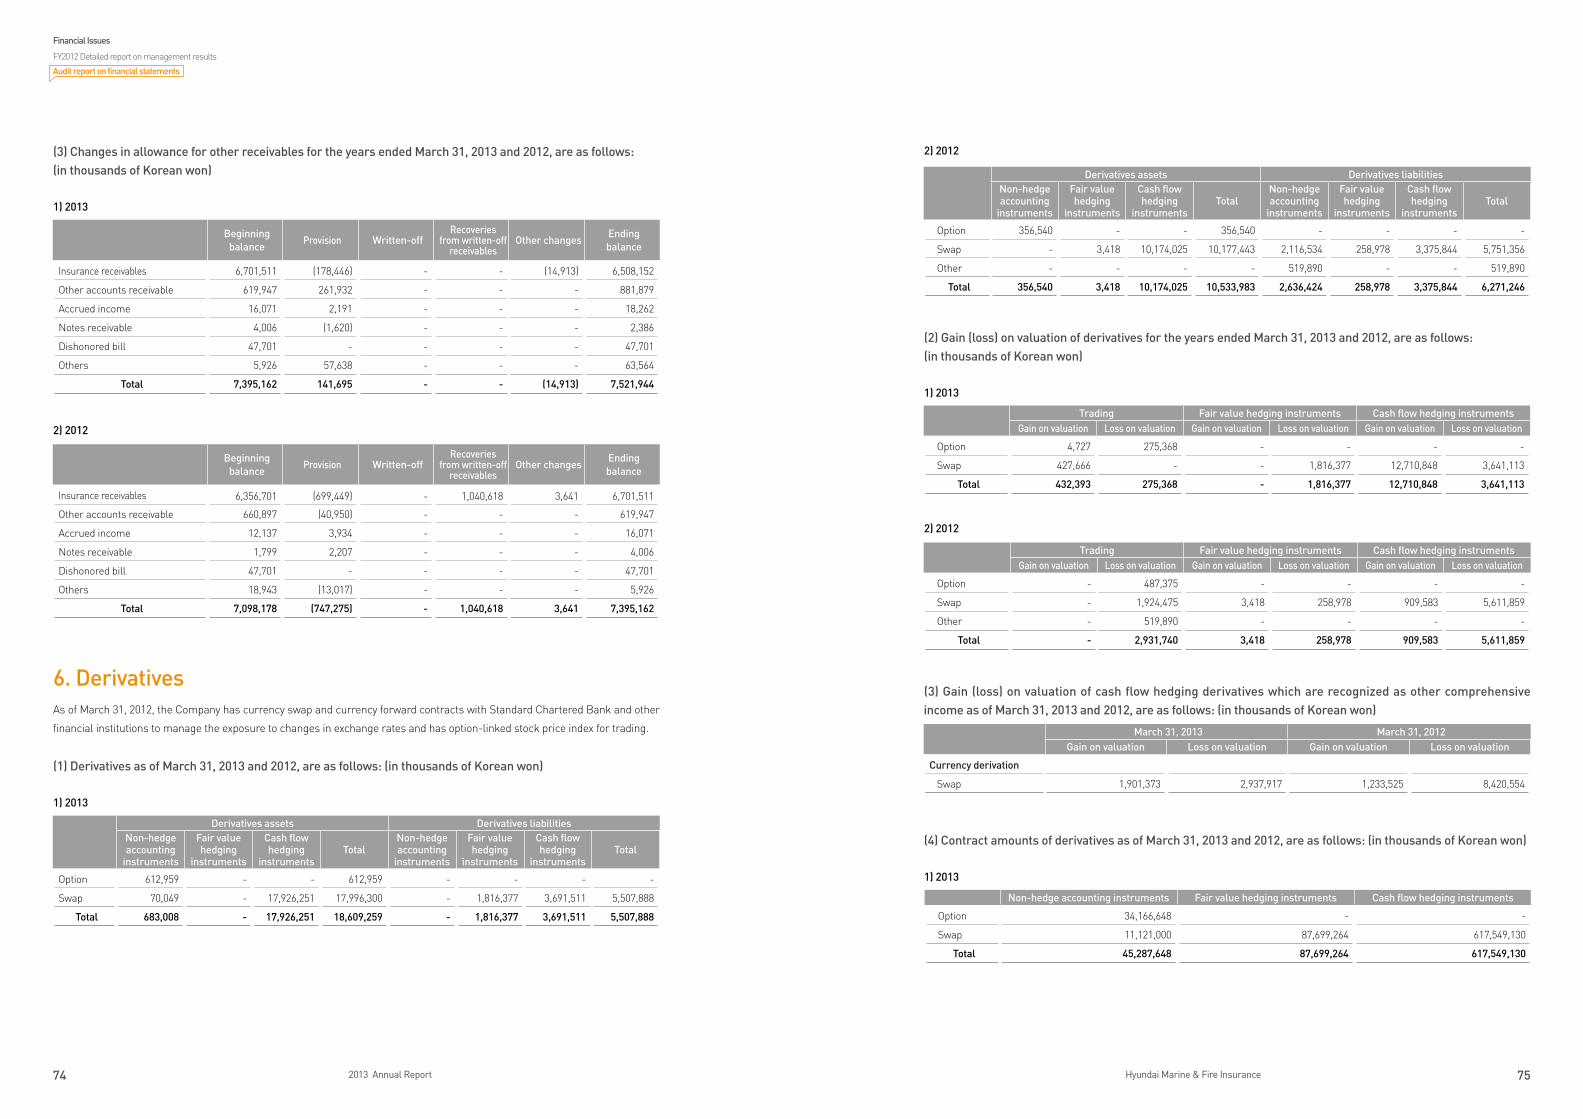
74 2013 Annual Report 75Hyundai Marine & Fire Insurance
(3) Changes in allowance for other receivables for the years ended March 31, 2013 and 2012, are as follows:(in thousands of Korean won)
1) 2013
2) 2012
6. DerivativesAs of March 31, 2012, the Company has currency swap and currency forward contracts with Standard Chartered Bank and other
financial institutions to manage the exposure to changes in exchange rates and has option-linked stock price index for trading.
(1) Derivatives as of March 31, 2013 and 2012, are as follows: (in thousands of Korean won)
1) 2013
2) 2012
(2) Gain (loss) on valuation of derivatives for the years ended March 31, 2013 and 2012, are as follows:(in thousands of Korean won)
1) 2013
2) 2012
(3) Gain (loss) on valuation of cash flow hedging derivatives which are recognized as other comprehensive income as of March 31, 2013 and 2012, are as follows: (in thousands of Korean won)
(4) Contract amounts of derivatives as of March 31, 2013 and 2012, are as follows: (in thousands of Korean won)
1) 2013
Beginning balance
Provision Written-offRecoveries
from written-off receivables
Other changesEnding balance
Insurance receivables 6,701,511 (178,446) - - (14,913) 6,508,152
Other accounts receivable 619,947 261,932 - - - 881,879
Accrued income 16,071 2,191 - - - 18,262
Notes receivable 4,006 (1,620) - - - 2,386
Dishonored bill 47,701 - - - - 47,701
Others 5,926 57,638 - - - 63,564
Total 7,395,162 141,695 - - (14,913) 7,521,944
Beginning balance
Provision Written-offRecoveries
from written-off receivables
Other changesEnding balance
Insurance receivables 6,356,701 (699,449) - 1,040,618 3,641 6,701,511
Other accounts receivable 660,897 (40,950) - - - 619,947
Accrued income 12,137 3,934 - - - 16,071
Notes receivable 1,799 2,207 - - - 4,006
Dishonored bill 47,701 - - - - 47,701
Others 18,943 (13,017) - - - 5,926
Total 7,098,178 (747,275) - 1,040,618 3,641 7,395,162
Derivatives assets Derivatives liabilitiesNon-hedge accounting
instruments
Fair value hedging
instruments
Cash flow hedging
instrumentsTotal
Non-hedge accounting
instruments
Fair value hedging
instruments
Cash flow hedging
instrumentsTotal
Option 612,959 - - 612,959 - - - -
Swap 70,049 - 17,926,251 17,996,300 - 1,816,377 3,691,511 5,507,888
Total 683,008 - 17,926,251 18,609,259 - 1,816,377 3,691,511 5,507,888
Trading Fair value hedging instruments Cash flow hedging instrumentsGain on valuation Loss on valuation Gain on valuation Loss on valuation Gain on valuation Loss on valuation
Option - 487,375 - - - -
Swap - 1,924,475 3,418 258,978 909,583 5,611,859
Other - 519,890 - - - -
Total - 2,931,740 3,418 258,978 909,583 5,611,859
March 31, 2013 March 31, 2012Gain on valuation Loss on valuation Gain on valuation Loss on valuation
Currency derivation
Swap 1,901,373 2,937,917 1,233,525 8,420,554
Derivatives assets Derivatives liabilitiesNon-hedge accounting
instruments
Fair value hedging
instruments
Cash flow hedging
instrumentsTotal
Non-hedge accounting
instruments
Fair value hedging
instruments
Cash flow hedging
instrumentsTotal
Option 356,540 - - 356,540 - - - -
Swap - 3,418 10,174,025 10,177,443 2,116,534 258,978 3,375,844 5,751,356
Other - - - - 519,890 - - 519,890
Total 356,540 3,418 10,174,025 10,533,983 2,636,424 258,978 3,375,844 6,271,246
Trading Fair value hedging instruments Cash flow hedging instrumentsGain on valuation Loss on valuation Gain on valuation Loss on valuation Gain on valuation Loss on valuation
Option 4,727 275,368 - - - -
Swap 427,666 - - 1,816,377 12,710,848 3,641,113
Total 432,393 275,368 - 1,816,377 12,710,848 3,641,113
Non-hedge accounting instruments Fair value hedging instruments Cash flow hedging instruments
Option 34,166,648 - -
Swap 11,121,000 87,699,264 617,549,130
Total 45,287,648 87,699,264 617,549,130
Financial Issues
FY2012 Detailed report on management results
Audit report on financial statements
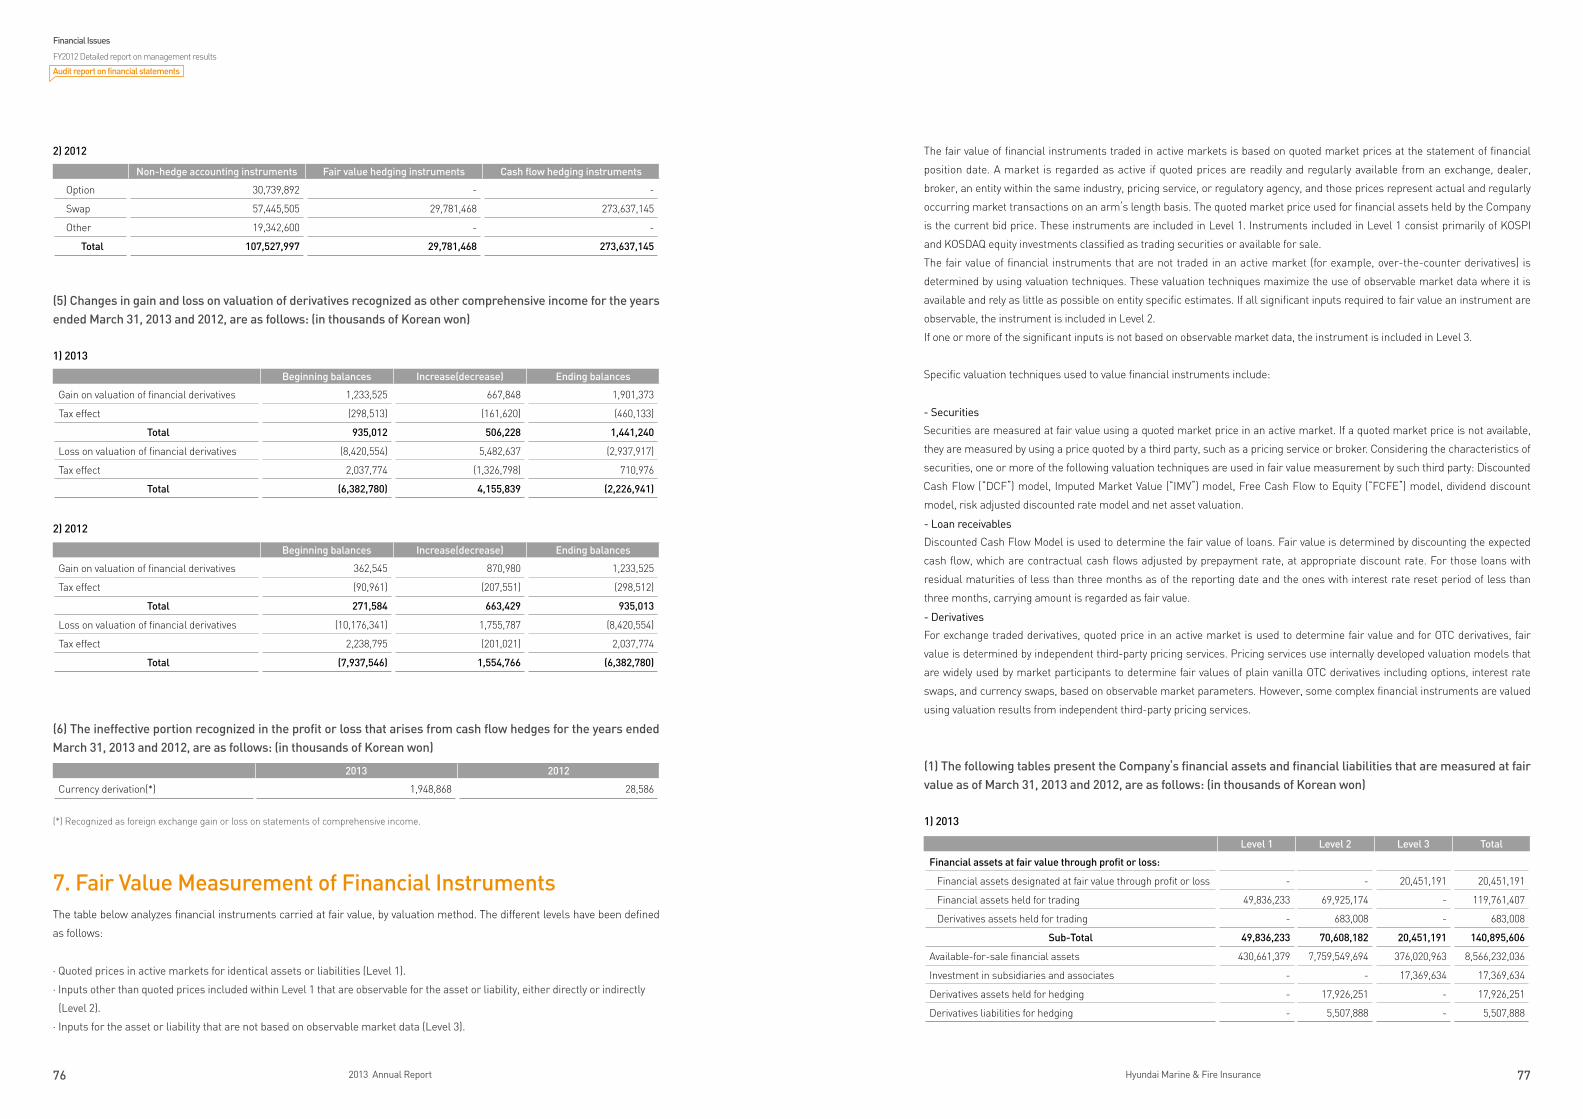
76 2013 Annual Report 77Hyundai Marine & Fire Insurance
2) 2012
(5) Changes in gain and loss on valuation of derivatives recognized as other comprehensive income for the years ended March 31, 2013 and 2012, are as follows: (in thousands of Korean won)
1) 2013
2) 2012
(6) The ineffective portion recognized in the profit or loss that arises from cash flow hedges for the years ended March 31, 2013 and 2012, are as follows: (in thousands of Korean won)
(*) Recognized as foreign exchange gain or loss on statements of comprehensive income.
7. Fair Value Measurement of Financial InstrumentsThe table below analyzes financial instruments carried at fair value, by valuation method. The different levels have been defined
as follows:
· Quoted prices in active markets for identical assets or liabilities (Level 1).
· Inputs other than quoted prices included within Level 1 that are observable for the asset or liability, either directly or indirectly
(Level 2).
· Inputs for the asset or liability that are not based on observable market data (Level 3).
The fair value of financial instruments traded in active markets is based on quoted market prices at the statement of financial
position date. A market is regarded as active if quoted prices are readily and regularly available from an exchange, dealer,
broker, an entity within the same industry, pricing service, or regulatory agency, and those prices represent actual and regularly
occurring market transactions on an arm’s length basis. The quoted market price used for financial assets held by the Company
is the current bid price. These instruments are included in Level 1. Instruments included in Level 1 consist primarily of KOSPI
and KOSDAQ equity investments classified as trading securities or available for sale.
The fair value of financial instruments that are not traded in an active market (for example, over-the-counter derivatives) is
determined by using valuation techniques. These valuation techniques maximize the use of observable market data where it is
available and rely as little as possible on entity specific estimates. If all significant inputs required to fair value an instrument are
observable, the instrument is included in Level 2.
If one or more of the significant inputs is not based on observable market data, the instrument is included in Level 3.
Specific valuation techniques used to value financial instruments include:
- Securities
Securities are measured at fair value using a quoted market price in an active market. If a quoted market price is not available,
they are measured by using a price quoted by a third party, such as a pricing service or broker. Considering the characteristics of
securities, one or more of the following valuation techniques are used in fair value measurement by such third party: Discounted
Cash Flow (“DCF”) model, Imputed Market Value (“IMV”) model, Free Cash Flow to Equity (“FCFE”) model, dividend discount
model, risk adjusted discounted rate model and net asset valuation.
- Loan receivables
Discounted Cash Flow Model is used to determine the fair value of loans. Fair value is determined by discounting the expected
cash flow, which are contractual cash flows adjusted by prepayment rate, at appropriate discount rate. For those loans with
residual maturities of less than three months as of the reporting date and the ones with interest rate reset period of less than
three months, carrying amount is regarded as fair value.
- Derivatives
For exchange traded derivatives, quoted price in an active market is used to determine fair value and for OTC derivatives, fair
value is determined by independent third-party pricing services. Pricing services use internally developed valuation models that
are widely used by market participants to determine fair values of plain vanilla OTC derivatives including options, interest rate
swaps, and currency swaps, based on observable market parameters. However, some complex financial instruments are valued
using valuation results from independent third-party pricing services.
(1) The following tables present the Company’s financial assets and financial liabilities that are measured at fair value as of March 31, 2013 and 2012, are as follows: (in thousands of Korean won)
1) 2013
Beginning balances Increase(decrease) Ending balances
Gain on valuation of financial derivatives 362,545 870,980 1,233,525
Tax effect (90,961) (207,551) (298,512)
Total 271,584 663,429 935,013
Loss on valuation of financial derivatives (10,176,341) 1,755,787 (8,420,554)
Tax effect 2,238,795 (201,021) 2,037,774
Total (7,937,546) 1,554,766 (6,382,780)
2013 2012
Currency derivation(*) 1,948,868 28,586
Beginning balances Increase(decrease) Ending balances
Gain on valuation of financial derivatives 1,233,525 667,848 1,901,373
Tax effect (298,513) (161,620) (460,133)
Total 935,012 506,228 1,441,240
Loss on valuation of financial derivatives (8,420,554) 5,482,637 (2,937,917)
Tax effect 2,037,774 (1,326,798) 710,976
Total (6,382,780) 4,155,839 (2,226,941)
Level 1 Level 2 Level 3 Total
Financial assets at fair value through profit or loss:
Financial assets designated at fair value through profit or loss - - 20,451,191 20,451,191
Financial assets held for trading 49,836,233 69,925,174 - 119,761,407
Derivatives assets held for trading - 683,008 - 683,008
Sub-Total 49,836,233 70,608,182 20,451,191 140,895,606
Available-for-sale financial assets 430,661,379 7,759,549,694 376,020,963 8,566,232,036
Investment in subsidiaries and associates - - 17,369,634 17,369,634
Derivatives assets held for hedging - 17,926,251 - 17,926,251
Derivatives liabilities for hedging - 5,507,888 - 5,507,888
Non-hedge accounting instruments Fair value hedging instruments Cash flow hedging instruments
Option 30,739,892 - -
Swap 57,445,505 29,781,468 273,637,145
Other 19,342,600 - -
Total 107,527,997 29,781,468 273,637,145
Financial Issues
FY2012 Detailed report on management results
Audit report on financial statements
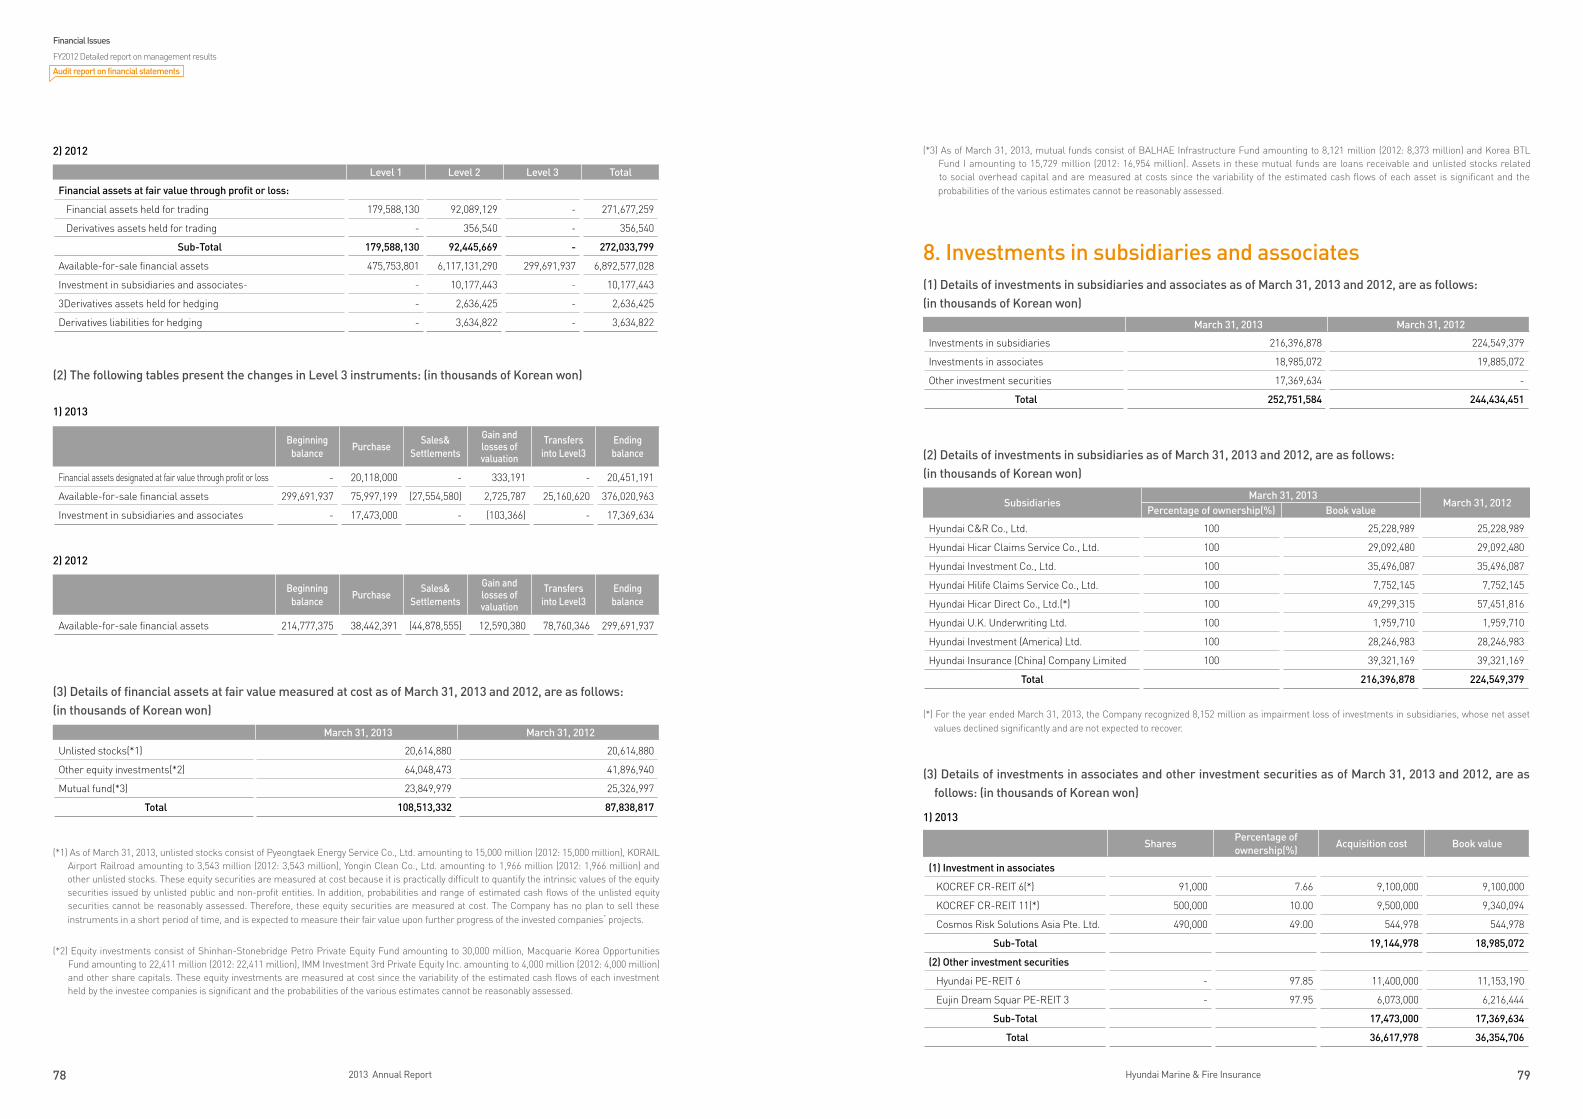
78 2013 Annual Report 79Hyundai Marine & Fire Insurance
2) 2012
(2) The following tables present the changes in Level 3 instruments: (in thousands of Korean won)
1) 2013
2) 2012
(3) Details of financial assets at fair value measured at cost as of March 31, 2013 and 2012, are as follows:(in thousands of Korean won)
(*1) As of March 31, 2013, unlisted stocks consist of Pyeongtaek Energy Service Co., Ltd. amounting to 15,000 million (2012: 15,000 million), KORAIL Airport Railroad amounting to 3,543 million (2012: 3,543 million), Yongin Clean Co., Ltd. amounting to 1,966 million (2012: 1,966 million) and other unlisted stocks. These equity securities are measured at cost because it is practically difficult to quantify the intrinsic values of the equity securities issued by unlisted public and non-profit entities. In addition, probabilities and range of estimated cash flows of the unlisted equity securities cannot be reasonably assessed. Therefore, these equity securities are measured at cost. The Company has no plan to sell these instruments in a short period of time, and is expected to measure their fair value upon further progress of the invested companies’ projects.
(*2) Equity investments consist of Shinhan-Stonebridge Petro Private Equity Fund amounting to 30,000 million, Macquarie Korea Opportunities Fund amounting to 22,411 million (2012: 22,411 million), IMM Investment 3rd Private Equity Inc. amounting to 4,000 million (2012: 4,000 million) and other share capitals. These equity investments are measured at cost since the variability of the estimated cash flows of each investment held by the investee companies is significant and the probabilities of the various estimates cannot be reasonably assessed.
(*3) As of March 31, 2013, mutual funds consist of BALHAE Infrastructure Fund amounting to 8,121 million (2012: 8,373 million) and Korea BTL Fund I amounting to 15,729 million (2012: 16,954 million). Assets in these mutual funds are loans receivable and unlisted stocks related to social overhead capital and are measured at costs since the variability of the estimated cash flows of each asset is significant and the probabilities of the various estimates cannot be reasonably assessed.
8. Investments in subsidiaries and associates(1) Details of investments in subsidiaries and associates as of March 31, 2013 and 2012, are as follows:(in thousands of Korean won)
(2) Details of investments in subsidiaries as of March 31, 2013 and 2012, are as follows: (in thousands of Korean won)
(*) For the year ended March 31, 2013, the Company recognized 8,152 million as impairment loss of investments in subsidiaries, whose net asset values declined significantly and are not expected to recover.
(3) Details of investments in associates and other investment securities as of March 31, 2013 and 2012, are as follows: (in thousands of Korean won)
1) 2013
Beginning balance
PurchaseSales&
Settlements
Gain and losses of valuation
Transfers into Level3
Ending balance
Financial assets designated at fair value through profit or loss - 20,118,000 - 333,191 - 20,451,191
Available-for-sale financial assets 299,691,937 75,997,199 (27,554,580) 2,725,787 25,160,620 376,020,963
Investment in subsidiaries and associates - 17,473,000 - (103,366) - 17,369,634
Beginning balance
PurchaseSales&
Settlements
Gain and losses of valuation
Transfers into Level3
Ending balance
Available-for-sale financial assets 214,777,375 38,442,391 (44,878,555) 12,590,380 78,760,346 299,691,937
March 31, 2013 March 31, 2012
Unlisted stocks(*1) 20,614,880 20,614,880
Other equity investments(*2) 64,048,473 41,896,940
Mutual fund(*3) 23,849,979 25,326,997
Total 108,513,332 87,838,817
March 31, 2013 March 31, 2012
Investments in subsidiaries 216,396,878 224,549,379
Investments in associates 18,985,072 19,885,072
Other investment securities 17,369,634 -
Total 252,751,584 244,434,451
SubsidiariesMarch 31, 2013
March 31, 2012Percentage of ownership(%) Book value
Hyundai C&R Co., Ltd. 100 25,228,989 25,228,989
Hyundai Hicar Claims Service Co., Ltd. 100 29,092,480 29,092,480
Hyundai Investment Co., Ltd. 100 35,496,087 35,496,087
Hyundai Hilife Claims Service Co., Ltd. 100 7,752,145 7,752,145
Hyundai Hicar Direct Co., Ltd.(*) 100 49,299,315 57,451,816
Hyundai U.K. Underwriting Ltd. 100 1,959,710 1,959,710
Hyundai Investment (America) Ltd. 100 28,246,983 28,246,983
Hyundai Insurance (China) Company Limited 100 39,321,169 39,321,169
Total 216,396,878 224,549,379
SharesPercentage of ownership(%)
Acquisition cost Book value
(1) Investment in associates
KOCREF CR-REIT 6(*) 91,000 7.66 9,100,000 9,100,000
KOCREF CR-REIT 11(*) 500,000 10.00 9,500,000 9,340,094
Cosmos Risk Solutions Asia Pte. Ltd. 490,000 49.00 544,978 544,978
Sub-Total 19,144,978 18,985,072
(2) Other investment securities
Hyundai PE-REIT 6 - 97.85 11,400,000 11,153,190
Eujin Dream Squar PE-REIT 3 - 97.95 6,073,000 6,216,444
Sub-Total 17,473,000 17,369,634
Total 36,617,978 36,354,706
Level 1 Level 2 Level 3 Total
Financial assets at fair value through profit or loss:
Financial assets held for trading 179,588,130 92,089,129 - 271,677,259
Derivatives assets held for trading - 356,540 - 356,540
Sub-Total 179,588,130 92,445,669 - 272,033,799
Available-for-sale financial assets 475,753,801 6,117,131,290 299,691,937 6,892,577,028
Investment in subsidiaries and associates- - 10,177,443 - 10,177,443
3Derivatives assets held for hedging - 2,636,425 - 2,636,425
Derivatives liabilities for hedging - 3,634,822 - 3,634,822
Financial Issues
FY2012 Detailed report on management results
Audit report on financial statements
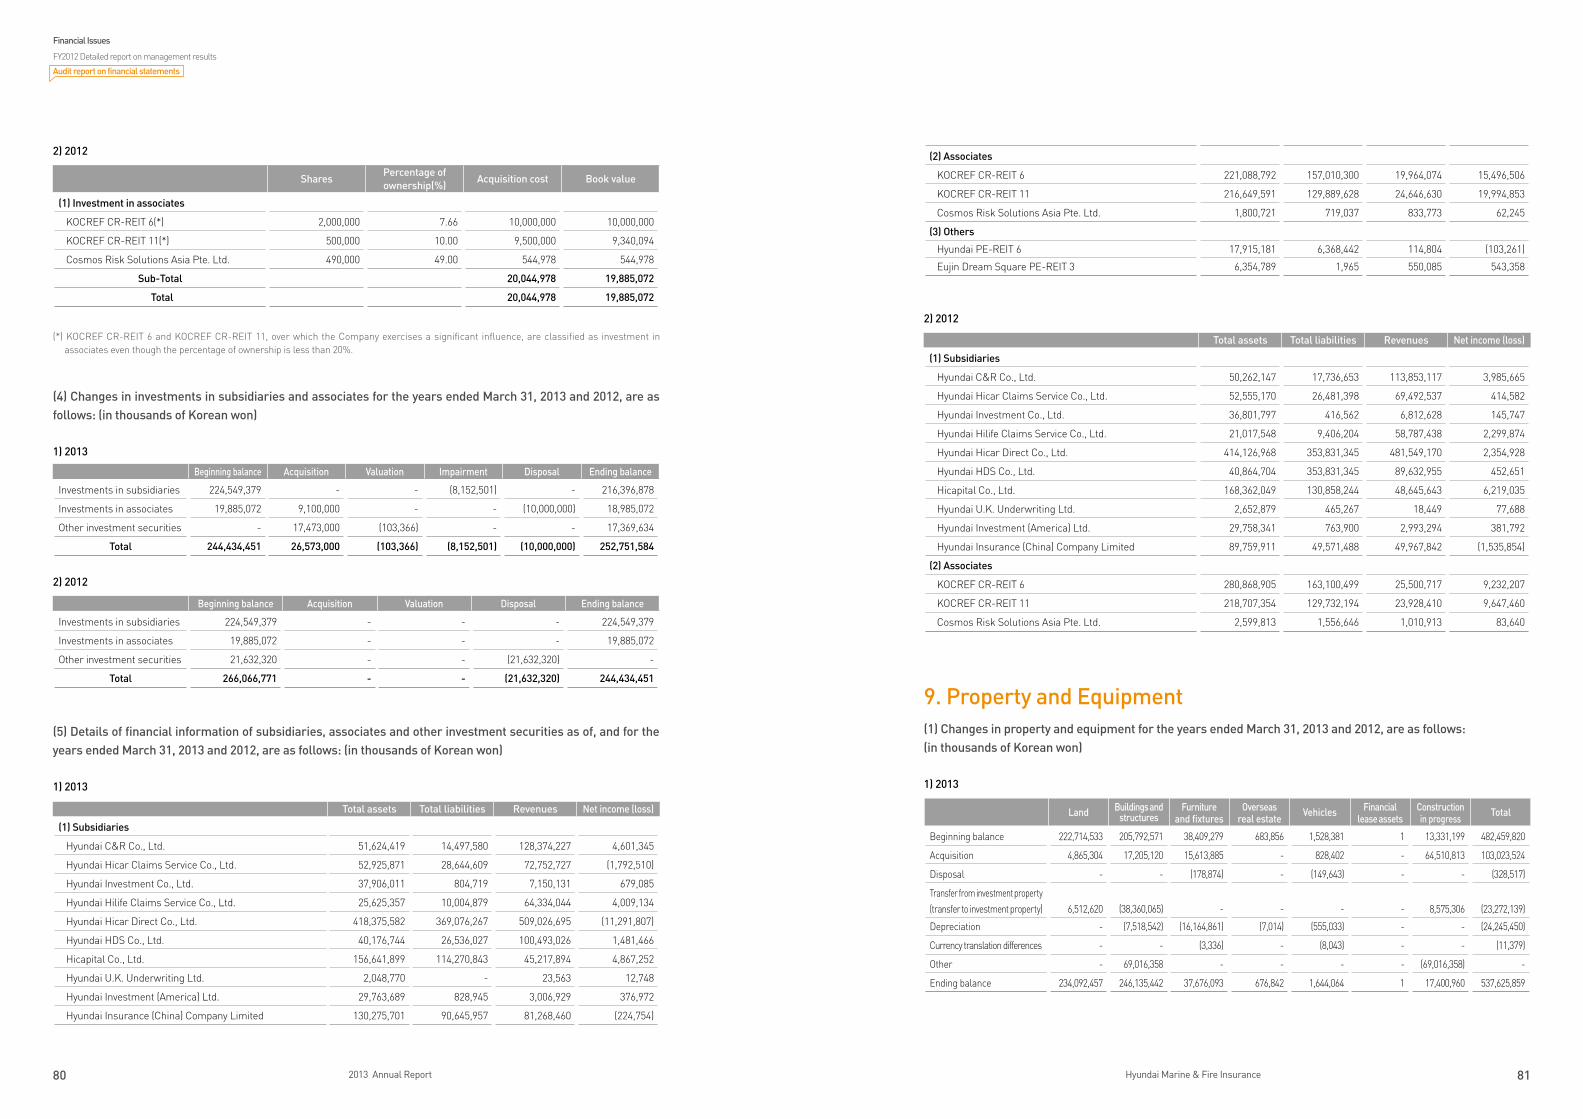
80 2013 Annual Report 81Hyundai Marine & Fire Insurance
2) 2012
9. Property and Equipment (1) Changes in property and equipment for the years ended March 31, 2013 and 2012, are as follows: (in thousands of Korean won)
1) 2013
2) 2012
(*) KOCREF CR-REIT 6 and KOCREF CR-REIT 11, over which the Company exercises a significant influence, are classified as investment in associates even though the percentage of ownership is less than 20%.
(4) Changes in investments in subsidiaries and associates for the years ended March 31, 2013 and 2012, are as follows: (in thousands of Korean won)
1) 2013
2) 2012
(5) Details of financial information of subsidiaries, associates and other investment securities as of, and for the years ended March 31, 2013 and 2012, are as follows: (in thousands of Korean won)
1) 2013
Beginning balance Acquisition Valuation Impairment Disposal Ending balance
Investments in subsidiaries 224,549,379 - - (8,152,501) - 216,396,878
Investments in associates 19,885,072 9,100,000 - - (10,000,000) 18,985,072
Other investment securities - 17,473,000 (103,366) - - 17,369,634
Total 244,434,451 26,573,000 (103,366) (8,152,501) (10,000,000) 252,751,584
Beginning balance Acquisition Valuation Disposal Ending balance
Investments in subsidiaries 224,549,379 - - - 224,549,379
Investments in associates 19,885,072 - - - 19,885,072
Other investment securities 21,632,320 - - (21,632,320) -
Total 266,066,771 - - (21,632,320) 244,434,451
Total assets Total liabilities Revenues Net income (loss)
(1) Subsidiaries
Hyundai C&R Co., Ltd. 51,624,419 14,497,580 128,374,227 4,601,345
Hyundai Hicar Claims Service Co., Ltd. 52,925,871 28,644,609 72,752,727 (1,792,510)
Hyundai Investment Co., Ltd. 37,906,011 804,719 7,150,131 679,085
Hyundai Hilife Claims Service Co., Ltd. 25,625,357 10,004,879 64,334,044 4,009,134
Hyundai Hicar Direct Co., Ltd. 418,375,582 369,076,267 509,026,695 (11,291,807)
Hyundai HDS Co., Ltd. 40,176,744 26,536,027 100,493,026 1,481,466
Hicapital Co., Ltd. 156,641,899 114,270,843 45,217,894 4,867,252
Hyundai U.K. Underwriting Ltd. 2,048,770 - 23,563 12,748
Hyundai Investment (America) Ltd. 29,763,689 828,945 3,006,929 376,972
Hyundai Insurance (China) Company Limited 130,275,701 90,645,957 81,268,460 (224,754)
Total assets Total liabilities Revenues Net income (loss)
(1) Subsidiaries
Hyundai C&R Co., Ltd. 50,262,147 17,736,653 113,853,117 3,985,665
Hyundai Hicar Claims Service Co., Ltd. 52,555,170 26,481,398 69,492,537 414,582
Hyundai Investment Co., Ltd. 36,801,797 416,562 6,812,628 145,747
Hyundai Hilife Claims Service Co., Ltd. 21,017,548 9,406,204 58,787,438 2,299,874
Hyundai Hicar Direct Co., Ltd. 414,126,968 353,831,345 481,549,170 2,354,928
Hyundai HDS Co., Ltd. 40,864,704 353,831,345 89,632,955 452,651
Hicapital Co., Ltd. 168,362,049 130,858,244 48,645,643 6,219,035
Hyundai U.K. Underwriting Ltd. 2,652,879 465,267 18,449 77,688
Hyundai Investment (America) Ltd. 29,758,341 763,900 2,993,294 381,792
Hyundai Insurance (China) Company Limited 89,759,911 49,571,488 49,967,842 (1,535,854)
(2) Associates
KOCREF CR-REIT 6 280,868,905 163,100,499 25,500,717 9,232,207
KOCREF CR-REIT 11 218,707,354 129,732,194 23,928,410 9,647,460
Cosmos Risk Solutions Asia Pte. Ltd. 2,599,813 1,556,646 1,010,913 83,640
Land Buildings and structures
Furnitureand fixtures
Overseas real estate
Vehicles Financial lease assets
Construction in progress
Total
Beginning balance 222,714,533 205,792,571 38,409,279 683,856 1,528,381 1 13,331,199 482,459,820
Acquisition 4,865,304 17,205,120 15,613,885 - 828,402 - 64,510,813 103,023,524
Disposal - - (178,874) - (149,643) - - (328,517)
Transfer from investment property(transfer to investment property) 6,512,620 (38,360,065) - - - - 8,575,306 (23,272,139)
Depreciation - (7,518,542) (16,164,861) (7,014) (555,033) - - (24,245,450)
Currency translation differences - - (3,336) - (8,043) - - (11,379)
Other - 69,016,358 - - - - (69,016,358) -
Ending balance 234,092,457 246,135,442 37,676,093 676,842 1,644,064 1 17,400,960 537,625,859
SharesPercentage of ownership(%)
Acquisition cost Book value
(1) Investment in associates
KOCREF CR-REIT 6(*) 2,000,000 7.66 10,000,000 10,000,000
KOCREF CR-REIT 11(*) 500,000 10.00 9,500,000 9,340,094
Cosmos Risk Solutions Asia Pte. Ltd. 490,000 49.00 544,978 544,978
Sub-Total 20,044,978 19,885,072
Total 20,044,978 19,885,072
(2) Associates
KOCREF CR-REIT 6 221,088,792 157,010,300 19,964,074 15,496,506
KOCREF CR-REIT 11 216,649,591 129,889,628 24,646,630 19,994,853
Cosmos Risk Solutions Asia Pte. Ltd. 1,800,721 719,037 833,773 62,245
(3) Others
Hyundai PE-REIT 6 17,915,181 6,368,442 114,804 (103,261)
Eujin Dream Square PE-REIT 3 6,354,789 1,965 550,085 543,358
Financial Issues
FY2012 Detailed report on management results
Audit report on financial statements
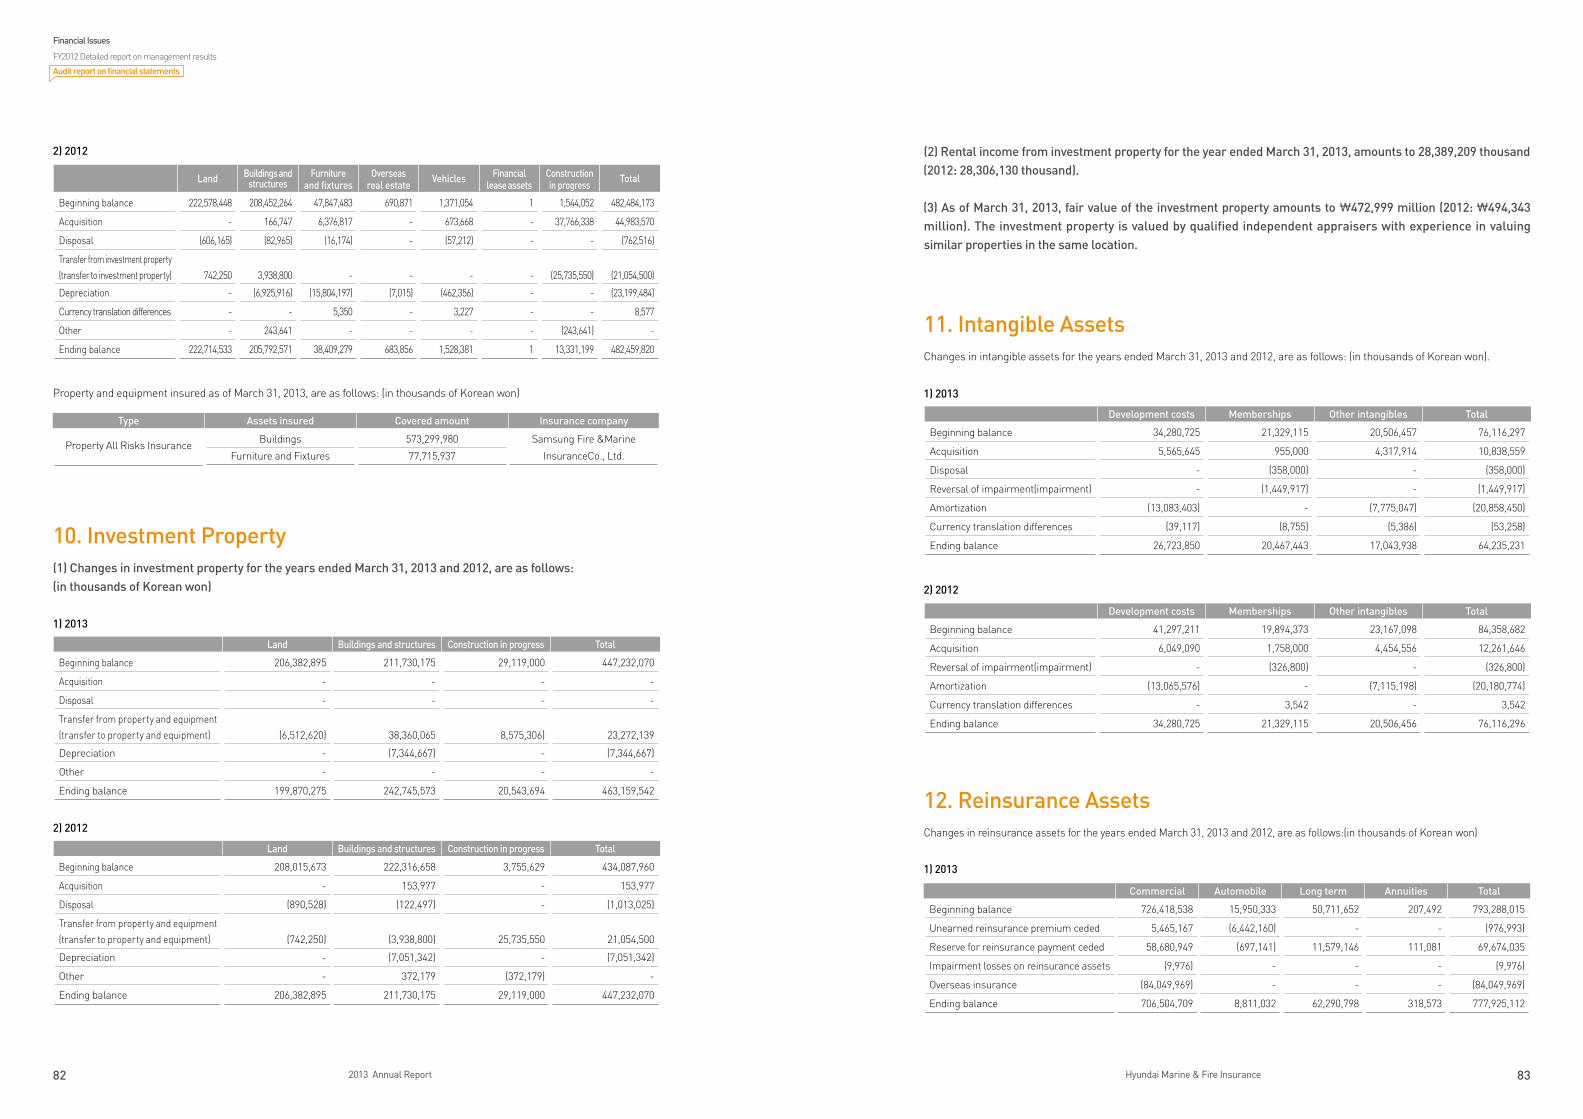
82 2013 Annual Report 83Hyundai Marine & Fire Insurance
(2) Rental income from investment property for the year ended March 31, 2013, amounts to 28,389,209 thousand (2012: 28,306,130 thousand).
(3) As of March 31, 2013, fair value of the investment property amounts to \472,999 million (2012: \494,343 million). The investment property is valued by qualified independent appraisers with experience in valuing similar properties in the same location.
11. Intangible AssetsChanges in intangible assets for the years ended March 31, 2013 and 2012, are as follows: (in thousands of Korean won).
1) 2013
2) 2012
12. Reinsurance AssetsChanges in reinsurance assets for the years ended March 31, 2013 and 2012, are as follows:(in thousands of Korean won)
1) 2013
2) 2012
Property and equipment insured as of March 31, 2013, are as follows: (in thousands of Korean won)
10. Investment Property(1) Changes in investment property for the years ended March 31, 2013 and 2012, are as follows: (in thousands of Korean won)
1) 2013
2) 2012
Type Assets insured Covered amount Insurance company
Property All Risks Insurance
Buildings 573,299,980 Samsung Fire &Marine
InsuranceCo., Ltd.Furniture and Fixtures 77,715,937
Land Buildings and structures Construction in progress Total
Beginning balance 206,382,895 211,730,175 29,119,000 447,232,070
Acquisition - - - -
Disposal - - - -
Transfer from property and equipment(transfer to property and equipment) (6,512,620) 38,360,065 8,575,306) 23,272,139
Depreciation - (7,344,667) - (7,344,667)
Other - - - -
Ending balance 199,870,275 242,745,573 20,543,694 463,159,542
Land Buildings and structures Construction in progress Total
Beginning balance 208,015,673 222,316,658 3,755,629 434,087,960
Acquisition - 153,977 - 153,977
Disposal (890,528) (122,497) - (1,013,025)
Transfer from property and equipment(transfer to property and equipment) (742,250) (3,938,800) 25,735,550 21,054,500
Depreciation - (7,051,342) - (7,051,342)
Other - 372,179 (372,179) -
Ending balance 206,382,895 211,730,175 29,119,000 447,232,070
Development costs Memberships Other intangibles Total
Beginning balance 41,297,211 19,894,373 23,167,098 84,358,682
Acquisition 6,049,090 1,758,000 4,454,556 12,261,646
Reversal of impairment(impairment) - (326,800) - (326,800)
Amortization (13,065,576) - (7,115,198) (20,180,774)
Currency translation differences - 3,542 - 3,542
Ending balance 34,280,725 21,329,115 20,506,456 76,116,296
Development costs Memberships Other intangibles Total
Beginning balance 34,280,725 21,329,115 20,506,457 76,116,297
Acquisition 5,565,645 955,000 4,317,914 10,838,559
Disposal - (358,000) - (358,000)
Reversal of impairment(impairment) - (1,449,917) - (1,449,917)
Amortization (13,083,403) - (7,775,047) (20,858,450)
Currency translation differences (39,117) (8,755) (5,386) (53,258)
Ending balance 26,723,850 20,467,443 17,043,938 64,235,231
Land Buildings and structures
Furnitureand fixtures
Overseas real estate
Vehicles Financial lease assets
Construction in progress
Total
Beginning balance 222,578,448 208,452,264 47,847,483 690,871 1,371,054 1 1,544,052 482,484,173
Acquisition - 166,747 6,376,817 - 673,668 - 37,766,338 44,983,570
Disposal (606,165) (82,965) (16,174) - (57,212) - - (762,516)
Transfer from investment property(transfer to investment property) 742,250 3,938,800 - - - - (25,735,550) (21,054,500)
Depreciation - (6,925,916) (15,804,197) (7,015) (462,356) - - (23,199,484)
Currency translation differences - - 5,350 - 3,227 - - 8,577
Other - 243,641 - - - - (243,641) -
Ending balance 222,714,533 205,792,571 38,409,279 683,856 1,528,381 1 13,331,199 482,459,820
Commercial Automobile Long term Annuities Total
Beginning balance 726,418,538 15,950,333 50,711,652 207,492 793,288,015
Unearned reinsurance premium ceded 5,465,167 (6,442,160) - - (976,993)
Reserve for reinsurance payment ceded 58,680,949 (697,141) 11,579,146 111,081 69,674,035
Impairment losses on reinsurance assets (9,976) - - - (9,976)
Overseas insurance (84,049,969) - - - (84,049,969)
Ending balance 706,504,709 8,811,032 62,290,798 318,573 777,925,112
Financial Issues
FY2012 Detailed report on management results
Audit report on financial statements
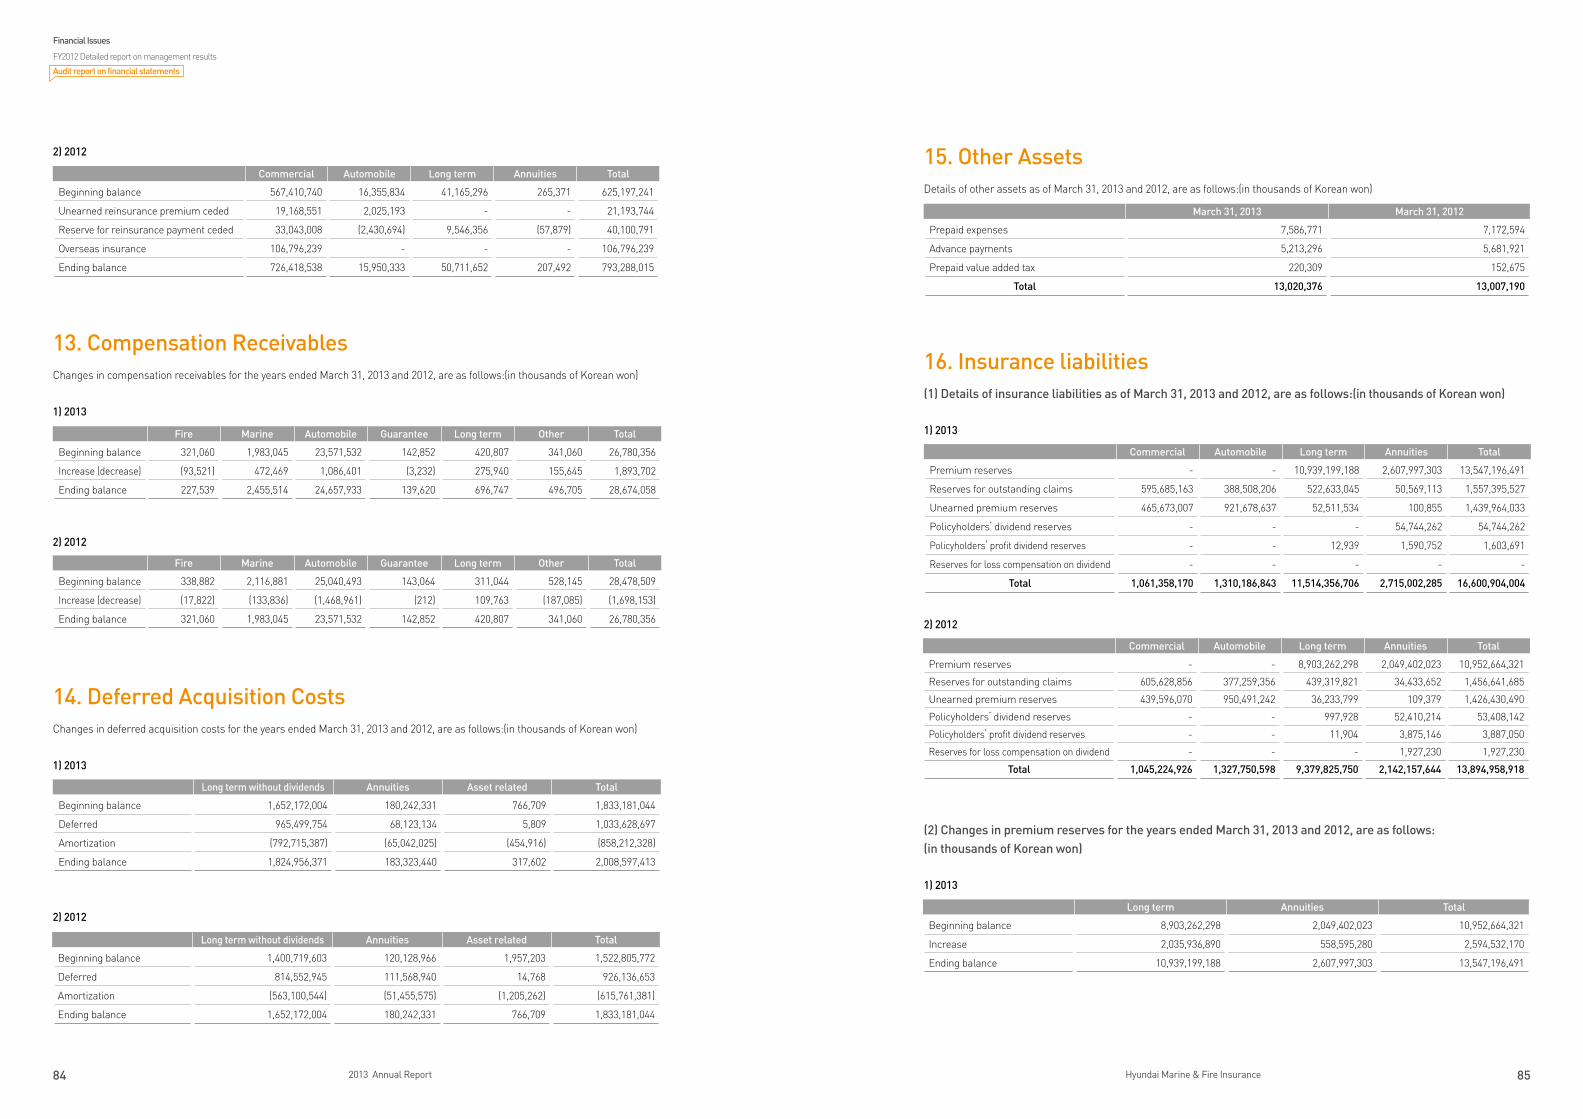
84 2013 Annual Report 85Hyundai Marine & Fire Insurance
2) 2012
13. Compensation ReceivablesChanges in compensation receivables for the years ended March 31, 2013 and 2012, are as follows:(in thousands of Korean won)
1) 2013
2) 2012
14. Deferred Acquisition CostsChanges in deferred acquisition costs for the years ended March 31, 2013 and 2012, are as follows:(in thousands of Korean won)
1) 2013
2) 2012
15. Other AssetsDetails of other assets as of March 31, 2013 and 2012, are as follows:(in thousands of Korean won)
16. Insurance liabilities(1) Details of insurance liabilities as of March 31, 2013 and 2012, are as follows:(in thousands of Korean won)
1) 2013
2) 2012
(2) Changes in premium reserves for the years ended March 31, 2013 and 2012, are as follows: (in thousands of Korean won)
1) 2013
Fire Marine Automobile Guarantee Long term Other Total
Beginning balance 321,060 1,983,045 23,571,532 142,852 420,807 341,060 26,780,356
Increase (decrease) (93,521) 472,469 1,086,401 (3,232) 275,940 155,645 1,893,702
Ending balance 227,539 2,455,514 24,657,933 139,620 696,747 496,705 28,674,058
Commercial Automobile Long term Annuities Total
Beginning balance 567,410,740 16,355,834 41,165,296 265,371 625,197,241
Unearned reinsurance premium ceded 19,168,551 2,025,193 - - 21,193,744
Reserve for reinsurance payment ceded 33,043,008 (2,430,694) 9,546,356 (57,879) 40,100,791
Overseas insurance 106,796,239 - - - 106,796,239
Ending balance 726,418,538 15,950,333 50,711,652 207,492 793,288,015
Fire Marine Automobile Guarantee Long term Other Total
Beginning balance 338,882 2,116,881 25,040,493 143,064 311,044 528,145 28,478,509
Increase (decrease) (17,822) (133,836) (1,468,961) (212) 109,763 (187,085) (1,698,153)
Ending balance 321,060 1,983,045 23,571,532 142,852 420,807 341,060 26,780,356
Long term without dividends Annuities Asset related Total
Beginning balance 1,652,172,004 180,242,331 766,709 1,833,181,044
Deferred 965,499,754 68,123,134 5,809 1,033,628,697
Amortization (792,715,387) (65,042,025) (454,916) (858,212,328)
Ending balance 1,824,956,371 183,323,440 317,602 2,008,597,413
Long term without dividends Annuities Asset related Total
Beginning balance 1,400,719,603 120,128,966 1,957,203 1,522,805,772
Deferred 814,552,945 111,568,940 14,768 926,136,653
Amortization (563,100,544) (51,455,575) (1,205,262) (615,761,381)
Ending balance 1,652,172,004 180,242,331 766,709 1,833,181,044
March 31, 2013 March 31, 2012
Prepaid expenses 7,586,771 7,172,594
Advance payments 5,213,296 5,681,921
Prepaid value added tax 220,309 152,675
Total 13,020,376 13,007,190
Commercial Automobile Long term Annuities Total
Premium reserves - - 10,939,199,188 2,607,997,303 13,547,196,491
Reserves for outstanding claims 595,685,163 388,508,206 522,633,045 50,569,113 1,557,395,527
Unearned premium reserves 465,673,007 921,678,637 52,511,534 100,855 1,439,964,033
Policyholders’ dividend reserves - - - 54,744,262 54,744,262
Policyholders’ profit dividend reserves - - 12,939 1,590,752 1,603,691
Reserves for loss compensation on dividend - - - - -
Total 1,061,358,170 1,310,186,843 11,514,356,706 2,715,002,285 16,600,904,004
Commercial Automobile Long term Annuities Total
Premium reserves - - 8,903,262,298 2,049,402,023 10,952,664,321
Reserves for outstanding claims 605,628,856 377,259,356 439,319,821 34,433,652 1,456,641,685
Unearned premium reserves 439,596,070 950,491,242 36,233,799 109,379 1,426,430,490
Policyholders’ dividend reserves - - 997,928 52,410,214 53,408,142
Policyholders’ profit dividend reserves - - 11,904 3,875,146 3,887,050
Reserves for loss compensation on dividend - - - 1,927,230 1,927,230
Total 1,045,224,926 1,327,750,598 9,379,825,750 2,142,157,644 13,894,958,918
Long term Annuities Total
Beginning balance 8,903,262,298 2,049,402,023 10,952,664,321
Increase 2,035,936,890 558,595,280 2,594,532,170
Ending balance 10,939,199,188 2,607,997,303 13,547,196,491
Financial Issues
FY2012 Detailed report on management results
Audit report on financial statements
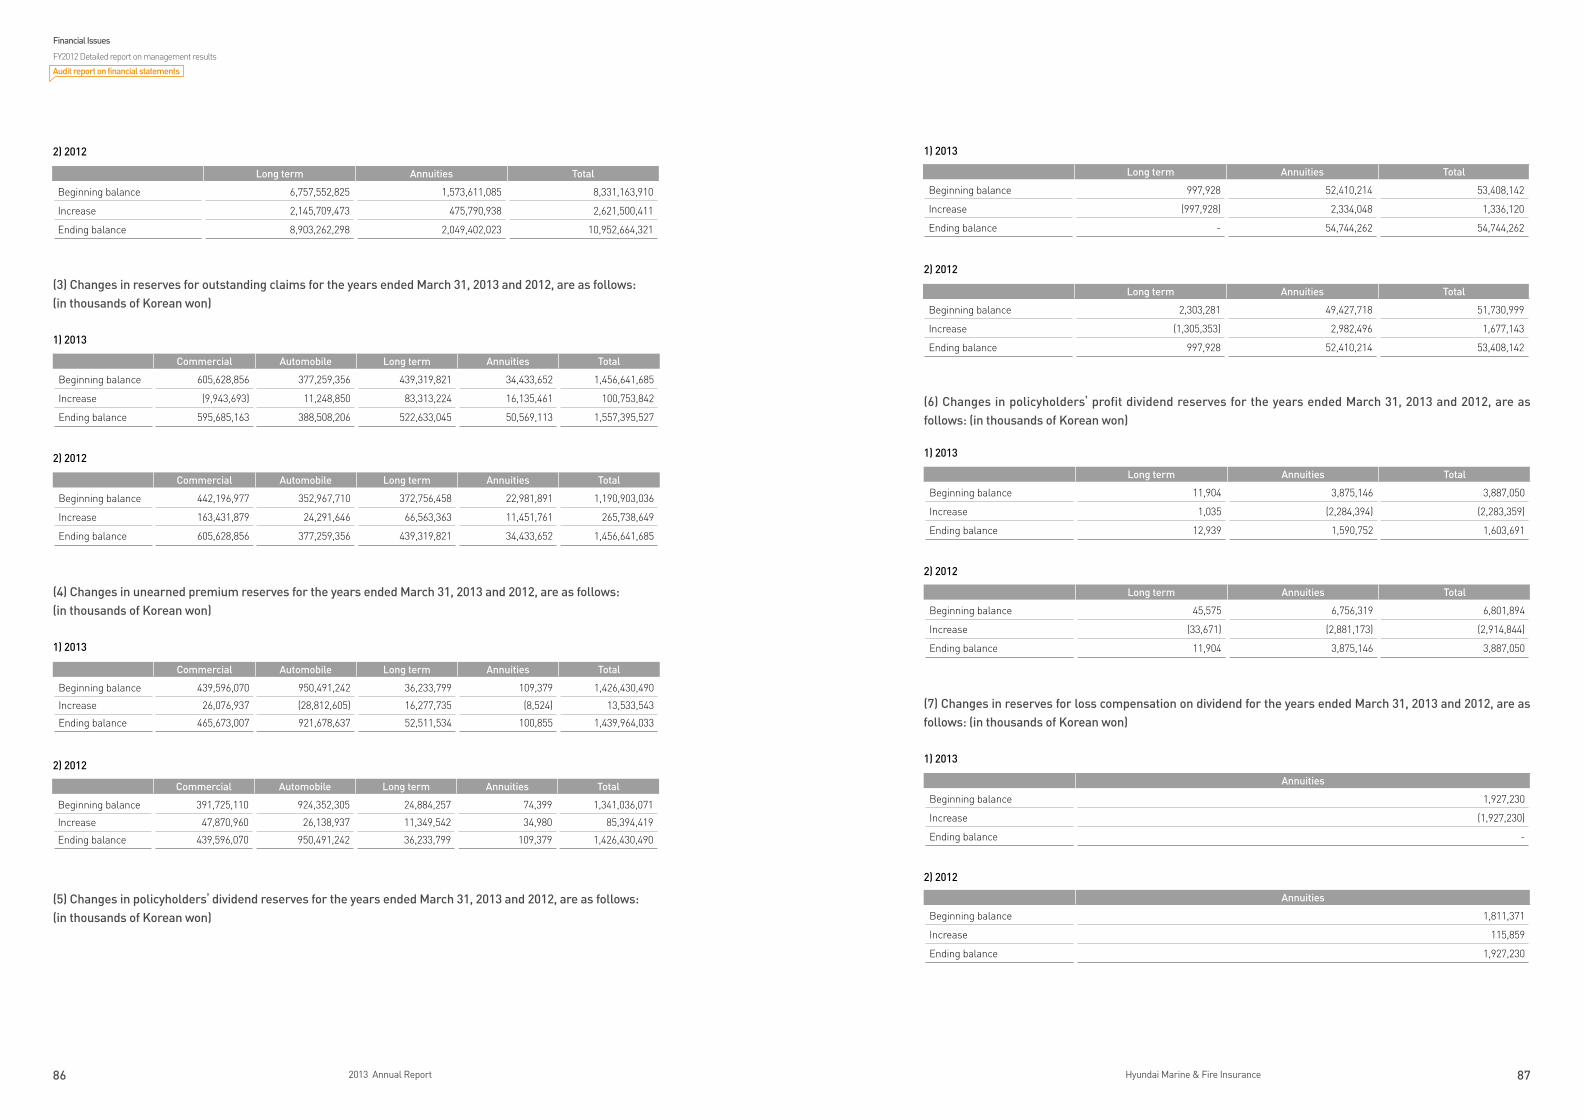
86 2013 Annual Report 87Hyundai Marine & Fire Insurance
2) 2012
(3) Changes in reserves for outstanding claims for the years ended March 31, 2013 and 2012, are as follows: (in thousands of Korean won)
1) 2013
2) 2012
(4) Changes in unearned premium reserves for the years ended March 31, 2013 and 2012, are as follows:(in thousands of Korean won)
1) 2013
2) 2012
(5) Changes in policyholders’ dividend reserves for the years ended March 31, 2013 and 2012, are as follows:(in thousands of Korean won)
Commercial Automobile Long term Annuities Total
Beginning balance 439,596,070 950,491,242 36,233,799 109,379 1,426,430,490
Increase 26,076,937 (28,812,605) 16,277,735 (8,524) 13,533,543
Ending balance 465,673,007 921,678,637 52,511,534 100,855 1,439,964,033
Long term Annuities Total
Beginning balance 6,757,552,825 1,573,611,085 8,331,163,910
Increase 2,145,709,473 475,790,938 2,621,500,411
Ending balance 8,903,262,298 2,049,402,023 10,952,664,321
Commercial Automobile Long term Annuities Total
Beginning balance 605,628,856 377,259,356 439,319,821 34,433,652 1,456,641,685
Increase (9,943,693) 11,248,850 83,313,224 16,135,461 100,753,842
Ending balance 595,685,163 388,508,206 522,633,045 50,569,113 1,557,395,527
Commercial Automobile Long term Annuities Total
Beginning balance 442,196,977 352,967,710 372,756,458 22,981,891 1,190,903,036
Increase 163,431,879 24,291,646 66,563,363 11,451,761 265,738,649
Ending balance 605,628,856 377,259,356 439,319,821 34,433,652 1,456,641,685
Commercial Automobile Long term Annuities Total
Beginning balance 391,725,110 924,352,305 24,884,257 74,399 1,341,036,071
Increase 47,870,960 26,138,937 11,349,542 34,980 85,394,419
Ending balance 439,596,070 950,491,242 36,233,799 109,379 1,426,430,490
1) 2013
2) 2012
(6) Changes in policyholders’ profit dividend reserves for the years ended March 31, 2013 and 2012, are as follows: (in thousands of Korean won)
1) 2013
2) 2012
(7) Changes in reserves for loss compensation on dividend for the years ended March 31, 2013 and 2012, are as follows: (in thousands of Korean won)
1) 2013
2) 2012
Long term Annuities Total
Beginning balance 997,928 52,410,214 53,408,142
Increase (997,928) 2,334,048 1,336,120
Ending balance - 54,744,262 54,744,262
Long term Annuities Total
Beginning balance 2,303,281 49,427,718 51,730,999
Increase (1,305,353) 2,982,496 1,677,143
Ending balance 997,928 52,410,214 53,408,142
Long term Annuities Total
Beginning balance 11,904 3,875,146 3,887,050
Increase 1,035 (2,284,394) (2,283,359)
Ending balance 12,939 1,590,752 1,603,691
Long term Annuities Total
Beginning balance 45,575 6,756,319 6,801,894
Increase (33,671) (2,881,173) (2,914,844)
Ending balance 11,904 3,875,146 3,887,050
Annuities
Beginning balance 1,927,230
Increase (1,927,230)
Ending balance -
Annuities
Beginning balance 1,811,371
Increase 115,859
Ending balance 1,927,230
Financial Issues
FY2012 Detailed report on management results
Audit report on financial statements
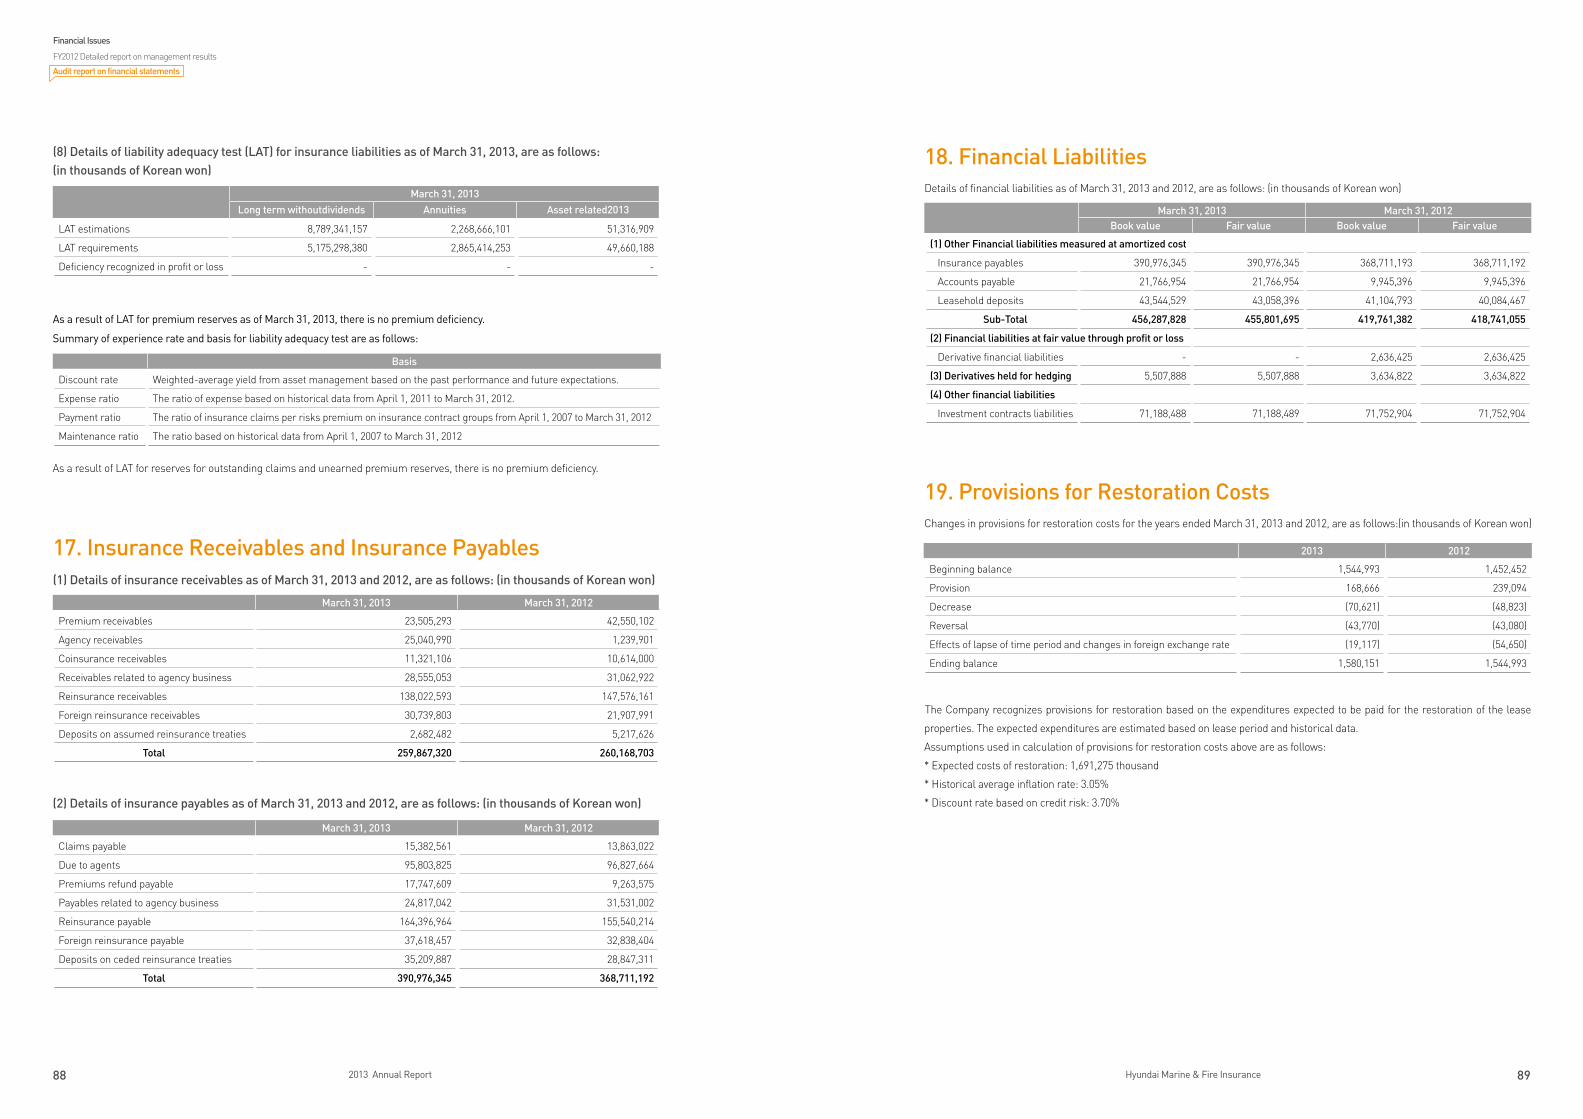
88 2013 Annual Report 89Hyundai Marine & Fire Insurance
(8) Details of liability adequacy test (LAT) for insurance liabilities as of March 31, 2013, are as follows:(in thousands of Korean won)
As a result of LAT for premium reserves as of March 31, 2013, there is no premium deficiency.
Summary of experience rate and basis for liability adequacy test are as follows:
As a result of LAT for reserves for outstanding claims and unearned premium reserves, there is no premium deficiency.
17. Insurance Receivables and Insurance Payables(1) Details of insurance receivables as of March 31, 2013 and 2012, are as follows: (in thousands of Korean won)
(2) Details of insurance payables as of March 31, 2013 and 2012, are as follows: (in thousands of Korean won)
March 31, 2013
Long term withoutdividends Annuities Asset related2013
LAT estimations 8,789,341,157 2,268,666,101 51,316,909
LAT requirements 5,175,298,380 2,865,414,253 49,660,188
Deficiency recognized in profit or loss - - -
Basis
Discount rate Weighted-average yield from asset management based on the past performance and future expectations.
Expense ratio The ratio of expense based on historical data from April 1, 2011 to March 31, 2012.
Payment ratio The ratio of insurance claims per risks premium on insurance contract groups from April 1, 2007 to March 31, 2012
Maintenance ratio The ratio based on historical data from April 1, 2007 to March 31, 2012
March 31, 2013 March 31, 2012
Premium receivables 23,505,293 42,550,102
Agency receivables 25,040,990 1,239,901
Coinsurance receivables 11,321,106 10,614,000
Receivables related to agency business 28,555,053 31,062,922
Reinsurance receivables 138,022,593 147,576,161
Foreign reinsurance receivables 30,739,803 21,907,991
Deposits on assumed reinsurance treaties 2,682,482 5,217,626
Total 259,867,320 260,168,703
March 31, 2013 March 31, 2012
Claims payable 15,382,561 13,863,022
Due to agents 95,803,825 96,827,664
Premiums refund payable 17,747,609 9,263,575
Payables related to agency business 24,817,042 31,531,002
Reinsurance payable 164,396,964 155,540,214
Foreign reinsurance payable 37,618,457 32,838,404
Deposits on ceded reinsurance treaties 35,209,887 28,847,311
Total 390,976,345 368,711,192
18. Financial LiabilitiesDetails of financial liabilities as of March 31, 2013 and 2012, are as follows: (in thousands of Korean won)
19. Provisions for Restoration CostsChanges in provisions for restoration costs for the years ended March 31, 2013 and 2012, are as follows:(in thousands of Korean won)
The Company recognizes provisions for restoration based on the expenditures expected to be paid for the restoration of the lease
properties. The expected expenditures are estimated based on lease period and historical data.
Assumptions used in calculation of provisions for restoration costs above are as follows:
* Expected costs of restoration: 1,691,275 thousand
* Historical average inflation rate: 3.05%
* Discount rate based on credit risk: 3.70%
March 31, 2013 March 31, 2012Book value Fair value Book value Fair value
(1) Other Financial liabilities measured at amortized cost
Insurance payables 390,976,345 390,976,345 368,711,193 368,711,192
Accounts payable 21,766,954 21,766,954 9,945,396 9,945,396
Leasehold deposits 43,544,529 43,058,396 41,104,793 40,084,467
Sub-Total 456,287,828 455,801,695 419,761,382 418,741,055
(2) Financial liabilities at fair value through profit or loss
Derivative financial liabilities - - 2,636,425 2,636,425
(3) Derivatives held for hedging 5,507,888 5,507,888 3,634,822 3,634,822
(4) Other financial liabilities
Investment contracts liabilities 71,188,488 71,188,489 71,752,904 71,752,904
2013 2012
Beginning balance 1,544,993 1,452,452
Provision 168,666 239,094
Decrease (70,621) (48,823)
Reversal (43,770) (43,080)
Effects of lapse of time period and changes in foreign exchange rate (19,117) (54,650)
Ending balance 1,580,151 1,544,993
Financial Issues
FY2012 Detailed report on management results
Audit report on financial statements
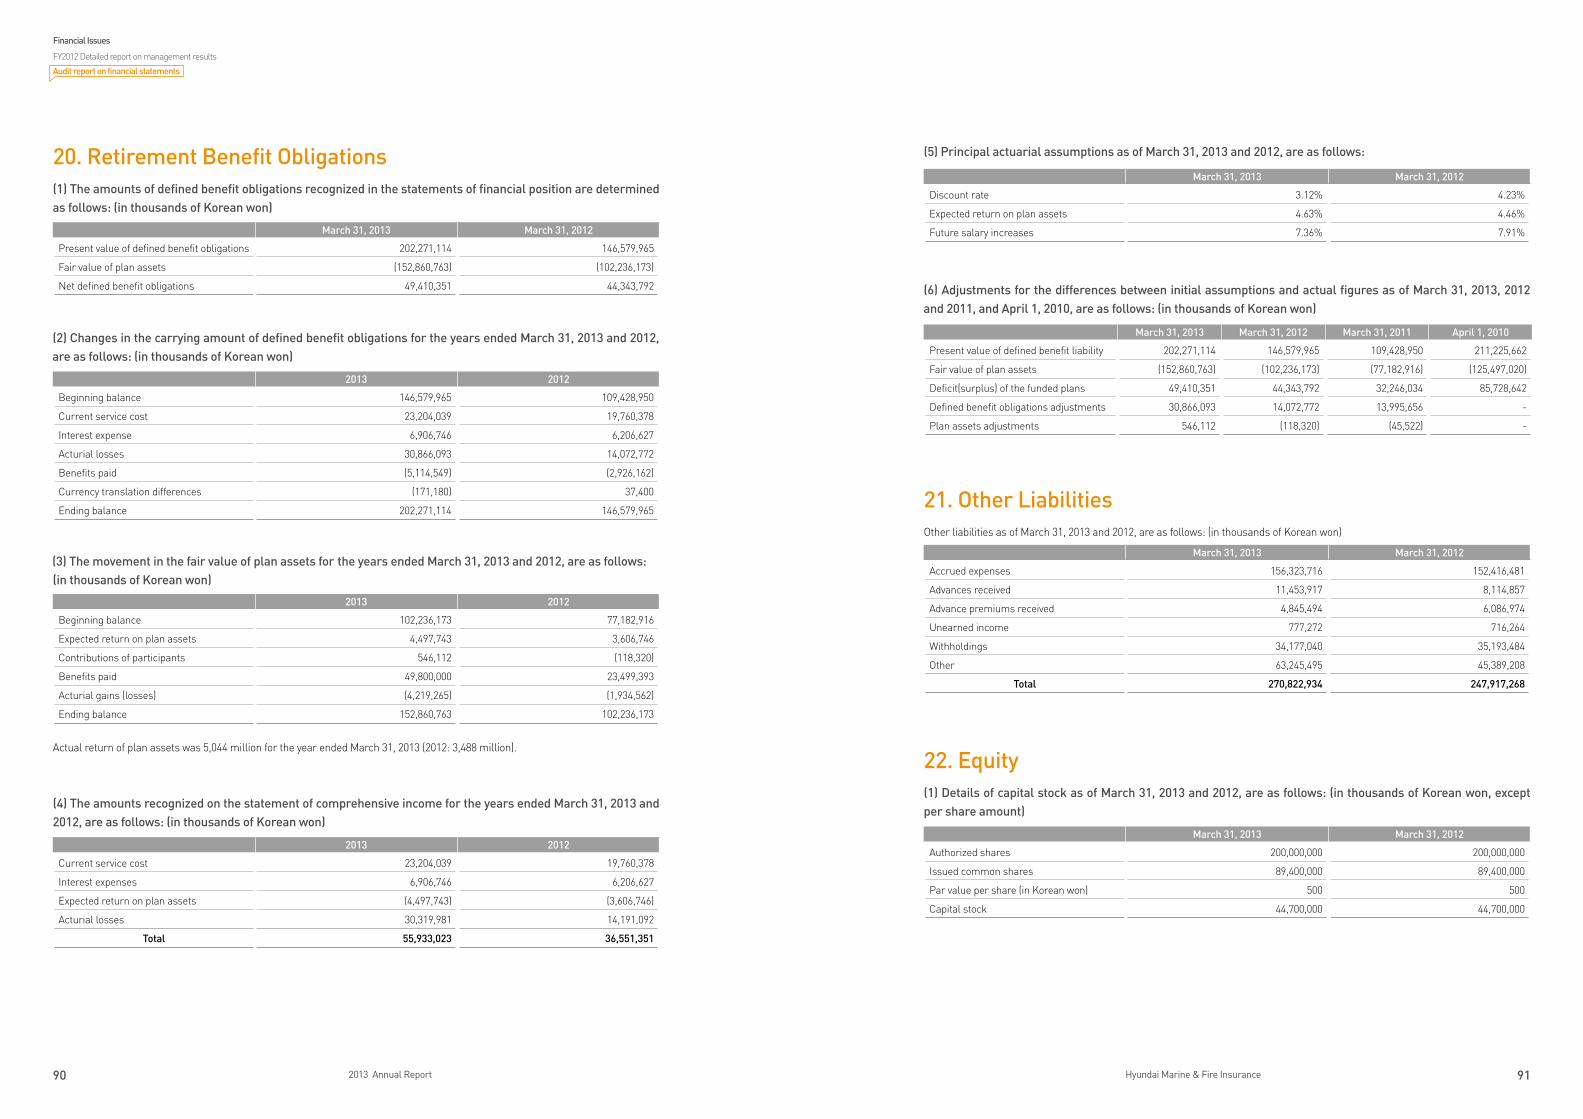
90 2013 Annual Report 91Hyundai Marine & Fire Insurance
(5) Principal actuarial assumptions as of March 31, 2013 and 2012, are as follows:
(6) Adjustments for the differences between initial assumptions and actual figures as of March 31, 2013, 2012 and 2011, and April 1, 2010, are as follows: (in thousands of Korean won)
21. Other LiabilitiesOther liabilities as of March 31, 2013 and 2012, are as follows: (in thousands of Korean won)
22. Equity(1) Details of capital stock as of March 31, 2013 and 2012, are as follows: (in thousands of Korean won, except per share amount)
March 31, 2013 March 31, 2012
Discount rate 3.12% 4.23%
Expected return on plan assets 4.63% 4.46%
Future salary increases 7.36% 7.91%
20. Retirement Benefit Obligations(1) The amounts of defined benefit obligations recognized in the statements of financial position are determined as follows: (in thousands of Korean won)
(2) Changes in the carrying amount of defined benefit obligations for the years ended March 31, 2013 and 2012, are as follows: (in thousands of Korean won)
(3) The movement in the fair value of plan assets for the years ended March 31, 2013 and 2012, are as follows:(in thousands of Korean won)
Actual return of plan assets was 5,044 million for the year ended March 31, 2013 (2012: 3,488 million).
(4) The amounts recognized on the statement of comprehensive income for the years ended March 31, 2013 and 2012, are as follows: (in thousands of Korean won)
2013 2012
Beginning balance 146,579,965 109,428,950
Current service cost 23,204,039 19,760,378
Interest expense 6,906,746 6,206,627
Acturial losses 30,866,093 14,072,772
Benefits paid (5,114,549) (2,926,162)
Currency translation differences (171,180) 37,400
Ending balance 202,271,114 146,579,965
2013 2012
Beginning balance 102,236,173 77,182,916
Expected return on plan assets 4,497,743 3,606,746
Contributions of participants 546,112 (118,320)
Benefits paid 49,800,000 23,499,393
Acturial gains (losses) (4,219,265) (1,934,562)
Ending balance 152,860,763 102,236,173
2013 2012
Current service cost 23,204,039 19,760,378
Interest expenses 6,906,746 6,206,627
Expected return on plan assets (4,497,743) (3,606,746)
Acturial losses 30,319,981 14,191,092
Total 55,933,023 36,551,351
March 31, 2013 March 31, 2012 March 31, 2011 April 1, 2010
Present value of defined benefit liability 202,271,114 146,579,965 109,428,950 211,225,662
Fair value of plan assets (152,860,763) (102,236,173) (77,182,916) (125,497,020)
Deficit(surplus) of the funded plans 49,410,351 44,343,792 32,246,034 85,728,642
Defined benefit obligations adjustments 30,866,093 14,072,772 13,995,656 -
Plan assets adjustments 546,112 (118,320) (45,522) -
March 31, 2013 March 31, 2012
Present value of defined benefit obligations 202,271,114 146,579,965
Fair value of plan assets (152,860,763) (102,236,173)
Net defined benefit obligations 49,410,351 44,343,792
March 31, 2013 March 31, 2012
Accrued expenses 156,323,716 152,416,481
Advances received 11,453,917 8,114,857
Advance premiums received 4,845,494 6,086,974
Unearned income 777,272 716,264
Withholdings 34,177,040 35,193,484
Other 63,245,495 45,389,208
Total 270,822,934 247,917,268
March 31, 2013 March 31, 2012
Authorized shares 200,000,000 200,000,000
Issued common shares 89,400,000 89,400,000
Par value per share (in Korean won) 500 500
Capital stock 44,700,000 44,700,000
Financial Issues
FY2012 Detailed report on management results
Audit report on financial statements
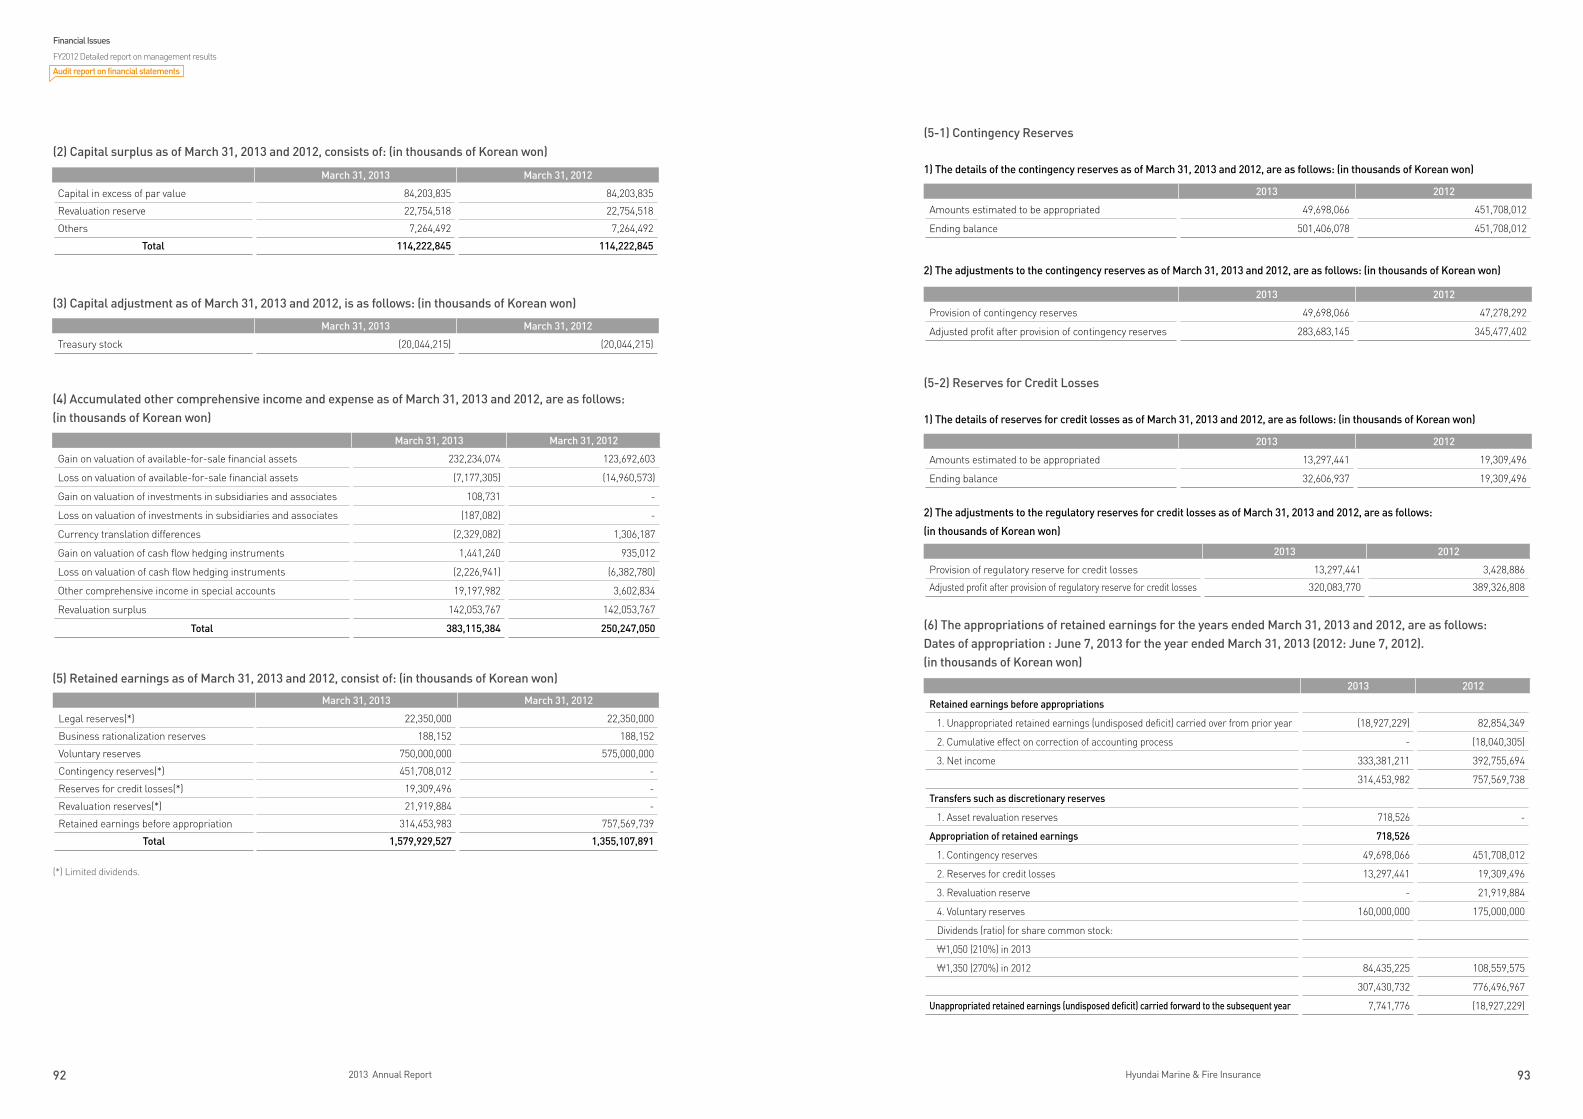
92 2013 Annual Report 93Hyundai Marine & Fire Insurance
(5-1) Contingency Reserves
1) The details of the contingency reserves as of March 31, 2013 and 2012, are as follows: (in thousands of Korean won)
2) The adjustments to the contingency reserves as of March 31, 2013 and 2012, are as follows: (in thousands of Korean won)
(5-2) Reserves for Credit Losses
1) The details of reserves for credit losses as of March 31, 2013 and 2012, are as follows: (in thousands of Korean won)
2) The adjustments to the regulatory reserves for credit losses as of March 31, 2013 and 2012, are as follows:
(in thousands of Korean won)
(6) The appropriations of retained earnings for the years ended March 31, 2013 and 2012, are as follows:Dates of appropriation : June 7, 2013 for the year ended March 31, 2013 (2012: June 7, 2012).(in thousands of Korean won)
(2) Capital surplus as of March 31, 2013 and 2012, consists of: (in thousands of Korean won)
(3) Capital adjustment as of March 31, 2013 and 2012, is as follows: (in thousands of Korean won)
(4) Accumulated other comprehensive income and expense as of March 31, 2013 and 2012, are as follows:(in thousands of Korean won)
(5) Retained earnings as of March 31, 2013 and 2012, consist of: (in thousands of Korean won)
(*) Limited dividends.
March 31, 2013 March 31, 2012
Capital in excess of par value 84,203,835 84,203,835
Revaluation reserve 22,754,518 22,754,518
Others 7,264,492 7,264,492
Total 114,222,845 114,222,845
March 31, 2013 March 31, 2012
Treasury stock (20,044,215) (20,044,215)
March 31, 2013 March 31, 2012
Gain on valuation of available-for-sale financial assets 232,234,074 123,692,603
Loss on valuation of available-for-sale financial assets (7,177,305) (14,960,573)
Gain on valuation of investments in subsidiaries and associates 108,731 -
Loss on valuation of investments in subsidiaries and associates (187,082) -
Currency translation differences (2,329,082) 1,306,187
Gain on valuation of cash flow hedging instruments 1,441,240 935,012
Loss on valuation of cash flow hedging instruments (2,226,941) (6,382,780)
Other comprehensive income in special accounts 19,197,982 3,602,834
Revaluation surplus 142,053,767 142,053,767
Total 383,115,384 250,247,050
March 31, 2013 March 31, 2012
Legal reserves(*) 22,350,000 22,350,000
Business rationalization reserves 188,152 188,152
Voluntary reserves 750,000,000 575,000,000
Contingency reserves(*) 451,708,012 -
Reserves for credit losses(*) 19,309,496 -
Revaluation reserves(*) 21,919,884 -
Retained earnings before appropriation 314,453,983 757,569,739
Total 1,579,929,527 1,355,107,891
2013 2012
Amounts estimated to be appropriated 49,698,066 451,708,012
Ending balance 501,406,078 451,708,012
2013 2012
Provision of contingency reserves 49,698,066 47,278,292
Adjusted profit after provision of contingency reserves 283,683,145 345,477,402
2013 2012
Amounts estimated to be appropriated 13,297,441 19,309,496
Ending balance 32,606,937 19,309,496
2013 2012
Provision of regulatory reserve for credit losses 13,297,441 3,428,886
Adjusted profit after provision of regulatory reserve for credit losses 320,083,770 389,326,808
2013 2012
Retained earnings before appropriations
1. Unappropriated retained earnings (undisposed deficit) carried over from prior year (18,927,229) 82,854,349
2. Cumulative effect on correction of accounting process - (18,040,305)
3. Net income 333,381,211 392,755,694
314,453,982 757,569,738
Transfers such as discretionary reserves
1. Asset revaluation reserves 718,526 -
Appropriation of retained earnings 718,526
1. Contingency reserves 49,698,066 451,708,012
2. Reserves for credit losses 13,297,441 19,309,496
3. Revaluation reserve - 21,919,884
4. Voluntary reserves 160,000,000 175,000,000
Dividends (ratio) for share common stock:
₩1,050 (210%) in 2013
₩1,350 (270%) in 2012 84,435,225 108,559,575
307,430,732 776,496,967
Unappropriated retained earnings (undisposed deficit) carried forward to the subsequent year 7,741,776 (18,927,229)
Financial Issues
FY2012 Detailed report on management results
Audit report on financial statements
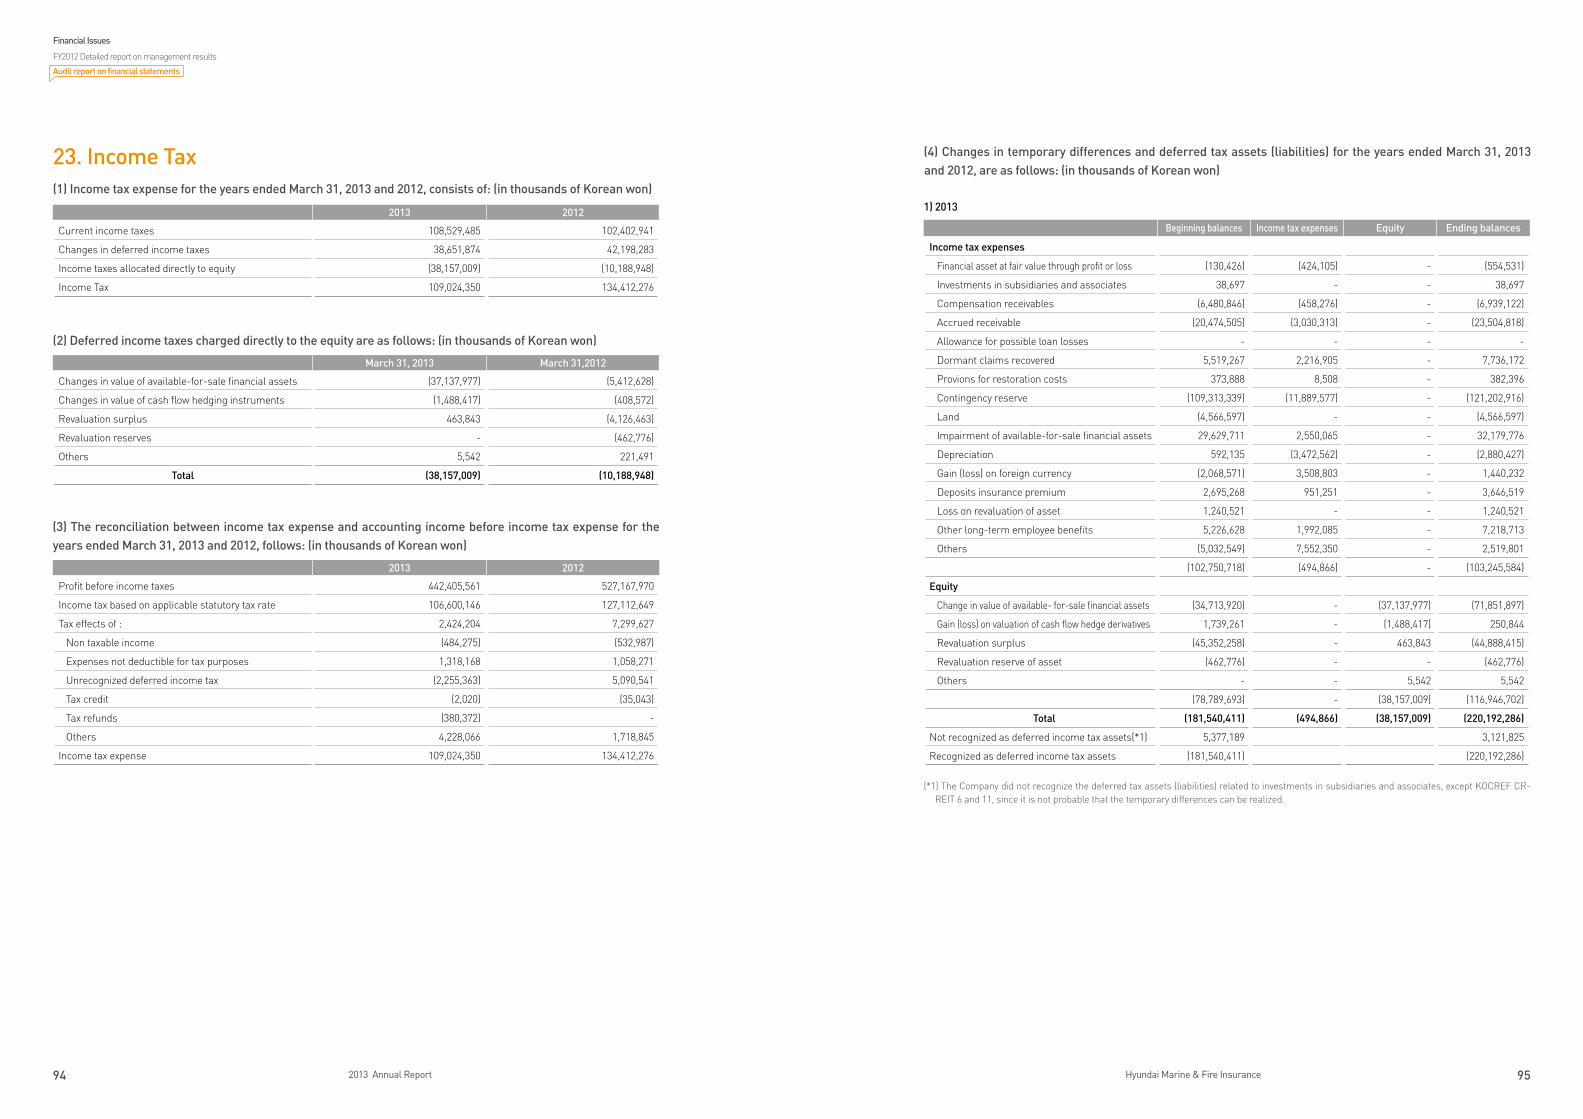
94 2013 Annual Report 95Hyundai Marine & Fire Insurance
(4) Changes in temporary differences and deferred tax assets (liabilities) for the years ended March 31, 2013 and 2012, are as follows: (in thousands of Korean won)
1) 2013
(*1) The Company did not recognize the deferred tax assets (liabilities) related to investments in subsidiaries and associates, except KOCREF CR-REIT 6 and 11, since it is not probable that the temporary differences can be realized.
23. Income Tax(1) Income tax expense for the years ended March 31, 2013 and 2012, consists of: (in thousands of Korean won)
(2) Deferred income taxes charged directly to the equity are as follows: (in thousands of Korean won)
(3) The reconciliation between income tax expense and accounting income before income tax expense for the years ended March 31, 2013 and 2012, follows: (in thousands of Korean won)
2013 2012
Current income taxes 108,529,485 102,402,941
Changes in deferred income taxes 38,651,874 42,198,283
Income taxes allocated directly to equity (38,157,009) (10,188,948)
Income Tax 109,024,350 134,412,276
2013 2012
Profit before income taxes 442,405,561 527,167,970
Income tax based on applicable statutory tax rate 106,600,146 127,112,649
Tax effects of : 2,424,204 7,299,627
Non taxable income (484,275) (532,987)
Expenses not deductible for tax purposes 1,318,168 1,058,271
Unrecognized deferred income tax (2,255,363) 5,090,541
Tax credit (2,020) (35,043)
Tax refunds (380,372) -
Others 4,228,066 1,718,845
Income tax expense 109,024,350 134,412,276
Beginning balances Income tax expenses Equity Ending balances
Income tax expenses
Financial asset at fair value through profit or loss (130,426) (424,105) - (554,531)
Investments in subsidiaries and associates 38,697 - - 38,697
Compensation receivables (6,480,846) (458,276) - (6,939,122)
Accrued receivable (20,474,505) (3,030,313) - (23,504,818)
Allowance for possible loan losses - - - -
Dormant claims recovered 5,519,267 2,216,905 - 7,736,172
Provions for restoration costs 373,888 8,508 - 382,396
Contingency reserve (109,313,339) (11,889,577) - (121,202,916)
Land (4,566,597) - - (4,566,597)
Impairment of available-for-sale financial assets 29,629,711 2,550,065 - 32,179,776
Depreciation 592,135 (3,472,562) - (2,880,427)
Gain (loss) on foreign currency (2,068,571) 3,508,803 - 1,440,232
Deposits insurance premium 2,695,268 951,251 - 3,646,519
Loss on revaluation of asset 1,240,521 - - 1,240,521
Other long-term employee benefits 5,226,628 1,992,085 - 7,218,713
Others (5,032,549) 7,552,350 - 2,519,801
(102,750,718) (494,866) - (103,245,584)
Equity
Change in value of available- for-sale financial assets (34,713,920) - (37,137,977) (71,851,897)
Gain (loss) on valuation of cash flow hedge derivatives 1,739,261 - (1,488,417) 250,844
Revaluation surplus (45,352,258) - 463,843 (44,888,415)
Revaluation reserve of asset (462,776) - - (462,776)
Others - - 5,542 5,542
(78,789,693) - (38,157,009) (116,946,702)
Total (181,540,411) (494,866) (38,157,009) (220,192,286)
Not recognized as deferred income tax assets(*1) 5,377,189 3,121,825
Recognized as deferred income tax assets (181,540,411) (220,192,286)
March 31, 2013 March 31,2012
Changes in value of available-for-sale financial assets (37,137,977) (5,412,628)
Changes in value of cash flow hedging instruments (1,488,417) (408,572)
Revaluation surplus 463,843 (4,126,463)
Revaluation reserves - (462,776)
Others 5,542 221,491
Total (38,157,009) (10,188,948)
Financial Issues
FY2012 Detailed report on management results
Audit report on financial statements
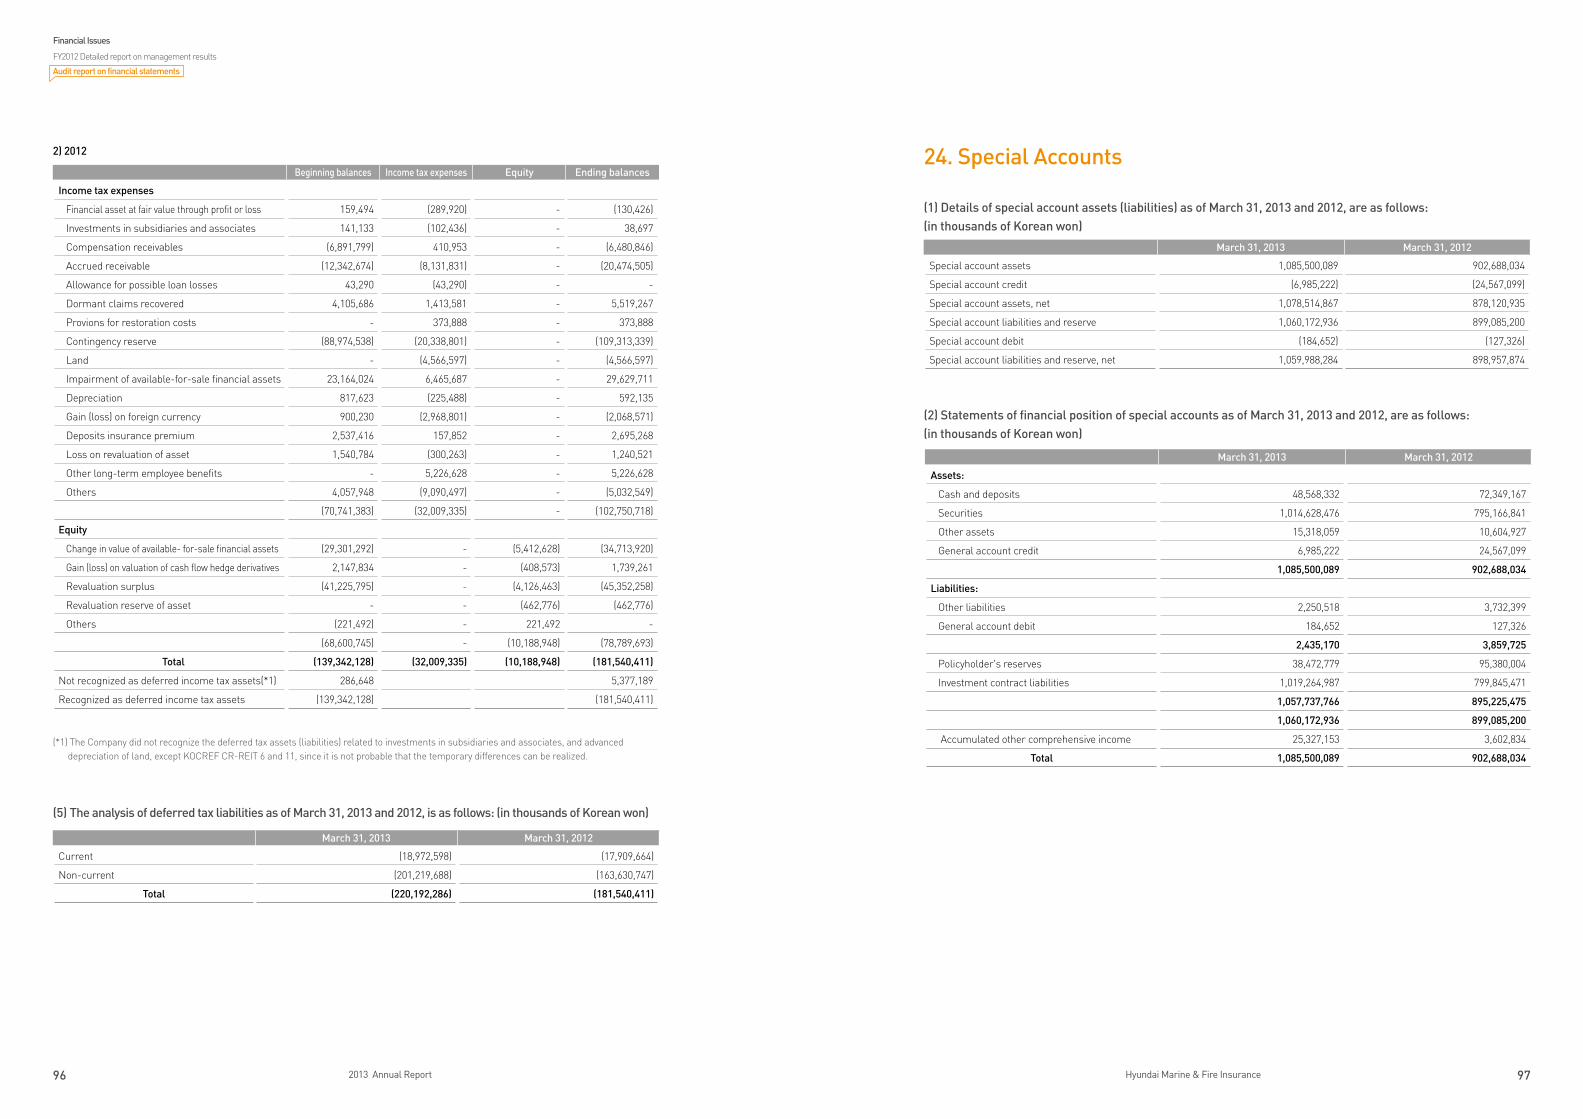
96 2013 Annual Report 97Hyundai Marine & Fire Insurance
24. Special Accounts
(1) Details of special account assets (liabilities) as of March 31, 2013 and 2012, are as follows: (in thousands of Korean won)
2) 2012
(*1) The Company did not recognize the deferred tax assets (liabilities) related to investments in subsidiaries and associates, and advanced depreciation of land, except KOCREF CR-REIT 6 and 11, since it is not probable that the temporary differences can be realized.
(5) The analysis of deferred tax liabilities as of March 31, 2013 and 2012, is as follows: (in thousands of Korean won)
Beginning balances Income tax expenses Equity Ending balances
Income tax expenses
Financial asset at fair value through profit or loss 159,494 (289,920) - (130,426)
Investments in subsidiaries and associates 141,133 (102,436) - 38,697
Compensation receivables (6,891,799) 410,953 - (6,480,846)
Accrued receivable (12,342,674) (8,131,831) - (20,474,505)
Allowance for possible loan losses 43,290 (43,290) - -
Dormant claims recovered 4,105,686 1,413,581 - 5,519,267
Provions for restoration costs - 373,888 - 373,888
Contingency reserve (88,974,538) (20,338,801) - (109,313,339)
Land - (4,566,597) - (4,566,597)
Impairment of available-for-sale financial assets 23,164,024 6,465,687 - 29,629,711
Depreciation 817,623 (225,488) - 592,135
Gain (loss) on foreign currency 900,230 (2,968,801) - (2,068,571)
Deposits insurance premium 2,537,416 157,852 - 2,695,268
Loss on revaluation of asset 1,540,784 (300,263) - 1,240,521
Other long-term employee benefits - 5,226,628 - 5,226,628
Others 4,057,948 (9,090,497) - (5,032,549)
(70,741,383) (32,009,335) - (102,750,718)
Equity
Change in value of available- for-sale financial assets (29,301,292) - (5,412,628) (34,713,920)
Gain (loss) on valuation of cash flow hedge derivatives 2,147,834 - (408,573) 1,739,261
Revaluation surplus (41,225,795) - (4,126,463) (45,352,258)
Revaluation reserve of asset - - (462,776) (462,776)
Others (221,492) - 221,492 -
(68,600,745) - (10,188,948) (78,789,693)
Total (139,342,128) (32,009,335) (10,188,948) (181,540,411)
Not recognized as deferred income tax assets(*1) 286,648 5,377,189
Recognized as deferred income tax assets (139,342,128) (181,540,411)
March 31, 2013 March 31, 2012
Current (18,972,598) (17,909,664)
Non-current (201,219,688) (163,630,747)
Total (220,192,286) (181,540,411)
March 31, 2013 March 31, 2012
Special account assets 1,085,500,089 902,688,034
Special account credit (6,985,222) (24,567,099)
Special account assets, net 1,078,514,867 878,120,935
Special account liabilities and reserve 1,060,172,936 899,085,200
Special account debit (184,652) (127,326)
Special account liabilities and reserve, net 1,059,988,284 898,957,874
(2) Statements of financial position of special accounts as of March 31, 2013 and 2012, are as follows:(in thousands of Korean won)
March 31, 2013 March 31, 2012
Assets:
Cash and deposits 48,568,332 72,349,167
Securities 1,014,628,476 795,166,841
Other assets 15,318,059 10,604,927
General account credit 6,985,222 24,567,099
1,085,500,089 902,688,034
Liabilities:
Other liabilities 2,250,518 3,732,399
General account debit 184,652 127,326
2,435,170 3,859,725
Policyholder's reserves 38,472,779 95,380,004
Investment contract liabilities 1,019,264,987 799,845,471
1,057,737,766 895,225,475
1,060,172,936 899,085,200
Accumulated other comprehensive income 25,327,153 3,602,834
Total 1,085,500,089 902,688,034
Financial Issues
FY2012 Detailed report on management results
Audit report on financial statements
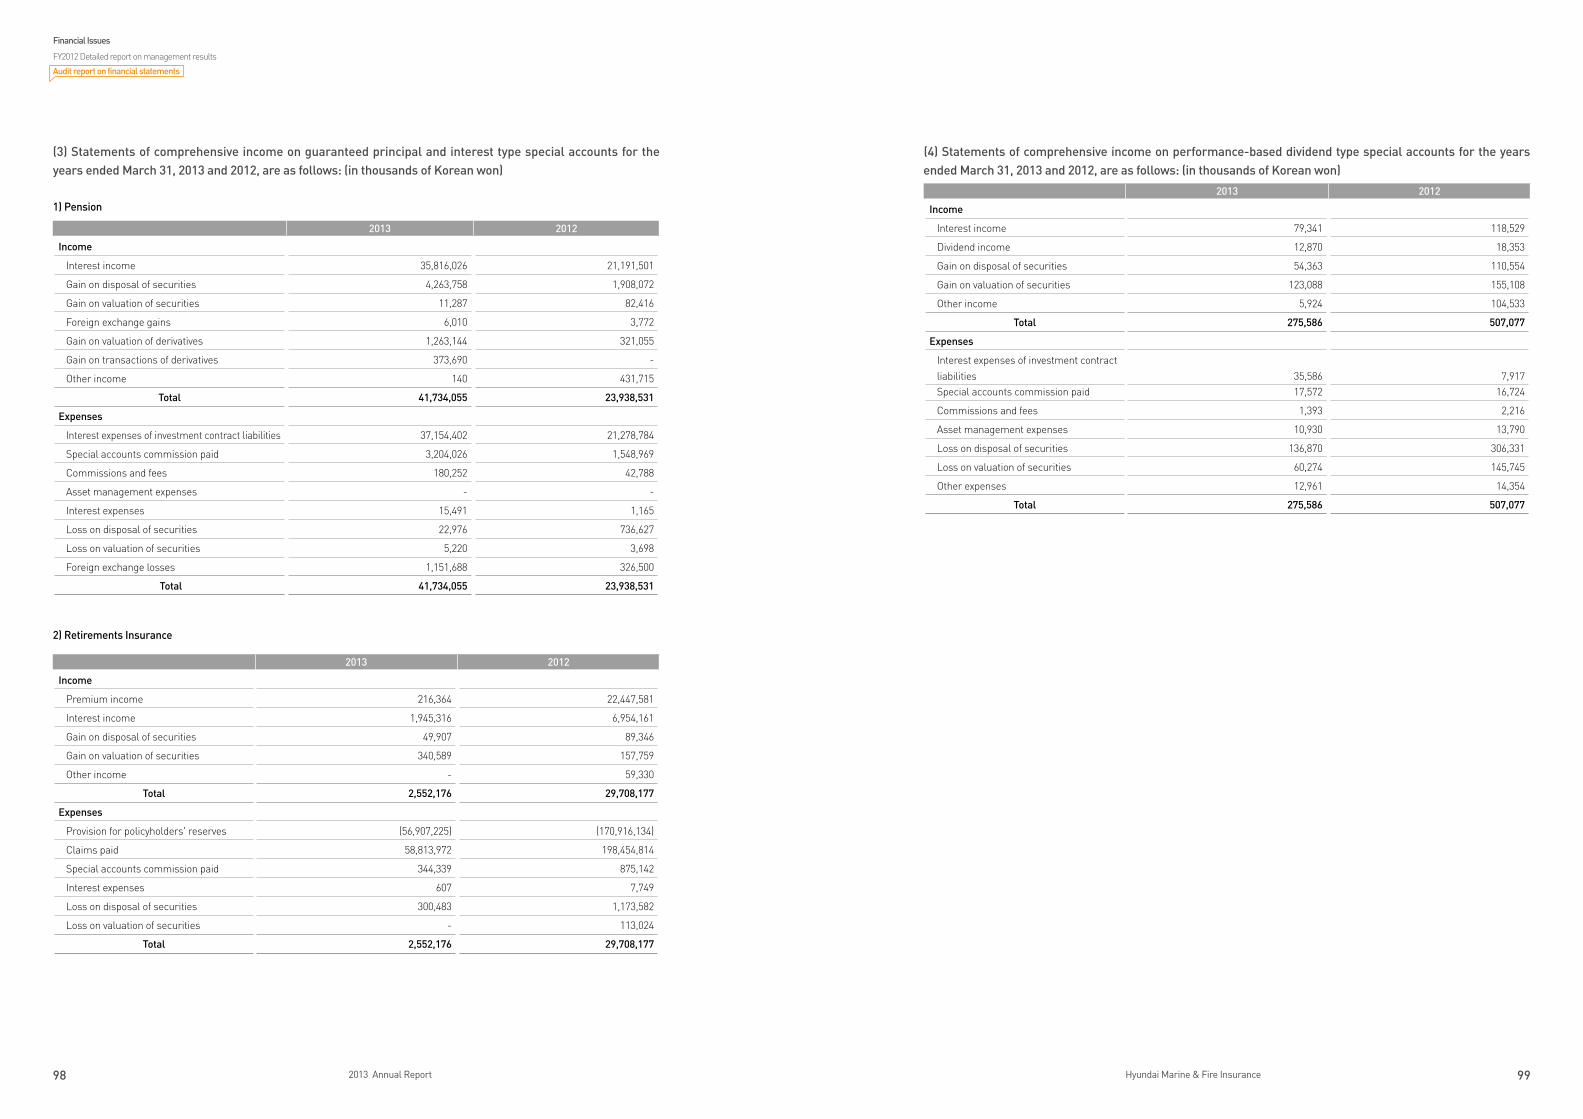
98 2013 Annual Report 99Hyundai Marine & Fire Insurance
(3) Statements of comprehensive income on guaranteed principal and interest type special accounts for the years ended March 31, 2013 and 2012, are as follows: (in thousands of Korean won)
1) Pension
2) Retirements Insurance
2013 2012
Income
Interest income 35,816,026 21,191,501
Gain on disposal of securities 4,263,758 1,908,072
Gain on valuation of securities 11,287 82,416
Foreign exchange gains 6,010 3,772
Gain on valuation of derivatives 1,263,144 321,055
Gain on transactions of derivatives 373,690 -
Other income 140 431,715
Total 41,734,055 23,938,531
Expenses
Interest expenses of investment contract liabilities 37,154,402 21,278,784
Special accounts commission paid 3,204,026 1,548,969
Commissions and fees 180,252 42,788
Asset management expenses - -
Interest expenses 15,491 1,165
Loss on disposal of securities 22,976 736,627
Loss on valuation of securities 5,220 3,698
Foreign exchange losses 1,151,688 326,500
Total 41,734,055 23,938,531
2013 2012
Income
Premium income 216,364 22,447,581
Interest income 1,945,316 6,954,161
Gain on disposal of securities 49,907 89,346
Gain on valuation of securities 340,589 157,759
Other income - 59,330
Total 2,552,176 29,708,177
Expenses
Provision for policyholders' reserves (56,907,225) (170,916,134)
Claims paid 58,813,972 198,454,814
Special accounts commission paid 344,339 875,142
Interest expenses 607 7,749
Loss on disposal of securities 300,483 1,173,582
Loss on valuation of securities - 113,024
Total 2,552,176 29,708,177
(4) Statements of comprehensive income on performance-based dividend type special accounts for the years ended March 31, 2013 and 2012, are as follows: (in thousands of Korean won)
2013 2012
Income
Interest income 79,341 118,529
Dividend income 12,870 18,353
Gain on disposal of securities 54,363 110,554
Gain on valuation of securities 123,088 155,108
Other income 5,924 104,533
Total 275,586 507,077
Expenses
Interest expenses of investment contract liabilities 35,586 7,917Special accounts commission paid 17,572 16,724
Commissions and fees 1,393 2,216
Asset management expenses 10,930 13,790
Loss on disposal of securities 136,870 306,331
Loss on valuation of securities 60,274 145,745
Other expenses 12,961 14,354
Total 275,586 507,077
Financial Issues
FY2012 Detailed report on management results
Audit report on financial statements
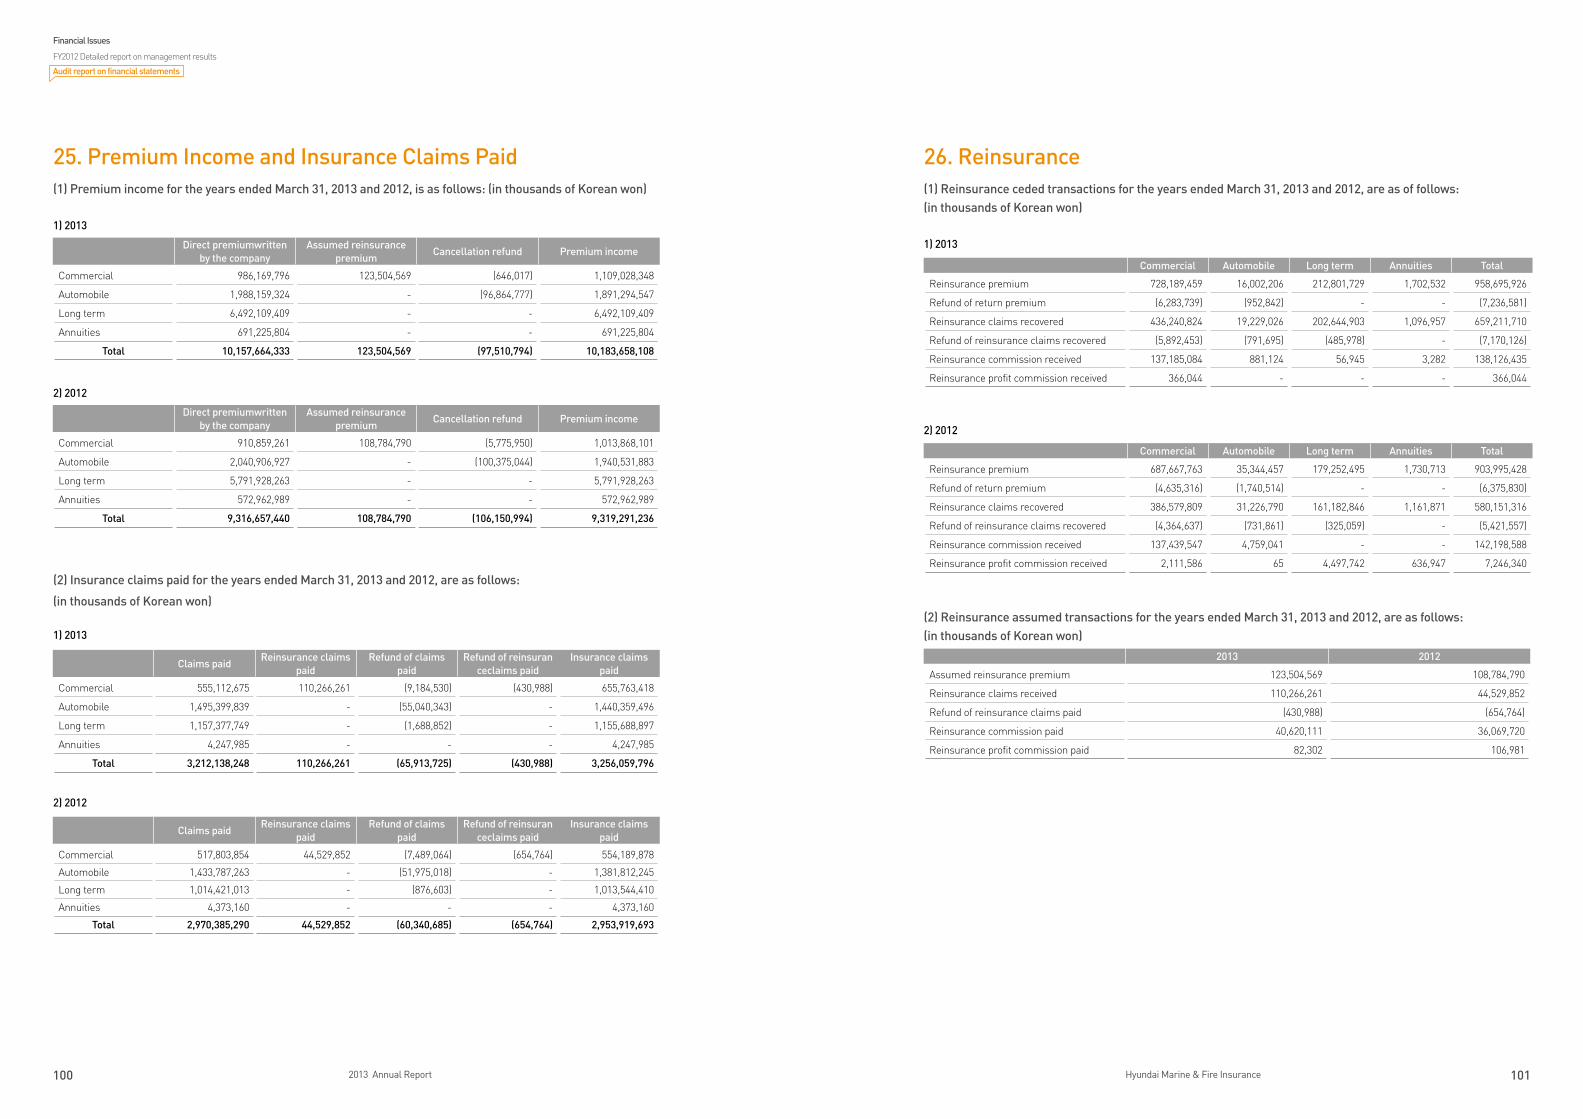
100 2013 Annual Report 101Hyundai Marine & Fire Insurance
26. Reinsurance(1) Reinsurance ceded transactions for the years ended March 31, 2013 and 2012, are as of follows:(in thousands of Korean won)
1) 2013
2) 2012
(2) Reinsurance assumed transactions for the years ended March 31, 2013 and 2012, are as follows:(in thousands of Korean won)
25. Premium Income and Insurance Claims Paid(1) Premium income for the years ended March 31, 2013 and 2012, is as follows: (in thousands of Korean won)
1) 2013
2) 2012
(2) Insurance claims paid for the years ended March 31, 2013 and 2012, are as follows:
(in thousands of Korean won)
1) 2013
2) 2012
Claims paidReinsurance claims
paidRefund of claims
paidRefund of reinsuran
ceclaims paidInsurance claims
paid
Commercial 555,112,675 110,266,261 (9,184,530) (430,988) 655,763,418
Automobile 1,495,399,839 - (55,040,343) - 1,440,359,496
Long term 1,157,377,749 - (1,688,852) - 1,155,688,897
Annuities 4,247,985 - - - 4,247,985
Total 3,212,138,248 110,266,261 (65,913,725) (430,988) 3,256,059,796
Claims paidReinsurance claims
paidRefund of claims
paidRefund of reinsuran
ceclaims paidInsurance claims
paid
Commercial 517,803,854 44,529,852 (7,489,064) (654,764) 554,189,878
Automobile 1,433,787,263 - (51,975,018) - 1,381,812,245
Long term 1,014,421,013 - (876,603) - 1,013,544,410
Annuities 4,373,160 - - - 4,373,160
Total 2,970,385,290 44,529,852 (60,340,685) (654,764) 2,953,919,693
Commercial Automobile Long term Annuities Total
Reinsurance premium 728,189,459 16,002,206 212,801,729 1,702,532 958,695,926
Refund of return premium (6,283,739) (952,842) - - (7,236,581)
Reinsurance claims recovered 436,240,824 19,229,026 202,644,903 1,096,957 659,211,710
Refund of reinsurance claims recovered (5,892,453) (791,695) (485,978) - (7,170,126)
Reinsurance commission received 137,185,084 881,124 56,945 3,282 138,126,435
Reinsurance profit commission received 366,044 - - - 366,044
Commercial Automobile Long term Annuities Total
Reinsurance premium 687,667,763 35,344,457 179,252,495 1,730,713 903,995,428
Refund of return premium (4,635,316) (1,740,514) - - (6,375,830)
Reinsurance claims recovered 386,579,809 31,226,790 161,182,846 1,161,871 580,151,316
Refund of reinsurance claims recovered (4,364,637) (731,861) (325,059) - (5,421,557)
Reinsurance commission received 137,439,547 4,759,041 - - 142,198,588
Reinsurance profit commission received 2,111,586 65 4,497,742 636,947 7,246,340
2013 2012
Assumed reinsurance premium 123,504,569 108,784,790
Reinsurance claims received 110,266,261 44,529,852
Refund of reinsurance claims paid (430,988) (654,764)
Reinsurance commission paid 40,620,111 36,069,720
Reinsurance profit commission paid 82,302 106,981
Direct premiumwritten by the company
Assumed reinsurance premium
Cancellation refund Premium income
Commercial 986,169,796 123,504,569 (646,017) 1,109,028,348
Automobile 1,988,159,324 - (96,864,777) 1,891,294,547
Long term 6,492,109,409 - - 6,492,109,409
Annuities 691,225,804 - - 691,225,804
Total 10,157,664,333 123,504,569 (97,510,794) 10,183,658,108
Direct premiumwritten by the company
Assumed reinsurance premium
Cancellation refund Premium income
Commercial 910,859,261 108,784,790 (5,775,950) 1,013,868,101
Automobile 2,040,906,927 - (100,375,044) 1,940,531,883
Long term 5,791,928,263 - - 5,791,928,263
Annuities 572,962,989 - - 572,962,989
Total 9,316,657,440 108,784,790 (106,150,994) 9,319,291,236
Financial Issues
FY2012 Detailed report on management results
Audit report on financial statements
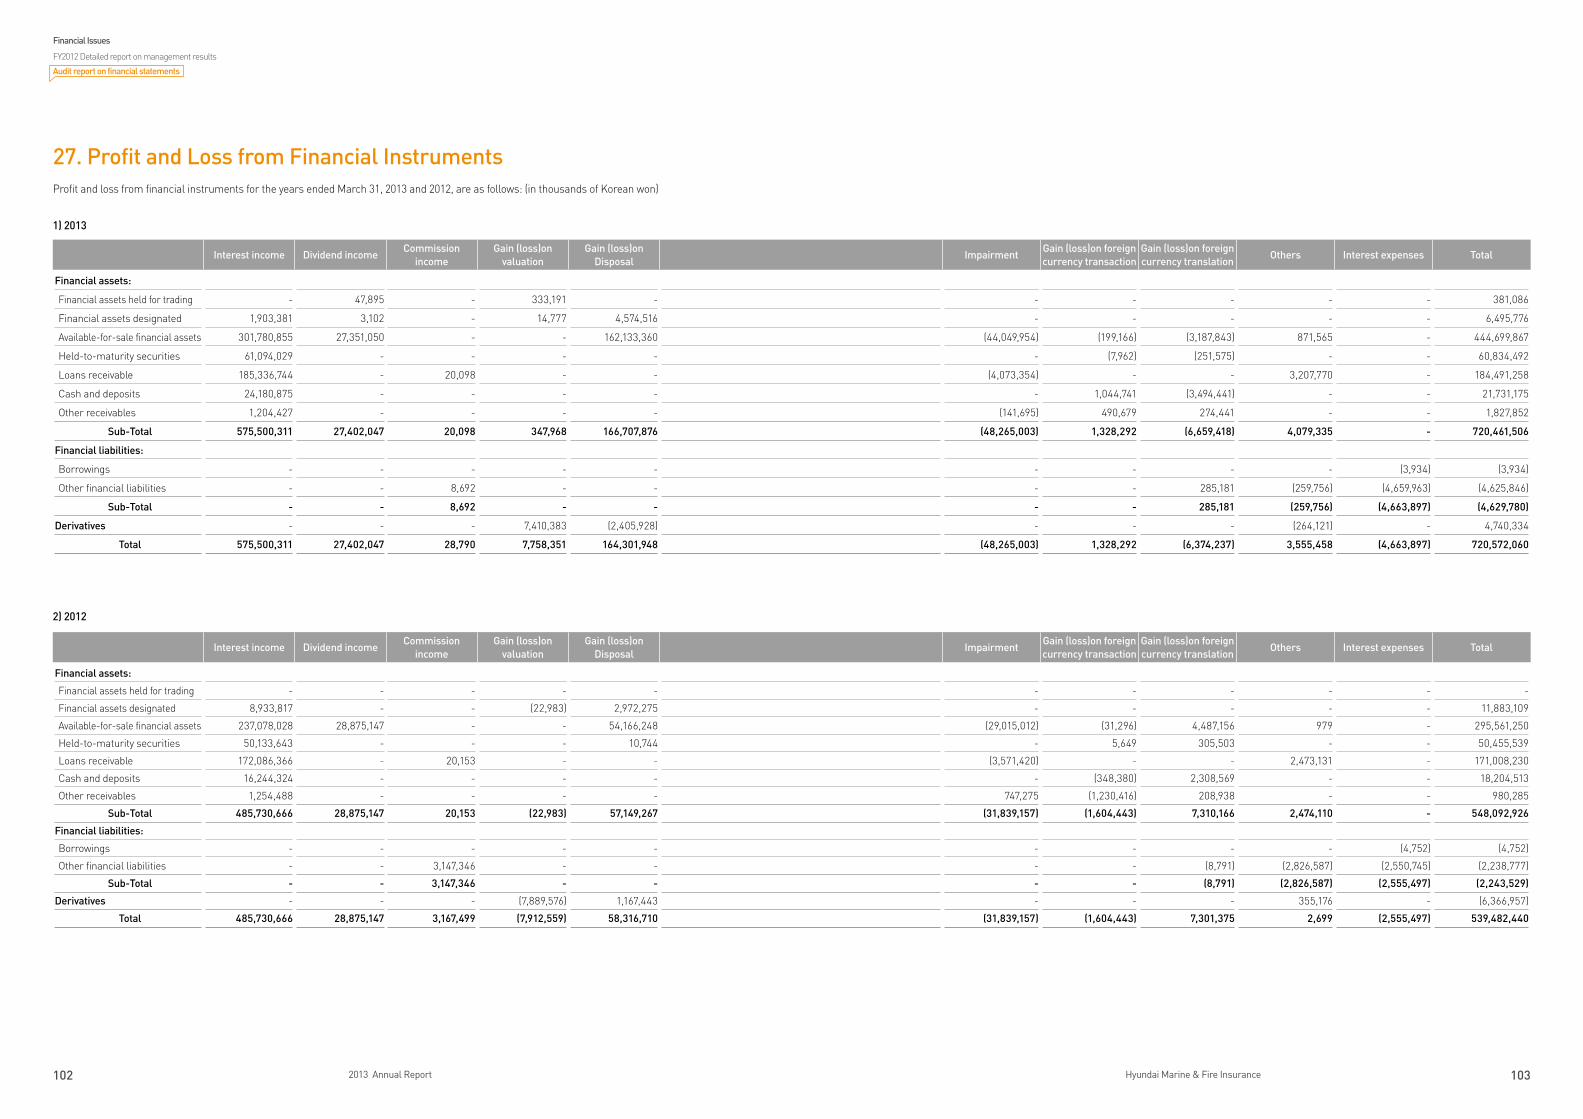
102 2013 Annual Report 103Hyundai Marine & Fire Insurance
27. Profit and Loss from Financial InstrumentsProfit and loss from financial instruments for the years ended March 31, 2013 and 2012, are as follows: (in thousands of Korean won)
1) 2013
2) 2012
Interest income Dividend incomeCommission
incomeGain (loss)on
valuationGain (loss)on
DisposalImpairment
Gain (loss)on foreign currency transaction
Gain (loss)on foreign currency translation
Others Interest expenses Total
Financial assets:
Financial assets held for trading - - - - - - - - - - -
Financial assets designated 8,933,817 - - (22,983) 2,972,275 - - - - - 11,883,109
Available-for-sale financial assets 237,078,028 28,875,147 - - 54,166,248 (29,015,012) (31,296) 4,487,156 979 - 295,561,250
Held-to-maturity securities 50,133,643 - - - 10,744 - 5,649 305,503 - - 50,455,539
Loans receivable 172,086,366 - 20,153 - - (3,571,420) - - 2,473,131 - 171,008,230
Cash and deposits 16,244,324 - - - - - (348,380) 2,308,569 - - 18,204,513
Other receivables 1,254,488 - - - - 747,275 (1,230,416) 208,938 - - 980,285
Sub-Total 485,730,666 28,875,147 20,153 (22,983) 57,149,267 (31,839,157) (1,604,443) 7,310,166 2,474,110 - 548,092,926
Financial liabilities:
Borrowings - - - - - - - - - (4,752) (4,752)
Other financial liabilities - - 3,147,346 - - - - (8,791) (2,826,587) (2,550,745) (2,238,777)
Sub-Total - - 3,147,346 - - - - (8,791) (2,826,587) (2,555,497) (2,243,529)
Derivatives - - - (7,889,576) 1,167,443 - - - 355,176 - (6,366,957)
Total 485,730,666 28,875,147 3,167,499 (7,912,559) 58,316,710 (31,839,157) (1,604,443) 7,301,375 2,699 (2,555,497) 539,482,440
Interest income Dividend incomeCommission
incomeGain (loss)on
valuationGain (loss)on
DisposalImpairment
Gain (loss)on foreign currency transaction
Gain (loss)on foreign currency translation
Others Interest expenses Total
Financial assets:
Financial assets held for trading - 47,895 - 333,191 - - - - - - 381,086
Financial assets designated 1,903,381 3,102 - 14,777 4,574,516 - - - - - 6,495,776
Available-for-sale financial assets 301,780,855 27,351,050 - - 162,133,360 (44,049,954) (199,166) (3,187,843) 871,565 - 444,699,867
Held-to-maturity securities 61,094,029 - - - - - (7,962) (251,575) - - 60,834,492
Loans receivable 185,336,744 - 20,098 - - (4,073,354) - - 3,207,770 - 184,491,258
Cash and deposits 24,180,875 - - - - - 1,044,741 (3,494,441) - - 21,731,175
Other receivables 1,204,427 - - - - (141,695) 490,679 274,441 - - 1,827,852
Sub-Total 575,500,311 27,402,047 20,098 347,968 166,707,876 (48,265,003) 1,328,292 (6,659,418) 4,079,335 - 720,461,506
Financial liabilities:
Borrowings - - - - - - - - - (3,934) (3,934)
Other financial liabilities - - 8,692 - - - - 285,181 (259,756) (4,659,963) (4,625,846)
Sub-Total - - 8,692 - - - - 285,181 (259,756) (4,663,897) (4,629,780)
Derivatives - - - 7,410,383 (2,405,928) - - - (264,121) - 4,740,334
Total 575,500,311 27,402,047 28,790 7,758,351 164,301,948 (48,265,003) 1,328,292 (6,374,237) 3,555,458 (4,663,897) 720,572,060
Financial Issues
FY2012 Detailed report on management results
Audit report on financial statements
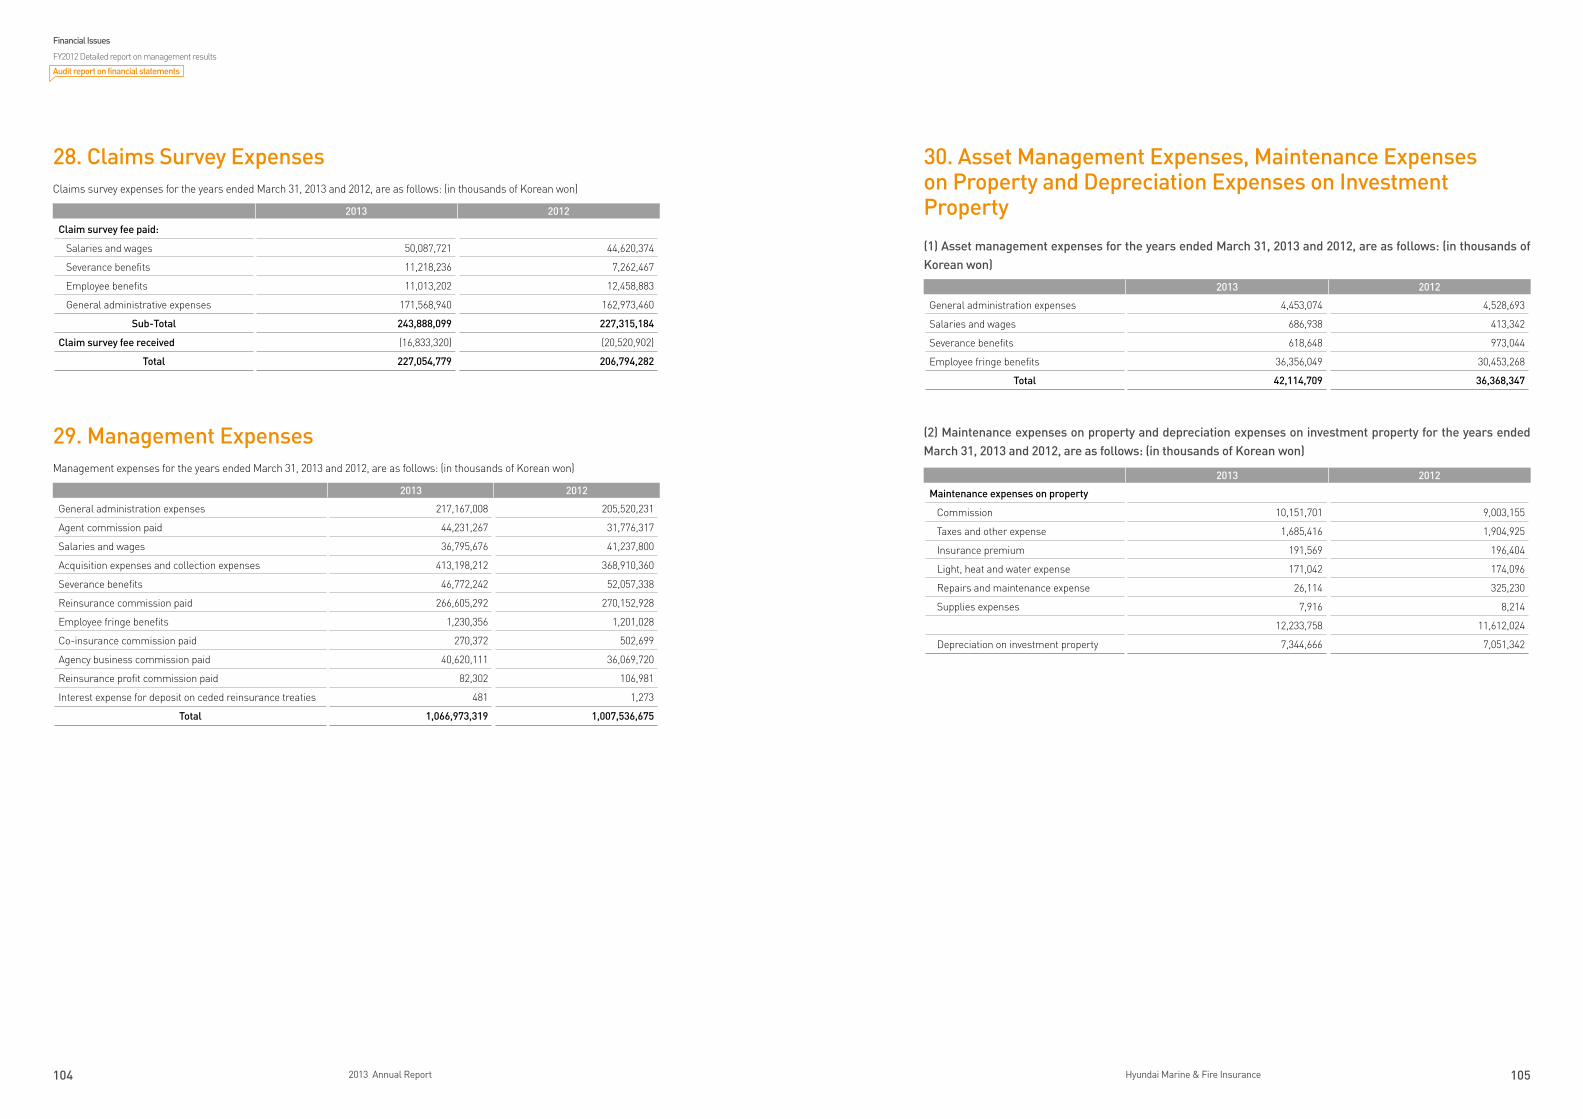
104 2013 Annual Report 105Hyundai Marine & Fire Insurance
30. Asset Management Expenses, Maintenance Expenses on Property and Depreciation Expenses on InvestmentProperty
(1) Asset management expenses for the years ended March 31, 2013 and 2012, are as follows: (in thousands of Korean won)
(2) Maintenance expenses on property and depreciation expenses on investment property for the years ended March 31, 2013 and 2012, are as follows: (in thousands of Korean won)
28. Claims Survey ExpensesClaims survey expenses for the years ended March 31, 2013 and 2012, are as follows: (in thousands of Korean won)
29. Management ExpensesManagement expenses for the years ended March 31, 2013 and 2012, are as follows: (in thousands of Korean won)
2013 2012
Claim survey fee paid:
Salaries and wages 50,087,721 44,620,374
Severance benefits 11,218,236 7,262,467
Employee benefits 11,013,202 12,458,883
General administrative expenses 171,568,940 162,973,460
Sub-Total 243,888,099 227,315,184
Claim survey fee received (16,833,320) (20,520,902)
Total 227,054,779 206,794,282
2013 2012
General administration expenses 217,167,008 205,520,231
Agent commission paid 44,231,267 31,776,317
Salaries and wages 36,795,676 41,237,800
Acquisition expenses and collection expenses 413,198,212 368,910,360
Severance benefits 46,772,242 52,057,338
Reinsurance commission paid 266,605,292 270,152,928
Employee fringe benefits 1,230,356 1,201,028
Co-insurance commission paid 270,372 502,699
Agency business commission paid 40,620,111 36,069,720
Reinsurance profit commission paid 82,302 106,981
Interest expense for deposit on ceded reinsurance treaties 481 1,273
Total 1,066,973,319 1,007,536,675
2013 2012
General administration expenses 4,453,074 4,528,693
Salaries and wages 686,938 413,342
Severance benefits 618,648 973,044
Employee fringe benefits 36,356,049 30,453,268
Total 42,114,709 36,368,347
2013 2012
Maintenance expenses on property
Commission 10,151,701 9,003,155
Taxes and other expense 1,685,416 1,904,925
Insurance premium 191,569 196,404
Light, heat and water expense 171,042 174,096
Repairs and maintenance expense 26,114 325,230
Supplies expenses 7,916 8,214
12,233,758 11,612,024
Depreciation on investment property 7,344,666 7,051,342
Financial Issues
FY2012 Detailed report on management results
Audit report on financial statements
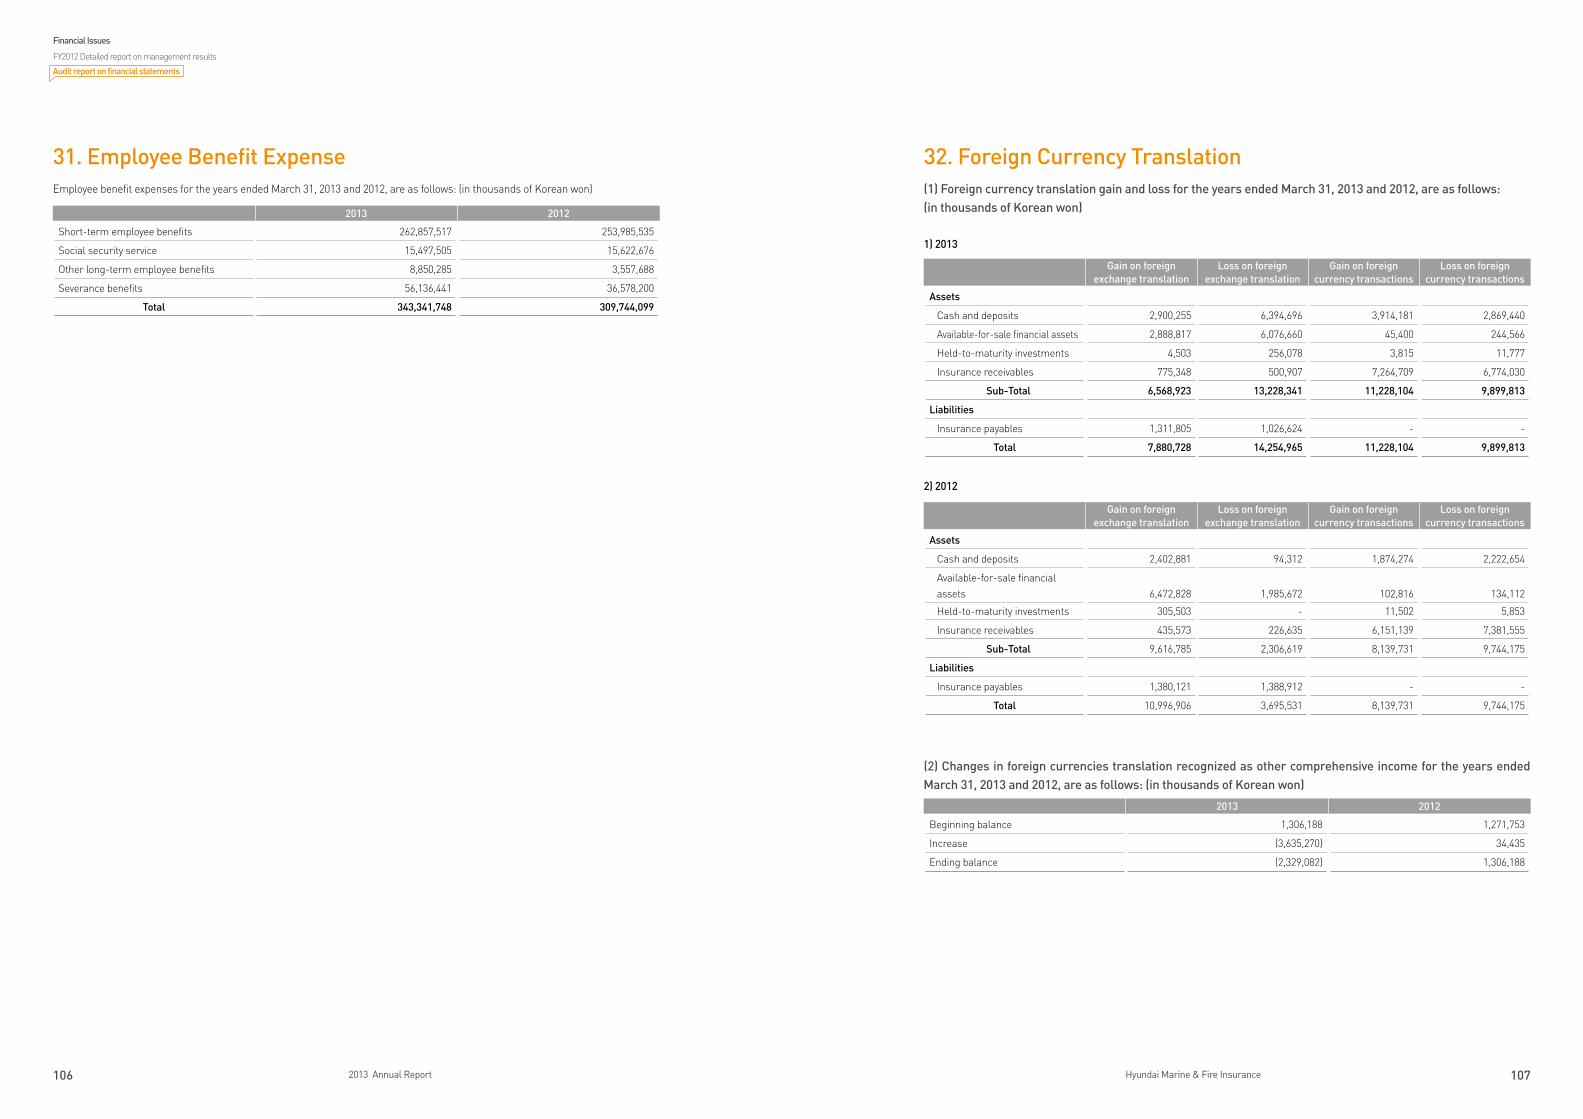
106 2013 Annual Report 107Hyundai Marine & Fire Insurance
32. Foreign Currency Translation(1) Foreign currency translation gain and loss for the years ended March 31, 2013 and 2012, are as follows:(in thousands of Korean won)
1) 2013
2) 2012
(2) Changes in foreign currencies translation recognized as other comprehensive income for the years ended March 31, 2013 and 2012, are as follows: (in thousands of Korean won)
31. Employee Benefit ExpenseEmployee benefit expenses for the years ended March 31, 2013 and 2012, are as follows: (in thousands of Korean won)
2013 2012
Short-term employee benefits 262,857,517 253,985,535
Social security service 15,497,505 15,622,676
Other long-term employee benefits 8,850,285 3,557,688
Severance benefits 56,136,441 36,578,200
Total 343,341,748 309,744,099
2013 2012
Beginning balance 1,306,188 1,271,753
Increase (3,635,270) 34,435
Ending balance (2,329,082) 1,306,188
Gain on foreign exchange translation
Loss on foreign exchange translation
Gain on foreign currency transactions
Loss on foreign currency transactions
Assets
Cash and deposits 2,900,255 6,394,696 3,914,181 2,869,440
Available-for-sale financial assets 2,888,817 6,076,660 45,400 244,566
Held-to-maturity investments 4,503 256,078 3,815 11,777
Insurance receivables 775,348 500,907 7,264,709 6,774,030
Sub-Total 6,568,923 13,228,341 11,228,104 9,899,813
Liabilities
Insurance payables 1,311,805 1,026,624 - -
Total 7,880,728 14,254,965 11,228,104 9,899,813
Gain on foreign exchange translation
Loss on foreign exchange translation
Gain on foreign currency transactions
Loss on foreign currency transactions
Assets
Cash and deposits 2,402,881 94,312 1,874,274 2,222,654
Available-for-sale financial assets 6,472,828 1,985,672 102,816 134,112
Held-to-maturity investments 305,503 - 11,502 5,853
Insurance receivables 435,573 226,635 6,151,139 7,381,555
Sub-Total 9,616,785 2,306,619 8,139,731 9,744,175
Liabilities
Insurance payables 1,380,121 1,388,912 - -
Total 10,996,906 3,695,531 8,139,731 9,744,175
Financial Issues
FY2012 Detailed report on management results
Audit report on financial statements
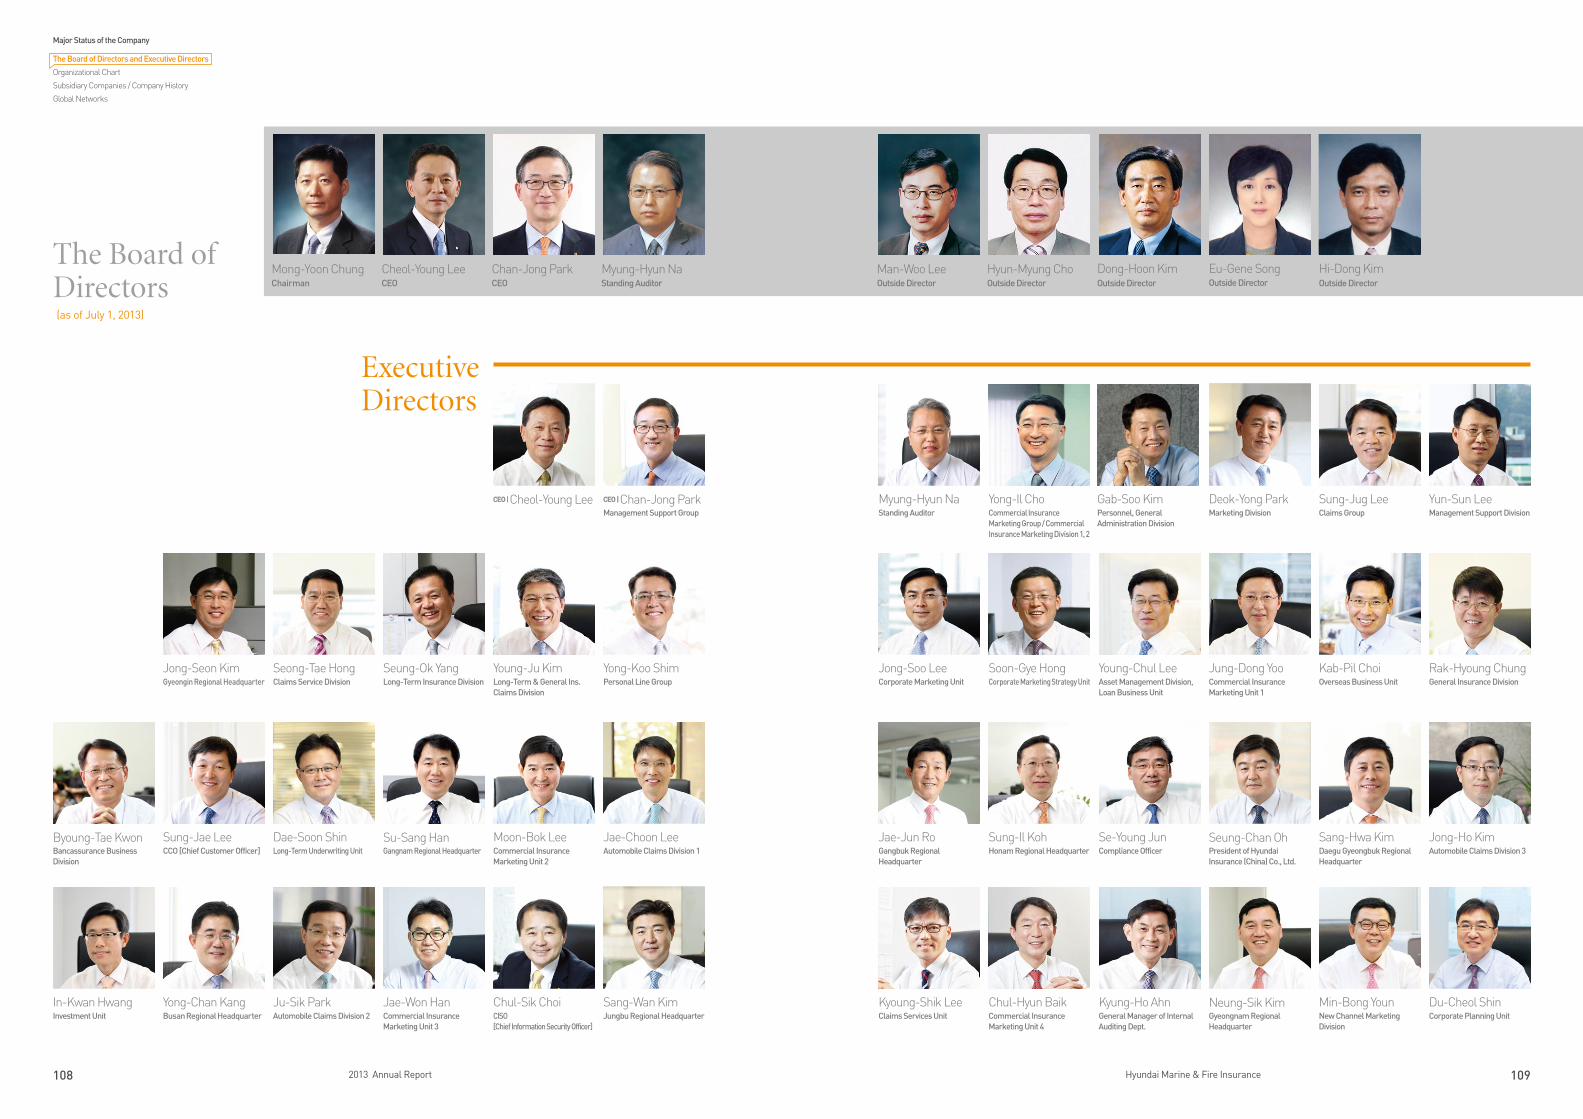
108 2013 Annual Report 109Hyundai Marine & Fire Insurance
Executive Directors
Man-Woo Lee
Outside DirectorHyun-Myung Cho
Outside DirectorDong-Hoon Kim Outside Director
Eu-Gene SongOutside Director
Hi-Dong Kim Outside Director
Myung-Hyun Na
Standing Auditor Mong-Yoon Chung
ChairmanCheol-Young LeeCEO
Chan-Jong ParkCEO
Byoung-Tae KwonBancassurance Business Division
Jae-Choon Lee Automobile Claims Division 1
Sung-Jae LeeCCO [Chief Customer Officer]
Jong-Soo LeeCorporate Marketing Unit
Soon-Gye HongCorporate Marketing Strategy Unit
Young-Chul Lee Asset Management Division, Loan Business Unit
Jung-Dong YooCommercial Insurance Marketing Unit 1
Kab-Pil ChoiOverseas Business Unit
Rak-Hyoung Chung General Insurance Division
Jong-Seon KimGyeongin Regional Headquarter
Seong-Tae HongClaims Service Division
Seung-Ok Yang Long-Term Insurance Division
Young-Ju Kim Long-Term & General Ins. Claims Division
Yong-Koo ShimPersonal Line Group
Moon-Bok LeeCommercial Insurance Marketing Unit 2
Dae-Soon ShinLong-Term Underwriting Unit
Su-Sang HanGangnam Regional Headquarter
Jae-Jun RoGangbuk Regional Headquarter
Sung-Il Koh Honam Regional Headquarter
Se-Young JunCompliance Officer
Seung-Chan OhPresident of Hyundai Insurance (China) Co., Ltd.
Sang-Hwa Kim Daegu Gyeongbuk Regional Headquarter
Sang-Wan KimJungbu Regional Headquarter
Kyoung-Shik LeeClaims Services Unit
Chul-Hyun BaikCommercial Insurance Marketing Unit 4
Kyung-Ho AhnGeneral Manager of Internal Auditing Dept.
Jong-Ho KimAutomobile Claims Division 3
Neung-Sik KimGyeongnam Regional Headquarter
Min-Bong YounNew Channel Marketing Division
Du-Cheol ShinCorporate Planning Unit
Chul-Sik Choi CISO [Chief Information Security Officer]
In-Kwan HwangInvestment Unit
Yong-Chan Kang Busan Regional Headquarter
Ju-Sik ParkAutomobile Claims Division 2
Jae-Won HanCommercial Insurance Marketing Unit 3
Yong-Il Cho Commercial Insurance Marketing Group / Commercial Insurance Marketing Division 1, 2
Myung-Hyun Na Standing Auditor
Deok-Yong Park Marketing Division
Gab-Soo KimPersonnel, General Administration Division
Sung-Jug LeeClaims Group
Yun-Sun LeeManagement Support Division
CEO | Cheol-Young Lee CEO | Chan-Jong Park Management Support Group
The Board of Directors(as of July 1, 2013)
Major Status of the Company
The Board of Directors and Executive Directors
Organizational Chart
Subsidiary Companies / Company History
Global Networks
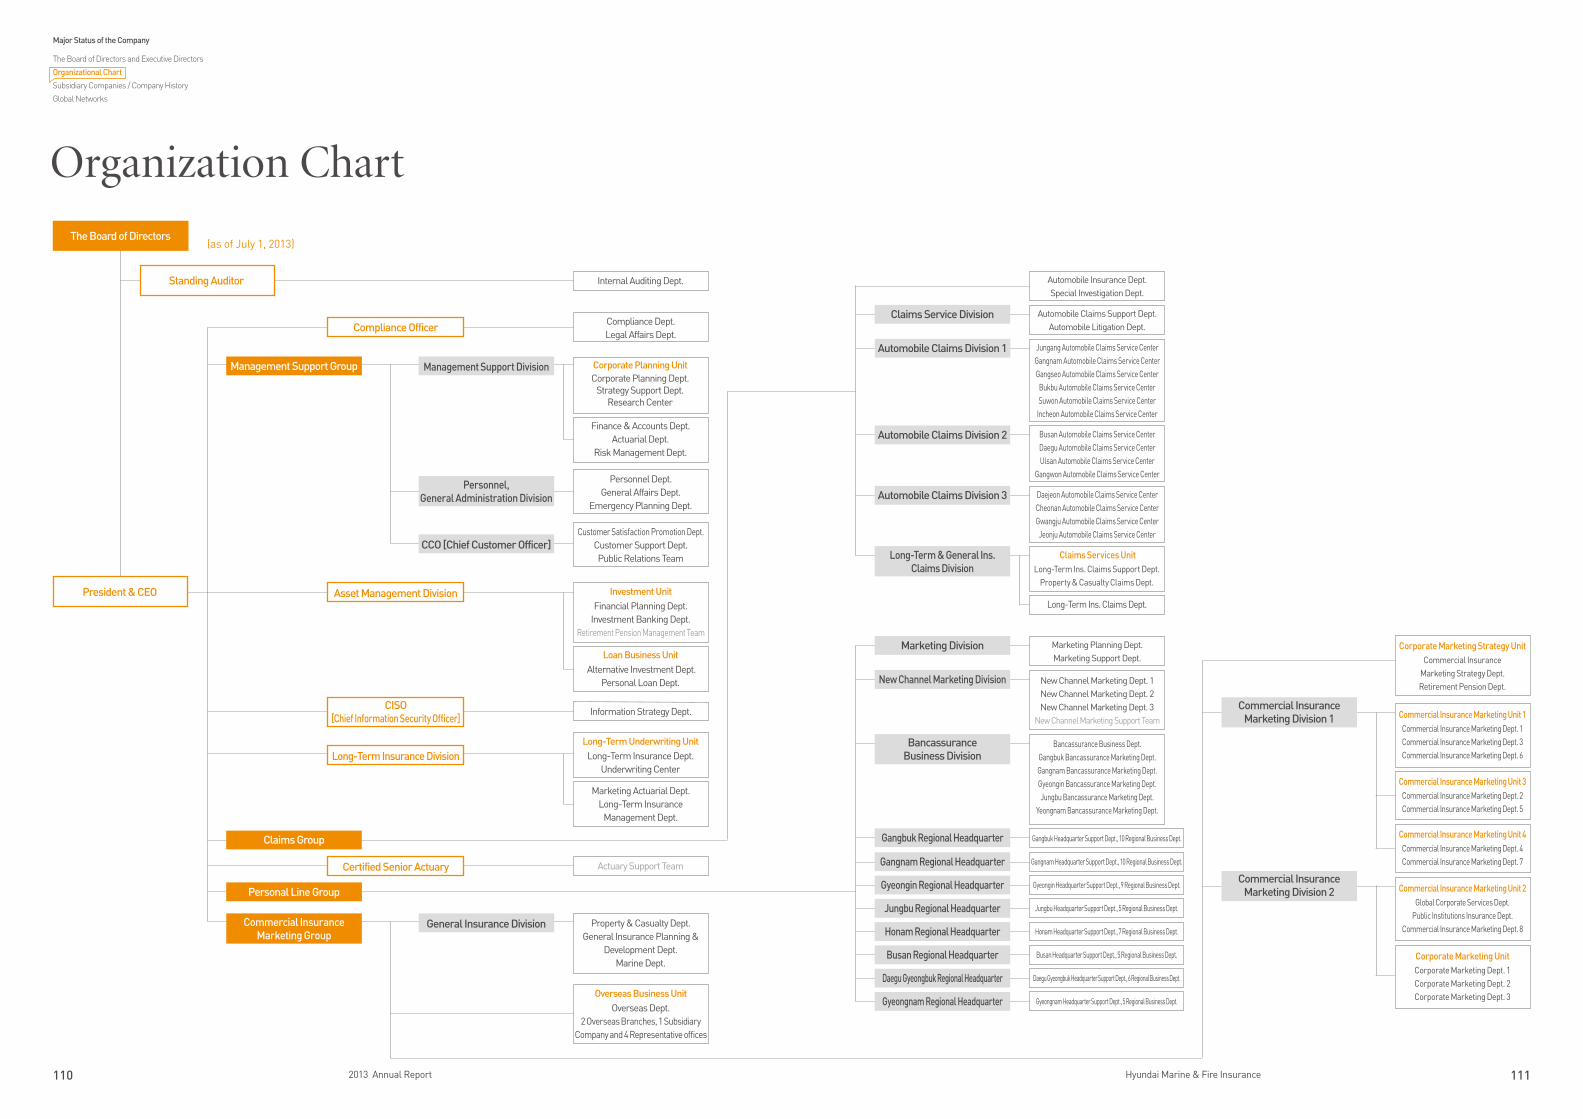
110 2013 Annual Report 111Hyundai Marine & Fire Insurance
Certified Senior Actuary Actuary Support Team
Organization Chart
(as of July 1, 2013) The Board of Directors
Standing Auditor
Compliance Officer Compliance Dept.Legal Affairs Dept.
Internal Auditing Dept.
Claims Group
Personal Line Group
Automobile Claims Division 3 Daejeon Automobile Claims Service CenterCheonan Automobile Claims Service CenterGwangju Automobile Claims Service CenterJeonju Automobile Claims Service Center
Automobile Insurance Dept.Special Investigation Dept.
Claims Service Division Automobile Claims Support Dept.Automobile Litigation Dept.
Automobile Claims Division 1 Jungang Automobile Claims Service CenterGangnam Automobile Claims Service CenterGangseo Automobile Claims Service CenterBukbu Automobile Claims Service CenterSuwon Automobile Claims Service CenterIncheon Automobile Claims Service Center
Automobile Claims Division 2 Busan Automobile Claims Service CenterDaegu Automobile Claims Service CenterUlsan Automobile Claims Service Center
Gangwon Automobile Claims Service Center
Long-Term & General Ins. Claims Division
General Insurance Division
Overseas Business UnitOverseas Dept.
2 Overseas Branches, 1 Subsidiary Company and 4 Representative offices
Property & Casualty Dept.General Insurance Planning &
Development Dept.Marine Dept.
Commercial Insurance Marketing Group
Marketing Division Marketing Planning Dept.Marketing Support Dept.
New Channel Marketing Division New Channel Marketing Dept. 1New Channel Marketing Dept. 2New Channel Marketing Dept. 3
New Channel Marketing Support Team
Bancassurance Business Division
Bancassurance Business Dept.Gangbuk Bancassurance Marketing Dept.Gangnam Bancassurance Marketing Dept.Gyeongin Bancassurance Marketing Dept.Jungbu Bancassurance Marketing Dept.
Yeongnam Bancassurance Marketing Dept.
Gangbuk Regional Headquarter Gangbuk Headquarter Support Dept., 10 Regional Business Dept.
Gangnam Headquarter Support Dept., 10 Regional Business Dept.Gangnam Regional Headquarter
Gyeongin Headquarter Support Dept., 9 Regional Business Dept.Gyeongin Regional Headquarter
Jungbu Regional Headquarter Jungbu Headquarter Support Dept., 5 Regional Business Dept.
Honam Regional Headquarter Honam Headquarter Support Dept., 7 Regional Business Dept.
Busan Regional Headquarter Busan Headquarter Support Dept., 5 Regional Business Dept.
Daegu Gyeongbuk Regional Headquarter Daegu Gyeongbuk Headquarter Support Dept., 6 Regional Business Dept.
Gyeongnam Regional Headquarter Gyeongnam Headquarter Support Dept., 5 Regional Business Dept.
Commercial Insurance Marketing Division 1 Commercial Insurance Marketing Unit 1
Commercial Insurance Marketing Dept. 1Commercial Insurance Marketing Dept. 3Commercial Insurance Marketing Dept. 6
Commercial Insurance Marketing Unit 3Commercial Insurance Marketing Dept. 2Commercial Insurance Marketing Dept. 5
Commercial Insurance Marketing Unit 4Commercial Insurance Marketing Dept. 4Commercial Insurance Marketing Dept. 7
Commercial Insurance Marketing Unit 2Global Corporate Services Dept.
Public Institutions Insurance Dept.Commercial Insurance Marketing Dept. 8
Corporate Marketing UnitCorporate Marketing Dept. 1Corporate Marketing Dept. 2Corporate Marketing Dept. 3
Corporate Marketing Strategy UnitCommercial Insurance
Marketing Strategy Dept.Retirement Pension Dept.
Long-Term Insurance DivisionLong-Term Underwriting UnitLong-Term Insurance Dept.
Underwriting Center
Loan Business Unit Alternative Investment Dept.
Personal Loan Dept.
Marketing Actuarial Dept.Long-Term Insurance
Management Dept.
Claims Services UnitLong-Term Ins. Claims Support Dept.
Property & Casualty Claims Dept.
Long-Term Ins. Claims Dept.Asset Management Division
Management Support Group Management Support Division
Personnel,General Administration Division
Personnel Dept.General Affairs Dept.
Emergency Planning Dept.
Customer Satisfaction Promotion Dept.Customer Support Dept.Public Relations Team
CCO [Chief Customer Officer]
CISO [Chief Information Security Officer]
Information Strategy Dept.
Finance & Accounts Dept.Actuarial Dept.
Risk Management Dept.
Corporate Planning UnitCorporate Planning Dept.
Strategy Support Dept.Research Center
Investment UnitFinancial Planning Dept.
Investment Banking Dept.Retirement Pension Management Team
President & CEO
Commercial Insurance Marketing Division 2
Major Status of the Company
The Board of Directors and Executive Directors
Organizational Chart
Subsidiary Companies / Company History
Global Networks
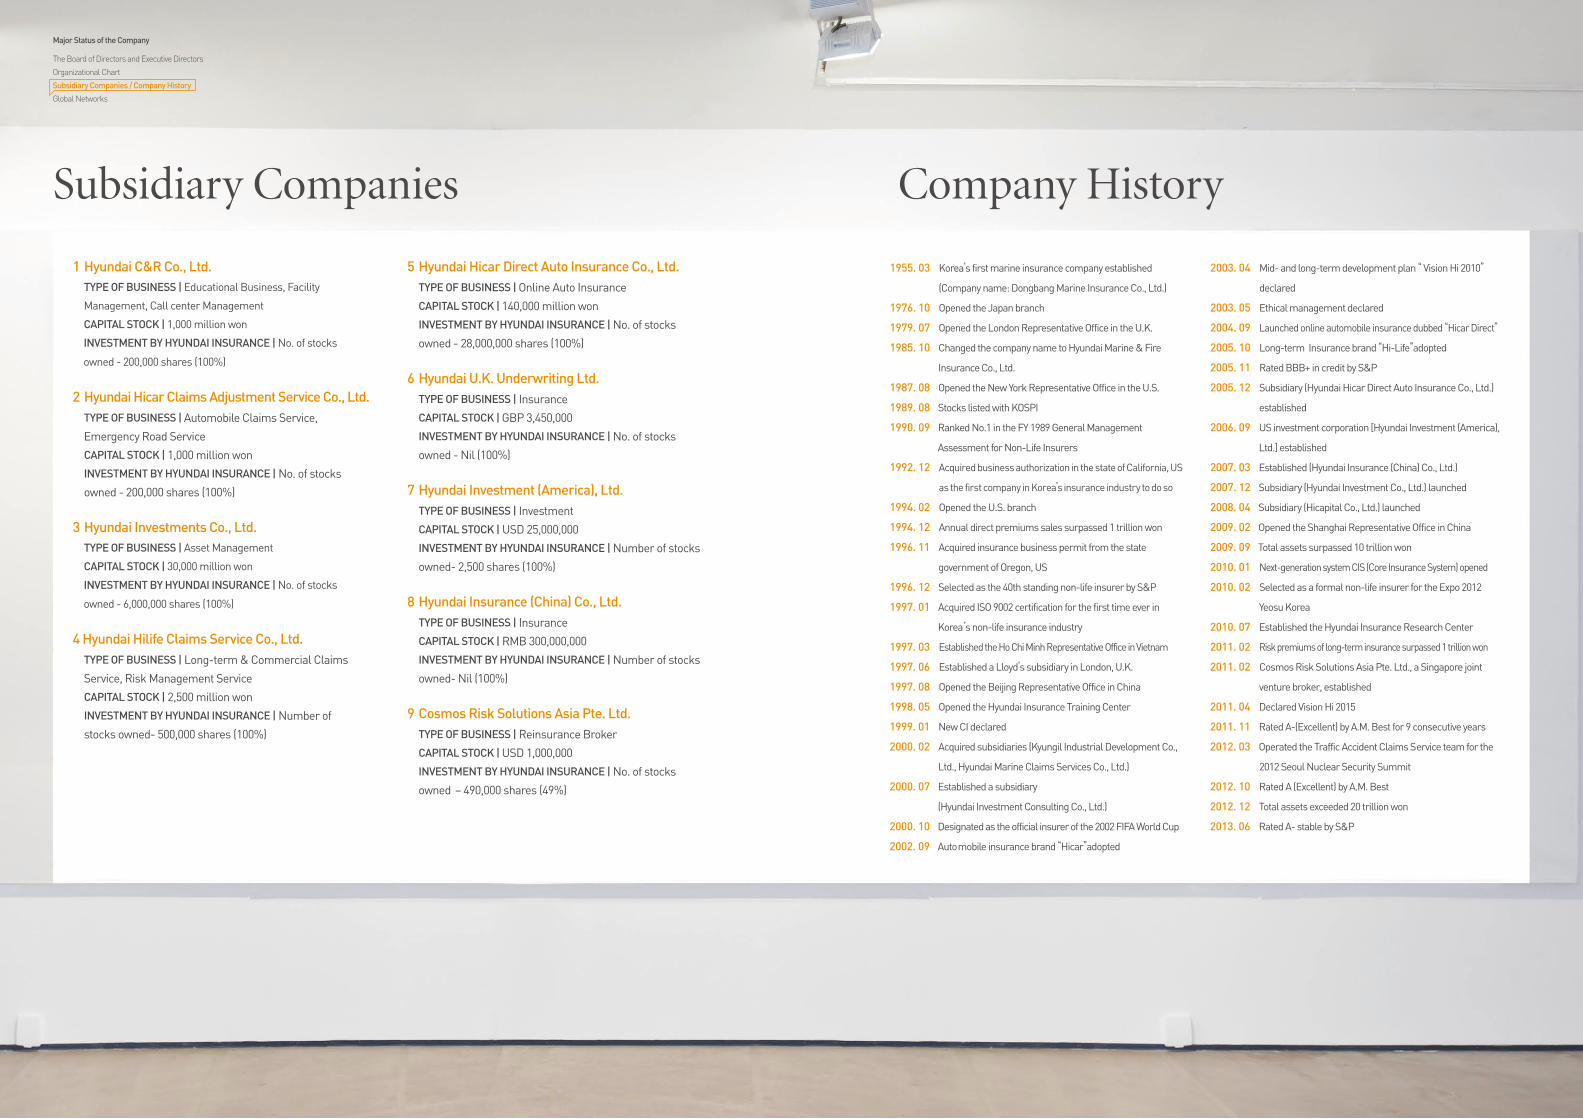
112 2013 Annual Report 113Hyundai Marine & Fire Insurance
5 Hyundai Hicar Direct Auto Insurance Co., Ltd. TYPE OF BUSINESS | Online Auto Insurance
CAPITAL STOCK | 140,000 million won
INVESTMENT BY HYUNDAI INSURANCE | No. of stocks
owned - 28,000,000 shares (100%)
6 Hyundai U.K. Underwriting Ltd. TYPE OF BUSINESS | Insurance
CAPITAL STOCK | GBP 3,450,000
INVESTMENT BY HYUNDAI INSURANCE | No. of stocks
owned - Nil (100%)
7 Hyundai Investment (America), Ltd. TYPE OF BUSINESS | Investment
CAPITAL STOCK | USD 25,000,000
INVESTMENT BY HYUNDAI INSURANCE | Number of stocks
owned- 2,500 shares (100%)
8 Hyundai Insurance (China) Co., Ltd. TYPE OF BUSINESS | Insurance
CAPITAL STOCK | RMB 300,000,000
INVESTMENT BY HYUNDAI INSURANCE | Number of stocks
owned- Nil (100%)
9 Cosmos Risk Solutions Asia Pte. Ltd. TYPE OF BUSINESS | Reinsurance Broker
CAPITAL STOCK | USD 1,000,000
INVESTMENT BY HYUNDAI INSURANCE | No. of stocks
owned – 490,000 shares (49%)
1 Hyundai C&R Co., Ltd. TYPE OF BUSINESS | Educational Business, Facility
Management, Call center Management
CAPITAL STOCK | 1,000 million won
INVESTMENT BY HYUNDAI INSURANCE | No. of stocks
owned - 200,000 shares (100%)
2 Hyundai Hicar Claims Adjustment Service Co., Ltd. TYPE OF BUSINESS | Automobile Claims Service,
Emergency Road Service
CAPITAL STOCK | 1,000 million won
INVESTMENT BY HYUNDAI INSURANCE | No. of stocks
owned - 200,000 shares (100%)
3 Hyundai Investments Co., Ltd. TYPE OF BUSINESS | Asset Management
CAPITAL STOCK | 30,000 million won
INVESTMENT BY HYUNDAI INSURANCE | No. of stocks
owned - 6,000,000 shares (100%)
4 Hyundai Hilife Claims Service Co., Ltd. TYPE OF BUSINESS | Long-term & Commercial Claims
Service, Risk Management Service
CAPITAL STOCK | 2,500 million won
INVESTMENT BY HYUNDAI INSURANCE | Number of
stocks owned- 500,000 shares (100%)
Mid- and long-term development plan “ Vision Hi 2010”
declared
Ethical management declared
Launched online automobile insurance dubbed “Hicar Direct”
Long-term Insurance brand “Hi-Life”adopted
Rated BBB+ in credit by S&P
Subsidiary (Hyundai Hicar Direct Auto Insurance Co., Ltd.)
established
US investment corporation [Hyundai Investment (America),
Ltd.] established
Established (Hyundai Insurance (China) Co., Ltd.)
Subsidiary (Hyundai Investment Co., Ltd.) launched
Subsidiary (Hicapital Co., Ltd.) launched
Opened the Shanghai Representative Office in China
Total assets surpassed 10 trillion won
Next-generation system CIS (Core Insurance System) opened
Selected as a formal non-life insurer for the Expo 2012
Yeosu Korea
Established the Hyundai Insurance Research Center
Risk premiums of long-term insurance surpassed 1 trillion won
Cosmos Risk Solutions Asia Pte. Ltd., a Singapore joint
venture broker, established
Declared Vision Hi 2015
Rated A-(Excellent) by A.M. Best for 9 consecutive years
Operated the Traffic Accident Claims Service team for the
2012 Seoul Nuclear Security Summit
Rated A (Excellent) by A.M. Best
Total assets exceeded 20 trillion won
Rated A- stable by S&P
2003. 04
2003. 05
2004. 09
2005. 10
2005. 11
2005. 12
2006. 09
2007. 03
2007. 12
2008. 04
2009. 02
2009. 09
2010. 01
2010. 02
2010. 07
2011. 02
2011. 02
2011. 04
2011. 11
2012. 03
2012. 10
2012. 12
2013. 06
Korea’s first marine insurance company established
(Company name: Dongbang Marine Insurance Co., Ltd.)
Opened the Japan branch
Opened the London Representative Office in the U.K.
Changed the company name to Hyundai Marine & Fire
Insurance Co., Ltd.
Opened the New York Representative Office in the U.S.
Stocks listed with KOSPI
Ranked No.1 in the FY 1989 General Management
Assessment for Non-Life Insurers
Acquired business authorization in the state of California, US
as the first company in Korea’s insurance industry to do so
Opened the U.S. branch
Annual direct premiums sales surpassed 1 trillion won
Acquired insurance business permit from the state
government of Oregon, US
Selected as the 40th standing non-life insurer by S&P
Acquired ISO 9002 certification for the first time ever in
Korea’s non-life insurance industry
Established the Ho Chi Minh Representative Office in Vietnam
Established a Lloyd’s subsidiary in London, U.K.
Opened the Beijing Representative Office in China
Opened the Hyundai Insurance Training Center
New CI declared
Acquired subsidiaries (Kyungil Industrial Development Co.,
Ltd., Hyundai Marine Claims Services Co., Ltd.)
Established a subsidiary
(Hyundai Investment Consulting Co., Ltd.)
Designated as the official insurer of the 2002 FIFA World Cup
Automobile insurance brand “Hicar”adopted
1955. 03
1976. 10
1979. 07
1985. 10
1987. 08
1989. 08
1990. 09
1992. 12
1994. 02
1994. 12
1996. 11
1996. 12
1997. 01
1997. 03
1997. 06
1997. 08
1998. 05
1999. 01
2000. 02
2000. 07
2000. 10
2002. 09
Subsidiary Companies Company History
Major Status of the Company
The Board of Directors and Executive Directors
Organizational Chart
Subsidiary Companies / Company History
Global Networks
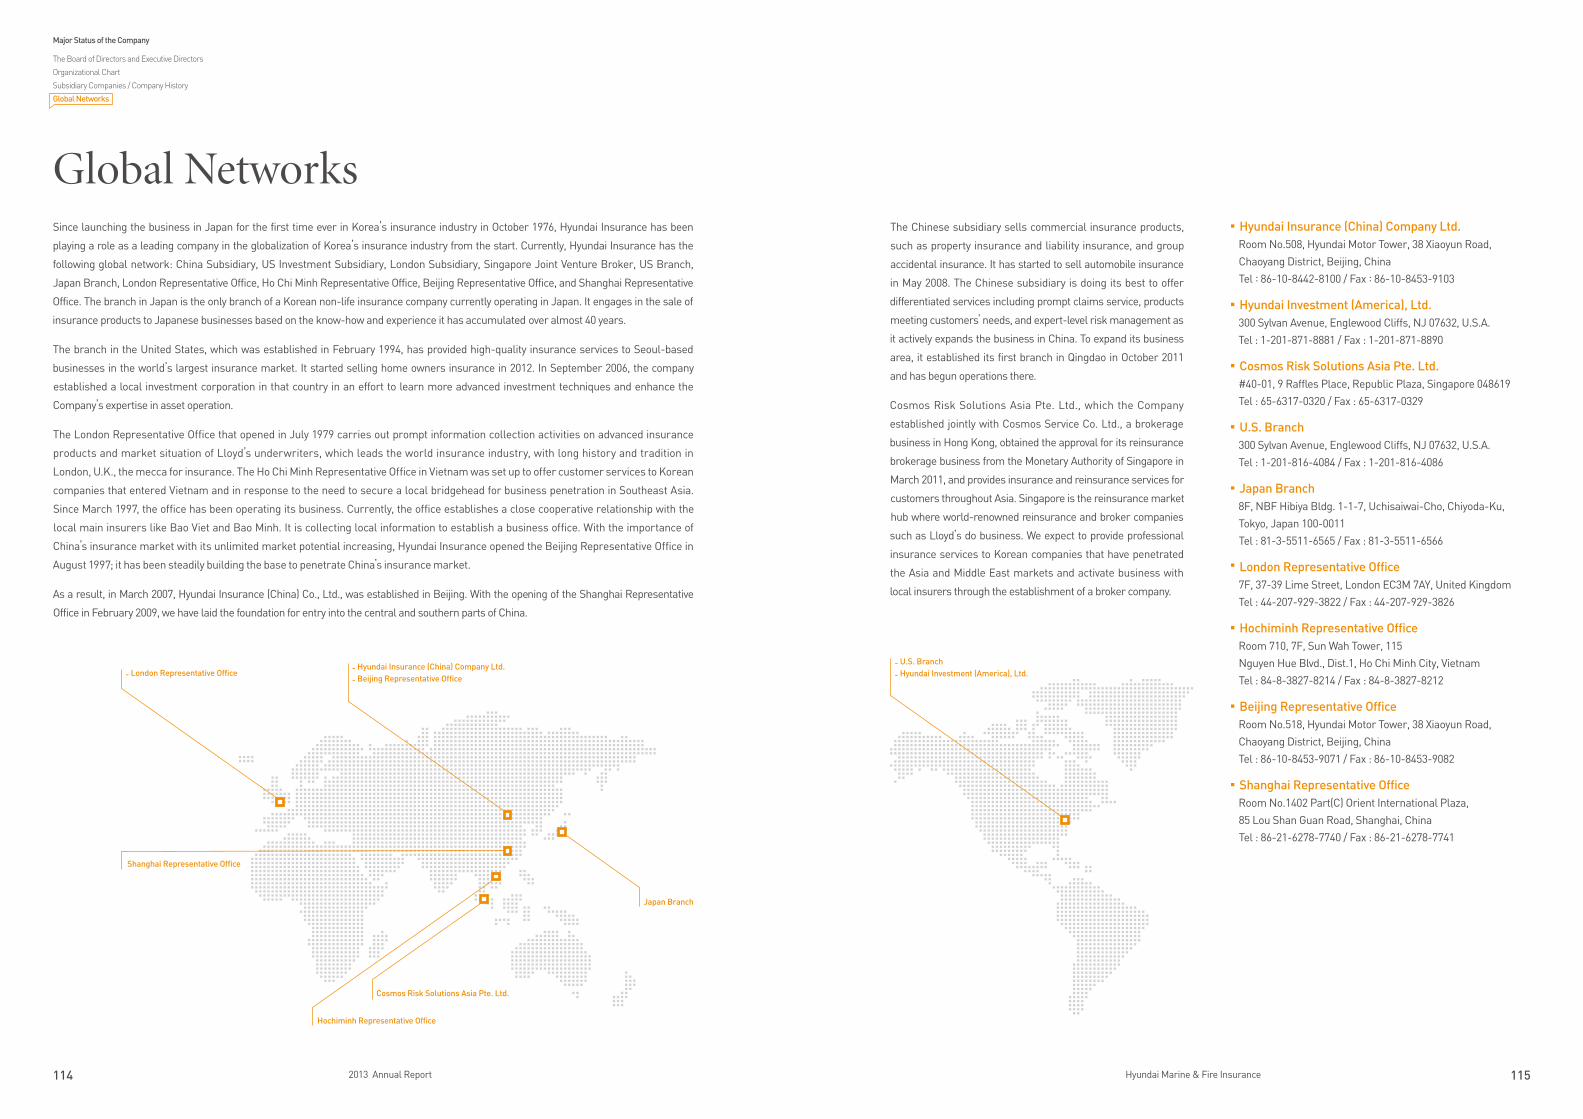
114 2013 Annual Report 115Hyundai Marine & Fire Insurance
Global NetworksSince launching the business in Japan for the first time ever in Korea’s insurance industry in October 1976, Hyundai Insurance has been
playing a role as a leading company in the globalization of Korea’s insurance industry from the start. Currently, Hyundai Insurance has the
following global network: China Subsidiary, US Investment Subsidiary, London Subsidiary, Singapore Joint Venture Broker, US Branch,
Japan Branch, London Representative Office, Ho Chi Minh Representative Office, Beijing Representative Office, and Shanghai Representative
Office. The branch in Japan is the only branch of a Korean non-life insurance company currently operating in Japan. It engages in the sale of
insurance products to Japanese businesses based on the know-how and experience it has accumulated over almost 40 years.
The branch in the United States, which was established in February 1994, has provided high-quality insurance services to Seoul-based
businesses in the world’s largest insurance market. It started selling home owners insurance in 2012. In September 2006, the company
established a local investment corporation in that country in an effort to learn more advanced investment techniques and enhance the
Company’s expertise in asset operation.
The London Representative Office that opened in July 1979 carries out prompt information collection activities on advanced insurance
products and market situation of Lloyd’s underwriters, which leads the world insurance industry, with long history and tradition in
London, U.K., the mecca for insurance. The Ho Chi Minh Representative Office in Vietnam was set up to offer customer services to Korean
companies that entered Vietnam and in response to the need to secure a local bridgehead for business penetration in Southeast Asia.
Since March 1997, the office has been operating its business. Currently, the office establishes a close cooperative relationship with the
local main insurers like Bao Viet and Bao Minh. It is collecting local information to establish a business office. With the importance of
China’s insurance market with its unlimited market potential increasing, Hyundai Insurance opened the Beijing Representative Office in
August 1997; it has been steadily building the base to penetrate China’s insurance market.
As a result, in March 2007, Hyundai Insurance (China) Co., Ltd., was established in Beijing. With the opening of the Shanghai Representative
Office in February 2009, we have laid the foundation for entry into the central and southern parts of China.
Japan Branch
Cosmos Risk Solutions Asia Pte. Ltd.
- Hyundai Insurance (China) Company Ltd.
- Beijing Representative Office- London Representative Office
Hochiminh Representative Office
Shanghai Representative Office
Major Status of the Company
The Board of Directors and Executive Directors
Organizational Chart
Subsidiary Companies / Company History
Global Networks
■ Hyundai Insurance (China) Company Ltd. Room No.508, Hyundai Motor Tower, 38 Xiaoyun Road,
Chaoyang District, Beijing, China
Tel : 86-10-8442-8100 / Fax : 86-10-8453-9103
■ Hyundai Investment (America), Ltd. 300 Sylvan Avenue, Englewood Cliffs, NJ 07632, U.S.A.
Tel : 1-201-871-8881 / Fax : 1-201-871-8890
■ Cosmos Risk Solutions Asia Pte. Ltd. #40-01, 9 Raffles Place, Republic Plaza, Singapore 048619
Tel : 65-6317-0320 / Fax : 65-6317-0329
■ U.S. Branch 300 Sylvan Avenue, Englewood Cliffs, NJ 07632, U.S.A.
Tel : 1-201-816-4084 / Fax : 1-201-816-4086
■ Japan Branch 8F, NBF Hibiya Bldg. 1-1-7, Uchisaiwai-Cho, Chiyoda-Ku,
Tokyo, Japan 100-0011
Tel : 81-3-5511-6565 / Fax : 81-3-5511-6566
■ London Representative Office 7F, 37-39 Lime Street, London EC3M 7AY, United Kingdom
Tel : 44-207-929-3822 / Fax : 44-207-929-3826
■ Hochiminh Representative Office Room 710, 7F, Sun Wah Tower, 115
Nguyen Hue Blvd., Dist.1, Ho Chi Minh City, Vietnam
Tel : 84-8-3827-8214 / Fax : 84-8-3827-8212
■ Beijing Representative Office Room No.518, Hyundai Motor Tower, 38 Xiaoyun Road,
Chaoyang District, Beijing, China
Tel : 86-10-8453-9071 / Fax : 86-10-8453-9082
■ Shanghai Representative Office Room No.1402 Part(C) Orient International Plaza,
85 Lou Shan Guan Road, Shanghai, China
Tel : 86-21-6278-7740 / Fax : 86-21-6278-7741
The Chinese subsidiary sells commercial insurance products,
such as property insurance and liability insurance, and group
accidental insurance. It has started to sell automobile insurance
in May 2008. The Chinese subsidiary is doing its best to offer
differentiated services including prompt claims service, products
meeting customers’ needs, and expert-level risk management as
it actively expands the business in China. To expand its business
area, it established its first branch in Qingdao in October 2011
and has begun operations there.
Cosmos Risk Solutions Asia Pte. Ltd., which the Company
established jointly with Cosmos Service Co. Ltd., a brokerage
business in Hong Kong, obtained the approval for its reinsurance
brokerage business from the Monetary Authority of Singapore in
March 2011, and provides insurance and reinsurance services for
customers throughout Asia. Singapore is the reinsurance market
hub where world-renowned reinsurance and broker companies
such as Lloyd’s do business. We expect to provide professional
insurance services to Korean companies that have penetrated
the Asia and Middle East markets and activate business with
local insurers through the establishment of a broker company.
- U.S. Branch
- Hyundai Investment (America), Ltd.