Embed Size (px)
Citation preview

2013 ANNUAL REPORT FINANCIAL AND CORPORATE RESPONSIBILITY PERFORMANCE
FOCUSED

COVER: Chongqing, located on the Yangtze River in Southwest China, is one of the world’s fastest-growing cities. With a population of 33 million and another half million arriving each year, it exemplifies the rapid urbanization taking place throughout the developing world. UTC companies are supporting this growth with high-performance, energy-efficient products for the commercial building industry. Otis is supplying elevators and escalators for the International Finance Centre, the city’s first premier office building to receive LEED Gold precertification. Carrier heating and air-conditioning systems are installed in the World Financial Center. And Chongqing’s metro lines are equipped with Carrier heating, ventilating and air-conditioning systems, Edwards fire detection and alarm systems, and Shengjie fire suppression systems.
INSIDE COVER: The Airbus A321 is powered by IAE V2500 engines and equipped with nacelles and more than a dozen systems from UTC Aerospace Systems, including flight controls, electric power, lighting, air data systems, ice detection, cockpit controls, and wheels and brakes. Our acquisition of Goodrich Corp. gives us the ability to provide more intelligent, fully integrated systems for our aerospace customers. Our majority interest in the IAE International Aero Engines AG collaboration strengthens our position in the commercial aerospace aftermarket. It also allows our customers to transition smoothly from the current V2500 engine to Pratt & Whitney’s PurePower engine for the new Airbus A320neo aircraft family.
United Technologies Corporation (UTC) provides a broad range of high-technology products and services for the aerospace and commercial building industries. Our aerospace businesses include Sikorsky helicopters, Pratt & Whitney aircraft engines and UTC Aerospace Systems. In 2013, we combined our commercial businesses to form UTC Building & Industrial Systems, the world’s largest provider of building technologies. It includes Otis elevators and escalators; Carrier heating, air-conditioning and refrigeration systems; and fire and security solutions from brands such as Kidde and Chubb.
To learn more, visit www.utc.com.
CONTENTS
02 Shareowner Letter
06 The Right Solutions
08 The Right People
10 The Right Approach
12 At a Glance
14 Business Highlights
19 Financials
43 Cautionary Note Concerning Factors That May Affect Future Results
82 Board of Directors
83 Leadership
84 Shareowner Information
Recognition, Our Commitments
Inside Back Cover

012013 Annual Report
By focusing on our core aerospace and building systems businesses, investing in game-changing technologies and continuing to expand our presence in emerging markets, we are well positioned to deliver strong growth in 2014 and well into the future.
DEAR SHAREOWNER
02 United Technologies Corporation
United Technologies delivered another strong performance in 2013, with double-digit earnings growth despite a weaker-than-expected economic recovery. The success of our portfolio transformation and our continued investments in game-changing technologies position us to accelerate growth, as does our ability to leverage our global scale to provide innovative solutions in our core aerospace and building systems markets. Our focused portfolio, combined with our relentless drive to reduce costs and increase productivity, set a strong foundation for delivering long-term shareowner value.
Across the company, there were many notable accomplishments in 2013. Among them was the successful integration of Goodrich and International Aero Engines. These transformational acquisitions are delivering better-than-expected results and have greatly improved our position in the high-growth commercial aerospace market. On the commercial side, Otis resumed organic growth and had a number of significant emerging market wins, including the Hyderabad Metro Rail Project, India’s largest single elevator and escalator contract ever; and the Goldin Finance 117 tower in Tianjin, China, which will feature the world’s longest single elevator hoistway.
UTC Climate, Controls & Security achieved its margin target two years ahead of schedule, unlocking synergies from the combination of Carrier and UTC Fire & Security. Notable CCS wins included the contract to provide security and access controls for the second phase of Galaxy Macau, one of Asia’s most popular resorts; fire protection systems for the Wuxi Metro Line in China’s Jiangsu Province; building monitoring and control systems for Intergate Manhattan in New York City, the world’s tallest data center; and energy-efficient HVAC systems and advanced CCTV and access control solutions for the new Midfield Concourse development at Hong Kong International Airport.
In 2013, we announced a tremendous new growth platform with the creation of UTC Building & Industrial Systems, combining Otis and UTC Climate, Controls & Security. This new organizational structure better positions us to capitalize on urbanization in emerging markets, where customers need customized, energy-efficient solutions incorporating multiple building systems and services.
We are also realizing the benefits of the UTC Propulsion & Aerospace Systems structure announced in 2011,
bringing together Pratt & Whitney and UTC Aerospace Systems to support customer demand for more integrated solutions. For example, Embraer selected UTC to provide a fully integrated propulsion system — engines, nacelles and controls — for its new E-Jet aircraft family. UTC Aerospace Systems was also selected as the sole provider of the E-Jet’s wheels, brakes and electrical system. These wins demonstrate the value of the Goodrich acquisition and highlight our potential to secure even greater content on new aircraft.
Sikorsky’s investment in X2 technology paved the way for its agreement with Boeing to pursue the Joint Multi-Role helicopter, the U.S. Army’s next-generation utility and attack helicopter program. Also positioning Sikorsky for growth is strong demand for its S-76D and S-92 helicopters, which have the range and capabilities to support offshore oil and gas exploration around the world.
Along with the company’s strong operating performance came solid cash generation, as cash flow from operations less capital expenditures again exceeded net income. As promised, we resumed our share repurchase program in 2013, buying back $1.2 billion of shares and bringing total share repurchase since 2007 to $12 billion.
In 2013, we increased our dividend by 10.3 percent and marked the 77th consecutive year of dividend payments to shareowners. United Technologies’ long-term total shareowner return continues to exceed that of our peers and key market indices. For the decade ending December 31, 2013, UTC delivered total shareowner return of 197 percent, almost twice that of the Dow Jones Industrials or S&P 500 index.

LOUIS R. CHÊNEVERT CHAIRMAN & CHIEF EXECUTIVE OFFICER
Louis Chênevert is shown here with the main landing gear for the Airbus A380 — the world’s largest commercial airliner — at the UTC Aerospace Systems facility in Oakville, Ontario.
032013 Annual Report

04 United Technologies Corporation
01 Cloud Cap HD TASE stabilized camera UTC AEROSPACE SYSTEMS
02 Goldie Srivastava UNITED TECHNOLOGIES New Delhi, India
03 PurePower PW1100G-JM engine
PRATT & WHITNEY
04 Haixia Lu OTIS Hangzhou, China
05 Christophe Marty UTC AEROSPACE SYSTEMS Toulouse, France
06 Sikorsky Autonomous Research Aircraft SIKORSKY
07 UT Electronic Controls UTC CLIMATE, CONTROLS
& SECURITY
08 Lakesha C. Etienne PRATT & WHITNEY West Palm Beach, Florida
09 Darrin Wong UTC AEROSPACE SYSTEMS Everett, Washington
10 NCE escalator OTIS
11 Stacy Sheard SIKORSKY Coatesville, Pennsylvania
12 Carrier CO2OLtec refrigeration system
CARRIER
13 UH-60M BLACK HAWK helicopter
SIKORSKY
14 Lu Jun CARRIER Hangzhou, China
15 PW127M engine PRATT & WHITNEY CANADA
568F propeller UTC AEROSPACE SYSTEMS
16 Kelvan Waters SIKORSKY West Palm Beach, Florida
Louis R. Chênevert Chairman & Chief Executive Officer
Looking ahead, United Technologies’ growth opportunities are truly remarkable, driven by two powerful megatrends: urbanization and the rapid growth in commercial aviation. Across emerging markets, tens of millions of people are moving to urban centers every year, driving demand for more efficient elevators, air conditioning, and fire and security systems, as well as for a modern cold chain to support sustainable growth. Urban growth is also increasing demand for commercial aviation to connect cities in commerce and provide recreational travel opportunities for a growing middle class.
United Technologies is well positioned to capitalize on these opportunities as a result of investments in game-changing technologies such as Pratt & Whitney’s revolutionary PurePower Geared Turbofan engine. With more than 5,300 orders and commitments, including options, our customers have embraced this technology and the significant improvements in fuel burn and lower emissions it delivers. By substantially reducing an aircraft’s noise footprint — in some cases by 75 percent — the PurePower engine will allow airlines to add flights and use more direct routes into congested airports while improving the quality of life in neighboring communities.
Across the company, we’ve focused R&D investments to address local market needs, deliver value to customers and convert to top-line growth. Recent examples include the advanced systems UTC Aerospace Systems is providing for the new Airbus A350 XWB; Carrier’s expansion of the WeatherExpert line of commercial rooftop units with industry-leading efficiency and lower costs of ownership; Kidde’s introduction of the Worry-Free carbon monoxide alarm with a 10-year lithium battery; and Otis’ Gen2 Switch elevator with a battery backup system for the South Asian and European markets.
UTC’s performance over the past year reflects the dedication and hard work of UTC’s leadership team and our 212,000 employees. When I meet with UTC employees around the world, I am always impressed by their passion, commitment and creativity. On behalf of our shareowners, I thank our employees for their many contributions and for making UTC such an amazing company.
I also want to thank our customers for the confidence and trust they have placed in United Technologies. We recognize that our customers have choices, and how we perform determines whether they choose us. At UTC, we work tirelessly to ensure our customers’ success, providing the most advanced, reliable and efficient solutions at the best value.
In closing, 2013 was a year of many accomplishments, all achieved with a complete commitment to the highest ethical, legal, environmental and safety standards. By focusing on integration and execution, UTC delivered strong results and positioned the company for long-term sustainable growth. As we look to the future, we are confident we have the right portfolio, strategy and leadership team to deliver customer and shareowner value for decades to come.

We are confident in our strategy, our portfolio and our people to deliver long-term value for our customers and shareowners the right way — ethically, safely and profitably.
01
05
07
09
13
02
06
08
10
14
03
11
15
04
12
16

06 United Technologies Corporation
01
The Right Solutions We make products and provide solutions that make modern life possible — setting the standard for performance, reliability and energy efficiency.

072013 Annual Report
02 03
04
05
01 Sikorsky’s new S-76D helicopter features all-composite main rotor blades and Pratt & Whitney Canada PW210S engines. In January, Sikorsky delivered the first fully configured S-76D to the Bristow Group, the world’s leading provider of helicopter services to the offshore oil and gas industry.
02 Bombardier’s new CSeries single-aisle jet completed its maiden flight in September, powered by Pratt & Whitney’s exceptionally quiet PurePower PW1500G engines and equipped with more than 14 systems from UTC Aerospace Systems, including the nacelles, thrust reversers and electrical power systems.
03 The award-winning Otis Gen2 system with ReGen drive technology captures energy generated by gravity during an elevator’s ascent and descent and recycles it back into a building’s power grid, reducing energy consumption by up to 75 percent.
04 Carrier’s AquaForce 30XA chiller, one of the quietest and most efficient on the market, uses 30 percent less refrigerant than traditional designs and employs aluminum coils to limit corrosion.
05 UTC Climate, Controls & Security will supply the latest HVAC systems and advanced video security and access control solutions for the new Midfield Concourse development at Hong Kong International Airport.
Urbanization is a powerful force driving demand for our products and solutions.
We are helping to build smarter, more sustainable cities with solutions that improve the quality of urban life. Otis elevators and escalators move people faster and more efficiently through the airports, metros and high-rise buildings of modern cities. Carrier heating, ventilating and air-conditioning systems make indoor life more comfortable and productive, and our fire and security systems keep people safe and secure. Carrier’s cold-chain management solutions preserve the global food supply from field to point of sale, keeping it safe for consumption.
As the world urbanizes, increased air travel follows. To meet this demand, UTC is helping to build planes that are quieter, more fuel efficient and less costly to maintain. Our PurePower engine dramatically reduces fuel consumption, emissions and noise. Our aerospace systems are found on virtually every aircraft in the air today, and Sikorsky is pushing the limits of autonomous flight with technologies that reduce pilot workload and improve safety during complicated maneuvers.
To ensure our technology leadership continues, we are investing in additive manufacturing and other advanced processes that will allow us to continue to provide our customers with the most reliable, efficient and affordable solutions.

08 United Technologies Corporation
05
03
The Right PeopleOur employees have a reputation for innovative thinking — aiming for the biggest improvements and the best solutions.

092013 Annual Report
06
04
01 02
01 Carlos Jalomo, Karla Hipolito and Israel Ruiz CARRIER Monterrey, Mexico
02 Samuel Viana PRATT & WHITNEY West Palm Beach, Florida
03 Fábio Silva, Fabiano Pires OTIS
São Paulo, Brazil
04 Ryszard Łach UTC AEROSPACE SYSTEMS Rzeszów, Poland
05 Anais Espinal UNITED TECHNOLOGIES
RESEARCH CENTER East Hartford, Connecticut
06 Demetrius Brown SIKORSKY Stratford, Connecticut
Our high-performance culture attracts the best people in their fields — people of diverse backgrounds working together to solve complex problems.
Our people thrive in an environment where conventional thinking can be challenged and calculated risks taken, achieving ever higher levels of performance in everything they do, from developing new products to finding better ways to serve our customers. It is through their efforts that we are leaders in the highly competitive aerospace and building systems industries. Our high-performance culture succeeds because of our focus on developing, recognizing and rewarding this dedicated, experienced workforce — 212,000 employees around the world speaking more than 30 languages and sharing diverse cultures and beliefs.
We support our employees in their career development in many ways, including our Employee Scholar Program, recognized as one of the world’s most generous employee education programs. The program covers the cost of tuition, fees and books for accredited programs for employees anywhere in the world. We have invested more than $1 billion in the program since its launch in 1996, an investment that has led to almost 36,000 degrees earned by our employees. Nearly 8,000 employees participated in the program in 2013, half of them pursuing advanced degrees.
The people of UTC provide the innovative spark that moves us forward. Thanks to their expertise, creativity and passion, UTC was ranked among the world’s most innovative companies for the second consecutive year in 2013 by Thomson Reuters.

10 United Technologies Corporation
RIGHT: Jill Albertelli, Vice President, Procurement, Pratt & Whitney, meets with students at the UTC-sponsored Junior Achievement Global Exchange Program at Yale University, which brought together high school students from the United States and China for a weeklong global business seminar.
RIGHT: UTC’s EH&S professionals around the world are committed to ensuring that our sites meet the highest standards for workplace safety, comply fully with environmental laws and regulations, and achieve UTC’s own aggressive 2015 sustainability goals.
The Right ApproachAs United Technologies continues to grow in markets around the world, we bring with us a belief that financial performance and corporate responsibility go hand in hand.
Environment, Health & Safety (EH&S)As a responsible corporate citizen, we are committed to minimizing the adverse environmental impact of our products, our operations and our supply chain — and to providing a safe work environment for all employees.
At UTC, sustainability means profitable, responsible operations that don’t compromise the environmental and economic health of future generations. We were among the first companies to set targets for reducing energy consumption, water use, chemical emissions and industrial waste. We continue to set big goals for ourselves — and to achieve even bigger results. Since 2006, we have reduced greenhouse gas emissions by 27 percent, water use by 31 percent, chemical emissions by 49 percent and industrial process waste by 37 percent. (See page 13.)
Greening the Built EnvironmentUTC is committed to continuous improvement in the environmental performance of its products. We are a pioneer in the use of natural refrigerants, and our heating, ventilating and air-conditioning systems consistently exceed the most stringent energy and environmental standards. We calculate that installations of these high-efficiency systems by customers around the world since 2000 have avoided adding more than 138 million tons of carbon emissions to the atmosphere — the equivalent of taking 29 million cars off the road for a year.
UTC is also a leading voice in promoting green design, believing that protecting the environment is not only the right thing to do — it is also good for business. We were the first company to join the U.S. Green Building Council. We are also a founding member of numerous other green building councils around the world. Carrier continued its highly successful Distinguished Sustainability Lecture Series in 2013. The lecture series brings together experts in sustainable design and representatives of the building industry to discuss the benefits of energy efficiency, conduct training and review trends in what could become a $1.8 trillion market for energy-efficient building design and technology by 2030, according to research we conducted with the Rhodium Group.

112013 Annual Report
Ewa PisulaUTC AEROSPACE SYSTEMSWrocław, Poland
“ We know that by reducing our environmental footprint, we are helping to build a better future for our children and grandchildren. ”
Bruce RocksSIKORSKY Georgetown, Texas
“ Everyone benefits when we make progress toward our EH&S goals. An environmentally responsible company is a better place to work. You can see it in how engaged our employees are. ”
Shef ShangUTC CLIMATE, CONTROLS & SECURITY Shanghai, China
“ We measure success by our ability to integrate UTC’s EH&S management system into everything we do, including the operations of newly acquired businesses.”
Alice SamPRATT & WHITNEY Singapore
“ We are extremely proud to add Singapore to UTC’s growing number of LEED Gold-certified facilities around the world — and to do our part to minimize the company’s environmental footprint. ”
Josep HendrawanOTIS Asia Pacific
“ Achieving excellence is always a work in progress. We strive to make environmental stewardship and workplace health and safety part of everyone’s job. ”
Leading in the CommunityOur people lead in their communities — volunteering time, talent and expertise. We celebrate and encourage their efforts because we believe United Technologies and our employees can have a positive impact in our communities around the world.
To learn how our employees are making things better, visit www.utc.com/makethingsbetter.
GovernancePROMOTING TRUST, RESPECT AND INTEGRITYThe integrity, reputation and profitability of United Technologies depend on the individual actions of our directors, officers, employees and representatives all over the world. Each is responsible and accountable for compliance with our Code of Ethics. And each of us shares the commitment to be world class in all that we do — to aim for outstanding operational and financial performance, the highest ethical conduct in all situations, the safest work environment and the best compliance practices.
Our Code of Ethics provides a framework to help employees make the right decision in any situation. It also embodies our commitment to promoting the behaviors that create a culture of trust, respect and integrity. These include communicating openly, honoring all our commitments and holding ourselves accountable to the highest standards.
PROTECTING EMPLOYEES WHO PROTECT THE COMPANYUTC wants every employee to feel empowered to speak up about suspected violations of our Code of Ethics. In 2013, we introduced a non-retaliation policy and accompanying handbook to reinforce our long-standing commitment to a safe reporting environment that is free of fear, bullying and other negative consequences. An important channel for doing so is our Ombudsman/DIALOG program, a worldwide, confidential communications network employees can use to ask questions, make suggestions, register complaints and report suspected wrongdoing.

FinancialsUnited Technologies Corporation provides a broad range of high-technology products and services for the aerospace and commercial building industries worldwide. In 2013, UTC net sales were $62.6 billion.
Earnings per share from continuing operations were $6.21 per share. Cash flow from operations less capital expenditures exceeded net income attributable to common shareowners.
Businesses in BalanceUTC’s balanced portfolio of businesses spans geographies, markets and customer relationships.
At a Glance
12 United Technologies Corporation
47%34%
19%
57%
43% 38%21%
27%
14%
NET SALES BY TYPE AS A PERCENT OF TOTAL NET SALES
NET SALES BY GEOGRAPHYAS A PERCENT OF TOTAL NET SALES
Military Aerospace & Space
Commercial Aerospace
Aftermarket
Asia Pacific
Europe
Commercial& Industrial
OriginalEquipment
Manufacturing
UnitedStates
Other
1 Amounts include company- and customer-funded research and development.
2 The increase in the 2012 debt to capitalization ratio reflects debt issuances to finance the Goodrich acquisition.
0.000
7.825
15.650
23.475
31.300
39.125
46.950
54.775
62.600
NET SALESDollars in billions
50.5
09
52.3
10
55.8
11
57.7
12
62.6
13
0.0000
0.5875
1.1750
1.7625
2.3500
2.9375
3.5250
4.1125
4.7000
RESEARCH AND DEVELOPMENT 1
Dollars in billions
3.2
09
3.1
10
3.4
11
4.0
12
4.7
130.000
0.275
0.550
0.825
1.100
1.375
1.650
1.925
DIVIDENDS PAID PER COMMON SHAREDollars per share
1.54
09
1.70
10
1.87
11
2.03
12
2.20
130.00
5.75
11.50
17.25
23.00
28.75
34.50
40.25
46.00
DEBT TO CAPITAL 2
Percent
32
09
32
10
31
11
46
12
38
13
0.00000
0.77625
1.55250
2.32875
3.10500
3.88125
4.65750
5.43375
6.21000
DILUTED EARNINGS PER COMMON SHAREDollars per share
4.00
09
4.55
10
5.33
11
5.35
12
6.21
130.0000
0.9375
1.8750
2.8125
3.7500
4.6875
5.6250
6.5625
7.5000
CASH FLOW FROM OPERATIONSDollars in billions
5.1
09
5.6
10
6.5
11
6.6
12
7.5
13

Corporate ResponsibilityKey Performance Indicators measure UTC’s sustainability goals and performance for current operations. UTC reporting standards include the ongoing analysis and correction of data, as applicable, following the close of a reporting period. Consequently, previously reported annual metric results may change between annual reporting periods, and UTC may include any prior-year data revisions in current reporting.
The increases in our 2013 environmental performance results and our 2015 goals reflect the addition of 100 former Goodrich sites to our EH&S management system.
132013 Annual Report
In 2013, the U.S. Department of Energy recognized UTC for slashing energy consumption across its U.S. operations by nearly 30 percent between 2005 and 2012. UTC was one of five companies honored for achieving aggressive energy-reduction targets set as part of its voluntary participation in the DOE’s Better Plants program. UTC has been a pioneer in energy conservation, setting its first energy reduction goals in 1997.
0.0000
0.2625
0.5250
0.7875
1.0500
1.3125
1.5750
1.8375
NON-GREENHOUSE GAS EMISSIONSMillion lbs
1.2
10
1.2
11
0.9
12
2.1
13
2.0
15
0.0000
9.1625
18.3250
27.4875
36.6500
45.8125
54.9750
64.1375
NON-RECYCLED INDUSTRIAL PROCESS WASTEMillion lbs
55.0
10
51.4
11
47.7
12
73.3
13
70.2
15
0.0000
0.0925
0.1850
0.2775
0.3700
0.4625
0.5550
0.6475
TOTAL RECORDABLE INCIDENT RATECases/100 employees
0.64
10
0.74
11
0.73
12
0.69
13
0.68
15
0.000
0.225
0.450
0.675
0.900
1.125
1.350
1.575
WORLDWIDE WATER CONSUMPTIONBillion gals
1.6
10
1.6
11
1.4
12
1.8
13
1.8
150.000
0.025
0.050
0.075
0.100
0.125
0.150
0.175
LOST WORKDAY INCIDENT RATECases/100 employees
0.14
10
0.20
11
0.19
12
0.17
13
0.15
15
0.0000
0.2875
0.5750
0.8625
1.1500
1.4375
1.7250
2.0125
GREENHOUSE GAS EMISSIONSMillion metric tons CO2e
1.9
10
1.9
11
1.8
12
2.2
13
2.3
150.0
35.7
71.4
107.1
142.8
178.5
214.2
249.9
INDUSTRIAL PROCESS WASTEMillion lbs
242
10
247
11
223
12
286
13
278
15
Additional information detailing our progress is available at www.utc.com/responsibility.
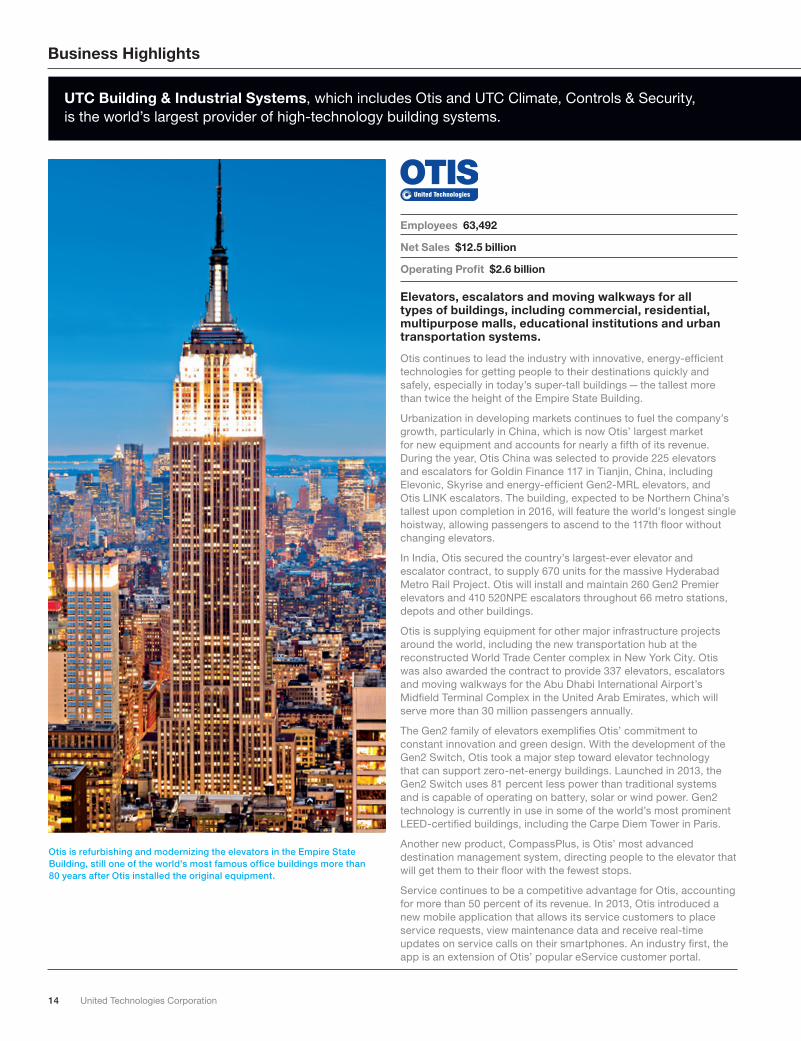
UTC Building & Industrial Systems, which includes Otis and UTC Climate, Controls & Security, is the world’s largest provider of high-technology building systems.
14 United Technologies Corporation
Business Highlights
Elevators, escalators and moving walkways for all types of buildings, including commercial, residential, multipurpose malls, educational institutions and urban transportation systems.
Otis continues to lead the industry with innovative, energy-efficient technologies for getting people to their destinations quickly and safely, especially in today’s super-tall buildings — the tallest more than twice the height of the Empire State Building.
Urbanization in developing markets continues to fuel the company’s growth, particularly in China, which is now Otis’ largest market for new equipment and accounts for nearly a fifth of its revenue. During the year, Otis China was selected to provide 225 elevators and escalators for Goldin Finance 117 in Tianjin, China, including Elevonic, Skyrise and energy-efficient Gen2-MRL elevators, and Otis LINK escalators. The building, expected to be Northern China’s tallest upon completion in 2016, will feature the world’s longest single hoistway, allowing passengers to ascend to the 117th floor without changing elevators.
In India, Otis secured the country’s largest-ever elevator and escalator contract, to supply 670 units for the massive Hyderabad Metro Rail Project. Otis will install and maintain 260 Gen2 Premier elevators and 410 520NPE escalators throughout 66 metro stations, depots and other buildings.
Otis is supplying equipment for other major infrastructure projects around the world, including the new transportation hub at the reconstructed World Trade Center complex in New York City. Otis was also awarded the contract to provide 337 elevators, escalators and moving walkways for the Abu Dhabi International Airport’s Midfield Terminal Complex in the United Arab Emirates, which will serve more than 30 million passengers annually.
The Gen2 family of elevators exemplifies Otis’ commitment to constant innovation and green design. With the development of the Gen2 Switch, Otis took a major step toward elevator technology that can support zero-net-energy buildings. Launched in 2013, the Gen2 Switch uses 81 percent less power than traditional systems and is capable of operating on battery, solar or wind power. Gen2 technology is currently in use in some of the world’s most prominent LEED-certified buildings, including the Carpe Diem Tower in Paris.
Another new product, CompassPlus, is Otis’ most advanced destination management system, directing people to the elevator that will get them to their floor with the fewest stops.
Service continues to be a competitive advantage for Otis, accounting for more than 50 percent of its revenue. In 2013, Otis introduced a new mobile application that allows its service customers to place service requests, view maintenance data and receive real-time updates on service calls on their smartphones. An industry first, the app is an extension of Otis’ popular eService customer portal.
Employees 63,492
Net Sales $12.5 billion
Operating Profit $2.6 billion
Otis is refurbishing and modernizing the elevators in the Empire State Building, still one of the world’s most famous office buildings more than 80 years after Otis installed the original equipment.

UTC Building & Industrial Systems, which includes Otis and UTC Climate, Controls & Security, is the world’s largest provider of high-technology building systems.
152013 Annual Report
01 Carrier’s 23XRV water-cooled chiller uses non-ozone-depleting HFC-134a refrigerant, making it one of the most efficient, reliable and durable chillers in the industry.
02 Carrier Transicold’s ultra-high-efficiency X4 Series with ecoFORWARD technology delivers the highest refrigeration capacities currently available while meeting the new diesel emission standards set by the U.S. Department of Environmental Protection. The X4 Series combines lower fuel consumption with lower maintenance costs, lighter weight and quieter operation.
03 Kidde’s Worry-Free product line features smoke, carbon monoxide (CO) and combination alarms, each proven to provide a decade of protection. In 2013, Kidde launched the first UL-listed CO alarm that lasts 10 years — up to twice the life span of other alarms.
02
01
03
Heating, ventilating, air-conditioning and refrigeration systems (HVACR); fire detection and alarm systems; suppression systems; security solutions; building controls and automation; and services and sustainable solutions for residential, commercial, industrial, food service and transportation applications.
UTC Climate, Controls & Security makes the world a better place to live by creating energy-efficient indoor environments that are safer and more comfortable, and by storing and refrigerating the global food supply during transport and at retail stores.
The integration of Carrier with our fire and security businesses continues to create opportunities in the commercial building space and to drive growth.
During the year, Chubb, Lenel and Interlogix were selected to provide security and access control systems for the second phase of Galaxy Macau, one of Asia’s most popular resorts, located in the city of Macau across the Pearl River Delta from Hong Kong.
Employees 57,294
Net Sales $16.8 billion
Operating Profit $2.6 billion
Carrier reached a milestone with the 100th installation of its CO2OLtec Integral system, this one for the SPAR supermarket in Schüpfen, Switzerland. The system uses carbon dioxide, a natural refrigerant, and can cut a store’s energy consumption by 30 percent. It is also an integrated management system that controls a store’s refrigeration, heating, cooling, ventilating and lighting systems.
Automated Logic was selected to provide building monitoring and controls for Intergate Manhattan, the world’s tallest data center, a 32-story former office tower in New York City. In China’s coastal province of Jiangsu, Marioff will provide water mist fire protection systems for the Wuxi Metro Line, scheduled to begin operation in 2015.
Carrier expanded its WeatherExpert line of commercial rooftop cooling units to include six new models. The high-efficiency series now ranges from 3 tons to 150 tons.
To meet growing demand in India for efficient, economical and reliable cold-chain protection, Carrier Transicold introduced its Citimax line of refrigeration units for light commercial vehicles and trucks to the Indian market.
In 2013, UTC Climate, Controls & Security and Otis were combined to form UTC Building & Industrial Systems. With a broad portfolio of innovative products and services, an unmatched global footprint, and a strong presence in emerging markets, this new organization unlocks greater value for customers and shareowners — and positions UTC for long-term growth in the commercial building segment.

UTC Propulsion & Aerospace Systems, which includes Pratt & Whitney and UTC Aerospace Systems, is one of the world’s largest suppliers of advanced aerospace products.
16 United Technologies Corporation
Business Highlights
The F-35 Lightning II jet, the next-generation fighter for the United States and its allies, is powered by Pratt & Whitney’s F135 engine. The engine has performed exceptionally well in more than 29,000 hours of ground and flight tests. The U.S. Marine Corps expects initial operational capability of the F-35 in 2015, followed by the U.S. Air Force in 2016 and the U.S. Navy in 2019.
Turbofan engines for large commercial, business and military aircraft; turboprop engines for regional airline, business, utility and military aircraft; turboshaft engines for commercial and military helicopters; power units; maintenance, repair and overhaul services, including the sale of spare parts as well as fleet management services.
By the end of this decade, Pratt & Whitney will be producing engines at rates last seen in the early 1980s, with new engine families for military, business and commercial aircraft, including the PurePower engine — developed for the single-aisle aircraft that will constitute 70 percent of the commercial market in the coming decades.
Bombardier’s new CSeries aircraft, powered by Pratt & Whitney PurePower PW1500G engines, completed its maiden flight in September, taking off from Mirabel International Airport in Quebec. Much of the press coverage focused on the remarkably quiet engines, which reduce ground noise by up to 75 percent.
Embraer selected the PurePower engine as the exclusive power source for its second generation of E-Jets, becoming the fifth aircraft maker to choose our Geared Turbofan technology either as the sole power source or as an option for one of its new aircraft. The engines, designed for the growing narrow-body aircraft segment, are expected to generate $400 billion in revenue over the life of the program. The company had more than 5,300 orders and commitments, including options, through early 2014.
The benefits resulting from the 2012 acquisition of a majority stake in the IAE International Aero Engines AG collaboration are exceeding expectations. There are more than 5,000 IAE V2500 engines in service today, nearly half of which have yet to be overhauled, creating significant opportunity for Pratt & Whitney’s aftermarket business.
Pratt & Whitney Canada celebrated the 50th anniversary of its iconic PT6 engine in 2013 and marked another milestone, the delivery of its 80,000th engine, a PT6A-60A that powers Beechcraft’s King Air 350i.
On the military side, through 2013 Pratt & Whitney had delivered more than 130 F135 engines for the F-35 Lightning II, the next-generation fighter for the United States and its allies. Pratt & Whitney has reduced F135 engine costs by more than 40 percent.
Northrop Grumman’s experimental X-47B unmanned combat aircraft — powered by Pratt & Whitney’s F100-PW-220U engine — completed its first carrier-based trials during 2013, including catapult launches, touch-and-go maneuvers and arrested landings.
Pratt & Whitney and Boeing marked delivery of the first PW4062 engines for the U.S. Air Force’s new KC-46A aerial refueling aircraft. Boeing’s contract with Pratt & Whitney calls for delivery of as many as 368 PW4062 engines through 2027.
Employees 31,700
Net Sales $14.5 billion
Operating Profit $1.9 billion
UTC Propulsion & Aerospace Systems, which includes Pratt & Whitney and UTC Aerospace Systems, is one of the world’s largest suppliers of advanced aerospace products.
172013 Annual Report
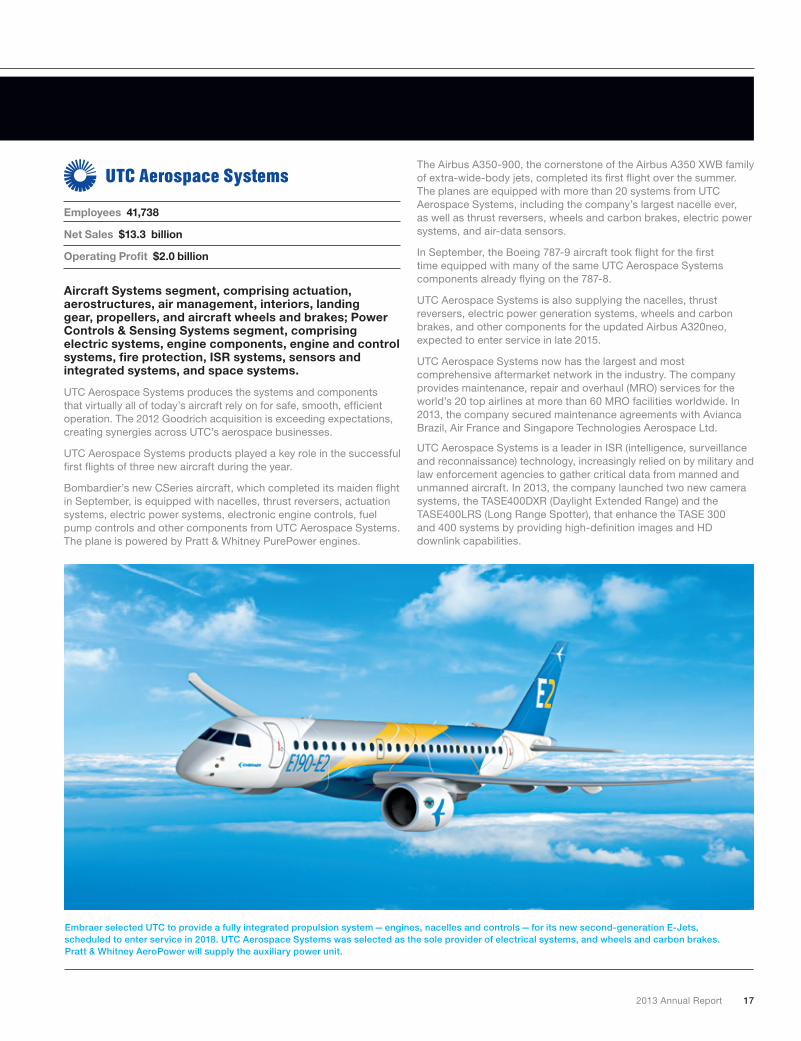
Embraer selected UTC to provide a fully integrated propulsion system — engines, nacelles and controls — for its new second-generation E-Jets, scheduled to enter service in 2018. UTC Aerospace Systems was selected as the sole provider of electrical systems, and wheels and carbon brakes. Pratt & Whitney AeroPower will supply the auxiliary power unit.
Employees 41,738
Net Sales $13.3 billion
Operating Profit $2.0 billion
Aircraft Systems segment, comprising actuation, aerostructures, air management, interiors, landing gear, propellers, and aircraft wheels and brakes; Power Controls & Sensing Systems segment, comprising electric systems, engine components, engine and control systems, fire protection, ISR systems, sensors and integrated systems, and space systems.
UTC Aerospace Systems produces the systems and components that virtually all of today’s aircraft rely on for safe, smooth, efficient operation. The 2012 Goodrich acquisition is exceeding expectations, creating synergies across UTC’s aerospace businesses.
UTC Aerospace Systems products played a key role in the successful first flights of three new aircraft during the year.
Bombardier’s new CSeries aircraft, which completed its maiden flight in September, is equipped with nacelles, thrust reversers, actuation systems, electric power systems, electronic engine controls, fuel pump controls and other components from UTC Aerospace Systems. The plane is powered by Pratt & Whitney PurePower engines.
The Airbus A350-900, the cornerstone of the Airbus A350 XWB family of extra-wide-body jets, completed its first flight over the summer. The planes are equipped with more than 20 systems from UTC Aerospace Systems, including the company’s largest nacelle ever, as well as thrust reversers, wheels and carbon brakes, electric power systems, and air-data sensors.
In September, the Boeing 787-9 aircraft took flight for the first time equipped with many of the same UTC Aerospace Systems components already flying on the 787-8.
UTC Aerospace Systems is also supplying the nacelles, thrust reversers, electric power generation systems, wheels and carbon brakes, and other components for the updated Airbus A320neo, expected to enter service in late 2015.
UTC Aerospace Systems now has the largest and most comprehensive aftermarket network in the industry. The company provides maintenance, repair and overhaul (MRO) services for the world’s 20 top airlines at more than 60 MRO facilities worldwide. In 2013, the company secured maintenance agreements with Avianca Brazil, Air France and Singapore Technologies Aerospace Ltd.
UTC Aerospace Systems is a leader in ISR (intelligence, surveillance and reconnaissance) technology, increasingly relied on by military and law enforcement agencies to gather critical data from manned and unmanned aircraft. In 2013, the company launched two new camera systems, the TASE400DXR (Daylight Extended Range) and the TASE400LRS (Long Range Spotter), that enhance the TASE 300 and 400 systems by providing high-definition images and HD downlink capabilities.

18 United Technologies Corporation
Business Highlights
Developed for the Canadian Forces, Sikorsky’s new twin-engine CH148 CYCLONE maritime helicopter is designed for multiple missions, including anti-submarine warfare, surveillance, and search and rescue operations. In 2013, Canadian pilots completed preliminary flight training, and Initial Operational Training and Evaluation is targeted for 2014.
Employees 16,524
Net Sales $6.3 billion
Operating Profit $594 million
Sikorsky is a world leader in the design, manufacture and service of military and commercial helicopters and fixed-wing aircraft.
Military and commercial helicopters; fixed-wing aircraft; spare parts and maintenance, repair and overhaul services for helicopters and fixed-wing aircraft.
Sikorsky continues to build on its heritage of innovation. The S-97 RAIDER next-generation light tactical helicopter, based on Sikorsky’s X2 technology, is on track for first flight in 2014. MATRIX technology for autonomous flight is generating strong customer interest, as is the company’s new Rig Approach automated system for the S-92 helicopter, which enhances safety by reducing pilot workload during challenging operating conditions.
On the commercial side, Sikorsky finished the year with a backlog of nearly $3 billion — its largest ever — driven by growing demand for offshore transportation in the oil and gas industry. The S-92 helicopter, Sikorsky’s best-selling commercial product, is the only helicopter in its class certified to the latest U.S. Federal Aviation Administration and European airworthiness safety standards — a major consideration in the offshore transportation industry. In January 2014, Sikorsky delivered the first S-76D to the Bristow Group, the world’s leading provider of helicopter services to the offshore oil and gas industry. Powered by Pratt & Whitney Canada PW210S engines, the S-76D has the lowest noise signature in its class, as well as a faster cruise speed and more efficient fuel burn than any of its predecessors in the S-76 line.
First flight of the CH-53K, the U.S. Marine Corps’ next-generation heavy-lift helicopter, is expected in late 2014. The CH-53K is the only major helicopter development program currently funded by the U.S. Department of Defense, Sikorsky’s biggest customer, and represents potential revenue in excess of $20 billion. The helicopter was designed and manufactured using advanced 3-D virtual reality technology, speeding development, reducing costs and winning recognition for engineering excellence by the U.S. Defense Department and the American Helicopter Society.
Sikorsky is gaining traction internationally with the S-70i BLACK HAWK helicopter. Sikorsky delivered two to the Colombian Army in 2013. It also delivered four S-70i helicopters to the Brunei Ministry of Defence as part of a contract to supply 12 by the end of 2014.
Positioning the company for future growth, Sikorsky successfully teamed with Boeing to design and build the SB>1 DEFIANT demonstrator helicopter for the U.S. government’s Joint Multi-Role helicopter program, the first phase in the U.S. government’s Future Vertical Lift initiative to develop the next-generation utility and attack helicopter.

20 Five-Year Summary
21 Management’s Discussion and Analysis
43 Cautionary Note Concerning Factors That MayAffect Future Results
44 Management’s Report on Internal Control over Financial Reporting
45 Report of Independent Registered Public Accounting Firm
46 Consolidated Statement of Operations
47 Consolidated Statement of Comprehensive Income
48 Consolidated Balance Sheet
49 Consolidated Statement of Cash Flows
50 Consolidated Statement of Changes in Equity
52 Notes to Consolidated Financial Statements
82 Board of Directors
82 Permanent Committees
83 Leadership
84 Shareowner Information
Financial Table of Contents
2013 Annual Report 19

(DOLLARS IN MILLIONS, EXCEPT PER SHARE AMOUNTS) 2013 2012 2011 2010 2009
For The YearNet sales $ 62,626 $ 57,708 $ 55,754 $ 52,275 $ 50,469Research and development 4 2,529 2,371 1,951 1,656 1,460Restructuring costs 481 590 315 387 787Net income from continuing operations 6,074 5,200 5,216 4,523 4,060Net income from continuing operations attributable to common shareowners 5,686 4,847 4,831 4,195 3,719
Basic earnings per share—Net income from continuing operationsattributable to common shareowners 6.31 5.41 5.41 4.62 4.05Diluted earnings per share—Net income from continuing operationsattributable to common shareowners 6.21 5.35 5.33 4.55 4.00Cash dividends per common share 2.20 2.03 1.87 1.70 1.54
Average number of shares of Common Stock outstanding:Basic 901 895 892 908 917Diluted 915 907 907 923 929
Cash flows provided by operating activities of continuing operations 7,505 6,605 6,460 5,720 5,083Capital expenditures 6 1,688 1,389 929 838 773Acquisitions, including debt assumed 3 151 18,620 372 2,781 676Repurchases of Common Stock 5 1,200 – 2,175 2,200 1,100Dividends paid on Common Stock 1 1,908 1,752 1,602 1,482 1,356
At Year EndWorking capital $ 6,642 $ 5,174 $ 7,142 $ 5,778 $ 5,281Total assets 3 90,594 89,409 61,452 58,493 55,762Long-term debt, including current portion 2 19,853 22,718 9,630 10,173 9,490Total debt 2 20,241 23,221 10,260 10,289 9,744
Total debt to total capitalization 2 38% 46% 31% 32% 32%Total equity 2 33,219 27,069 22,820 22,323 20,999Number of employees 3 212,400 218,300 199,900 208,200 206,700
Note 1 Excludes dividends paid on Employee Stock Ownership Plan Common Stock.
Note 2 The decrease in the 2013 debt to total capitalization ratio, as compared to 2012, reflects the repayment of approximately $2.9 billion of long-term debt, mostof which was used to finance the acquisition of Goodrich. The increase in the 2012 debt to total capitalization ratio, as compared to 2011, reflects the issu-ance of $9.8 billion in long-term debt, $1.1 billion in equity units and the assumption of approximately $3 billion in long-term debt in connection with theacquisition of Goodrich.
Note 3 The increase in 2012, as compared with 2011, includes the net impact of acquisitions and divestitures across the Company, most notably the 2012 acquisitionof Goodrich and divestiture of the legacy Hamilton Sundstrand Industrial business, both within the UTC Aerospace Systems segment, as well as the impact ofother acquisitions and dispositions and restructuring actions across UTC.
Note 4 The increase in 2012, as compared with 2011, includes approximately $250 million incremental research and development spending related to the Goodrichbusinesses that were acquired during 2012, and approximately $65 million at Pratt & Whitney to further advance development of multiple geared turbofanplatforms.
Note 5 In connection with the acquisition of Goodrich, repurchases of common stock under our share repurchase program were suspended for 2012. We resumedour share repurchase program in 2013.
Note 6 Capital expenditures increased in 2013 and are expected to increase in 2014 as we build capacity to meet expected demand within our aerospace businessesfor the next generation engine platforms. We expect capital expenditures in 2014 of approximately $2 billion.
Five-Year Summary
20 United Technologies Corporation
MANAGEMENT’S DISCUSSION AND ANALYSIS OFFINANCIAL CONDITION AND RESULTS OF OPERATIONS
BUSINESS OVERVIEW
We are a global provider of high technology products and servicesto the building systems and aerospace industries. Our operations forthe periods presented herein are classified into five principal businesssegments: Otis, UTC Climate, Controls & Security, Pratt & Whitney,UTC Aerospace Systems and Sikorsky. Otis and UTC Climate,Controls & Security are referred to as the “commercial businesses,”while Pratt & Whitney, UTC Aerospace Systems and Sikorsky arecollectively referred to as the “aerospace businesses.” Certainreclassifications have been made to the prior year amounts toconform to the current year presentation.
On September 23, 2013, we announced the formation of UTCBuilding & Industrial Systems, a new organizational structure consistingof the Otis and UTC Climate, Controls & Security segments. This neworganizational structure is expected to enhance our ability to delivermore integrated solutions to our customers and accelerate innovationin smart building technologies and sustainable designs. Otis and UTCClimate, Controls & Security each continue to report their financial andoperational results as separate segments, which is consistent with howwe allocate resources and measure the financial performance of thesebusinesses.
On July 26, 2012, UTC acquired Goodrich Corporation (Goodrich)pursuant to a merger agreement dated September 21, 2011. As aresult of the acquisition, Goodrich became a wholly-owned subsidiaryof UTC. The acquired Goodrich business and the legacy HamiltonSundstrand business were combined to form a new segment namedUTC Aerospace Systems. The results of the acquired Goodrichbusiness have been included in UTC’s financial statements only forperiods subsequent to the completion of the acquisition. The acquisi-tion resulted in the inclusion of Goodrich’s assets and liabilities asof the acquisition date at their respective fair values. Accordingly,the acquisition materially affected UTC’s results of operations andfinancial position.
On June 29, 2012, Pratt & Whitney, Rolls-Royce plc (Rolls-Royce),MTU Aero Engines AG (MTU) and Japanese Aero Engines Corporation(JAEC), participants in the IAE International Aero Engines AG (IAE)collaboration, completed a restructuring of their interests in IAE. Underthe terms of the agreement, Rolls-Royce sold its ownership and col-laboration interests in IAE to Pratt & Whitney, while also entering intoa license for its V2500 intellectual property with Pratt & Whitney. Inexchange for the increased ownership and collaboration interests andintellectual property license, Pratt & Whitney paid Rolls-Royce $1.5billion at closing with additional payments due to Rolls-Royce duringthe fifteen year period following closing of the purchase, conditionalupon each hour flown by V2500-powered aircraft in service at theclosing. Pratt & Whitney entered into a collaboration arrangementwith MTU with respect to a portion of the collaboration interest in IAEacquired from Rolls-Royce for consideration of approximately $233million with additional payments due to Pratt & Whitney in the future.As a result of these transactions, Pratt & Whitney has a 61% net
interest in the collaboration and a 49.5% ownership interest in IAE,which has been consolidated by Pratt & Whitney post-transaction.
In 2012, the Board of Directors of the Company approved aplan for the divestiture of a number of non-core businesses. Cashgenerated from these divestitures was used to repay debt incurred tofinance the acquisition of Goodrich. The legacy Hamilton SundstrandIndustrial businesses, as well as Clipper Windpower (Clipper), Pratt& Whitney Rocketdyne (Rocketdyne) and UTC Power all met the“held-for-sale” criteria in 2012. The results of operations, including thenet realized gain and losses on disposition, and the related cash flowswhich result from these non-core businesses were reclassified toDiscontinued operations in our Consolidated Statements of Operationsand Cash Flows. The dispositions of Clipper and the legacy HamiltonSundstrand Industrial businesses were completed in 2012. OnFebruary 12, 2013, we completed the disposition of UTC Power toClearEdge Power. The UTC Power disposition resulted in paymentsby UTC totaling $48 million, which included capitalization of thebusiness prior to the sale and interim funding of operations as theacquiror took control of a loss generating business. We have nocontinuing involvement with the UTC Power business.
On June 14, 2013, we completed the sale of substantially alloperations of Rocketdyne to GenCorp Inc. for $411 million. The salegenerated a pre-tax loss of approximately $7 million ($3 million aftertax), which has been included in Discontinued operations in theaccompanying Consolidated Statement of Operations. On May 17,2013, we completed the sale of the Pratt & Whitney Power Systemsbusiness to Mitsubishi Heavy Industries (MHI) for $432 million, exclud-ing contingent consideration valued at approximately $200 million, andwe entered into a long-term engineering and manufacturing agreementwith MHI. The sale generated a pre-tax gain of approximately $193million ($132 million after tax). Pratt & Whitney Power Systems was notreclassified to Discontinued operations due to our level of continuinginvolvement in the business post-sale.
In connection with regulatory approval of the Goodrich acquisition,regulatory authorities required UTC to dispose of the Goodrich electricpower systems and the pumps and engine controls businesses.Pursuant to these regulatory obligations, these businesses had beenheld separately from UTC’s and Goodrich’s ongoing businesses sincethe acquisition of Goodrich by UTC. On March 18, 2013, we com-pleted the sale of the Goodrich pumps and engine controls businessto Triumph Group, Inc., and on March 26, 2013, we completed thesale of the Goodrich electric power systems business to Safran S.A.Combined proceeds from the sales of the two businesses wereapproximately $600 million.
Our consolidated net sales were derived from the commercialand aerospace businesses as follows (sales from Pratt & Whitney’sindustrial markets are included in “commercial and industrial”):
2013 2012 2011
Commercial and industrial 47% 51% 57%
Military aerospace and space 19% 21% 20%
Commercial aerospace 34% 28% 23%
100% 100% 100%
Management’s Discussion and Analysis
2013 Annual Report 21

The significant shift in sales from Commercial and industrialto Commercial aerospace largely reflects the Goodrich and IAEtransactions. In 2013 and 2012, approximately 57% of our consoli-dated sales were original equipment manufacturing (OEM) and 43%were aftermarket parts and services, while in 2011 the amounts were56% and 44%, respectively.
Our worldwide operations can be affected by industrial, economicand political factors on both a regional and global level. To limit theimpact of any one industry, or the economy of any single countryon our consolidated operating results, our strategy has been, andcontinues to be, the maintenance of a balanced and diversified portfo-lio of businesses. Our operations include OEM and extensive relatedaftermarket parts and services in both our commercial and aerospacebusinesses. Our business mix also reflects the combination of shortercycles at UTC Climate, Controls & Security and in our commercialaerospace spares businesses, and longer cycles at Otis and in ouraerospace OEM and aftermarket maintenance businesses. Our cus-tomers include companies in both the public and private sectors,and our businesses reflect an extensive geographic diversification thathas evolved with the continued globalization of world economies. Thecomposition of net sales from outside the U.S., including U.S. exportsales to these regions, in U.S. Dollars and as a percentage of totalsegment sales, is as follows:
(DOLLARS IN MILLIONS) 2013 2012 2011 2013 2012 2011
Europe $ 12,652 $ 11,823 $ 12,344 20% 20% 22%
Asia Pacific 8,696 8,733 9,016 14% 15% 16%
Other Non-U.S. 5,274 4,964 5,376 8% 9% 10%
U.S. Exports 12,171 9,201 7,721 19% 16% 14%
Internationalsegment sales $ 38,793 $ 34,721 $ 34,457 61% 60% 62%
As part of our growth strategy, we invest in businesses in certaincountries that carry high levels of currency, political and/or economicrisk, such as Argentina, Brazil, China, India, Mexico, Russia, SouthAfrica and countries in the Middle East. As of December 31, 2013,the net assets in any one of these countries did not exceed 5% ofconsolidated shareowners’ equity.
Emerging economies, principally China, continue to show stronggrowth, and together with U.S. economic expansion, are expected todrive global growth in the coming year. Third party forecasts project2014 global GDP of approximately 3%, and we continue to expectgrowth rates in China to outpace the rest of the world. European eco-nomic recovery is expected with modest growth in northern Europeaneconomies tempered by lower rates of growth in southern Europe. Inthe U.S., growth rates are expected to increase in 2014 on improvingconsumer finances and a strong housing market. Further, we expectcontinued improvement in commercial construction in North Americathroughout 2014. U.S. fiscal policy has constrained sales to the U.S.Government in 2013. U.S. and international military volume declineshave been partially offset by strong demand for commercial aircraft atSikorsky, which delivered its first fully configured S-76D in 2013. In
2013, as compared with 2012, commercial aerospace spares orders atPratt & Whitney increased 27% in total, due to the consolidation of IAE(19%) and as a result of organic order growth during the year (8%).UTC Aerospace Systems’ commercial aerospace spares ordersincreased 63% primarily due to the acquisition of Goodrich.
Organic sales growth was a modest 1% in 2013 as salesincreases in commercial aerospace OEM and aftermarket, and in theAmericas at our Commercial Businesses, were offset by declines inmilitary OEM and aftermarket. We expect organic sales growth in 2014to be 3% to 4%. Although we expect an increase in organic growth,which, if realized, would contribute to operating profit growth, we alsocontinue to invest in new platforms and new markets to position us foradditional growth, while remaining focused on structural cost reduc-tion, operational improvements and disciplined cash redeployment.These actions contributed to our earnings growth during 2013 andpositioned us for further earnings growth as the global economycontinues to strengthen.
As discussed below in “Results of Operations,” operating profitin both 2013 and 2012 includes the impact from activities that arenot expected to recur often or that are not otherwise reflective of theunderlying operations, such as the beneficial impact of net gains frombusiness divestiture activities, primarily those related to UTC Climate,Controls & Security’s portfolio transformation. Our earnings growthstrategy contemplates earnings from organic sales growth, includinggrowth from new product development and product improvements,structural cost reductions, operational improvements, and incrementalearnings from our investments in acquisitions. We invested $151 millionand $18.6 billion (including debt assumed of $2.6 billion) in the acquisi-tion of businesses across the entire company in 2013 and 2012,respectively. Acquisitions completed in 2013 consisted principally ofa number of smaller acquisitions in our commercial businesses. Ourinvestment in businesses in 2012 principally reflected the Goodrichand IAE transactions.
Both acquisition and restructuring costs associated with businesscombinations are expensed as incurred. Depending on the nature andlevel of acquisition activity, earnings could be adversely impacted dueto acquisition and restructuring actions initiated in connection with theintegration of businesses acquired.
For additional discussion of acquisitions and restructuring, see“Liquidity and Financial Condition,” “Restructuring Costs” and Notes 2and 13 to the Consolidated Financial Statements.
RESULTS OF OPERATIONS
Net Sales
(DOLLARS IN MILLIONS) 2013 2012 2011
Net sales $ 62,626 $ 57,708 $ 55,754
Percentage change year-over-year 8.5% 3.5% 6.7%
Management’s Discussion and Analysis
22 United Technologies Corporation

The factors contributing to the total percentage change year-over-year in total net sales are as follows:
2013 2012
Organic volume 1% –
Foreign currency translation – (2)%
Acquisitions and divestitures, net 8% 6 %
Total % Change 9% 4 %
Organic sales growth during 2013 was led by UTC AerospaceSystems (4%) and Otis (3%), along with organic growth at Pratt &Whitney (2%) and UTC Climate, Controls & Security (1%), offset byorganic sales contraction at Sikorsky (8%). The organic sales growthat UTC Aerospace Systems was primarily attributable to highercommercial aerospace OEM and aftermarket volume, while organicsales growth at Otis was primarily a result of higher new equipmentsales in China, the U.S. and Russia. The organic sales contraction atSikorsky was driven primarily by decreased international military, U.S.Government, and military aftermarket sales. The military aftermarketsales decline, driven by lower spares volume, was a result of con-strained U.S. Government spending in 2013. The sales increasefrom net acquisitions and divestitures is a result of Goodrich and IAEsales, partially offset by the portfolio transformation initiatives at UTCClimate, Controls & Security. See the Segment Review section ofManagement’s Discussion and Analysis for further discussion ofsegment organic sales.
Organic sales growth during 2012 at UTC Aerospace Systems(7%) and Pratt & Whitney (2%) was offset by organic sales contractionat Sikorsky (8%). The organic sales growth at UTC Aerospace Systemswas primarily attributable to higher aerospace OEM volume, while theorganic sales growth at Pratt & Whitney was a result of higher militaryengine deliveries and aftermarket sales. The organic sales contractionat Sikorsky was driven primarily by fewer aircraft deliveries to theU.S. Government and international military operations. There was noorganic sales growth within the commercial businesses in 2012. Thesales increase from net acquisitions and divestitures is a result ofGoodrich and IAE sales, partially offset by the portfolio transformationinitiatives at UTC Climate, Controls & Security.
Cost of Products and Services Sold
(DOLLARS IN MILLIONS) 2013 2012 2011
Cost of products sold $ 34,063 $ 31,094 $ 29,252
Percentage of product sales 75.3% 76.3% 75.2%
Cost of services sold $ 11,258 $ 11,059 $ 11,117
Percentage of service sales 64.8% 65.1% 65.9%
Total cost of products and services sold $ 45,321 $ 42,153 $ 40,369
Percentage change year-over-year 7.5% 4.4% 6.4%
The factors contributing to the total percentage change year-over-year in total cost of products and services sold are as follows:
2013 2012
Organic volume – –
Foreign currency translation – (2)%
Acquisitions and divestitures, net 8% 6 %
Total % Change 8% 4 %
There was no organic change in total cost of products andservices sold in 2013. The increase in cost of products and servicessold related to the organic sales growth (1%) was offset by theabsence of amortization of inventory fair-value adjustments (1%) relatedto the Goodrich acquisition that were recorded in 2012 within the UTCAerospace Systems segment. The total increase in cost of productsand services sold is a result of the Goodrich and IAE transactions(9%) partially offset by lower cost of products and services sold as aresult of the UTC Climate, Controls & Security portfolio transformation(1%). Cost of products sold as a percentage of product sales declined100 basis points in 2013, as compared with 2012, as a result of thebenefits of favorable pricing and cost savings from prior restructuringactions.
Total cost of products and services sold increased (4%) at a rateconsistent with sales growth (4%) in 2012 as compared with 2011.The increase in cost of products and services sold is a result of theGoodrich and IAE transactions (8%) partially offset by lower cost ofproducts and services sold as a result of the UTC Climate, Controls &Security portfolio transformation (3%) and the beneficial impact offoreign currency exchange translation (2%).
Gross Margin
(DOLLARS IN MILLIONS) 2013 2012 2011
Gross margin $ 17,305 $ 15,555 $ 15,385
Percentage of net sales 27.6% 27.0% 27.6%
Gross margin as a percentage of sales increased 60 basis points,in 2013 as compared with 2012, driven primarily by the absence ofinventory fair-value adjustments related to the Goodrich acquisition thatwere recorded in 2012 (40 basis points) and lower loss provisionsrecorded by Sikorsky for a contract with the Canadian Government(20 basis points). The benefit of lower restructuring expense coupledwith savings from prior restructuring actions was offset by the adverseimpact of a sales mix shift from aftermarket to OEM in 2013.
Gross margin as a percentage of sales decreased 60 basispoints, in 2012 as compared with 2011, driven primarily by the adverseimpact of the Goodrich and IAE transactions (40 basis points), higherrestructuring expense in 2012 (30 basis points), and a loss provisionrecorded by Sikorsky for a contract with the Canadian Government(30 basis points), all of which was partially offset by benefits from thedisposition of lower margin businesses in connection with the UTCClimate, Controls & Security portfolio transformation (30 basis points).
Management’s Discussion and Analysis
2013 Annual Report 23
Research and Development
(DOLLARS IN MILLIONS) 2013 2012 2011
Company-funded $ 2,529 $ 2,371 $ 1,951
Percentage of net sales 4.0% 4.1% 3.5%
Customer-funded $ 2,140 $ 1,670 $ 1,419
Percentage of net sales 3.4% 2.9% 2.5%
Research and development spending is subject to the variablenature of program development schedules and, therefore, year-over-year variations in spending levels are expected. The majority of thecompany-funded spending is incurred by the aerospace businessesand relates largely to the next generation product family at Pratt &Whitney, the CSeries, Airbus A350, and Boeing 787 programs at UTCAerospace Systems, and various programs at Sikorsky. The year-over-year increase in company-funded research and development in 2013,compared with 2012, primarily reflects increases at UTC AerospaceSystems (10%) primarily due to development spending related to theGoodrich businesses for full year 2013 as compared to the 2012 post-acquisition period, offset by lower research and development spendingat Pratt & Whitney related to the development of multiple geared turbo-fan platforms (4%). The increase in customer-funded research anddevelopment in 2013, as compared with the prior year, reflects spend-ing related to the Goodrich businesses (18%) and at Pratt & Whitneyrelated to military programs (11%).
The increase in company-funded research and developmentin 2012, compared with 2011, primarily reflects increases at UTCAerospace Systems as a result of incremental research and develop-ment spending related to the Goodrich businesses (13%) and atPratt & Whitney to further advance development of multiple gearedturbofan platforms and military engines (5%). The increase incustomer-funded research and development in 2012, as comparedwith 2011, reflects spending related to the Goodrich businesses (24%)partially offset by a decrease at Sikorsky (4%) related to a reduction indevelopment spending on U.S. Government military platforms.
Company-funded research and development spending in 2014 isexpected to be consistent with 2013 levels.
Selling, General and Administrative
(DOLLARS IN MILLIONS) 2013 2012 2011
Selling, general and administrative $ 6,718 $ 6,452 $ 6,161
Percentage of net sales 10.7% 11.2% 11.1%
The increase in selling, general and administrative expenses in2013, as compared with 2012, (4%) is due primarily to the impact ofacquisitions, net of divestitures, completed over the preceding twelvemonths (5%) and higher export compliance costs (1%) partially offsetby cost savings from previous restructuring actions.
The increase in selling, general and administrative expensesin 2012, as compared with 2011, is due primarily to the impact ofacquisitions, net of divestitures, completed over the preceding twelvemonths (3%) and higher restructuring costs (2%). Higher pensioncosts (1%) were offset by favorable foreign exchange translation.
Other Income, Net
(DOLLARS IN MILLIONS) 2013 2012 2011
Other income, net $ 1,151 $ 952 $ 573
Other income, net includes the operational impact of equity earn-ings in unconsolidated entities, royalty income, foreign exchange gainsand losses as well as other ongoing and infrequently occurring items.The year-over-year change in Other income, net in 2013, as comparedwith 2012, largely reflects a $193 million gain on the sale of Pratt &Whitney Power Systems, a $39 million gain on a settlement with anengine program partner, higher licensing income of $30 million, andgains on the sale of real estate and other miscellaneous assets ofapproximately $82 million. All of this was partially offset by a $25 millioncharge to adjust the fair value of a Pratt & Whitney joint venture invest-ment, a $102 million decline in net gains related to the UTC Climate,Controls & Security portfolio transformation, and the absence of othergains recorded in 2012, including a $34 million gain on the fair valuere-measurement of the shares of Goodrich held by the Company priorto the acquisition of Goodrich and a $46 million gain as a result of theeffective settlement of a pre-existing contractual dispute in connectionwith the acquisition of Goodrich. The remaining increase in Otherincome, net is attributable to the normal recurring operational activityas disclosed above.
The year-over-year change in Other income, net in 2012, ascompared with 2011, largely reflects an approximately $46 million netyear-over-year increased gain resulting from UTC Climate, Controls &Security’s portfolio transformation, a $34 million gain on the fair valuere-measurement of the shares of Goodrich held by the Company priorto the acquisition of Goodrich, a $46 million gain resulting from theeffective settlement of a pre-existing contractual dispute in connectionwith the acquisition of Goodrich, an $81 million increase in incomefrom joint ventures, as well as the absence of both a $66 million other-than-temporary impairment charge on an equity investment at UTCClimate, Controls & Security, and $45 million of reserves established forlegal matters. The remaining increase in Other income, net is attribut-able to net gains recognized on miscellaneous asset sales and normalrecurring operational activity as disclosed above.
Interest Expense, Net
(DOLLARS IN MILLIONS) 2013 2012 2011
Interest expense $ 1,034 $ 893 $ 673
Interest income (137) (120) (177)
Interest expense, net $ 897 $ 773 $ 496
Average interest expense rate during the year on:Short-term borrowings 1.6% 0.9% 2.0%
Total debt 4.2% 4.1% 5.6%
Interest expense increased in 2013, as compared with 2012,primarily as a result of higher average debt balances throughout 2013associated with the financing and acquisition of Goodrich. The effect ofhigher average debt balances was partially offset by the absence ofinterest associated with the repayment of approximately $2.9 billion oflong-term debt including the 2015 UTC 1.200% Senior Notes, 2019
Management’s Discussion and Analysis
24 United Technologies Corporation

Goodrich 6.125% Notes, and 2021 Goodrich 3.600% Notes as well ascertain floating rate notes which were due in 2013. See the “Liquidityand Financial Condition” section of Management’s Discussion andAnalysis for further discussion on the Goodrich acquisition financing.Interest income increased in 2013, as compared with 2012, as a resultof favorable pre-tax interest adjustments related to the settlement ofoutstanding tax matters.
Interest expense increased in 2012, as compared with 2011,primarily as a result of higher average debt balances in 2012 associ-ated with the financing of our acquisition of Goodrich. Financing forthe Goodrich acquisition included a total of $9.8 billion of long-termdebt, $1.1 billion of equity units which bear contract adjustment pay-ments at a rate of 5.95% per year, and $3.2 billion from the issuance ofcommercial paper. We also entered into a term loan credit agreementfor $2 billion and borrowed the full amount available under this facility.In connection with the acquisition of Goodrich, we assumed long-termdebt of approximately $3.0 billion, which bears interest at rates rangingfrom 3.6% to 7.1%. Subsequent to the acquisition in 2012, we repaidapproximately $635 million of principal ($761 million fair value) of theassumed Goodrich debt, the entire $2.0 billion term loan, and nearly allof the commercial paper issued to finance the acquisition.
The increase in the weighted-average interest rates for short-termborrowings was due to the mix of our borrowings with a greater per-centage of short-term borrowings at lower interest rates in 2012 thanthe percentage of short-term borrowings in 2013. At December 31,2013 and 2012, we had commercial paper borrowings outstanding of$200 million and $320 million, respectively. The three month LIBORrate as of December 31, 2013, 2012 and 2011 was 0.2%, 0.3% and0.6%, respectively.
Income Taxes2013 2012 2011
Effective income tax rate 26.9% 24.8% 29.0%
The effective income tax rates for 2013, 2012, and 2011 reflecttax benefits associated with lower tax rates on international earnings,which we intend to permanently reinvest outside the United States. Weestimate our full year annual effective income tax rate in 2014 will beapproximately 30%, absent one-time adjustments. We anticipate somevariability in the tax rate quarter to quarter in 2014.
For additional discussion of income taxes and the effectiveincome tax rate, see “Critical Accounting Estimates—Income Taxes”and Note 11 to the Consolidated Financial Statements.
Net Income Attributable to Common Shareowners fromContinuing Operations
(DOLLARS IN MILLIONS, EXCEPT PER SHARE AMOUNTS) 2013 2012 2011
Net income attributable to commonshareowners from continuing operations $ 5,686 $ 4,847 $ 4,831
Diluted earnings per share fromcontinuing operations $ 6.21 $ 5.35 $ 5.33
To help mitigate the volatility of foreign currency exchangerates on our operating results, we maintain foreign currency hedgingprograms, the majority of which are entered into by Pratt & WhitneyCanada (P&WC). In 2013, foreign currency, including hedging atP&WC, did not result in any impact on earnings per diluted share.In 2012, foreign currency generated a net adverse impact on ouroperational results of $0.17 per diluted share, while in 2011 foreigncurrency had a favorable impact of $0.11 per diluted share. Foradditional discussion of foreign currency exposure, see “Market Riskand Risk Management—Foreign Currency Exposures.”
Restructuring charges of $481 million were offset by the net gainsfrom business disposition activity ($248 million) including UTC Climate,Controls & Security’s portfolio transformation and the sale of Pratt &Whitney’s Power Systems business, as well as income tax items asdiscussed further in Note 11 to the Consolidated Financial Statements.
Net Income Attributable to Common Shareowners fromDiscontinued Operations
(DOLLARS IN MILLIONS, EXCEPT PER SHARE AMOUNTS) 2013 2012 2011
Net income attributable to commonshareowners from discontinued operations $ 35 $ 283 $ 148
Diluted earnings per share fromdiscontinued operations $ 0.04 $ 0.31 $ 0.16
Diluted earnings per share from discontinued operations for 2013largely reflects the results of operations of $63 million up to the point ofdisposal. Diluted earnings per share from discontinued operations for2012 includes $0.82 per share of goodwill and net asset impairmentcharges related to Rocketdyne, Clipper and UTC Power, and $1.01per share gain on the disposition of the legacy Hamilton SundstrandIndustrial businesses. A $0.16 per share benefit from the results ofoperations of discontinued entities was partially offset by the $0.07per share Clipper warranty charge.
RESTRUCTURING COSTS
(DOLLARS IN MILLIONS) 2013 2012 2011
Restructuring costs $ 479 $ 614 $ 336
Restructuring actions are an essential component of our operatingmargin improvement efforts and relate to both existing operations andthose recently acquired. We expect to incur additional restructuringcosts in 2014 of approximately $300 million, including trailing costsrelated to prior actions associated with our continuing cost reductionefforts and the integration of acquisitions. The expected adverseimpact on earnings in 2014 from anticipated additional restructuringcosts is expected to be offset by the beneficial impact from gainsand other items that are outside the normal operating activities of thebusiness. Although no specific plans for significant actions have beenfinalized at this time, we continue to closely monitor the economicenvironment and may undertake further restructuring actions to keepour cost structure aligned with the demands of the prevailing marketconditions. As described below, the 2013 charges relate primarily to
Management’s Discussion and Analysis
2013 Annual Report 25

actions initiated during 2013 and 2012, while the 2012 charges relateprimarily to actions initiated during 2012 and 2011.
2013 Actions. During 2013, we recorded net pre-tax restructur-ing charges of $421 million relating to ongoing cost reduction actionsinitiated in 2013. The charges include severance related to workforcereductions and asset write-downs and facility exit and lease terminationcosts related to the consolidation of field and manufacturingoperations.
We are targeting to complete in 2014 the majority of the remain-ing workforce and facility related cost reduction actions initiated in2013. Approximately 75% of the total pre-tax charge will require cashpayments, which we have funded and expect to continue to fund withcash generated from operations. During 2013, we had cash outflowsof approximately $174 million related to the 2013 actions. We expectto incur additional restructuring and other charges of $59 million tocomplete these actions. We expect recurring pre-tax savings toincrease over the two-year period subsequent to initiating the actionsto approximately $440 million annually, of which, approximately $119million was realized in 2013.
2012 Actions. During 2013 and 2012, we recorded net pre-taxrestructuring charges of $60 million and $576 million, respectively, foractions initiated in 2012. The 2012 actions relate to ongoing costreduction efforts, including severance related to workforce reductionsand asset write-downs and facility exit and lease termination costsrelated to the consolidation of field and manufacturing operations.
We are targeting to complete in 2014 the majority of the remain-ing workforce and all facility related cost reduction actions initiated in2012. Approximately 85% of the total pre-tax charge will require cashpayments, which we have and expect to continue to fund with cashgenerated from operations. During 2013, we had cash outflows ofapproximately $252 million related to the 2012 actions. We expect toincur additional restructuring charges of $25 million to complete theseactions. We expect recurring pre-tax savings to increase over thetwo-year period subsequent to initiating the actions to approximately$550 million annually.
For additional discussion of restructuring, see Note 13 to theConsolidated Financial Statements.
SEGMENT REVIEW
Net Sales Operating Profits Operating Profit Margin
(DOLLARS IN MILLIONS) 2013 2012 2011 2013 2012 2011 2013 2012 2011
Otis $ 12,484 $ 12,056 $ 12,437 $ 2,590 $ 2,512 $ 2,815 20.7% 20.8% 22.6%
UTC Climate, Controls & Security 16,809 17,090 18,864 2,590 2,425 2,212 15.4% 14.2% 11.7%
Pratt & Whitney 14,501 13,964 12,711 1,876 1,589 1,867 12.9% 11.4% 14.7%
UTC Aerospace Systems 13,347 8,334 4,760 2,018 944 759 15.1% 11.3% 15.9%
Sikorsky 6,253 6,791 7,355 594 712 840 9.5% 10.5% 11.4%
Total segment 63,394 58,235 56,127 9,668 8,182 8,493 15.3% 14.0% 15.1%
Eliminations and other (768) (527) (373) 22 (72) (228)
General corporate expenses – – – (481) (426) (419)
Consolidated $ 62,626 $ 57,708 $ 55,754 $ 9,209 $ 7,684 $ 7,846 14.7% 13.3% 14.1%
Commercial Businesses
The financial performance of our commercial businesses can beinfluenced by a number of external factors including fluctuations inresidential and commercial construction activity, regulatory changes,interest rates, labor costs, foreign currency exchange rates, customerattrition, raw material and energy costs, credit markets and otherglobal and political factors. UTC Climate, Controls & Security’s financialperformance can also be influenced by production and utilizationof transport equipment, and for its residential business, weatherconditions. Geographic and industry diversity across the commercialbusinesses help to balance the impact of such factors on our consoli-dated operating results, particularly in the face of uneven economicgrowth. Worldwide economic conditions remained generally favorablefor Otis with strong new equipment order growth rates in China (25%)
and the Americas (16%) throughout 2013, partially offset by lower ratesof new equipment order growth in Europe (4%) and declines in otherareas in Asia (6%). Within the UTC Climate, Controls & Securitysegment, North American residential heating, ventilation and airconditioning (HVAC) orders increased (15%), due largely to animproving housing market, while global commercial HVAC ordersincreased (1%).
In both 2013 and 2012, 70% of total commercial business saleswere generated outside the U.S., including U.S. export sales. Thefollowing table shows sales generated outside the U.S., including U.S.export sales, for each of the commercial business segments:
2013 2012
Otis 82% 82%
UTC Climate, Controls & Security 61% 62%
Management’s Discussion and Analysis
26 United Technologies Corporation

Otis is the world’s largest elevator and escalator manufacturing,installation and service company. Otis designs, manufactures, sellsand installs a wide range of passenger and freight elevators for low-,medium- and high-speed applications, as well as a broad line ofescalators and moving walkways. In addition to new equipment,Otis provides modernization products to upgrade elevators and
escalators as well as maintenance and repair services for both itsproducts and those of other manufacturers. Otis serves customersin the commercial and residential property industries around theworld. Otis sells directly to the end customer and through salesrepresentatives and distributors.
Total Increase (Decrease) Year-Over-Year for:
(DOLLARS IN MILLIONS) 2013 2012 2011 2013 Compared with 2012 2012 Compared with 2011
Net Sales $ 12,484 $ 12,056 $ 12,437 $ 428 4% $ (381) (3)%
Cost of Sales 8,345 8,008 8,090 337 4% (82) (1)%
4,139 4,048 4,347
Operating Expenses and Other 1,549 1,536 1,532
Operating Profits $ 2,590 $ 2,512 $ 2,815 $ 78 3% $ (303) (11)%
Factors Contributing to Total % Increase (Decrease) Year-Over-Year in:
2013 2012
Net SalesCost of
SalesOperating
Profits Net SalesCost of
SalesOperating
Profits
Organic/Operational 3% 5 % (1)% – 1 % (3)%
Foreign currency translation – – – (3)% (3)% (4)%
Acquisitions and divestitures, net 1% – – – – –
Restructuring costs – (1)% 3 % – 1 % (4)%
Other – – 1 % – – –
Total % change 4% 4 % 3 % (3)% (1)% (11)%
2013 Compared with 2012Organic sales increased 3% in 2013 due to higher new equipmentsales (3%) primarily in China, the U.S. and Russia partially offset bydeclines in South Korea. Service sales increases in Asia, Brazil andthe U.S. were partially offset by declines in southern Europe.
The operational profit declined slightly for the year (1%) due princi-pally to lower service contribution (2%) resulting from continued pricingpressures. New equipment contribution increased 2% due to highernew equipment volume and the impact of lower commodity costs,partially offset by costs associated with the factory consolidation inNorth America. Overhead expenses increased 1% due to continuedgrowth in emerging markets.
2012 Compared with 2011There was no organic sales growth in 2012 as higher service saleswere offset by lower new equipment sales. Higher service sales inAsia and the Americas (2%) were offset by declines in Europe (1%).Lower new equipment volume (1%) primarily in China and Europewas partially offset by a slight increase in the Americas and Russia.
The operational profit decline for the year (3%) was due to lowernew equipment contribution driven by lower volume and pricingpressures (4%), lower service contribution (1%) resulting from contin-ued pricing pressure primarily in Europe, and the impact of highercommodity costs (1%). Partially offsetting these factors were benefitsderived from ongoing cost reduction initiatives (3%).
UTC Climate, Controls & Security is the leading provider of HVAC andrefrigeration solutions, including controls for residential, commercial,
industrial and transportation applications. These products and servicesare sold under the Carrier name and other brand names to buildingcontractors and owners, homeowners, transportation companies, retailstores and food service companies. Through its venture with Watsco,Inc., UTC Climate, Controls & Security distributes Carrier, Bryant,Payne and Totaline residential and light commercial HVAC products inthe U.S. and selected territories in the Caribbean and Latin America.UTC Climate, Controls & Security sells directly to end customers andthrough manufacturers’ representatives, distributors, wholesalers, deal-ers and retail outlets. Certain of UTC Climate, Controls & Security’sHVAC businesses are seasonal and can be impacted by weather. UTCClimate, Controls & Security is also a global provider of security andfire safety products and services. UTC Climate, Controls & Securityprovides electronic security products such as intruder alarms, accesscontrol systems and video surveillance systems and designs andmanufactures a wide range of fire safety products including specialtyhazard detection and fixed suppression products, portable fire extin-guishers, fire detection and life safety systems, and other firefightingequipment. Services provided to the electronic security and fire safetyindustries include systems integration, video surveillance, installation,maintenance, and inspection. In certain markets, UTC Climate, Con-trols & Security also provides monitoring, response and securitypersonnel services, including cash-in-transit security, to complement itselectronic security and fire safety businesses. UTC Climate, Controls &Security customarily offers its customers incentives to purchase prod-ucts to ensure an adequate supply in the distribution channels. Theprincipal incentive program provides reimbursements to distributors for
Management’s Discussion and Analysis
2013 Annual Report 27

offering promotional pricing on UTC Climate, Controls & Security prod-ucts. UTC Climate, Controls & Security products and services are usedby governments, financial institutions, architects, building owners anddevelopers, security and fire consultants, homeowners and other end-users requiring a high level of security and fire protection for their
businesses and residences. UTC Climate, Controls & Security providesits security and fire safety products and services under Chubb, Kiddeand other brand names and sells directly to customers as well asthrough manufacturer representatives, distributors, dealers and U.S.retail distribution.
Total Increase (Decrease) Year-Over-Year for:
(DOLLARS IN MILLIONS) 2013 2012 2011 2013 Compared with 2012 2012 Compared with 2011
Net Sales $ 16,809 $ 17,090 $ 18,864 $ (281) (2)% $ (1,774) (9)%
Cost of Sales 11,918 12,316 13,848 (398) (3)% (1,532) (11)%
4,891 4,774 5,016
Operating Expenses and Other 2,301 2,349 2,804
Operating Profits $ 2,590 $ 2,425 $ 2,212 $ 165 7% $ 213 10 %
Factors Contributing to Total % Increase (Decrease) Year-Over-Year in:
2013 2012
Net SalesCost of
SalesOperating
Profits Net SalesCost of
SalesOperating
Profits
Organic/Operational 1 % – 9 % – – 10 %
Foreign currency translation – – – (2)% (3)% (2)%
Acquisitions and divestitures, net (3)% (3)% – (7)% (8)% –
Restructuring costs – – 2 % – – (1)%
Other – – (4)% – – 3 %
Total % change (2)% (3)% 7 % (9)% (11)% 10 %
2013 Compared with 2012The organic sales increase (1%) for the year primarily reflects growthin the Americas (1%), driven by the U.S. residential HVAC business,and the transport refrigeration business (1%), partially offset by declinesin Europe (1%) as a result of weak end markets. The decrease in“Acquisitions and divestitures, net” sales (3%) reflects the year-over-year impact of divestitures completed in the preceding twelve monthsassociated with UTC Climate, Controls & Security’s portfoliotransformation.
The 9% operational profit increase was driven largely by thebenefits of restructuring actions and cost productivity (combined 4%),volume growth (3%), and favorable commodity costs (2%). The 4%decrease in “Other” primarily reflects an approximately $102 million netyear-over-year impact from UTC Climate, Controls & Security’s portfoliotransformation. Portfolio transformation activity in 2013 resulted in anet gain of approximately $55 million, including gains from the sale ofbusinesses in Hong Kong and Australia, as compared to a net gain of$157 million in 2012.
2012 Compared with 2011There was no organic sales growth during 2012 as lower volumes inthe transport refrigeration business (1%) were offset by growth in theAmericas (1%) attributable to the residential and commercial HVACbusinesses. The decrease in “Acquisitions and divestitures, net” (7%)reflects the year-over-year impact of divestitures completed in thepreceding twelve months associated with UTC Climate, Controls &Security’s portfolio transformation.
The 10% operational profit increase was driven largely by thebenefits of net cost productivity and restructuring actions (combined
3%) including savings from the consolidation of legacy Carrier andUTC Fire & Security, favorable commodity costs (2%), and higherequity income from joint venture partners (2%). Also, operational profitincluded the benefit of a special cash dividend (1%) received from aninterest in a distribution partner. The 3% increase in “Other” primarilyreflects an approximately $46 million net year-over-year gain from UTCClimate, Controls & Security’s portfolio transformation and the absenceof a $66 million other-than-temporary impairment charge recorded onan Asian equity investment in the prior year. This was partially offsetby the absence of an approximately $25 million favorable litigationresolution and gain on the disposition of the U.K. Security business,both recorded in 2011. The year-over-year net portfolio transformationgain primarily includes approximately $120 million from the sale of acontrolling interest in a Canadian distribution business, including a$24 million pension settlement charge, combined with an approxi-mately $215 million net gain from the sale of a controlling interest in amanufacturing and distribution joint venture in Asia. These gains werepartially offset by a $32 million loss on the disposition of the U.S. Fire& Security branch operations, $142 million of impairment chargesrecorded in 2012 related to ongoing business dispositions, and theabsence of an approximately $80 million prior year gain resultingprimarily from the contribution of legacy Carrier’s HVAC operationsin Brazil, Argentina and Chile into a new venture controlled by MideaGroup of China.
Aerospace Businesses
The financial performance of Pratt & Whitney, UTC Aerospace Systemsand Sikorsky is directly tied to the economic conditions of the commer-cial aerospace and defense aerospace industries. In particular, Pratt &
Management’s Discussion and Analysis
28 United Technologies Corporation

Whitney experiences intense competition for new commercial airframe/engine combinations. Engine suppliers may offer substantial discountsand other financial incentives, performance and operating cost guaran-tees, and participate in financing arrangements which may result inlosses on the OEM engine sales. Economically, such up-front lossesare typically recovered through the sales and profits generated over theengine’s maintenance cycle. At times, the aerospace businesses alsoenter into development programs and firm fixed-price developmentcontracts, which may require the company to bear cost overrunsrelated to unforeseen technical and design challenges that arise duringthe development stage of the program. Customer selections of enginesand components can also have a significant impact on later sales ofparts and service. Predicted traffic levels, load factors, worldwide airlineprofits, general economic activity and global defense spending havebeen reliable indicators for new aircraft and aftermarket orders withinthe aerospace industry. Spare part sales and aftermarket service trendsare affected by many factors, including usage, technological improve-ments, pricing, regulatory changes and the retirement of older aircraft.Performance in the general aviation sector is closely tied to the overallhealth of the economy and is positively correlated to corporate profits.
Our long-term aerospace contracts are subject to strict safety andperformance regulations which can affect our ability to estimate costsprecisely. Contract cost estimation for the development of complexprojects, in particular, requires management to make significant judg-ments and assumptions regarding the complexity of the work to beperformed, availability of materials, the performance by subcontractors,the timing of funding from customers and the length of time to com-plete the contract. As a result, we review and update our costestimates on significant contracts on a quarterly basis, and no less fre-quently than annually for all others, and when circumstances changeand warrant a modification to a previous estimate. Changes in esti-mates relate to the current period impact of revisions to total estimatedcontract sales and costs at completion. We record changes in contractestimates using the cumulative catch-up method in accordance withthe Revenue Recognition Topic of the FASB Accounting StandardsCodification (“ASC”). Net operating profits included significant changesin aerospace contract estimates of $167 million in 2013 driven byseveral favorable contract adjustments recorded throughout the yearlargely at the Pratt & Whitney segment. The impact of these adjust-ments was not considered significant to either the sales or operatingprofits of the segment in the quarter in which they were recorded otherthan the impact of a contract termination which was disclosed in thePratt & Whitney segment results in the first quarter of 2013. The netchange in contract estimates also includes the $27 million adverseimpact of a revision in estimate on the Sikorsky CH-148 contractdiscussed further below. In accordance with our revenue recognitionpolicy, losses, if any, on long-term contracts are provided for whenanticipated. Loss provisions on OEM contracts are recognized to theextent that estimated inventoriable manufacturing, engineering, productwarranty and product performance guarantee costs, as appropriate,exceed the projected revenue from the products contemplated underthe contractual arrangement.
The commercial airline industry remained strong throughout 2013.Airline traffic growth rates, as measured by revenue passenger miles(RPMs) grew approximately 5% in 2013, as compared with 2012. Air-lines’ profitability has continued to grow and airlines are forecasted bythird party analysts to earn $16.4 billion in 2014. Nevertheless, highfuel prices continue to challenge the airlines to consider the need formore fuel efficient aircraft. Pratt & Whitney continues to develop fiveseparate geared turbofan platforms and has begun to build capacityto meet demand for new engines which are fuel efficient and havereduced noise levels and exhaust emissions. There is also strongdemand for commercial helicopters, particularly from deep-water oiland gas exploration around the world.
U.S. Government deficit reduction measures continue to pressurethe U.S. Department of Defense spending and adversely affect ourmilitary business. Total sales to the U.S. Government of $9.9 billion in2013, $10.1 billion in 2012, and $9.1 billion in 2011 were 16%, 18%and 16% of total UTC sales in 2013, 2012, and 2011, respectively. Thedefense portion of our aerospace business is affected by changes inmarket demand and the global political environment. Our participationin long-term production and development programs for the U.S.Government has contributed positively to our results in 2013 and isexpected to continue to benefit results in 2014. In July 2012, theU.S. Government and Sikorsky signed a five-year multiservice contract(“Multi-year 8”) for approximately 650 H-60 helicopters. Actual pro-duction quantities will be determined year-by-year over the life ofthe program based on funding allocations set by Congressional andPentagon acquisition priorities.
As previously reported, Sikorsky is developing the CH-148 deriva-tive of the H-92 helicopter (the “Cyclone”), a military variant of the S-92helicopter, for the Canadian Government. The Cyclone is being devel-oped under a fixed-price contract that provides for the developmentand production of 28 helicopters (the “Acquisition Contract”), and arelated In Service Support contract (the “ISS Contract”) through March2028 (collectively, the “Arrangements”). The current contract values ofthe Arrangements are estimated to be $4.2 billion and are subject tochanges in underlying variables such as the timing of deliveries, futureflight hours and fluctuations in foreign currency exchange rates.
In 2011, Sikorsky completed a significant contractual milestonefor work on four interim configuration helicopters and recognized therevenues and related costs. Although the Arrangements were expectedto be profitable on a combined basis in 2011, $56 million of losseswere recorded upon completing the milestones for the four aircraftas the actual costs exceeded revenues. Sikorsky and the CanadianGovernment are currently using these aircraft for initial operationaltraining and evaluation in Canada. These interim configuration aircraftwill require further software and hardware upgrades before full missioncapability can be achieved.
Delivery of the final configuration aircraft, which was scheduledto begin in 2012, did not occur due to a number of disputes betweenthe Canadian Government and Sikorsky related to contractualrequirements and contract performance. As a result of these matters,Sikorsky recorded a loss provision of $157 million during the fourthquarter of 2012 as the estimated profits on the ISS Contract no longer
Management’s Discussion and Analysis
2013 Annual Report 29

exceeded the estimated remaining losses on the Acquisition Contract.The profit erosion was driven by an increase in total expected coststo be incurred primarily as a result of the delays in delivering the finalconfiguration aircraft resulting in a claim for liquidated damages, anda reduction of expected flight hour revenues on the ISS Contract.
During 2013, Sikorsky made substantial progress in the manufac-turing process for the remaining 24 aircraft. However, due to ongoingcontractual disputes with the Canadian Government, no revenue wasrecorded for these aircraft in 2013, and an incremental $27 millioncharge was recorded in the quarter ended December 31, 2013 dueto program delays and related production cost increases. Since theAcquisition Contract’s costs exceed its revenues on a stand-alonebasis, we expect to record an approximately $14 million loss uponachievement of the contractual milestone for each aircraft in the future.
In December 2013, Sikorsky and the Canadian Governmentsigned a Principles of Agreement that establishes a framework torestructure the contracts while providing a new governance and projectstructure. That agreement serves as the basis for ongoing formal con-tract negotiations and requires the parties to enter into a yet-to-benegotiated contractual amendment no later than March 31, 2014. Ourfinancial plan for 2014 anticipates revenue recognition of eight interimconfiguration helicopters during the course of the year.
While Sikorsky is committed to the program, the unresolved con-tract restructuring, coupled with the remaining development issues andlong-term nature of this program, provide substantial uncertainty andrisk in regards to the Acquisition Contract costs. While the loss provi-sions recorded to date reflect management’s best estimate of theprojected costs to complete the development and manufacture of thefinal configuration aircraft, there is still significant effort required to com-plete the development of the mission system capability as well as themanufacturing, testing and retrofit activities. Future variability in internalcost targets related to the aircraft may be caused by increases in hold-ing costs, retrofit estimates, and subcontractor performance. Withrespect to the multi-year ISS Contract, the future profitability is depen-dent upon a number of factors including aircraft deliveries, aircraft flighthours, deployed aircraft availability, aircraft performance, availability oftrained pilots and government budgetary pressures. The inability toachieve a satisfactory contractual solution, further unplanned delays,additional developmental cost growth or variations in any of the esti-mates used in the existing contract analysis could lead to furtherloss provisions on the Arrangements. Additional losses could havea material adverse impact on the consolidated results of operationsin the period in which the loss may be recognized.
Effective July 1, 2012, the auxiliary power unit business (APU) ofthe UTC Aerospace Systems business segment was transferred to thePratt & Whitney business segment. The APU business designs andmanufactures a variety of products for commercial and military aircraft.Annual sales for the APU business are approximately $600 million. Thereclassification has been made prospectively; prior year results havenot been restated for the transfer of the business.
Pratt & Whitney is among the world’s leading suppliers of aircraftengines for the commercial, military, business jet and general aviation
markets. Pratt & Whitney provides maintenance, repair and overhaulservices, including the sale of spare parts, as well as fleet managementservices for large commercial engines. Pratt & Whitney produces fami-lies of engines for wide and narrow-body and large regional aircraft inthe commercial market and for fighter and transport aircraft in the militarymarket. P&WC is a world leader in the production of engines poweringgeneral and business aviation, as well as regional airline, utility and militaryairplanes and helicopters, and provides related maintenance, repair andoverhaul services, including the sale of spare parts, as well as fleet man-agement services. Pratt & Whitney’s products are sold principally toaircraft manufacturers, airlines and other aircraft operators, aircraft leasingcompanies, and the U.S. and foreign governments. Pratt & Whitney’sproducts and services must adhere to strict regulatory and market-driven safety and performance standards. The frequently changingnature of these standards, along with the long duration of aircraftengine development, production and support programs, createsuncertainty regarding engine program profitability. The vast majority ofsales are made directly to the end customer and, to a limited extent,through independent distributors and foreign sales representatives.
Pratt & Whitney is currently developing technology, including thePurePower PW1000G Geared TurboFan engine, intended to enable itto power both currently-proposed and future aircraft. The PurePowerPW1000G engine targets a significant reduction in fuel burn and noiselevels with lower environmental emissions and operating costs thancurrent production engines. In December 2010, Airbus announcedthat it will offer a version of the PurePower PW1000G engine as anew engine option to power its A320neo family of aircraft scheduledto enter into service in 2015. In November 2012, Pratt & Whitneycommenced testing on this new engine, the PW1100G-JM, beingdeveloped as part of a collaboration with MTU and JAEC. Additionally,PurePower PW1000G engine models have been selected by Bombar-dier to power the new CSeries passenger aircraft, by Mitsubishi AircraftCorporation to power the new Mitsubishi Regional Jet, and by IrkutCorporation of Russia to power the proposed new Irkut MC-21 pas-senger aircraft. The CSeries passenger aircraft engine received its civilaviation certificate from Transport Canada in February 2013, had itsfirst flight in September 2013, and is scheduled to enter into servicein 2015. The Mitsubishi Regional Jet and the Irkut MC-21 are bothscheduled to enter into service in 2017. Further, on January 8, 2013,Embraer announced the selection of the PurePower engine to exclu-sively power the next generation of Embraer’s E-Jet family of aircraftscheduled to enter service in 2018. The success of these aircraft andthe PurePower PW1000G family of engines is dependent upon manyfactors including technological accomplishments, aircraft demand, andregulatory approval. Based on these factors, as well as the level ofsuccess of aircraft program launches by aircraft manufacturers andother conditions, additional investment in the PurePower program maybe required. P&WC has developed or is developing the PW210 enginefamily for helicopters manufactured by Sikorsky, AgustaWestland andAirbus Helicopters and is developing the PurePower PW800 engine forthe new generation of long-range and heavy business jets. Pratt &Whitney continues to enhance its programs through performanceimprovement measures and product base expansion.
Management’s Discussion and Analysis
30 United Technologies Corporation

In view of the risks and costs associated with developing newengines, Pratt & Whitney has entered into collaboration arrangementsin which sales, costs and risks are shared. At December 31, 2013,the interests of third party participants in Pratt & Whitney-directedcommercial jet engine programs ranged from 2 percent to 49 percent.In addition, Pratt & Whitney has interests in other engine programs,including a 50 percent ownership interest in the Engine Alliance (EA),a joint venture with GE Aviation, which markets and manufacturesthe GP7000 engine for the Airbus A380 aircraft. Pratt & Whitney hasentered into risk and revenue sharing arrangements with third parties
for 40 percent of the products and services that Pratt & Whitney isresponsible for providing to the EA. Pratt & Whitney accounts for itsinterests in the EA joint venture under the equity method of accounting.Pratt & Whitney continues to pursue additional collaboration partners.
On June 29, 2012, Pratt & Whitney, Rolls-Royce, MTU and JAEC,participants in the IAE collaboration, completed a restructuring of theirinterests in IAE. Pratt & Whitney now has a 61% net interest in thecollaboration and a 49.5% ownership interest in IAE. See the BusinessOverview section of Management’s Discussion and Analysis for furtherinformation on the IAE transaction.
Total Increase (Decrease) Year-Over-Year for:
(DOLLARS IN MILLIONS) 2013 2012 2011 2013 Compared with 2012 2012 Compared with 2011
Net Sales $ 14,501 $ 13,964 $ 12,711 $ 537 4% $ 1,253 10%
Cost of Sales 11,148 10,600 9,282 548 5% 1,318 14%
3,353 3,364 3,429
Operating Expenses and Other 1,477 1,775 1,562
Operating Profits $ 1,876 $ 1,589 $ 1,867 $ 287 18% $ (278) (15)%
Factors Contributing to Total % Increase (Decrease) Year-Over-Year in:
2013 2012
Net SalesCost of
SalesOperating
Profits Net SalesCost of
SalesOperating
Profits
Organic*/Operational* 2% 3% 13 % 2 % 5% (16)%
Foreign currency (including P&WC net hedging)* – – – (1)% – (3)%
Acquisitions and divestitures, net 2% 2% 1 % 9 % 9% 6 %
Restructuring costs – – (4)% – – (2)%
Other – – 8 % – – –
Total % change 4% 5% 18 % 10 % 14% (15)%
* As discussed further in the “Business Overview” and “Results of Operations” sections, for Pratt & Whitney only, the transactional impact of foreign exchange hedging at P&WC hasbeen netted against the translational foreign exchange impact for presentation purposes in the above table. For all other segments, these foreign exchange transactional impactsare included within the organic sales/operational operating profit caption in their respective tables. Due to its significance to Pratt & Whitney’s overall operating results, we believeit is useful to segregate the foreign exchange transactional impact in order to clearly identify the underlying financial performance.
2013 Compared with 2012The organic sales increase (2%) was primarily driven by highercommercial engine sales volume (2%), higher military aftermarketand development program sales (2%), higher commercial aftermarketsales (1%), and higher industrial engine sales and related developmentcontracts (1%), partially offset by lower military engine sales volume(4%). Sales increased (2%) as a result of the consolidation of IAE andthe transfer of the AeroPower business to Pratt & Whitney from UTCAerospace Systems, partially offset by the divestiture of Pratt &Whitney Power Systems.
The operational profit increase (13%) was driven by favorablecommercial aftermarket volume and sales mix (9%), lower researchand development spending (6%), favorable military sales mix (3%),profits from industrial turbines and related development contracts(2%), and income from licensing agreements (1%), partially offsetby unfavorable commercial engine volume and mix (6%), and theabsence of a gain as a result of the effective settlement of a pre-existing contractual dispute in connection with the acquisition ofGoodrich in 2012 (3%). Restructuring savings were largely offset byhigher pension costs. The increase in “Acquisitions and divestitures,
net” (1%) reflects the consolidation of IAE and the transfer of theAeroPower business to Pratt & Whitney from UTC Aerospace Systems,partially offset by the divestiture of Pratt & Whitney Power Systems.“Other” reflects a gain on the sale of Pratt & Whitney Power Systems(12%) and a gain on the sale of intellectual property (1%), offset bya fair value adjustment of a joint venture investment (2%), and theabsence of gains on the sale of equity interest in a joint venture (2%)and on the consolidation resulting from a restructuring of interests inIAE (1%) in 2012.
2012 Compared with 2011Organic sales growth (2%) was driven by higher military enginedeliveries and aftermarket sales (5%), higher P&WC engine and sparesvolume (1%), and higher industrial volume at Pratt & Whitney PowerSystems (1%), offset by a decrease in commercial aftermarket (6%).Sales increased (9%) as a result of the consolidation of IAE and thetransfer of the APU business to Pratt & Whitney from UTC AerospaceSystems.
The operational profit decrease (16%) was primarily driven bylower profit on commercial aftermarket (17%), and higher research anddevelopment (8%), partially offset by favorable P&WC engine volume
Management’s Discussion and Analysis
2013 Annual Report 31

and delivery mix (3%), higher military engine and spares volume (3%)and an increase in contract settlements and close outs (3%). Operatingprofit increased 6% due to net acquisitions primarily as a result of theconsolidation of IAE.
UTC Aerospace Systems—On July 26, 2012, UTC acquiredGoodrich, pursuant to a merger agreement dated September 21,2011. As a result of the acquisition, Goodrich became a wholly-ownedsubsidiary of UTC. The acquired Goodrich business and the formerHamilton Sundstrand segment have been combined to form the newUTC Aerospace Systems segment. UTC Aerospace Systems is amongthe world’s leading suppliers of technologically advanced aerospaceproducts and aftermarket services for diversified markets worldwide.UTC Aerospace Systems’ aerospace products include electric power
generation, management and distribution systems, flight controlsystems, engine control systems, intelligence, surveillance andreconnaissance systems, engine components, environmental controlsystems, fire protection and detection systems, propeller systems,aircraft nacelles, and interior, actuation, landing and electronic systems.UTC Aerospace Systems products serve commercial, military, regional,business and general aviation, as well as military ground vehicle, spaceand undersea applications. Aftermarket services include spare parts,overhaul and repair, engineering and technical support and fleetmanagement solutions. UTC Aerospace Systems sells aerospaceproducts to airframe manufacturers, the U.S. and foreign governments,aircraft operators, maintenance, repair and overhaul providers, andindependent distributors.
Total Increase (Decrease) Year-Over-Year for:
(DOLLARS IN MILLIONS) 2013 2012 2011 2013 Compared with 2012 2012 Compared with 2011
Net Sales $ 13,347 $ 8,334 $ 4,760 $ 5,013 60% $ 3,574 75%
Cost of Sales 9,534 6,090 3,403 3,444 57% 2,687 79%
3,813 2,244 1,357
Operating Expenses and Other 1,795 1,300 598
Operating Profits $ 2,018 $ 944 $ 759 $ 1,074 114% $ 185 24%
Factors Contributing to Total % Increase (Decrease) Year-Over-Year in:
2013 2012
Net SalesCost of
SalesOperating
Profits Net SalesCost of
SalesOperating
Profits
Organic/Operational 4% 2% 37% 7 % 6 % 6 %
Foreign currency translation – – 1% (1)% (1)% (1)%
Acquisitions and divestitures, net 56% 55% 74% 69 % 73 % 33 %
Restructuring costs – – 2% – 1 % (14)%
Other – – – – – –
Total % change 60% 57% 114% 75 % 79 % 24 %
2013 Compared with 2012The organic sales growth (4%) primarily reflects an increase incommercial aerospace OEM and commercial aftermarket volume(5%) partially offset by lower military OEM sales volume (1%).
The organic increase in operational profit (37%) primarily reflectsthe absence of amortization of inventory fair-value adjustments(26%) related to the Goodrich acquisition, lower selling, general andadministrative expenses (9%) including the impact of synergies fromthe integration of Goodrich, lower research and development costs(6%), the profit contribution on higher aftermarket sales volume (6%)and higher licensing and royalty income (3%), partially offset by lowerprofits on OEM sales (15%) primarily attributable to adverse mix incommercial and military markets. “Acquisitions and Divestitures, net”is principally a result of the acquisition of Goodrich.
2012 Compared with 2011The organic sales growth (7%) reflects higher commercial aerospaceOEM (4%), military aerospace OEM (2%), and aftermarket (1%) volume.
The organic increase in operational profit (6%) primarily reflectsthe benefit of profit contribution on higher sales (11%) and lower
warranty costs (5%) partially offset by higher engineering anddevelopment (4%) and pension costs (6%). “Acquisitions anddivestitures, net” is principally a result of the acquisition of Goodrich.
Sikorsky is one of the world’s largest helicopter companies. Sikorskymanufactures military and commercial helicopters and also providesaftermarket helicopter and aircraft parts and services.
Current major production programs at Sikorsky include theUH-60M Black Hawk medium-transport helicopters and HH-60MMedevac helicopters for the U.S. and foreign governments, the S-70Black Hawk for foreign governments, the MH-60S and MH-60Rhelicopters for the U.S. Navy, the International Naval Hawk for multiplenaval missions, and the S-76 and S-92 helicopters for commercialoperations. The UH-60M helicopter is the latest and most modern ina series of Black Hawk variants that Sikorsky has been delivering tothe U.S. Army since 1978. In July 2012, the U.S. Government andSikorsky signed a five-year multi-service contract for approximately650 H-60 helicopters. Actual production quantities will be determinedyear-by-year over the life of the program based on funding allocationsset by Congress and the U.S. Department of Defense acquisition
Management’s Discussion and Analysis
32 United Technologies Corporation

priorities, as well as the U.S. Foreign Military Sales program. Sikorskyis also developing the CH-53K next generation heavy lift helicopter forthe U.S. Marine Corps and the CH-148 derivative of the H-92helicopter, a military variant of the S-92 helicopter, for the CanadianGovernment. See the Aerospace Business section of Management’sDiscussion and Analysis above, for further discussion of Sikorsky’scontract with the Canadian Government.
Sikorsky’s aftermarket business includes spare parts sales,mission equipment, overhaul and repair services, maintenance
contracts and logistics support programs for helicopters and other air-craft. Sales are principally made to the U.S. and foreign governments,and commercial helicopter operators. Sikorsky is increasingly engagingin logistics support programs and partnering with its government andcommercial customers to manage and provide logistics, maintenanceand repair services.
Total Increase (Decrease) Year-Over-Year for:
(DOLLARS IN MILLIONS) 2013 2012 2011 2013 Compared with 2012 2012 Compared with 2011
Net Sales $ 6,253 $ 6,791 $ 7,355 $ (538) (8)% $ (564) (8)%
Cost of Sales 5,141 5,643 6,120 (502) (9)% (477) (8)%
1,112 1,148 1,235
Operating Expenses and Other 518 436 395
Operating Profits $ 594 $ 712 $ 840 $ (118) (17)% $ (128) (15)%
Factors Contributing to Total % Increase (Decrease) Year-Over-Year in:
2013 2012
Net SalesCost of
SalesOperating
Profits Net SalesCost of
SalesOperating
Profits
Organic/Operational (8)% (9)% (16)% (8)% (8)% (7)%
Other – – (1)% – – (8)%
Total % change (8)% (9)% (17)% (8)% (8)% (15)%
2013 Compared with 2012The organic sales decrease (8%) reflects decreased internationalmilitary sales (8%), decreased U.S. Government sales (2%) due tolower volume and unfavorable Multi-year 8 reset provisions, lower vol-ume on customer funded development programs (2%) and decreasedaftermarket sales (4%) due to lower military spares activity, partiallyoffset by higher commercial aftermarket volume. These decreaseswere partially offset by increased commercial aircraft sales (8%)due to increased S-92 and S-76D aircraft sales volume andcompletion services.
The operational profit decrease (16%) reflects lower profitabilityfrom the U.S. Government (19%), aftermarket (5%), and customerfunded development programs (4%); lower international military aircraftvolume (8%); higher export compliance (5%); other selling, general andadministrative costs including pension and salaries (3%); and researchand development (1%) costs. The decline in profitability on U.S.Government programs was due to lower aircraft volume, Multi-year 8pricing reset provisions and aircraft cost performance, while the declinein aftermarket was due to lower military spares volume partially offsetby favorable contract performance. These operational profit decreaseswere partially offset by lower loss provision adjustments for the previ-ously noted CH-148 contract with the Canadian Government (18%)and higher profitability from commercial operations (10%) due to higherS-92 and S-76D aircraft sales and completions volume.
2012 Compared with 2011The organic sales decrease (8%) reflects reduced aircraft deliveriesand completions from foreign military operations (6%) across variousprograms including four fewer CH-148 aircraft for the CanadianGovernment, reduced U.S. Government sales (2%) and lower volumefrom customer funded development programs (2%). These decreaseswere partially offset by increased commercial aircraft volume (2%) dueprimarily to increased S-92 sales, which were partially offset by lowerS-76 sales as Sikorsky transitions to the new S-76D model.
The operational profit decrease (7%) is a result of lower salesto the U.S. Government (12%), higher engineering and developmentcosts (1%) and lower profits from foreign military operations (8%) duein large part to the previously noted $157 million loss provision for theCH-148 contract with the Canadian Government, partially offset byfavorable aircraft mix within the foreign military operations business.These decreases were partially offset by an increase in commercialprofits (10%) due primarily to strong S-92 volume and profitability,and increased aftermarket support (5%) due primarily to increasedU.S. Government spares sales, favorable contract performance andsavings from restructuring initiatives. The 8% decrease in “Other” pri-marily reflects the absence of a gain recognized on the contributionof a business to a venture in the United Arab Emirates in 2011.
Management’s Discussion and Analysis
2013 Annual Report 33

Eliminations and otherNet Sales Operating Profits
(DOLLARS IN MILLIONS) 2013 2012 2011 2013 2012 2011
Eliminations and other $ (768) $ (527) $ (373) $ 22 $ (72) $ (228)
General corporate expenses – – – (481) (426) (419)
Eliminations and other reflects the elimination of sales, otherincome and operating profit transacted between segments, as well asthe operating results of certain smaller businesses. The change in salesin 2013, as compared with 2012, reflects an increase in the amount ofinter-segment sales eliminations due to our acquisition of Goodrich.The change in the operating profit elimination in 2013, as comparedwith 2012, primarily reflects the benefit of lower acquisitions anddivestiture costs of approximately $70 million.
LIQUIDITY AND FINANCIAL CONDITION
(DOLLARS IN MILLIONS) 2013 2012
Cash and cash equivalents $ 4,619 $ 4,819
Total debt 20,241 23,221
Net debt (total debt less cash and cash equivalents) 15,622 18,402
Total equity 33,219 27,069
Total capitalization (total debt plus total equity) 53,460 50,290
Net capitalization (total debt plus total equity lesscash and cash equivalents) 48,841 45,471
Total debt to total capitalization 38% 46%
Net debt to net capitalization 32% 40%
We assess our liquidity in terms of our ability to generate cash to fundour operating, investing and financing activities. Our principal sourceof liquidity is operating cash flows from continuing operations, which,after netting out capital expenditures, we target to equal or exceednet income attributable to common shareowners from continuingoperations. In addition to operating cash flows, other significant factorsthat affect our overall management of liquidity include: capital expendi-tures, customer financing requirements, investments in businesses,dividends, common stock repurchases, pension funding, access to thecommercial paper markets, adequacy of available bank lines of credit,and the ability to attract long-term capital at satisfactory terms.
The global economic environment has been improving. Inthe U.S., consumer sentiment and spending continue to improveon strength in the equity and housing markets, partially offset bycontinued weakness in defense spending. Europe has seen a returnto moderate economic growth, while in China, construction startsand property transactions remained strong for 2013. In light of thesecircumstances, we continue to assess our current business andclosely monitor the impact on our customers and suppliers, and havedetermined that overall there was not a significant adverse impact onour financial position, results of operations or liquidity during 2013.
Our domestic pension funds experienced a positive returnon assets of approximately 11% during 2013. Approximately 89%of these domestic pension plans are invested in readily-liquid invest-ments, including equity, fixed income, asset-backed receivablesand structured products. The balance of these domestic pension
plans (11%) is invested in less-liquid but market-valued investments,including real estate and private equity. Across our global pensionplans, the absence of prior pension investment losses, impact of ahigher discount rate, as well as the positive returns experienced during2013, are expected to result in decreased pension expense in 2014 ofapproximately $500 million as compared to 2013.
As discussed further below, despite the levels of debt we issuedto finance the Goodrich acquisition, our strong debt ratings and finan-cial position have historically enabled us to issue long-term debt atfavorable market rates, including our issuance of $9.8 billion of long-term debt in June 2012. Our ability to obtain debt financing atcomparable risk-based interest rates is partly a function of our existingdebt-to-total-capitalization level as well as our current credit standing.
The purchase price of Goodrich of $127.50 per share in cashequated to a total enterprise value of $18.3 billion, including $1.9 billionin net debt assumed. To finance the cash consideration for theGoodrich acquisition and pay related fees, expenses and otheramounts due and payable as a result of the acquisition, we utilizedthe net proceeds of approximately $9.6 billion from the $9.8 billionof long-term notes issued on June 1, 2012, the net proceeds ofapproximately $1.1 billion from the equity units issued on June 18,2012, $3.2 billion from the issuance of commercial paper during July2012 and $2.0 billion of proceeds borrowed on July 26, 2012 pursuantto our April 24, 2012 term loan credit agreement, all of which arediscussed below. The $2.0 billion borrowed pursuant to our April 24,2012 term loan credit agreement was repaid in November andDecember 2012. For the remainder of the cash consideration, weutilized approximately $0.5 billion of cash and cash equivalentsgenerated from operating activities.
To manage the cash flow and liquidity impacts of these actions,we suspended share repurchases in 2012 and the fourth quarterof 2011, while resuming in 2013 with approximately $1.2 billion inshare repurchases. We expect our acquisition spending for 2014 toapproximate $1 billion; however, actual acquisition spending mayvary depending on the timing, availability and appropriate value ofacquisition opportunities.
On August 23, 2013, we redeemed all remaining outstanding2019 Goodrich 6.125% notes, representing $202 million in aggregateprincipal, under our redemption notice issued on July 24, 2013.On September 27, 2013, we redeemed all remaining outstanding2021 Goodrich 3.600% notes, representing $294 million in aggregateprincipal, under our redemption notice issued on August 28, 2013.On May 7, 2013, we commenced cash tender offers for two seriesof outstanding notes issued by Goodrich and the 2015 UTC 1.200%Senior Notes. These offers expired on June 4, 2013. Approximately$874.2 million in aggregate principal amount of these outstandingnotes were tendered pursuant to these tender offers, including
Management’s Discussion and Analysis
34 United Technologies Corporation

notes validly tendered prior to an early tender date in May 2013 andthereby eligible for an early tender premium. Total payments underthese tender offers were approximately $935 million including principal,premium and interest. On June 24, 2013 we redeemed all remainingoutstanding 2015 UTC 1.200% Senior Notes, representing $327million in aggregate principal, under our redemption notice issuedon May 24, 2013. We expect full year 2014 debt repayments to beapproximately $1 billion.
Approximately $637 million in aggregate principal amount ofthe outstanding Goodrich notes were tendered under tender offers,the commencement of which were announced December 6, 2012,with $635 million in aggregate principal amount being eligible for anearly tender premium. Total payments under these tender offers wereapproximately $790 million including principal, premium and interest.
In 2012, we approved plans for the divestiture of a number ofnon-core businesses, which were completed on June 14, 2013 withthe sale of Pratt & Whitney Rocketdyne (Rocketdyne) to GenCorp Inc.for $411 million. On May 17, 2013, we completed the sale of the Pratt& Whitney Power Systems business to Mitsubishi Heavy Industries(MHI) for $432 million, excluding contingent consideration valued atapproximately $200 million. On December 13, 2012, we completedthe sale of the legacy Hamilton Sundstrand Industrial businesses toa private limited liability company formed by affiliates of BC Partnersand affiliates of The Carlyle Group for $3.4 billion. The tax expenseassociated with this transaction was approximately $1.2 billion. Cashgenerated from these divestitures was used to repay debt incurred tofinance the Goodrich acquisition.
On June 1, 2012, we issued a total of $9.8 billion of long-termdebt, which is comprised of $1.0 billion aggregate principal amount of1.200% notes due 2015, $1.5 billion aggregate principal amount of1.800% notes due 2017, $2.3 billion aggregate principal amount of3.100% notes due 2022, $3.5 billion aggregate principal amount of4.500% notes due 2042, $1.0 billion aggregate principal amount ofthree-month LIBOR plus 0.270% floating rate notes due 2013, and$0.5 billion aggregate principal amount of three-month LIBOR plus0.500% floating rate notes due 2015. The three-month LIBOR rateas of December 31, 2013 was approximately 0.2%.
On June 18, 2012, we issued 22,000,000 equity units andreceived approximately $1.1 billion in net proceeds. Each equity unithas a stated amount of $50 and initially is in the form of a corporateunit consisting of (a) a freestanding stock purchase contract underwhich the holder will purchase from us on August 1, 2015, a numberof shares of our common stock determined pursuant to the terms ofthe agreement and (b) a 1/20, or 5.0%, undivided beneficial ownershipinterest in $1,000 principal amount on our 1.55% junior subordinatednotes due 2022. Holders of the equity units are entitled to receivequarterly contract adjustment payments at a rate of 5.95% per year ofthe stated amount of $50 per equity unit, subject to our right to defersuch payments.
At December 31, 2013, we had revolving credit agreements withvarious banks permitting aggregate borrowings of up to $4.0 billionpursuant to a $2.0 billion revolving credit agreement and a $2.0 billionmulticurrency revolving credit agreement, both of which expire in
November 2016. As of December 31, 2013 and 2012, there wereno borrowings under either of these revolving credit agreements. Theundrawn portions of our revolving credit agreements are also availableto serve as backup facilities for the issuance of commercial paper. Asof December 31, 2013, our maximum commercial paper borrowingauthority as set by our Board of Directors was $4 billion. We generallyuse our commercial paper borrowings for general corporate purposes,including the funding of potential acquisitions and repurchases of ourcommon stock.
We continue to have access to the commercial paper marketsand our existing credit facilities, and expect to continue to generatestrong operating cash flows. While the impact of market volatilitycannot be predicted, we believe we have sufficient operating flexibility,cash reserves and funding sources to maintain adequate amounts ofliquidity and to meet our future operating cash needs.
Given our extensive international operations, most of our cashis denominated in foreign currencies. We manage our worldwidecash requirements by reviewing available funds among the manysubsidiaries through which we conduct our business and the costeffectiveness with which those funds can be accessed. The repatriationof cash balances from certain of our subsidiaries could have adversetax consequences or be subject to capital controls; however, thosebalances are generally available without legal restrictions to fundordinary business operations. As discussed in Note 11, with fewexceptions, U.S. income taxes have not been provided on undistrib-uted earnings of international subsidiaries. Our intention is to reinvestthese earnings permanently or to repatriate the earnings only whenit is tax effective to do so.
On occasion, we are required to maintain cash deposits withcertain banks with respect to contractual obligations related to acqui-sitions or divestitures or other legal obligations. As of December 31,2013 and 2012, the amount of such restricted cash was approximately$47 million and $35 million, respectively.
We believe our future operating cash flows will be sufficient tomeet our future operating cash needs. Further, our ability to obtaindebt or equity financing, as well as the availability under committedcredit lines, provides additional potential sources of liquidity shouldthey be required or appropriate.
Cash Flow — Operating Activities of Continuing Operations
(DOLLARS IN MILLIONS) 2013 2012 2011
Net cash flows provided by operatingactivities of continuing operations $ 7,505 $ 6,605 $ 6,460
2013 Compared with 2012The increase in net cash flows provided by operating activities of con-tinuing operations in 2013 as compared with 2012 was driven by theincrease in income from continuing operations primarily attributable tothe full year benefit in 2013 of 2012 acquisitions and continued costreductions, as well as lower global pension contributions. Included inincome from continuing operations in 2013 were approximately $248million of net gains from the sale of the Pratt & Whitney Power Systemsbusiness and portfolio transformation activities at UTC Climate,
Management’s Discussion and Analysis
2013 Annual Report 35

Controls & Security, approximately $95 million of tax benefit as a resultof enactment of the American Taxpayer Relief Act of 2012 in January2013, and approximately $83 million of tax and interest benefits fromthe conclusion of the examination by the Internal Revenue Service (IRS)of legacy Goodrich’s 2009 and 2010 tax years as well as settlementsfor our tax years prior to 2006. In 2013, the net increase in workingcapital required a cash outflow of approximately $200 million, com-pared to a cash inflow of approximately $100 million in 2012. Thisdecrease of $300 million is attributable to an increase in accountsreceivable driven by sales volumes and timing, primarily at Pratt &Whitney and UTC Aerospace Systems. Increases in inventories andcontracts in progress were largely offset by increases in accountspayable and accrued liabilities.
The funded status of our defined benefit pension plans is depen-dent upon many factors, including returns on invested assets and thelevel of market interest rates. We can contribute cash or UTC sharesto our plans at our discretion, subject to applicable regulations. Totalcash contributions to our global defined benefit pension plans were$108 million, $430 million and $551 million during 2013, 2012 and2011, respectively. During 2011, we also contributed $450 million inUTC Common Stock to our defined benefit pension plans. As ofDecember 31, 2013, the total investment by the global defined benefitpension plans in our securities was approximately 3% of total planassets. We expect to make total contributions of approximately $275million to our global defined benefit pension plans in 2014. Althoughour domestic defined benefit pension plans are approximately 98%funded on a projected benefit obligation basis as of December 31,2013, and we are not required to make additional contributionsthrough the end of 2014, we may elect to make discretionarycontributions in 2014. Contributions to our global defined benefitpension plans in 2014 are expected to meet or exceed the currentfunding requirements.
2012 Compared with 2011The increase in net cash flows provided by operating activities ofcontinuing operations in 2012 as compared with 2011 was drivenprimarily by lower working capital cash requirements, and a decreasein global pension contributions of $121 million. Included in income fromcontinuing operations in 2012 were approximately $157 million of netnon-cash gains from the portfolio transformation activities at UTCClimate, Controls & Security, an approximately $218 million non-cashtax and interest benefit from the conclusion of the examination by theIRS of our 2006—2008 tax years and an approximately $59 millionnon-cash tax and interest benefit from the resolution of disputes withthe Appeals Division of the IRS for our 2004—2005 tax years. In 2012,the net decrease in working capital provided positive cash flow of $103million, including a $157 million loss provision recorded on the CH-148contract at Sikorsky, compared to a cash outflow of $291 million in2011. This increase of $394 million was primarily driven by a decreasein accounts receivable due to strong collections, partially offset by anincrease in inventories largely associated with anticipated volumechanges at Sikorsky and Pratt & Whitney.
Cash Flow — Investing Activities of Continuing Operations
(DOLLARS IN MILLIONS) 2013 2012 2011
Net cash flows used in investing activitiesof continuing operations $ (1,464) $ (18,795) $ (672)
2013 Compared with 2012Cash flows used in investing activities of continuing operations for2013 primarily reflect the net proceeds of approximately $1.6 billionfrom business dispositions, offset by capital expenditures of approxi-mately $1.7 billion and payments related to our collaboration intangibleassets and contractual rights to provide product on new aircraftplatforms of approximately $930 million. Business dispositions includethe sale of the legacy Goodrich pumps and engine controls businessto Triumph Group, Inc. on March 18, 2013, the sale of the legacyGoodrich electric power systems business to Safran S.A. on March 26,2013, and the sale of Pratt & Whitney Power Systems to MHI onMay 17, 2013.
In October 2011, Pratt & Whitney and Rolls-Royce announcedtheir intention to form a new partnership to develop an engine to powerfuture mid-size aircraft. In September 2013, following further discussionand because of the current regulatory environment, the parties agreednot to proceed with the partnership. In 2013, we made net paymentsof $420 million under our 2012 agreement to acquire Rolls-Royce’scollaboration interest in IAE and the September 2013 agreement notto proceed with the partnership with Rolls-Royce. Capital expendituresin 2013 primarily relate to investments in new programs at Pratt &Whitney, and continuing Goodrich integration activities at UTCAerospace Systems. Investments in businesses during 2013 were$151 million and included a number of small acquisitions in ourcommercial and aerospace businesses.
Customer financing activities were a net use of cash of $135million and $25 million in 2013 and 2012, respectively. While weexpect that 2014 customer financing activity will be a net use of funds,actual funding is subject to usage under existing customer financingcommitments during the year. We may also arrange for third-partyinvestors to assume a portion of our commitments. At December 31,2013, we had commercial aerospace financing and other contractualcommitments of approximately $11.1 billion related to commercialaircraft and certain contractual rights to provide product on new aircraftplatforms, of which as much as $1.1 billion may be required to bedisbursed during 2014. As discussed in Note 1 to the ConsolidatedFinancial Statements, we have entered into certain collaborationarrangements, which may include participation by our collaborators inthese commitments. At December 31, 2013, our collaborators’ shareof these commitments was approximately $3.1 billion of which asmuch as $342 million may be required to be disbursed to us during2014. Refer to Note 5 to the Consolidated Financial Statements foradditional discussion of our commercial aerospace industry assetsand commitments.
Management’s Discussion and Analysis
36 United Technologies Corporation
2012 Compared with 2011The increase in cash used in investing activities of continuing opera-tions in 2012 as compared with 2011 was primarily a result of theGoodrich acquisition, which required cash payments, net of cashacquired, of $15.8 billion, as well as payments made to Rolls-Royce,net of cash acquired, to acquire their ownership and collaborationinterests in IAE and license its V2500 intellectual property to Pratt &Whitney of approximately $1.7 billion in total, reflected in acquisitionsof businesses and as an increase in collaboration intangible assets,respectively. Partially offsetting these increases, concurrent withthe closing of the purchase of Rolls-Royce’s interests in IAE, Pratt &Whitney entered into a collaboration arrangement with MTU withrespect to a portion of the acquired collaboration interest in IAEfor consideration of approximately $233 million, with additionalpayments due to Pratt & Whitney in the future. Investments inbusinesses during 2012 also included a number of additional smallacquisitions in our commercial and aerospace businesses. Capitalexpenditures increased $460 million primarily at Pratt & Whitney andOtis, reflecting expenditures related to investments in new programsand low-cost manufacturing facilities, as well as at UTC AerospaceSystems due to spending at legacy Goodrich businesses subsequentto acquisition. Customer financing activities were a net use of cash of$25 million in 2012, compared to a net source of cash of $50 millionin 2011.
Cash Flow — Financing Activities of Continuing Operations
(DOLLARS IN MILLIONS) 2013 2012 2011
Net cash flows (used in) provided byfinancing activities of continuing operations $ (5,940) $ 8,021 $ (3,983)
2013 Compared with 2012The timing and levels of certain cash flow activities, such as acquisi-tions and repurchases of our stock, have resulted in the issuance ofboth long-term and short-term debt. Commercial paper borrowingsand revolving credit facilities provide short-term liquidity to supplementoperating cash flows and are used for general corporate purposes,including the funding of potential acquisitions and repurchases of ourstock. As previously disclosed, in June 2012 we issued approximately$10.9 billion of long-term debt and equity units to finance the Goodrichacquisition, and made repayments of long-term debt of approximately$2.9 billion and $800 million in 2013 and 2012, respectively. We had$200 million and $320 million of commercial paper outstanding atDecember 31, 2013 and 2012, respectively.
Financing cash outflows for 2013 included the repurchase of12.6 million shares of our common stock for approximately $1.2 billion.In connection with the Goodrich acquisition, we suspended sharerepurchases for 2012 and the fourth quarter of 2011. At December 31,2013, management had authority to repurchase approximately 51.3million shares under the share repurchase program announced onFebruary 4, 2013. Under this program, shares may be purchasedon the open market, in privately negotiated transactions and underplans complying with Rules 10b5-1 and 10b-18 under the SecuritiesExchange Act of 1934, as amended. We may also reacquire shares
outside of the program from time to time in connection with the surren-der of shares to cover taxes on vesting of restricted stock. Our sharerepurchases vary depending upon various factors including the level ofour other investing activities.
In 2013, we paid aggregate dividends on common stock ofapproximately $1.9 billion, consisting of $0.535 per share in the firstquarter of 2013 totaling $465 million, $0.535 per share in the secondquarter of 2013 totaling $465 million, $0.535 per share in the thirdquarter of 2013 totaling $465 million, and $0.59 per share in the fourthquarter of 2013 totaling $512 million. During 2012, an aggregate $1.8billion of cash dividends were paid to common stock shareowners.
We have an existing universal shelf registration statement filedwith the SEC for an indeterminate amount of debt and equity securitiesfor future issuance, subject to our internal limitations on the amount ofsecurities to be issued under this shelf registration statement.
2012 Compared with 2011In June 2012, we issued $9.8 billion of long-term debt and $1.1 billionof equity units, and in July 2012, we borrowed $2.0 billion from ourterm loan credit agreement and issued $3.2 billion of commercial paperprimarily to partially finance the Goodrich acquisition and pay relatedfees, expenses and other amounts due and payable by UTC as aresult of the acquisition. We had $320 million and $455 million ofcommercial paper outstanding at December 31, 2012 and 2011,respectively.
In connection with the Goodrich acquisition, we suspended sharerepurchases for 2012 and the fourth quarter of 2011. Financing cashoutflows for 2011 included the repurchase of 26.9 million shares of ourcommon stock for approximately $2.2 billion under the previouslyannounced share repurchase program.
In 2012, we paid aggregate dividends on common stock ofapproximately $1.8 billion. During 2011, an aggregate $1.6 billion ofcash dividends were paid to common stock shareowners.
Cash Flow — Discontinued Operations
(DOLLARS IN MILLIONS) 2013 2012 2011
Net cash flows (used in) provided bydiscontinued operations $ (277) $ 3,015 $ 73
2013 Compared with 2012Cash flows used in discontinued operations in 2013 primarily relate tothe completed divestitures of the legacy Hamilton Sundstrand Industrialbusinesses in December 2012 and Rocketdyne on June 14, 2013.Tax payments related to discontinued operations were approximately$640 million in 2013, primarily related to transactions concluded in2012 and reported in discontinued operations. We do not expectremaining net tax payments related to these discontinued operations tobe significant. Net cash flows used in discontinued operations for 2013includes positive cash flows of approximately $400 million related tothe sale of Rocketdyne, and cash flows from the operating activitiesof Rocketdyne, and of UTC Power through its date of disposition ofFebruary 12, 2013, as well as payments made in settlement of liabili-ties, transaction costs, and interim funding of UTC Power and ofClipper, which was divested in 2012.
Management’s Discussion and Analysis
2013 Annual Report 37

2012 Compared with 2011Cash flows provided by discontinued operations primarily relate to thecompleted divestitures of two businesses. As discussed above, onDecember 13, 2012 we completed the sale of the legacy HamiltonSundstrand Industrial businesses for $3.4 billion. Also, on August 7,2012, we completed the disposition of Clipper to a private equityacquirer. The disposition resulted in payments totaling approximately$367 million, which included capitalization of the business prior to sale,transaction fees, and funding of operations as the acquirer took controlof a business with significant net liabilities.
CRITICAL ACCOUNTING ESTIMATES
Preparation of our financial statements requires management to makeestimates and assumptions that affect the reported amounts of assets,liabilities, revenues and expenses. Note 1 to the Consolidated FinancialStatements describes the significant accounting policies used in prepa-ration of the Consolidated Financial Statements. Management believesthe most complex and sensitive judgments, because of their signifi-cance to the Consolidated Financial Statements, result primarily fromthe need to make estimates about the effects of matters that areinherently uncertain. The most significant areas involving managementjudgments and estimates are described below. Actual results in theseareas could differ from management’s estimates.
Long-Term Contract Accounting. We utilize percentage-of-completion accounting on certain of our long-term contracts. Thepercentage-of-completion method requires estimates of futurerevenues and costs over the full term of product and/or servicedelivery. We also utilize the completed-contract method of accountingon certain lesser value commercial contracts. Under the completed-contract method, sales and cost of sales are recognized when acontract is completed.
Losses, if any, on long-term contracts are provided for whenanticipated. We recognize loss provisions on original equipmentcontracts to the extent that estimated inventoriable manufacturing,engineering, product warranty and product performance guaranteecosts, as appropriate, exceed the projected revenue from the productscontemplated under the contractual arrangement. For new commit-ments, we generally record loss provisions at the earlier of contractannouncement or contract signing except for certain requirementscontracts under which losses are recorded based upon receipt of thepurchase order which obligates us to perform. For existing commit-ments, anticipated losses on contracts are recognized in the periodin which losses become evident. Products contemplated under thecontractual arrangement include products purchased under thecontract and, in the large commercial engine and wheels and brakesbusinesses, future highly probable sales of replacement parts requiredby regulation that are expected to be purchased subsequently forincorporation into the original equipment. Revenue projections used indetermining contract loss provisions are based upon estimates of thequantity, pricing and timing of future product deliveries. We measurethe extent of progress toward completion on our long-term commercialaerospace equipment and helicopter production type contracts usingunits-of-delivery. In addition, we use the cost-to-cost method for
elevator and escalator sales, installation and modernization contractsin the commercial businesses and certain aerospace developmentcontracts. For long-term aftermarket contracts, we recognize revenueover the contract period in proportion to the costs expected to beincurred in performing services under the contract. Contract account-ing also requires estimates of future costs over the performance periodof the contract as well as an estimate of award fees and other sourcesof revenue.
Contract costs are incurred over a period of time, which can beseveral years, and the estimation of these costs requires manage-ment’s judgment. The long-term nature of these contracts, thecomplexity of the products, and the strict safety and performance stan-dards under which they are regulated can affect our ability to estimatecosts precisely. As a result, we review and update our cost estimateson significant contracts on a quarterly basis, and no less frequentlythan annually for all others, and when circumstances change andwarrant a modification to a previous estimate. We record changesin contract estimates using the cumulative catch-up method inaccordance with the Revenue Recognition Topic of the FASB ASC.
Income Taxes. The future tax benefit arising from net deductibletemporary differences and tax carryforwards was $3.2 billion at bothDecember 31, 2013 and 2012. Management believes that our earningsduring the periods when the temporary differences become deductiblewill be sufficient to realize the related future income tax benefits. Forthose jurisdictions where the expiration date of tax carryforwards orthe projected operating results indicate that realization is not likely, avaluation allowance is provided.
In assessing the need for a valuation allowance, we estimatefuture taxable income, considering the feasibility of ongoing tax plan-ning strategies and the realizability of tax loss carryforwards. Valuationallowances related to deferred tax assets can be affected by changesto tax laws, changes to statutory tax rates and future taxable incomelevels. In the event we were to determine that we would not be able torealize all or a portion of our deferred tax assets in the future, we wouldreduce such amounts through an increase to tax expense in the periodin which that determination is made or when tax law changes areenacted. Conversely, if we were to determine that we would be ableto realize our deferred tax assets in the future in excess of the netcarrying amounts, we would decrease the recorded valuation allow-ance through a decrease to tax expense in the period in which thatdetermination is made.
In the ordinary course of business there is inherent uncertaintyin quantifying our income tax positions. We assess our income taxpositions and record tax benefits for all years subject to examinationbased upon management’s evaluation of the facts, circumstances andinformation available at the reporting date. For those tax positionswhere it is more likely than not that a tax benefit will be sustained, wehave recorded the largest amount of tax benefit with a greater than50% likelihood of being realized upon ultimate settlement with a taxingauthority that has full knowledge of all relevant information. For thoseincome tax positions where it is not more likely than not that a taxbenefit will be sustained, no tax benefit has been recognized in the
Management’s Discussion and Analysis
38 United Technologies Corporation
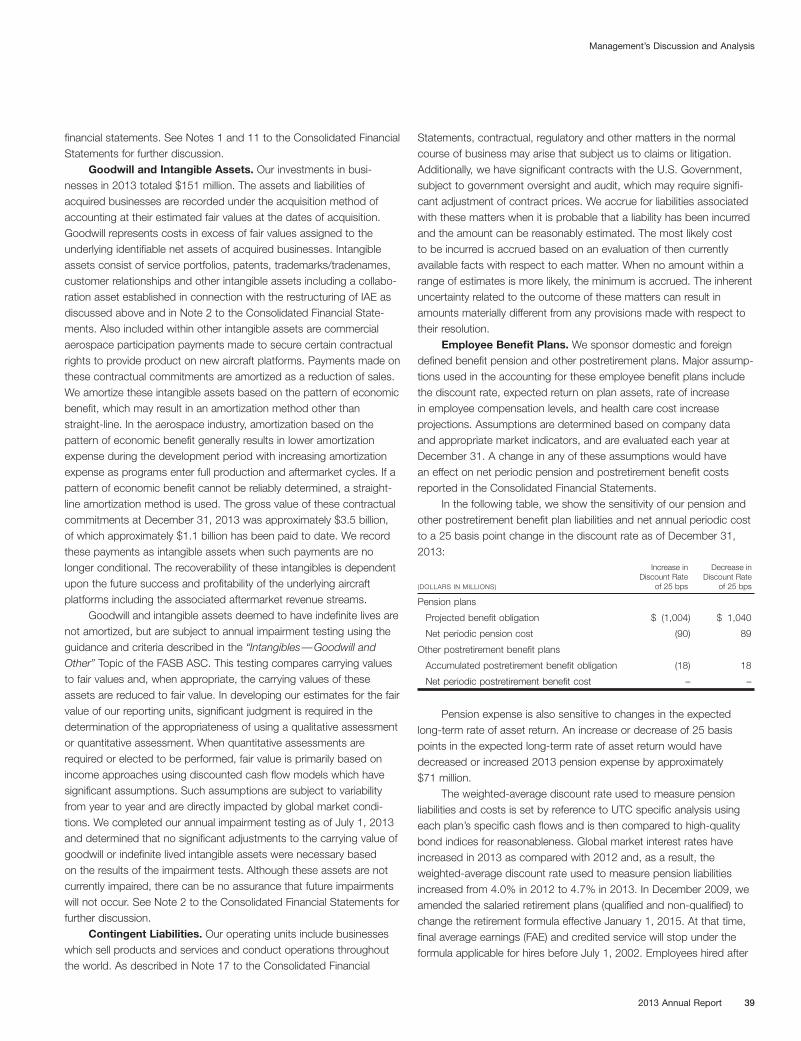
financial statements. See Notes 1 and 11 to the Consolidated FinancialStatements for further discussion.
Goodwill and Intangible Assets. Our investments in busi-nesses in 2013 totaled $151 million. The assets and liabilities ofacquired businesses are recorded under the acquisition method ofaccounting at their estimated fair values at the dates of acquisition.Goodwill represents costs in excess of fair values assigned to theunderlying identifiable net assets of acquired businesses. Intangibleassets consist of service portfolios, patents, trademarks/tradenames,customer relationships and other intangible assets including a collabo-ration asset established in connection with the restructuring of IAE asdiscussed above and in Note 2 to the Consolidated Financial State-ments. Also included within other intangible assets are commercialaerospace participation payments made to secure certain contractualrights to provide product on new aircraft platforms. Payments made onthese contractual commitments are amortized as a reduction of sales.We amortize these intangible assets based on the pattern of economicbenefit, which may result in an amortization method other thanstraight-line. In the aerospace industry, amortization based on thepattern of economic benefit generally results in lower amortizationexpense during the development period with increasing amortizationexpense as programs enter full production and aftermarket cycles. If apattern of economic benefit cannot be reliably determined, a straight-line amortization method is used. The gross value of these contractualcommitments at December 31, 2013 was approximately $3.5 billion,of which approximately $1.1 billion has been paid to date. We recordthese payments as intangible assets when such payments are nolonger conditional. The recoverability of these intangibles is dependentupon the future success and profitability of the underlying aircraftplatforms including the associated aftermarket revenue streams.
Goodwill and intangible assets deemed to have indefinite lives arenot amortized, but are subject to annual impairment testing using theguidance and criteria described in the “Intangibles—Goodwill andOther” Topic of the FASB ASC. This testing compares carrying valuesto fair values and, when appropriate, the carrying values of theseassets are reduced to fair value. In developing our estimates for the fairvalue of our reporting units, significant judgment is required in thedetermination of the appropriateness of using a qualitative assessmentor quantitative assessment. When quantitative assessments arerequired or elected to be performed, fair value is primarily based onincome approaches using discounted cash flow models which havesignificant assumptions. Such assumptions are subject to variabilityfrom year to year and are directly impacted by global market condi-tions. We completed our annual impairment testing as of July 1, 2013and determined that no significant adjustments to the carrying value ofgoodwill or indefinite lived intangible assets were necessary basedon the results of the impairment tests. Although these assets are notcurrently impaired, there can be no assurance that future impairmentswill not occur. See Note 2 to the Consolidated Financial Statements forfurther discussion.
Contingent Liabilities. Our operating units include businesseswhich sell products and services and conduct operations throughoutthe world. As described in Note 17 to the Consolidated Financial
Statements, contractual, regulatory and other matters in the normalcourse of business may arise that subject us to claims or litigation.Additionally, we have significant contracts with the U.S. Government,subject to government oversight and audit, which may require signifi-cant adjustment of contract prices. We accrue for liabilities associatedwith these matters when it is probable that a liability has been incurredand the amount can be reasonably estimated. The most likely costto be incurred is accrued based on an evaluation of then currentlyavailable facts with respect to each matter. When no amount within arange of estimates is more likely, the minimum is accrued. The inherentuncertainty related to the outcome of these matters can result inamounts materially different from any provisions made with respect totheir resolution.
Employee Benefit Plans. We sponsor domestic and foreigndefined benefit pension and other postretirement plans. Major assump-tions used in the accounting for these employee benefit plans includethe discount rate, expected return on plan assets, rate of increasein employee compensation levels, and health care cost increaseprojections. Assumptions are determined based on company dataand appropriate market indicators, and are evaluated each year atDecember 31. A change in any of these assumptions would havean effect on net periodic pension and postretirement benefit costsreported in the Consolidated Financial Statements.
In the following table, we show the sensitivity of our pension andother postretirement benefit plan liabilities and net annual periodic costto a 25 basis point change in the discount rate as of December 31,2013:
(DOLLARS IN MILLIONS)
Increase inDiscount Rate
of 25 bps
Decrease inDiscount Rate
of 25 bps
Pension plans
Projected benefit obligation $ (1,004) $ 1,040
Net periodic pension cost (90) 89
Other postretirement benefit plans
Accumulated postretirement benefit obligation (18) 18
Net periodic postretirement benefit cost – –
Pension expense is also sensitive to changes in the expectedlong-term rate of asset return. An increase or decrease of 25 basispoints in the expected long-term rate of asset return would havedecreased or increased 2013 pension expense by approximately$71 million.
The weighted-average discount rate used to measure pensionliabilities and costs is set by reference to UTC specific analysis usingeach plan’s specific cash flows and is then compared to high-qualitybond indices for reasonableness. Global market interest rates haveincreased in 2013 as compared with 2012 and, as a result, theweighted-average discount rate used to measure pension liabilitiesincreased from 4.0% in 2012 to 4.7% in 2013. In December 2009, weamended the salaried retirement plans (qualified and non-qualified) tochange the retirement formula effective January 1, 2015. At that time,final average earnings (FAE) and credited service will stop under theformula applicable for hires before July 1, 2002. Employees hired after
Management’s Discussion and Analysis
2013 Annual Report 39

2009 are not eligible for any defined benefit pension plan and willinstead receive an enhanced benefit under the UTC Savings Plan. Asof July 26, 2012 the same amendment was applied to legacy Goodrichsalaried employees. The absence of prior pension investment losses,impact of a higher discount rate, as well as the positive returns experi-enced during 2013, are expected to decrease pension expense in2014 by approximately $500 million as compared to 2013. SeeNote 12 to the Consolidated Financial Statements for furtherdiscussion.
OFF-BALANCE SHEET ARRANGEMENTS AND CONTRACTUALOBLIGATIONS
We extend a variety of financial guarantees to third parties in supportof unconsolidated affiliates and for potential financing requirements ofcommercial aerospace customers. We also have obligations arisingfrom sales of certain businesses and assets, including indemnities forrepresentations and warranties and environmental, health and safety,tax and employment matters. Circumstances that could cause thecontingent obligations and liabilities arising from these arrangementsto come to fruition include changes in an underlying transaction(e.g., hazardous waste discoveries, etc.), nonperformance under acontract, customer requests for financing, or deterioration in thefinancial condition of the guaranteed party.
A summary of our consolidated contractual obligations andcommitments as of December 31, 2013 is as follows:
Payments Due by Period
(DOLLARS IN MILLIONS) Total 2014 2015 – 2016 2017 – 2018 Thereafter
Long-term debt—principal $ 19,643 $ 112 $ 1,965 $ 2,655 $ 14,911
Long-term debt—future interest 13,327 963 1,747 1,520 9,097
Operating leases 2,373 586 858 389 540
Purchase obligations 17,011 9,045 6,069 982 915
Other long-term liabilities 5,042 937 1,228 1,377 1,500
Total contractualobligations $ 57,396 $ 11,643 $ 11,867 $ 6,923 $ 26,963
Purhase obligations include amounts committed under legallyenforceable contracts or purchase orders for goods and services withdefined terms as to price, quantity, delivery and termination liability.Approximately 23% of the purchase obligations disclosed above repre-sent purchase orders for products to be delivered under firm contractswith the U.S. Government for which we have full recourse undercustomary contract termination clauses.
Other long-term liabilities primarily include those amounts on ourDecember 31, 2013 balance sheet representing obligations underproduct service and warranty policies, performance and operating costguarantees, estimated environmental remediation costs and expectedcontributions under employee benefit programs. The timing ofexpected cash flows associated with these obligations is based uponmanagement’s estimates over the terms of these agreements and islargely based upon historical experience.
In connection with the acquisition of Goodrich in 2012, we identi-fied customer contractual obligations on certain OEM development
programs where the expected costs exceed the expected revenueunder contract. We measured these liabilities under the measurementprovisions of the “Fair Value Measurements and Disclosures” Topic ofthe FASB ASC, which is based on the price to transfer the obligationto a market participant at the measurement date, assuming that theliability will remain outstanding in the marketplace. Based on the esti-mated net cash outflows of the OEM developmental programs plus areasonable contracting profit margin required to transfer the contractsto market participants, we recorded assumed liabilities of approxi-mately $2.2 billion. These liabilities are being liquidated in accordancewith the underlying economic pattern of obligations, as reflected by thenet cash outflows incurred on the OEM contracts. Total consumptionof the contractual obligations for the year ended December 31, 2013was approximately $278 million. Total consumption of the contractualobligations is expected to be as follows: $261 million in 2014, $220million in 2015, $239 million in 2016, $242 million in 2017, $210 millionin 2018 and $686 million thereafter. These amounts are not included inthe table above.
The above table also does not reflect unrecognized tax benefitsof $1,223 million, the timing of which is uncertain, except for approxi-mately $133 million that may become payable during 2014. Referto Note 11 to the Consolidated Financial Statements for additionaldiscussion on unrecognized tax benefits.
COMMERCIAL COMMITMENTS
The following table summarizes our commercial commitmentsoutstanding as of December 31, 2013.
Amount of Commitment Expiration per Period
(DOLLARS IN MILLIONS) Committed 2014 2015 – 2016 2017 – 2018 Thereafter
Commercial aerospacefinancing commitments $ 4,031 $ 440 $ 1,641 $ 1,012 $ 938
Other commercialaerospace commitments 7,227 656 1,374 1,287 3,910
Commercial aerospacefinancing arrangements 615 10 96 20 489
Unconsolidated subsidiarydebt guarantees 231 97 49 – 85
Performance guarantees 150 58 5 11 76
Total commercialcommitments $ 12,254 $ 1,261 $ 3,165 $ 2,330 $ 5,498
In exchange for the increased ownership and collaboration inter-ests and intellectual property license, Pratt & Whitney paid Rolls-Royce$1.5 billion at closing with additional payments due to Rolls-Roycecontingent upon each hour flown by the V2500-powered aircraft inservice as of June 29, 2012 during the fifteen year period followingclosing of the purchase. These payments are being capitalized as acollaboration intangible asset and amortized in relation to the economicbenefits received over the projected remaining thirty year life of theV2500 program. The estimated flight hour payments are included inOther commercial aerospace commitments in the table above.
Refer to Notes 1, 5 and 16 to the Consolidated FinancialStatements for additional discussion on contractual and commercialcommitments.
Management’s Discussion and Analysis
40 United Technologies Corporation

MARKET RISK AND RISK MANAGEMENT
We are exposed to fluctuations in foreign currency exchange rates,interest rates and commodity prices. To manage certain of thoseexposures, we use derivative instruments, including swaps, forwardcontracts and options. Derivative instruments utilized by us in ourhedging activities are viewed as risk management tools, involve littlecomplexity and are not used for trading or speculative purposes. Wediversify the counterparties used and monitor the concentration of riskto limit our counterparty exposure.
We have evaluated our exposure to changes in foreign currencyexchange rates, interest rates and commodity prices in our marketrisk sensitive instruments, which are primarily cash, debt and derivativeinstruments, using a value at risk analysis. Based on a 95% confidencelevel and a one-day holding period, at December 31, 2013, the poten-tial loss in fair value on our market risk sensitive instruments was notmaterial in relation to our financial position, results of operations orcash flows. Our calculated value at risk exposure represents anestimate of reasonably possible net losses based on volatilities andcorrelations and is not necessarily indicative of actual results. Referto Notes 1, 9 and 14 to the Consolidated Financial Statements foradditional discussion of foreign currency exchange, interest rates andfinancial instruments.
Foreign Currency Exposures. We have a large volume offoreign currency exposures that result from our international sales,purchases, investments, borrowings and other international transac-tions. International segment sales, including U.S. export sales,averaged approximately $36 billion over the last three years. Weactively manage foreign currency exposures that are associatedwith committed foreign currency purchases and sales, and otherassets and liabilities created in the normal course of business at theoperating unit level. More than insignificant exposures that cannotbe naturally offset within an operating unit are hedged with foreigncurrency derivatives. We also have a significant amount of foreigncurrency net asset exposures. Currently, we do not hold any derivativecontracts that hedge our foreign currency net asset exposures butmay consider such strategies in the future.
Within aerospace, our sales are typically denominated in U.S.Dollars under accepted industry convention. However, for our non-U.S.based entities, such as P&WC, a substantial portion of their costs areincurred in local currencies. Consequently, there is a foreign currencyexchange impact and risk to operational results as U.S. Dollars mustbe converted to local currencies such as the Canadian Dollar in orderto meet local currency cost obligations. In order to minimize the expo-sure that exists from changes in the exchange rate of the U.S. Dollaragainst these other currencies, we hedge a certain portion of sales tosecure the rates at which U.S. Dollars will be converted. The majorityof this hedging activity occurs at P&WC. At P&WC, firm and forecastedsales for both engines and spare parts are hedged at varying amountsup to 24 months on the U.S. Dollar sales exposure as representedby the excess of U.S. Dollar sales over U.S. Dollar denominated pur-chases. Hedging gains and losses resulting from movements in foreigncurrency exchange rates are partially offset by the foreign currencytranslation impacts that are generated on the translation of local
currency operating results into U.S. Dollars for reporting purposes.While the objective of the hedging program is to minimize the foreigncurrency exchange impact on operating results, there are typicallyvariances between the hedging gains or losses and the translationalimpact due to the length of hedging contracts, changes in the salesprofile, volatility in the exchange rates and other such operationalconsiderations.
Interest Rate Exposures. Our long-term debt portfolio consistsmostly of fixed-rate instruments. From time to time, we may hedge tofloating rates using interest rate swaps. The hedges are designated asfair value hedges and the gains and losses on the swaps are reportedin interest expense, reflecting that portion of interest expense at a vari-able rate. We issue commercial paper, which exposes us to changesin interest rates. Currently, we do not hold any derivative contractsthat hedge our interest exposures, but may consider such strategiesin the future.
Commodity Price Exposures. We are exposed to volatility inthe prices of raw materials used in some of our products and fromtime to time we may use forward contracts in limited circumstancesto manage some of those exposures. In the future, if hedges areused, gains and losses may affect earnings. There were no significantoutstanding commodity hedges as of December 31, 2013.
ENVIRONMENTAL MATTERS
Our operations are subject to environmental regulation by federal, stateand local authorities in the United States and regulatory authoritieswith jurisdiction over our foreign operations. As a result, we haveestablished, and continually update, policies relating to environmentalstandards of performance for our operations worldwide. We believethat expenditures necessary to comply with the present regulationsgoverning environmental protection will not have a material effect uponour competitive position, results of operations, cash flows or financialcondition.
We have identified 710 locations, mostly in the United States,at which we may have some liability for remediating contamination.We have resolved our liability at 322 of these locations. We do notbelieve that any individual location’s exposure will have a material effecton our results of operations. Sites in the investigation, remediation oroperation and maintenance stage represent approximately 94% of ouraccrued environmental remediation reserve.
We have been identified as a potentially responsible party underthe Comprehensive Environmental Response Compensation andLiability Act (CERCLA or Superfund) at 124 sites. The number ofSuperfund sites, in and of itself, does not represent a relevant measureof liability because the nature and extent of environmental concernsvary from site to site and our share of responsibility varies from soleresponsibility to very little responsibility. In estimating our liabilityfor remediation, we consider our likely proportionate share of theanticipated remediation expense and the ability of other potentiallyresponsible parties to fulfill their obligations.
At December 31, 2013 and 2012, we had $936 million and$847 million reserved for environmental remediation, respectively.Cash outflows for environmental remediation were $40 million in 2013,
Management’s Discussion and Analysis
2013 Annual Report 41

$35 million in 2012 and $54 million in 2011. We estimate that ongoingenvironmental remediation expenditures in each of the next two yearswill not exceed approximately $87 million.
GOVERNMENT MATTERS
As described in “Critical Accounting Estimates—Contingent Liabilities,”our contracts with the U.S. Government are subject to audits. Suchaudits may recommend that certain contract prices should be reducedto comply with various government regulations. We are also thesubject of one or more investigations and legal proceedings initiatedby the U.S. Government with respect to government contract matters.See “Legal Proceedings” in Item 1 to this Form 10-K and Note 11“Income Taxes” and Note 17 “Commitments & Contingencies” of ourConsolidated Financial Statements for further discussion of these andother government matters.
Management’s Discussion and Analysis
42 United Technologies Corporation

This 2013 Annual Report to Shareowners (2013 Annual Report)contains statements which, to the extent they are not statements ofhistorical or present fact, constitute “forward-looking statements” underthe securities laws. From time to time, oral or written forward-lookingstatements may also be included in other materials released to thepublic. These forward-looking statements are intended to providemanagement’s current expectations or plans for our future operatingand financial performance, based on assumptions currently believed tobe valid. Forward-looking statements can be identified by the use ofwords such as “believe,” “expect,” “expectations,” “plans,” “strategy,”“prospects,” “estimate,” “project,” “target,” “anticipate,” “will,” “should,”“see,” “guidance,” “confident” and other words of similar meaning inconnection with a discussion of future operating or financial perfor-mance. Forward-looking statements may include, among other things,statements relating to future sales, earnings, cash flow, results ofoperations, uses of cash and other measures of financial performance.All forward-looking statements involve risks, uncertainties and otherfactors that may cause actual results to differ materially from thoseexpressed or implied in the forward-looking statements. For thosestatements we claim the protection of the safe harbor for forward-looking statements contained in the U.S. Private Securities LitigationReform Act of 1995. Such risks, uncertainties and other factorsinclude, without limitation:
• the effect of economic conditions in the markets in which we operatein the U.S. and globally and any changes therein, including financialmarket conditions, fluctuations in commodity prices, interest ratesand foreign currency exchange rates, levels of end market demandin construction and in both the commercial and defense segmentsof the aerospace industry, levels of air travel, financial difficulties(including bankruptcy) of commercial airlines, the impact of weatherconditions and natural disasters and the financial condition of ourcustomers and suppliers;
• our ability to realize the intended benefits of recently announcedorganizational changes;
• future levels of indebtedness and capital spending and researchand development spending;
• future availability of credit and factors that may affect such availabil-ity, including credit market conditions and our capital structure;
• delays and disruption in delivery of materials and services fromsuppliers;
• new business opportunities;• customer and Company directed cost reduction efforts and
restructuring costs and savings and other consequences thereof;
• the scope, nature or impact of other acquisition and divestitureactivity, including among other things integration of acquiredbusinesses into our existing businesses and realization of synergiesand opportunities for growth and innovation;
• the development, production, delivery, support, performance andanticipated benefits of advanced technologies and new productsand services;
• the anticipated benefits of diversification and balance of operationsacross product lines, regions and industries;
• the impact of the negotiation of collective bargaining agreementsand labor disputes;
• the outcome of legal proceedings and other contingencies;• future repurchases of our common stock;• pension plan assumptions and future contributions; and• the effect of changes in tax, environmental and other laws and
regulations or political conditions in the United States and othercountries in which we operate.
In addition, our Annual Report on Form 10-K for 2013 includesimportant information as to risks, uncertainties and other factorsthat may cause actual results to differ materially from those expressedor implied in the forward-looking statements. See the “Notes toConsolidated Financial Statements” under the heading “Note 17:Contingent Liabilities,” the section titled “Management’s Discussionand Analysis of Financial Condition and Results of Operations” underthe headings “Business Overview,” “Results of Operations,” “Liquidityand Financial Condition,” and “Critical Accounting Estimates,” andthe section titled “Risk Factors.” Our Annual Report on Form 10-Kfor 2013 also includes important information as to these factors inthe “Business” section under the headings “General,” “Description ofBusiness by Segment” and “Other Matters Relating to Our Business asa Whole,” and in the “Legal Proceedings” section. Additional importantinformation as to these factors is included in this 2013 Annual Reportin the section titled “Management’s Discussion and Analysis ofFinancial Condition and Results of Operations” under the headings“Restructuring Costs,” “Environmental Matters” and “GovernmentalMatters.” The forward-looking statements speak only as of the date ofthis report or, in the case of any document incorporated by reference,the date of that document. We undertake no obligation to publiclyupdate or revise any forward-looking statements, whether as a resultof new information, future events or otherwise, except as requiredby applicable law. Additional information as to factors that may causeactual results to differ materially from those expressed or implied in theforward-looking statements are disclosed from time to time in our otherfilings with the SEC.
Cautionary Note Concerning Factors That May Affect Future Results
2013 Annual Report 43
The management of UTC is responsible for establishing and maintain-ing adequate internal control over financial reporting. Internal controlover financial reporting is a process designed to provide reasonableassurance regarding the reliability of financial reporting and thepreparation of financial statements for external reporting purposes inaccordance with accounting principles generally accepted in the UnitedStates of America. Because of its inherent limitations, internal controlover financial reporting may not prevent or detect misstatements.Management has assessed the effectiveness of UTC’s internal controlover financial reporting as of December 31, 2013. In making itsassessment, management has utilized the criteria set forth by theCommittee of Sponsoring Organizations of the Treadway Commissionin its Internal Control—Integrated Framework, released in 1992.Management concluded that based on its assessment, UTC’s internalcontrol over financial reporting was effective as of December 31, 2013.The effectiveness of UTC’s internal control over financial reporting, asof December 31, 2013, has been audited by PricewaterhouseCoopersLLP, an independent registered public accounting firm, as stated intheir report which is included herein.
Louis R. ChenevertChairman & Chief Executive Officer
Gregory J. HayesSenior Vice President and Chief Financial Officer
John E. StantialActing Controller and Assistant Controller, Financial Reporting
Management’s Report on Internal Control over Financial Reporting
44 United Technologies Corporation

TO THE BOARD OF DIRECTORS AND SHAREOWNERS OFUNITED TECHNOLOGIES CORPORATION:
In our opinion, the accompanying consolidated balance sheet andthe related consolidated statement of operations, of comprehensiveincome, of cash flows and of changes in equity present fairly, in allmaterial respects, the financial position of United TechnologiesCorporation and its subsidiaries at December 31, 2013 andDecember 31, 2012, and the results of their operations and their cashflows for each of the three years in the period ended December 31,2013 in conformity with accounting principles generally accepted in theUnited States of America. Also in our opinion, the Corporation main-tained, in all material respects, effective internal control over financialreporting as of December 31, 2013, based on criteria established inInternal Control—Integrated Framework issued by the Committee ofSponsoring Organizations of the Treadway Commission (COSO) in1992. The Corporation’s management is responsible for these financialstatements, for maintaining effective internal control over financialreporting and for its assessment of the effectiveness of internal controlover financial reporting included in the accompanying Management’sReport on Internal Control Over Financial Reporting. Our responsibilityis to express opinions on these financial statements and on theCorporation’s internal control over financial reporting based on ourintegrated audits. We conducted our audits in accordance with thestandards of the Public Company Accounting Oversight Board (UnitedStates). Those standards require that we plan and perform the auditsto obtain reasonable assurance about whether the financial statementsare free of material misstatement and whether effective internal controlover financial reporting was maintained in all material respects. Ouraudits of the financial statements included examining, on a test basis,evidence supporting the amounts and disclosures in the financialstatements, assessing the accounting principles used and significantestimates made by management, and evaluating the overall financialstatement presentation. Our audit of internal control over financialreporting included obtaining an understanding of internal control overfinancial reporting, assessing the risk that a material weakness exists,
and testing and evaluating the design and operating effectiveness ofinternal control based on the assessed risk. Our audits also includedperforming such other procedures as we considered necessary in thecircumstances. We believe that our audits provide a reasonable basisfor our opinions.
A corporation’s internal control over financial reporting is aprocess designed to provide reasonable assurance regarding the reli-ability of financial reporting and the preparation of financial statementsfor external purposes in accordance with generally accepted account-ing principles. A corporation’s internal control over financial reportingincludes those policies and procedures that (i) pertain to the mainte-nance of records that, in reasonable detail, accurately and fairly reflectthe transactions and dispositions of the assets of the corporation;(ii) provide reasonable assurance that transactions are recorded asnecessary to permit preparation of financial statements in accordancewith generally accepted accounting principles, and that receipts andexpenditures of the corporation are being made only in accordancewith authorizations of management and directors of the corporation;and (iii) provide reasonable assurance regarding prevention or timelydetection of unauthorized acquisition, use, or disposition of the corpo-ration’s assets that could have a material effect on the financialstatements.
Because of its inherent limitations, internal control over financialreporting may not prevent or detect misstatements. Also, projectionsof any evaluation of effectiveness to future periods are subject to therisk that controls may become inadequate because of changes inconditions, or that the degree of compliance with the policies orprocedures may deteriorate.
Hartford, ConnecticutFebruary 6, 2014
Report of Independent Registered Public Accounting Firm
2013 Annual Report 45

(DOLLARS IN MILLIONS, EXCEPT PER SHARE AMOUNTS; SHARES IN MILLIONS) 2013 2012 2011
Net Sales:
Product sales $ 45,253 $ 40,729 $ 38,882
Service sales 17,373 16,979 16,872
62,626 57,708 55,754
Costs and Expenses:
Cost of products sold 34,063 31,094 29,252
Cost of services sold 11,258 11,059 11,117
Research and development 2,529 2,371 1,951
Selling, general and administrative 6,718 6,452 6,161
54,568 50,976 48,481
Other income, net 1,151 952 573
Operating profit 9,209 7,684 7,846
Interest expense, net 897 773 496
Income from continuing operations before income taxes 8,312 6,911 7,350
Income tax expense 2,238 1,711 2,134
Net income from continuing operations 6,074 5,200 5,216
Less: Noncontrolling interest in subsidiaries’ earnings from continuing operations 388 353 385
Income from continuing operations attributable to common shareowners 5,686 4,847 4,831
Discontinued operations (Note 3):
Income (loss) from operations 63 (998) 255
(Loss) gain on disposal (33) 2,030 –
Income tax benefit (expense) 5 (742) (97)
Net income from discontinued operations 35 290 158
Less: Noncontrolling interest in subsidiaries’ earnings from discontinued operations – 7 10
Income from discontinued operations attributable to common shareowners 35 283 148
Net income attributable to common shareowners $ 5,721 $ 5,130 $ 4,979
Earnings Per Share of Common Stock—Basic:
Net income from continuing operations attributable to common shareowners $ 6.31 $ 5.41 $ 5.41
Net income attributable to common shareowners $ 6.35 $ 5.73 $ 5.58
Earnings Per Share of Common Stock—Diluted:
Net income from continuing operations attributable to common shareowners $ 6.21 $ 5.35 $ 5.33
Net income attributable to common shareowners $ 6.25 $ 5.66 $ 5.49
Dividends Per Share of Common Stock $ 2.195 $ 2.030 $ 1.865
Weighted average number of shares outstanding:
Basic shares 901.0 895.2 892.3
Diluted shares 915.1 906.6 906.8
See accompanying Notes to Consolidated Financial Statements
Consolidated Statement of Operations
46 United Technologies Corporation

(DOLLARS IN MILLIONS) 2013 2012 2011
Net income from continuing operations $ 6,074 $ 5,200 $ 5,216
Net income from discontinued operations 35 290 158
Net income 6,109 5,490 5,374
Other comprehensive income (loss), net of tax
Foreign currency translation adjustments
Foreign currency translation adjustments arising during period (523) 556 (278)
Less: reclassification adjustments for loss (gain) on sale of an investment in a foreign entity recognized innet income 25 (100) 115
(498) 456 (163)
Change in pension and post-retirement benefit plans
Net actuarial gain (loss) arising during period 3,987 (1,542) (2,692)
Prior service (cost) credit arising during period (225) 211 (21)
Other 50 (3) (9)
Less: amortization of actuarial loss, prior service cost and transition obligation 906 689 441
4,718 (645) (2,281)
Tax (expense) benefit (1,735) 205 796
2,983 (440) (1,485)
Unrealized gain (loss) on available-for-sale securities
Unrealized holding gain arising during period 332 91 78
Less: reclassification adjustments for gain included in net income (91) (123) (27)
241 (32) 51
Tax (expense) benefit (90) 13 (21)
151 (19) 30
Change in unrealized cash flow hedging
Unrealized cash flow hedging (loss) gain arising during period (136) 88 (46)
Less: loss (gain) reclassified into Product sales 25 (31) (96)
(111) 57 (142)
Tax benefit (expense) 29 (4) 36
(82) 53 (106)
Other comprehensive income (loss), net of tax 2,554 50 (1,724)
Comprehensive income 8,663 5,540 3,650
Less: comprehensive income attributable to noncontrolling interest (374) (368) (392)
Comprehensive income attributable to common shareowners $ 8,289 $ 5,172 $ 3,258
See accompanying Notes to Consolidated Financial Statements
Consolidated Statement of Comprehensive Income
2013 Annual Report 47

(DOLLARS IN MILLIONS, EXCEPT PER SHARE AMOUNTS; SHARES IN THOUSANDS) 2013 2012
AssetsCash and cash equivalents $ 4,619 $ 4,819
Accounts receivable (net of allowance for doubtful accounts of $488 and $443) 11,458 11,099
Inventories and contracts in progress, net 10,330 9,537
Future income tax benefits, current 1,964 1,611
Assets held for sale – 1,071
Other assets, current 1,071 1,473
Total Current Assets 29,442 29,610
Customer financing assets 1,156 1,150
Future income tax benefits 1,236 1,599
Fixed assets, net 8,866 8,518
Goodwill 28,168 27,801
Intangible assets, net 15,521 15,189
Other assets 6,205 5,542
Total Assets $ 90,594 $ 89,409
Liabilities and EquityShort-term borrowings $ 388 $ 503
Accounts payable 6,965 6,431
Accrued liabilities 15,335 15,310
Liabilities held for sale – 421
Long-term debt currently due 112 1,121
Total Current Liabilities 22,800 23,786
Long-term debt 19,741 21,597
Future pension and postretirement benefit obligations 3,444 7,520
Other long-term liabilities 11,279 9,199
Total Liabilities 57,264 62,102
Commitments and contingent liabilities (Notes 5 and 17)
Redeemable noncontrolling interest 111 238
Shareowners’ Equity:
Capital Stock:
Preferred Stock, $1 par value; 250,000 shares authorized; None issued or outstanding – –
Common Stock, $1 par value; 4,000,000 shares authorized; 1,417,724 and 1,407,780 shares issued 14,764 13,976
Treasury Stock—501,038 and 488,931 common shares at average cost (20,431) (19,251)
Retained earnings 40,539 36,776
Unearned ESOP shares (126) (139)
Total Accumulated other comprehensive loss (2,880) (5,448)
Total Shareowners’ Equity 31,866 25,914
Noncontrolling interest 1,353 1,155
Total Equity 33,219 27,069
Total Liabilities and Equity $ 90,594 $ 89,409
See accompanying Notes to Consolidated Financial Statements
Consolidated Balance Sheet
48 United Technologies Corporation

(DOLLARS IN MILLIONS) 2013 2012 2011
Operating Activities of Continuing Operations:
Net income attributable to common shareowners $ 5,721 $ 5,130 $ 4,979
Noncontrolling interest in subsidiaries’ earnings 388 360 395
Net income 6,109 5,490 5,374
Less: Net income from discontinued operations 35 290 158
Income from continuing operations 6,074 5,200 5,216
Adjustments to reconcile income from continuing operations to net cash flows provided by operating activities ofcontinuing operations:
Depreciation and amortization 1,821 1,524 1,263
Deferred income tax provision 242 120 334
Stock compensation cost 275 210 221
Change in:
Accounts receivable (531) (165) (697)
Inventories and contracts in progress (1,096) (539) (330)
Other current assets 74 (4) (24)
Accounts payable and accrued liabilities 1,354 811 760
Global pension contributions (108) (430) (551)
Other operating activities, net (600) (122) 268
Net cash flows provided by operating activities of continuing operations 7,505 6,605 6,460
Investing Activities of Continuing Operations:
Capital expenditures (1,688) (1,389) (929)
Increase in customer financing assets (245) (100) (42)
Decrease in customer financing assets 110 75 92
Investments in businesses (151) (16,026) (357)
Dispositions of businesses 1,560 425 494
Increase in collaboration intangible assets (722) (1,543) –
Other investing activities, net (328) (237) 70
Net cash flows used in investing activities of continuing operations (1,464) (18,795) (672)
Financing Activities of Continuing Operations:
Issuance of long-term debt 92 10,899 59
Repayment of long-term debt (2,862) (842) (616)
(Decrease) increase in short-term borrowings, net (113) (214) 562
Common Stock issued under employee stock plans 378 522 226
Dividends paid on Common Stock (1,908) (1,752) (1,602)
Repurchase of Common Stock (1,200) – (2,175)
Other financing activities, net (327) (592) (437)
Net cash flows (used in) provided by financing activities of continuing operations (5,940) 8,021 (3,983)
Discontinued Operations:
Net cash (used in) provided by operating activities (628) 41 130
Net cash provided by (used in) investing activities 351 2,974 (35)
Net cash used in financing activities – – (22)
Net cash flows (used in) provided by discontinued operations (277) 3,015 73
Effect of foreign exchange rate changes on cash and cash equivalents (41) 30 (1)
Net (decrease) increase in cash and cash equivalents (217) (1,124) 1,877
Cash and cash equivalents, beginning of year 4,836 5,960 4,083
Cash and cash equivalents, end of year 4,619 4,836 5,960
Less: Cash and cash equivalents of businesses held for sale – 17 –
Cash and cash equivalents of continuing operations, end of year $ 4,619 $ 4,819 $ 5,960
Supplemental Disclosure of Cash Flow Information:
Interest paid, net of amounts capitalized $ 1,047 $ 725 $ 642
Income taxes paid, net of refunds $ 2,789 $ 1,772 $ 1,432
Non-cash investing and financing activities include:
Contributions of UTC Common Stock to domestic defined benefit pension plans $ – $ – $ 450
See accompanying Notes to Consolidated Financial Statements
Consolidated Statement of Cash Flows
2013 Annual Report 49

(DOLLARS IN MILLIONS) Common Stock Treasury Stock
Balance at December 31, 2010 $ 12,597 $ (17,468)
Comprehensive income (loss):
Net income
Redeemable noncontrolling interest in subsidiaries’ earnings
Other comprehensive income (loss), net of tax
Common Stock issued under employee plans (7.2 million shares), net of tax benefit of $81 672 10
Common Stock contributed to defined benefit pension plans (5.7 million shares) 227 223
Common Stock repurchased (26.9 million shares) (2,175)
Dividends on Common Stock
Dividends on ESOP Common Stock
Dividends attributable to noncontrolling interest
Redeemable noncontrolling interest accretion
Purchase of subsidiary shares from noncontrolling interest (54)
Sale of subsidiary shares in noncontrolling interest 3
Other changes in noncontrolling interest
Balance at December 31, 2011 $ 13,445 $ (19,410)
Comprehensive income (loss):
Net income
Redeemable noncontrolling interest in subsidiaries’ earnings
Other comprehensive income (loss), net of tax
Common Stock issued under employee plans (8 million shares), net of tax benefit of $67 643 18
Treasury Stock reissued under employee plans (3.6 million shares) 138 141
Equity Units issuance (216)
Dividends on Common Stock
Dividends on ESOP Common Stock
Dividends attributable to noncontrolling interest
Redeemable noncontrolling interest accretion
Purchase of subsidiary shares from noncontrolling interest (34)
Sale of subsidiary shares in noncontrolling interest
Other changes in noncontrolling interest
Redeemable noncontrolling interest reclassification to noncontrolling interest
Balance at December 31, 2012 $ 13,976 $ (19,251)
Comprehensive income (loss):
Net income
Redeemable noncontrolling interest in subsidiaries’ earnings
Other comprehensive income (loss), net of tax
Common Stock issued under employee plans (10.4 million shares), net of tax benefit of $115 837 20
Common Stock repurchased (12.6 million shares) (1,200)
Dividends on Common Stock
Dividends on ESOP Common Stock
Dividends attributable to noncontrolling interest
Purchase of subsidiary shares from noncontrolling interest (49)
Sale of subsidiary shares in noncontrolling interest
Disposition of noncontrolling interest
Redeemable noncontrolling interest reclassification to noncontrolling interest
Balance at December 31, 2013 $ 14,764 $ (20,431)
See accompanying Notes to Consolidated Financial Statements
Consolidated Statement of Changes in Equity
50 United Technologies Corporation

Shareowners’ Equity
Retained Earnings Unearned ESOP Shares
Accumulated OtherComprehensiveIncome (Loss)
NoncontrollingInterest Total Equity
RedeemableNoncontrolling
Interest
$ 30,191 $ (166) $ (3,769) $ 947 $ 22,332 $ 317
4,979 395 5,374
(25) (25) 25
(1,721) (6) (1,727) 3
(9) 14 687
450
(2,175)
(1,602) (1,602)
(63) (63)
(363) (363) (15)
(9) (9) 9
(19) (73) (2)
23 26
(12) (12) 21
$ 33,487 $ (152) $ (5,490) $ 940 $ 22,820 $ 358
5,130 360 5,490
(24) (24) 24
42 2 44 6
(20) 13 654
279
(216)
(1,752) (1,752)
(67) (67)
(337) (337) (18)
(2) (2) 2
(4) (38) (34)
52 52
66 66
100 100 (100)
$ 36,776 $ (139) $ (5,448) $ 1,155 $ 27,069 $ 238
5,721 388 6,109
(5) (5) 5
2,568 (5) 2,563 (9)
19 13 889
(1,200)
(1,908) (1,908)
(69) (69)
(355) (355) (5)
(94) (143) (3)
243 243
(7) (7) (82)
33 33 (33)
$ 40,539 $ (126) $ (2,880) $ 1,353 $ 33,219 $ 111
Consolidated Statement of Changes in Equity
2013 Annual Report 51

NOTE 1: SUMMARY OF ACCOUNTING PRINCIPLES
The preparation of financial statements requires management to makeestimates and assumptions that affect the reported amounts of assets,liabilities, revenues and expenses. Actual results could differ from thoseestimates. Certain reclassifications have been made to the prior yearamounts to conform to the current year presentation.
Consolidation. The Consolidated Financial Statements includethe accounts of United Technologies Corporation (UTC) and its con-trolled subsidiaries. Intercompany transactions have been eliminated.
Cash and Cash Equivalents. Cash and cash equivalentsincludes cash on hand, demand deposits and short-term cashinvestments that are highly liquid in nature and have originalmaturities of three months or less.
On occasion, we are required to maintain cash depositswith certain banks with respect to contractual obligations relatedto acquisitions or divestitures or other legal obligations. As ofDecember 31, 2013 and 2012, the amount of such restricted cashwas approximately $47 million and $35 million, respectively.
Accounts Receivable. Current and long-term accountsreceivable include retainage of $173 million and $172 million andunbilled receivables of $1,495 million and $1,363 million as ofDecember 31, 2013 and 2012, respectively.
Retainage represents amounts that, pursuant to the applicablecontract, are not due until project completion and acceptance bythe customer. Unbilled receivables represent revenues that are notcurrently billable to the customer under the terms of the contract.These items are expected to be collected in the normal course ofbusiness. See Note 5 for further discussion of additional deferredassets recorded in connection with long-term aftermarket contractswith commercial aerospace industry customers.
Marketable Equity Securities. Equity securities that have areadily determinable fair value and that we do not intend to trade areclassified as available-for-sale and carried at fair value. Unrealizedholding gains and losses are recorded as a separate component ofshareowners’ equity, net of deferred income taxes.
Inventories and Contracts in Progress. Inventories and con-tracts in progress are stated at the lower of cost or estimated realizablevalue and are primarily based on first-in, first-out (FIFO) or average costmethods; however, certain UTC Aerospace Systems and UTC Climate,Controls & Security entities use the last-in, first-out (LIFO) method. Ifinventories that were valued using the LIFO method had been valuedunder the FIFO method, they would have been higher by $133 millionand $139 million at December 31, 2013 and 2012, respectively.
Costs accumulated against specific contracts or orders are atactual cost. Valuation reserves for excess, obsolete, and slow-movinginventory are estimated by comparing the inventory levels of individualparts to both future sales forecasts or production requirements andhistorical usage rates in order to identify inventory where the resalevalue or replacement value is less than inventoriable cost. Other factors
that management considers in determining the adequacy of thesereserves include whether individual inventory parts meet current speci-fications and cannot be substituted for a part currently being sold orused as a service part, overall market conditions, and other inventorymanagement initiatives. Manufacturing costs are allocated to currentproduction and firm contracts.
Equity Method Investments. Investments in which we havethe ability to exercise significant influence, but do not control, areaccounted for under the equity method of accounting and are includedin Other assets on the Consolidated Balance Sheet. Under this methodof accounting, our share of the net earnings or losses of the investeeis included in Other income, net on the Consolidated Statement ofOperations since the activities of the investee are closely aligned withthe operations of the business segment holding the investment. Weevaluate our equity method investments whenever events or changesin circumstance indicate that the carrying amounts of such investmentsmay be impaired. If a decline in the value of an equity method invest-ment is determined to be other than temporary, a loss is recorded inearnings in the current period. There were no significant impairmentcharges recorded in 2013 on our equity method investments.
Goodwill and Intangible Assets. Goodwill represents costs inexcess of fair values assigned to the underlying net assets of acquiredbusinesses. Goodwill and intangible assets deemed to have indefinitelives are not amortized. Goodwill and indefinite-lived intangible assetsare subject to annual impairment testing using the guidance andcriteria described in the FASB ASC Topic “Intangibles—Goodwill andOther.” This testing compares carrying values to fair values and, whenappropriate, the carrying value of these assets is reduced to fair value.
Intangible assets consist of service portfolios, patents,trademarks/tradenames, customer relationships and other intangibleassets including a collaboration asset established in connection withthe restructuring of participants’ interests in IAE as discussed furtherin Note 2. Acquired intangible assets are recognized at fair value inpurchase accounting and then amortized to cost of sales and selling,general & administrative expenses over the applicable useful lives.Also included within other intangible assets are commercial aerospacepayments made to secure certain contractual rights to provide producton new aircraft platforms. Consideration paid on these contractualcommitments is capitalized when it is no longer conditional.
Useful lives of finite-lived intangible assets are estimated basedupon the nature of the intangible asset and the industry in which theintangible asset is used. These intangible assets are amortized basedon the pattern in which the economic benefits of the intangible assetsare consumed. For both our commercial aerospace collaborationassets and exclusivity arrangements, the pattern of economic benefitgenerally results in lower amortization during the development periodwith increasing amortization as programs enter full rate production andaftermarket cycles. If a pattern of economic benefit cannot be reliably
Notes to Consolidated Financial Statements
52 United Technologies Corporation

determined, a straight-line amortization method is used. The range ofestimated useful lives is as follows:
Collaboration asset 30 years
Customer relationships and related programs 2 to 32 years
Purchased service contracts 5 to 30 years
Patents & trademarks 3 to 40 years
Exclusivity assets 3 to 25 years
Other Long-Lived Assets. We evaluate the potential impairmentof other long-lived assets when appropriate. If the carrying value ofother long-lived assets held and used exceeds the sum of the undis-counted expected future cash flows, the carrying value is written downto fair value.
Long-Term Financing Receivables. Our long-term and financ-ing receivables primarily represent balances related to the aerospacebusinesses such as long-term trade accounts receivable, leases, andnotes receivable. We also have other long-term receivables in ourcommercial businesses; however, both the individual and aggregateamounts of those other receivables are not significant.
Long-term trade accounts receivable represent amounts arisingfrom the sale of goods and services with a contractual maturity dateof greater than one year and are recognized as “Other assets” in ourConsolidated Balance Sheet. Notes and leases receivable representnotes and lease receivables other than receivables related to operatingleases, and are recognized as “Customer financing assets” in ourConsolidated Balance Sheet. The following table summarizesthe balance by class of aerospace long-term receivables as ofDecember 31, 2013 and 2012:
(DOLLARS IN MILLIONS) 2013 2012
Long-term trade accounts receivable $ 714 $ 593
Notes and leases receivable 583 584
Total long-term receivables $ 1,297 $ 1,177
We determine a receivable is impaired when, based on currentinformation and events, it is probable that we will be unable to collectamounts due according to the contractual terms of the receivableagreement. Factors considered in assessing collectability and riskinclude, but are not limited to, examination of credit quality indicatorsand other evaluation measures, underlying value of any collateral orsecurity interests, significant past due balances, historical losses, andexisting economic conditions.
We determine credit ratings for each customer in our portfoliobased upon public information and information obtained directlyfrom our customers. We conduct a review of customer credit ratings,published historical credit default rates for different rating categories,and multiple third party aircraft value publications as a basis to validatethe reasonableness of the allowance for losses on these balancesquarterly or when events and circumstances warrant. Customer creditratings range from an extremely strong capacity to meet financialobligations, to customers whose uncollateralized receivable is in
default. There can be no assurance that actual results will not differfrom estimates or that consideration of these factors in the future willnot result in an increase or decrease to the allowance for credit losseson long-term receivables. Based upon the customer credit ratings,approximately 9% of the total long-term receivables reflected in thetable above were considered to bear high credit risk as of bothDecember 31, 2013 and 2012. See Note 5 for further discussionof commercial aerospace industry assets and commitments.
Reserves for credit losses on receivables relate to specificallyidentified receivables that are evaluated individually for impairment.For notes and leases receivable we determine a specific reserve forexposure based on the difference between the carrying value of thereceivable and the estimated fair value of the related collateral inconnection with the evaluation of credit risk and collectability. Forlong-term trade accounts receivable, we evaluate credit risk andcollectability individually to determine if an allowance is necessary.Our long-term receivables reflected in the table above, which includereserves of $49 million and $60 million as of December 31, 2013and 2012, respectively, are individually evaluated for impairment. Atboth December 31, 2013 and 2012, we did not have any significantbalances that are considered to be delinquent, on non-accrual status,past due 90 days or more, or considered to be impaired.
Income Taxes. In the ordinary course of business there is inher-ent uncertainty in quantifying our income tax positions. We assess ourincome tax positions and record tax benefits for all years subject toexamination based upon management’s evaluation of the facts, cir-cumstances, and information available at the reporting date. For thosetax positions where it is more-likely-than-not that a tax benefit will besustained, we have recorded the largest amount of tax benefit with agreater than 50% likelihood of being realized upon ultimate settlementwith a taxing authority that has full knowledge of all relevant informa-tion. For those income tax positions where it is not more-likely-than-notthat a tax benefit will be sustained, no tax benefit has been recognizedin the financial statements. Where applicable, associated interestexpense has also been recognized. We recognize accrued interestrelated to unrecognized tax benefits in interest expense. Penalties, ifincurred, would be recognized as a component of income tax expense.
Revenue Recognition. As a result of our diverse product andservice mix and customer base, we use multiple revenue recognitionpractices. We recognize sales for product or services in contractswithin the scope of Staff Accounting Bulletin (“SAB”) Topic 13,Revenue Recognition. Products and services included within thescope of this SAB Topic include heating, ventilating, air-conditioningand refrigeration systems, non-complex alarm and fire detection andsuppression systems, commercially funded research and developmentcontracts and non-complex aerospace components. Sales within thescope of this SAB Topic are recognized when persuasive evidence ofan arrangement exists, product delivery has occurred or services havebeen rendered, pricing is fixed or determinable and collectability isreasonably assured. Subsequent changes in service contracts areaccounted for prospectively.
Notes to Consolidated Financial Statements
2013 Annual Report 53
Contract Accounting and Separately Priced Maintenance andExtended Warranty Aftermarket Contracts: For our construction-typeand certain production-type contracts, sales are recognized on apercentage-of-completion basis following contract accounting meth-ods. Contracts consist of enforceable agreements which form thebasis of our unit of accounting for measuring sales, accumulating costsand recording loss provisions as necessary. Contract accountingrequires estimates of award fees and other sources of variable consid-eration as well as future costs over the performance period of thecontract. Cost estimates also include the estimated cost of satisfyingour offset obligations required under certain contracts. Cost estimatesare subject to change and result in adjustments to margins on con-tracts in progress. The extent of progress toward completion on ourlong-term commercial aerospace equipment and production-typehelicopter contracts is measured using units of delivery or othercontractual milestones. The extent of progress towards completionon our development and other cost reimbursement contracts in ouraerospace businesses and elevator and escalator sales, installation,modernization and other construction contracts in our commercialbusinesses is measured using cost-to-cost based input measures.Contract costs include estimated inventoriable manufacturing, engi-neering, product warranty and product performance guarantee costs,as appropriate. Contract costs are primarily averaged until actualcosts approximate the average for those units of accounting whichuse output measures when measuring progress towards completion.
For separately priced product maintenance and extendedwarranty aftermarket contracts, sales are recognized over the contractperiod. In the commercial businesses, sales are primarily recognizedon a straight-line basis. In the aerospace businesses, sales areprimarily recognized in proportion to cost as sufficient historicalevidence indicates that costs of performing services under thecontract are incurred on an other than straight-line basis.
Losses, if any, on long-term contracts are provided for whenevident. Loss provisions on original equipment contracts are recog-nized to the extent estimated contract costs exceed the estimatedconsideration from the products contemplated under the contractualarrangement. For new commitments, we generally record loss provi-sions at the earlier of contract announcement or contract signingexcept for certain requirements contracts under which losses arerecorded upon receipt of the purchase order which obligates us toperform. For existing commitments, anticipated losses on contractsare recognized in the period in which losses become evident. Productscontemplated under contractual arrangement include firm quantities ofproducts purchased under contract and, in the large commercialengine and wheels and brakes businesses, future highly probable salesof replacement parts required by regulation that are expected to bepurchased subsequently for incorporation into the original equipment.In the large commercial engine and wheels and brakes businesses,when the combined original equipment and aftermarket arrangementsfor each individual sales campaign are profitable, we record originalequipment product losses, as applicable, at the time of delivery.
We review our cost estimates on significant contracts on a quar-terly basis, and for others, no less frequently than annually or whencircumstances change and warrant a modification to a previous esti-mate. We record changes in contract estimates using the cumulativecatch-up method in accordance with the “Revenue Recognition” Topicof the FASB ASC. The net increase in operating profits as a result ofsignificant changes in aerospace contract estimates was $167 millionin 2013 driven by several favorable contract adjustments recordedthroughout the year largely at the Pratt & Whitney segment. The impactof these adjustments was not considered significant to either the salesor operating profits of the segment in the quarter in which they wererecorded other than the impact of a contract termination which wasdisclosed in the Pratt & Whitney segment results in the first quarterof 2013. The net change in contract estimates also includes the$27 million and $157 million adverse impacts revisions in estimateon the CH-148 Canadian Maritime Helicopter program resulting fromongoing program delays in 2013 and 2012, respectively.
Collaborations: Sales generated from engine programs, spareparts sales, and aftermarket business under collaboration arrange-ments are recorded consistent with our revenue recognition policiesin our consolidated financial statements. Amounts attributable to ourcollaborators for their share of sales are recorded as an expense in ourfinancial statements based upon the terms and nature of the arrange-ment. Costs associated with engine programs under collaborativearrangements are expensed as incurred. Under these arrangements,collaborators contribute their program share of engine parts, incur theirown production costs and make certain payments to Pratt & Whitneyfor shared or joint program costs. The reimbursement of a collabora-tor’s share of program costs is recorded as a reduction of the relatedexpense item at that time.
Cash Payments to Customers: UTC Climate, Controls & Securitycustomarily offers its customers incentives to purchase products toensure an adequate supply of its products in the distribution channels.The principal incentive program provides reimbursements to distribu-tors for offering promotional pricing for our products. We account forincentive payments made as a reduction in sales. In our aerospacebusinesses, we may make participation payments to certain customersto secure certain contract rights. We classify the subsequent amortiza-tion of these acquired intangible assets from our customers as areduction in sales. Contractually stated prices in arrangements withour customers that include the acquisition of intangible rights withinthe scope of “Intangibles—Goodwill and Other” and deliverableswithin the scope of the FASB ASC Topic “Revenue Recognition” arenot presumed to be representative of fair value for determining theamounts to allocate to each element of an arrangement.
Research and Development. Research and developmentcosts not specifically covered by contracts and those related to thecompany sponsored share of research and development activity inconnection with cost-sharing arrangements are charged to expenseas incurred. Government research and development support, notassociated with specific contracts, is recorded as a reduction toresearch and development expense in the period earned. Repayment,if any, is in the form of future royalties and is conditioned upon the
Notes to Consolidated Financial Statements
54 United Technologies Corporation
achievement of certain financial targets including specific aircraftengine sales, total aircraft engine sales volume and total year-over-yearsales growth of the entity receiving the government funding. Giventhe conditional and uncertain nature of any repayment obligations,royalty expense is typically recorded only upon engine shipment oris otherwise accrued monthly based upon the forecasted impactfor the current year. The cumulative funding received under existingrelationships has been approximately $2.2 billion of which approxi-mately $500 million has been repaid to date in the form of royalties.
Research and development costs incurred under contracts withcustomers are included as a contract cost and reported as a compo-nent of cost of products sold when revenue from such contracts isrecognized. Research and development costs in excess of contractualconsideration is expensed as incurred.
Foreign Exchange. We conduct business in many different cur-rencies and, accordingly, are subject to the inherent risks associatedwith foreign exchange rate movements. The financial position andresults of operations of substantially all of our foreign subsidiaries aremeasured using the local currency as the functional currency. Foreigncurrency denominated assets and liabilities are translated into U.S.Dollars at the exchange rates existing at the respective balance sheetdates, and income and expense items are translated at the averageexchange rates during the respective periods. The aggregate effectsof translating the balance sheets of these subsidiaries are deferredas a separate component of shareowners’ equity.
Derivatives and Hedging Activity. We have used derivativeinstruments, including swaps, forward contracts and options, to helpmanage certain foreign currency, interest rate and commodity priceexposures. Derivative instruments are viewed as risk managementtools by us and are not used for trading or speculative purposes. Bytheir nature, all financial instruments involve market and credit risks.We enter into derivative and other financial instruments with majorinvestment grade financial institutions and have policies to monitor thecredit risk of those counterparties. We limit counterparty exposure andconcentration of risk by diversifying counterparties. While there can beno assurance, we do not anticipate any material non-performance byany of these counterparties. We enter into transactions that are subjectto enforceable master netting arrangements or other similar agree-ments with various counterparties. However, we have not elected tooffset multiple contracts with a single counterparty and, as a result, thefair value of the derivative instruments in a loss position is not offsetagainst the fair value of derivative instruments in a gain position.
Derivatives used for hedging purposes may be designated andeffective as a hedge of the identified risk exposure at the inception ofthe contract. All derivative instruments are recorded on the balancesheet at fair value. Derivatives used to hedge foreign-currency-denominated balance sheet items are reported directly in earningsalong with offsetting transaction gains and losses on the items beinghedged. Derivatives used to hedge forecasted cash flows associatedwith foreign currency commitments or forecasted commodity pur-chases may be accounted for as cash flow hedges, as deemedappropriate. Gains and losses on derivatives designated as cash flowhedges are recorded in other comprehensive income and reclassified
to earnings as a component of product sales or expenses, as appli-cable, when the hedged transaction occurs. To the extent that apreviously designated hedging transaction is no longer an effectivehedge, any ineffectiveness measured in the hedging relationship isrecorded currently in earnings in the period it occurs.
To the extent the hedge accounting criteria are not met, theforeign currency forward contracts are utilized as economic hedgesand changes in the fair value of these contracts are recorded currentlyin earnings in the period in which they occur. Additional informationpertaining to foreign currency forward contracts is included in Note 14.
Environmental. Environmental investigatory, remediation, operat-ing and maintenance costs are accrued when it is probable that aliability has been incurred and the amount can be reasonably esti-mated. The most likely cost to be incurred is accrued based on anevaluation of currently available facts with respect to each individualsite, including existing technology, current laws and regulations andprior remediation experience. Where no amount within a range of esti-mates is more likely, the minimum is accrued. For sites with multipleresponsible parties, we consider our likely proportionate share of theanticipated remediation costs and the ability of the other parties tofulfill their obligations in establishing a provision for those costs.Liabilities with fixed or reliably determinable future cash paymentsare discounted. Accrued environmental liabilities are not reduced bypotential insurance reimbursements.
Pension and Postretirement Obligations. Guidance underthe FASB ASC Topic “Compensation—Retirement Benefits” requiresbalance sheet recognition of the overfunded or underfunded statusof pension and postretirement benefit plans. Under this guidance,actuarial gains and losses, prior service costs or credits, and anyremaining transition assets or obligations that have not been recog-nized under previous accounting standards must be recognized inother comprehensive income, net of tax effects, until they are amor-tized as a component of net periodic benefit cost.
Product Performance Obligations. We extend performanceand operating cost guarantees beyond our normal service andwarranty policies for extended periods on some of our products, par-ticularly commercial aircraft engines. Liability under such guarantees isbased upon future product performance and durability. In addition, weincur discretionary costs to service our products in connection withproduct performance issues. We accrue for such costs that are prob-able and can be reasonably estimated. The costs associated withthese product performance and operating cost guarantees requireestimates over the full terms of the agreements, and require manage-ment to consider factors such as the extent of future maintenancerequirements and the future cost of material and labor to perform theservices. These cost estimates are largely based upon historicalexperience. See Note 16 for further discussion.
Collaborative Arrangements. In view of the risks and costsassociated with developing new engines, Pratt & Whitney has enteredinto certain collaboration arrangements in which sales, costs and risksare shared. Sales generated from engine programs, spare parts, andaftermarket business under collaboration arrangements are recordedas earned in our financial statements. Amounts attributable to our
Notes to Consolidated Financial Statements
2013 Annual Report 55
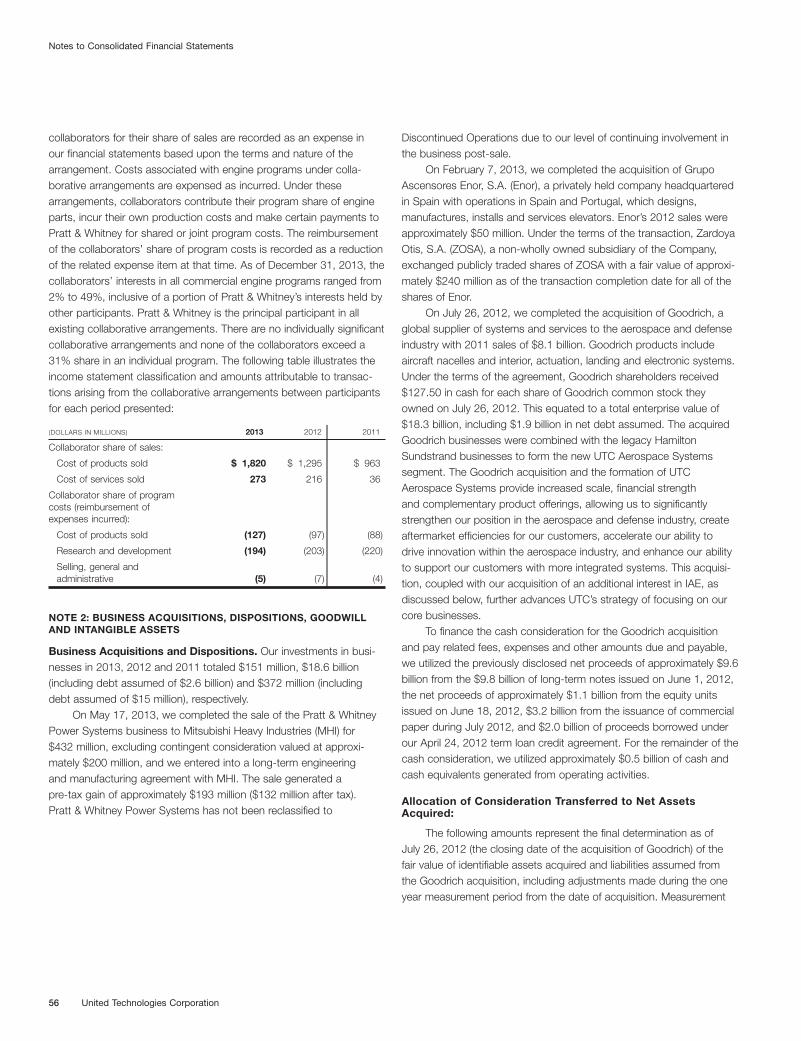
collaborators for their share of sales are recorded as an expense inour financial statements based upon the terms and nature of thearrangement. Costs associated with engine programs under colla-borative arrangements are expensed as incurred. Under thesearrangements, collaborators contribute their program share of engineparts, incur their own production costs and make certain payments toPratt & Whitney for shared or joint program costs. The reimbursementof the collaborators’ share of program costs is recorded as a reductionof the related expense item at that time. As of December 31, 2013, thecollaborators’ interests in all commercial engine programs ranged from2% to 49%, inclusive of a portion of Pratt & Whitney’s interests held byother participants. Pratt & Whitney is the principal participant in allexisting collaborative arrangements. There are no individually significantcollaborative arrangements and none of the collaborators exceed a31% share in an individual program. The following table illustrates theincome statement classification and amounts attributable to transac-tions arising from the collaborative arrangements between participantsfor each period presented:
(DOLLARS IN MILLIONS) 2013 2012 2011
Collaborator share of sales:
Cost of products sold $ 1,820 $ 1,295 $ 963
Cost of services sold 273 216 36
Collaborator share of programcosts (reimbursement ofexpenses incurred):
Cost of products sold (127) (97) (88)
Research and development (194) (203) (220)
Selling, general andadministrative (5) (7) (4)
NOTE 2: BUSINESS ACQUISITIONS, DISPOSITIONS, GOODWILLAND INTANGIBLE ASSETS
Business Acquisitions and Dispositions. Our investments in busi-nesses in 2013, 2012 and 2011 totaled $151 million, $18.6 billion(including debt assumed of $2.6 billion) and $372 million (includingdebt assumed of $15 million), respectively.
On May 17, 2013, we completed the sale of the Pratt & WhitneyPower Systems business to Mitsubishi Heavy Industries (MHI) for$432 million, excluding contingent consideration valued at approxi-mately $200 million, and we entered into a long-term engineeringand manufacturing agreement with MHI. The sale generated apre-tax gain of approximately $193 million ($132 million after tax).Pratt & Whitney Power Systems has not been reclassified to
Discontinued Operations due to our level of continuing involvement inthe business post-sale.
On February 7, 2013, we completed the acquisition of GrupoAscensores Enor, S.A. (Enor), a privately held company headquarteredin Spain with operations in Spain and Portugal, which designs,manufactures, installs and services elevators. Enor’s 2012 sales wereapproximately $50 million. Under the terms of the transaction, ZardoyaOtis, S.A. (ZOSA), a non-wholly owned subsidiary of the Company,exchanged publicly traded shares of ZOSA with a fair value of approxi-mately $240 million as of the transaction completion date for all of theshares of Enor.
On July 26, 2012, we completed the acquisition of Goodrich, aglobal supplier of systems and services to the aerospace and defenseindustry with 2011 sales of $8.1 billion. Goodrich products includeaircraft nacelles and interior, actuation, landing and electronic systems.Under the terms of the agreement, Goodrich shareholders received$127.50 in cash for each share of Goodrich common stock theyowned on July 26, 2012. This equated to a total enterprise value of$18.3 billion, including $1.9 billion in net debt assumed. The acquiredGoodrich businesses were combined with the legacy HamiltonSundstrand businesses to form the new UTC Aerospace Systemssegment. The Goodrich acquisition and the formation of UTCAerospace Systems provide increased scale, financial strengthand complementary product offerings, allowing us to significantlystrengthen our position in the aerospace and defense industry, createaftermarket efficiencies for our customers, accelerate our ability todrive innovation within the aerospace industry, and enhance our abilityto support our customers with more integrated systems. This acquisi-tion, coupled with our acquisition of an additional interest in IAE, asdiscussed below, further advances UTC’s strategy of focusing on ourcore businesses.
To finance the cash consideration for the Goodrich acquisitionand pay related fees, expenses and other amounts due and payable,we utilized the previously disclosed net proceeds of approximately $9.6billion from the $9.8 billion of long-term notes issued on June 1, 2012,the net proceeds of approximately $1.1 billion from the equity unitsissued on June 18, 2012, $3.2 billion from the issuance of commercialpaper during July 2012, and $2.0 billion of proceeds borrowed underour April 24, 2012 term loan credit agreement. For the remainder of thecash consideration, we utilized approximately $0.5 billion of cash andcash equivalents generated from operating activities.
Allocation of Consideration Transferred to Net AssetsAcquired:
The following amounts represent the final determination as ofJuly 26, 2012 (the closing date of the acquisition of Goodrich) of thefair value of identifiable assets acquired and liabilities assumed fromthe Goodrich acquisition, including adjustments made during the oneyear measurement period from the date of acquisition. Measurement
Notes to Consolidated Financial Statements
56 United Technologies Corporation

period adjustments were not significant and were not retroactivelyreclassified to prior periods.
(DOLLARS IN MILLIONS)
Cash and cash equivalents $ 538
Accounts receivable, net 1,205
Inventories and contracts in progress, net 1,673
Future income tax benefits, current 515
Other assets, current 647
Fixed assets 2,209
Intangible assets:
Customer relationships and related program assets 8,550
Trademarks 1,550
Other assets 1,501
Short-term borrowings (84)
Accounts payable (587)
Accrued liabilities (1,919)
Long-term debt (2,961)
Future pension and postretirement benefit obligations (1,743)
Other long-term liabilities:
Customer contractual obligations (2,200)
Other long-term liabilities (4,013)
Noncontrolling interests (41)
Total identifiable net assets 4,840
Goodwill 11,580
Total consideration transferred $ 16,420
In order to allocate the consideration transferred for Goodrich, thefair values of all identifiable assets and liabilities needed to be estab-lished. For accounting and financial reporting purposes, fair value isdefined under the “Fair Value Measurements and Disclosures” Topicof the FASB ASC as the price that would be received upon sale of anasset or the amount paid to transfer a liability in an orderly transactionbetween market participants at the measurement date. Market parti-cipants are assumed to be buyers and sellers in the principal (mostadvantageous) market for the asset or liability. Additionally, fair valuemeasurements for an asset assume the highest and best use of thatasset by market participants. Use of different estimates and judgmentscould yield different results.
In determining the fair value of identifiable assets acquiredand liabilities assumed, a review was conducted for any significantcontingent assets or liabilities existing as of the acquisition date. Nosignificant contingencies related to existing legal or government actionhave been identified which existed as of the opening balance sheetdate. Based upon our existing practices and phase II environmentalassessments done on a number of Goodrich sites, we determinedthat environmental liability obligations of $325 million were assumed inconnection with the acquisition.
The fair values of the customer relationship and related programintangible assets, which include the related aerospace program OEMand aftermarket cash flows, were determined by using an “income
approach” which is the most common valuation approach utilized.Under this approach, the net earnings attributable to the asset orliability being measured are isolated using the discounted projected netcash flows. These projected cash flows are isolated from the projectedcash flows of the combined asset group over the remaining economiclife of the intangible asset or liability being measured. Both the amountand the duration of the cash flows are considered from a marketparticipant perspective. Our estimates of market participant net cashflows considered historical and projected pricing, remaining develop-mental effort, operational performance including company specificsynergies, aftermarket retention, product life cycles, material and laborpricing, and other relevant customer, contractual and market factors.Where appropriate, the net cash flows are probability-adjusted toreflect the uncertainties associated with the underlying assumptions,as well as the risk profile of the net cash flows utilized in the valuation.The probability-adjusted future cash flows are then discounted topresent value using an appropriate discount rate. The customerrelationship and related program intangible assets are being amortizedon a straight-line basis (which approximates the economic pattern ofbenefits) over the estimated economic life of the underlying programsof 10 to 25 years.
We also identified customer contractual obligations on certainOEM development programs where the expected costs exceed theexpected revenue under contract. We measured these liabilities underthe provisions of the “Fair Value Measurements and Disclosures” Topicof the FASB ASC, which is based on the price to transfer the obligationto a market participant at the measurement date, assuming that theliability will remain outstanding in the marketplace. Based on the esti-mated net cash outflows of the OEM developmental programs plus areasonable contracting profit margin required to transfer the contractsto market participants, we recorded assumed liabilities of approxi-mately $2.2 billion. These liabilities will be liquidated in accordance withthe underlying economic pattern of obligations, as reflected by the netcash outflows incurred on the OEM contracts. Total consumption ofthe contractual obligation for the year ended December 31, 2013 wasapproximately $278 million. Total consumption of the contractual obli-gation is expected to be as follows: $261 million in 2014, $220 millionin 2015, $239 million in 2016, $242 million in 2017, $210 million in2018 and $686 million thereafter.
Goodrich had not recorded an income tax liability on the unremit-ted earnings of its non-U.S. subsidiaries, which were approximately$853 million as of December 31, 2011. In connection with theGoodrich acquisition, UTC has made a determination to repatriatecertain of these unremitted earnings, making such amounts subjectto both U.S. and non-U.S. income taxes. Accordingly, an income taxliability of $215 million was recorded in purchase accounting for theunremitted earnings no longer considered permanently reinvested.
In 2010, Pratt & Whitney entered into a preferred supplier con-tract with Goodrich for the development and subsequent productionof nacelles for the PW1500G (Bombardier CSeries) and PW1200G
Notes to Consolidated Financial Statements
2013 Annual Report 57

(Mitsubishi Regional Jet). That preferred supplier contract replacedprevious contracts and preliminary Memorandum of Understandingsentered into in 2006 and 2008. Under the 2010 agreement, Pratt &Whitney agreed to fund Goodrich’s non-recurring development effortand established a recurring price for the production nacelles. Prior tothe date of the Goodrich acquisition, Pratt & Whitney and Goodrichhad asserted claims against each other in a contractual dispute andwould have ultimately arbitrated the matter were it not for the acquisi-tion. In accordance with ASC Topic 805, pre-existing relationshipsmust be effectively settled at acquisition as the relationships becomeintercompany relationships upon acquisition and are eliminated inthe post-combination financial statements. Any resulting settlementgains or losses should be measured at fair value and recorded on theacquisition date. Accordingly, a $46 million gain was recorded in otherincome by Pratt & Whitney in the quarter ended September 30, 2012based upon a third party determination of the probability-weightedoutcome had the matter gone to arbitration. No additional gain orloss was recorded in connection with the settlement of thesepre-existing relationships as we determined that the terms of thesetwo contracts were consistent with other similar market transactionsat the time of our acquisition of Goodrich.
Under Goodrich’s pre-existing management continuity arrange-ments (MCAs), we assumed change-in-control obligations related tocertain executives at Goodrich. We evaluated the change-in-controlprovisions governed by the MCAs and for certain of the executives, wedetermined that we had assumed liabilities of approximately $74 millionas the benefit payments were effectively single trigger arrangementsin substance. We measured the assumed liability based on fair valueconcepts of ASC Topic 820, using weighted average techniques ofpossible outcomes of the employees electing to receive such benefits.We expensed approximately $12 million in 2012 for MCAs where weamended the term of the MCAs beyond the original expiration date forcertain executives. We incurred expense of approximately $9 million inconnection with MCA payments made in 2013.
Acquisition-Related Costs:
Acquisition-related costs have been expensed as incurred. In2012 and 2011, approximately $95 million and $84 million, respec-tively, of transaction costs (including integration costs) were incurred inaddition to approximately $67 million of restructuring costs, includingexit costs in connection with the acquisition.
Supplemental Pro-Forma Data:
Goodrich’s results of operations have been included in UTC’sfinancial statements for the period subsequent to the completion of theacquisition on July 26, 2012. The following unaudited supplementalpro-forma data presents consolidated information as if the acquisitionhad been completed on January 1, 2011. There were no significantpro-forma adjustments required for the year ended December 31,2013. The pro-forma results were calculated by combining the resultsof UTC with the stand-alone results of Goodrich for the pre-acquisition
periods, which were adjusted to account for certain costs which wouldhave been incurred during this pre-acquisition period:
(DOLLARS IN MILLIONS, EXCEPT PER SHARE AMOUNTS) 2012
Net sales $ 62,173
Net income attributable to common shareowners from continuingoperations 5,095
Basic earnings per share of common stock from continuingoperations 5.69
Diluted earnings per share of common stock from continuingoperations 5.62
The unaudited supplemental pro-forma data above includes thefollowing significant adjustments made to account for certain costswhich would have been incurred if the acquisition had been completedon January 1, 2011, as adjusted for the applicable tax impact. As theGoodrich acquisition was completed on July 26, 2012, the pro-formaadjustments for 2012 in the table below only include the requiredadjustments through July 26, 2012:
(DOLLARS IN MILLIONS) 2012
Amortization of inventory fair value adjustment1 $ (103)
Amortization of acquired Goodrich intangible assets, net 2 108
Utilization of contractual customer obligation 3 (96)
Interest expense incurred on acquisition financing, net 4 63
1 Removed the expense for inventory fair value adjustments recognized during thelast two quarters of 2012, which would have been amortized as the correspondinginventory would have been completely sold during the first two quarters of 2011.
2 Added the additional amortization of the acquired Goodrich intangible assetsrecognized at fair value in purchase accounting and eliminated the historicalGoodrich intangible asset amortization expense.
3 Added the additional utilization of the Goodrich contractual customer obligationrecognized in purchase accounting.
4 Added the additional interest expense for the debt incurred to finance our acquisitionof Goodrich and reduced interest expense for the debt fair value adjustment whichwould have been amortized.
The unaudited supplemental pro-forma financial informationdoes not reflect the potential realization of cost savings relating to theintegration of the two companies. Further, the pro-forma data shouldnot be considered indicative of the results that would have occurredif the acquisition and related financing had been consummated onJanuary 1, 2011, nor are they indicative of future results.
In connection with regulatory approval of UTC’s acquisition ofGoodrich, regulatory authorities required UTC to dispose of theGoodrich electric power systems and the Goodrich pumps and enginecontrols businesses. Pursuant to regulatory obligations, these busi-nesses had been held separately from UTC’s and Goodrich’s ongoingbusinesses since the acquisition of Goodrich by UTC. On March 18,2013, we completed the sale of the Goodrich pumps and engine con-trols business to Triumph Group, Inc., and on March 26, 2013, wecompleted the sale of the Goodrich electric power systems business toSafran S.A. Combined proceeds from the sales of the two businesseswere approximately $600 million.
Notes to Consolidated Financial Statements
58 United Technologies Corporation

Other Acquisition and Disposition Activity:
In 2012, UTC approved plans for the divestiture of a number ofnon-core businesses. Cash generated from these divestitures wasused to repay debt incurred to finance the Goodrich acquisition. SeeNote 3 for further discussion.
On June 29, 2012, Pratt & Whitney, Rolls-Royce plc (Rolls-Royce), MTU Aero Engines AG (MTU), and Japanese Aero EnginesCorporation (JAEC), participants in the IAE collaboration, completeda restructuring of their interests in IAE. Under the terms of the agree-ment, Rolls-Royce sold its ownership and collaboration interests in IAEto Pratt & Whitney, while also entering into an agreement to license itsV2500 intellectual property to Pratt & Whitney. In exchange for theincreased ownership and collaboration interests and intellectualproperty license, Pratt & Whitney paid Rolls-Royce $1.5 billion atclosing with additional payments due to Rolls-Royce during the fifteenyear period following closing of the purchase, conditional upon eachhour flown by V2500-powered aircraft in service at the closing. Pay-ments made to Rolls-Royce under this agreement are capitalized ascollaboration intangible assets, as further discussed below. In October2011, Pratt & Whitney and Rolls-Royce announced their intention toform a new partnership to develop an engine to power future mid-sizedaircraft. In September 2013, following further discussion and becauseof the current regulatory environment, the parties agreed not toproceed with this partnership. As a result of this decision, an additionalcollaboration intangible asset payment was made to Rolls-Royce inaccordance with the underlying agreement.
The collaboration interest and intellectual property licenses arereflected as intangible assets and are amortized in relation to theeconomic benefits received over the remaining estimated 30 yearlife of the V2500 program. As a result of these transactions, Pratt &Whitney holds a 61% net interest in the collaboration and a 49.5%ownership interest in IAE. IAE’s business purpose is to coordinate thedesign, development, manufacturing and product support of theV2500 program through involvement with the collaborators. IAE retainslimited equity with the primary economics of the V2500 programpassed to the participants in the separate collaboration arrangement.As such, we have determined that IAE is a variable interest entity, andPratt & Whitney is the primary beneficiary under the criteria establishedin the FASB ASC Topic 810 “Consolidations” and has, therefore, beenconsolidated. The carrying amounts and classification of assetsand liabilities for IAE in our Consolidated Balance Sheet as ofDecember 31, 2013 and 2012 are as follows:
(DOLLARS IN MILLIONS) 2013 2012
Current assets $ 1,616 $ 1,308
Noncurrent assets 1,066 899
Total assets $ 2,682 $ 2,207
Current liabilities $ 1,895 $ 1,468
Noncurrent liabilities 1,085 781
Total liabilities $ 2,980 $ 2,249
UTC Climate, Controls & Security continued its portfolio transfor-mation efforts in 2013 with the disposition of a number of businesses,resulting in a net gain of approximately $55 million, including gainsfrom the sale of businesses in Hong Kong and Australia. UTC Climate,Controls & Security portfolio transformation in 2012 included thedisposition of a number of businesses resulting in impairment andother charges totaling approximately $180 million. During 2012, UTCClimate, Controls & Security also sold a controlling interest in amanufacturing and distribution joint venture in Asia generating a gainof approximately $215 million, and a controlling interest in a Canadiandistribution business generating a gain of approximately $120 million.
Goodwill. The changes in the carrying amount of goodwill, bysegment, are as follows:
(DOLLARS IN MILLIONS)
Balance as ofJanuary 1,
2013
Goodwillresulting from
businesscombinations
Foreigncurrency
translationand other
Balance as ofDecember 31,
2013
Otis $ 1,583 $ 152 $ 6 $ 1,741
UTC Climate, Controls & Security 9,868 2 (143) 9,727
Pratt & Whitney 1,238 – 35 1,273
UTC Aerospace Systems 14,754 301 14 15,069
Sikorsky 353 – – 353
Total Segments 27,796 455 (88) 28,163
Eliminations and other 5 – – 5
Total $ 27,801 $ 455 $ (88) $ 28,168
Intangible Assets. Identifiable intangible assets are comprised ofthe following:
2013 2012
(DOLLARS IN MILLIONS)Gross
AmountAccumulatedAmortization
GrossAmount
AccumulatedAmortization
Amortized:
Service portfolios $ 2,234 $ (1,295) $ 2,127 $ (1,202)
Patents andtrademarks 380 (181) 412 (167)
IAE collaboration 2,273 – 1,526 –
Customerrelationshipsand other 12,049 (2,199) 11,901 (1,718)
16,936 (3,675) 15,966 (3,087)
Unamortized:
Trademarksand other 2,260 – 2,310 –
Total $ 19,196 $ (3,675) $ 18,276 $ (3,087)
The customer relationships intangible assets include paymentsmade to our customers to secure certain contractual rights. We amor-tize these intangible assets based on the pattern of economic benefit,which may result in an amortization method other than straight-line. Inaccordance with the FASB ASC Topic 605, “Customer Payments andIncentives,” we classify amortization of such payments as a reductionof sales. The IAE collaboration intangible asset is being amortizedbased upon the economic pattern of benefits as represented by the
Notes to Consolidated Financial Statements
2013 Annual Report 59

underlying cash flows. As these cash flows have been negative todate, no amortization has yet been recorded. Amortization of intangibleassets was $710 million, $547 million and $398 million in 2013, 2012and 2011, respectively. The following is the expected amortization ofintangible assets for 2014 through 2018, which reflects an increase inexpected amortization expense due to the pattern of economic benefiton certain aerospace intangible assets increasing over time.
(DOLLARS IN MILLIONS) 2014 2015 2016 2017 2018
Amortization expense $ 706 $ 688 $ 706 $ 732 $ 761
NOTE 3: DISCONTINUED OPERATIONS
In 2012, the UTC Board of Directors approved plans for the divestitureof a number of non-core businesses, which were completed with thesale of Pratt & Whitney Rocketdyne (Rocketdyne) on June 14, 2013,as discussed below. Cash generated from these divestitures wasused to repay debt incurred to finance the Goodrich acquisition.
On June 14, 2013, we completed the sale of substantially alloperations of Rocketdyne to GenCorp Inc. for $411 million. The salegenerated a pre-tax loss of approximately $7 million ($3 million aftertax), which has been included in discontinued operations in theaccompanying Consolidated Statement of Operations.
On February 12, 2013, we completed the disposition of UTCPower to ClearEdge Power. The disposition resulted in payments byUTC totaling $48 million, which included capitalization of the businessprior to the sale and interim funding of operations as the buyer tookcontrol of a loss generating business. We have no continuing involve-ment with the UTC Power business post disposition.
On December 13, 2012, we completed the sale of the legacyHamilton Sundstrand Industrial businesses to BC Partners and theCarlyle Group for $3.4 billion. The sale generated a pre-tax gainof approximately $2.1 billion ($0.9 billion after tax) which hasbeen included in discontinued operations in the accompanyingConsolidated Statement of Operations. The high effective tax rateis primarily attributable to non-deductible goodwill.
On August 7, 2012, we completed the disposition of ClipperWindpower (Clipper) to a private equity acquirer. The dispositionresulted in payments totaling approximately $367 million whichincluded capitalization of the business prior to sale, transaction fees,and funding of operations as the acquirer took control of a businesswith significant net liabilities. These payments are largely reflectedin Net cash provided by (used in) investing activities within thediscontinued operations section of the Consolidated Statement ofCash Flows. We have no continuing involvement with the Clipperbusiness following disposition.
The legacy Hamilton Sundstrand Industrial businesses, as wellas Clipper, Rocketdyne and UTC Power all met the “held-for-sale”criteria in 2012. The results of operations, including the net realizedgains and losses on disposition, and the related cash flows whichresulted from these non-core businesses, have been reclassifiedto Discontinued Operations in our Consolidated Statements ofOperations and Cash Flows.
The following summarized financial information for our discon-tinued operations businesses has been segregated from continuingoperations and reported as Discontinued Operations:
(DOLLARS IN MILLIONS) 2013 2012
Discontinued Operations:
Net sales $ 309 $ 2,075
Income (loss) from operations $ 63 $ (998)
Income tax expense (32) (65)
Income (loss) from operations, net of income taxes 31 (1,063)
(Loss) gain on disposal (33) 2,030
Income tax benefit (expense) 37 (677)
Net income from discontinued operations $ 35 $ 290
Income (loss) from operations of discontinued operations for 2012includes pre-tax impairment charges of approximately $1.2 billion.There were no impairment charges for 2013. These amounts were pre-viously included in (loss) gain on disposal of discontinued operationsand have been reclassified for consistency of presentation.
NOTE 4: EARNINGS PER SHARE
(DOLLARS IN MILLIONS, EXCEPT PER SHAREAMOUNTS; SHARES IN MILLIONS) 2013 2012 2011
Net income attributable to commonshareowners:
Net income from continuing operations $ 5,686 $ 4,847 $ 4,831
Net income from discontinued operations 35 283 148
Net income attributable tocommon shareowners $ 5,721 $ 5,130 $ 4,979
Basic weighted average number of sharesoutstanding 901.0 895.2 892.3
Stock awards 14.1 11.4 14.5
Diluted weighted average number ofshares outstanding 915.1 906.6 906.8
Earnings Per Share of Common Stock—Basic:
Net income from continuing operations $ 6.31 $ 5.41 $ 5.41
Net income from discontinued operations 0.04 0.32 0.17
Net income attributable to commonshareowners 6.35 5.73 5.58
Earnings Per Share of Common Stock—Diluted:
Net income from continuing operations $ 6.21 $ 5.35 $ 5.33
Net income from discontinued operations 0.04 0.31 0.16
Net income attributable to commonshareowners 6.25 5.66 5.49
The computation of diluted earnings per share excludes the effectof the potential exercise of stock awards, including stock appreciationrights and stock options when the average market price of the com-mon stock is lower than the exercise price of the related stock awardsduring the period. These outstanding stock awards are not included inthe computation of diluted earnings per share because the effectwould have been anti-dilutive. For 2013, there were no anti-dilutivestock awards excluded from the computation. For 2012, there were4.7 million anti-dilutive stock awards excluded from the computation.
Notes to Consolidated Financial Statements
60 United Technologies Corporation

For 2011, there were no anti-dilutive stock awards excluded from thecomputation. The dilutive impact of our equity units issued in 2012was not significant for 2013.
NOTE 5: COMMERCIAL AEROSPACE INDUSTRY ASSETS ANDCOMMITMENTS
We have receivables and other financing assets with commercialaerospace industry customers totaling $6,193 million and $5,731million at December 31, 2013 and 2012, respectively, includingcustomer financing assets related to commercial aerospace industrycustomers consisting of products under lease of $662 million andnotes and leases receivable of $586 million.
Aircraft financing commitments, in the form of debt, guaranteesor lease financing, are provided to commercial aerospace customers.The extent to which the financing commitments will be utilized isnot currently known, since customers may be able to obtain morefavorable terms from other financing sources. We may also arrangefor third-party investors to assume a portion of these commitments.If financing commitments are exercised, debt financing is generallysecured by assets with fair market values equal to or exceeding the
financed amounts consistent with market terms and conditions. Wemay also lease aircraft and subsequently sublease the aircraft to cus-tomers under long-term non-cancelable operating leases. Lastly, wehave made residual value and other guarantees related to various com-mercial aerospace customer financing arrangements. The estimatedfair market values of the guaranteed assets equal or exceed the valueof the related guarantees, net of existing reserves.
We also have other contractual commitments, including commit-ments to secure certain contractual rights to provide product on newaircraft platforms, which are included in “Other commercial aerospacecommitments” in the table below. Payments made on these contrac-tual commitments are included within other intangible assets and are tobe amortized over the term of underlying economic benefit. Our com-mercial aerospace financing and other contractual commitments as ofDecember 31, 2013 were approximately $11 billion. We have enteredinto certain collaboration arrangements, which may include participa-tion by our collaboration partners in these commitments.
The following is the expected maturity of commercial aerospaceindustry assets and commitments as of December 31, 2013:
(DOLLARS IN MILLIONS) Committed 2014 2015 2016 2017 2018 Thereafter
Notes and leases receivable $ 586 $ 107 $ 70 $ 59 $ 59 $ 48 $ 243
Commercial aerospace financing commitments $ 4,031 $ 440 $ 789 $ 852 $ 781 $ 231 $ 938
Other commercial aerospace commitments 7,227 656 664 710 689 598 3,910
Collaboration partners’ share (3,209) (342) (454) (516) (487) (225) (1,185)
Total commercial commitments $ 8,049 $ 754 $ 999 $ 1,046 $ 983 $ 604 $ 3,663
In exchange for the increased ownership and collaboration inter-ests and intellectual property license, Pratt & Whitney paid Rolls-Royce$1.5 billion at closing with additional payments due to Rolls-Roycecontingent upon each hour flown by the V2500-powered aircraft inservice as of June 29, 2012 during the fifteen year period followingclosing of the purchase. These payments are being capitalized as acollaboration intangible asset and amortized in relation to the economicbenefits received over the projected remaining 30 year life of the V2500program. The flight hour payments are included in other commercialaerospace commitments in the table above.
Our financing commitments with customers are contingent uponmaintenance of certain levels of financial condition by the customers. Inaddition, we have residual value and other guarantees of $615 millionas of December 31, 2013.
We have long-term aftermarket maintenance contracts with com-mercial aerospace industry customers for which revenue is recognizedin proportion to actual costs incurred relative to total expected coststo be incurred over the respective contract periods. Billings, however,are typically based on factors such as engine flight hours. The timingdifferences between the billings and the maintenance costs incurredgenerates both deferred assets and deferred revenues. Deferred assetsunder these long-term aftermarket contracts totaled $677 million and$391 million at December 31, 2013 and 2012, respectively, and are
included in “Other assets” in the accompanying Consolidated BalanceSheet. Deferred revenues generated totaled $3,117 million and $2,760million at December 31, 2013 and 2012, respectively, and are includedin “Accrued liabilities” and “Other long-term liabilities” in the accompa-nying Consolidated Balance Sheet.
Reserves related to aerospace receivables and financing assetswere $243 million and $210 million at December 31, 2013 and 2012,respectively. Reserves related to financing commitments and guaran-tees were $76 million and $67 million at December 31, 2013 and2012, respectively.
NOTE 6: INVENTORIES & CONTRACTS IN PROGRESS
(DOLLARS IN MILLIONS) 2013 2012
Raw materials $ 1,983 $ 1,861
Work-in-process 4,600 4,151
Finished goods 3,360 3,205
Contracts in progress 7,929 7,354
17,872 16,571
Less:
Progress payments, secured by lien, on U.S.Government contracts (279) (274)
Billings on contracts in progress (7,263) (6,760)
$ 10,330 $ 9,537
Notes to Consolidated Financial Statements
2013 Annual Report 61

Raw materials, work-in-process and finished goods are netof valuation reserves of $1,025 million and $866 million as ofDecember 31, 2013 and 2012, respectively. As of December 31, 2013and 2012, inventory also includes capitalized contract developmentcosts of $899 million and $823 million, respectively, related to certainaerospace programs. These capitalized costs will be liquidated as pro-duction units are delivered to the customer. The capitalized contractdevelopment costs within inventory principally relate to capitalizedcosts on Sikorsky’s CH-148 contract with the Canadian Government.
Contracts in progress principally relate to elevator and escalatorcontracts and include costs of manufactured components, accumu-lated installation costs and estimated earnings on incompletecontracts.
Our sales contracts in many cases are long-term contractsexpected to be performed over periods exceeding twelve months. AtDecember 31, 2013 and 2012, approximately 69% and 66%, respec-tively, of total inventories and contracts in progress have been acquiredor manufactured under such long-term contracts, a portion of which isnot scheduled for delivery within the next twelve months.
NOTE 7: FIXED ASSETS
(DOLLARS IN MILLIONS)Estimated
Useful Lives 2013 2012
Land $ 434 $ 433
Buildings and improvements 12 – 40 years 5,633 5,436
Machinery, tools and equipment 3 – 20 years 11,353 10,880
Other, including assets underconstruction 1,241 1,316
18,661 18,065
Accumulated depreciation (9,795) (9,547)
$ 8,866 $ 8,518
Depreciation expense was $1,050 million in 2013, $920 million in 2012and $823 million in 2011.
NOTE 8: ACCRUED LIABILITIES
(DOLLARS IN MILLIONS) 2013 2012
Advances on sales contracts and service billings $ 6,444 $ 5,936
Accrued salaries, wages and employee benefits 1,901 2,176
Income taxes payable 540 1,143
Litigation and contract matters 526 563
Service and warranty accruals 505 479
Interest payable 481 494
Accrued restructuring costs 337 389
Accrued property, sales and use taxes 280 291
Accrued workers compensation 218 233
Other 4,103 3,606
$ 15,335 $ 15,310
NOTE 9: BORROWINGS AND LINES OF CREDIT
(DOLLARS IN MILLIONS) 2013 2012
Short-term borrowings:
Commercial paper $ 200 $ 320
Other borrowings 188 183
Total short-term borrowings $ 388 $ 503
At December 31, 2013, we had revolving credit agreementswith various banks permitting aggregate borrowings of up to $4 billionpursuant to a $2 billion revolving credit agreement and a $2 billionmulticurrency revolving credit agreement, both of which expire inNovember 2016. As of December 31, 2013, there were no borrow-ings under either of these revolving credit agreements. The undrawnportions of these revolving credit agreements are also available toserve as backup facilities for the issuance of commercial paper. Asof December 31, 2013, our maximum commercial paper borrowingauthority as set by our Board of Directors was $4 billion. We generallyuse our commercial paper borrowings for general corporate purposes,including the funding of potential acquisitions and repurchases of ourcommon stock.
The weighted-average interest rates applicable to short-termborrowings outstanding at December 31, 2013 and 2012 were 1.8%and 0.9%, respectively. At December 31, 2013, approximately $1.4billion was available under short-term lines of credit with local banksat our various domestic and international subsidiaries.
On September 27, 2013, we redeemed all remaining outstanding2021 Goodrich 3.600% notes, representing $294 million in aggregateprincipal, under our redemption notice issued on August 28, 2013.On August 23, 2013, we redeemed all remaining outstanding 2019Goodrich 6.125% notes, representing $202 million in aggregateprincipal, under our redemption notice issued on July 24, 2013. OnJune 24, 2013, we redeemed all remaining outstanding 2015 UTC1.200% Senior Notes, representing $327 million in aggregate principal,under our redemption notice issued on May 24, 2013. On May 7,2013, we commenced cash tender offers for two series of outstandingnotes issued by Goodrich and the UTC 1.200% Senior Notes. A totalof $874 million principal amount of all notes subject to the tenderoffers, and $36 million of the fair value adjustment related to the notesassumed in the Goodrich acquisition, were repaid, including approxi-mately $103 million principal amount of the 2016 Goodrich 6.290%notes, approximately $98 million principal amount of the 2019Goodrich 6.125% notes, and approximately $674 million principalamount of the 2015 UTC 1.200% Senior Notes. A combined netextinguishment loss of approximately $23 million was recognizedwithin Interest expense, net in the accompanying ConsolidatedStatements of Operations.
As previously disclosed, on December 6, 2012, we announcedthat we had commenced cash tender offers for six series of outstand-ing notes issued by Goodrich. These offers expired on January 7,2013. Approximately $637 million in aggregate principal amount ofnotes subject to the tender offers and $126 million of the fair valueadjustment were repaid, with $635 million in aggregate principal
Notes to Consolidated Financial Statements
62 United Technologies Corporation

amount being eligible for the early tender premium and approximately$2 million in aggregate principal amount being paid on January 8,2013. An extinguishment loss of approximately $26 million wasrecognized within Interest expense, net during 2012.
Long-term debt consisted of the following as of December 31:
(DOLLARS IN MILLIONS) 2013 2012
LIBOR§ plus 0.270% floating rate notes due 2013 $ – $ 1,000
LIBOR§ plus 0.500% floating rate notes due 2015 500 500
1.200% notes due 2015* – 1,000
4.875% notes due 2015* 1,200 1,200
6.290% notes due 2016‡ 186 291
5.375% notes due 2017* 1,000 1,000
1.800% notes due 2017* 1,500 1,500
6.800% notes due 2018‡ 99 99
6.125% notes due 2019‡ – 300
6.125% notes due 2019* 1,250 1,250
8.875% notes due 2019 272 272
4.500% notes due 2020* 1,250 1,250
4.875% notes due 2020‡ 171 171
3.600% notes due 2021‡ – 295
8.750% notes due 2021 250 250
3.100% notes due 2022* 2,300 2,300
1.550% junior subordinated notes due 2022† 1,100 1,100
7.100% notes due 2027‡ 141 141
6.700% notes due 2028 400 400
7.500% notes due 2029* 550 550
5.400% notes due 2035* 600 600
6.050% notes due 2036* 600 600
6.800% notes due 2036‡ 134 134
7.000% notes due 2038‡ 159 159
6.125% notes due 2038* 1,000 1,000
5.700% notes due 2040* 1,000 1,000
4.500% notes due 2042* 3,500 3,500
Project financing obligations 86 100
Other (including capitalized leases)‡ 395 403
Total principal long-term debt 19,643 22,365
Other (fair market value adjustments and discounts)‡ 210 353
Total long-term debt 19,853 22,718
Less current portion 112 1,121
Long-term debt, net of current portion $ 19,741 $ 21,597
* We may redeem the above notes, in whole or in part, at our option at any time at aredemption price in U.S. Dollars equal to the greater of 100% of the principal amount ofthe notes to be redeemed or the sum of the present values of the remaining scheduledpayments of principal and interest on the notes to be redeemed, discounted to theredemption date on a semiannual basis at the adjusted treasury rate plus 10-50 basispoints. The redemption price will also include interest accrued to the date of redemp-tion on the principal balance of the notes being redeemed.
† The junior subordinated notes are redeemable at our option, in whole or in part, on adate not earlier than August 1, 2017. The redemption price will be the principal amount,plus accrued and unpaid interest, if any, up to but excluding the redemption date. Wemay extend or eliminate the optional redemption date as part of a remarketing of thejunior subordinated notes which could occur between April 29, 2015 and July 15, 2015or between July 23, 2015 and July 29, 2015.
‡ Includes notes and remaining fair market value adjustments that were assumed as apart of the Goodrich acquisition on July 26, 2012.
§ The three-month LIBOR rate as of December 31, 2013 was approximately 0.2%.
The project financing obligations noted above are associatedwith the sale of rights to unbilled revenues related to the ongoingactivity of an entity owned by UTC Climate, Controls & Security. Thepercentage of total short-term borrowings and long-term debt atvariable interest rates was 10% and 9% at December 31, 2013 and2012, respectively. Interest rates on our commercial paper borrowingsare considered variable due to their short-term duration and high-frequency of turnover.
The schedule of principal payments required on long-term debtfor the next five years and thereafter is:
(DOLLARS IN MILLIONS)
2014 $ 112
2015 1,732
2016 233
2017 2,534
2018 121
Thereafter 14,911
Total $ 19,643
We have an existing universal shelf registration statement filedwith the Securities and Exchange Commission (SEC) for an indetermi-nate amount of securities for future issuance, subject to our internallimitations on the amount of securities to be issued under this shelfregistration statement.
NOTE 10: EQUITY
As of January 1, 2013, we adopted the provisions of the FASBissued ASU No. 2013-02, “Reporting of Amounts Reclassified Outof Accumulated Other Comprehensive Income.” As a result of thisadoption, we have disclosed below the significant items reclassifiedto net income in their entirety during the period.
Notes to Consolidated Financial Statements
2013 Annual Report 63

A summary of the changes in each component of accumulated other comprehensive (loss) income, net of tax for the year endedDecember 31, 2013 is provided below:
(DOLLARS IN MILLIONS)
ForeignCurrency
Translation
Defined BenefitPension and
Post-retirementPlans
Unrealized Gains(Losses) on
Available-for-Sale Securities
UnrealizedHedging(Losses)
Gains
AccumulatedOther
Comprehensive(Loss) Income
Balance at December 31, 2012 $ 654 $ (6,250) $ 145 $ 3 $ (5,448)
Other comprehensive (loss) income before reclassifications, net (509) 2,409 208 (100) 2,008
Amounts reclassified 25 574 (57) 18 560
Balance at December 31, 2013 $ 170 $ (3,267) $ 296 $ (79) $ (2,880)
Details of the reclassification out of accumulated other comprehensive (loss) income for the year ended December 31, 2013 isprovided below:
(DOLLARS IN MILLIONS)Amount of Income (Expense) Reclassifiedfrom Other Comprehensive Income (Loss)
Affected Line Item in the ConsolidatedStatement of Comprehensive Income
Foreign Currency Translation:
Recognized due to business disposition $ (25) Other income, net
Defined Benefit Pension and Post-retirement Plans:
Amortization of prior-service costs and transition obligation $ 44 Note (1)
Recognized actuarial net loss (950) Note (1)
Total before tax (906)
Tax benefit 332 Income tax expense
Net of tax $ (574)
Unrealized Gains on Available-for-Sale Securities:
Realized gain on sale of securities, before tax $ 91 Other income, net
Tax expense (34) Income tax expense
Net of tax $ 57
Unrealized Hedging (Losses) Gains:
Foreign exchange contracts $ (25) Product Sales
Other contracts 2 Other income, net
Total before tax (23)
Tax benefit 5 Income tax expense
Net of tax $ (18)
(1) These accumulated other comprehensive components are included in the computation of net periodic pension cost (see Note 12 for additional details).
Changes in noncontrolling interests that do not result in a changeof control, and where there is a difference between fair value and carry-ing value, are accounted for as equity transactions. A summary ofthese changes in ownership interests in subsidiaries and the pro-formaeffect on Net income attributable to common shareowners had theybeen recorded through net income is provided below:
(DOLLARS IN MILLIONS) 2013 2012 2011
Net income attributable tocommon shareowners $ 5,721 $ 5,130 $ 4,979
Transfers to noncontrolling interests:
Increase in common stock forsale of subsidiary shares – – 3
Decrease in common stock forpurchase of subsidiary shares (49) (34) (54)
Net income attributable to commonshareowners after transfersto noncontrolling interests $ 5,672 $ 5,096 $ 4,928
NOTE 11: INCOME TAXES
Income Before Income Taxes. The sources of income from continu-ing operations before income taxes are:
(DOLLARS IN MILLIONS) 2013 2012 2011
United States $ 3,658 $ 2,595 $ 3,168
Foreign 4,654 4,316 4,182
$ 8,312 $ 6,911 $ 7,350
With few exceptions, U.S. income taxes have not been providedon undistributed earnings of UTC’s international subsidiaries. Theseearnings relate to ongoing operations and were approximately $25billion as of December 31, 2013. It is not practicable to estimatethe amount of tax that might be payable. We intend to reinvest theseearnings permanently outside the U.S. or to repatriate the earningsonly when it is tax effective to do so.
Notes to Consolidated Financial Statements
64 United Technologies Corporation
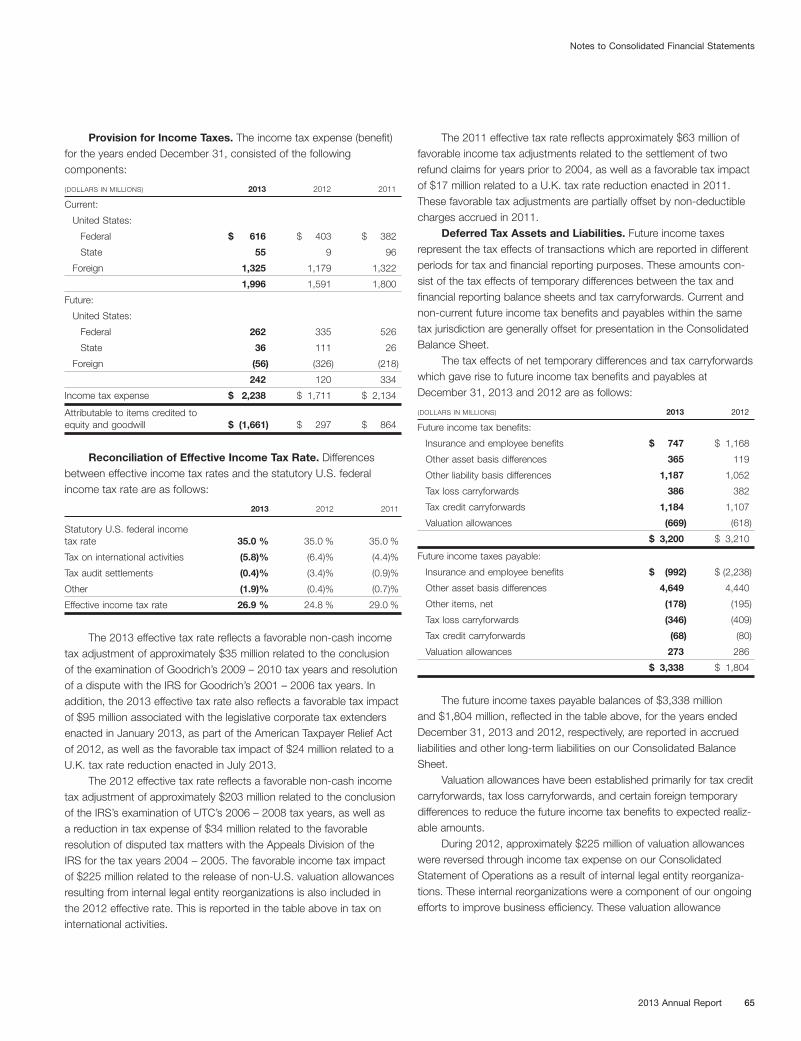
Provision for Income Taxes. The income tax expense (benefit)for the years ended December 31, consisted of the followingcomponents:
(DOLLARS IN MILLIONS) 2013 2012 2011
Current:
United States:
Federal $ 616 $ 403 $ 382
State 55 9 96
Foreign 1,325 1,179 1,322
1,996 1,591 1,800
Future:
United States:
Federal 262 335 526
State 36 111 26
Foreign (56) (326) (218)
242 120 334
Income tax expense $ 2,238 $ 1,711 $ 2,134
Attributable to items credited toequity and goodwill $ (1,661) $ 297 $ 864
Reconciliation of Effective Income Tax Rate. Differencesbetween effective income tax rates and the statutory U.S. federalincome tax rate are as follows:
2013 2012 2011
Statutory U.S. federal incometax rate 35.0 % 35.0 % 35.0 %
Tax on international activities (5.8)% (6.4)% (4.4)%
Tax audit settlements (0.4)% (3.4)% (0.9)%
Other (1.9)% (0.4)% (0.7)%
Effective income tax rate 26.9 % 24.8 % 29.0 %
The 2013 effective tax rate reflects a favorable non-cash incometax adjustment of approximately $35 million related to the conclusionof the examination of Goodrich’s 2009 – 2010 tax years and resolutionof a dispute with the IRS for Goodrich’s 2001 – 2006 tax years. Inaddition, the 2013 effective tax rate also reflects a favorable tax impactof $95 million associated with the legislative corporate tax extendersenacted in January 2013, as part of the American Taxpayer Relief Actof 2012, as well as the favorable tax impact of $24 million related to aU.K. tax rate reduction enacted in July 2013.
The 2012 effective tax rate reflects a favorable non-cash incometax adjustment of approximately $203 million related to the conclusionof the IRS’s examination of UTC’s 2006 – 2008 tax years, as well asa reduction in tax expense of $34 million related to the favorableresolution of disputed tax matters with the Appeals Division of theIRS for the tax years 2004 – 2005. The favorable income tax impactof $225 million related to the release of non-U.S. valuation allowancesresulting from internal legal entity reorganizations is also included inthe 2012 effective rate. This is reported in the table above in tax oninternational activities.
The 2011 effective tax rate reflects approximately $63 million offavorable income tax adjustments related to the settlement of tworefund claims for years prior to 2004, as well as a favorable tax impactof $17 million related to a U.K. tax rate reduction enacted in 2011.These favorable tax adjustments are partially offset by non-deductiblecharges accrued in 2011.
Deferred Tax Assets and Liabilities. Future income taxesrepresent the tax effects of transactions which are reported in differentperiods for tax and financial reporting purposes. These amounts con-sist of the tax effects of temporary differences between the tax andfinancial reporting balance sheets and tax carryforwards. Current andnon-current future income tax benefits and payables within the sametax jurisdiction are generally offset for presentation in the ConsolidatedBalance Sheet.
The tax effects of net temporary differences and tax carryforwardswhich gave rise to future income tax benefits and payables atDecember 31, 2013 and 2012 are as follows:
(DOLLARS IN MILLIONS) 2013 2012
Future income tax benefits:
Insurance and employee benefits $ 747 $ 1,168
Other asset basis differences 365 119
Other liability basis differences 1,187 1,052
Tax loss carryforwards 386 382
Tax credit carryforwards 1,184 1,107
Valuation allowances (669) (618)
$ 3,200 $ 3,210
Future income taxes payable:
Insurance and employee benefits $ (992) $ (2,238)
Other asset basis differences 4,649 4,440
Other items, net (178) (195)
Tax loss carryforwards (346) (409)
Tax credit carryforwards (68) (80)
Valuation allowances 273 286
$ 3,338 $ 1,804
The future income taxes payable balances of $3,338 millionand $1,804 million, reflected in the table above, for the years endedDecember 31, 2013 and 2012, respectively, are reported in accruedliabilities and other long-term liabilities on our Consolidated BalanceSheet.
Valuation allowances have been established primarily for tax creditcarryforwards, tax loss carryforwards, and certain foreign temporarydifferences to reduce the future income tax benefits to expected realiz-able amounts.
During 2012, approximately $225 million of valuation allowanceswere reversed through income tax expense on our ConsolidatedStatement of Operations as a result of internal legal entity reorganiza-tions. These internal reorganizations were a component of our ongoingefforts to improve business efficiency. These valuation allowance
Notes to Consolidated Financial Statements
2013 Annual Report 65

releases are included in the effective tax rate reconciliation tablewithin the tax on international activities component.
Tax Credit and Loss Carryforwards. At December 31, 2013,tax credit carryforwards, principally state and foreign, and tax losscarryforwards, principally state and foreign, were as follows:
(DOLLARS IN MILLIONS)Tax Credit
CarryforwardsTax Loss
Carryforwards
Expiration period:
2014-2018 $ 43 $ 536
2019-2023 16 315
2024-2033 311 794
Indefinite 881 2,245
Total $ 1,251 $ 3,890
Unrecognized Tax Benefits. At December 31, 2013, we hadgross tax-effected unrecognized tax benefits of $1,223 million, $1,163million of which, if recognized, would impact the effective tax rate. Thetable below includes both additional unrecognized tax benefits andrelated interest attributable to the acquisition of Goodrich in 2012. Areconciliation of the beginning and ending amounts of unrecognizedtax benefits and interest expense related to unrecognized tax benefitsfor the years ended December 31, 2013, 2012, and 2011 is as follows:
(DOLLARS IN MILLIONS) 2013 2012 2011
Balance at January 1 $ 1,073 $ 946 $ 891
Additions for tax positionsrelated to the current year 113 232 71
Additions for tax positions ofprior years 211 221 71
Reductions for tax positions ofprior years (41) (21) (24)
Settlements (133) (305) (63)
Balance at December 31 $ 1,223 $ 1,073 $ 946
Gross interest expense related tounrecognized tax benefits $ 51 $ 40 $ 23
Total accrued interest balance atDecember 31 $ 262 $ 270 $ 165
We conduct business globally and, as a result, UTC or one ormore of our subsidiaries files income tax returns in the U.S. federaljurisdiction and various state and foreign jurisdictions. In the normalcourse of business we are subject to examination by taxing authoritiesthroughout the world, including such major jurisdictions as Australia,Belgium, Canada, China, France, Germany, Hong Kong, Italy, Japan,South Korea, Singapore, Spain, the United Kingdom and the UnitedStates. With few exceptions, we are no longer subject to U.S.federal, state and local, or non-U.S. income tax examinations foryears before 2000.
During the second quarter, the Company recognized a settle-ment gain of approximately $34 million for interest relating to theclosure of IRS audits of UTC through 2005. This gain includes cash
and non-cash components in the amounts of approximately $10 millionand $24 million, respectively. UTC tax years 2006 through 2008 arecurrently before the Appeals Division of the IRS (IRS Appeals) for reso-lution discussions regarding certain proposed adjustments with whichUTC does not agree. Tax years 2009 and 2010 are under review by theExamination Division of the IRS. It is currently expected that both the2006 – 2008 appeals proceedings and the 2009 – 2010 examinationactivity may conclude during 2014. Examination activity for UTC taxyears 2011 and 2012 is expected to commence during 2014.
The Company has been engaged in litigation regarding theproper timing of certain deductions taken by Goodrich Corporation inits tax years 2001 and 2002, prior to its acquisition by UTC. Effectivesettlement was achieved with respect to this matter during the fourthquarter, resulting in recognition of a non-cash settlement gain ofapproximately $25 million, including $12 million of interest. TheCompany is also engaged in litigation with respect to a separateissue involving the proper timing of deductions taken by GoodrichCorporation in its tax years 2005 and 2006, prior to its acquisition byUTC. This is a recurring issue and it is expected that the IRS will con-tinue to challenge it in subsequent tax years until the issue is resolved.
During the second quarter, the IRS completed examination activityof Goodrich pre-acquisition tax years 2009 and 2010 and transferredthe case to IRS Appeals, resulting in a non-cash settlement gain ofapproximately $24 million, including $2 million of interest. GoodrichCorporation tax years 2007 through 2010 are currently before IRSAppeals for resolution discussions regarding certain proposed adjust-ments with which UTC does not agree, including the recurring timingissue described above. It is possible that both the 2005 – 2006 litiga-tion and the 2007 – 2010 appeals proceedings could be resolvedduring 2014. Examination activity for Goodrich Corporation tax years2011 and 2012, prior to its acquisition by UTC, is expected to com-mence during 2014.
During 2012, the IRS completed examination fieldwork for our2006 through 2008 tax years and issued its audit report. During 2012,we also reached final resolution with the Appeals Division of the IRS forour 2004 and 2005 tax years regarding certain proposed adjustmentswith which we did not agree. As a result of the above described eventswith respect to our 2004 – 2005 and 2006 – 2008 tax years, werecorded reductions in tax expense in 2012 in the aggregate amountof $237 million.
During 2011, we reached final resolution with the IRS on tworefund claims that had been pending with respect to pre-2004 taxyears and refunds were received in accordance with the resolutions.A reduction in tax expense in the amount of $63 million and pre-taxinterest income in the amount of $89 million was recognized during2011 associated with the resolution of these claims.
It is reasonably possible that a net reduction within a range of$215 million to $625 million of unrecognized tax benefits may occur
Notes to Consolidated Financial Statements
66 United Technologies Corporation

within the next twelve months as a result of additional worldwideuncertain tax positions, the revaluation of current uncertain tax posi-tions arising from developments in examinations, in appeals, or in thecourts, or the closure of tax statutes.
As previously disclosed, the French Tax Authority has assessede237 million (approximately $324 million) related to the proposed disal-lowance of certain deductions claimed in France for tax years 2008through 2011. This is a recurring issue and it is expected that similarchallenges will be raised in subsequent tax years until the issue isresolved. During the fourth quarter of 2013, the French Tax Authorityapproached the Company with an offer of proposed settlement andinvited the Company to participate in further negotiations. Based onthe settlement proposal made by the French Tax Authority, theCompany believes there is the potential to achieve resolution andaccordingly plans to participate in such further negotiations. As a resultof these developments, an accrual was made in the fourth quarterbased upon a settlement amount that UTC believes has potential toresult in resolution. This accrual is included in the December 31, 2013unrecognized tax benefit balance reflected above.
See Note 17, Contingent Liabilities, for discussion regardinguncertain tax positions which are not included in the range aboverelated to certain deductions claimed in Germany.
NOTE 12: EMPLOYEE BENEFIT PLANS
We sponsor numerous domestic and foreign employee benefit plans,which are discussed below.
Employee Savings Plans. We sponsor various employeesavings plans. Our contributions to employer sponsored definedcontribution plans were $335 million, $256 million and $218 millionfor 2013, 2012 and 2011, respectively.
Our non-union domestic employee savings plan uses anEmployee Stock Ownership Plan (ESOP) for employer matching contri-butions. External borrowings were used by the ESOP to fund a portionof its purchase of ESOP stock from us. The external borrowings havebeen extinguished and only re-amortized loans remain between UTCand the ESOP Trust. As ESOP debt service payments are made,common stock is released from an unreleased shares account. ESOPdebt may be prepaid or re-amortized to either increase or decrease thenumber of shares released so that the value of released shares equalsthe value of plan benefit. We may also, at our option, contribute addi-tional common stock or cash to the ESOP.
Shares of common stock are allocated to employees’ ESOPaccounts at fair value on the date earned. Cash dividends on commonstock held by the ESOP are used for debt service payments. Partici-pants receive additional shares in lieu of cash dividends. Commonstock allocated to ESOP participants is included in the average numberof common shares outstanding for both basic and diluted earnings pershare. At December 31, 2013, 30.6 million common shares had beenallocated to employees, leaving 15.5 million unallocated commonshares in the ESOP Trust, with an approximate fair value of $1.8 billion.
Pension Plans. We sponsor both funded and unfunded domes-tic and foreign defined benefit pension plans that cover a large numberof our employees. Our plans use a December 31 measurement dateconsistent with our fiscal year.
(DOLLARS IN MILLIONS) 2013 2012
Change in Benefit Obligation:
Beginning balance $ 35,708 $ 27,167
Service cost 569 500
Interest cost 1,373 1,331
Actuarial (gain) loss (3,027) 2,855
Total benefits paid (1,601) (1,357)
Net settlement and curtailment gain (53) (90)
Plan amendments 224 (195)
Business combinations – 5,235
Other (167) 262
Ending balance $ 33,026 $ 35,708
Change in Plan Assets:
Beginning balance $ 29,928 $ 23,542
Actual return on plan assets 3,019 3,306
Employer contributions 236 516
Benefits paid from plan assets (1,601) (1,357)
Business combinations – 3,800
Other (227) 121
Ending balance $ 31,355 $ 29,928
Funded Status:
Fair value of plan assets $ 31,355 $ 29,928
Benefit obligations (33,026) (35,708)
Funded status of plan $ (1,671) $ (5,780)
Amounts Recognized in the ConsolidatedBalance Sheet Consist of:
Noncurrent assets $ 768 $ 643
Current liability (74) (105)
Noncurrent liability (2,365) (6,318)
Net amount recognized $ (1,671) $ (5,780)
Amounts Recognized in Accumulated OtherComprehensive Loss Consist of:
Net actuarial loss $ 5,261 $ 10,215
Prior service credit (37) (322)
Net amount recognized $ 5,224 $ 9,893
The amounts included in “Other” in the preceding table reflect theimpact of foreign exchange translation, primarily for plans in the U.K.and Canada, and the impact of settlements.
As part of the Goodrich acquisition on July 26, 2012, weassumed approximately $5.2 billion of pension projected benefitobligations and $3.8 billion of plan assets.
Notes to Consolidated Financial Statements
2013 Annual Report 67
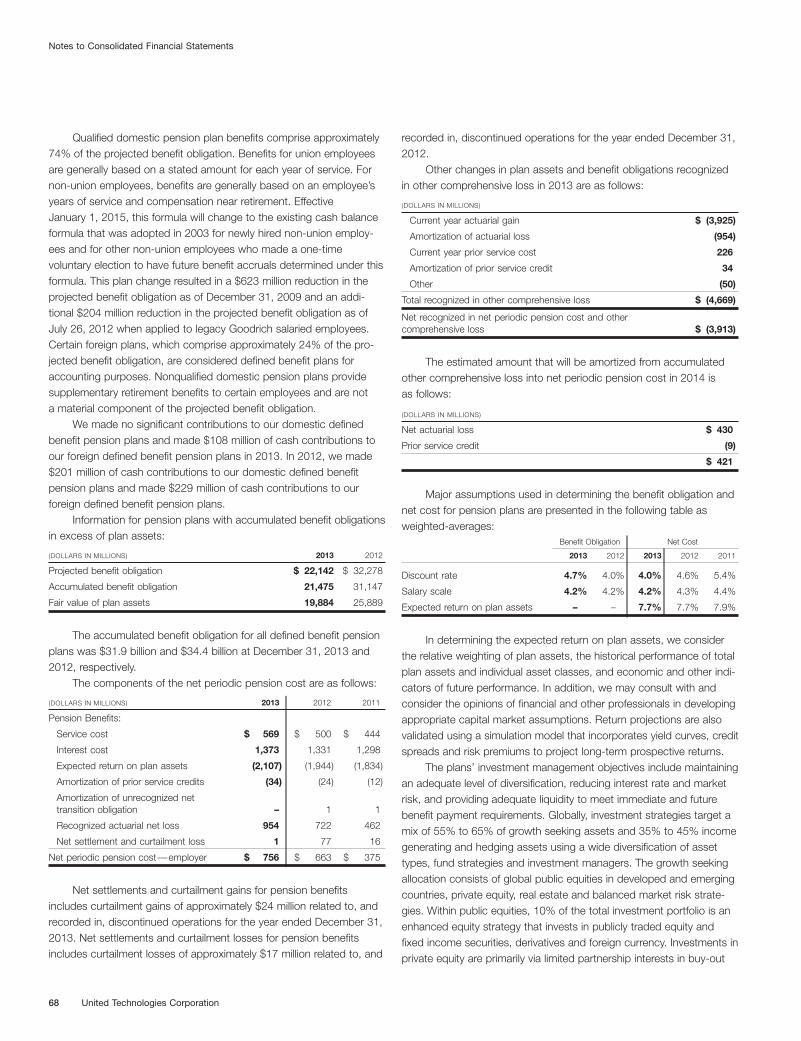
Qualified domestic pension plan benefits comprise approximately74% of the projected benefit obligation. Benefits for union employeesare generally based on a stated amount for each year of service. Fornon-union employees, benefits are generally based on an employee’syears of service and compensation near retirement. EffectiveJanuary 1, 2015, this formula will change to the existing cash balanceformula that was adopted in 2003 for newly hired non-union employ-ees and for other non-union employees who made a one-timevoluntary election to have future benefit accruals determined under thisformula. This plan change resulted in a $623 million reduction in theprojected benefit obligation as of December 31, 2009 and an addi-tional $204 million reduction in the projected benefit obligation as ofJuly 26, 2012 when applied to legacy Goodrich salaried employees.Certain foreign plans, which comprise approximately 24% of the pro-jected benefit obligation, are considered defined benefit plans foraccounting purposes. Nonqualified domestic pension plans providesupplementary retirement benefits to certain employees and are nota material component of the projected benefit obligation.
We made no significant contributions to our domestic definedbenefit pension plans and made $108 million of cash contributions toour foreign defined benefit pension plans in 2013. In 2012, we made$201 million of cash contributions to our domestic defined benefitpension plans and made $229 million of cash contributions to ourforeign defined benefit pension plans.
Information for pension plans with accumulated benefit obligationsin excess of plan assets:
(DOLLARS IN MILLIONS) 2013 2012
Projected benefit obligation $ 22,142 $ 32,278
Accumulated benefit obligation 21,475 31,147
Fair value of plan assets 19,884 25,889
The accumulated benefit obligation for all defined benefit pensionplans was $31.9 billion and $34.4 billion at December 31, 2013 and2012, respectively.
The components of the net periodic pension cost are as follows:
(DOLLARS IN MILLIONS) 2013 2012 2011
Pension Benefits:
Service cost $ 569 $ 500 $ 444
Interest cost 1,373 1,331 1,298
Expected return on plan assets (2,107) (1,944) (1,834)
Amortization of prior service credits (34) (24) (12)
Amortization of unrecognized nettransition obligation – 1 1
Recognized actuarial net loss 954 722 462
Net settlement and curtailment loss 1 77 16
Net periodic pension cost—employer $ 756 $ 663 $ 375
Net settlements and curtailment gains for pension benefitsincludes curtailment gains of approximately $24 million related to, andrecorded in, discontinued operations for the year ended December 31,2013. Net settlements and curtailment losses for pension benefitsincludes curtailment losses of approximately $17 million related to, and
recorded in, discontinued operations for the year ended December 31,2012.
Other changes in plan assets and benefit obligations recognizedin other comprehensive loss in 2013 are as follows:
(DOLLARS IN MILLIONS)
Current year actuarial gain $ (3,925)
Amortization of actuarial loss (954)
Current year prior service cost 226
Amortization of prior service credit 34
Other (50)
Total recognized in other comprehensive loss $ (4,669)
Net recognized in net periodic pension cost and othercomprehensive loss $ (3,913)
The estimated amount that will be amortized from accumulatedother comprehensive loss into net periodic pension cost in 2014 isas follows:
(DOLLARS IN MILLIONS)
Net actuarial loss $ 430
Prior service credit (9)
$ 421
Major assumptions used in determining the benefit obligation andnet cost for pension plans are presented in the following table asweighted-averages:
Benefit Obligation Net Cost
2013 2012 2013 2012 2011
Discount rate 4.7% 4.0% 4.0% 4.6% 5.4%
Salary scale 4.2% 4.2% 4.2% 4.3% 4.4%
Expected return on plan assets – – 7.7% 7.7% 7.9%
In determining the expected return on plan assets, we considerthe relative weighting of plan assets, the historical performance of totalplan assets and individual asset classes, and economic and other indi-cators of future performance. In addition, we may consult with andconsider the opinions of financial and other professionals in developingappropriate capital market assumptions. Return projections are alsovalidated using a simulation model that incorporates yield curves, creditspreads and risk premiums to project long-term prospective returns.
The plans’ investment management objectives include maintainingan adequate level of diversification, reducing interest rate and marketrisk, and providing adequate liquidity to meet immediate and futurebenefit payment requirements. Globally, investment strategies target amix of 55% to 65% of growth seeking assets and 35% to 45% incomegenerating and hedging assets using a wide diversification of assettypes, fund strategies and investment managers. The growth seekingallocation consists of global public equities in developed and emergingcountries, private equity, real estate and balanced market risk strate-gies. Within public equities, 10% of the total investment portfolio is anenhanced equity strategy that invests in publicly traded equity andfixed income securities, derivatives and foreign currency. Investments inprivate equity are primarily via limited partnership interests in buy-out
Notes to Consolidated Financial Statements
68 United Technologies Corporation

strategies with smaller allocations to distressed debt funds. The realestate strategy is principally concentrated in directly held U.S. coreinvestments with some smaller investments in international, value-added and opportunistic strategies. Within the income generatingassets, the fixed income portfolio consists of mainly governmentand broadly diversified high quality corporate bonds.
The plans have continued their pension risk managementtechniques designed to reduce the plan’s interest rate risk. More
specifically, the plans have incorporated liability hedging programs thatinclude the adoption of a risk reduction objective as part of the long-term investment strategy. Under this objective the interest rate hedgeis dynamically increased as funded status improves. The hedging pro-grams incorporate a range of assets and investment tools, each withranging interest rate sensitivity. The investment portfolios are currentlyhedging approximately 40% to 50% of the interest rate sensitivity ofthe pension plan liabilities.
The fair values of pension plan assets at December 31, 2013 and 2012 by asset category are as follows:
(DOLLARS IN MILLIONS)
Quoted Prices inActive Markets
For Identical Assets(Level 1)
SignificantObservable Inputs
(Level 2)
SignificantUnobservable
Inputs(Level 3) Total
Asset Category:
Public Equities
Global Equities $ 6,840 $ 1 $ – $ 6,841
Global Equity Commingled Funds 1 – 4,881 – 4,881
Enhanced Global Equities 2 261 2,241 500 3,002
Private Equities 3 – – 1,339 1,339
Fixed Income Securities
Governments 424 1,307 – 1,731
Corporate Bonds – 8,461 296 8,757
Structured Products 4 – 80 – 80
Real Estate 5 – 13 1,800 1,813
Other 6 – 2,110 – 2,110
Cash & Cash Equivalents 7 2 207 – 209
Subtotal $ 7,527 $ 19,301 $ 3,935 $ 30,763
Other Assets & Liabilities 8 592
Total at December 31, 2013 $ 31,355
Public Equities
Global Equities $ 6,413 $ – $ – $ 6,413
Global Equity Commingled Funds 1 – 4,114 – 4,114
Enhanced Global Equities 2 169 1,959 447 2,575
Private Equities 3 – – 1,202 1,202
Fixed Income Securities
Governments 1,003 1,421 – 2,424
Corporate Bonds – 7,699 276 7,975
Structured Products 4 – 21 – 21
Real Estate 5 – 19 1,785 1,804
Other 6 – 2,182 – 2,182
Cash & Cash Equivalents 7 1 364 – 365
Subtotal $ 7,586 $ 17,779 $ 3,710 $ 29,075
Other Assets & Liabilities 8 853
Total at December 31, 2012 $ 29,928
Note 1 Represents commingled funds that invest primarily in common stocks.
Note 2 Represents enhanced equity separate account and commingled fund portfolios. A portion of the portfolio may include long-short market neutral and relativevalue strategies that invest in publicly traded, equity and fixed income securities, as well as derivatives of equity and fixed income securities and foreigncurrency.
Note 3 Represents limited partner investments with general partners that primarily invest in debt and equity.
Note 4 Represents mortgage and asset-backed securities.
Note 5 Represents investments in real estate including commingled funds and directly held properties.
Note 6 Represents insurance contracts and global balanced risk commingled funds consisting mainly of equity, bonds and some commodities.
Note 7 Represents short-term commercial paper, bonds and other cash or cash-like instruments.
Note 8 Represents trust receivables and payables that are not leveled.
Notes to Consolidated Financial Statements
2013 Annual Report 69

Derivatives in the plan are primarily used to manage risk andgain asset class exposure while still maintaining liquidity. Derivativeinstruments mainly consist of equity futures, interest rate futures,interest rate swaps and currency forward contracts.
Our common stock represents approximately 3% of total planassets at December 31, 2013 and 2012. We review our assets atleast quarterly to ensure we are within the targeted asset allocation
ranges and, if necessary, asset balances are adjusted back withintarget allocations. We employ a broadly diversified investment managerstructure that includes diversification by active and passive manage-ment, style, capitalization, country, sector, industry and number ofinvestment managers.
The fair value measurement of plan assets using significantunobservable inputs (Level 3) changed due to the following:
(DOLLARS IN MILLIONS)
EnhancedGlobal
EquitiesPrivate
EquitiesCorporate
BondsReal
Estate Total
Balance, December 31, 2011 $ 239 $ 1,159 $ 110 $ 1,364 $ 2,872
Plan assets acquired 63 – – 79 142
Realized gains 1 174 3 6 184
Unrealized (losses) gains relating to instruments still held in the reporting period 31 (14) 51 115 183
Purchases, sales, and settlements, net 113 (117) 112 221 329
Balance, December 31, 2012 447 1,202 276 1,785 3,710
Realized gains – 195 – 20 215
Unrealized (losses) gains relating to instruments still held in the reporting period 50 (9) 2 102 145
Purchases, sales, and settlements, net 3 (49) 18 (107) (135)
Balance, December 31, 2013 $ 500 $ 1,339 $ 296 $ 1,800 $ 3,935
Quoted market prices are used to value investments when avail-able. Investments in securities traded on exchanges, including listedfutures and options, are valued at the last reported sale prices on thelast business day of the year or, if not available, the last reported bidprices. Fixed income securities are primarily measured using a marketapproach pricing methodology, where observable prices are obtainedby market transactions involving identical or comparable securities ofissuers with similar credit ratings. Mortgages have been valued on thebasis of their future principal and interest payments discounted at pre-vailing interest rates for similar investments. Investment contracts arevalued at fair value by discounting the related cash flows based oncurrent yields of similar instruments with comparable durations. Realestate investments are valued on a quarterly basis using discountedcash flow models which consider long-term lease estimates, futurerental receipts and estimated residual values. Valuation estimates aresupplemented by third-party appraisals on an annual basis.
Private equity limited partnerships are valued quarterly using dis-counted cash flows, earnings multiples and market multiples. Valuationadjustments reflect changes in operating results, financial condition,or prospects of the applicable portfolio company. Over-the-countersecurities and government obligations are valued at the bid prices orthe average of the bid and ask prices on the last business day of the
year from published sources or, if not available, from other sourcesconsidered reliable, generally broker quotes. Temporary cash invest-ments are stated at cost, which approximates fair value.
ESTIMATED FUTURE CONTRIBUTIONS AND BENEFIT PAYMENTS
We expect to make contributions of approximately $275 million to ourforeign defined benefit pension plans in 2014. Although we are notrequired to make contributions to our domestic defined benefit pensionplans through the end of 2016, we may elect to make discretionarycontributions in 2014. Contributions do not reflect benefits to be paiddirectly from corporate assets.
Benefit payments, including amounts to be paid from corporateassets, and reflecting expected future service, as appropriate, areexpected to be paid as follows: $1,710 million in 2014, $1,732 millionin 2015, $1,802 million in 2016, $1,886 million in 2017, $1,966 millionin 2018, and $10,834 million from 2019 through 2023.
Postretirement Benefit Plans. We sponsor a number ofpostretirement benefit plans that provide health and life benefits toeligible retirees. Such benefits are provided primarily from domesticplans, which comprise approximately 89% of the benefit obligation.The postretirement plans are unfunded.
Notes to Consolidated Financial Statements
70 United Technologies Corporation

(DOLLARS IN MILLIONS) 2013 2012
Change in Benefit Obligation:
Beginning balance $ 1,106 $ 784
Service cost 3 3
Interest cost 38 37
Actuarial (gain) loss (62) 45
Total benefits paid (119) (107)
Business combinations – 328
Other 21 16
Ending balance $ 987 $ 1,106
Change in Plan Assets:
Beginning balance $ – $ –
Actual return on plan assets – –
Employer contributions 95 85
Benefits paid from plan assets (119) (107)
Other 24 22
Ending balance $ – $ –
Funded Status:
Fair value of plan assets $ – $ –
Benefit obligations (987) (1,106)
Funded status of plan $ (987) $ (1,106)
Amounts Recognized in the Consolidated BalanceSheet Consist of:
Current liability $ (86) $ (91)
Noncurrent liability (901) (1,015)
Net amount recognized $ (987) $ (1,106)
Amounts Recognized in Accumulated OtherComprehensive Loss Consist of:
Net actuarial gain $ (124) $ (65)
Prior service credit (1) (11)
Net amount recognized $ (125) $ (76)
As part of our acquisition of Goodrich on July 26, 2012, weassumed approximately $328 million of postretirement projectedbenefit obligations.
We modified the postretirement medical benefits provided tolegacy Goodrich salaried employees by eliminating any company sub-sidy for retirements that occur after January 31, 2014. This resultedin a $16 million reduction in the projected benefit obligation as ofJuly 26, 2012.
The components of net periodic benefit cost are as follows:
(DOLLARS IN MILLIONS) 2013 2012 2011
Other Postretirement Benefits:
Service cost $ 3 $ 3 $ 3
Interest cost 38 37 39
Expected return on plan assets – – (1)
Amortization of prior service credit (10) (4) (2)
Recognized actuarial net gain (4) (6) (8)
Net settlement and curtailment gain – (2) (8)
Net periodic other postretirement benefitcost $ 27 $ 28 $ 23
Other changes in plan assets and benefit obligations recognizedin other comprehensive loss in 2013 are as follows:
(DOLLARS IN MILLIONS)
Current year actuarial gain $ (62)
Current year prior service credit (1)
Amortization of prior service credit 10
Amortization of actuarial net gain 4
Net settlements and curtailments –
Total recognized in other comprehensive loss $ (49)
Net recognized in net periodic other postretirement benefit cost andother comprehensive loss $ 22
The estimated amounts that will be amortized from accumulatedother comprehensive loss into net periodic benefit cost in 2014 includeactuarial net gains of $3 million and prior service credit of $1 million.
Major assumptions used in determining the benefit obligation andnet cost for postretirement plans are presented in the following table asweighted-averages:
Benefit Obligation Net Cost
2013 2012 2013 2012 2011
Discount rate 4.4% 3.6% 3.6% 4.2% 4.9%
Expected return on plan assets – – – – 5.0%
Assumed health care cost trend rates are as follows:
2013 2012
Health care cost trend rate assumed for next year 7.5% 8.0%
Rate that the cost trend rate gradually declines to 5.0% 5.0%
Year that the rate reaches the rate it is assumed toremain at 2019 2019
Assumed health care cost trend rates have a significant effect onthe amounts reported for the health care plans. A one-percentage-point change in assumed health care cost trend rates would have thefollowing effects:
2013 One-Percentage-Point
(DOLLARS IN MILLIONS) Increase Decrease
Effect on total service and interest cost $ 3 $ (2)
Effect on postretirement benefit obligation 69 (59)
ESTIMATED FUTURE BENEFIT PAYMENTS
Benefit payments, including net amounts to be paid from corporateassets and reflecting expected future service, as appropriate, areexpected to be paid as follows: $86 million in 2014, $83 million in2015, $80 million in 2016, $74 million in 2017, $68 million in 2018,and $283 million from 2019 through 2023.
Multiemployer Benefit Plans. We contribute to various domes-tic and foreign multiemployer defined benefit pension plans. The risksof participating in these multiemployer plans are different from single-employer plans in that assets contributed are pooled and may be usedto provide benefits to employees of other participating employers. If aparticipating employer stops contributing to the plan, the unfunded
Notes to Consolidated Financial Statements
2013 Annual Report 71

obligations of the plan may be borne by the remaining participatingemployers. Lastly, if we choose to stop participating in some ofour multiemployer plans, we may be required to pay those plansa withdrawal liability based on the underfunded status of the plan.
Our participation in these plans for the annual periods endedDecember 31 is outlined in the table below. Unless otherwise noted,the most recent Pension Protection Act (PPA) zone status available
in 2013 and 2012 is for the plan’s year-end at June 30, 2012, andJune 30, 2011, respectively. The zone status is based on informationthat we received from the plan and is certified by the plan’s actuary.Our significant plan is in the green zone which represents at least80 percent funded and does not require a financial improvementplan (FIP) or a rehabilitation plan (RP).
(DOLLARS IN MILLIONS)
PensionProtection ActZone Status
FIP/RP Status Contributions
Pension FundEIN/Pension
Plan Number 2013 2012Pending/
Implemented 2013 2012 2011Surcharge
Imposed
Expiration Date ofCollective-Bargaining
Agreement
National Elevator Industry Pension Plan 23-2694291 Green Green No $ 71 $ 63 $ 56 No July 8, 2017
Other funds 34 36 38
$ 105 $ 99 $ 94
For the plan years ended June 30, 2012 and 2011, respectively,we were listed in the National Elevator Industry Pension Plan’s Forms5500 as providing more than 5% of the total contributions for the plan.At the date these financial statements were issued, Forms 5500 werenot available for the plan year ending June 30, 2013.
In addition, we participate in several multiemployer arrangementsthat provide postretirement benefits other than pensions, with theNational Elevator Industry Health Benefit Plan being the most signifi-cant. These arrangements generally provide medical and life benefitsfor eligible active employees and retirees and their dependents.Contributions to multiemployer plans that provide postretirement ben-efits other than pensions were $12 million, $11 million and $10 millionfor 2013, 2012 and 2011, respectively.
Stock-based Compensation. UTC’s long-term incentive planauthorizes various types of market and performance based incentiveawards that may be granted to officers and employees. Our Long-TermIncentive Plan (LTIP) was initially approved on April 13, 2005 andamended in 2011 to increase the maximum number of shares availablefor award under the LTIP to 119 million shares. All equity-basedcompensation awards are made exclusively through the LTIP. As ofDecember 31, 2013, approximately 32 million shares remain availablefor awards under the LTIP. The LTIP does not contain an aggregateannual award limit. We expect that the shares awarded on an annualbasis will range from 1% to 1.5% of shares outstanding. The LTIP willexpire after all shares have been awarded or April 30, 2017, whicheveris sooner.
Under the LTIP and predecessor long-term incentive plans, theexercise price of awards is set on the grant date and may not be lessthan the fair market value per share on that date. Generally, stockappreciation rights and stock options have a term of ten years and aminimum three-year vesting period. In the event of retirement, awardsheld for more than one year may become vested and exercisable sub-ject to certain terms and conditions. LTIP awards with performance-based vesting generally have a minimum three-year vesting period and
vest based on performance against pre-established metrics. In theevent of retirement, vesting for awards held more than one year doesnot accelerate but will vest as scheduled based on actual performancerelative to target metrics. We have historically repurchased shares ofour common stock in an amount at least equal to the number ofshares issued under our equity compensation arrangements and willcontinue to evaluate this policy in conjunction with our overall sharerepurchase program.
We measure the cost of all share-based payments, includingstock options, at fair value on the grant date and recognize this cost inthe statement of operations. For the years ended December 31, 2013,2012 and 2011, $275 million, $210 million and $221 million, respec-tively, of compensation cost was recognized in operating results. Theassociated future income tax benefit recognized was $97 million,$76 million and $75 million for the years ended December 31, 2013,2012 and 2011, respectively.
For the years ended December 31, 2013, 2012 and 2011, theamount of cash received from the exercise of stock options was $378million, $381 million and $226 million, respectively, with an associatedtax benefit realized of $194 million, $111 million and $101 million,respectively. In addition, for the years ended December 31, 2013,2012 and 2011, the associated tax benefit realized from the vesting ofperformance share units was $26 million, $15 million and $19 million,respectively. Also, in accordance with the Compensation—StockCompensation Topic of the FASB ASC, for the years endedDecember 31, 2013, 2012 and 2011, $115 million, $67 millionand $81 million, respectively, of certain tax benefits have been reportedas operating cash outflows with corresponding cash inflows fromfinancing activities.
At December 31, 2013, there was $185 million of total unrecog-nized compensation cost related to non-vested equity awards grantedunder long-term incentive plans. This cost is expected to be recog-nized ratably over a weighted-average period of 1.9 years.
Notes to Consolidated Financial Statements
72 United Technologies Corporation

A summary of the transactions under all long-term incentive plans for the year ended December 31, 2013 follows:
Stock Options Stock Appreciation Rights Performance Share Units
(SHARES AND UNITS IN THOUSANDS) SharesAverage
Price* SharesAverage
Price* UnitsAverage
Price**
OtherIncentive
Shares / Units
Outstanding at:
December 31, 2012 13,806 $ 52.45 38,421 $ 68.70 2,791 $ 74.77 1,284
Granted 309 87.46 6,719 86.87 942 84.03 543
Exercised/earned (7,840) 49.40 (5,747) 63.19 (886) 71.80 (233)
Cancelled (36) 75.04 (1,178) 81.31 (146) 78.63 (116)
December 31, 2013 6,239 $ 57.88 38,215 $ 72.33 2,701 $ 78.77 1,478
* weighted-average exercise price
** weighted-average grant stock price
The weighted-average grant date fair value of stock options andstock appreciation rights granted during 2013, 2012 and 2011 was$19.91, $19.32 and $20.26, respectively. The weighted-average grantdate fair value of performance share units, which vest upon achievingcertain performance metrics, granted during 2013, 2012, and 2011was $91.71, $82.15 and $87.65, respectively. The total fair value ofawards vested during the years ended December 31, 2013, 2012 and2011 was $219 million, $187 million and $170 million, respectively.The total intrinsic value (which is the amount by which the stock priceexceeded the exercise price on the date of exercise) of stock options
and stock appreciation rights exercised during the years endedDecember 31, 2013, 2012 and 2011 was $608 million, $370 millionand $336 million, respectively. The total intrinsic value (which is thestock price at vesting) of performance share units vested was $75 mil-lion, $46 million and $59 million during the years ended December 31,2013, 2012 and 2011, respectively.
The following table summarizes information about equity awardsoutstanding that are vested and expected to vest and equity awardsoutstanding that are exercisable at December 31, 2013:
Equity Awards Vested and Expected to Vest Equity Awards That Are Exercisable
(SHARES IN THOUSANDS; AGGREGATE INTRINSIC VALUE IN MILLIONS) AwardsAverage
Price*
AggregateIntrinsic
ValueRemaining
Term** AwardsAverage
Price*
AggregateIntrinsic
ValueRemaining
Term**
Stock Options/Stock Appreciation Rights 43,979 $ 69.70 $ 1,939 5.5 27,656 $ 63.44 $ 1,393 3.9
Performance Share Units/Restricted Stock 3,722 – 424 1.1
* weighted-average exercise price per share
** weighted-average contractual remaining term in years
The fair value of each option award is estimated on the dateof grant using a binomial lattice model. The following table indicatesthe assumptions used in estimating fair value for the years endedDecember 31, 2013, 2012 and 2011. Lattice-based option modelsincorporate ranges of assumptions for inputs, those ranges areas follows:
2013 2012 2011
Expected volatility 26% – 27% 30% – 35% 26% – 32%
Weighted-average volatility 27% 30% 26%
Expected term (in years) 7.3 – 7.6 7.4 – 7.7 7.5 – 8.0
Expected dividends 2.6% 2.3% 2.4%
Risk-free rate 0.1% – 1.9% 0.0% – 2.0% 0.1% – 3.5%
Expected volatilities are based on the returns of our stock, includ-ing implied volatilities from traded options on our stock for the binomiallattice model. We use historical data to estimate equity award exerciseand employee termination behavior within the valuation model. Sepa-rate employee groups and equity award characteristics are consideredseparately for valuation purposes. The expected term represents an
estimate of the period of time equity awards are expected to remainoutstanding. The risk-free rate is based on the term structure ofinterest rates at the time of equity award grant.
NOTE 13: RESTRUCTURING COSTS
During 2013, we recorded net pre-tax restructuring costs totaling$479 million for new and ongoing restructuring actions. We recordedcharges in the segments as follows:
(DOLLARS IN MILLIONS)
Otis $ 88
UTC Climate, Controls & Security 97
Pratt & Whitney 154
UTC Aerospace Systems 92
Sikorsky 50
Eliminations and other –
Restructuring costs recorded within continuing operations 481
Restructuring costs recorded within discontinued operations (2)
Total $ 479
Notes to Consolidated Financial Statements
2013 Annual Report 73

Restructuring charges incurred in 2013 primarily relate to actionsinitiated during 2013 and 2012, and were recorded as follows:
(DOLLARS IN MILLIONS)
Cost of sales $ 215
Selling, general and administrative 265
Other income, net 1
Restructuring costs recorded within continuing operations 481
Restructuring costs recorded within discontinued operations (2)
Total $ 479
2013 Actions. During 2013, we initiated restructuring actionsrelating to ongoing cost reduction efforts, including workforcereductions and consolidation of manufacturing operations. Werecorded net pre-tax restructuring costs totaling $421 million forrestructuring actions initiated in 2013, consisting of $164 million incost of sales and $257 million in selling, general and administrativeexpenses.
We are targeting to complete in 2014 the majority of the remain-ing workforce and all facility related cost reduction actions initiated in2013. No specific plans for significant other actions have been finalizedat this time. The following table summarizes the accrual balances andutilization by cost type for the 2013 restructuring actions:
(DOLLARS IN MILLIONS) Severance
AssetWrite-
Downs
Facility Exit,Lease
Termination& Other
Costs Total
Net pre-tax restructuring costs $ 381 $ 15 $ 25 $ 421
Utilization and foreign exchange (185) (15) (6) (206)
Balance at December 31, 2013 $ 196 $ – $ 19 $ 215
The following table summarizes expected, incurred and remainingcosts for the 2013 restructuring actions by segment:
(DOLLARS IN MILLIONS)Expected
Costs
CostIncurred
During2013
RemainingCosts at
December 31,2013
Otis $ 75 $ (69) $ 6
UTC Climate, Controls & Security 124 (89) 35
Pratt & Whitney 158 (154) 4
UTC Aerospace Systems 85 (71) 14
Sikorsky 38 (38) –
Eliminations and other – – –
Discontinued operations – – –
Total $ 480 $ (421) $ 59
2012 Actions. During 2013, we recorded net pre-tax restructur-ing costs totaling $60 million for restructuring actions initiated in 2012,consisting of $46 million in cost of sales, $13 million in selling, generaland administrative expenses, and $1 million in other income, net.
The 2012 actions relate to ongoing cost reduction efforts, includingworkforce reductions and the consolidation of field operations.
The following table summarizes the restructuring accrual balancesand utilization by cost type for the 2012 programs:
(DOLLARS IN MILLIONS) Severance
AssetWrite-
Downs
Facility Exit,Lease
Terminationand Other
Costs Total
Restructuring accruals at January 1, 2013 $ 289 $ – $ 50 $ 339
Net pre-tax restructuring costs 14 1 45 60
Utilization and foreign exchange (218) (1) (47) (266)
Balance at December 31, 2013 $ 85 $ – $ 48 $ 133
The following table summarizes expected, incurred and remainingcosts for the 2012 programs by segment:
(DOLLARS IN MILLIONS)Expected
Costs
CostsIncurred
During2012
CostsIncurred
During2013
RemainingCosts at
December 31,2013
Otis $ 156 $ (146) $ (9) $ 1
UTC Climate, Controls & Security 147 (123) (18) 6
Pratt & Whitney 94 (94) – –
UTC Aerospace Systems 157 (121) (21) 15
Sikorsky 62 (47) (12) 3
Eliminations and other 19 (19) – –
Discontinued operations 26 (26) – –
Total $ 661 $ (576) $ (60) $ 25
2011 Actions. During 2013, we recorded net pre-tax restructur-ing costs totaling $(2) million for restructuring actions initiated in 2011.As of December 31, 2013, there are no remaining costs to completethe 2011 actions.
NOTE 14: FINANCIAL INSTRUMENTS
We enter into derivative instruments for risk management purposesonly, including derivatives designated as hedging instruments underthe Derivatives and Hedging Topic of the FASB ASC and those utilizedas economic hedges. We operate internationally and, in the normalcourse of business, are exposed to fluctuations in interest rates, foreignexchange rates and commodity prices. These fluctuations can increasethe costs of financing, investing and operating the business. We haveused derivative instruments, including swaps, forward contracts andoptions to manage certain foreign currency, interest rate and commod-ity price exposures.
The four quarter rolling average of the notional amount of foreignexchange contracts hedging foreign currency transactions was $12.3billion and $11.8 billion at December 31, 2013 and 2012, respectively.Additional information pertaining to foreign exchange and hedgingactivities is included in Note 1.
Notes to Consolidated Financial Statements
74 United Technologies Corporation

The following table summarizes the fair value of derivative instru-ments as of December 31, 2013 and 2012 which consist solely offoreign exchange contracts:
Asset Derivatives Liability Derivatives
(DOLLARS IN MILLIONS) 2013 2012 2013 2012
Derivatives designated ashedging instruments $ 59 $ 78 $ 103 $ 11
Derivatives not designated ashedging instruments 31 50 54 138
The impact from foreign exchange derivative instruments thatqualified as cash flow hedges for the period was as follows:
December 31,
(DOLLARS IN MILLIONS) 2013 2012
(Loss) gain recorded in Accumulated othercomprehensive loss $ (136) $ 88
(Loss) gain reclassified from Accumulated othercomprehensive loss into Product sales (effective portion) (25) 31
Assuming current market conditions continue, a $35 millionpre-tax loss is expected to be reclassified from Accumulated othercomprehensive loss into Product sales to reflect the fixed pricesobtained from foreign exchange hedging within the next 12 months.At December 31, 2013, all derivative contracts accounted for ascash flow hedges mature by December 2015.
We recognized a gain of $22 million and a loss of $120 million inOther income, net on the Consolidated Statement of Operations fromforeign exchange contracts not designated as hedging instruments in2013 and 2012, respectively.
NOTE 15: FAIR VALUE MEASUREMENTS
The FASB ASC Topic “Fair Value Measurements and Disclosure”establishes a valuation hierarchy for disclosure of the inputs to thevaluations used to measure fair value. A financial asset or liability’sclassification within the hierarchy is determined based on the lowestlevel input that is significant to the fair value measurement. Thishierarchy prioritizes the inputs into three broad levels as follows:
• Level 1 – quoted prices in active markets for identical assets orliabilities;
• Level 2 – inputs other than quoted prices included within Level 1 thatare observable for the asset or liability either directly or indirectly;
• Level 3 – unobservable inputs based on our own assumptions usedto measure assets and liabilities at fair value.
The following table provides the assets and liabilities carriedat fair value measured on a recurring and nonrecurring basis as ofDecember 31, 2013 and 2012:
2013 (DOLLARS IN MILLIONS) Total Level 1 Level 2 Level 3
Recurring fair valuemeasurements:
Available-for-salesecurities $ 988 $ 988 $ – $ –
Derivative assets 90 – 90 –
Derivative liabilities (157) – (157) –
Nonrecurring fairvalue measurements:
Business dispositions 66 – 66 –
2012 (DOLLARS IN MILLIONS) Total Level 1 Level 2 Level 3
Recurring fair valuemeasurements:
Available-for-salesecurities $ 781 $ 781 $ – $ –
Derivative assets 128 – 128 –
Derivative liabilities (149) – (149) –
Nonrecurring fairvalue measurements:
Equity methodinvestments 432 – 432 –
Business dispositions 84 – 84 –
During 2013, we recorded an approximately $55 million netgain from UTC Climate, Controls & Security’s portfolio transformation,primarily due to a gain on the sale of businesses in Hong Kong andAustralia. In addition, we recorded an approximately $193 million gainfrom the sale of Pratt & Whitney Power Systems business (see Note 2),as well as an approximately $25 million charge to adjust the fair valueof a Pratt & Whitney joint venture investment.
During 2012, we recorded net gains on nonrecurring fair valuemeasurements of approximately $157 million within Other income,net from UTC Climate, Controls & Security’s portfolio transformationefforts including the integration of the legacy UTC Fire & Security busi-nesses with the legacy Carrier businesses. These net gains includeapproximately $357 million from the sales of controlling interests inmanufacturing and distribution joint ventures in Asia and Canada, ofwhich approximately $272 million was non-cash. These gains werepartially offset by $168 million of other-than-temporary impairmentcharges related to business dispositions and a $32 million loss on
Notes to Consolidated Financial Statements
2013 Annual Report 75

the disposition of the U.S. UTC Fire & Security branch operations.In addition, we recorded a $34 million gain on the fair marketmeasurement of the Company’s previously held interest in Goodrich.
Valuation Techniques. Our available-for-sale securities includeequity investments that are traded in active markets, either domesti-cally or internationally and are measured at fair value using closingstock prices from active markets. Our derivative assets and liabilitiesinclude foreign exchange contracts and commodity derivatives thatare measured at fair value using internal models based on observablemarket inputs such as forward rates, interest rates, our own credit riskand our counterparties’ credit risks. As of December 31, 2013, therewere no significant transfers in and out of Level 1 and Level 2.
As of December 31, 2013, there has not been any significantimpact to the fair value of our derivative liabilities due to our owncredit risk. Similarly, there has not been any significant adverse impactto our derivative assets based on our evaluation of our counterparties’credit risks.
The following table provides carrying amounts and fair values offinancial instruments that are not carried at fair value at December 31,2013 and 2012:
December 31, 2013 December 31, 2012
(DOLLARS IN MILLIONS)CarryingAmount
FairValue
CarryingAmount
FairValue
Long-term receivables $ 655 $ 586 $ 499 $ 464
Customer financing notesreceivable 394 366 375 371
Short-term borrowings (388) (388) (503) (503)
Long-term debt (excludingcapitalized leases) (19,807) (21,525) (22,665) (25,606)
Long-term liabilities (283) (253) (182) (167)
The following table provides the valuation hierarchy classificationof assets and liabilities that are not carried at fair value in our Consoli-dated Balance Sheet as of December 31, 2013:
(DOLLARS IN MILLIONS) Total Level 1 Level 2 Level 3
Long-term receivables $ 586 $ – $ 586 $ –
Customer financingnotes receivable 366 – 366 –
Short-termborrowings (388) – (200) (188)
Long-term debt(excluding capitalizedleases) (21,525) – (21,211) (314)
Long-term liabilities (253) – (253) –
NOTE 16: GUARANTEES
We extend a variety of financial guarantees to third parties. As ofDecember 31, 2013 and 2012, the following financial guaranteeswere outstanding:
December 31, 2013 December 31, 2012
(DOLLARS IN MILLIONS)
MaximumPotentialPayment
CarryingAmount of
Liability
MaximumPotentialPayment
CarryingAmount of
Liability
Commercial aerospace financingarrangements (see Note 5) $ 615 $ 25 $ 346 $ 7
Credit facilities and debtobligations—unconsolidatedsubsidiaries (expire 2014 to 2034) 231 6 240 2
Performance guarantees 150 – 33 –
As disclosed in Note 3, we completed the sale of substantially alloperations of Rocketdyne to GenCorp Inc. on June 14, 2013. Follow-ing the sale, certain guarantees of Rocketdyne’s performance underexisting contracts remain in place, which resulted in an increase in ourperformance guarantees of approximately $112 million, with no associ-ated significant carrying amount of a liability as of December 31, 2013.
We also have obligations arising from sales of certain businessesand assets, including those from representations and warranties andrelated indemnities for environmental, health and safety, tax andemployment matters. The maximum potential payment related to theseobligations is not a specified amount as a number of the obligations donot contain financial caps. The carrying amount of liabilities related tothese obligations was $189 million and $144 million at December 31,2013 and 2012, respectively. For additional information regarding theenvironmental indemnifications, see Note 17.
We accrue for costs associated with guarantees when it isprobable that a liability has been incurred and the amount can bereasonably estimated. The most likely cost to be incurred is accruedbased on an evaluation of currently available facts, and where noamount within a range of estimates is more likely, the minimum isaccrued. In accordance with the FASB ASC Topic “Guarantees” werecord these liabilities at fair value.
We provide service and warranty policies on our products andextend performance and operating cost guarantees beyond our normalservice and warranty policies on some of our products, particularlycommercial aircraft engines. In addition, we incur discretionary costs toservice our products in connection with specific product performanceissues. Liabilities for performance and operating cost guarantees arebased upon future product performance and durability, and are largely
Notes to Consolidated Financial Statements
76 United Technologies Corporation

estimated based upon historical experience. Adjustments are made toaccruals as claim data and historical experience warrant. The changesin the carrying amount of service and product warranties and productperformance guarantees for the years ended December 31, 2013 and2012 are as follows:
Year ended December 31,
(DOLLARS IN MILLIONS) 2013 2012
Balance as of January 1 $ 1,332 $ 1,468
Warranties and performance guarantees issued 313 325
Settlements made (287) (277)
Other 2 (184)
Balance as of December 31 $ 1,360 $ 1,332
The decrease in the above table in “Other” during the year endedDecember 31, 2012 primarily reflects the impact of warranty reservesreclassified to Liabilities held for sale, as a part of the Clipper disposi-tion, partially offset by an increase in warranty reserves from theGoodrich acquisition. See Notes 2 and 3 for further discussion.
NOTE 17: CONTINGENT LIABILITIES
Except as otherwise noted, while we are unable to predict the final out-come, based on information currently available, we do not believe thatresolution of any of the following matters will have a material adverseeffect upon our competitive position, results of operations, cash flowsor financial condition.
Leases. We occupy space and use certain equipment underlease arrangements. Rental commitments of $2,373 million atDecember 31, 2013 under long-term non-cancelable operating leasesare payable as follows: $586 million in 2014, $494 million in 2015,$364 million in 2016, $233 million in 2017, $156 million in 2018 and$540 million thereafter. Rent expense was $456 million in 2013,$457 million in 2012 and $453 million in 2011.
Additional information pertaining to commercial aerospace rentalcommitments is included in Note 5 to the Consolidated FinancialStatements.
Environmental. Our operations are subject to environmentalregulation by federal, state and local authorities in the United Statesand regulatory authorities with jurisdiction over our foreign operations.As described in Note 1 to the Consolidated Financial Statements, wehave accrued for the costs of environmental remediation activities andperiodically reassess these amounts. We believe that the likelihood ofincurring losses materially in excess of amounts accrued is remote.As of December 31, 2013 and 2012, we had $936 million and $847million reserved for environmental remediation, respectively. Additionalinformation pertaining to environmental matters is included in Note 1to the Consolidated Financial Statements.
Government. We are now, and believe that, in light of the currentU.S. Government contracting environment, we will continue to be thesubject of one or more U.S. Government investigations. If we or one ofour business units were charged with wrongdoing as a result of any ofthese investigations or other government investigations (including viola-tions of certain environmental or export laws) the U.S. Governmentcould suspend us from bidding on or receiving awards of new U.S.Government contracts pending the completion of legal proceedings.If convicted or found liable, the U.S. Government could fine and debarus from new U.S. Government contracting for a period generally not toexceed three years. The U.S. Government could void any contractsfound to be tainted by fraud.
Our contracts with the U.S. Government are also subject toaudits. Like many defense contractors, we have received audit reports,which recommend that certain contract prices should be reduced tocomply with various government regulations. Some of these auditreports involved substantial amounts. We have made voluntary refundsin those cases we believe appropriate, have settled some allegationsand continue to litigate certain cases. In addition, we accrue forliabilities associated with those matters that are probable and canbe reasonably estimated. The most likely settlement amount to beincurred is accrued based upon a range of estimates. Where noamount within a range of estimates is more likely, then we accruedthe minimum amount.
Legal Proceedings. F100 Engine Litigation: As previously dis-closed, the United States government sued us in 1999 in the UnitedStates District Court for the Southern District of Ohio, claiming thatPratt & Whitney violated the civil False Claims Act and common law.The claims relate to the “Fighter Engine Competition” between Pratt &Whitney’s F100 engine and General Electric’s F110 engine. The gov-ernment alleged that it overpaid for F100 engines under contractsawarded by the U.S. Air Force in fiscal years 1985 through 1990because Pratt & Whitney inflated its estimated costs for somepurchased parts and withheld data that would have revealed theoverstatements. At trial, which ended in April, 2005, the governmentclaimed Pratt & Whitney’s liability to be approximately $624 million. OnAugust 1, 2008, the trial court held that the Air Force had not sufferedany actual damages because Pratt & Whitney had made significantprice concessions after the alleged overstatements were made. How-ever, the trial court judge found that Pratt & Whitney violated the FalseClaims Act due to inaccurate statements contained in its 1983 initialengine pricing proposal. In the absence of actual damages, the trialcourt awarded the government the maximum civil penalty of approxi-mately $7 million, or $10,000 for each of the 709 invoices Pratt &Whitney submitted in 1989 and later under the contracts. In Septem-ber 2008, both the government and UTC appealed the decision to the
Notes to Consolidated Financial Statements
2013 Annual Report 77

United States Court of Appeals for the Sixth Circuit. On November 18,2010, the Sixth Circuit affirmed Pratt & Whitney’s liability under theFalse Claims Act, but remanded the case to the trial court for furtherproceedings on the issues of False Claims Act damages and commonlaw liability and damages.
On June 18, 2012, the trial court found that Pratt & Whitney hadbreached obligations imposed by common law based on the sameconduct with respect to which the court previously found liability underthe False Claims Act. Under the common law claims, the U.S. AirForce is entitled to seek damages for events occurring before March 3,1989, which are not recoverable under the False Claims Act.
On June 17, 2013, the trial court awarded the governmentapproximately $473 million in damages and penalties, plus prejudg-ment interest in an amount to be determined. On July 1, 2013, the trialcourt, after determining the amount of prejudgment interest, enteredjudgment in favor of the government in the amount of approximately$664 million. The trial court also awarded postjudgment interest on thefull amount of the judgment to accrue from July 2, 2013, at the federalvariable interest rate determined pursuant to 28 U.S.C. § 1961. Thejudgment included four different components of damages: (1) commonlaw damages of approximately $109 million; (2) prejudgment intereston common law damages of approximately $191 million; (3) FalseClaims Act treble damages of approximately $357 million; and(4) penalties of approximately $7 million. The penalty componentof the judgment previously was affirmed by the United States Courtof Appeals in 2010.
We strongly disagree with the trial court’s analysis and conclu-sions. We filed an appeal from the judgment to the United States Courtof Appeals for the Sixth Circuit on August 26, 2013. Based on ouranalysis, we continue to believe that there is no basis for any commonlaw liability for the inaccurate statements. We also believe that thegovernment suffered no actual damages as a result of the inaccuratestatements made in 1983 and, therefore, there is no basis in fact orlaw for the award of common law damages, prejudgment interest orFalse Claims Act treble damages. If, contrary to our expectations, all orany portion of the judgment should ultimately be affirmed, we estimatea range of reasonably possible loss from approximately $24 million to$657 million in excess of amounts previously accrued, plus postjudg-ment interest. The outcome of this matter could result in a materialadverse effect on our results of operations in the period in which aliability would be recognized and cash flows for the period in whichdamages would be paid.
Department of Defense Cost Accounting Standards Claim:As previously disclosed, in December 2008, the Department ofDefense (DOD) issued a contract claim against Sikorsky to recoveroverpayments the DOD alleges that it made to Sikorsky since January2003 in connection with cost accounting changes approved by theDOD and implemented by Sikorsky in 1999 and 2006. These changesrelate to the calculation of material overhead rates in government
contracts. The DOD claimed that Sikorsky’s liability was approximately$97 million (including interest through December 31, 2013). Webelieved this claim was without merit and Sikorsky filed an appeal inDecember 2009 with the U.S. Court of Federal Claims. Trial in thematter concluded in January 2013 and on March 22, 2013, the U.S.Court of Federal Claims issued a written decision in favor of Sikorskydetermining that the DOD had failed to prove its claims becauseSikorsky’s calculation of material overhead complied with the costaccounting standards. DOD has appealed this decision.
German Tax Office Appeal: As previously disclosed, UTC hasbeen involved in administrative review proceedings with the GermanTax Office, which concern e203 million (approximately $278 million) oftax benefits that we have claimed related to a 1998 reorganization ofthe corporate structure of Otis operations in Germany. Upon audit,these tax benefits were disallowed by the German Tax Office. OnAugust 3, 2012, we filed suit in the local German Tax Court (Berlin-Brandenburg). In 2008 the German Federal Tax Court (“FTC”) deniedbenefits to another taxpayer in a case involving a German tax law rel-evant to our reorganization. The determination of the FTC on this othermatter was appealed to the European Court of Justice (“ECJ”) todetermine if the underlying German tax law is violative of EuropeanUnion (EU) principles. On September 17, 2009, the ECJ issued anopinion in this case that is generally favorable to the other taxpayer andreferred the case back to the FTC for further consideration of certainrelated issues. In May 2010, the FTC released its decision, in which itresolved certain tax issues that may be relevant to our suit andremanded the case to a lower court for further development. In 2012,the lower court decided in favor of the taxpayer and the governmentappealed the findings to the FTC. After consideration of the ECJ deci-sion, the latest FTC decision and the lower court decision, we continueto believe that it is more likely than not that the relevant German taxlaw is violative of EU principles and we have not accrued for this mat-ter. We intend to litigate vigorously the matter to conclusion. We cannotreasonably estimate the range of loss, if any, that may result from thismatter given the current procedural status of this matter.
Other. As described in Note 16 to the Consolidated FinancialStatements, we extend performance and operating cost guaranteesbeyond our normal warranty and service policies for extended periodson some of our products. We have accrued our estimate of the liabilitythat may result under these guarantees and for service costs that areprobable and can be reasonably estimated.
We have accrued for environmental investigatory, remediation,operating and maintenance costs, performance guarantees and otherlitigation and claims based on our estimate of the probable outcome ofthese matters. While it is possible that the outcome of these mattersmay differ from the recorded liability, we believe that resolution of thesematters will not have a material impact on our competitive position,results of operations, cash flows or financial condition.
Notes to Consolidated Financial Statements
78 United Technologies Corporation
We also have other commitments and contingent liabilities relatedto legal proceedings, self-insurance programs and matters arising outof the normal course of business. We accrue contingencies basedupon a range of possible outcomes. If no amount within this range is abetter estimate than any other, then we accrue the minimum amount.
We are also subject to a number of routine lawsuits, investigationsand claims (some of which involve substantial amounts) arising out ofthe ordinary course of our business. We do not believe that thesematters will have a material adverse effect upon our competitiveposition, results of operations, cash flows or financial condition.
NOTE 18: SEGMENT FINANCIAL DATA
Our operations for the periods presented herein are classified into fiveprincipal segments. The segments are generally determined basedon the management structure of the businesses and the grouping ofsimilar operating companies, where each management organizationhas general operating autonomy over diversified products and services.
Otis products include elevators, escalators, moving walkwaysand service sold to customers in the commercial and residentialproperty industries around the world.
UTC Climate, Controls & Security products and related ser-vices include HVAC and refrigeration systems, building controls andautomation, fire and special hazard suppression systems and equip-ment, security monitoring and rapid response systems, provided toa diversified international customer base principally in the industrial,commercial and residential property and commercial transportationsectors.
Pratt & Whitney products include commercial, military, businessjet and general aviation aircraft engines, parts and services, industrialgas turbines, sold to a diversified customer base, including interna-tional and domestic commercial airlines and aircraft leasing companies,aircraft manufacturers, and U.S. and foreign governments. Pratt &Whitney also provides product support and a full range of overhaul,repair and fleet management services and produces land-based powergeneration equipment.
Effective July 1, 2012, the auxiliary power unit business (APU) ofthe UTC Aerospace Systems business segment was transferred to thePratt & Whitney business segment. The APU business designs andmanufactures a variety of products for commercial and military aircraft.Annual sales for the APU business are approximately $600 million. Thereclassification has been made prospectively; prior year results havenot been restated for the transfer of the business.
UTC Aerospace Systems provides aerospace products andaftermarket services for commercial, military, business jet and generalaviation customers worldwide. Products include electric power genera-tion, management and distribution systems, flight control systems,engine control systems, intelligence, surveillance and reconnaissancesystems, engine components, environmental control systems, fireprotection and detection systems, propeller systems, aircraft nacelles,and interior, actuation, landing and electronic systems.
Sikorsky products include military and commercial helicopters,aftermarket helicopter and aircraft parts and services.
We have reported our financial and operational results for theperiods presented herein under the five principal segments notedabove, consistent with how we have reviewed our business operationsfor decision-making purposes, resource allocation and performanceassessment during 2013.
Notes to Consolidated Financial Statements
2013 Annual Report 79
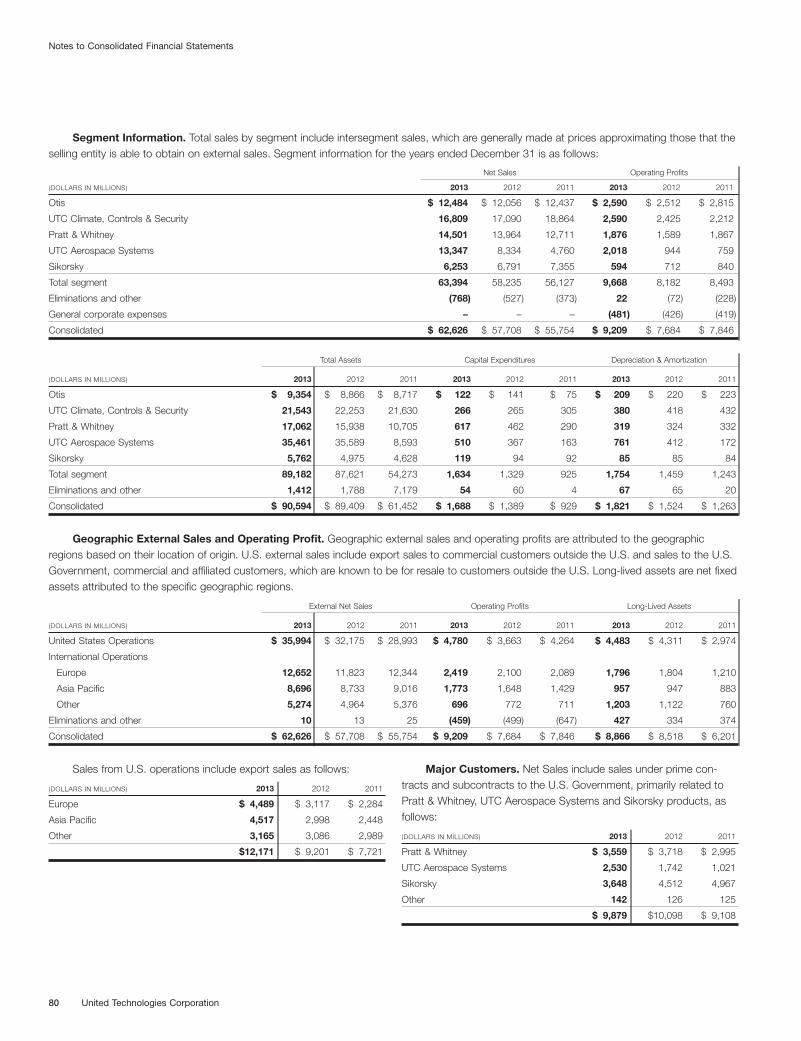
Segment Information. Total sales by segment include intersegment sales, which are generally made at prices approximating those that theselling entity is able to obtain on external sales. Segment information for the years ended December 31 is as follows:
Net Sales Operating Profits
(DOLLARS IN MILLIONS) 2013 2012 2011 2013 2012 2011
Otis $ 12,484 $ 12,056 $ 12,437 $ 2,590 $ 2,512 $ 2,815
UTC Climate, Controls & Security 16,809 17,090 18,864 2,590 2,425 2,212
Pratt & Whitney 14,501 13,964 12,711 1,876 1,589 1,867
UTC Aerospace Systems 13,347 8,334 4,760 2,018 944 759
Sikorsky 6,253 6,791 7,355 594 712 840
Total segment 63,394 58,235 56,127 9,668 8,182 8,493
Eliminations and other (768) (527) (373) 22 (72) (228)
General corporate expenses – – – (481) (426) (419)
Consolidated $ 62,626 $ 57,708 $ 55,754 $ 9,209 $ 7,684 $ 7,846
Total Assets Capital Expenditures Depreciation & Amortization
(DOLLARS IN MILLIONS) 2013 2012 2011 2013 2012 2011 2013 2012 2011
Otis $ 9,354 $ 8,866 $ 8,717 $ 122 $ 141 $ 75 $ 209 $ 220 $ 223
UTC Climate, Controls & Security 21,543 22,253 21,630 266 265 305 380 418 432
Pratt & Whitney 17,062 15,938 10,705 617 462 290 319 324 332
UTC Aerospace Systems 35,461 35,589 8,593 510 367 163 761 412 172
Sikorsky 5,762 4,975 4,628 119 94 92 85 85 84
Total segment 89,182 87,621 54,273 1,634 1,329 925 1,754 1,459 1,243
Eliminations and other 1,412 1,788 7,179 54 60 4 67 65 20
Consolidated $ 90,594 $ 89,409 $ 61,452 $ 1,688 $ 1,389 $ 929 $ 1,821 $ 1,524 $ 1,263
Geographic External Sales and Operating Profit. Geographic external sales and operating profits are attributed to the geographicregions based on their location of origin. U.S. external sales include export sales to commercial customers outside the U.S. and sales to the U.S.Government, commercial and affiliated customers, which are known to be for resale to customers outside the U.S. Long-lived assets are net fixedassets attributed to the specific geographic regions.
External Net Sales Operating Profits Long-Lived Assets
(DOLLARS IN MILLIONS) 2013 2012 2011 2013 2012 2011 2013 2012 2011
United States Operations $ 35,994 $ 32,175 $ 28,993 $ 4,780 $ 3,663 $ 4,264 $ 4,483 $ 4,311 $ 2,974
International Operations
Europe 12,652 11,823 12,344 2,419 2,100 2,089 1,796 1,804 1,210
Asia Pacific 8,696 8,733 9,016 1,773 1,648 1,429 957 947 883
Other 5,274 4,964 5,376 696 772 711 1,203 1,122 760
Eliminations and other 10 13 25 (459) (499) (647) 427 334 374
Consolidated $ 62,626 $ 57,708 $ 55,754 $ 9,209 $ 7,684 $ 7,846 $ 8,866 $ 8,518 $ 6,201
Sales from U.S. operations include export sales as follows:
(DOLLARS IN MILLIONS) 2013 2012 2011
Europe $ 4,489 $ 3,117 $ 2,284
Asia Pacific 4,517 2,998 2,448
Other 3,165 3,086 2,989
$12,171 $ 9,201 $ 7,721
Major Customers. Net Sales include sales under prime con-tracts and subcontracts to the U.S. Government, primarily related toPratt & Whitney, UTC Aerospace Systems and Sikorsky products, asfollows:
(DOLLARS IN MILLIONS) 2013 2012 2011
Pratt & Whitney $ 3,559 $ 3,718 $ 2,995
UTC Aerospace Systems 2,530 1,742 1,021
Sikorsky 3,648 4,512 4,967
Other 142 126 125
$ 9,879 $10,098 $ 9,108
Notes to Consolidated Financial Statements
80 United Technologies Corporation

SELECTED QUARTERLY FINANCIAL DATA (UNAUDITED)
2013 Quarters 2012 Quarters
(DOLLARS IN MILLIONS, EXCEPT PER SHARE AMOUNTS) First Second Third Fourth First Second Third Fourth
Net Sales $ 14,399 $ 16,006 $ 15,462 $ 16,759 $ 12,416 $ 13,807 $ 15,042 $ 16,443
Gross margin 3,934 4,454 4,442 4,475 3,486 3,873 4,039 4,157
Net income attributable to common shareowners 1,266 1,560 1,432 1,463 330 1,328 1,415 2,057
Earnings per share of Common Stock:
Basic—net income $ 1.40 $ 1.73 $ 1.59 $ 1.62 $ 0.37 $ 1.49 $ 1.58 $ 2.28
Diluted—net income $ 1.39 $ 1.71 $ 1.57 $ 1.60 $ 0.36 $ 1.47 $ 1.56 $ 2.26
COMPARATIVE STOCK DATA (UNAUDITED)
2013 2012
COMMON STOCK High Low Dividend High Low Dividend
First quarter $ 93.59 $ 83.55 $ 0.535 $ 87.50 $ 73.62 $ 0.480
Second quarter $ 97.55 $ 91.05 $ 0.535 $ 83.57 $ 70.71 $ 0.480
Third quarter $ 112.00 $ 93.80 $ 0.535 $ 82.56 $ 70.95 $ 0.535
Fourth quarter $ 113.80 $ 102.76 $ 0.590 $ 83.64 $ 74.44 $ 0.535
Our common stock is listed on the New York Stock Exchange. The high and low prices are based on the Composite Tape of the New YorkStock Exchange. There were approximately 21,364 registered shareholders at January 31, 2014.
PERFORMANCE GRAPH (UNAUDITED)
The following graph presents the cumulative total shareholder return for the five years ending December 31, 2013 for our common stock, ascompared to the Standard & Poor’s 500 Stock Index and to the Dow Jones 30 Industrial Average. Our common stock price is a component ofboth indices. These figures assume that all dividends paid over the five-year period were reinvested, and that the starting value of each indexand the investment in common stock was $100.00 on December 31, 2008.
COMPARISON OF CUMULATIVE FIVE YEAR TOTAL RETURN
December
2008 2009 2010 2011 2012 2013
United Technologies Corporation $ 100.00 $ 133.29 $ 154.93 $ 147.23 $ 169.46 $ 240.42
S&P 500 Index $ 100.00 $ 126.46 $ 145.51 $ 148.59 $ 172.37 $ 228.19
Dow Jones Industrial Average $ 100.00 $ 122.68 $ 139.94 $ 151.67 $ 167.19 $ 216.77
$0
$50
$100
$150
$200
$250
201320122011201020092008
United Technologies Corporation
S&P 500 Index
Dow Jones Industrial Average
Notes to Consolidated Financial Statements
2013 Annual Report 81

Louis R. ChenevertChairman & Chief Executive OfficerUnited Technologies Corporation(Diversified Manufacturer)
John V. FaraciChairman and Chief Executive OfficerInternational Paper(Paper, Packaging and Distribution)
Jean-Pierre GarnierChairman of the BoardActelion(Biopharmaceutical Company)Operating PartnerAdvent International(Global Private Equity Firm)Retired Chief Executive OfficerGlaxoSmithKIine
Jamie S. GorelickPartner, WilmerHale(Law Firm)Former Deputy Attorney Generalof the United StatesFormer General Counsel of theDepartment of Defense
Edward A. KangasFormer Chairman and CEODeloitte, Touche, Tohmatsu(Audit and Tax Services)
Ellen J. KullmanChair of the Board & CEODuPont(Diversified Chemicals and Materials)
Marshall O. LarsenFormer Chairman, Presidentand Chief Executive OfficerGoodrich Corporation(Aerospace and Defense Systemsand Services)
Harold McGraw IIIChairman of the BoardMcGraw Hill Financial(Ratings, Benchmarks and Analyticsfor Financial Markets)
Richard B. MyersGeneral, U.S. Air Force (Ret.)and former Chairman ofthe Joint Chiefs of Staff(Military Leadership)
H. Patrick SwygertPresident EmeritusHoward University(Educational Institution)
Andre VilleneuveChairmanICE Benchmark Administration Limited(Administrator LIBORBenchmark Interest Rate)
Christine Todd WhitmanPresidentThe Whitman Strategy Group(Environment and Public Policy Consulting)Former EPA AdministratorFormer Governor of New Jersey
PERMANENT COMMITTEES
Audit CommitteeEdward A. Kangas, ChairJohn V. FaraciEllen J. KullmanRichard B. MyersH. Patrick SwygertAndre Villeneuve
Committee on Compensationand Executive DevelopmentJean-Pierre Garnier, ChairJamie S. GorelickEdward A. KangasHarold McGraw IllRichard B. MyersH. Patrick Swygert
Executive CommitteeLouis R. Chenevert, ChairJohn V. FaraciEdward A. Kangas
Finance CommitteeJohn V. Faraci, ChairLouis R. ChenevertJamie S. GorelickEllen J. KullmanMarshall O. LarsenHarold McGraw IIIAndre VilleneuveChristine Todd Whitman
Committee on Nominationsand GovernanceH. Patrick Swygert, ChairJohn V. FaraciJean-Pierre GarnierEdward A. KangasHarold McGraw IllRichard B. MyersChristine Todd Whitman
Public Issues Review CommitteeChristine Todd Whitman, ChairJean-Pierre GarnierJamie S. GorelickEllen J. KullmanMarshall O. LarsenAndre Villeneuve
Board of Directors
82 United Technologies Corporation

Paul R. AdamsPresident,Pratt & Whitney
Elizabeth B. AmatoSenior Vice President,Human Resources andOrganization
David G. AppelPresident, Carrier Transicold& Refrigeration Systems,UTC Building & Industrial Systems
Alain M. BellemarePresident &Chief Executive Officer,UTC Propulsion &Aerospace Systems
Richard H. Bennett, Jr.Vice President,Environment, Health & Safety
Patrick BlethonPresident, South Asia Pacific,UTC Building & Industrial Systems
Carey E. BondPresident,Commercial Systems & Services,Sikorsky
Brian BrandewieSenior Vice President,Aircraft Systems,UTC Aerospace Systems
David M. BrantnerPresident, Commercial Engines,Pratt & Whitney
Matthew F. BrombergPresident, Aftermarket,Pratt & Whitney
Benoit BrossoitVice President,Operations
Bernardo Calleja FernandezPresident, South Europe,UTC Building & Industrial Systems
David B. CarterVice President, Engineeringand Technology,UTC Aerospace Systems
Louis R. ChenevertChairman &Chief Executive Officer
Bennett M. CroswellPresident, Military Engines,Pratt & Whitney
Paolo C. Dal CinVice President,Operations & Supply Chain,UTC Aerospace Systems
Geraud DarnisPresident &Chief Executive Officer,UTC Building & Industrial Systems
Nancy M. DavisVice President andChief Information Officer
Pierre DejouxPresident, Otis Europe,UTC Building & Industrial Systems
Philippe DelpechChief Operating Officer,Intercontinental Operations,UTC Building & Industrial Systems
Danny Di PernaSenior Vice President,Engineering & Operations,Pratt & Whitney
Robin L. DiamonteVice President,Pension Investments
Michael R. DumaisPresident,Power, Controls &Sensing Systems,UTC Aerospace Systems
Shane EddySenior Vice President,Operations, Sikorsky
Charles D. Gill, Jr.Senior Vice President andGeneral Counsel
David L. GitlinPresident, Aircraft Systems,UTC Aerospace Systems
Peter J. Graber-LippermanVice President, Secretary andAssociate General Counsel
Lindsay HarveyPresident,United Kingdom & Benelux,UTC Building & Industrial Systems
Nicole Parent HaugheyVice President,Corporate Strategy
Gregory J. HayesSenior Vice President andChief Financial Officer
Dennis JarviVice President,Development Programs,Sikorsky
Matti KuivalainenPresident, Germany, Nordicsand Central & Eastern Europe,UTC Building & Industrial Systems
Michael B. MaurerPresident,Sikorsky
Robert J. McDonoughChief Operating Officer, Americas,UTC Building & Industrial Systems
J. Michael McQuadeSenior Vice President,Science and Technology
Samir B. MehtaPresident,Defense Systems & Services,Sikorsky
Thomas A. MephamSenior Vice President,Power, Controls &Sensing Systems,UTC Aerospace Systems
Mark F. MillerVice President, Research &Engineering, Sikorsky
Christopher NelsonPresident, HVAC North America,UTC Building & Industrial Systems
Kevin J. O’ConnorVice President,Global Compliance
Bart OttenPresident, Fire & Security, EMEA,UTC Building & Industrial Systems
David E. ParekhVice President, Research, andDirector, United TechnologiesResearch Center
Thomas W. PreteVice President, Engineering,Pratt & Whitney
Thomas I. RoganVice President, Treasurer
Alain RuePresident, France,Switzerland & Africa,UTC Building & Industrial Systems
John SaabasPresident,Pratt & Whitney Canada
Pedro Sainz de BarandaPresident, Otis and President,Intelligent Building Technologies,UTC Building & Industrial Systems
Richard J. SanfreySenior Vice President, Operations,UTC Building & Industrial Systems
Andreas SchellPresident, Actuation &Propeller Systems,UTC Aerospace Systems
Ross B. ShusterPresident, North Asia,UTC Building & Industrial Systems
Tobin J. TreichelVice President, Tax
Thomas R. ViningPresident, Otis Americas,UTC Building & Industrial Systems
Gregg WardSenior Vice President,Government Relations
James P. WardPresident, Fire Safety Solutions,UTC Building & Industrial Systems
Peiming Perry ZhengPresident, Otis China,UTC Building & Industrial Systems
Leadership
2013 Annual Report 83

CORPORATE OFFICE
United Technologies CorporationUnited Technologies BuildingHartford, CT 06101Telephone: 860.728.7000
This report is made available to shareowners in advance of theannual meeting of shareowners to be held at 2 p.m., April 28, 2014,in Charlotte, N.C. The proxy statement will be made available toshareowners on or about March 14, 2014, at which time proxies forthe meeting will be requested.
Information about UTC, including financial information, can befound at our website: www.utc.com.
STOCK LISTING
New York Stock Exchange
TICKER SYMBOL
UTX
TRANSFER AGENT AND REGISTRAR
Computershare Trust Company, N.A., is the transfer agent, registrarand dividend disbursing agent for UTC’s common stock. Questionsand communications regarding transfer of stock, replacement of lostcertificates, dividends, address changes, and the Stock Purchase andDividend Reinvestment Plan administered by Computershare shouldbe directed to:
Computershare Trust Company, N.A.250 Royall StreetCanton, MA 02021Telephone:
Within the U.S.: 1.800.488.9281Outside the U.S.: 1.781.575.2724
Website: www.computershare.com/investor
TDD: 1.800.952.9245Telecommunications device for the hearing impaired
CERTIFICATIONS
UTC has included as Exhibit 31 to its Annual Report on Form 10-K forfiscal year 2013 filed with the Securities and Exchange Commissioncertificates of its Chief Executive Officer, Chief Financial Officer andActing Controller certifying, among other things, the informationcontained in the Form 10-K.
Annually UTC submits to the New York Stock Exchange (NYSE)a certificate of UTC’s Chief Executive Officer certifying that he was notaware of any violation by UTC of NYSE corporate governance listingstandards as of the date of the certification.
DIVIDENDS
Dividends are usually paid on the 10th day of March, June, Septemberand December.
ELECTRONIC ACCESS
Rather than receiving mailed copies, registered shareowners may signup at the following website for electronic communications, includingannual meeting materials, stock plan statements and tax documents:www.computershare-na.com/green.
For annual meeting materials, your enrollment is revocable until aweek before each year’s record date for the annual meeting. Beneficialshareowners may be able to request electronic access by contactingtheir broker or bank, or Broadridge Financial Solutions at:http://enroll.icsdelivery.com/utc.
ADDITIONAL INFORMATION
Shareowners may obtain, without charge, a copy of the UTC AnnualReport on Form 10-K for fiscal year 2013 filed with the Securities andExchange Commission by writing to:
Corporate SecretaryUnited Technologies CorporationUnited Technologies BuildingHartford, CT 06101
For additional information about UTC, please contact InvestorRelations at the above corporate office address or visit our website at:www.utc.com.
SHAREOWNER INFORMATION SERVICES
Our Internet and telephone services give shareowners fast access toUTC financial results. The 24-hour-a-day, toll-free telephone serviceincludes recorded summaries of UTC’s quarterly earnings informationand other company news.
To access the service, dial 1.800.881.1914 from any touchtonephone and follow the recorded instructions.
DIRECT REGISTRATION SYSTEM
If your shares are held in street name through a broker and you areinterested in participating in the Direct Registration System, youmay have your broker transfer the shares to Computershare TrustCompany, N.A., electronically through the Direct Registration System.
ENVIRONMENTALLY FRIENDLY REPORT
This annual report is printed on recycled and recyclable paper.
www.utc.comwww.bis.utc.comwww.otis.comwww.pw.utc.comwww.sikorsky.comwww.utcaerospacesystems.com
Shareowner Information
84 United Technologies Corporation
Our Commitments
PerformanceOur customers have a choice, and how we perform determines whether they choose us. We aim high, set ambitious goals and deliver results, and we use customer feedback to recalibrate when necessary. We move quickly and make timely, well-reasoned decisions because our future depends on them. We invest authority where it needs to be, in the hands of the people closest to the customer and the work.
InnovationWe are a company of ideas that are nurtured by a commitment to research and development. The achievements of our founders inspire us to reach always for the next innovative and powerful and marketable idea. We seek and share ideas openly, and encourage diversity of experience and opinion.
OpportunityOur employees’ ideas and inspiration create opportunities constantly, and without limits. We improve continuously everything we do, as a company and as individuals. We support and pursue lifelong learning to expand our knowledge and capabilities and to engage with the world outside UTC. Confidence spurs us to take prudent risks, to experiment, to cooperate with each other and, always, to learn from the consequences of our actions.
ResponsibilitySuccessful businesses improve the human condition. We maintain the highest ethical, environmental and safety standards everywhere, and we encourage and celebrate our employees’ active roles in their communities.
ResultsWe are a preferred investment because we meet aggressive targets whatever the economic environment. We communicate honestly and forthrightly to investors, and deliver consistently what we promise. We are a company of realists and optimists, and we project these values in everything we do.
This report and its associated Web content at www.utc.com/2013ar provide detailed examples of how our approach to integrating responsibility into our operations fosters a culture of innovation and delivers results.
Your feedback is important to us. Please visit www.utc.com/2013ar and tell us what you think of our financial and corporate responsibility performance and reporting.
United Technologies Corporation and its subsidiaries’ names, abbreviations thereof, logos, and product and service designators are either the registered or unregistered trademarks or trade names of United Technologies Corporation and its subsidiaries.
Names of other companies, abbreviations thereof, logos of other companies, and product and service designators of other companies are either the registered or unregistered trademarks or trade names of their respective owners.
All paper used in this report is certified to the Forest Stewardship Council™ (FSC®) standards.
The cover and narrative section are printed on paper made with 30 percent post-consumer recycled content. The financial section is printed on paper that contains 10 percent post-consumer recycled content and manufactured in facilities that use an average of 75 percent renewable energy.
Top 100 Global Innovators, Thomson Reuters
Most Admired Aerospace & Defense Companies, Fortune magazine
World’s Most Respected Companies, Barron’s magazine
Most Innovative Companies in China, Global Entrepreneur magazine
Top Corporate Partner, INROADS (7th consecutive year), an organization that seeks to develop and place talented, underserved youth in business and industry
UTC Research Center, R&D 100 Award, R&D Magazine, for the PureStorage flow battery energy storage technology, recognized as among the 100 most technologically significant products introduced during the previous year
Distinguished Service Award, USO (United Service Organizations), accepted by UTC Chairman & CEO Louis Chênevert on behalf of UTC and its employees
PHOTO CREDITSPage 7, courtesy Bombardier Inc.Page 16, courtesy Lockheed Martin CorporationPage 17, courtesy Embraer S.A.
Recognition

United Technologies BuildingHartford, CT 06101USAwww.utc.com