Embed Size (px)
Citation preview

Fishery Management Report No. 15-09
2013 Annual Management Report Norton Sound-Port Clarence Area and Arctic-Kotzebue Area
by
Jim Menard,
Joyce Soong,
Scott Kent,
Lauri Harlan,
and
Ashley Brown
March 2015
Alaska Department of Fish and Game Divisions of Sport Fish and Commercial Fisheries

Symbols and Abbreviations The following symbols and abbreviations, and others approved for the Système International d'Unités (SI), are used without definition in the following reports by the Divisions of Sport Fish and of Commercial Fisheries: Fishery Manuscripts, Fishery Data Series Reports, Fishery Management Reports, and Special Publications. All others, including deviations from definitions listed below, are noted in the text at first mention, as well as in the titles or footnotes of tables, and in figure or figure captions. Weights and measures (metric) centimeter cm deciliter dL gram g hectare ha kilogram kg kilometer km liter L meter m milliliter mL millimeter mm Weights and measures (English) cubic feet per second ft3/s foot ft gallon gal inch in mile mi nautical mile nmi ounce oz pound lb quart qt yard yd Time and temperature day d degrees Celsius °C degrees Fahrenheit °F degrees kelvin K hour h minute min second s Physics and chemistry all atomic symbols alternating current AC ampere A calorie cal direct current DC hertz Hz horsepower hp hydrogen ion activity pH (negative log of) parts per million ppm parts per thousand ppt, ‰ volts V watts W
General Alaska Administrative Code AAC all commonly accepted abbreviations e.g., Mr., Mrs.,
AM, PM, etc. all commonly accepted professional titles e.g., Dr., Ph.D., R.N., etc. at @ compass directions:
east E north N south S west W
copyright corporate suffixes:
Company Co. Corporation Corp. Incorporated Inc. Limited Ltd.
District of Columbia D.C. et alii (and others) et al. et cetera (and so forth) etc. exempli gratia (for example) e.g. Federal Information Code FIC id est (that is) i.e. latitude or longitude lat or long monetary symbols (U.S.) $, ¢ months (tables and figures): first three letters Jan,...,Dec registered trademark trademark United States (adjective) U.S. United States of America (noun) USA U.S.C. United States
Code U.S. state use two-letter
abbreviations (e.g., AK, WA)
Mathematics, statistics all standard mathematical signs, symbols and abbreviations alternate hypothesis HA base of natural logarithm e catch per unit effort CPUE coefficient of variation CV common test statistics (F, t, χ2, etc.) confidence interval CI correlation coefficient (multiple) R correlation coefficient (simple) r covariance cov degree (angular ) ° degrees of freedom df expected value E greater than > greater than or equal to ≥ harvest per unit effort HPUE less than < less than or equal to ≤ logarithm (natural) ln logarithm (base 10) log logarithm (specify base) log2, etc. minute (angular) ' not significant NS null hypothesis HO percent % probability P probability of a type I error (rejection of the null hypothesis when true) α probability of a type II error (acceptance of the null hypothesis when false) β second (angular) " standard deviation SD standard error SE variance population Var sample var

FISHERY MANAGEMENT REPORT NO. 15-09
2013 ANNUAL MANAGEMENT REPORT NORTON SOUND-PORT CLARENCE AREA AND ARCTIC-KOTZEBUE
AREA
By Jim Menard, Joyce Soong, Scott Kent, Lauri Harlan, and Ashley Brown
Alaska Department of Fish and Game, Division of Commercial Fisheries, Nome
Alaska Department of Fish and Game Division of Sport Fish, Research and Technical Services 333 Raspberry Road, Anchorage, Alaska, 99518-1565
March 2015

The Fishery Management Reports series was established in 1989 by the Division of Sport Fish for the publication of an overview of management activities and goals in a specific geographic area, and became a joint divisional series in 2004 with the Division of Commercial Fisheries. Fishery Management Reports are intended for fishery and other technical professionals, as well as lay persons. Fishery Management Reports are available through the Alaska State Library and on the Internet: http://www.adfg.alaska.gov/sf/publications/. This publication has undergone regional peer review.
Jim Menard, Joyce Soong, Scott Kent, and Ashley Brown Alaska Department of Fish and Game, Division of Commercial Fisheries,
P.O. Box 1148, Nome, AK 99762, USA
This document should be cited as: Menard, J., J. Soong, S. Kent, L. Harlan, and A. Brown. 2015. 2013 Annual management report Norton Sound-
Port Clarence Area and Arctic-Kotzebue. Alaska Department of Fish and Game, Fishery Management Report No. 15-09, Anchorage.
The Alaska Department of Fish and Game (ADF&G) administers all programs and activities free from discrimination based on race, color, national origin, age, sex, religion, marital status, pregnancy, parenthood, or disability. The department administers all programs and activities in compliance with Title VI of the Civil Rights Act of 1964, Section 504 of the Rehabilitation Act of 1973, Title II of the Americans with Disabilities Act (ADA) of 1990, the Age Discrimination Act of 1975, and Title IX of the Education Amendments of 1972.
If you believe you have been discriminated against in any program, activity, or facility please write: ADF&G ADA Coordinator, P.O. Box 115526, Juneau, AK 99811-5526
U.S. Fish and Wildlife Service, 4401 N. Fairfax Drive, MS 2042, Arlington, VA 22203 Office of Equal Opportunity, U.S. Department of the Interior, 1849 C Street NW MS 5230, Washington DC 20240
The department’s ADA Coordinator can be reached via phone at the following numbers: (VOICE) 907-465-6077, (Statewide Telecommunication Device for the Deaf) 1-800-478-3648,
(Juneau TDD) 907-465-3646, or (FAX) 907-465-6078 For information on alternative formats and questions on this publication, please contact:
ADF&G, Division of Sport Fish, Research and Technical Services, 333 Raspberry Rd, Anchorage AK 99518 (907) 267-2375

TABLE OF CONTENTS Page LIST OF TABLES ......................................................................................................................................................... v
LIST OF FIGURES ....................................................................................................................................................... v
LIST OF APPENDICES ............................................................................................................................................... v
ABSTRACT .................................................................................................................................................................. 1
INTRODUCTION ......................................................................................................................................................... 1
SECTION 1: MANAGEMENT AREA OVERVIEWS 2
BOUNDARIES ............................................................................................................................................................. 2
SALMON OVERVIEW ................................................................................................................................................ 2
Commercial Salmon Fishery ......................................................................................................................................... 3 Subsistence Salmon Fishery .......................................................................................................................................... 3 Salmon Management ..................................................................................................................................................... 4
NORTON SOUND SALMON OVERVIEW ................................................................................................................ 5
District Boundaries ........................................................................................................................................................ 5 Historical Fishery Use ................................................................................................................................................... 6 Commercial Fishery Overview ...................................................................................................................................... 7 Commercial Fishery Management ................................................................................................................................. 8 Subsistence Fishery Overview ....................................................................................................................................... 9 Historical Regulatory Actions in Norton Sound Subdistricts ...................................................................................... 10
PORT CLARENCE SALMON OVERVIEW ............................................................................................................. 13
District Boundaries ...................................................................................................................................................... 13 Commercial Fishery Overview .................................................................................................................................... 13 Subsistence Fishery Overview ..................................................................................................................................... 14
KOTZEBUE SALMON OVERVIEW ........................................................................................................................ 15
District Boundaries ...................................................................................................................................................... 15 Commercial Fishery Overview .................................................................................................................................... 16 Subsistence Fishery Overview ..................................................................................................................................... 18
ARCTIC SALMON OVERVIEW .............................................................................................................................. 18
District Boundaries ...................................................................................................................................................... 18 Subsistence Fishery Overview ..................................................................................................................................... 18
PACIFIC HERRING OVERVIEW ............................................................................................................................. 19
District Boundaries ...................................................................................................................................................... 19 Spawning Areas and Timing ....................................................................................................................................... 19
NORTON SOUND PACIFIC HERRING OVERVIEW ............................................................................................. 21
Commercial Fishery Overview .................................................................................................................................... 21 Sac Roe ................................................................................................................................................................... 21 Spawn-on-Kelp ....................................................................................................................................................... 22 Food and Bait Fishery ............................................................................................................................................. 22
Commercial Fishery Management ............................................................................................................................... 23
i
TABLE OF CONTENTS (Continued) Page Subsistence Fishery Use .............................................................................................................................................. 24
PORT CLARENCE AND KOTZEBUE PACIFIC HERRING OVERVIEW ............................................................ 24
Commercial Fishery Overview .................................................................................................................................... 24 Historical Resource Investigations .............................................................................................................................. 24
KING CRAB OVERVIEW ......................................................................................................................................... 25
Norton Sound King Crab Overview ............................................................................................................................ 25 District Boundaries ................................................................................................................................................. 25 Abundance .............................................................................................................................................................. 25
Commercial Fishery Overview .................................................................................................................................... 27 CDQ Fishery ........................................................................................................................................................... 28 Commercial Catch Sampling .................................................................................................................................. 28
Subsistence Fishery Overview ..................................................................................................................................... 28 St. Lawrence Island And Kotzebue King Crab Overview ........................................................................................... 29
District Boundaries ................................................................................................................................................. 29 Abundance .............................................................................................................................................................. 29 Commercial Fishery Overview ............................................................................................................................... 30
MISCELLANEOUS FISH OVERVIEW .................................................................................................................... 30
Inconnu (Sheefish) ....................................................................................................................................................... 30 Spawning Areas and Timing ................................................................................................................................... 30 Historical Fishery Use ............................................................................................................................................ 31 Subsistence Fishery ................................................................................................................................................ 32 Commercial Fishery ................................................................................................................................................ 32 Sport Fishery ........................................................................................................................................................... 32 Historical Escapement ............................................................................................................................................ 33
Dolly Varden ............................................................................................................................................................... 33 Spawning Areas and Timing ................................................................................................................................... 34 Subsistence Fishery ................................................................................................................................................ 34 Commercial Fishery ................................................................................................................................................ 34 Sport Fishery ........................................................................................................................................................... 35 Historical Escapement ............................................................................................................................................ 35
Whitefish ..................................................................................................................................................................... 35 Spawning Areas and Timing ................................................................................................................................... 35 Commercial Fishery ................................................................................................................................................ 36 Subsistence Fishery ................................................................................................................................................ 36 Historical Escapement ............................................................................................................................................ 37
Saffron Cod ................................................................................................................................................................. 37 Miscellaneous Finfish Species ................................................................................................................................ 37 Subsistence Fishery ................................................................................................................................................ 37 Commercial Fishery ................................................................................................................................................ 37 Sport Fishery ........................................................................................................................................................... 37
SECTION 2: SALMON FISHERIES 38 2013 Norton Sound Salmon Fishery ............................................................................................................................ 38
2013 Norton Sound Fisheries Outlook ................................................................................................................... 38 Commercial Fishery Season Summary ................................................................................................................... 38 Subsistence Fishery Season Summary .................................................................................................................... 40
ii

TABLE OF CONTENTS (Continued) Page
Season Summary by Subdistrict ............................................................................................................................. 40 Nome–Norton Sound Subdistrict 1 ............................................................................................................... 40 Golovin–Norton Sound Subdistrict 2 ............................................................................................................ 41 Elim–Norton Sound Subdistrict 3 ................................................................................................................. 42 Norton Bay–Norton Sound Subdistrict 4 ...................................................................................................... 43 Shaktoolik and Unalakleet–Norton Sound Subdistricts 5 and 6 .................................................................... 44
Escapement ............................................................................................................................................................. 45 Chinook Salmon ............................................................................................................................................ 45 Coho Salmon ................................................................................................................................................. 46 Pink Salmon .................................................................................................................................................. 47 Sockeye Salmon ............................................................................................................................................ 47
Enforcement ............................................................................................................................................................ 48 2014 Norton Sound Salmon Outlook ........................................................................................................................... 48 2013 Port Clarence Salmon Fishery ............................................................................................................................ 49
Commercial Fishery Season Summary ................................................................................................................... 49 Subsistence Fishery Season Summary .................................................................................................................... 49 Escapement ............................................................................................................................................................. 50 Enforcement ............................................................................................................................................................ 50
2014 Port Clarence Salmon Outlook ........................................................................................................................... 50 2013 Kotzebue Sound Salmon Fishery ........................................................................................................................ 50
Commercial Fishery Season Summary ................................................................................................................... 50 Subsistence Fishery Season Summary .................................................................................................................... 51 Escapement ............................................................................................................................................................. 52 Enforcement ............................................................................................................................................................ 52 2014 Kotzebue Salmon Outlook ............................................................................................................................. 52
SECTION 3: PACIFIC HERRING FISHERIES 53 2013 Norton Sound Pacific Herring Fishery ............................................................................................................... 53
Sac Roe ................................................................................................................................................................... 53 Spawn-on-Kelp ....................................................................................................................................................... 53 Bait Fishery ............................................................................................................................................................. 53 Commercial Fishery Management .......................................................................................................................... 53 Catch Reporting and Enforcement .......................................................................................................................... 54 Biomass Determination .......................................................................................................................................... 54
2014 Norton Sound Pacific Herring Outlook .............................................................................................................. 54 SECTION 4: KING CRAB FISHERIES 55 Norton Sound Crab Fishery ......................................................................................................................................... 55
Abundance .............................................................................................................................................................. 55 Summer Open Access Commercial Fishery ........................................................................................................... 55 CDQ Fishery ........................................................................................................................................................... 56 Harvest Areas and Commercial Catch Sampling .................................................................................................... 56 Enforcement ............................................................................................................................................................ 57 Winter Commercial Fishery .................................................................................................................................... 57 Subsistence Fishery ................................................................................................................................................ 57 Sport Fishery ........................................................................................................................................................... 58 Future Resource Investigations ............................................................................................................................... 58
St. Lawrence Island Crab Fishery ................................................................................................................................ 58 Commercial Fishery ................................................................................................................................................ 58
SECTION 5: MISCELLANEOUS SPECIES 59
iii

TABLE OF CONTENTS (Continued) Page Inconnu (Sheefish) ....................................................................................................................................................... 59
Commercial Fishery ................................................................................................................................................ 59 Subsistence and Sport Fishery ................................................................................................................................ 59 Escapement ............................................................................................................................................................. 59
Dolly Varden ............................................................................................................................................................... 59 Commercial Fishery ................................................................................................................................................ 59 Subsistence and Sport Fishery ................................................................................................................................ 59 Escapement ............................................................................................................................................................. 60
Whitefish ..................................................................................................................................................................... 60 Commercial Fishery ................................................................................................................................................ 60 Subsistence and Sport Fishery ................................................................................................................................ 60
Saffron Cod ................................................................................................................................................................. 60 Commercial Fishery ................................................................................................................................................ 60 Subsistence and Sport Fishery ................................................................................................................................ 60
Capelin ......................................................................................................................................................................... 61 Commercial Fishery ................................................................................................................................................ 61 Subsistence ............................................................................................................................................................. 61
ACKNOWLEDGEMENTS ......................................................................................................................................... 61
REFERENCES CITED ............................................................................................................................................... 62
TABLES ...................................................................................................................................................................... 65
APPENDIX A: NORTON SOUND FISHERIES ........................................................................................................ 81
APPENDIX B: PORT CLARENCE FISHERIES ..................................................................................................... 117
APPENDIX C: KOTZEBUE FISHERIES ................................................................................................................ 123
APPENDIX D: HERRING FISHERIES ................................................................................................................... 135
APPENDIX E: KING CRAB FISHERIES ............................................................................................................... 149
APPENDIX F: MISCELLANEOUS FISHERIES .................................................................................................... 173
APPENDIX G: OVERVIEW OF 2013 ..................................................................................................................... 183
APPENDIX H: ARCTIC FISHERIES ...................................................................................................................... 227
iv
LIST OF FIGURES Figure Page
1 Norton Sound, Port Clarence, Kotzebue Sound, and Arctic management districts. ........................................ 2 2 Norton Sound commercial salmon fishing subdistricts. .................................................................................. 5 3 Port Clarence District. ................................................................................................................................... 13 4 Seward Peninsula with road accessible waters. ............................................................................................. 15 5 Kotzebue Sound District, villages and subsistence fishing area. ................................................................... 16 6 Kotzebue Sound commercial salmon fishing subdistricts and statistical areas. ............................................ 17 7 Arctic management district. .......................................................................................................................... 19 8 Commercial herring districts and statistical areas of Norton Sound, Port Clarence, and Kotzebue
Sound............................................................................................................................................................. 20 9 King crab fishing districts and sections of Statistical Area Q. ...................................................................... 26
10 Kotzebue and Kobuk River Valley villages and their spatial relationship with inconnu spawning and overwintering areas. ...................................................................................................................................... 31
LIST OF TABLES Table Page
1 Norton Sound commercial salmon harvest summary by subdistrict, 2013.................................................... 66 2 Subsistence salmon harvest for northern Norton Sound, 2013. ..................................................................... 67 3 Salmon counts of rivers and associated salmon escapement goal ranges, Norton Sound and Port
Clarence, 2013. .............................................................................................................................................. 68 4 Commercial salmon set gillnet catches from Golovin, Subdistrict 2, Norton Sound, 2013. ......................... 70 5 Commercial salmon set gillnet catches from Elim, Subdistrict 3, Norton Sound, 2013. ............................... 70 6 Commercial salmon set gillnet catches from Norton Bay, Subdistrict 4, Norton Sound, 2013. .................... 71 7 Commercial salmon set gillnet catches from Shaktoolik, Subdistrict 5, Norton Sound, 2013. ..................... 72 8 Commercial salmon set gillnet catches from Unalakleet, Subdistrict 6, Norton Sound, 2013. ..................... 73 9 Kotzebue District commercial chum salmon catch and average weight by date, 2013. ................................ 74
10 Historical chum salmon catch for Kobuk River drift test fishery, 1993–2013. ............................................. 75 11 Commercial herring sac roe harvest summary by subdistrict, Norton Sound District, 2013. ........................ 76 12 Daily catch for the open access and CDQ summer commercial king crab harvests, Norton Sound
Section, Eastern Bering Sea, July 3–September 14, 2013. ............................................................................ 77 13 Commercial harvest of red king crab from Norton Sound Section by statistical area, Norton Sound
District, 2013. ................................................................................................................................................ 80
LIST OF APPENDICES Appendix Page
A1 Commercial salmon catch by species, Norton Sound District, 1990–2013. .................................................. 82 A2 Number of commercial salmon permits fished, Norton Sound, 1990–2013. ................................................ 83 A3 Round weight and value of commercially caught salmon by species, Norton Sound District, 1990–
2013. .............................................................................................................................................................. 84 A4 Estimated mean prices paid to commercial salmon fishermen in dollars, Norton Sound District, 1990–
2013. .............................................................................................................................................................. 85 A5 Mean commercial salmon harvest weights, Norton Sound District, 1990–2013. .......................................... 86 A6 Commercial and subsistence salmon catch by species, by year in Nome Subdistrict, Norton Sound
District, 1990–2013. ...................................................................................................................................... 87 A7 Commercial and subsistence salmon catch by species, by year in Golovin Subdistrict, Norton Sound
District, 1990–2013. ...................................................................................................................................... 88 A8 Commercial and subsistence salmon catch by species, by year in Elim Subdistrict, Norton Sound
District, 1990–2013. ...................................................................................................................................... 89
v

LIST OF APPENDICES (Continued) Appendix Page A9 Commercial and subsistence salmon catch by species, by year in Norton Bay Subdistrict, Norton
Sound District, 1990–2013. ........................................................................................................................... 90 A10 Commercial and subsistence salmon catch by species, by year in Shaktoolik Subdistrict, Norton Sound
District, 1990–2013. ...................................................................................................................................... 91 A11 Commercial and subsistence salmon catch by species, by year in Unalakleet Subdistrict, Norton Sound
District, 1990–2013. ...................................................................................................................................... 92 A12 Subsistence salmon catch by species and year for St. Michael and Stebbins in Norton Sound District,
1994–2013. .................................................................................................................................................... 93 A13 Commercial, subsistence, and sport salmon catch by species, by year for Subdistricts 1–6 in Norton
Sound District, 1990–2013. ........................................................................................................................... 94 A14 Sport salmon harvest by species, by year for the Unalakleet River, 1990–2013. .......................................... 95 A15 Sport salmon harvest by species, by year for the Fish/Niukluk rivers, 1990–2013. ...................................... 96 A16 Sport salmon harvest by species, by year for the Nome River, 1990–2013. ................................................. 97 A17 Comparative salmon aerial survey escapement indices of Norton Sound streams unless noted
otherwise, 1990–2013. .................................................................................................................................. 98 A18 Combined aerial survey numbers of chum, pink, coho, and Chinook salmon for Norton Sound, 1990–
2013. ............................................................................................................................................................ 102 A19 Total escapement for chum, pink, coho, and Chinook salmon from weir and tower projects at Kwiniuk,
Niukluk, Nome, and Snake rivers, North River, Eldorado River. ............................................................... 103 A20 Total escapement and catch for chum, pink, coho, and Chinook salmon for Norton Sound District,
1995–2013. .................................................................................................................................................. 104 A21 Nome Subdistrict chum salmon estimated escapement, 1999–2013. .......................................................... 105 A22 Historical escapement of salmon and Dolly Varden at Eldorado River counting tower, 1997–2002 and
weir, 2003–2013. ......................................................................................................................................... 107 A23 Historical escapement of salmon and Dolly Varden at Snake River counting tower, 1995–2002 and
weir 2003–2013. .......................................................................................................................................... 108 A24 Historical salmon escapement at Kwiniuk River counting tower, 1990–2013. ........................................... 109 A25 Historical salmon escapement at Niukluk River counting tower, 1995–2012. ............................................ 110 A26 Historical salmon escapement at Nome River counting tower, 1993–1995, and weir, 1996–2013. ........... 110 A27 Salmon escapement at Solomon River weir, 2013. ..................................................................................... 111 A28 Historical sockeye salmon escapement at Glacial Lake weir, 2000–2013. ................................................. 111 A29 Historical salmon escapement at Inglutalik River counting tower, 2011–2013. ......................................... 112 A30 Historical salmon escapement at North River counting tower, 1996–2013. ............................................... 112 A31 Historical salmon escapement at Unalakleet River weir, 2010–2013. ........................................................ 112 A32 Chum salmon escapement by river, Nome Subdistrict, 1993–2013. ........................................................... 113 A33 Pink salmon escapement by year and river, Nome Subdistrict, 1993–2013. ............................................... 114 A34 Number of customary trade permits issued, Norton Sound District and Port Clarence District, 2007–
2013. ............................................................................................................................................................ 115 B1 Comparative sockeye salmon aerial survey indices, Port Clarence District, 1990–2013. ........................... 118 B2 Historical escapement of salmon and Dolly Varden at Pilgrim River counting tower, 1997–2002 and
weir 2003–2013. .......................................................................................................................................... 119 B3 Estimated number of subsistence fishing families and harvest in Port Clarence District, 1994–2013. ....... 120 B4 Application of 20-05-00 liquid blend of phosphorous and nitrogen fertilizer to Salmon Lake, 1997–
2013. ............................................................................................................................................................ 121 C1 Kotzebue District chum salmon catch statistics, 1990–2013. ..................................................................... 124 C2 Kotzebue District chum salmon type of processing and weights, 1990–2013. ........................................... 125 C3 Kotzebue District mean prices paid per pound in dollars to salmon fishermen by species, 1990–2013. .... 126 C4 Kotzebue District commercial fishery dollar value estimates, 1990–2013. ................................................ 127 C5 Kotzebue District commercial and subsistence salmon catches, 1990–2004 and 2012–2013..................... 128 C6 Kotzebue District subsistence chum salmon catches by village, 1990–2004 and 2012–2013. ................... 129
vi
LIST OF APPENDICES (Continued) Appendix Page
C7 Kotzebue District average subsistence chum salmon harvest per household by village, 1990–2004 and 2012–2013. .................................................................................................................................................. 130
C8 Kotzebue District chum salmon aerial survey counts, 1990–2009. ............................................................. 131 C9 Kobuk River chum salmon drift test fish cumulative catch per unit effort, 2007–2013. ............................. 133 D1 Norton Sound herring and spawn-on-kelp harvests by U.S. commercial fishermen, 1990–2013. .............. 136 D2 Commercial herring fishery summary information, Norton Sound District, 1990–2013. ........................... 137 D3 Norton Sound commercial herring harvest by subdistrict, by year, 1990–2013. ......................................... 138 D4 Port Clarence District commercial herring fishery, 1986–1996. ................................................................. 139 D5 Norton Sound herring age class composition by percentage of commercial catch, commercial gear
combined, 1987–1993. ................................................................................................................................ 140 D6 Norton Sound herring age class composition by percentage of commercial catch, commercial gear
combined, 1994–1999. ................................................................................................................................ 141 D7 Norton Sound herring age class composition by percentage of commercial catch, commercial gear
combined, 2000–2006. ................................................................................................................................ 142 D8 Norton Sound herring age class composition by percentage of commercial catch, commercial gear,
2013. ............................................................................................................................................................ 143 D9 Norton Sound herring age class composition by percentage of total catch, variable mesh gillnets, 1987–
1992. ............................................................................................................................................................ 144 D10 Norton Sound herring age class composition by percentage of total catch, variable mesh gillnets, 1993–
1998. ............................................................................................................................................................ 145 D11 Norton Sound herring age class composition by percentage of total catch, variable mesh gillnets, 1999–
2004. ............................................................................................................................................................ 146 D12 Norton Sound herring age class composition by percentage of total catch, variable mesh gillnets, 2005–
2012. ............................................................................................................................................................ 147 D13 Norton Sound Pacific herring age composition comparison of the 2013 variable mesh gear and the
projected age composition of the 2014 return. ............................................................................................ 148 E1 Historical commercial summer harvest of red king crab from Norton Sound Section, Eastern Bering
Sea, by statistical areas, 1990–2013 ............................................................................................................ 150 E2 The results of the population assessment surveys conducted for red king crab in Norton Sound since
1976. ............................................................................................................................................................ 153 E3 Historical summer commercial red king crab fishery economic performance, Norton Sound Section,
Eastern Bering Sea, 1990–2013. ................................................................................................................. 154 E4 Average length and percentage of recruit and postrecruit male red king crab from summer commercial
fishery catch samples in Norton Sound Section, Eastern Bering Sea, 1990–2013. ..................................... 156 E5 Winter commercial and subsistence red king crab harvests, Norton Sound, Eastern Bering Sea, 1990–
2013. ............................................................................................................................................................ 157 E6 Summer subsistence red king crab harvests, Norton Sound, Eastern Bering Sea, 2004–2013. ................... 158 E7 Number of crab pots lost during the subsistence and commercial winter crab fisheries, and ADF&G
winter studies, 2006–2013. .......................................................................................................................... 159 E8 Size composition by percent of red king crab from winter research pots near Nome, Norton Sound,
Eastern Bering Sea, 1990–2012. ................................................................................................................. 160 E9 Current and historical catch performance for the Norton Sound summer commercial crab fishery,
2008–2013. .................................................................................................................................................. 161 E10 Norton Sound crab exvessel value and fishery price per pound, 1994–2013. ............................................. 162 E11 Closed water regulations in effect for the Norton Sound summer commercial crab fishery, with dotted
line showing temporary boundaries for 2013 fishery only. ......................................................................... 163 E12 The percent of crab harvested during the Norton Sound summer commercial red king crab fishery east
of 164º west longitude, 1990–2013. ............................................................................................................ 164 E13 Norton Sound male red king crab size distribution from trawl assessment surveys conducted by the
National Marine Fisheries Service in 1991, and by ADF&G in 1996, 1999, and 2002. ............................. 165 E14 Norton Sound male red king crab size distribution from trawl assessment surveys conducted by
ADF&G in 2006, 2008, and 2011. .............................................................................................................. 166
vii

LIST OF APPENDICES (Continued) Appendix Page E15 Length composition of Norton Sound red king crab summer commercial harvests, 1990–1994. ............... 167 E16 Length composition of Norton Sound red king crab summer commercial harvests, 1995–1998. ............... 168 E17 Length composition of Norton Sound red king crab summer commercial harvests, 1999–2002. ............... 169 E18 Length composition of Norton Sound red king crab summer commercial harvests, 2003–2006. ............... 170 E19 Length composition of Norton Sound red king crab summer commercial harvests, 2007–2010. ............... 171 E20 Length composition of Norton Sound red king crab summer commercial harvests, 2011–2013. ............... 172 F1 Kotzebue District winter commercial sheefish harvest statistics, 1990–2013. ............................................ 174 F2 Kotzebue District reported subsistence harvests of sheefish, 1991–2004 and 2012–2013. ......................... 175 F3 Non-salmon sport fish harvests in Norton Sound and Kotzebue/Chukchi Sea, 1990–2013. ....................... 176 F4 Kotzebue District incidentally caught and sold Dolly Varden during the commercial salmon fishery,
1990–2013. .................................................................................................................................................. 177 F5 Subsistence harvests of Dolly Varden from the villages of Kivalina and Noatak, 1991–2013. .................. 178 F6 Dolly Varden sport fish harvests in Norton Sound, by river, 1990–2013. .................................................. 179 F7 Aerial survey counts of overwintering and spawning Dolly Varden in the Kotzebue District, 1990–
2013. ............................................................................................................................................................ 180 F8 Subsistence whitefish catch and effort in the Kotzebue District, 1991–1993, 1997–2004, and 2012–
2013. ............................................................................................................................................................ 181 F9 Norton Sound District winter commercial whitefish harvest statistics, 2007–2013. ................................... 182 F10 Norton Sound District winter commercial saffron cod harvest statistics, 1994–1995 and 2010–2013. ...... 182 G1 List of common and scientific names of finfish species of the Norton Sound, Port Clarence, Kotzebue
and Arctic Districts. ..................................................................................................................................... 184 G2 Alaska Department of Fish and Game and associated cooperative studies conducted within the Norton
Sound, Port Clarence, Kotzebue, and Arctic Districts, 2013. ...................................................................... 185 G3 Commercial processors and buyers operating in Norton Sound and Kotzebue Sound, 2013. ..................... 188 G4 Unalakleet subsistence salmon harvest survey form, 2013. ........................................................................ 189 G5 Shaktoolik subsistence salmon harvest survey form, 2013. ........................................................................ 190 G6 Koyuk Subdistrict subsistence salmon harvest survey form, 2013.............................................................. 191 G7 Emergency Orders issued during 2013. ....................................................................................................... 192 H1 Commercial freshwater finfish harvest and sales, Colville River, Arctic Area, 1990–2007. ...................... 228
viii

ABSTRACT This report provides information about the 2013 commercial and subsistence fisheries of Norton Sound-Port Clarence and Arctic-Kotzebue management areas of the Arctic-Yukon-Kuskokwim Region of the Alaska Department of Fish and Game, Division of Commercial Fisheries. The management areas consist of all waters from Point Romanof north of the Yukon River and west of 141 degrees W longitude and those waters draining into the Bering Sea north of Yukon River; the Chukchi Sea, Beaufort Sea and Arctic Ocean. Commercial and subsistence fisheries target 5 species of salmon (Chinook Oncorhynchus tshawytscha, sockeye O. nerka, chum O. keta, coho O. kisutch, and pink O. gorbuscha salmon), Pacific herring Clupea pallasii, red king crab Paralithodes camtschaticus, and miscellaneous species such as inconnu (sheefish) Stenodus leucichthys, whitefish Coregonus laurettae, Dolly Varden Salvelinus malma, saffron cod Eleginus gracilis, and capelin Mallotus villosus.
Key words: Norton Sound, Port Clarence, Kotzebue Sound, Arctic, subsistence, commercial fishery, management, escapement, salmon, Chinook salmon Oncorhynchus tshawytscha, chum salmon Oncorhynchus keta, coho salmon Oncorhynchus kisutch, pink salmon Oncorhynchus gorbuscha, sockeye (red) salmon Oncorhynchus nerka, red king crab Paralithodes camtschaticus, Pacific herring Clupea pallasii, inconnu sheefish Stenodus leucichthys, whitefish Coregonus laurettae, Coregonus pidschian, Coregonus sardinella, Coregonus nasus, Dolly Varden Salvelinus malma, saffron cod Eleginus gracilis, Annual Management Report (AMR), Fishery Management Report (FMR).
INTRODUCTION This report summarizes the 2013 season and historical information concerning management of the commercial and subsistence fisheries of Norton Sound-Port Clarence, Arctic-Kotzebue management areas of the Arctic-Yukon-Kuskokwim Region. Data from select management and research projects are included in this report. A more complete documentation of project results is presented in separate reports. Historical harvest and escapement information in this report goes back to 1990. For information prior to 1990 see Menard et al. 2013.
Data presented in this report supersede information found in previous management reports. An attempt has been made to correct errors present in earlier reports. Previously unreported data were included and are indicated by appropriate footnotes. Current-year catch data presented were derived from seasonal field data.
This report is organized into the following major sections:
1) Management Area Overviews2) Salmon Fisheries3) Pacific Herring Fisheries4) King Crab Fisheries5) Miscellaneous Species
Tabular data have been separated into 2 categories to facilitate use of this report: 1) Tables 1–13 present annual data, and 2) Appendices generally present historical comparisons. Not all appendices are cited in the text, and those that are cited are not necessarily cited in order.
1

SECTION 1: MANAGEMENT AREA OVERVIEWS
BOUNDARIES Norton Sound-Port Clarence Area and Arctic-Kotzebue Area include all waters from Point Romanof in southern Norton Sound and St. Lawrence Island and west of 141 degrees W longitude, to the U.S.-Canada border (Figure 1). This area encompasses over 100,000 mi², and has a coastline exceeding that of California, Oregon, and Washington combined. For crab management the southern boundary is Cape Romanzof.
Figure 1.–Norton Sound, Port Clarence, Kotzebue Sound, and Arctic management districts.
SALMON OVERVIEW There are 5 species of Pacific salmon indigenous to the area; however, chum Oncorhynchus keta and pink salmon O. gorbuscha historically are the most abundant. Chum and Chinook (king) salmon O. tshawytscha are found as far north as Barrow, but they are less common north of the Kotzebue Sound drainages. The northernmost large concentrations of chum salmon are found
2

within Kotzebue Sound drainages, but large numbers of Chinook and coho O. kisutch salmon are not found north of Norton Sound. Small sockeye (red) salmon O. nerka populations exist within a few Southern Seward Peninsula drainages. Pink salmon have been observed by aerial survey in increasing numbers in rivers north of Point Hope to Barrow. Small numbers of chum, pink, sockeye, and Chinook salmon have been reported by subsistence fishermen along the Arctic coast.
COMMERCIAL SALMON FISHERY In 1959 and 1960, Alaska Department of Fish and Game (ADF&G) biologists conducted resource inventories that indicated harvestable surpluses of salmon were available in several river systems of Norton Sound, Port Clarence, and Kotzebue districts. Historically, ADF&G has supported liberalizing various regulations by encouraging processors to explore and develop new fishing grounds since statehood. As a result, commercial salmon fishing activity grew significantly in the region and enabled some local residents to obtain cash income.
Currently, most commercial fishermen and many buying station workers are resident Native Alaskans (Yupik, Inupiat, and Siberian Yupik). Commercial fishermen operate set gillnets from outboard powered skiffs, and all commercial caught salmon are harvested in coastal marine waters.
There is no commercial salmon fishery in the Arctic District.
SUBSISTENCE SALMON FISHERY There are approximately 23,000 people in the area, the majority of whom are Native Alaskans residing in more than 40 small villages scattered along the coast and major river systems. Nearly all local residents are dependent to varying degrees on fish and game resources for their livelihoods.
Subsistence fishermen operate gillnets or seines in the main rivers and to a lesser extent in coastal marine waters to harvest salmon. Beach seines are used to catch schooling or spawning salmon and other species of fish. The major portion of fish taken during summer months is air-dried or smoked for later consumption by residents or occasionally their dogs.
Historical subsistence harvest information is discontinuous. Prior to 1960, subsistence data are either incomplete or entirely lacking. From the early 1960s until 1982, ADF&G conducted annual household surveys in communities with major salmon fisheries. In 1983, budgetary restrictions made it impossible to conduct surveys in each Norton Sound village, so surveys in many areas were suspended until 1994, when ADF&G initiated a new annual postseason household subsistence salmon harvest survey program. This program was also cut after the 2003 season in Norton Sound and after 2004 in Kotzebue Sound due to budget constraints. However, expansion of subsistence salmon permits in 2004 to Port Clarence District (affecting the communities of Teller and Brevig Mission), and Norton Sound Subdistricts 2 and 3 (affecting the communities of Council, White Mountain, Golovin, and Moses Point/Elim) has resulted in fewer household surveys because subsistence harvests for those communities are now reported through subsistence permits.
Also, in 2004, the Division of Commercial Fisheries began doing subsistence salmon household surveys annually in Shaktoolik and Unalakleet (and in Koyuk starting in 2008) and in other southern Norton Sound villages periodically. Surveyors attempt to contact all households.
3

ADF&G staff members use a community household list and each year update any new households and delete those no longer there. Salmon survey data are expanded to include those households that usually fish but ADF&G was unable to contact.
Prior to the fishing season, ADF&G personnel usually make one visit to each village to issue subsistence salmon fishing permits. Villagers can also call the Nome office toll free, and a permit will be mailed or faxed when possible. Village residents are able to mail completed permits to the Nome office postage free. Attempts are made to contact, by phone or letter, all permit holders who did not return their household permit. Also, trips to villages are made postseason by ADF&G personnel to collect permits and discuss the fishing season.
In 2008, a cooperative project was initiated and is ongoing (ADF&G Divisions of Commercial Fisheries, Habitat, and Subsistence; and North Slope Borough Department Wildlife Management and Planning) to assess Pacific salmon resources in the Arctic District. Components of the project include 1) documenting subsistence salmon fishing patterns such as species targeted, fishing gear and methods, harvest timing, local salmon abundance and run timing, historical knowledge, and observations of spawning locations; 2) conducting aerial surveys to document adult salmon distribution in river systems and determine which rivers could be used as index areas for future monitoring; and 3) acquiring age, sex, length and genetic samples for salmon.
SALMON MANAGEMENT The Division of Commercial Fisheries of ADF&G is responsible for management of commercial and subsistence fisheries in this vast area. Permanent full-time staff assigned to this area during 2013 consisted of an Area Management Biologist, an Assistant Area Management Biologist, a Research Biologist, and a Fish and Game Program Technician stationed in the Nome office. In addition, seasonal assistance in conducting various management and research activities was provided by approximately 20 seasonal biologists and technicians in Norton Sound, Port Clarence, and Kotzebue Sound. Biologists from regional staff provided additional assistance. In 2013, interns funded by Norton Sound Economic Development Corporation (NSEDC) were utilized as fisheries technicians at some projects. There are 5 cooperative projects staffed by NSEDC and 2 projects jointly operated by NSEDC and ADF&G in Norton Sound that supplemented salmon escapement monitoring activities of area staff.
The main objective of ADF&G’s program is to manage commercial and subsistence salmon fisheries on a sustained yield basis. Field projects are conducted to provide information on salmon abundance, migration, and stock composition. Summaries of ADF&G and NSEDC projects are presented in Appendix G2.
Management of salmon fisheries is complicated by insufficient comparative catch and return information and difficulties in obtaining accurate escapement data. Management difficulties are compounded by the need to provide not only for adequate escapements, but also for the needs of several different user groups. Alaska law requires subsistence users to receive priority over other users of fish and wildlife resources. If subsistence harvest increases, commercial fishing and sport fishing may be restricted.
The cornerstone regulation that governs commercial salmon harvest in all districts is the scheduled weekly fishing period. Commercial salmon fishing regulations allow for variable fishing periods per week during the open season depending on area and season differences. ADF&G attempts to distribute fishing effort throughout the entire return to avoid harvesting only
4

particular segments of the run. Occasionally, fishing time is increased or decreased by emergency order. Emergency orders issued in 2013 are listed in Appendix G9. Managers issue these orders depending upon fishing conditions and strength of runs or spawning escapements, as determined by evaluation of available run timing and abundance indicators. Weekly fishery reports with fishery status and schedules are broadcast during the fishing season over radio stations KICY and KNOM in Nome, and fishery news articles are published in the Nome Nugget and Arctic Sounder.
NORTON SOUND SALMON OVERVIEW DISTRICT BOUNDARIES Norton Sound Salmon District consists of all waters between Cape Douglas in the north and Point Romanof in the south. The district is divided into 6 subdistricts and corresponding statistical areas: Subdistrict 1, Nome (333-10); Subdistrict 2, Golovin (333-20); Subdistrict 3, Elim (333-31, 32, 33); Subdistrict 4, Norton Bay (333-40); Subdistrict 5, Shaktoolik (333-50); and Subdistrict 6, Unalakleet (333-60). The subdistrict and statistical area boundaries were established to facilitate management of individual salmon stocks, and each subdistrict contains at least 1 major salmon-producing stream (Figure 2).
Figure 2.–Norton Sound commercial salmon fishing subdistricts.
All commercial salmon fishing in the district is by set gillnets in marine waters; however, fishing effort is usually concentrated near river mouths. Commercial fishing typically begins in June and targets Chinook salmon if sufficient run strength exists. Emphasis switches to chum salmon in July and the coho salmon fishery begins the fourth week of July and closes in September. Pink salmon are much more abundant in even-numbered year returns. A pink salmon directed fishery may coincide with or may be scheduled to alternate periods with the historical chum salmon directed fishery.
5

Salmon management had changed significantly since the mid-1990s because of limited market conditions and marginal returns of several salmon stocks within the district; however, rebounding salmon returns in the mid-2000s resulted in renewed buyer interest. There had been no commercial interest in pink salmon from 2000 to 2006, but beginning in 2007 there was some commercial fishing to harvest a small portion of the pink salmon run. Also, since 2007 there has been renewed buyer interest in Golovin and Elim Subdistricts and since 2008 in Norton Bay Subdistrict. Commercial fishery managers use estimates of run strength from escapement counting projects, test fishing, aerial surveys, and commercial fishing indexes. Nome Subdistrict is managed intensively for subsistence use: Tier II chum salmon subsistence permits, registration permits, closed waters, setting fishing period length, limiting gear, and harvest limits are all tools that can be employed throughout the season to provide for escapement needs and to maximize subsistence opportunity.
HISTORICAL FISHERY USE Archeological evidence dating back 2,000 years indicates fishing has been a part of life for Norton Sound residents for many centuries (Bockstoce 1979). The largest precontact settlements on the Bering Strait Islands and the western Seward Peninsula were located where marine mammals were the primary subsistence resource. The rest of the region’s population lived in small groups scattered along the coast, often moving seasonally to access fish and wildlife resources (Thomas 1982). During summer months, residents would usually disperse in groups composed of 1 or 2 families and set up camps near the mouths of streams. Harvest levels of fish on any 1 stream were relatively small because of low concentrations of people who caught only what their families and 1 or 2 dogs needed through the winter (Thomas 1982).
A large-scale fur trade was developed by the Russians in the late 1800s and continued after the American purchase (Magdanz and Punguk 1981). These activities and support for hundreds of commercial whalers and trading ships caused trading to increase in the region around 1848 (Ray 1975). Increased competition for walrus, caribou, and other species from outsiders may have increased the importance of salmon to area residents (Magdanz and Punguk 1981). In the late 1890s, gold was discovered on the Seward Peninsula and boom towns sprang up with thousands of new immigrants flocking to the region. Commerce and the establishment of missions drew people to central year-round communities.
Mining affected fish populations significantly. Nearly every stream on the Seward Peninsula has had some sort of mining operation, ranging from simple gold panning or sluice boxes to hydraulic giants or bucket-line dredges. One example of extensive impact is the Solomon River, which is only 30 miles long but had 13 dredges working at one time. Another obvious impact was the large number of people who came to live in the region between 1900 and 1930. Communities like Nome, which had a population of 30,000, and Council, which had 10,000 residents, did not exist before gold was discovered.
In the late nineteenth century the size of dog teams increased from 2 or 3 to as many as 10 to 20. At about the same time, wooden boats began to replace kayaks (Thomas 1982). Consequently, the demand for dried fish to feed the dog teams increased with the development of better means to harvest fish. Winter transportation throughout the region was hired dog teams and drivers who carried mail or freight along the coast and across the state to the ice-free port at Seward. Dried fish, primarily chum and pink salmon, became a major barter item in response to the increased demand for dog food (Thomas 1982).
6

Local residents spent most of their summers catching and drying large amounts of salmon, some of which they kept for themselves; the rest they bartered or sold to mining camps, roadhouses, and trading posts or stores. For example, the Haycock mining camp on the Koyuk River bought about 2 tons of dried fish each year. Roadhouses were located at Golovin, Walla Walla, Moses Point, Isaac’s Point, Ungalik, Robertvale, Foothills (south of Shaktoolik), Egavik, and other locations. Dried fish was bought in units of bundles (50 dried fish tied together) at a typical price of $0.10 per lb from the fishermen. One elder in the area thought fishermen retained more fish for their own use, which may have averaged 5 to 10 bundles per household, compared to the amount sold (Thomas 1982).
The number of people gradually decreased over the next 20 years after the gold rush and the gold deposits were worked out. The number of dog teams diminished by the mid-1930s when mail planes and mechanical tractors were introduced, and the last dog-team mail contract ended in 1962 at Savoonga. However, local stores continued to trade and barter in dry fish at Shaktoolik, St. Michael, Unalakleet, and Golovin. An example of quantity was the 8x20x40-foot cache at the Shaktoolik store filled to the top with dry fish. One elder said the stores would buy the fish for $0.06 per lb and then sell them for $0.10 per lb or their equivalent in groceries and supplies (Thomas 1982). By the early 1960s, commercial salmon fishing developed into a source of summer cash and snow machines were replacing the need for dog teams. The use of dry fish to feed dogs decreased and cash became more available for exchange at stores.
COMMERCIAL FISHERY OVERVIEW Commercial salmon fishing in Norton Sound District began in Shaktoolik and Unalakleet Subdistricts in 1961. Most early interest involved Chinook and coho salmon flown in dressed condition to Anchorage for further processing. A single U.S. freezer ship purchased and processed chum and pink salmon during 1961. In 1962, two floating cannery ships operated in the district and commercial fishing was extended into Norton Bay, Moses Point, and Golovin. The peak in salmon canning operations occurred in 1963.
Since then, markets have been sporadic and some subdistricts have often been unable to attract buyers for entire seasons. A joint venture between KEG (Koyuk–Elim–Golovin) Fisheries and NPL Alaska, Inc. operated from 1984 until midseason in 1988. Two Japanese freezer ships were permitted to buy directly from domestic fishermen limited to salmon caught in the internal waters of Golovnin and Norton Bays. The most consistent markets are at Shaktoolik and Unalakleet, and onshore processing occurs at Unalakleet. Appendix G3 provides a list of commercial processors and buyers that operated in Norton Sound and Kotzebue Sound in 2013. The commercial salmon fishing season usually opens by emergency order between June 8 and July 1 but depends on run timing within each subdistrict. The season closes by regulation on August 31 in Subdistricts 1, 2, and 3, and on September 7 in Subdistricts 4, 5, and 6, but processors often terminated their operations before regulatory closure dates in the past. However, during recent years Norton Sound Seafood Products (NSSP) has remained operational until the regulatory fishing season closure. Commercial fishing periods are set by emergency order. No commercial salmon fishing periods occurred in the Nome Subdistrict 1997–2012 because of regulatory restrictions on chum salmon, lack of buyer interest, or weak runs. In 2013, limited commercial fishing occurred for chum and pink salmon (Appendix A6).
Commercial fishing gear is restricted to gillnets. A maximum aggregate length of 100 fathoms is allowed for each fisherman and there are no depth restrictions. However, mesh size is often
7

restricted in an attempt to direct harvest toward a specific species of salmon. Fishing periods restricted to 6.0 in and smaller mesh gillnets are used to target chum and coho salmon. Most gillnets fished are approximately 5.875-inch stretched mesh. In Unalakleet and Shaktoolik Subdistricts, 8.25-inch stretched mesh gillnets are commonly used if there are Chinook salmon fishing periods in June through early July. During years when large pink salmon runs occur and there is a buyer, ADF&G establishes fishing periods allowing only 4.5-inch mesh or less to be used. These special small-mesh periods are an attempt to target pink salmon while reducing harvest of larger sized salmon species.
COMMERCIAL FISHERY MANAGEMENT Norton Sound District is managed on comparative commercial catch data, escapements, and weather conditions. A combination of factors are considered before managers issue emergency orders affecting seasons, fishing periods, allowable mesh size, and fishing areas.
Aerial surveys are used to monitor escapements in most Norton Sound streams. Weather conditions, time of day, type of aircraft, water and bottom conditions, date of survey, and efficiency of surveyor and pilot must be taken into account when making interannual aerial survey comparisons. Counting towers and weirs are a more consistent and accurate method of obtaining migration information and have been utilized on several river systems in Norton Sound. In 2013, there were 3 counting towers and 7 weirs in operation. One sonar project was operated on the Shaktoolik River, but the project was still in development and was not used for inseason management.
Early management emphasis is on Chinook salmon switching to chum salmon around July 1, and then gradually shifting to coho salmon during the fourth week in July. Pink salmon are abundant during even-numbered years, but often no buyer is available for this species except as incidentally caught fish when there are other salmon directed fisheries. Coho salmon catches have remained fairly stable in recent years, although they have dropped from the record levels seen in Norton Sound in the mid-2000s. Chum salmon catches have been rebounding in recent years. Management actions have consisted of a series of emergency orders that open and close fishing seasons and periods and establish gillnet mesh size specifications.
Commercial fisheries in Golovin and Elim Subdistricts have targeted chum salmon and during even-numbered years pink salmon in June and July, and coho salmon in late July and August. Commercial chum salmon harvests have dropped dramatically since the mid-1980s. Poor chum salmon runs resulted in restrictive management actions during the late 1990s and early 2000s, but in the mid-2000s there was little market interest even as runs began to rebound. However, continued improving chum salmon runs in the late 2000s in Norton Sound has sparked renewed buyer interest in the northern subdistricts.
Little or no commercial salmon harvest had occurred in Nome and Norton Bay Subdistricts since the early 1980s. Nome Subdistrict has had very depressed chum salmon stocks that, until the mid-2000s, had required closure or severe restrictions of the subsistence fishery. Although salmon runs have improved greatly with record runs of pink and coho salmon in recent years and the best chum salmon runs since the 1980s, Nome Subdistrict had been unable to attract a buyer for pink and coho salmon until recently and was closed to commercial chum salmon fishing by regulation until 2013. The Norton Bay Subdistrict often has healthy stocks, but it had been unable to attract markets willing to operate in this remote area until recently. Since 2008, improving market conditions resulted in NSSP bringing more tenders to the subdistrict, and
8

commercial salmon fishing has resumed in Norton Bay. Commercial salmon harvest for Norton Sound in 2013 by subdistrict is listed in Table 1.
SUBSISTENCE FISHERY OVERVIEW Norton Sound District subsistence salmon harvest surveys have been conducted sporadically since statehood. From 1994 through 2003, ADF&G conducted an annual subsistence postseason salmon harvest assessment effort in northwest Alaska to provide more extensive, complete, and reliable salmon harvest estimates than had previously existed. These household subsistence harvest surveys were primarily funded by ADF&G Division of Commercial Fisheries and were conducted by the Division of Subsistence during the fall in 8 villages (Brevig Mission, Teller, Golovin, White Mountain, Elim, Koyuk, Shaktoolik, and Unalakleet). In 2004, surveys were replaced by permits in most of northern Norton Sound. Over the last 10 years in Norton Sound Subdistricts 1–6 (2003–2012), the average subsistence harvest was 70,149 salmon, with the majority being pink salmon (Appendix A13). However, from 2004 to 2007, the village of Koyuk was not surveyed, and therefore no harvest data from Norton Bay Subdistrict are included for those years.
Two goals of the postseason household subsistence survey are to collect harvest data to estimate subsistence salmon catch by species and community, and to compile information on gear types, participation rates, sharing, use of salmon for dog food, and household size. A copy of the Norton Sound subsistence salmon harvest survey form is shown by village in Appendices G4–G6.
In 2004, ADF&G’s subsistence salmon harvest assessment program changed substantially when household surveys were discontinued in most communities because the household subsistence permit system was expanded from Nome to include Port Clarence District (affecting the communities of Teller and Brevig Mission) and Norton Sound Subdistricts 2 and 3 (affecting the communities of Council, White Mountain, Golovin, and Elim). Thereafter, subsistence salmon harvest for those communities are reported totals from subsistence permits, so household surveys have not been necessary. Permits issued at the Nome office, and by ADF&G personnel in the field, identify gear restrictions, bag limits, subsistence zones (for Subdistrict 1, Salmon Lake and Pilgrim River only), location and access descriptions, and subsistence regulations for each location or body of water. In addition, the permit contains a catch calendar for household members to record gear type used, area fished, and catch in numbers by species for each day fished. If subsistence fishermen reach their harvest limit in one river, they can fish in other rivers until they reach the limit in those rivers. Subsistence permits are important to management because they identify users, fishing effort, harvests, and limits. Subsistence salmon harvests for the current year in northern Norton Sound are listed in Table 2.
In Subdistrict 1 (Nome), low salmon stock levels combined with a large concentration of users has required subsistence fishing permits since 1975. By regulation, permits with catch calendars are issued to each requesting household listing all Nome Subdistrict fishing locations, catch limits, and gear restrictions. After the fishing season, households are required to return the completed permit to ADF&G, whether or not they actually fished. Due to the subsistence permit program, all subsistence salmon catches from Norton Sound Subdistrict 1 have been determined from returned permits since 1975. However, not all fishermen obtained or returned permits from 1975 to 2003, and the data were not expanded for unreturned permits because the assumption was that those permit holders did not fish. Beginning in 2004, stricter enforcement of regulations
9

including fines for failure to return a permit resulted in nearly 99% of all permits issued being returned, and since 2010, all subsistence salmon permits issued have been returned or permit holders have reported catches in person, by telephone, or by email.
Norton Bay, Shaktoolik, and Unalakleet Subdistricts have continued to be surveyed postseason by household interviews. Additionally, daily surveys of Unalakleet River and ocean subsistence fishermen have been conducted annually during the Chinook salmon run since 1985. Although total harvests by subsistence fishermen were not documented, effort and catch information were used to judge timing and magnitude of the Chinook salmon return. The commercial fishery is delayed until it becomes apparent subsistence needs are being met and Chinook salmon are beginning their upstream migration as indicated by ADF&G test net in lower Unalakleet River.
HISTORICAL REGULATORY ACTIONS IN NORTON SOUND SUBDISTRICTS Nome Subdistrict (Subdistrict 1) has been the focus of most regulatory actions within the Norton Sound District since the 1970s. Although pink salmon are usually the most abundant species of salmon in Nome Subdistrict streams, the commercial fishery primarily targeted chum salmon during the 1970s. Relatively large chum salmon catches in this subdistrict in conjunction with weak local abundance implied the fishery may have intercepted nonlocal stocks. A 1978–1979 Norton Sound stock separation study (Gaudet and Schaefer 1982) showed that some salmon tagged near Nome were recaptured in fisheries from Golovin (Subdistrict 2) to Kotzebue. In an attempt to provide for spawning requirements and to provide for an important subsistence fishery that targets local stocks, a commercial harvest guideline of 5,000–15,000 chum salmon was adopted as a regulation.
The Alaska Board of Fisheries (BOF), in response to an advisory committee petition, directed ADF&G to manage the Nome Subdistrict commercial fishery for optimal chum salmon escapement after poor chum salmon escapements during the 1982 and 1983 seasons. During 1984 fall BOF meetings, directives in practice that season became regulation. In response to public and advisory committee proposals, the following commercial fishery restrictions were adopted as regulations:
1) Salmon may be taken commercially only from July 1 through August 31.
2) Fishing periods were restricted to two 24-hour periods per week.
3) Waters west of Cape Nome were closed to commercial salmon fishing to allow for rebuilding of river stocks that supported the historical subsistence effort.
ADF&G was directed to allow a harvest at the lower end of the guideline harvest range of 5,000 to 15,000 chum salmon, as stipulated in regulation 5 AAC 04.360. In addition to these restrictions, a proposal to restrict sport fishery in Nome and Snake rivers was adopted in 1984 that allowed “a bag and possession limit of 15 salmon, other than Chinook salmon, of which only 5 could be chum and coho salmon, in combination.”
Subsistence permit limits in Nome and Snake rivers were restricted to 20 chum and 20 coho salmon. The remainder of the permit limit could be filled with salmon other than chum or coho salmon.
Even with these restrictive regulations in place, chum salmon escapement goals were difficult to attain. The 1987 fishing season experienced poor returns of both chum and pink salmon to Nome Subdistrict streams. Numerous management actions were made to curtail commercial fishing activities, and later, sport, personal use, and subsistence fishing were restricted. Even with such
10
drastic fishery restrictions, escapement goals for chum salmon were not attained during 1987 in Nome, Eldorado, Flambeau, Bonanza, Snake, and Solomon rivers. In response to this continuing trend of decreasing chum and pink salmon returns to Nome Subdistrict, several new regulations were adopted by BOF in 1987 restricting gillnet length and mesh size in the subsistence fishery. Beach seine use in specific waters in the subsistence fishery was also eliminated.
Beginning in 1991, no chum salmon harvests were allowed until escapement goals were likely to be met or conservative management actions were judged to be no longer effective. Regulation changes in 1992 affected the use of beach seines for subsistence fishing in Nome Subdistrict. Managers were given authority to permit subsistence harvest of chum or pink salmon by beach seine if escapement needs were likely to be met. In the past, beach seines were viewed as an overly effective means to harvest fish. However, since 1999, beach seines were used to harvest abundant species and allow live release of other species experiencing depressed runs.
Through a series of BOF-directed meetings, BOF concluded that the previous management plan did not provide adequate opportunity for all subsistence salmon users to supply their annual needs for chum salmon. Therefore, Nome Subdistrict was designated a Tier II subsistence chum salmon permit fishery during a special BOF meeting held in Nome, March 1999. Tier II permits are dispensed to individuals prioritized by fishing history and dependence and are based on projected harvestable surplus. As a result, ADF&G allowed 20 individuals who scored highest on the Tier II application process in 1999 to subsistence fish. The intent was to allow Tier II permit holders first priority over other subsistence users if only a small harvestable surplus of chum salmon returned. If the run was assessed to be strong, then the subsistence fishery would open to all Alaskan residents who obtain a Tier I permit and individual harvests would be restricted to prescribed bag limits. In addition, BOF established “closed waters” areas where no subsistence salmon fishing would be allowed at any time, to protect chum salmon on the spawning grounds, and placed existing chum salmon aerial survey escapement goals for 6 Nome Subdistrict streams into regulation. In 1999, due to poor chum salmon returns, ADF&G closed even the Tier II fishery, and in 2000, only 10 Tier II permits were issued.
During a BOF work session in September 2000, several Norton Sound District chum salmon stocks were determined to be stocks of concern based on the Policy for the Management of Sustainable Salmon Fisheries. Chum salmon in Nome Subdistrict were determined to be a stock of management concern, and chum salmon in Golovin and Elim Subdistricts were determined to be a stock of yield concern.
Based upon the stock of concern determinations, BOF made several changes to regulations for management of Norton Sound salmon. In January 2001, BOF repealed the existing biological escapement goals (BEG) in regulation and adopted optimal escapement goals (OEG) for chum salmon for 5 Norton Sound rivers. In the past, escapement goals were expressed as aerial survey counts of salmon. Aerial surveys do not count all salmon present but serve as an index to compare current and previous surveys. New OEGs are in actual number of fish and based on ADF&G escapement goal analysis (Clark 2001). For rivers where an escapement project (tower or weir) are operated, 4 of 5 OEGs were established. BOF established OEGs, by subdistrict, are as follows:
11

Nome Subdistrict (Subdistrict 1)
Snake River: 1,600–2,500 chum salmon Nome River: 2,900–4,300 chum salmon Eldorado River: 6,000–9,200 chum salmon
Elim Subdistrict (Subdistrict 3)
Kwiniuk River: 11,500–23,000 chum salmon Tubutulik River: 9,200–18,400 chum salmon
A chum salmon management plan for Nome Subdistrict (Subdistrict 1) and a salmon management plan for Golovin and Elim Subdistricts (Subdistricts 2 and 3) were adopted by BOF. Commercial chum salmon fishing in Nome Subdistrict was closed and the fishery may not be reopened again until the abundance of chum salmon has a harvestable surplus large enough to meet subsistence needs for 4 consecutive years.
ADF&G was given authority to establish subsistence gillnet mesh size restriction of 4.5 in or less by emergency order when necessary to conserve chum salmon in Subdistricts 1, 2, and 3. Also, the Cripple and Penny rivers were closed to subsistence fishing for chum salmon. In addition, BOF expanded legal gear for the subsistence fishery to include a line attached to a rod or pole, from Cape Espenburg on the northern Seward Peninsula along the coast to Bald Head (between Elim and Koyuk). Bald Head is the boundary between Subdistricts 3 and 4. Therefore, west of Cape Espenburg in the Kotzebue District, in Port Clarence District, and in Norton Sound District from Cape Douglas to Bald Head, hook and line became legal subsistence gear. Although hook and line can be used for subsistence fishing, sport fish methods and means requirements still apply to harvesting of fish (for example, no snagging of fish is allowed). Sport fish bag and possession limits, by species, as specified in regulation 5 AAC 70.022 also apply, except when fishing through ice or in the Nome Subdistrict subsistence areas designated for each river. However, fishermen cannot combine sport fish bag and possession limits with subsistence harvest permit limits.
In 2001, chum salmon runs began to improve in Nome Subdistrict and additional permits were issued in the Tier II chum salmon fishery. Beginning in 2004, BOF expanded the salmon subsistence permit requirement for the Norton Sound area to include all marine waters, and fresh waters flowing into marine waters from Cape Prince of Wales to Bald Head. This regulation required salmon permits to be issued in Brevig Mission, Teller, White Mountain, Golovin, and Elim in addition to Nome.
Improving chum salmon runs in Nome Subdistrict resulted in Tier II chum salmon fishery restrictions being suspended beginning in 2006. A permit is still required for subsistence salmon fishing, but there is no longer a Tier II fishery that restricts participation in subsistence fishing. In addition, the BOF allowed commercial chum salmon fishing beginning in 2013.
Regulatory actions were also undertaken in other subdistricts. Subdistricts 5 and 6 Chinook salmon were designated a stock of yield concern in 2004, and BOF continued this designation in 2007 and 2010. To increase Chinook salmon escapements, BOF also adopted a more conservative Subdistricts 5 and 6 King Salmon Management Plan (5 AAC 04.395) that was first implemented during the 2007 season. Under the new plan, commercial fishing directed at Chinook salmon can only occur if the midpoint of the North River tower SEG range is projected to be reached. Additionally, the plan directs ADF&G to provide escapement windows by
12

restricting subsistence gillnet fishing for salmon from mid-June to mid-July to two 48-hour fishing periods a week in marine waters, and two 36-hour fishing periods a week in Unalakleet River. Subsistence fishing time can only be liberalized if the department projects that the lower end of the SEG range will be achieved. If North River Chinook salmon passage is projected to fall short of the SEG, ADF&G is directed to close the Chinook salmon fishery.
PORT CLARENCE SALMON OVERVIEW DISTRICT BOUNDARIES Port Clarence District encompasses all waters from Cape Douglas north to Cape Prince of Wales including Salmon Lake and Pilgrim River drainages (Figure 3). Salmon, saffron cod Eleginus gracilis, whitefish, and herring Clupea pallasii are the major subsistence species.
Figure 3.–Port Clarence District. Note: Cross-hatched area on map shows location where commercial salmon fishing may be opened.
COMMERCIAL FISHERY OVERVIEW In contrast to Norton Sound District, commercial fishing has been limited in Port Clarence District. In 1966, a commercial salmon fishery was established in the Grantley Harbor/Tuksuk Channel area of the Port Clarence District, but the fishery that year yielded less than 2,300 combined chum, pink, and sockeye salmon (Menard et al. 2013). It was closed later that same season, due to small salmon runs and concerns from local residents about impacts to area subsistence salmon fisheries, and had remained closed until relatively recently. In the mid-2000s, there were large increases in sockeye salmon runs as well as positive results from an ADF&G
13

test fishery in 2006. Consequently, in 2007, the BOF reestablished by regulation a Port Clarence District commercial salmon fishery. The BOF also established an inriver run goal of at least 30,000 sockeye salmon as a trigger point to allow a commercial fishery. The 2007 fishery harvest was 1,152 sockeye salmon, and 3,183 chum salmon, whereas the 2008 fishery harvest was 89 sockeye salmon, 256 chum salmon, and 910 pink salmon (Menard et al. 2010). The 2008 commercial fishery was closed when the inriver goal of 30,000 sockeye salmon for Pilgrim River was projected to fall short. The commercial fishery has remained closed since 2009 because of poor runs of sockeye salmon.
SUBSISTENCE FISHERY OVERVIEW Salmon Lake, which empties into the Pilgrim River in the Port Clarence District, along with Glacial Lake in the northwestern portion of the Nome Subdistrict, supports the northernmost sockeye salmon populations of significant size in North America. Subsistence harvests of sockeye salmon in the Sinuk River, which drains Glacial Lake, have historically been low due to difficulties navigating this shallow, boulder-laden river. In contrast, sockeye salmon harvests in the Pilgrim River are much higher because it is more easily traveled and several beach seining and set gillnet fishing locations are accessible via the Kougarok Road (Nome–Taylor Highway) emanating from Nome. A traditional subsistence salmon fishery has probably occurred within this district for centuries; however, subsistence fishing has only been reported at Salmon Lake since the 1930s and monitored at the upper Pilgrim River since 1962. Data collected by ADF&G personnel showed most fishermen of Brevig Mission fish northern and northeastern sections of Port Clarence District, and Teller fishermen utilize Grantley Harbor and Tuksuk Channel. Interviews with local residents indicated substantial fishing effort within Agiapuk River.
Beginning in 2007, regulations allowed for cash sales of up to $200 worth of subsistence-taken finfish per household, per year, in the Norton Sound–Port Clarence Area only, and starting in 2013 the amount allowed was raised to $500. From 2007 to 2012, 5 or less customary trade finfish permits were issued per year. Sales in most years were confidential because less than 4 permits were issued (Appendix A34).
Village subsistence surveys were conducted annually by the Division of Commercial Fisheries until 1983 (Appendix B3). The Division of Subsistence conducted a partial survey of Brevig Mission in 1989 and conducted full-scale household surveys of both villages from 1994 to 2003. Since expansion of the subsistence salmon permit program in 2004, subsistence salmon harvests for residents of Teller and Brevig Mission have been determined from reported totals on permits.
Salmon Lake and Pilgrim River stocks have been fished by Nome residents in addition to residents of Brevig Mission and Teller for quite some time. To conserve declining sockeye salmon stocks, BOF adopted a regulation in 1972 to close Salmon Lake and its tributaries to subsistence salmon fishing from July 15 through August 31. However, because Pilgrim River is accessible from the road system there has been increased fishing effort from Nome area residents due to increased fishing restrictions in Nome Subdistrict beginning in the 1990s (Figure 4) and more so in the mid-2000s when there were record runs of sockeye salmon to Salmon Lake.
14

Brevig Mission
PortClarence
ImurukBasin
Teller
Sinuk
Ri ver
Crip
ple
Ri
ver
Snak
e Ri
ver
Nom
e R
iver
Eldor
ado
Rive
r
Solo
mon
R.
Niukluk R.
Fish R
iver
White Mountain
Salmon Lake
Pilgrim River
Kuzitrin
River
Amer
ican
R.
Agia
pu
k R.
Tisuk R.
Feather R.GlacialLake
Nome
Tel ler
Hwy.
NOME
Council
Nom
e
Council Road
N o m e - T a y
l o r
H w
y.
Kuzitrin L.
Imuruk L.
0 25 50 Miles
0 25 50 Kilometers
N
N O R T O N S O U N D
Figure 4.–Seward Peninsula with road-accessible waters.
From 1997 to 2001, ADF&G conducted a fertilization program at Salmon Lake, partially funded by NSEDC and the Bureau of Land Management (BLM) to restore sockeye salmon to historical levels by applying liquid fertilizer. However, ADF&G could not determine whether the method was effective and suspended fertilization in 2001. After impressive 2003 sockeye salmon returns, the project was reevaluated and fertilizer was applied at a reduced rate in 2004, stopped again in 2005 and 2006, restarted in 2007 by NSEDC, and has continued in subsequent years (Appendix B4).
KOTZEBUE SALMON OVERVIEW DISTRICT BOUNDARIES Kotzebue Sound District encompasses all waters from Point Hope to Cape Prince of Wales, including those waters draining into the Chukchi Sea (Figure 5). Salmon, saffron cod, whitefish, and herring are major subsistence species.
15

District Boundary
Kotzebue SoundKobuk
Shungnak
Buckland
Selawik
Noorvik
Kiana
AmblerKotzebue
Deering
KivalinaNoatak
Shishmaref
Pt. Hope
Wales
Figure 5.–Kotzebue Sound District, villages and subsistence fishing area.
COMMERCIAL FISHERY OVERVIEW Kotzebue Sound District supports the northernmost commercial salmon fishery in Alaska. Kotzebue Sound District is divided into 3 subdistricts. Subdistrict 1 has 6 statistical areas where commercial salmon fishing may occur (Figure 6).
The commercial fishery under state management opened in 1962. Salmon harvests consist primarily of chum salmon, although limited amounts of Dolly Varden and a few Chinook, sockeye, pink, and coho salmon are harvested during the salmon fishery.
Sikasuilaq Springs
16

Figure 6.–Kotzebue Sound commercial salmon fishing subdistricts and statistical areas.
The earliest documented sales of salmon in Kotzebue District were in 1909 when Lockhart’s store purchased 21,906 lb of salmon from local Native Alaskans and resold it at $0.05/lb. Of those sales, 21,366 lb were sold to gold miners on the Kobuk River drainage and 540 lb were sold to a company in Seattle. A commercial fishery occurred from 1914 to 1918. Salmon were canned and the bulk of the harvest is assumed to have been sold to miners who worked in the upper Kobuk River drainage. The next organized commercial fishery began under state management in 1962 and continues to the present. The current fishery became fully developed in the mid-1970s. The fishery displayed a gradually declining pattern of overall run strength with 4-year cycles of stronger returns followed by weaker returns (Appendix C1). In 1987, the fisheries managers’ new program emphasized attaining escapement goals. Before 1987, harvests were proportional to total return. Since 1995, poor market conditions and/or limited buyer capacity have caused harvests to fall short of their potential.
In 1981, a chum salmon hatchery was established at Sikasuilaq Springs, a tributary of Noatak River. The hatchery was closed in 1995 due to lack of funding support. At peak production in 1992, the hatchery incubated 11,100,000 eggs. An estimated peak adult hatchery return of 90,000 chum salmon occurred in 1997. The estimated contribution to the commercial fishery was unknown.
17

SUBSISTENCE FISHERY OVERVIEW Subsistence salmon fishing in Kotzebue Sound District continues to be important, but fish abundance and fishing activities vary from community to community. Along the Noatak and Kobuk rivers where chum salmon runs are strong, household subsistence activities in middle and late summer revolve around catching, drying, and storing salmon. In southern Kotzebue Sound, fewer salmon are taken for subsistence because of low availability. Some fishermen base their fishing effort out of their village, while others move seasonally to fish camps where they stay for several days to several weeks. The predominant species in the district is chum salmon, although small numbers of other salmon species are present.
Historical subsistence surveys for the Kotzebue area have been less complete than for Norton Sound and Port Clarence Districts. However, expanded documented surveys from 1995–2004 result in an estimated total subsistence salmon harvest for the Kotzebue Sound area to be 57,977 annually (Appendix C5). During these years, ADF&G Division of Subsistence (DOS) conducted annual household subsistence salmon surveys in select Kotzebue District communities. Due to budget constraints these surveys were discontinued in 2005 but were restarted in 2012, when comprehensive subsistence fish harvest data were again collected from Kotzebue area villages by DOS. The town of Kotzebue was surveyed in 1995–2001 using a mail-in postcard but has not been surveyed since.
ARCTIC SALMON OVERVIEW DISTRICT BOUNDARIES The Arctic District includes all waters of Alaska north of the latitude of the western most tip of Point Hope and west of 141 degrees W longitude, including those waters draining into the Chukchi Sea, Beaufort Sea, and Arctic Ocean (Figure 7).
SUBSISTENCE FISHERY OVERVIEW There are no commercial salmon fisheries in the Arctic District. Small numbers of chum, pink, and Chinook salmon have been reported by subsistence fishermen along the Arctic coast, with pink salmon being the most numerous and then chum salmon (Craig George, North Slope Borough, senior wildlife biologist, personal communication). Salmon are caught in gillnets as an incidental species when subsistence fishermen are targeting other non-salmon finfish. In October 2012, a fisherman caught 2 sockeye salmon in Ikroavik Lake, approximately 5 miles south of Barrow, subsistence fishing with gillnets under the ice targeting least cisco (Geoff Carroll, ADF&G, Barrow; personal communication). There are no reliable reports of coho salmon being caught.
18

Figure 7.–Arctic management district.
PACIFIC HERRING OVERVIEW DISTRICT BOUNDARIES Pacific herring Clupea pallasii are present in Norton Sound, Port Clarence, Kotzebue Sound, and Arctic Districts. Norton Sound Herring District consists of all state waters between the latitude of the westernmost tip of Cape Douglas and the latitude of Point Romanof (Figure 8). Port Clarence Herring District consists of all Alaska waters between the latitude of Cape Douglas and the latitude of Cape Prince of Wales. Kotzebue Sound Herring District consists of all Alaska waters between the latitude of Cape Prince of Wales and the latitude of Point Hope. The Arctic District does not have herring district boundaries in regulation.
SPAWNING AREAS AND TIMING Arrival of herring on the spawning grounds is greatly influenced by climate and oceanic conditions, particularly the extent of the Bering Sea ice pack. Most herring spawning populations appear near the eastern Bering Sea coast immediately after ice breakup between mid-May and mid-June. Spawning progresses in a northerly direction and may continue into July or August along portions of the Seward Peninsula or within the Chukchi Sea.
The largest abundance of herring in the Arctic-Yukon-Kuskokwim Region is in Norton Sound District. Primary spawning areas are from Stuart Island to Tolstoi Point. When sea ice has remained in this area into June, spawning has been more extensive along Cape Denbigh and locations along the northern shore of Norton Sound between Bald Head and Bluff. Additional northerly spawning areas have been more difficult to identify because of small herring stock
19

20
sizes and limited investigations. Likely spawning areas include Imuruk Basin in Port Clarence District, and Shishmaref Inlet, Deering–Kiwalik coast, and Hotham Inlet in Kotzebue District. Although subsistence herring catches have been reported in the Arctic District near Barrow, there is no information available on spawning areas.
Port ClarenceDistrict 332
KingIsland
CapeDouglas
Point Hope
Kotzebue SoundDistrict 331
Cape Prince of WalesDiomedeIslands
Sledge Island
Norton Sound District 333
RockyPoint
Nome Gol
ovin
Elim
CapeEspenburg
Kotzebue
Kivalina
Sheshalik
Seward Peninsula
Deering
Shishmaref
ChurchRock
StebbinsStuart Island
Canal Point Light
CapeDarby
Kwiniuk River
BesboroIsland
CapeDenbigh
Klikitarik
Egg Island
St. Michael
Selawik
Shaktoolik
UnalakleetSpruce Creek
Island Point
Junction Creek
332-56332-60
331-40
333-
78
332-58 332-52
331-50
District Boundary Subdistrict Boundary
Key
333-80
333-70
332-54
331-42
331-48
331-44
331-46
333-72
333-
77
333-74
333-76
Figure 8.–Commercial herring districts and statistical areas of Norton Sound, Port Clarence, and
Kotzebue Sound.
Point Romanof

NORTON SOUND PACIFIC HERRING OVERVIEW COMMERCIAL FISHERY OVERVIEW Sac Roe The earliest American commercial effort on Bering Sea herring apparently took place in the early part of the 1900s near Golovin in Norton Sound (Menard et al. 2013). Domestic commercial fishing resumed for “spring herring” in Norton Sound in 1964 near Unalakleet and continued sporadically until 1979. Between 1964 and 1978, the fishery averaged about 10 tons of herring annually for sac roe extraction (Menard et al. 2013). In 1979, a domestic herring fishery for sac roe began on a larger scale in Norton Sound when approximately 1,292 tons of herring were taken by 63 fishermen (13 purse seiners, 50 gillnetters). Purse seiners took 70% of the total catch.
After the 1979 season, BOF adopted a public proposal that made gillnets and beach seines the only legal commercial herring fishing gear within Norton Sound. A purse seine fishery could only be opened if the gillnet fleet could not take the allowable harvest. The regulation attempted to encourage local fishermen to participate in this developing fishery.
During the 1980 season, 294 gillnet fishermen harvested 2,452 tons of herring (Menard et al. 2013). Because gillnet fishermen demonstrated they were capable of taking the available harvest, a regulation was passed in 1981 to prohibit any purse seine gear within Norton Sound District.
Before the 1984 season, harvest by beach seine fishermen was negligible, but in 1984, 10 beach seine fishermen harvested 327 tons. In 1984, BOF set a beach seine gear limit of 100 fathoms and limited harvest to “not exceed 10% of the total herring sac roe harvest projections as published by the ADF&G.” During the fall 1987 BOF meetings, beach seine gear was further restricted to a limit of 75 fathoms. Beach seine harvests from 1985 to 2000 were only about 8% of total reported harvest, and since 1998, little market interest has existed for herring caught with beach seines because of the smaller average size of herring captured.
As with most developing fisheries, fishing effort and harvest increased with each season. In 1984, Norton Sound became a superexclusive herring fishing district to slow growth and bolster local involvement, but it had limited success. The 1987 herring sac roe gillnet harvest was 3,759 tons and had the highest level of fishing effort on record (Menard et al. 2013). This effort was more than twice the average from 1980 through 1986, yet Norton Sound area residents accounted for only about a third of both the effort and total harvest. Then, in 1987 after a public proposal adopted at the fall BOF meeting, the Commercial Fisheries Entry Commission (CFEC) changed Norton Sound Herring District to Limited Entry status with a maximum number of 301 gillnet and 4 beach seine permits. Beginning in 1988, a moratorium was placed on Norton Sound and no new entrants were allowed into the sac roe herring fishery.
No harvest occurred in 1992 due to very late ice breakup, but both the gillnet and beach seine fisheries continued with a total of more than 200 participating fishermen until 1998. The 1995 gillnet harvest of 6,033 tons was the highest on record, and the 1993 beach seine harvest of 742 tons was the largest harvest on record by this gear type. Combined dollar value for both the beach seine and gillnet fisheries peaked in 1996 at $4.5 million (Appendix D2).
Since 1997, poor market conditions have been the primary influence on the level of commercial harvest. There has been no harvest by beach seine since 2000. Number of fishermen has
21

decreased from 122 in 1999 to an average of 19 for the past 5 years. From 1999 to present, the number of buyers has steadily declined from 4 to 1, with no buyers present in 2004. Even when there was a buyer, sometimes only bait was purchased, as happened in 2007–2009. One bright spot was the high recovery of over 13% roe in 2010 and 2011. In 2012 there was no sac roe fishery due to late ice breakup.
Spawn-on-Kelp A small-scale spawn-on-kelp Fucus sp. fishery existed in Norton Sound from 1977 to 1984. Harvests during the 1977–1984 periods ranged from less than 1 ton (1977) to approximately 47 tons (1981). During the 1984 season, 1 ton of Macrocystis kelp imported into Norton Sound resulted in a harvest of approximately 3 tons of product (Menard et al. 2013). In response to a public proposal, BOF closed all spawn-on-kelp fisheries in Norton Sound before the start of the 1985 season.
The 1998 herring market was known to be poor before the southernmost fisheries opened. An experimental herring spawn-on-Macrocystis-kelp fishery was approved by BOF to operate in Norton Sound during the 1998 season. The commissioner approved emergency regulations to allow a herring spawn-on-wild-Fucus-kelp fishery shortly before the normal start of the sac roe fishery. The intent of these decisions was to allow as much opportunity as possible to sac roe permit holders, because only a small minority would have an opportunity to participate in the sac roe fishery.
At the January 1999 meeting, BOF instituted a Macrocystis kelp open pound fishery and allowed for a wild Fucus spawn-on-kelp fishery for sac roe permit holders who had not sold sac roe product. Wild Fucus harvest is limited to an area west of Wood Point to Canal Point, including Stuart Island, and the guideline harvest level may not exceed 30 metric tons. The herring pound spawn-on-kelp guideline harvest level may not be more than 90 tons, to include combined weight of herring eggs and kelp.
Since 2001, little (less than 1 ton) or no harvest has occurred from either the Macrocystis kelp or wild Fucus spawn-on-kelp fisheries (Appendix D2).
Food and Bait Fishery Early records indicate about 3,200 tons of “fall herring” were processed in Norton Sound from 1916 to 1941 (Menard et al. 2013). This fishery, dependent on salt curing, declined because foreign competition produced poor marketing conditions. Japan began gillnetting in Norton Sound during 1968 with 3 vessels. Effort was concentrated about 12 miles offshore between St. Michael and Golovin. Approximately 40 Japanese vessels reported harvesting a record 1,400 tons of herring during 1969 (Menard et al. 2013). An average annual harvest of approximately 450 tons was reported in Norton Sound by the Japanese during 1968–1974. All foreign fleets were prohibited in 1977 from gillnet fishing in the area.
Since 1977, there has not been a consistent domestic commercial food and bait herring fishery in Norton Sound. The majority of reported food and bait herring harvest estimates were initially harvested as sac roe but bought and processed as food and bait, so they were considered food and bait for the purposes of this report. The largest Norton Sound herring harvest in the past 50 years occurred in 1995 when an estimated 6,763 tons of sac roe herring were delivered, of which only 116 tons were purchased as food and bait. Since 1997, no more than 91 tons of herring were sold annually as food and bait (Appendix D1).
22

COMMERCIAL FISHERY MANAGEMENT The overall statewide management strategy is based upon the Bering Sea Herring Fishery Management Plan (5 AAC 27.060) to annually harvest 0–20% of the herring biomass. The upper end of the exploitation range is applied to stocks in good condition. The lower end of the exploitation range is applied to stocks exhibiting a trend of decreasing abundance and poor recruitment. If a minimum biomass threshold level of 7,000 tons for Norton Sound is not achieved, no commercial fishery will be allowed.
Typically, herring are long-lived fish and will usually remain harvestable for at least 5 years after recruiting into the fishery. Harvesting only a percentage of the biomass ensures fish will remain for following years. This type of strategy helps mitigate population fluctuations caused by successive years of poor recruitment, a common occurrence in marine-spawning fish. Before 1983, harvests in Norton Sound were regulated by subdistrict so harvests would be dispersed over the entire fishing grounds (Menard et al. 2013). This strategy prevented harvest efforts from concentrating in one area, on what was then thought to be a distinct stock of fish.
Methods to reliably forecast herring returns are still being developed and estimates of recruitment are not available; therefore, inseason assessments of biomass supersede projected biomass for management of Norton Sound herring. The herring fishery is managed for a 20% exploitation rate at biomass levels twice minimum threshold or greater. If the run does not materialize as projected, the harvest exploitation rate may be reduced to a lower level.
Generally, fisheries management staff has tried to set commercial openings to allow gillnetters to fish flood tides as they crest. Figured heavily in this strategy is the belief that ripe females approach the beach at that time to spawn. Because the Norton Sound fishery covers a large area with varying tides, opening at the optimal time throughout the district is not always possible. The fishing fleet must be flexible to maximize catches and roe quality. However, since 1997 there have been limited markets for herring and the catch has been well below the guideline harvest level. Since 2002, to maximize efficiency for fishermen and buyers, ADF&G has opened the fishery continuously once buyers are ready and then buyers direct the fleet when to set and pull nets.
In the past, duration of beach seine openings was dependent on herring abundance near the beach and favorable weather conditions for spotters and fishing. Beach seiners prefer to work flood tides similar to gillnetters; however, fisheries managers frequently provided less optimal fishing times. Beach seiners are able to harvest their allotment of 10% of the preseason harvest goal in a single 3-hour opening under ideal conditions. By nature of the gear, beach seiners have the potential to wrap up large numbers of fish that could potentially exceed their allocation. In the past, management staff often reduced beach seine efficiency by allowing a gillnet opening to occur before a beach seine opening. This opening breaks up school size and reduces likelihood of excessive harvests. Occasionally, the beach seine fleet has been used to test roe quality of herring newly arrived in nearshore waters before a gillnet opening. The potential for waste would have been great had the entire gillnet fleet fished on poor quality herring.
In the 2000s, the market desired a higher roe percent and larger size fish. These criteria have been difficult to achieve with beach seine gear and therefore no buyer interest has existed for herring harvested from beach seines.
23
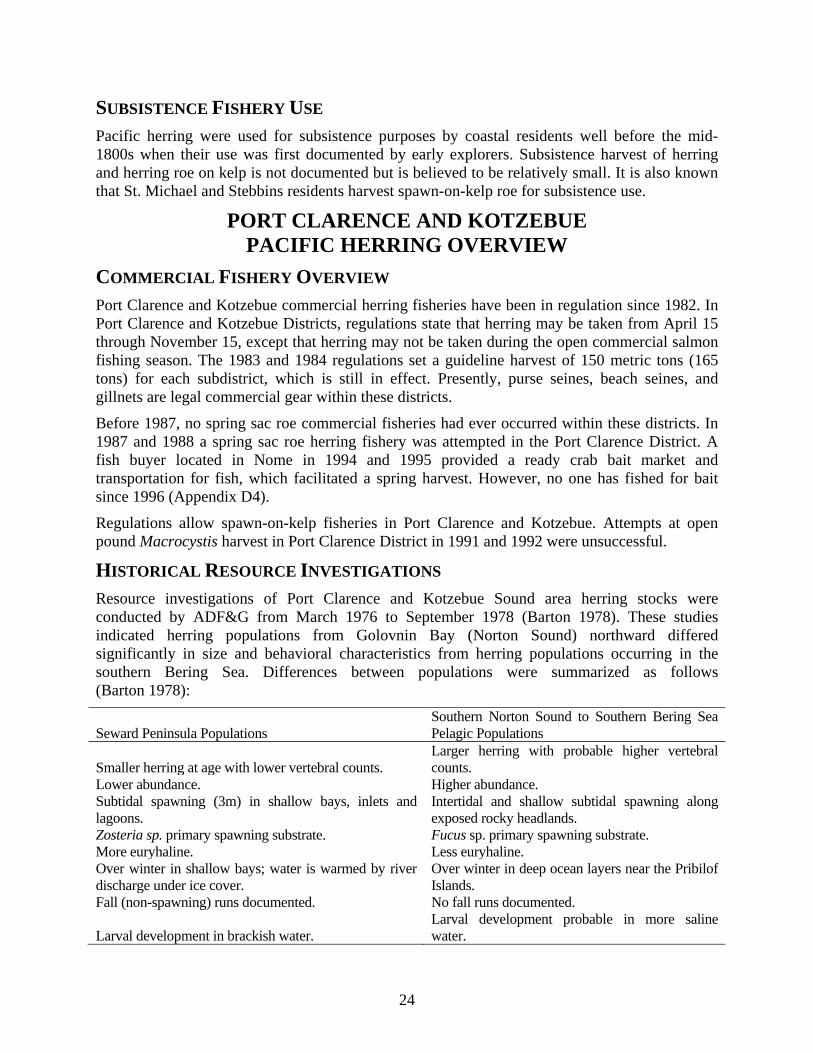
SUBSISTENCE FISHERY USE Pacific herring were used for subsistence purposes by coastal residents well before the mid-1800s when their use was first documented by early explorers. Subsistence harvest of herring and herring roe on kelp is not documented but is believed to be relatively small. It is also known that St. Michael and Stebbins residents harvest spawn-on-kelp roe for subsistence use.
PORT CLARENCE AND KOTZEBUE PACIFIC HERRING OVERVIEW
COMMERCIAL FISHERY OVERVIEW Port Clarence and Kotzebue commercial herring fisheries have been in regulation since 1982. In Port Clarence and Kotzebue Districts, regulations state that herring may be taken from April 15 through November 15, except that herring may not be taken during the open commercial salmon fishing season. The 1983 and 1984 regulations set a guideline harvest of 150 metric tons (165 tons) for each subdistrict, which is still in effect. Presently, purse seines, beach seines, and gillnets are legal commercial gear within these districts.
Before 1987, no spring sac roe commercial fisheries had ever occurred within these districts. In 1987 and 1988 a spring sac roe herring fishery was attempted in the Port Clarence District. A fish buyer located in Nome in 1994 and 1995 provided a ready crab bait market and transportation for fish, which facilitated a spring harvest. However, no one has fished for bait since 1996 (Appendix D4).
Regulations allow spawn-on-kelp fisheries in Port Clarence and Kotzebue. Attempts at open pound Macrocystis harvest in Port Clarence District in 1991 and 1992 were unsuccessful.
HISTORICAL RESOURCE INVESTIGATIONS Resource investigations of Port Clarence and Kotzebue Sound area herring stocks were conducted by ADF&G from March 1976 to September 1978 (Barton 1978). These studies indicated herring populations from Golovnin Bay (Norton Sound) northward differed significantly in size and behavioral characteristics from herring populations occurring in the southern Bering Sea. Differences between populations were summarized as follows (Barton 1978):
Seward Peninsula Populations Southern Norton Sound to Southern Bering Sea Pelagic Populations
Smaller herring at age with lower vertebral counts. Larger herring with probable higher vertebral counts.
Lower abundance. Higher abundance. Subtidal spawning (3m) in shallow bays, inlets and lagoons.
Intertidal and shallow subtidal spawning along exposed rocky headlands.
Zosteria sp. primary spawning substrate. Fucus sp. primary spawning substrate. More euryhaline. Less euryhaline. Over winter in shallow bays; water is warmed by river discharge under ice cover.
Over winter in deep ocean layers near the Pribilof Islands.
Fall (non-spawning) runs documented. No fall runs documented.
Larval development in brackish water. Larval development probable in more saline water.
24

Data collected from herring populations along the Seward Peninsula strongly indicated that a separate stock of herring occurs in Port Clarence and Kotzebue Sound Districts. These data do not preclude possibility of more southern stocks utilizing this region, such as stocks that winter near the Pribilof Islands and migrate to the western Alaska coast to spawn. Migration to central Bering Sea for wintering herring stocks along the western Seward Peninsula is unlikely; rather they might remain in coastal lagoons, bays, or inlets that are warmed by river discharge under the ice (Barton 1978). Size difference may be explained by warmer water temperatures from river discharge. Water temperatures and feeding conditions in deep ocean waters are probably more favorable for growth than those in herring winter habitats along the Seward Peninsula, where apparently they have become adapted to Arctic conditions (Barton 1978).
Aerial surveys are difficult in Port Clarence District because of organic coloring of waters of Imuruk Basin, Tuksuk Channel, Grantley Harbor, and, to a lesser extent, Port Clarence. Presence of other species of fish caught in test commercial gear sets indicate the need for verifying species composition of any biomass sighted. A further complicating factor within Port Clarence is spring ice conditions. Port Clarence is a sheltered body of water that becomes highly stained over winter and takes time to clear once ice melts. Typically, outside waters are significantly warmer than inside waters, which are covered by ice longer, thereby slowing solar gain and water mixing. Soon after ice begins to shift, herring move into the warm shallow lagoons to spawn. Herring are invisible to aerial observation once they enter stained water. The best aerial survey conditions exist just outside the entrance to Port Clarence, where herring mass just before the ice moves. In each of the past several years one or two surveys were flown, but virtually no herring were observed because the narrow window of time for seeing fish was missed.
KING CRAB OVERVIEW NORTON SOUND KING CRAB OVERVIEW District Boundaries Norton Sound Section (Q3) consists of all waters in Registration Area Q north of the latitude of Cape Romanzof (61 degrees 49 minutes N latitude), east of the International Dateline, and south of 66 degrees N latitude (Figure 9).
Abundance Since 1998, a length-based population model has been used to predict biomass for the red king crab population in Norton Sound (Zheng et al. 1998). Incorporating data from trawl surveys (Appendices E2 and E13–E14), historical winter and summer pot studies, and winter and summer fisheries (Appendices E15–E20), the model is used to project abundance estimates of legal male crab even in years when no trawl survey occurs, allowing abundance-based management of the summer commercial crab fishery. Every time new data are incorporated into the population model, the model both estimates current abundance and revises prior years’ abundances. It should be noted that estimates prior to 1996 are currently under review becausesurvey extrapolation methodologies changed after that point, and previous biomass estimates may be revised and incorporated into the model as a result of this assessment.
25

Figure 9.–King crab fishing districts and sections of Statistical Area Q.
The following estimates are based on the model’s results from spring of 2013 with the latest data from the 2011 trawl survey, the 2012 summer fishery, and the 2011–2012 winter study. In 2008, legal biomass estimate for the summer crab fishery was 3.35 million lb, an increase of 13% from the 2.96 million lb estimated for 2007. The legal population estimate increased for the following 3 years: to 3.71 million lb in 2009, 4.24 million lb in 2010, and 4.43 million lb in 2011. From 2011 to 2013, the legal abundance estimate decreased, to 4.22 million lb in 2012 and to 4.13 million lb in 2013 (NPFMC 2013).
The latest winter study data indicate that the legal proportion of the catch increased from 2007 to 2010, changed little from 2010 to 2011, and decreased in 2012 (Appendix E8). However, the record high overall male catch per unit of effort (CPUE) seen in 2012 and relatively stable legal CPUE from 2008 to 2011 suggests that the decline in 2012 in proportion of legal crab was caused more by an increase in prerecruit abundance than a decline in legal crab abundance. Because prerecruit-1 crab require 1 molt to become part of legal population the following year but prerecruit-2 crab require 2 molts, the above-average proportion of prerecruit-2 male crab in 2012 indicates a possible recruitment surge in 2014. No winter study took place in 2013 because ADF&G did an expanded spring and summer tagging study.
26

COMMERCIAL FISHERY OVERVIEW The last year that a large-vessel summer commercial crab fishery existed in Norton Sound Section was in 1990. No summer commercial fishery occurred in 1991 because of ADF&G staff constraints. In 1992, the summer commercial fishery resumed. Appendix E1 shows historical summer commercial harvest by year and statistical area for Norton Sound crab fishery since 1990. For historical information before 1990, please refer to the 2012 Annual Management Report (Menard et al. 2013). Regulation changes adopted during the March 1993 BOF meeting changed participation in the fishery to that of small boats. A superexclusive designation went into effect for the Norton Sound commercial crab fishery June 27, 1994. This designation stated that a vessel registered for the Norton Sound crab fishery may not be used to take king crab in any other registration area during that registration year. Later, a vessel moratorium put into place before the 1996 season was intended to precede a license limitation program. Community Development Quota (CDQ) groups were allocated a portion of the summer harvest beginning in 1998, but no CDQ harvest occurred until the 2000 season. The North Pacific License Limitation Program (LLP) went into effect for the Norton Sound crab fishery January 1, 2000. The program states a vessel which exceeds 32 feet in length overall must hold a valid crab license issued under LLP by National Marine Fisheries Service. Regulation changes and location of buyers resulted in harvest distribution moving eastward in Norton Sound in the mid-1990s (Appendix E12).
During the March 1999 BOF meeting a new management strategy was enacted for the Norton Sound summer red king crab fishery. A threshold level of abundance of legal male red king crab biomass was set at 1.5 million lb. A summer commercial season may only open if the legal crab biomass is estimated to be at least 1.5 million lb, and if the legal biomass falls in the range of 1.5 to 2.5 million lb the harvest rate will be no more than 5% so the stock may rebuild. If legal biomass is 2.5 million lb or more, the harvest rate will be no more than 10%. In March of 2012, this regulation was modified by the BOF so that the new threshold level of abundance of legal male red king crab biomass was set at 1.25 million lb. If the estimated legal crab biomass falls within the range of 1.25 to 2.0 million lb, the harvest rate will be no more than 7% of legal male abundance. From 2.0 to 3.0 million lb, the harvest rate will be no more than 13%. If the estimated legal biomass is more than 3.0 million lb, the harvest rate will be no more than 15%. Improved abundance estimates and the current management strategy will greatly reduce the risks of overfishing the stock.
Since 1981, in order to protect crab utilized by the inshore subsistence fishery from commercial harvest, an area delineated by a line approximately 10 to 15 miles off the shores of southern Seward Peninsula from Port Clarence to St. Michael has been closed to the summer commercial fishery. This closure line has relaxed over the years to its current position adopted by the BOF in 2002 (Appendix E11).
To reduce handling mortality of undersized crab and smaller female crab, the BOF at its March 2008 meeting put a new regulation into effect: a minimum of 4 escapement rings are required per pot with each ring having a minimum inside diameter of 4.5 in located within 1 mesh size from the bottom of the pot, or at least one-half of the vertical surface of a square pot or sloping side-wall surface of a conical or pyramid pot must be composed of no less than 6.5 in stretched mesh. Also starting with the 2008 season, even though the minimum legal size of red king crab is 4.75 inches in carapace width (CW), the local seafood plant did not always buy crab less than 5.0 in CW. The Anchorage buyer, however, has continued to buy crab as long as they are of legal size.
27

In 2010, due to concern over lack of stock status information, the North Pacific Fisheries Management Council closed the area above Cape Prince of Wales to crabbing. Only state waters (within 3 miles of shore) will be open to crabbing north of the latitude of Cape Prince of Wales (Appendix E11).
CDQ Fishery NSEDC and Yukon Delta Fisheries Development Association (YDFDA) divide the CDQ allocation. Only fishermen designated by these 2 CDQ groups are allowed to participate in this portion of the king crab fishery. Fishermen were required to have a CDQ fishing permit from CFEC and register their vessel with ADF&G before they made their first delivery. Fishermen operated under authority of the CDQ group and each CDQ group decided how their crab quota was harvested.
During the March 2002 BOF meeting, new regulations were adopted that affected the CDQ crab fishery and relaxed closed-water boundaries in eastern Norton Sound and waters west of Sledge Island. Closed-water boundaries are illustrated in Appendix E11. The Norton Sound CDQ fishery may begin at noon on June 15, or no less than 72 hours after commercial gillnet or beach seine herring fishing is closed, whichever is later, through noon on June 28. After July 1, the commissioner may, by emergency order, open a CDQ fishery for any remaining allocation after closure of the open access fishery. At the March 2008 BOF meeting the regulation requiring the herring fishery to be closed was repealed, and the CDQ fishery was allowed to occur by emergency order before, during, or after the open access fishery. Previously, the open access fishery started on July 1, but BOF passed a regulation allowing ADF&G to open the fishery by emergency order anytime beginning on or after June 15.
Commercial Catch Sampling The Norton Sound red king crab commercial fishery had the benefit of an onboard observer during the 2000 and 2001 seasons because there was a floating processor on the fishing grounds in those years. In years with no onboard observer, a smaller percentage of crab from the commercial harvest is sampled because fishermen deliver at all times of the day and night. The new seafood processing plant, Norton Sound Seafood Products (NSSP), began operating in Nome in summer 2002, greatly improving the ability of Nome ADF&G staff to sample crab brought to the Nome dock. Crab was either sampled at NSSP or at the small boat harbor where nonresident fishermen or catcher–processors not selling to NSSP offload their catch for delivery to Anchorage. ADF&G will continue to make a concerted effort to coordinate catch sampling with fishermen and buyers to ensure optimal commercial harvest data collection.
SUBSISTENCE FISHERY OVERVIEW Norton Sound residents utilize red king crab for subsistence, mainly during winter. Fishing occurs through cracks or holes cut in the ice with the use of hand lines and pots. To document trends in subsistence harvest, BOF enacted a regulation in 1977 requiring subsistence fishermen in Norton Sound to obtain a permit before fishing. Fishermen record their daily effort and catch on these permits.
For catch information before 1990, please refer to the 2012 Annual Management Report (Menard et al. 2013). Since 1990, the winter subsistence crab fishery harvest has ranged from a low of 256 crab during the 2000–2001 season to a high of 12,152 crab during the 1989–1990 season (Appendix E5). Lack of success in the winter crab fishery during some years has been attributed to
28

a declining crab population caused by removal of crab in the summer commercial fishery, together with low recruitment, low effort caused by poor ice conditions, and changes in nearshore winter distribution of crab. All these factors in varying degrees affect success of the winter fishery, as well as increased use of more efficient gear (pots instead of hand lines). Unstable ice conditions and record snowfalls adversely affected: 1992–1993, 1996–1997, 2000–2001, 2003–2004, and 2005–2006 catches. During years of stable ice conditions, approximately 85 fishermen averaged 80 crabs each.
ST. LAWRENCE ISLAND AND KOTZEBUE KING CRAB OVERVIEW District Boundaries Formerly, St. Lawrence Island Section was located immediately west and north of Norton Sound Section, but in May of 2006, BOF expanded Norton Sound Section to include the St. Lawrence Island Section south of 66 degrees N latitude and west of 168 degrees W longitude (Figure 9). The former St. Lawrence Island Section north of 66 degrees N latitude is now the Kotzebue Section.
Abundance Unlike Norton Sound, the area of the Bering Strait that includes St. Lawrence Island has never been surveyed consistently by ADF&G. Even though commercial and subsistence harvests are allowed by regulation, ADF&G does not have abundance estimates for this area. In summer of 2005, an exploratory pot survey was conducted by NSEDC in cooperation with ADF&G to assess the number and distribution of male blue king crab in the vicinity of King Island, Wales, and Port Clarence. The survey was only partially successful due to strong currents that made pot retrieval difficult when set deeper than 10 fathoms. Shallow pot placement resulted in a catch primarily of egg-bearing female blue king crab, and indicated that using standard Norton Sound crab gear would only access a nursery site for gravid blue king crab. When more suitable gear becomes available, further surveys will be necessary to determine the feasibility of a summer fishery. At the March 2008 BOF meeting, legal size requirement for blue king crab was changed from 5.5 to 5.0 in. Preliminary data indicate that blue king crab size at maturity is very similar to Norton Sound red king crab.
In summer of 2006, 2008, and 2011, the Northern Bering Sea trawl survey was conducted by NSEDC in cooperation with ADF&G to assess crab resources in the St Lawrence Island and Bering Strait areas of Norton Sound District. The primary focus was to collect information on blue king crab size, distribution, and abundance. The area surveyed lies west and northwest of the standard ADF&G triennial Norton Sound red king crab trawl survey locations. In 2006, trawls were conducted from near the southwest corner of St Lawrence Island to the Bering Strait area southwest of Cape Prince of Wales. Size information and general distribution of blue king crab was collected. In 2008 prior to the trawl survey, a camera sled was towed a few meters above the seabed to observe crab and other species in the St. Lawrence Island area that had been trawled in 2006. The 2008 and 2011 trawl work was focused on looking at the distribution of blue and red king crab in the area between Port Clarence and King Island. More survey work is necessary to generate an abundance estimate and to better understand the distribution of blue king crab. The 2006, 2008, and 2011 survey data should only be considered a starting point to understanding the Bering Strait and St. Lawrence Island blue king crab stock.
29

Commercial Fishery Overview In 1984, a regulation was adopted to close waters within 10 miles of all inhabited islands within the St. Lawrence Island Section (St. Lawrence Island, Little Diomede, and King Island). This regulation attempts to protect stocks targeted by local fishermen and reduce impacts on marine mammal subsistence harvests. Since 1990, commercial catches in the former St. Lawrence Island Section have only been reported for 4 years. In 1992, 53 lb of blue king crab were landed. In 1995, 7,913 lb of blue king crab were delivered from 3 landings (Bue et al. 1997). In 2005, 316 lb of red king crab were harvested in the Kotzebue area, and in 2006, 340 lb were harvested1.
Villagers of Little Diomede and St. Lawrence Island have bartered with and sold winter-caught blue king crab to residents of Nome and other villages for years. ADF&G does not have an accurate estimate of the magnitude of this trade. Remoteness of the villages contributes to lack of catch records. Current regulations allow a commercial harvest and sale of king crab caught near shore during winter. However, local residents have decided not to export any of their winter catch for commercial sale.
MISCELLANEOUS FISH OVERVIEW Several species other than salmon, crab, and herring are utilized for commercial and subsistence purposes in Norton Sound, Port Clarence, Kotzebue, and Arctic Districts (Appendix G1). Primary species include inconnu or “sheefish” Stenodus leucichthys, Dolly Varden Salvelinus malma, whitefish (Coregonus laurettae, C. pidschian, C. sardinella, C. nasus, and Prosopium cylindraceum), Coregonus sp., Prosopium sp., and saffron cod Eleginus gracilis.
These fish are taken by set gillnets, beach seines, “jigging” through the ice, and rod and reel. Subsistence catches taken during summer months are normally air dried, and winter catches are stored frozen. Fish are utilized for human consumption and for dog food. Fish taken for commercial purposes are mainly sold locally, although some are shipped out of the area.
Subsistence harvest of most species is not limited by regulation. Commercial harvest may be prohibited in some freshwater areas, but limited commercial endeavors are allowed in many areas under terms of a permit.
INCONNU (SHEEFISH) Spawning Areas and Timing Sheefish are distributed throughout nearshore estuarine areas of Kotzebue Sound, with the largest spawning stocks and harvests in the Kobuk–Selawik River drainages and Hotham Inlet. However, there is a small population in the Sheshalik and Krusenstern areas of northern Kotzebue Sound and in the Koyuk River of Norton Bay in Norton Sound (Figure 10).
1 Statewide electronic fish ticket database. 1st edition. Alaska Department of Fish and Game, Division of Commercial Fisheries. 1985 to present. [URL is not publically available because some information is confidential.] Hereafter referenced as “fish ticket database.”
30

Figure 10.–Kotzebue and Kobuk River Valley villages and their spatial relationship with inconnu
spawning and overwintering areas.
Inconnu’s spawning and overwintering migration behavior makes them available for harvest by various fisheries throughout their life cycle, yet increases their vulnerability to overharvest. Although inconnu are capable of consecutive spawning, most spawn every 2 to 3 years, and slow maturation rates of 5–7 years for males and 7–11 for females increase the time required to restore depleted populations. Sheefish have high fecundity, and large females can carry over 400,000 eggs. Such populations may be subject to episodic recruitment events depending on environmental conditions. If spawner abundance is maintained above a threshold level, intermittent years of good recruitment can carry the population through years of less favorable ice conditions.
After ice breakup in Kotzebue Sound area, adult sheefish migrate upriver to spawning areas on the Kobuk and Selawik rivers. On the Kobuk River, spawning occurs upstream from the village of Kobuk, with the greatest concentration observed between the Mauneluk and Beaver rivers. Then, when spawning is complete in late September and early October, sheefish disperse downstream to overwintering areas within Hotham Inlet/Selawik Lake.
Historical Fishery Use During the 1960s, age, sex, and length data indicated inconnu stocks were overharvested by commercial and subsistence fisheries in Kotzebue District. Consequently, an annual area commercial harvest quota of 25,000 lb was instituted, but subsistence is given priority and has remained unrestricted.
31

Subsistence Fishery Inconnu have long been utilized for subsistence purposes throughout Kotzebue basin, especially in Kotzebue, Selawik, and the villages along the Kobuk River. In 2004, an estimated 10,163 sheefish were harvested, surpassing the previous record since 1971 estimated at 9,805 in 1997, and 7,823 in 2003 (Appendix F2). These harvests may include winter, summer, and fall catches. Due to budget constraints, the Division of Subsistence did not survey the villages in Kotzebue Sound District for subsistence sheefish harvests from 1988 to 1990, and from 2004 to 2011. Due to limited survey effort during many years, total catch and effort should be regarded as minimum numbers and are not comparable year to year. Subsistence inconnu harvest information was not always collected for the town of Kotzebue, where a sizable ice fishery occurs for sheefish in late winter and spring. In 2012 and 2013, there were comprehensive subsistence surveys for fish and wildlife harvests of 6 Kotzebue area villages, but data is not yet available for 2013.
Summer and fall subsistence fishing for inconnu occur along Kobuk and Selawik rivers from June through October with gillnets, beach seines, and rod and reel. In spring, residents of Kotzebue, Noorvik, and Selawik harvest inconnu with hand jigs through the ice of Hotham Inlet and Selawik Lake. In early winter, Kotzebue, Noorvik, and Selawik fishermen use gillnets set under the ice in Hotham Inlet and Selawik Lake. No requirement exists for harvest reporting; however, during various years from 1973 to 2004 and starting again in 2012, ADF&G Division of Subsistence conducted household subsistence harvest surveys in various villages in Kotzebue District.
In 1987, BOF adopted a regulation limiting size of gillnets used to take inconnu for subsistence to be not more than 50 fathoms in aggregate length or 12 meshes in depth, nor have a mesh size larger than 7.0 in (5 AAC 01.120). This regulation was intended to conserve the larger, breeding portion of the stock. Except for this gear restriction, ADF&G does not restrict timing, area, or quantity of subsistence inconnu harvest.
Commercial Fishery Most commercial fishing effort occurs through the ice in Hatham Inlet, near Kotzebue, using gillnets from 5.5 in to 7.0 in stretched mesh. Recorded commercial catches are relatively small, but undocumented catches may be significant. Therefore, harvest totals should be considered minimum estimates. Restricted markets outside northwestern Alaska greatly limit commercial activity; however, most individuals participating in the winter commercial fishery also fish for subsistence purposes. Inconnu incidentally caught in the commercial salmon fisheries are sold in years when there is a market, but only in small amounts. Reported harvest and effort in the commercial fishery have declined in the last 15 years. Since 1998, harvest has not exceeded 1,250 lb, compared to the highest harvest of 8,224 lb in the last 23 years (Appendix F1). There were no reported commercial sheefish catches from 2006–2011 and 2013, but fishermen participated in commercial fishing in 2005 and 2012. Although sheefish were probably harvested and sold in the winter of 2011–2012 by several fishermen, only 1 fish ticket from the Kotzebue Sound District was submitted to ADF&G, making that catch information confidential.
Sport Fishery Kotzebue District sheefish are considered by many to be among the pinnacle of Alaska freshwater sport fishing due to their large size. Since the start of the ADF&G Trophy Fish
32

Program in 1967, all but one qualifying sheefish came from the Kobuk River. In spite of this, the level of sport fishing effort is still quite low.
Residents of Kobuk River villages have expressed concern over sport fish practices near spawning grounds on the upper Kobuk River. Catch-and-release fishing is considered by some local residents to be disrespectful and damaging to sheefish. Also, the practice of discarding filleted carcasses in the water is thought to drive other sheefish away from the area. In 1986, the Division of Subsistence investigated these concerns and found the concerns could be addressed if sport anglers were more aware of local customs and culture. An educational brochure is now available to fishermen on upper Kobuk River in the hope that proper handling during catch-and-release can minimize impacts on spawning populations. Although overall harvests are substantial, populations appear to be healthy, spawner abundances are increasing, and sport harvests are relatively low (Scanlon 2009). Sheefish sport harvests in the last 10 years have averaged approximately 850 annually (Appendix F3).
Historical Escapement Historically, aerial surveys were conducted on key inconnu spawning areas incidental to effort of enumerating salmon. These surveys were primarily conducted along upper Kobuk River in September. Survey conditions historically result in either very few or no inconnu being observed. During these surveys, species identification has been a problem. Surveys were not conducted from 1984 through 1990 because of high and/or turbid water, poor weather conditions, or lack of personnel. Through the early 1990s, incomplete escapement and catch data provided little basis for assessing current population status of inconnu in Kotzebue District, but some local residents were concerned that the inconnu stocks were declining.
Because of these concerns, a cooperative tagging project on inconnu in Kotzebue District began in 1994. This study was conducted by Division of Sport Fish, U.S. Fish & Wildlife Service (USFWS), and National Park Service. Spawning inconnu were tagged in Upper Kobuk River and Selawik River. Roughly 600 sheefish were tagged in Kobuk River by Division of Sport Fish and 150 in Selawik River by USFWS in 1994. During the fall of 1995, roughly 617 inconnu were tagged in Upper Selawik River and approximately 1,386 were tagged in Upper Kobuk River. In 1996, 2,300 were tagged in Upper Kobuk and 500 in Selawik River. The Selawik River project ended in 1996. In 1997, 1,757 inconnu were tagged in Upper Kobuk River. Spawning population estimates of inconnu in Upper Kobuk River were 32,273 in 1995, 43,036 in 1996, and 26,800 in 1997. Inconnu spawn upstream of the village of Kobuk; the greatest observed concentrations were between Meneluk and Beaver rivers. After spawning is complete in late September, fish disperse to downstream overwintering areas. In Selawik River, the spawning population estimate was 5,200 and 5,300 for 1995 and 1996, respectively. Tag recoveries showed that these stocks mixed in Hotham Inlet winter habitats but maintained fidelity to their spawning areas (DeCicco 2001).
DOLLY VARDEN Dolly Varden are distributed throughout Norton Sound, Port Clarence, Kotzebue, and Arctic Districts. Although taxonomists have disagreed on distinguishing Dolly Varden characteristics and distribution of Arctic char and Dolly Varden, most now agree char in this area are the northern form of Dolly Varden. To eliminate confusion, in this report these fish are referred to as Dolly Varden, the common name for this species complex; however, locally they are called trout.
33

Spawning Areas and Timing Dolly Varden in northwest Alaska are primarily nonconsecutive spawners. They spawn throughout late summer and fall in almost all drainages of Norton Sound, some northern Seward Peninsula rivers, and the major drainages of Kotzebue Sound and Chukchi Sea. Fry emerge in spring and migrate to the ocean during early summer after spending from 1 to 6 (generally 2–5) years in freshwater. Movements of Norton Sound Dolly Varden coincide with salmon. In spring, Dolly Varden are likely to remain longer in streams following a large pink salmon run to feed on abundant outmigrating fry. Also, they are sometimes present in streams during summer to feed on salmon eggs, especially during years of high pink salmon abundance.
Because Dolly Varden are a late-maturing fish (generally age 6–7), they are susceptible to overfishing by commercial, subsistence, and/or sport fisheries. Consequently, commercial fisheries have been maintained at low levels or prohibited to both reduce potential overharvest and provide for reproductive needs and subsistence uses.
Subsistence Fishery Dolly Varden is an important component in the diet of subsistence users in Norton Sound–Kotzebue Sound and Arctic areas. In some communities, they outrank salmon and whitefish in importance to subsistence; however, most villagers in Norton Sound District report Dolly Varden as incidental catches in subsistence salmon nets. Subsistence fishermen harvest Dolly Varden with seines in fall, hook and line through ice in winter, and gillnets in spring. The fall seine fishery contributes the greatest number of fish to annual subsistence Dolly Varden harvest.
In Kotzebue District, fall seine fishing is a group effort with several households making up a fishing group. Catch is stored and allowed to freeze in willow cribs located near the seining site. These fish are used throughout the winter by the fishing group. Most Dolly Varden harvests take place before or just after freeze-up. Fishermen from Noatak usually fish before freeze-up, but residents of Kobuk River villages of Shungnak and Noorvik fish for Dolly Varden throughout the winter. Since 1991, subsistence catch of Dolly Varden in Noatak has ranged from almost 3,000 to over 11,000 fish (Appendix F5), but they should be considered minimal figures because of survey timing. Except for 2007, no Dolly Varden harvest surveys have been conducted of Kivalina residents during the last 22 years. In 2012 and 2013, a comprehensive survey of fish harvests was done in Kobuk River villages and Noatak by the Division of Subsistence, but data are not yet available for 2013.
In Arctic District, fishery harvest studies by ADF&G’s Division of Subsistence noted that annual community catches of Dolly Varden in Kaktovik (Pedersen and Linn 2005) and Anaktuvuk Pass (Pedersen and Hugo 2005) produced annual catches of “char” (a mix of Arctic char and Dolly Varden).
Commercial Fishery Dolly Varden generally appear in commercial catches during the last 3 weeks of August and are taken as a nontarget species in the Kotzebue Sound commercial chum salmon fishery. In 1976, regulations closed the commercial chum salmon fishery on August 31 and thus reduced harvest of Dolly Varden. Spawning and overwintering Dolly Varden typically pass through the area during September but typically begin migration along the northern shore of Kotzebue Sound during the third week of August. Reported Dolly Varden sales are dependent upon available markets. The typical season catch, when buyers are purchasing Dolly Varden throughout August,
34
is approximately 1,000 to 3,000 fish (Appendix F4). However, limited markets in the 2000s have resulted in less than 200 Dolly Varden reported sold each year in Kotzebue Sound, and zero sold since 2005 because the buyer no longer purchases Dolly Varden. Regardless of sales, Dolly Varden catches are still required to be reported on fish tickets. During the 2011–2012 season, three fishermen caught and sold 1,057 lb of Dolly Varden to the fish plant in Nome as bait. This was the first recorded sale of Dolly Varden in Norton Sound in recent history.
Sport Fishery Drainages of Kotzebue Sound and the Chukchi Sea are known for the large size of anadromous Dolly Varden, but Kotzebue area residents and non-locals boating on Kobuk and Noatak rivers are the primary participants in this area’s Dolly Varden sport fishery. Both Noatak and Kobuk rivers are National Wild and Scenic rivers with headwaters included in Gates of the Arctic National Park. However, the Wulik River is probably the most important Dolly Varden stream in northwestern Alaska. The 90-mile Wulik River is known for the largest and most abundant Dolly Varden populations. Located approximately 90 miles north of Kotzebue, Wulik River flows into the Chukchi Sea through Kivalina Lagoon near the village of Kivalina and is estimated to have over 100,000 overwintering Dolly Varden annually.
Since the start of the ADF&G Trophy Fish Program in 1967, 140 of 219 qualifying Dolly Varden have come from Kotzebue Sound and Chukchi Sea drainages. Additionally, the current Alaska sport fish angling record for Dolly Varden was 12.4 kg (27 lb 4 oz), taken from the Wulik River in 2002 and surpassing the previous record (also taken from the Wulik River in 2000). In spite of this, sport fishing effort has been consistently low, which is probably due to the remote location and difficult access of fishing sites (Scanlon 2009). Dolly Varden sport fish harvests in the last 10 years in Norton Sound averaged almost 3,200 annually but averaged less than 1,200 in the Kotzebue/Chukchi Sea areas (Appendix F3).
Historical Escapement Since 1990, aerial survey counts of overwintering Dolly Varden on the Wulik River has ranged from 135,135 fish in 1992 to 1,500 fish in 2003 (Appendix F7). Weather and water conditions have precluded flying aerial surveys during many years. Weather permitting, Division of Sport Fish conducts aerial surveys of Noatak River spawning grounds in summer, and Kivalina and Wulik rivers overwintering areas in fall. Since 2000, however, only Wulik River has been surveyed.
WHITEFISH Although inconnu belong to the whitefish family, this section deals with several smaller species of genera Coregonus and Prosopium. Genus Coregonus contains “broad” and “humpback” whitefish or C. nasus and C. pidschian, respectively. In addition, 3 whitefish species known as “ciscoes” belong to these genera: least cisco C. sardinella, Arctic cisco C. autumnalis, and Bering cisco C. laurettae. “Round” whitefish Prosopium cylindraceus are the sole representatives of genus Prosopium in this area.
Spawning Areas and Timing Whitefish occur throughout most bodies of fresh water in Norton Sound, Port Clarence, Kotzebue, and Arctic districts and can also be found at various times of year in inshore marine
35

waters. Several whitefish species spawn in freshwater in late August to October when lakes and streams are close to freezing.
Commercial Fishery Limited commercial whitefish harvests have been allowed since statehood, normally under auspices of a permit that delineates harvest levels, open areas, legal gear, etc. Commercial whitefish fisheries were generally limited to large open-water areas (e.g., Grantley Harbor in Port Clarence District) or ocean waters. Beach seines were stipulated as legal gear in some instances in order to reduce the number of incidental species taken. Little comparative commercial catch and effort data were recorded, but harvest levels were historically low. Most commercial catches were made in Golovnin Bay in Norton Sound District, in Kuzitrin River in Port Clarence District, and in Hotham Inlet and Selawik River in Kotzebue District. Fish were sold to local markets for human consumption, dog food, or, more recently, crab bait. During the 2006–2007 season, one local Nome fisherman, who waived confidentiality, sold 3,723 lb of whitefish. No further whitefish harvests occurred until the 2010–2011 season, and since then only one or two fishermen have harvested whitefish commercially for no more than 2,200 lb total (Appendix F9).
In the Arctic District, a commercial fishery for freshwater finfish has existed in the Colville River delta (located approximately 60 miles west of Prudhoe Bay) since 1964 (Menard et al. 2013). Historically, commercial fishing generally took place during late June and July for broad and humpback whitefish and October through early December for Arctic and least cisco. However, since 1990 commercial fishing effort has predominantly occurred in October and November for Arctic and least cisco. Set gillnets are used as capture gear, and fishing during fall months occurs under the ice. All fish were harvested with the intent to sell commercially and are reported daily on a catch form. However, not all fish reported on permits for this area were sold. Those fish not commercially sold were retained and used for subsistence purposes. No commercial harvest has been reported since 2007 from the Coville River (Appendix H1).
Subsistence Fishery Whitefish are important for subsistence use and taken mainly by beach seine or set gillnets. Catches are usually dried and used for human consumption or dog food. In some areas, fish are “gutted” and dried early in summer, but later in summer, fish are filleted and dried with eggs and viscera intact.
Subsistence catch enumeration is difficult because fishermen do not count fish individually, but by “tubs,” “bags,” “strings,” or other estimators of gross abundance. Additionally, many fish are dried and consumed or stored in caches before the survey period. Reported subsistence harvests were generally the result of a limited and sporadic survey effort and should be regarded as minimum values and not comparable from year to year. In 1997, subsistence harvests of whitefish were included for the first time in Division of Subsistence household salmon harvest surveys in Kotzebue Sound villages (Appendix F8).
The relative importance of whitefish is higher in Kotzebue Sound District than in many areas of the state (Georgette and Shiedt 2005). Average subsistence harvests of whitefish estimated for the village of Noatak and the 5 Kobuk River villages combined from 1997 to 2004 was almost 54,000 fish (Appendix F8). Harvest numbers are considered minimal and are not comparable year to year. Since 2004, subsistence harvest surveys have not been conducted in the Kotzebue Sound District until 2012, when the Division of Subsistence conducted a comprehensive subsistence fish harvest survey in the Kobuk River villages and Noatak.
36
Historical Escapement Whitefish escapements have not been monitored in the past, but limited ADF&G observations and fishermen interviews do not indicate declining populations.
SAFFRON COD Saffron cod, or tomcod as they are called locally, are extensively utilized as a subsistence resource in Norton Sound-Port Clarence and Arctic-Kotzebue areas. Tomcod are taken through the ice by jigging, and with gillnets in open water and under the ice.
No extensive commercial fishery on tomcod in Norton Sound–Port Clarence and Arctic-Kotzebue areas has ever occurred, but during the 1980s, a limited commercial fishery occurred in Norton Sound (Menard et al. 2013). According to local fishermen, these fish were used for dog food, crab bait, and human consumption. In the mid-1990s, NSEDC established markets for several fish species not commercially utilized in the past. The need for crab bait was the primary factor in initiating the saffron cod fishery near Unalakleet. A total of 1,402 lb of saffron cod were sold during the 1993–1994 season. The NSEDC market was not available the following winter and was probably a factor in the reduced harvest of 52 lb (Appendix F10).
No commercial harvest was reported from 1995 through 2008. Since the fall of 2009, total annual tomcod harvest has ranged from 1,748 lb to almost 34,000 lb (Appendix F10), all sold to Norton Sound Seafood Products (NSSP) in Nome for use as crab bait. NSSP would only buy tomcod that were caught through the ice by jigging gear.
Miscellaneous Finfish Species Other finfish species taken for subsistence in Norton Sound, Port Clarence, Kotzebue, and Arctic areas include capelin, rainbow smelt (boreal smelt), northern pike, starry flounder, yellow fin sole, Arctic flounder, Alaska plaice, Arctic grayling, burbot, blackfish and halibut (Appendix G1).
Subsistence Fishery Subsistence utilization of these species has been documented, although effort and catch vary widely in scale and importance with locality. Some species are important to the subsistence community in certain localities during specific seasons of the year. In Nome Subdistrict, both Nome and Solomon rivers were closed to subsistence fishing for Arctic grayling in 2001 when abundance was determined to be low.
Commercial Fishery Burbot, or freshwater cod, have been commercially sold sporadically in the past in Kotzebue, Port Clarence, and Norton Sound districts under commercial permits.
Sport Fishery Sport fisheries for Arctic grayling exist in Norton Sound–Port Clarence and Arctic-Kotzebue areas, but they are relatively small. Average annual sport fish harvests for Arctic grayling in the last 5 years were under 1,000 fish in both Norton Sound and Kotzebue Districts. In Norton Sound, average Arctic grayling sport fish harvests for the last 10 years are roughly a fourth of that of Dolly Varden, but in Kotzebue District, average Arctic grayling sport fish harvests for the last 10 years is over half that of Dolly Varden (Appendix F3).
37

SECTION 2: SALMON FISHERIES
2013 NORTON SOUND SALMON FISHERY 2013 Norton Sound Fisheries Outlook The 2013 outlook was for a commercial harvest level of 40,000 to 70,000 chum salmon, 50,000 to 100,000 pink salmon, and 30,000 to 60,000 coho salmon. Salmon outlooks and harvest projections for the 2013 season were based on qualitative assessments of parent-year escapements and age composition, subjective determinations of freshwater overwintering and ocean survival conditions, and, in the case of the commercial fishery, anticipated market interest and processing capacity.
For the first time in over 20 years, commercial fishing for chum salmon was expected to occur in Nome Subdistrict. Commercial periods for chum salmon were not expected to exceed 24 hours in length.
As in previous years, the bulk of commercial salmon harvests were expected to come from southern Norton Sound (Subdistricts 4–6). The relatively large southern Norton Sound watersheds (e.g., Inglutalik, Ungalik, Shaktoolik, and Unalakleet rivers) generally support larger runs of salmon. This fact, coupled with stable, healthy salmon runs (except Chinook salmon) and more liberal fisheries management plans, allows for more commercial harvest opportunity in the southern Norton Sound subdistricts. In contrast, salmon runs, particularly chum salmon runs, have been more unstable in the smaller drainages to the north in Subdistricts 2 (Golovin) and 3 (Elim) since the early 2000s. Subdistricts 2 and 3 chum salmon runs have either been very strong, providing large surpluses available for commercial use (e.g., 2006, 2007, 2010, 2011); or very weak, with runs often below levels needed to achieve escapement goals, such as in 2004, 2005, 2008, and 2009. The extent and frequency of commercial chum and pink salmon periods in Subdistricts 2 and 3 is also largely predicated on the Subdistricts 2 and 3 management plan, which directs ADF&G to ensure that chum salmon escapement goals and subsistence needs are achieved.
Commercial Fishery Season Summary Weak Chinook salmon runs occurred throughout Norton Sound in 2013, requiring inseason restrictions and early closures to southern Norton Sound subsistence fisheries. As expected in odd-numbered years, pink salmon runs were only sufficient to provide for subsistence needs and limited directed commercial fishing openings. However, substantial increases in commercial chum and coho salmon harvests occurred in 2013, and sockeye salmon abundance was sufficient to reach escapement goals and avoid an early closure to the Pilgrim River sockeye salmon fishery for the first time since 2008.
The 2013 Norton Sound District commercial salmon fishery came in well above the forecast range of 40,000 to 70,000 chum salmon and within the forecast range of 30,000 to 60,000 coho salmon. Norton Sound commercial salmon harvest was 118,672 chum, 193 sockeye, 53,754 coho, and 8,251 pink salmon (Table 1). Also, there were 151 Chinook, 54 sockeye, 48 coho, 87 pink, and 37
38

chum salmon kept for personal use. The buyer was not able to buy Chinook salmon in Subdistricts 5 and 6, per department emergency order, and chose not to buy Chinook salmon in other subdistricts.
Large chum salmon harvests in conjunction with high prices paid for coho salmon accounted for nearly all $1,183,236 paid to 124 permit holders in 2013 (Appendices A2 and A3). The 2013 exvessel value ranks third highest and represents the third year since 2010 in which exvessel value has exceeded 1 million dollars (Appendix A3).
Commercial chum salmon harvest in 2013 was the highest in over 25 years. Southern Norton Sound (Subdistricts 4–6) accounted for the bulk of the commercial harvest. Subdistrict 4 (Norton Bay) had a record chum and coho salmon harvest. Commercial chum salmon harvest was also robust in Subdistrict 6 (Unalakleet), which ranked third highest. The chum salmon run was weaker in northern Norton Sound with the exception of Subdistrict 1 (Nome) and Port Clarence District. Subdistrict 2 (Golovin) and Subdistrict 3 (Elim) had the second-highest and fourth-highest coho salmon harvests on record, respectively.
The pink salmon harvest of 8,251 fish was well below the forecast of 50,000 to 100,000 fish. The low harvest was probably due to the existence of only one pink salmon directed fishing period. Both the buyer and fishermen expressed interest in having chum salmon directed fishing periods because of the higher price per pound of chum salmon.
The coho salmon harvest of 53,802 fish was below the recent 5- and 10-year average harvests of 73,080 fish and 76,695 fish, respectively (Appendix A13). Although there were near record to record harvests in Subdistricts 2 and 4, they make up a smaller portion of the overall catch in Norton Sound. The larger harvests usually came from Subdistricts 5 and 6, but in 2013, catches in those subdistricts ranged from only 36% to 66% compared to the recent 5- and 10-year averages (Appendix A10 and A11). Some of this can be attributed to weather during the month of August, particularly in Subdistrict 5. High surf conditions only diminished for brief periods during many scheduled openings in August, which caused several permit holders to lose interest and pursue other endeavors.
The number of permit holders (124) participating in the commercial fishery this year was above average and was the highest number of participants since 1993 (Appendix A2). The previous 5-year average in Norton Sound was 108 permits fished, and the previous 10-year average was 78 permits fished (Appendix A2). The increased fishing effort in the salmon fishery since 2010 is largely the result of stronger chum salmon runs, improved market interest, and high dock prices for salmon, particularly coho salmon. Dock prices per pound for Norton Sound salmon in 2013 were $0.22, $0.55, $1.49, and $1.77 for pink, chum, sockeye, and coho salmon, respectively (Appendix A4). Chinook salmon were not purchased by the buyer in 2013. Average commercial weights by species were 7.6 lb for coho salmon, 2.9 lb for pink salmon, and 6.9 lb for chum salmon (Appendix A5).
Only one salmon buyer operated in Norton Sound during the 2013 season. The Unalakleet fish plant operated by Norton Sound Seafood Products was the base of commercial fisheries operations. Salmon were both delivered to the Unalakleet dock and tendered from Subdistricts 2–5. Subdistrict 1 catch was delivered by the single permit holder to the Nome plant.
39

Subsistence Fishery Season Summary Subsistence salmon fishermen in Port Clarence District, Cape Woolley Subdistrict, and Subdistricts 1–3 were required to possess a subsistence salmon fishing permit for each household that fished in these locations. Households may obtain and fish permits for multiple areas. Return rates for these permits have been close to 100% in most years, and in 2013 the return rate was 100% for the third year in a row (Table 2).
In southern Norton Sound, in 2013, postseason household surveys were conducted in Koyuk, Shaktoolik, and Unalakleet, and attempts were made to contact 100% of the households. Catch information for Subdistricts 4–6 are in Appendices A9–A11. Unlike in 2012, the villages of Stebbins and St. Michael were not surveyed in 2013.
In Norton Sound District, there are limits on subsistence salmon harvests only in Subdistrict 1 (Nome), where salmon limits have been in place since 1985. Also, hook and line subsistence fishermen must follow sport fish bag limits except in the Subdistrict 1 subsistence zones, where they can catch the subsistence limit. In 2013, an average chum salmon run was forecasted for Subdistrict 1 and the subdistrict was not closed to salmon fishing in mid-June for the eighth year in a row. From 1991 through 2005, Subdistrict 1 was closed to subsistence salmon fishing in mid-June in order for ADF&G to determine the run strength of chum salmon before allowing fishing. Furthermore, Tier II regulations were not in effect in 2013 because the chum salmon run was projected to exceed the amount necessary for subsistence (ANS).
In Port Clarence District, subsistence permits are required and a separate permit is required for Pilgrim River and for Salmon Lake. There are no salmon harvest limits in Port Clarence District, except for Kuzitrin River, Pilgrim River, and Salmon Lake.
Beginning in 2007, regulations allowed for cash sales of up to $200 worth of subsistence-taken finfish per household, per year, in the Norton Sound–Port Clarence Area only, and starting in 2013 the amount allowed was raised to $500. In 2013, ADF&G increased efforts to remind residents about the permit requirement when selling subsistence-caught finfish and 18 permits were issued, which resulted in cash sales of almost $2,000 (Appendix A34).
Season Summary by Subdistrict Nome–Norton Sound Subdistrict 1
In Subdistrict 1, 2013 chum salmon run abundance was projected to achieve the subdistrict-wide biological escapement goal (BEG) range of 23,000–35,000 chum salmon and amounts necessary for subsistence (ANS) range of 3,430–5,716 chum salmon. As such, a Tier II fishery was not implemented in 2013. There has not been a Tier II fishery implemented since 2005, and Tier II subsistence fishing restrictions were rescinded early during the 2004 and 2005 seasons.
Regulation changes made at 2013 Alaska Board of Fisheries meeting allowed for subsistence gillnet fishing 7 days a week in marine waters in the eastern half of Subdistrict 1, and beach seining was allowed in all subsistence locations during the chum salmon run when gillnet fishing was open. Excellent marine subsistence catches of chum salmon were reported in late June and early July in eastern Subdistrict 1. Aerial surveys were conducted in mid-July of the eastern Nome Subdistrict drainages (Flambeau, Eldorado, and Bonanza rivers) and Sinuk River in the western Nome Subdistrict. Several thousand chum salmon were observed on these surveys in the lower reaches of these drainages. The Eldorado River, Nome River, and Snake River weir counts
40
exceeded the chum salmon escapement goal ranges in 2013. Consequently, chum salmon subsistence gillnet fishing proceeded on the standard freshwater schedule, and the marine schedule for western Subdistrict 1 was extended from 3 days a week to 5 days a week. Several beach seining opportunities were also issued via emergency order to increase the efficiency of subsistence chum and pink salmon harvests during optimal drying weather periods.
The Subdistrict 1 BEG of 23,000–35,000 chum salmon has been achieved 4 of the last 5 years. However, achievement of the goal is often a result of better and more productive chum salmon runs east of Cape Nome disproportionately contributing to the BEG. The chum salmon escapement goal range for the Eldorado River, which is east of Cape Nome, is double the combined escapement goal range of the Nome and Snake rivers, both of which are west of Cape Nome, highlighting the disparity in river productivity within the subdistrict. In the last 5 years, the Eldorado River has exceeded the chum salmon escapement goal range in 4 years, and the Nome and Snake rivers have met or exceeded their escapement goal ranges in 3 years (Appendix A22–A23 and A26). Although chum salmon runs are greater east of Cape Nome (Appendix A32), for pink salmon the run strength is much greater west of Cape Nome (Appendix A33). Both the Nome and Sinuk rivers have much larger runs of pink salmon, particularly in even-numbered years, compared to rivers east of Cape Nome. Nome River has the only pink salmon escapement goal in Subdistrict 1, and the odd-year goal of 3,200 pink salmon was easily exceeded (Appendix A26).
No coho salmon escapement goals have been established in Subdistrict 1, but the escapement in Nome and Snake rivers was about in the mid-range compared to 10 previous years of sufficient escapement estimates with no large-scale flooding events.
In 2013 there were 477 subsistence salmon permits issued for the Nome Subdistrict, slightly below the 483 permits issued last year and below the record 494 permits issued during the 2010 season. All 477 permits issued were returned (Table 2).
Reported subsistence harvest was 48 Chinook, 3,065 chum, 845 pink, 1,804 coho, and 211 sockeye salmon (Appendix A6). The chum salmon harvest was the fourth highest since 1990, but it was somewhat less than expected based on the large abundance of chum salmon available for harvest. However, increased fishing opportunity in 2013 for sockeye salmon at Pilgrim River may have shifted some effort from Subdistrict 1. The pink salmon harvest was comparable to most odd-numbered years in the last 20 years, and the coho salmon harvest was average compared to the recent 5- and 10-year harvest averages.
Golovin–Norton Sound Subdistrict 2 The Subdistrict 2 regulatory salmon management plan limits commercial harvest to a maximum of 15,000 chum salmon before mid-July in an attempt to protect chum salmon stocks and allow for some harvest while flesh quality is at its best. By mid-July, the chum salmon run can be assessed and fishing time adjusted accordingly. The counting tower project on the Niukluk River had been used to evaluate escapement in the Golovin Subdistrict from 1995–2012, but the project was eliminated in 2013. The Niukluk River is a tributary of Fish River, a major salmon-producing river in the Golovin Subdistrict. Telemetry studies in the early 2000s showed an average of 33% of the chum salmon in the Fish River drainage pass the Niukluk River tower (Todd et al. 2005).
41

There was no commercial chum salmon fishing in Golovin Subdistrict from 2002 to 2007, largely because escapements, in most of those years, had fallen short of the lower bound SEG of greater than 30,000 fish for the Niukluk River (Appendix A25). Consequently, ADF&G has implemented a conservative approach with respect to determining when commercial fishing may occur. Early indicators of 2013 chum salmon abundance to Golovin Subdistrict were limited to scant subsistence catch reports of fair catches. ADF&G had concerns about the chum run because the adjacent Subdistrict 3 counting tower at Kwiniuk River was having near record low counts. In 16 of the previous 18 years, if Kwiniuk River counting tower reached or did not reach its chum salmon escapement goal, then Niukluk River counting tower was in agreement for those years in reaching or not reaching the chum salmon escapement goal. Aerial surveys did show larger numbers of chum salmon in the Fish River drainage compared to Kwiniuk River escapement counts and 2 directed chum salmon fishing periods were allowed beginning the third week of July with mediocre catches.
As a result of chum salmon conservation concerns, the pink salmon directed commercial fishery (4.5 in or smaller gillnet mesh size) could not commence until July 14 per the management plan for Subdistricts 2 and 3. On July 17, commercial pink salmon fishing commenced in Golovin Subdistrict with a 48 hour opening. The harvest of 1,028 pink salmon was below average.
Commercial coho salmon fishing periods commenced on August 1 with 24-hour fishing periods. Coho salmon catches were above average, and there were 3 more 36-hour fishing periods the first 2 weeks of August followed by three 48-hour fishing periods the last 2 weeks of August. The coho salmon harvest was the second highest on record, and aerial surveys of Niukluk River and Ophir Creek confirmed that the combined aerial survey goal of 950–1900 coho salmon used in the early 2000s had been exceeded.
The commercial catch in Golovin Subdistrict for 2013 including personal use was 5,362 coho, 1,180 pink, and 3,113 chum salmon caught by 14 permit holders (Table 4). The number of permit holders participating in the fishery was tied with last year and both were the highest since 1998.
This was the tenth year that subsistence salmon permits were required, and 153 permits were issued for Golovin Subdistrict in 2013. Reported harvest was 47 Chinook, 3,256 chum, 3,655 pink, 964 coho, and 15 sockeye salmon (Appendix A7). The number of salmon reported harvested (7,937) ranked fourth lowest in the 2000s.
Elim–Norton Sound Subdistrict 3 The Subdistrict 3 management plan directs ADF&G to project that chum salmon escapement goals will be reached and ensure that harvestable surpluses will be in excess of subsistence needs before directed chum or pink salmon commercial fishing is allowed. Further, in times of low chum salmon abundance, directed pink salmon commercial fishing may not occur before July 7 in the subdistrict. By this date, historical data indicate that the bulk of the chum salmon run is in river, and commercial pink salmon fishing would be expected to have little impact on chum salmon escapement or subsistence needs.
Early indicators of chum salmon abundance to Elim Subdistrict were limited to scant subsistence catch reports of fair catches in marine waters. However, early projections of chum salmon escapement as indexed by the Kwiniuk River tower counts indicated a very weak run, with the tower-based OEG range of 11,500–23,000 chum salmon unlikely to be achieved. Although there
42

could have been pink salmon directed commercial fishing periods after July 6, the permit holders expressed no interest because of the lower run size during an odd-numbered year. Late in the season there were 2 directed chum salmon commercial fishing periods, restricted to an area west of the Kwiniuk River mouth. Chum catches were sparse with a harvest of 850 chum salmon (Table 5).
The first directed coho salmon fishing period began on August 1 with a 24-hour opening. Good catches combined with sufficient escapement counts at Kwiniuk River counting tower allowed coho salmon directed fishing periods ranging from 36 to 48 hours for the remainder of the month.
The commercial catch in Elim Subdistrict including personal use was 6 Chinook, 27 sockeye, 6,675 coho, 601 pink, and 1,434 chum salmon caught by 21 permit holders (Table 5). The 2013 Elim coho salmon harvest ranks fourth best historically but is slightly below the 5-year average harvest because the 3 highest harvests occurred in the last 5 years (Appendix A8).
There were 64 subsistence salmon permits issued for Elim Subdistrict in 2013. The number of salmon reported harvested (3,921) was the second lowest since harvest estimation methods were standardized in 1994. Estimated subsistence harvests by species were 39 Chinook, 15 sockeye, 1,515 coho salmon, 1,134 pink salmon, and 1,218 chum salmon. Chinook salmon harvest was a record low since estimation methods were standardized (Appendix A8). Also, the Kwiniuk River Chinook salmon escapement count (15) was the lowest since the 1970s.
Norton Bay–Norton Sound Subdistrict 4 Historically, Norton Bay Subdistrict has had difficulty attracting a buyer due to its remoteness and its reputation for watermarked fish. Until recently, Norton Bay Subdistrict has typically been managed based on Shaktoolik and Unalakleet Subdistricts salmon run assessments due to a lack of ground-based escapement projects in Norton Bay. However, in 2011, an enumeration tower project was initiated by NSEDC on the Inglutalik River to provide an index of salmon escapement to Norton Bay. Currently, the Inglutalik River escapement counts are considered ancillary to comparative catch statistics for inseason management until a longer time series of escapement data becomes established.
In 2008, a small-scale commercial salmon fishery occurred in Norton Bay Subdistrict for the first time since 1997, and 4 permit holders participated. ADF&G again opened the commercial salmon fishery in 2009 and 7 permits holders participated. In 2010, there were 5 permit holders participating in the fishery, which was limited due to a combination of inadequate tendering capacity in early July, mechanical breakdowns on tender vessels in August, and reduced fishery participation probably due to concurrent fisheries prosecuted in the Elim and Shaktoolik Subdistricts (permit data on file with ADF&G, Division of Commercial Fisheries; Nome).
In 2011 effort nearly doubled to 12 permit holders, and in 2012 there were 18 permit holders fishing in Norton Bay Subdistrict and a record 49,970 pink salmon were harvested. In 2013 there was a record catch of 36,021 chum and 5,485 coho salmon by 18 permit holders (Table 6).
The first chum salmon fishing period began on June 25 and periods were 48 hours twice a week until mid-July, when fishing periods were increased to 72 hours twice a week. Longer periods were allowed because chum salmon escapement at Inglutalik counting tower was tracking double the commercial catch. Coho salmon directed fishing periods of 48 hours twice a week began on August 2, and the last fishing period ended on September 5.
43

Cumulative commercial catch by species for Norton Bay Subdistrict including personal use was 8 Chinook, 4 sockeye, 5,485 coho, 487 pink, and 36,021 chum salmon. The final escapement estimate at Inglutalik River tower was 860 Chinook, 5,904 coho, 268,537 pink, and 61,259 chum salmon (Appendix A29). The coho salmon estimate was a minimum estimate because high water precluded counting the entire run.
This was the sixth consecutive year that household subsistence salmon surveys were conducted in the village of Koyuk. Surveys were conducted from 1994 to 2003, but funding limitations precluded surveys of Koyuk during the 2004–2007 seasons. There were 76 households that were successfully contacted out of a possible 82 in 2013. Results from these households were expanded to estimate harvests by species, gear type, and location (e.g., Inglutalik River, Ungalik River, Koyuk River, Mukluktulik River, and marine waters) for those households not surveyed (Appendix A9).
An estimated 123 Chinook, 2 sockeye, 826 coho, 1,341 pink, and 3,853 chum salmon were reported as subsistence harvest in Norton Bay Subdistrict in 2013 and ranked fourth highest out of the last 6 years (Appendix A9).
Shaktoolik and Unalakleet–Norton Sound Subdistricts 5 and 6 Both Subdistricts 5 and 6, which share a common boundary, consistently attract commercial markets due to larger volumes of fish and better transportation services. Management actions typically encompass both subdistricts because salmon tend to intermingle, and harvest in one subdistrict affects the movement of fish in the adjacent subdistrict. Results from ADF&G’s test net in Unalakleet River (Kent 2010), North River tower counts, and subsistence fishermen interviews in Unalakleet had been used to set early fishing periods in both subdistricts. However, the test net project was discontinued in 2013. This year ADF&G used the North River tower counts to assess run strength along with commercial and subsistence catches and, later in the run, counts from the Unalakleet River weir, which is much farther upstream. Radiotelemetry projects in the Unalakleet River drainage have shown that a large percentage of the Chinook salmon run spawns in the North River compared to chum and coho salmon (Estensen et al. 2005; Estensen and Hamazaki 2007; Joy et al. 2005; Joy and Reed 2006, 2007; Wuttig 1998 and 1999). Aerial surveys are only useful for late-season escapement assessment because of the long travel time between the fishing and spawning grounds.
In Subdistricts 5 and 6, directed commercial Chinook salmon fishing has only occurred in 2 of the previous 11 years, and in only 1 year since 2001. Restrictive action was taken in the subsistence and sport fisheries from 2003 to 2004 and from 2006 to 2013. As forecasted, a weak run of Chinook salmon to Shaktoolik and Unalakleet Subdistricts in 2013 precluded commercial fisheries directed on Chinook salmon but also led to a significant amount of foregone chum salmon harvest surplus. As a consequence of the poor Chinook salmon run, directed chum salmon fishing was delayed until July 1 per the Shaktoolik and Unalakleet Subdistricts management plan.
Estimated 2013 Chinook salmon escapements from the Unalakleet River mainstem and its major tributary, North River, were 767 and 564 fish, respectively, and were the lowest ever recorded (data on file with ADF&G, Division of Commercial Fisheries; Nome). Subsistence Chinook salmon harvests in Subdistrict 5 and 6 were the lowest recorded since survey methods were standardized in 1994, with 136 and 468 fish, respectively (Appendices A10 and A11).
44

Despite the late start to commercial fishing in Subdistricts 5 and 6, the chum salmon commercial harvest was well above average. The Subdistrict 5 harvest (23,268) ranked third highest and the Subdistrict 6 harvest (54,873) ranked the highest out of the last 20 years of commercial harvests, respectively (Appendices A10 and A11). Initially ADF&G started with 24-hour chum salmon periods the first week of July to protect Chinook salmon. Good catches of chum salmon in both subdistricts combined with low Chinook salmon incidental harvest resulted in the department increasing to 48-hour fishing periods the second week of July and then increasing to two 72-hour fishing periods per week in both Subdistricts 5 and 6 beginning the third week of July until the end of the month.
The commercial fishing schedule for coho salmon for Subdistricts 5 and 6 went into effect in early August with two 48-hour fishing periods per week. During the last decade commercial coho salmon harvests were the highest on record in Norton Sound District (Appendix A13), but they have recently returned to average levels prior to the record harvests from 2006–2008. In Subdistrict 5 coho salmon harvest declined for the third consecutive year with a harvest of 6,890 coho (Appendix A10). Subdistrict 5 fishermen had to contend with relatively severe local surf conditions in August, which may in part explain why Shaktoolik coho salmon harvests declined this season despite increased commercial harvests elsewhere in Norton Sound compared to last year (Appendices A6–A11).
The Subdistrict 6 commercial harvest of 29,390 coho salmon ranked twelfth highest in the last 20 years and represented a 32% increase from the 2012 harvest of 22,274 (Appendix A11).
Escapement Table 3 and Appendix A17 summarize escapement assessments for the major index river systems of Norton Sound and Port Clarence Districts in 2013. Appendices A22–A31 present passage numbers for Chinook, chum, coho, pink, and sockeye salmon at various enumeration projects in Norton Sound. Aerial survey assessments are indices and relative to historical escapement sizes.
Escapement projects in Norton Sound include counting towers on North, Inglutalik, and Kwiniuk rivers; sonar on Shaktoolik River; and weirs on Unalakleet, Snake, Nome, Solomon, Eldorado, and Pilgrim rivers, and in Glacial Creek, which flows from Glacial Lake into Sinuk River.
Escapement project operations were a result of multiple collaborators, including ADF&G, NSEDC, BLM, and Unalakleet IRA. All projects supplied important daily information to ADF&G that was very useful for management of local salmon resources and will become more important the longer they operate. Funding sources for projects come from USFWS Office of Subsistence Management, NSEDC, and ADF&G.
Aerial survey assessment conditions were fair to poor during July and August of 2013; as a result, there were very few aerial surveys flown.
Chinook Salmon Chinook salmon escapement was estimated to be very weak in many locations in 2013. A record low 15 Chinook salmon were counted at the Kwiniuk River tower, which was well below the lower end of the SEG range of 300–550 fish (Appendix A24). Also, a record low escapement of 564 Chinook salmon at the North River tower was less than half the lower end of the escapement goal range of 1,200–2,600 Chinook salmon (Appendix A30). Final escapement at the Unalakleet
45

River weir was 767 Chinook salmon, which was the lowest count in the 4-year project history (Appendix A31). Surprisingly, preemptive measures, additional marine mesh-size restrictions, and eventual early closures were not sufficient to achieve Chinook salmon escapement goals in Subdistrict 6.
Chum Salmon Chum salmon escapement goals were achieved in 5 of 8 established Norton Sound chum salmon runs. The Kwiniuk River tower-based goal was not achieved. The former Niukluk River tower-based goal could not be determined because the project is no longer operational. Tubutulik River’s escapement goal was not evaluated because the aerial survey was not conducted during the peak spawning stage.
Subdistrict 1 ended up having its largest chum salmon escapement in over 20 years. Estimated subdistrict-wide escapement of chum salmon was 108,120 fish, 209% above the upper bound of the subdistrict-wide biological escapement goal (BEG) range of 23,000–35,000 chum salmon (Table 3; Appendix A21). Subdistrict 1 escapements of chum salmon have exceeded the upper bound of the escapement goal range in 8 of the last 13 years of the established goal. As in previous years, the majority (62%) of the chum salmon escapement occurred in rivers east of Cape Nome. However, Sinuk River, west of Cape Nome, had the largest estimated escapement for an individual river system, contributing 31,691 chum salmon or 29% of the subdistrict-wide escapement (Appendix A32).
Escapement at Kwiniuk River tower was 5,631 chum salmon, only slightly above the record low count of 5,577 chum salmon observed in 2012 (Appendix A24). This was the second consecutive season that escapement fell well short of the optimal escapement goal (OEG) range of 11,500–23,000 chum salmon. However, escapement of chum salmon to the neighboring Tubutulik River may have narrowly met the OEG range of 9,200–18,400 fish, based on a July 9 aerial survey of 4,532 chum salmon in the lower reaches of the watershed (Table 3). To the west in Subdistrict 2, the peak spawning ground aerial survey of the Niukluk River tributary of the Fish River was 17,203 chum salmon (Table 3). This year’s survey count suggests that actual ground-based escapement of chum salmon to the Niukluk River tower was near the former tower-based sustainable escapement goal (SEG) threshold of ≥ 23,000 fish.
As with harvest patterns, southern Norton Sound drainages showed comparably strong chum salmon escapements in 2013. For example, Norton Sound’s largest chum salmon producer, the Unalakleet River drainage, had its second largest escapement on record. The estimated escapement was 124,471 chum salmon (based on aggregate tower and weir counts) in 2013 (Table 3).
In Port Clarence District, chum salmon runs were also strong in 2013. Escapement of chum salmon to the Pilgrim River was 47,557 fish, which established a new record high count for the Pilgrim River floating weir project (Appendix B2). The previous record escapement was 45,361 chum salmon set in 2006.
Coho Salmon Coho salmon are found in nearly all of the chum salmon producing streams throughout Norton Sound, with the primary commercial contributors being the Unalakleet and Shaktoolik rivers. Escapement data are not available over a long time series for several streams because few projects counted the coho salmon run prior to the early 2000s due to funding limitations. More
46

recent Norton Sound escapement assessment projects have been funded to monitor coho salmon as well as chum salmon and are becoming increasingly important to fisheries management.
There are only 2 coho salmon escapement goals in Norton Sound, and both are aerial survey goals. The North River goal of 550–1,100 was achieved with an aerial survey estimate of 867 fish in 2013 (Table 3). The Kwiniuk River goal of 650–1,300 was probably achieved because, although no survey was flown, the final tower count was 3,940 fish (Table 3).
The previous aerial survey goal for Niukluk River and Ophir Creek was 950–1,900 coho salmon, but it was eliminated with a Niukluk River tower goal of 2,400–7,200 coho salmon. A combined aerial survey count of 2,353 coho salmon of Niukluk River and Ophir Creek indicates that both former escapement goals would have been reached (Table 3).
Both the Snake (1,203) and Nome (2,624) rivers’ weir projects had counts near the median for coho salmon (Appendix A23 and A26).
Pink Salmon For over 25 years, pink salmon runs to Norton Sound have followed an odd- and even-numbered year cycle, with even-numbered year runs typically much higher in abundance than odd-numbered years. Pink salmon escapement estimates were successfully obtained from all ground-based escapement projects in 2013. There are 3 pink salmon escapement goals in Norton Sound: Nome River (3,200), Kwiniuk River (8,400), and North River (25,000). In almost all years the goals are reached, and the goals were likewise reached in 2013 (Table 3).
Sockeye Salmon River spawning sockeye salmon are typically found in small numbers throughout Norton Sound District. Glacial Lake (Nome Subdistrict) and Salmon Lake (Port Clarence District) support populations of lake-spawning sockeye salmon and constitute the northernmost populations of any significance of sockeye salmon in North America. Salmon Lake spawning populations seldom exceeded 10,000 fish in years previous to 2003, whereas from 2003 to 2007 there were near-record to record runs of sockeye salmon. Likewise, Glacial Lake saw an upswing in sockeye salmon returns beginning in 2004, and a record count of 11,135 sockeye salmon occurred in 2005 (Appendix A28).
In 2008, sockeye salmon escapement dropped off at both Glacial Lake and Salmon Lake, and in 2009 sockeye salmon counts further declined at both Glacial Lake weir and Pilgrim River weir. The Glacial Lake weir is operated at Glacial Creek near the outlet of the lake and about 1 mile upstream from the confluence with the Sinuk River, and 826 sockeye salmon were counted in 2009, the lowest count since the weir project started in 2000 (Appendix A28). The 2009 Salmon Lake sockeye salmon run was also the lowest since Pilgrim River weir began operations in 2003, with 953 sockeye salmon counted through the weir (Appendix B2).
Sockeye salmon escapements in these 2 systems increased in 2010, although not by much. Sockeye salmon escapement in 2010 at Glacial Lake was 1,047 fish, tying 2002 for the third lowest count since the project began in 2000 (Appendix A28). Pilgrim River weir sockeye salmon escapement in 2010 was 1,654 fish, which was the second lowest on record (Appendix B2).
47

The escapement at Glacial Lake weir in 2012 of 1,636 sockeye salmon was just slightly less than the 2011 escapement; the same goes for the Pilgrim River weir escapement of 7,085 sockeye salmon.
Improving sockeye salmon runs occurred at both Glacial and Salmon lakes in 2013. An estimated 2,544 sockeye salmon were enumerated at Glacial Lake weir, and 12,428 sockeye salmon were enumerated at the Pilgrim River weir in 2013 (Appendices A28 and B2). The 2013 Glacial Lake weir count was a 55% increase from the 1,636 sockeye salmon counted in 2012. Similarly, the 2013 Pilgrim weir count represents a 75% increase from the 2012 weir count of 7,085 sockeye salmon (Appendix B2). An August 13 aerial survey count of 6,971 sockeye salmon was greater than the 5,830 and 5,144 sockeye salmon observed during the 2011 and 2012 aerial surveys, respectively. The 2013 season signifies the third consecutive season in which the Grand Central River/Salmon Lake aerial survey SEG range of 4,000–8,000 has been achieved, but unlike the 2 previous years, the Pilgrim River was not closed to subsistence salmon fishing. A total of 1,366 sockeye salmon was also observed at Glacial Lake, making 2013 the first season since 2010 that the Glacial Lake aerial survey SEG range (800–1600 sockeye salmon) has been evaluated and achieved.
Enforcement Fishing regulations are primarily enforced by the Department of Public Safety, Alaska Wildlife Troopers (AWT). Two AWT officers patrolled the Norton Sound District 2013 commercial salmon fisheries in Unalakleet, and one AWT officer patrolled the Nome area. In addition, Nome ADF&G Division of Commercial Fisheries has 7 deputized staff with the ability to issue citations, of which 2 worked the commercial salmon fishery in Shaktoolik and Unalakleet Subdistricts. The subsistence fishery had no official patrol, but random checks were conducted by 2 ADF&G personnel.
2014 NORTON SOUND SALMON OUTLOOK Salmon outlooks and harvest projections for the 2014 salmon season are based on qualitative assessments of parent-year escapements, subjective determinations of freshwater overwintering and ocean survival, and, in the case of the commercial fishery, the projections of local market conditions. The Chinook salmon run is expected to be very weak and similar to the 2013 run, with no commercial fishing targeting Chinook salmon expected. Additional preemptive subsistence restrictions are also likely for southern Norton Sound in order to conserve Chinook salmon to reach escapement goals. These restrictions include preemptive closures or reductions in fishing time in marine waters, inriver closures to gillnets with a mesh size greater than 4.5 in, and 6 in or less mesh size restrictions in marine waters. However, beach seining subsistence opportunity will be provided early in the run to allow the take of other, more plentiful species like pink and chum salmon.
Chum salmon runs are expected to be average in southern Norton Sound Subdistricts (Norton Bay, Shaktoolik, and Unalakleet) based on the recent 5-year trend of average to above-average chum salmon abundance in southern Norton Sound and sibling relationship analyses. As a result, directed chum salmon fishing is anticipated to commence as early as the third week of June in Norton Bay Subdistrict but no earlier than July 1 in Shaktoolik and Unalakleet Subdistricts because of Chinook salmon conservation concerns. In 2014, northern Norton Sound chum salmon runs are expected to be below average to average. Chum salmon abundance is anticipated to be sufficient to reach escapement goals and perhaps provide for a limited chum salmon
48

commercial harvest in Subdistricts 2 (Golovin) and 3 (Elim). A limited commercial fishery for chum salmon is possible in Nome Subdistrict dependent on a sufficient chum salmon run to obtain escapement goals throughout the subdistrict. Overall projected commercial harvest of chum salmon in Norton Sound is expected to range between 80,000–110,000 fish with an increased contribution to this harvest expected for Norton Bay Subdistrict due to improvements in tendering capacity, a good forecast, and a flexible management plan.
ADF&G expects the pink salmon run to be average for an even-numbered year, and dependent on buyer interest the harvest could be 250,000–500,000 fish. No subsistence fishing restrictions for pink salmon are expected.
The coho salmon run in 2014 is expected to be average based on recent 5-year trends in abundance and ocean conditions, as well as parent-year escapements and freshwater rearing conditions for the 2010 brood year. Northern Norton Sound contributions to the coho salmon run are expected to be below average to average, based on less-than-favorable freshwater rearing conditions. Conversely, southern Norton Sound runs of coho salmon in 2014 are expected to range from average (Subdistricts 5 and 6) to above average (Subdistrict 4) based on favorable freshwater rearing conditions. Considering these factors collectively, the commercial harvest is expected to range from 60,000 to 90,000 coho salmon. Coho salmon subsistence fishing restrictions are not expected.
2013 PORT CLARENCE SALMON FISHERY Commercial Fishery Season Summary No commercial salmon fishing was allowed in 2013. ADF&G had projected, and later confirmed by counts from the Pilgrim River weir, that the sockeye salmon run for Pilgrim River in 2013 would not reach the inriver goal of 30,000 sockeye salmon that is necessary for a commercial fishery to occur.
Subsistence Fishery Season Summary Subsistence fishing permits have been required for Pilgrim River since 1964, and beginning in 2003 the number of permits issued has skyrocketed with the record sockeye salmon runs in the mid-2000s. In 2013 a record 265 permits were issued, surpassing the previous record in 2008 when 255 permits were issued (Menard et al. 2012). Pilgrim River estimated subsistence harvests by species were 8 coho salmon, 48 pink salmon, 2,761 sockeye salmon, and 282 chum salmon (Table 2). This was the first year since 2008 that subsistence salmon gillnet fishing was not closed during part of the season on Pilgrim River.
The size of the Pilgrim River sockeye salmon run greatly affects the number of issued subsistence permits. The first year of the great runs of sockeye salmon (2003), there were 100 permits issued. In 2004, there were 223 permits issued (permit data on file with ADF&G, Division of Commercial Fisheries; Nome). For comparison, in 2002 only 25 permits were issued, and a counting tower in operation that year at the same location as the present-day weir estimated less than 4,000 sockeye salmon passing (Appendix B2).
Although permits have been required in the Pilgrim River drainage for 50 years, 2013 was only the tenth year that permits were required throughout Port Clarence District. The number of subsistence salmon permits issued for all waters of Port Clarence District, excluding Pilgrim
49

River and Salmon Lake, was 162 permits, compared to 147 permits issued last year. Salmon Lake was opened in September in the northeast section and 4 permits were issued (Table 2).
Escapement Aerial surveys are not typically flown in Port Clarence District except for Salmon Lake because higher priority is assigned to Nome Subdistrict and surrounding areas where commercial fishing occurs. Aerial surveys had shown an increasing trend of sockeye salmon returns to Salmon Lake since 1990 (Appendix B1). However, the sockeye salmon run crashed beginning in 2009, and ADF&G has had to have subsistence fishing restrictions on Pilgrim River in 4 of the last 5 years. An aerial survey in 2012 of Salmon Lake and Grand Central River estimated 4,730 sockeye salmon in Salmon Lake and 1,100 sockeye salmon in Grand Central River, a tributary to Salmon Lake. The combined aerial survey count of 6,971 sockeye salmon in 2013 was higher than both the 2012 (5,830) and 2011 (5,144) counts, and was the third time in a row the escapement goal has been reached since 2008 (survey data on file with ADF&G, Division of Commercial Fisheries; Nome). The combined aerial survey escapement goal for Salmon Lake and Grand Central River is 4,000–8,000 sockeye salmon (Table 3).
Salmon Lake had an average sockeye salmon spawning population of roughly 12,500 fish in the 5 years previous to 2003. But from 2003 to 2007, sockeye salmon escapements skyrocketed, and average weir count for the 5-year period was almost 56,000 sockeye salmon (Appendix B2). Average count for the next 5 years decreased greatly, to less than 8,000 sockeye salmon. From 2012 to 2013, the count improved by 75%, from 7,085 to 12,428 sockeye salmon ( Appendix B2).
Enforcement In 2013, one AWT officer patrolled Pilgrim River in Port Clarence District.
2014 PORT CLARENCE SALMON OUTLOOK The guideline harvest range (GHR) set by BOF for the Port Clarence commercial sockeye salmon fishery allows for a harvest of up to 10,000 sockeye salmon. Based on recent history, ADF&G expects that the inriver goal of 30,000 sockeye salmon for Pilgrim River will not be met; therefore, no commercial fishing is expected in 2014. In addition, based on escapement and smolt data, the sockeye salmon run is expected to drop, and subsistence fishing restrictions may occur during the second week of July or later, if necessary. Chum and pink salmon are expected to have sufficient runs allowing for subsistence fishing.
ADF&G will compare the 2014 run with sockeye salmon escapement counts at the weir from the last few years and determine whether any subsistence fishing restrictions are needed.
2013 KOTZEBUE SOUND SALMON FISHERY Commercial Fishery Season Summary The Kotzebue Sound District commercial salmon fishery opened on July 10 and closed after the August 31 fishing period. Similar to the previous year, there was a very strong run of chum salmon and again commercial fishing time was limited, mostly in August, because of insufficient cargo space on airplanes to get the catch out to processing facilities.
50

During most of July, there was sufficient airplane capacity for the fleet to fish 6 days a week and fishing periods were 4 to 8 hours in length. Starting in late July until the third week of August, periods were 4 hours or less because of the high catches during the traditional peak weeks of harvest. During the last week of August, fishing periods were increased to 12 hours a day as a result of decreasing catches, reduced fishing effort, and sufficient airplane capacity.
There were 66 permit holders who sold chum salmon in 2013 (Appendix C1). Of these, 65 permit holders sold fish to the major buyer, Great Pacific Seafoods. One catcher–seller sold to a second buyer, Maniilaq Services, Incorporated, and also to Kotzebue area residents. In late August, with the decreasing catches, Maniilaq began to buy from additional permit holders who had been previously selling to Great Pacific. Maniilaq purchased from 21 permit holders during the season. There was a 20% drop in the number of permit holders selling fish this year compared to last year (Appendix C1). The price per pound for chum salmon dropped 16% from last year (Appendix C3) and may have been a factor in the number of permit holders fishing this season.
The overall chum salmon run to Kotzebue Sound in 2013 was estimated to be well above average based on commercial harvest rates, subsistence fishermen reporting good catches, and the Kobuk test fish index being the highest in the 21-year project history (Table 10).
The commercial harvest of 319,062 chum salmon was the highest since the 1980s (Appendix C1). There were 67 chum salmon kept for personal use included in the commercial harvest total. Also kept for personal use were 16 Chinook salmon, 13 sockeye salmon, 42 pink salmon, 43 coho salmon, 302 Dolly Varden, 705 sheefish, and 50 whitefish (Table 9). However, there were likely some additional fish kept for personal use that did not get reported on fish tickets.
A total of 2,555,304 pounds of chum salmon (average weight 8.0 lbs) were sold at an average of $0.27 per pound (Appendices C2 and C3). The total exvessel value was $689,163. The average value for each participating permit holder was $10,442. The total exvessel value was almost two and a half times that of the average from the last 20 years (Appendix C4).
In the Kotzebue fishery, gear is limited to set nets with an aggregate of no more than 150 fathoms per permit holder. Fishermen generally operate with an end on or near shore and with all 3 shackles connected. Fishermen also set in deeper channels in the mud flats farther out from shore. Most gear used in the district is 5.875 in (14.9 cm) or 6 in (15.2 cm) stretch mesh gillnet.
Age, sex, and length (ASL) composition was taken from commercial catch samples but was not used to manage the fishery. The majority of the chum salmon each year are usually 4- and 5-year-old fish. In 2013, commercial catch samples were 4% age-0.2 fish, 54% age-0.3 fish, 40% age-0.4 fish and 2% age-0.5 fish. Historical comparisons showed the catch samples falling within the range of previous years (http://www.adfg.alaska.gov/CommFishR3/ WebSite/AYKDBMSWebsite/Default.aspx).
Subsistence Fishery Season Summary Subsistence household salmon surveys were regularly conducted in Kotzebue District from 1990 to 2004 by the Division of Subsistence (DOS), and again starting in 2012, when comprehensive subsistence fish harvest data were collected from 6 Kotzebue area villages by DOS. In 2012, total subsistence chum salmon reported caught was 26,693 salmon, more than in 2003 and 2004, the last 2 years that the same 6 villages were surveyed (Appendices C5 and C6), and subsistence chum harvest per household averaged 70 salmon for Kobuk River villages (Appendix C7).
51

Subsistence survey information from 2013 is not yet available, but funding is available for DOS to conduct surveys through 2014 (Nikki Braem, Subsistence Resource Specialist, ADF&G, Fairbanks; personal communication).
Escapement This year’s test fishing chum salmon CPUE cumulative index at ADF&G test fish project on Kobuk River near Kiana was 2,698 points and was a record index at the Kobuk River test fish project (Table 10). The Kobuk River test net catch samples were 6% age-0.2 fish, 33% age-0.3 fish, 60% age-0.4 fish and 1% age-0.5 fish. Historical comparisons show the catch samples falling within the range of previous years. High and turbid water prevented aerial surveys of the Kobuk River and Noatak River drainages in 2013.
Enforcement One AWT officer patrolled the Kotzebue Sound District 2013 commercial salmon fishery.
2014 Kotzebue Salmon Outlook The outlook for the 2014 season is based on the parent-year returns and returning age classes observed in the commercial catch samples and in the test fishing catch samples from the Kobuk River in 2013. During the 2014 season, the 4-year-old component of the run is expected to be above average based on the 3-year-old return. The 5-year-old component of the run is expected to be average based on the 4-year-old return this past season. The 3-year-old and 6-year-old age classes are much smaller components of the run and are expected to be average (age data on file with ADF&G, Division of Commercial Fisheries; Nome). The commercial harvest is expected to fall within the range of 250,000 to 275,000 chum salmon, if market conditions can accept that level of harvest.
52

SECTION 3: PACIFIC HERRING FISHERIES
2013 NORTON SOUND PACIFIC HERRING FISHERY Sac Roe In contrast to last year when there was no herring sac roe fishery, there was a fishery in 2013 and 490 tons of sac roe herring were harvested by 40 permit holders (Table 11). The majority of the sac roe herring harvest was from the Cape Denbigh area (Subdistrict 3). Historical information for the Norton Sound commercial sac roe fishery can be found in Appendix D2 and Menard et al. 2013. Other historical fisheries information is presented in Appendices D1 and D3.
Spawn-on-Kelp There was no market interest expressed in the commercial spawn-on-wild-kelp (Fucus sp.) or Macrocystis spawn-on-kelp fisheries in 2013.
Bait Fishery Two tons of herring were bought as bait during the sac roe fishery.
Commercial Fishery Management ADF&G projection for the 2013 herring spawning biomass for Norton Sound was 58,594 tons. At 20% exploitation rate, the guideline harvest level (GHL) for the Norton Sound District fishery was 11,719 tons with 11,399 tons allocated to the sac roe fishery. NSEDC was successful at developing a market for 800–1,200 tons of sac roe herring in 2013. However, only 41–61% of the desired harvest was obtained before the floating processor had to depart for Bristol Bay salmon fishery on June 21 (Appendix D2). As in 2010, extensive pack ice in the northern Bering Sea delayed the arrival of tender and processing vessels in Norton Sound. Additionally, extensive shorefast ice in southern Norton Sound also severely hampered fishing effort during the second week of June when herring spawning biomass was building in the St. Michael (Subdistrict 1) and Cape Denbigh (Subdistrict 3) Subdistricts. With the exception of Shaktoolik, permit holders had difficulty departing from southern Norton Sound villages until after June 10 due to shorefast ice. Even though the harvest was small, roe recovery averaged 13.2%, the third highest on record and the third consecutive season that roe percentages have exceeded 13% (Appendix D2).
A temporary lead in shorefast ice allowed the ADF&G field crew to deploy for Cape Denbigh from Unalakleet on June 10 to conduct test fishing operations. The 2013 season was the first season since 2008 in which test fishing operations were conducted throughout the entire herring spawning season. Test fishing operations commenced on morning of June 11. The test fishery crew’s first successful variable-mesh gillnet (VMG) haul occurred on June 12 when 51 herring were sampled from a catch of 306 herring on the western end of Cape Denbigh in front of Elim Beach. Approximately 85% of the catch occurred in the 2.0-inch mesh panel of the VGM. Test fish operations were conducted daily morning and evening from June 12–18 and a total of 452 VMG samples were collected, the majority originating from the Elim Beach area. During this
53

time, the crew also collected 615 samples from tender vessels operating in the Cape Denbigh Subdistrict throughout the duration of the fishery (data on file with ADF&G, Division of Commercial Fisheries; Nome). The crew departed the Cape Denbigh area on June 18 because the fishery was winding down and they wanted to avoid forecasted hazardous surf conditions that would have significantly delayed their return to Unalakleet.
Catch Reporting and Enforcement No AWT officers were on Norton Sound herring grounds during the 2013 fishery because of the ice conditions preventing a sac roe fishery. Catch reporting for the bait fishery was sufficient for the limited harvest, and a final report was submitted to ADF&G.
Biomass Determination There were no Norton Sound herring aerial surveys conducted this season by NSEDC or ADF&G biologists because of ice conditions that made surveying and accurately estimating herring biomass impossible.
2014 NORTON SOUND PACIFIC HERRING OUTLOOK The 2014 projected biomass for Norton Sound District is 52,138 tons. A 20% exploitation rate would result in a GHL of 10,428 tons. A maximum of 320 tons of herring are reserved to allow for the pound fishery to harvest a maximum of 90 tons of product (combined weight of herring roe and kelp). This leaves 10,108 tons for sac roe harvest. The beach seine harvest is allocated 10% of the sac roe projected harvest, or 1,011 tons. The 2014 herring fishery will be opened by emergency order and the fishery will close by emergency order when up to 20% of the available herring biomass has been harvested. Varied harvest rates may be applied to individual subdistricts based on biomass distribution, roe quality, weather, and sea ice conditions. Herring ages 6 and 7 are expected to make up 30% of the returning biomass (Appendix D13). Herring age 8 and older are expected to make up 64% of the biomass. If there are more favorable ice conditions in 2014, ADF&G expects to conduct a more comprehensive test fishery, and a commercial sampling program is anticipated for the 2014 season to obtain more representative age class data from the spawning biomass and harvest.
54

SECTION 4: KING CRAB FISHERIES
NORTON SOUND CRAB FISHERY Abundance The ADF&G length-based population model estimated harvestable legal male crab biomass for the 2013 summer commercial crab fishery at 4.13 million lb (1.56 million crab), a decrease of 2% from the revised model biomass estimate of 4.22 million lb (1.56 million crab) for legal male crab for 2012. An exploitation rate of 12% on the harvestable population equates to a guideline harvest level (GHL) of 495,600 lb of crab. This follows the revised harvest strategy set in regulation by the BOF in March of 2012. By regulation, the CDQ fishery is allocated 7.5% of the GHL; therefore, the CDQ harvest quota was set at 37,170 lb preseason, with the open access fishery allocation set at 458,430 lb.
Summer Open Access Commercial Fishery The 2013 summer open access commercial crab fishery was opened by emergency order at noon on July 3 in the Norton Sound Section, with a GHL of 458,430 pounds of crab. Two companies, Norton Sound Seafood Products (NSSP) and Aquatech, were registered to buy crab, and 5 fishermen registered to sell crab dockside as catcher–sellers or catcher–processors. NSSP operated a seafood processing plant in Nome and 2 tenders in eastern Norton Sound. A fisherman based in Unalakleet shipped live crab via airplane to Aquatech in Anchorage. The majority of crab was delivered to NSSP, whereas the catcher–sellers sold crab directly to local residents as well as to NSSP. The 2 catcher–processors sold to a live market in Korea and to NSSP.
The first open access delivery was made on July 5 and final delivery was made September 15, the day after the open access portion of the fishery was closed by emergency order at 6:00 PM, for a total season length of 74 days, compared to 44 days in 2012 (Table 12). This year, the season start was delayed for a few days because NSSP found poor meat fill in some of their test fishery crab; however, once the open access season was under way, both land-based buyers purchased crab continuously with no further reports of poor crab meat fill until the very end of the season.
In 2013, catch rate was poor for the entire fleet and by the end of July the projected trend line showed that if the catch rate did not change, the quota would not be reached until the second half of September. On August 1, to allow the fleet to efficiently obtain the allowable harvest of red king crab, the closure line south of Nome from 166°15′W (Sledge Island) and 163°30′W (near Square Rock) was moved by emergency order north by 3 miles, to 64°18′N from 64°15′N (Appendix E11). On August 7, to allow more of the fleet additional fishing opportunity, the closure line between162°38′W (Carson Creek) and 162°W (the eastern border of statistical area 626401) was moved by emergency order north by 5 miles to 64°15′N, and the closure line between 162°W and 161°30′W (Cape Denbigh) was also moved north, by 3 miles to 64°18′N (Appendix E11). Catch rates increased slightly and temporarily for the portion of the fleet that fished in the western half of Norton Sound but did not improve for the crabbers fishing in the east side of Norton Sound. By the second half of August, the trend line projected the quota would not be
55

reached. Because most of the registered buyers were still interested in purchasing crab, the fishing time was extended from September 3 to September 10, by which time a few newly molted crab had shown up in the fishery. A shorter extension was granted, to September 13, but safety concerns due to adverse marine conditions resulted in the final closure date of September 14.
The open access harvest from fish ticket reports was 124,485 red king crab or 373,278 lb (81% of the open access quota; Table 12). Of this total, 882 lb were reported as deadloss and 6,248 lb as personal use. A total of 33 vessels and 33 permit holders made 435 landings, and average weight for commercially caught crab was 3.0 lb. Including CDQ, the number of pots registered was 1,420, and there were 15,058 pot pulls, for a season CPUE of 9 crab. In 2013, the total catch rate tracked very closely to 2009; these 2 years had the lowest catch rates out of the last 6 years (Appendix E9). Average price paid (including CDQ catch) was $5.63 per lb, the highest amount ever paid (Appendix E3). Exvessel value of the fishery (including CDQ) was $2.165 million, second only to the record-setting amount paid out in 2012 of $2.556 million, the highest since 1994 when Norton Sound was designated a superexclusive area, which effectively changed the character of the fishery from a large vessel to a small vessel fishery (Appendix E10).
CDQ Fishery For the fourth time in the last 5 years, the CDQ fishery opened concurrently with the open access fishery in 2013. The first CDQ delivery was made on July 16 and the last delivery was made September 15, when 18,585 lb (50% of the allocated 37,170 lb) had been harvested, for a total length of 74 days (Table 12 and Appendix E1). In 2013, as in the previous 6 years, YDFDA transferred their CDQ quota to NSEDC; however, due to the poor catch rate all season, NSEDC only harvested their original half of the CDQ quota, resulting in the first time in 10 years that the fishery did not harvest all, or nearly all, of the allocation. Seven permit holders were registered to fish the CDQ fishery, but only 4 fished, making a total of 25 landings and 862 pots lifts. Average price paid to fishermen was $5.50 per lb, for an exvessel value of $101,250 for the CDQ fishery. This was the thirteenth year a CDQ harvest occurred since the CDQ fishery was implemented in 1998.
Harvest Areas and Commercial Catch Sampling Fish ticket reports document fourteen statistical areas were fished in the open access and CDQ fisheries (Table 13), compared to 9 areas in 2012. Unlike last year, the top harvest came from statistical area 656401 (38%). As the crabbers moved around more this year trying to find the crab, their harvests came from a larger area instead of being concentrated as in years past. Several statistical areas yielded harvests of 9–15%: 646401 (15%), 656402 (10%), 626401 (9%), 636401 (9%), and 666401 (9%). Except for statistical area 656402, which was temporarily opened this year, all the other listed statistical areas are directly south of the original closed boundary line (Appendix E11). The catch from statistical areas east of 164°W longitude made up 23% of the harvest, less than half of the 56% last year (Appendices E1 and E12).
Carapace length (CL) measurements and shell age were collected from 6,072 commercially caught crab during the open access and CDQ fisheries. Carapace age was classified as new (2–12 months old) or old (over 13 months old). Male new-shell crab made up 91% of the total legal crab sampled, and old-shell crab made up 9%. Recruit crab are new-shell legal crab < 116 mm CL. Postrecruit crab are legal new-shell male crab > 116 mm CL and all legal old-shell males.
56

Recruit crab made up 32% of the legal crab sampled and postrecruit crab made up 68%, the highest percentage of postrecruit crab since 2006 (Appendix E4). Overall mean carapace length of legal male crab was 120 mm. For comparison of historical length composition of Norton Sound red king crab summer commercial harvests from 1990 to 2013, see Appendices E15–E20.
Enforcement No AWT trooper made dockside checks during the 2013 summer crab fishery; however, an ADF&G staff member who worked the king crab fishery was deputized to cite violations if necessary.
Winter Commercial Fishery The winter commercial season opened November 15, 2012, and 34 fishermen registered. One land-based processor (NSSP) and 2 land-based catcher–processors registered to buy crab, and 7 fishermen registered to sell crab dockside as catcher–sellers. Based on fish tickets submitted, the first landing was made December 22, 2012. From then until the last landing on May 15, when the season closed, the 26 fishermen that fished made a total of 495 landings, with an overall CPUE of 4 and an average weight of 2.75 lb/crab. Price of crab averaged $6.73/lb, slightly higher than the $6.47/lb price in 2012, and total exvessel value of the fishery was $402,256, almost 3 times the amount from 2012 ($150,569). A total of 22,639 crab (62,179 lb) were harvested, with percentages of crab sold (and CPUE) each month as follows: December 1% (2), January 11% (3), February 25% (4), March 26% (5), April 24% (3), and May 13% (3). Total number of crab harvested was over twice that of 2012 and over six times the average harvest from 1990 to 2012 (Appendix E5). As an indicator of nearshore ice stability, commercial fishermen reported losing 23 out of 389 pots (6%) during the 2012–2013 winter season. Pots were fished from 10 miles east to 18 miles west of Nome, excluding the area closed to commercial fishing from 3.5 miles east to 2.0 miles west of Nome. Similar to years previous to 2012, the majority of crabbers (16) and harvest (93%) came from the Nome area, with the remaining crabbers and harvest coming from Elim, Golovin, Shaktoolik, and St. Michael/Stebbins areas. Unlike last year, ice was unstable in most of eastern Norton Sound; therefore, no crabbers from Unalakleet even registered to fish the winter commercial crab fishery.
The harvest is generally divided between local residents who buy crab directly from the crabbers, the seafood plant (NSSP) in Nome, and other nonlocal markets such as Anchorage. Starting in 2013, the 2 catcher–processors shipped live crab to Korea. Most crabbers consider the winter commercial crabbing a sideline and hold other jobs. Usually, a few of the winter crab fishermen sell the majority of the crab.
Subsistence Fishery Both a summer and a winter subsistence red king crab fishery occur in Norton Sound, although the majority of the effort and harvest is from the winter fishery (Appendices E5 and E6). During the 2012–2013 winter crab season, all but one of the 149 permits issued were returned, and the 104 permit holders that actually fished reported retaining 7,662 crab, similar to the 7,371 crab retained in 2012. The number caught, which included crab thrown back to the ocean, was 21,752 crab, the greatest amount caught since 1984, when records started to be kept of total crab caught; however, the amount kept was only the eighth highest since 1984. Incidental reports from subsistence crabbers in Nome indicated an unusually high number of smaller male crab and female crab caught in their pots, which resulted in many crab thrown back in the sea. Residents
57

of Brevig Mission, Diomede, Elim, Golovin, St. Michael, Shaktoolik, Stebbins, Unalakleet, and White Mountain had a combined harvest of 983 crab, which was 13% of the total harvest. Out of 197 pots reported fishing, 4 (2%) were reportedly lost during the season due to moving ice (Appendix E7). Percentages of subsistence crab harvested each month are as follows: December 2%, January 6%, February 31%, March 35%, April 21%, and May 5%. Like 2012, more than 99% of the crab were caught with pots in 2013 (permit data on file with ADF&G, Division of Commercial Fisheries; Nome).
During the 2013 Norton Sound summer subsistence crab season, 47 permits were issued and 46 were returned. The 26 fishermen that actually fished reported harvesting a total of 1,865 crab, over half of which came from Nome area and over a third of which came from Unalakleet area, with the remainder harvested by villagers from Brevig Mission, Elim, or White Mountain. Crab kept per fisherman averaged 72 crab for summer 2013 (Appendix E6).
Sport Fishery Sport fishermen can fish for crab, and a harvest log issued by the Nome office similar to a subsistence permit is required. Sport fishermen are only allowed to keep 6 male crab daily, and they must be of legal size (4.75 in or greater). The only recent harvest by sport fishermen was in 2005. That year, 9 harvest logs were issued and 8 were returned, showing that 6 nonresident sport fishermen caught 918 crab and kept 106, for an average harvest of 18 crab per fisherman (permit data on file with ADF&G, Division of Commercial Fisheries; Nome).
Future Resource Investigations The triennial Norton Sound Trawl Survey will take place in the summer of 2014. Red king crab biomass estimates from the trawl survey are an integral part of the data used in the length-based population model to project the summer king crab legal biomass (during years when no trawl survey occurs) and appropriate GHL for the summer commercial king crab fishery.
A winter pot study that had been conducted annually in nearshore waters of Nome since the early 1980s was replaced with a much larger tagging project in the summer and fall of 2012 and 2013. Results of the winter project have been used in the length-based model to project the summer legal biomass and appropriate GHL for the upcoming summer commercial crab fishery. Size composition by year from the winter king crab project is shown in Appendix E8. This summer tagging project is planned for June 2014, and the results will be compared with previous winter tagging projects.
ST. LAWRENCE ISLAND CRAB FISHERY Commercial Fishery In 2006, the BOF split the St. Lawrence Island section between north and south of 66° N latitude. In the northern section, now known as the Kotzebue section, the commercial season was from noon June 15 through August 1. The southern section was merged with Norton Sound section. This change was initiated by Norton Sound area fishermen to expand fishing opportunity to an area with little commercial utilization since 1995. No harvest was reported from this new area in 2013. No permit holders fished in the Kotzebue section in 2013.
58

SECTION 5: MISCELLANEOUS SPECIES
INCONNU (SHEEFISH) Commercial Fishery Although inconnu, commonly known as sheefish, may have been harvested and sold in the winter of 2012–2013, no fish tickets were submitted to ADF&G. In Kotzebue Sound District, no fishermen reported selling inconnu (Appendix F1). Sheefish are not commonly found in either Norton Sound or Port Clarence Districts.
Subsistence and Sport Fishery In 2012 and 2013, there were comprehensive subsistence surveys for fish and wildlife harvests of 6 Kotzebue area villages conducted by the Division of Subsistence. In 2012, surveyed households in 5 Kobuk River villages and Noatak reported harvesting 11,693 sheefish, more than any other year since 1990 (Appendix F2). However, because survey effort was limited during many years, harvest numbers should be considered minimal and are not comparable year to year. Information is not yet available for 2013. Sport fish harvest reports indicate a harvest of 218 sheefish in Kotzebue Sound District in 2013 (Brendon Scanlon, Sport Fish Biologist, ADF&G, Fairbanks; personal communication). Sheefish sport harvests in the last 10 years have averaged approximately 850 annually (Appendix F3).
Escapement No aerial surveys are flown to determine sheefish escapement. An ADF&G test fishing project on the Kobuk River helps to give an index of abundance, but the test fishery is operated to determine the index of chum salmon abundance and begins operation well after sheefish have begun to pass the site. In 2013, test fishing on Kobuk River resulted in 310 sheefish caught in 208 drifts, for a cumulative CPUE of 330. The CPUE ranked eleventh out of 16 years sheefish catches were recorded (data on file with ADF&G, Division of Commercial Fisheries; Nome).
DOLLY VARDEN Commercial Fishery Dolly Varden Salvelinus malma are occasionally incidentally caught in commercial salmon fisheries in Norton Sound and Kotzebue Districts. During the 2013 commercial salmon fishery, Kotzebue District reported 302 Dolly Varden caught but not sold, similar to last year when 300 were caught and not sold (Appendix F4).
Subsistence and Sport Fishery Subsistence harvest data for Dolly Varden were not recorded for Norton Sound or Port Clarence, and household surveys for Dolly Varden subsistence catches were not conducted in Arctic communities. A comprehensive survey of fish harvests was done in Kobuk River villages and Noatak by the Division of Subsistence in 2012 and 2013. In 2012, surveyed Noatak households
59
reported harvesting 6,437 Dolly Varden (Appendix F5). Information is not yet available for 2013.
Sport fish harvest was 1,184 Dolly Varden in Norton Sound and 1,074 Dolly Varden in Kotzebue/Chukchi Sea areas in 2013 (Appendix F3). Overall, Dolly Varden sport fish harvests in the last 10 years in Norton Sound averaged over 3,000 annually, with most fish harvested out of the Unalakleet River (Appendix F6).
Escapement Dolly Varden escapement is determined from aerial surveys conducted by ADF&G Sport Fish Division in the Kotzebue area, and weir or tower counts in Norton Sound. In 2013, a survey on the Wulik River counted a total of 23,312 Dolly Varden, although the count should be considered a rough estimate because counting conditions were poor due to the presence of river ice (Appendix F7).
WHITEFISH Commercial Fishery Commercial whitefish harvest information for the 2012–2013 season was 105 pounds in Norton Sound District (Appendix F9).
Subsistence and Sport Fishery Subsistence harvest data for whitefish were not recorded for Norton Sound, Port Clarence or Arctic Districts, but a comprehensive survey of fish subsistence harvests by the Division of Subsistence was conducted in Kobuk River villages and Noatak in 2012 and 2013. In 2012, survey data showed that 41,229 whitefish were harvested for 6 villages in Kotzebue District (Appendix F8). Information is not yet available for 2013. Harvest numbers are considered minimal and are not comparable year to year. For the sport fishery, no harvest data are collected in Norton Sound, Port Clarence, or Kotzebue Sound Districts for whitefish.
SAFFRON COD Commercial Fishery During the 2012–2013 season, 25 permit holders harvested 33,939 lb of saffron cod Eleginus gracilis, commonly known as tomcod, in Norton Sound and sold them to a commercial buyer at $0.50/lb for use as bait (Appendix F10).
Subsistence and Sport Fishery In Norton Sound areas tomcod are primarily fished by “jigging” through the ice. Because no subsistence permit is required and a sport fish license is not needed for Alaska residents in northern Norton Sound from Cape Prince of Wales to Bald Head, harvests of tomcod are not reported or documented. In 2013, Norton Sound household subsistence surveys were conducted; however, subsistence harvest information of tomcod was not collected.
60

CAPELIN Commercial Fishery No reported commercial fishery has occurred for capelin Mallotus villosus, although there are substantial stocks in northern Norton Sound (Pahlke 1985).
Subsistence Because no subsistence permit for capelin is required, accurate harvests of capelin are not reported or documented. In 2013, one of the latest capelin spawning events observed on Nome beaches occurred on July 19, compared to mid-June in most years when capelin are observed spawning on Nome beaches. Many residents harvested capelin with various gear, such as nets, buckets, plastic bags, and shovels. No other information on capelin harvest is available.
ACKNOWLEDGEMENTS Employees of the Alaska Department of Fish and Game, U.S. Fish and Wildlife Service including the Office of Subsistence Management, Bureau of Land Management, National Park Service, Norton Sound Economic Development Corporation, Unalakleet IRA, LGL, and other agencies and organizations worked long and irregular hours at various locations throughout the Norton Sound, Kotzebue, and Port Clarence Areas collecting data presented in this report. We gratefully acknowledge their hard work and funding support.
61

REFERENCES CITED Barton, L. H. 1978. Finfish resource surveys in Norton Sound and Kotzebue; final report, Alaska Marine
Environment Assessment Project, Research Unit 19. Alaska Department of Fish and Game, Division of Commercial Fisheries, AYK Region OCS Report No. 13, Anchorage.
Bockstoce, J. 1979. The archeology of Cape Nome, Alaska. The University Museum, University of Pennsylvania, Philadelphia.
Bue, F. J., T. L. Lingnau, C. F. Lean, and E. L. Brennan. 1997. Annual management report 1996, Norton Sound–Port Clarence–Kotzebue. Alaska Department of Fish and Game, Division of Commercial Fisheries Management and Development, Regional Information Report 3A97-30, Anchorage.
Clark, J. H. 2001. Biological escapement goal for chum salmon in District 1 of Norton Sound. Alaska Department of Fish and Game, Division of Commercial Fisheries, Regional Information Report 3A01-09, Anchorage.
DeCicco, F. 2001. Fishery management report for sport fisheries in the Northwest Alaska regulatory areas, 1999-2000. Alaska Department of Fish and Game, Fishery Management Report No. 01-01, Anchorage.
Estensen, J. L., G. L. Todd, and C. S. Monsivais. 2005. Estimation of abundance and distribution of chum salmon in the Unalakleet River drainage, 2004. Alaska Department of Fish and Game, Fishery Data Series No. 05-52, Anchorage.
Estensen, J. L., and T. Hamazaki. 2007. Estimation of abundance and distribution of chum salmon (Oncorhynchus keta) in the Unalakleet River drainage, 2005. Alaska Department of Fish and Game, Fishery Data Series No. 07-03, Anchorage.
Gaudet, D. M., and G. Schaefer. 1982. Migrations of salmon in Norton Sound, Alaska determined by tagging in 1978-1979. Alaska Department of Fish and Game, Division of Commercial Fisheries, Informational Leaflet No. 198, Juneau.
Georgette, S., D. Caylor, and S. Tahbone. 2003. Subsistence salmon harvest summary, northwest Alaska 2002. Alaska Department of Fish and Game, Division of Subsistence and Kawerak, Inc.
Georgette, S., and A. Shiedt. 2005. Whitefish: traditional ecological knowledge and subsistence fishing in the Kotzebue Sound Region, Alaska. Alaska Department of Fish and Game and Maniilaq Association, Technical Paper No. 290, Juneau.
Joy, P., A. L. J. Brase, and D. J. Reed. 2005. Estimation of coho salmon abundance and spawning distribution in the Unalakleet River 2004. Alaska Department of Fish and Game, Fishery Data Series No. 05-38. Anchorage.
Joy, P., and D. J. Reed. 2006. Estimation of coho salmon abundance and spawning distribution in the Unalakleet River 2005. Alaska Department of Fish and Game, Fishery Data Series No. 06-38. Anchorage.
Joy, P., and D. J. Reed. 2007. Estimation of coho salmon abundance and spawning distribution in the Unalakleet River 2004-2006, final report for study 05-101 USFWS, Office of Subsistence Management Fishery Information Service Division. Alaska Department of Fish and Game, Fishery Data Series No. 07-48. Anchorage.
Kent, S. 2010. Unalakleet River salmon studies, 2002-2008. Alaska Department of Fish and Game, Fishery Data Series No. 10-83, Anchorage.
Magdanz, J. S., and D. E. Punguk. 1981. Nome River fishery II. Alaska Department of Fish and Game, Division of Subsistence, Technical Paper No. 5, Nome.
Menard, J., J. Soong, and S, Kent. 2010. 2008 Annual management report Norton Sound, Port Clarence, and Kotzebue. Alaska Department of Fish and Game, Fishery Management Report No. 10-49, Anchorage.
Menard, J., J. Soong, and S. Kent. 2012. 2011 Annual management report Norton Sound, Port Clarence, and Kotzebue. Alaska Department of Fish and Game, Fishery Management Report No. 12-39, Anchorage.
Menard, J., J. Soong, S. Kent, and A. Brown. 2013. 2012 Annual management report Norton Sound, Port Clarence, and Kotzebue. Alaska Department of Fish and Game, Fishery Management Report No. 13-28, Anchorage.
62

REFERENCES CITED (Continued) NPFMC (North Pacific Fisheries Management Council). 2013. Stock assessment and fishery evaluation report for
the king and Tanner crab fisheries of the Bering Sea and Aleutian Islands Regions. Stock Assessment and Fishery Evaluation Reports. North Pacific Fishery Management Council. 605 W. 4th Ave., #306, Anchorage.
Pahlke, K. A. 1985. Preliminary studies of capelin (Mallotus villosus) in Alaska waters. Alaska Department of Fish and Game, Division of Commercial Fisheries, Informational Leaflet 250, Juneau.
Pedersen, S., and A. Linn Jr. 2005. North Slope (Kaktovik) subsistence fish harvest assessment. USFWS Office of Subsistence Management, Fisheries Resource Monitoring Program, Annual Report No. FIS 01-101, Anchorage.
Pedersen, S., and S. C. Hugo. 2005. North Slope (Anaktuvuk Pass) subsistence fish harvest assessment. USFWS Office of Subsistence Management, Fisheries Resource Monitoring Program, Annual Report No. FIS 02-050-3, Anchorage.
Ray, D. J. 1975. The Eskimos of Bering Strait, 1650-1898. University of Washington Press, Seattle.
Scanlon, B. 2009. Fishery management report for sport fisheries in the Northwest/North Slope Management Area, 2008. Alaska Department of Fish and Game, Fishery Management Report No. 09-48, Anchorage.
Thomas, D. C. 1982. The role of local fish and wildlife resources in the community of Shaktoolik, Alaska. Alaska Department of Fish and Game, Division of Subsistence, Technical Paper No. 13, Nome.
Todd, G. L., C.S. Monsivais, and D. F. Kaplan. 2005. Estimation of chum salmon abundance, migration timing, and spawning distribution in the Fish River complex, Norton Sound Alaska, 2002-2004. Alaska Department of Fish and Game, Fishery Data Series No. 05-67, Anchorage.
Wuttig, K. G. 1998. Escapement of Chinook salmon in the Unalakleet River in 1997. Alaska Department of Fish and Game, Fishery Data Series No. 98-08, Anchorage.
Wuttig, K. G. 1999. Escapement of Chinook salmon in the Unalakleet River in 1998. Alaska Department of Fish and Game, Fishery Data Series No. 99-10, Anchorage.
Zheng, J., G. H. Kruse, and L. Fair. 1998. Using multiple data sets to assess red king crab Paralithodes camtschaticus in Norton Sound, Alaska: a length-based stock synthesis approach. Pages 591-612 [In] F. Funk, T. J. Quinn II, J. Heifetz, J. N. Ianelli, J. E. Powers, J. F. Schweigert, P. J. Sullivan, and C. I. Zhang, editors. Fishery Stock Assessment Models. Alaska Sea Grant College Program Report No. AK-SG-98-01, University of Alaska Fairbanks.
63

64

TABLES
65

Table 1.–Norton Sound commercial salmon harvest summary by subdistrict, 2013.
Subdistricts 1 2 3 4 5 6 Total Number of Fishermen a 1 14 21 18 24 57 124
Chinook b Number 0 0 0 0 0 0 0
Weight (lbs) 0 0 0 0 0 0 0
Sockeye Number 0 0 21 4 40 128 193
Weight (lbs) 0 0 168 30 286 932 1,416
Coho Number 0 5,362 6,651 5,485 6,890 29,366 53,754
Weight (lbs) 0 41,189 51,185 40,290 54,052 223,295 410,011
Pink Number 0 1,180 598 454 14 6,005 8,251
Weight (lbs) 0 3,039 1,708 1,613 45 17,719 24,124
Chum Number 0 3,113 1,412 36,021 23,268 54,858 118,672 Weight (lbs) 0 22,144 10,164 252,242 162,299 374,082 820,931 Total Number 0 9,655 8,682 41,964 30,212 90,357 180,870 Weight (lbs) 0 66,372 63,225 294,175 216,682 616,028 1,256,482 Note: An additional 151 Chinook, 54 sockeye, 48 coho, 87 pink, and 37 chum salmon were retained for personal use. Average
commercial weights by species were 7.34 lb for sockeye salmon, 7.63 lb for coho salmon, 2.92 lb for pink salmon, and 6.92 lb for chum salmon.
a Number of fishermen is unique number of permit holders that fished in each subdistrict. Some permit holders fished in more than 1 subdistrict. Subdistrict 1 catch is confidential and is not included in total.
b The buyer did not buy Chinook salmon in 2013; all were retained for personal use.
66

Table 2.–Subsistence salmon harvest for northern Norton Sound, 2013.
Permits Number of salmon harvested Fished a Chinook Sockeye Coho Pink Chum Total
Marine Waters 50 36 161 609 372 2,194 3,372 Bonanza River 14 0 0 76 41 140 257 Cripple Creek 6 0 0 19 0 0 19 Eldorado River – above weir 1 0 0 1 0 0 1 Eldorado River – below weir 17 1 0 108 56 344 509 Flambeau River 4 0 0 19 1 25 45 Safety Sound 1 0 0 0 0 0 0 Nome River – above weir 11 0 1 9 22 4 36 Nome River – below weir 162 10 18 480 211 177 896 Penny River 9 0 0 27 43 0 70 Sinuk River 34 0 26 80 19 43 168 Snake River – above weir 0 0 0 0 0 0 0 Snake River – below weir 74 1 4 301 80 134 520 Solomon River 14 0 1 75 0 4 80 Nome Subdistrict Total b 302 48 211 1,804 845 3,065 5,973 Cape Woolley c 3 0 0 0 0 1 1 Marine Waters 16 40 12 79 93 929 1,153 Kachavik River 8 2 1 7 1,627 834 2,471 McKinley River 5 0 0 24 2 0 26 Chinik Creek 5 1 0 88 11 0 100 Fish River 56 4 0 601 1,690 1400 3,695 Niukluk River 21 0 2 141 232 92 467 Other Creeks/Rivers 3 0 0 24 0 1 25 Golovin Subdistrict Total d 97 47 15 964 3,655 3,256 7,937 Marine Waters 15 5 4 523 342 592 1,466 Kwiniuk River – above tower 3 0 0 11 70 0 81 Kwiniuk River – below tower 35 18 7 649 572 515 1,761 Next Creek 1 0 0 0 0 0 0 Tubutulik River 10 12 0 265 134 110 521 Iron Creek 5 0 0 67 16 1 84 Other Creeks/Rivers 2 4 4 0 0 0 8 Elim Subdistrict Total e 45 39 15 1,515 1,134 1,218 3,921 Port Clarence – Marine Waters 93 36 2,041 609 1,587 4,402 8,675 Tuksuk Channel 13 2 428 34 133 1,446 2,043 Imuruk Basin 0 0 0 0 0 0 0 Agiapuk River 3 0 0 0 20 448 468 Kuzitrin River 6 0 9 0 0 10 19 Salmon Lake 2 0 4 0 0 0 4 Pilgrim River – above weir 62 0 807 8 6 172 993 Pilgrim River – below weir 89 0 1,954 0 42 110 2,106 Port Clarence District Total f 265 38 5,243 651 1,788 6,588 14,308 Total 712 172 5,484 4,934 7,422 14,128 32,140 a There were 7 locations where subsistence permits were issued in 2013 for northern Norton Sound: 1-Nome Subdistrict; 2-
Cape Woolley; 3-Golovin Subdistrict; 4-Elim Subdistrict; 5-Pilgrim River; 6-Salmon Lake; and 7-Port Clarence District. Except for Pilgrim River and Salmon Lake, each permit is valid for both marine and fresh waters. Permits fished include those permit holders who fished but reported no harvest.
b All 477 Nome Subdistrict permits issued were returned. c All 19 Cape Woolley permits issued were returned. d All 153 Golovin Subdistrict permits issued were returned. e All 64 Elim Subdistrict permits issued were returned. f All 265 Pilgrim River and 4 Salmon Lake permits issued were returned. All 162 Port Clarence District permits issued were
returned.
67

Table 3.–Salmon counts of rivers and associated salmon escapement goal ranges (SEG, BEG or OEG), Norton Sound and Port Clarence, 2013.
Chinook Salmon Chum Salmon Weir/ Escapement Aerial Escapement Weir/ Escapement Aerial Aerial Escapement Tower Goal Survey Goal Tower Goal Survey Survey Goal Stream Count Range Count a Range Count Range Count a Expansion Range Salmon L. 0 0 Grand Central R. 0 0 Agiapuk R. American R. Pilgrim R. 47 47,557 Glacial L. 0 35 Sinuk R. 1
19,500 31,691
Cripple R.
Penny R.
Anvil Creek
Dry Creek
Snake R. 8 2,755 1,600–2,500 b Nome R. 9 4,811 2,900–4,300 b Flambeau R. 16,088 27,928 Eldorado R. 9 27,928 6,000–9,200 b 16,859 Bonanza R. 5,284 13,437 Solomon R. 0 1,377 156 Nome Subdistrict 23,000–35,000 c 108,120 Fish R. 15 Combined 2,550 Boston Cr. 19 100–250 16,100 Niukluk R. 68 23,000 17,203 Ophir Cr. Kwiniuk R. 15 300–550 5,631 11,500–23,000 d Tubutulik R. 2 9,200–18,400 e 4,532 Ungalik R. 17 28,283 Inglutalik R 860 61,259 24,562 Pikmiktalik R Shaktoolik R. 151 400–800 11,878 Unalakleet R. 767 Combined 113,953 Combined Old Woman R. 168 550–1,100 367 2,400–4,800 North R. 564 339 1,200–2,600 10,518 2,425
-continued-
68 68

Table 3.–Page 2 of 2.
Coho Salmon Sockeye Salmon Pink Salmon
Weir/ Aerial Escapement
Weir/ Aerial Escapement
Weir/ Escapement Aerial
Tower Survey Goal
Tower Survey Goal
Tower Goal Survey
Stream Count Count a Range Count Count a Range Count Range Count a Salmon L.
0
5,820 Combined
0
Grand Central R.
0
1,151 4,000–8,000
0 Agiapuk R.
American R. Pilgrim R. 890
12,428
1,060
Glacial L.
2,544 1,366 800–1,600
2 Sinuk R.
1,054
39
23,000
Cripple R. Penny R. Anvil Creek Dry Creek Snake R. 1,203
163
1,333
Nome R. 2,624
38
10,257 3,200 Flambeau R.
Eldorado R. b 15
0
1,025 Bonanza R.
945
800
Solomon R. 178
3
2,733 Fish R.
Boston Cr.
Tower Goal Niukluk R.
2,279 2,400–7,200
0
9,700
Ophir Cr.
74 Kwiniuk R. 3,940
650–1,300
0
13,212 8,400
Tubutulik R.
700
700 Ungalik R.
1,063
49,890
Inglutalik R 5,904
0
268,537
109,980 Pikmiktalik R
Shaktoolik R.
271
10,400 Unalakleet R. 25,566
243
144,225
Old Woman R. North R. 8,834 867 550–1,100 12 46,668 25,000 5,025
Note: Data not available for all streams. Sustainable escapement goal (SEG), biological escapement goal (BEG), and optimal escapement goal (OEG) are listed. a All aerial surveys are rated fair to good, unless otherwise noted. b The Alaska Board of Fisheries (BOF) also established an OEG with the same range as the BEG. c BOF-established OEG is the same range as the BEG and is based on a combination of weir counts and expanded aerial survey counts. d This represents the OEG in regulation. The BEG is 10,000–20,000 for the Kwiniuk River and 8,000–16,000 for the Tubutulik River. e The goal listed is actual fish and not aerial counts. However, at this time there is no counting project on the river.
69 69
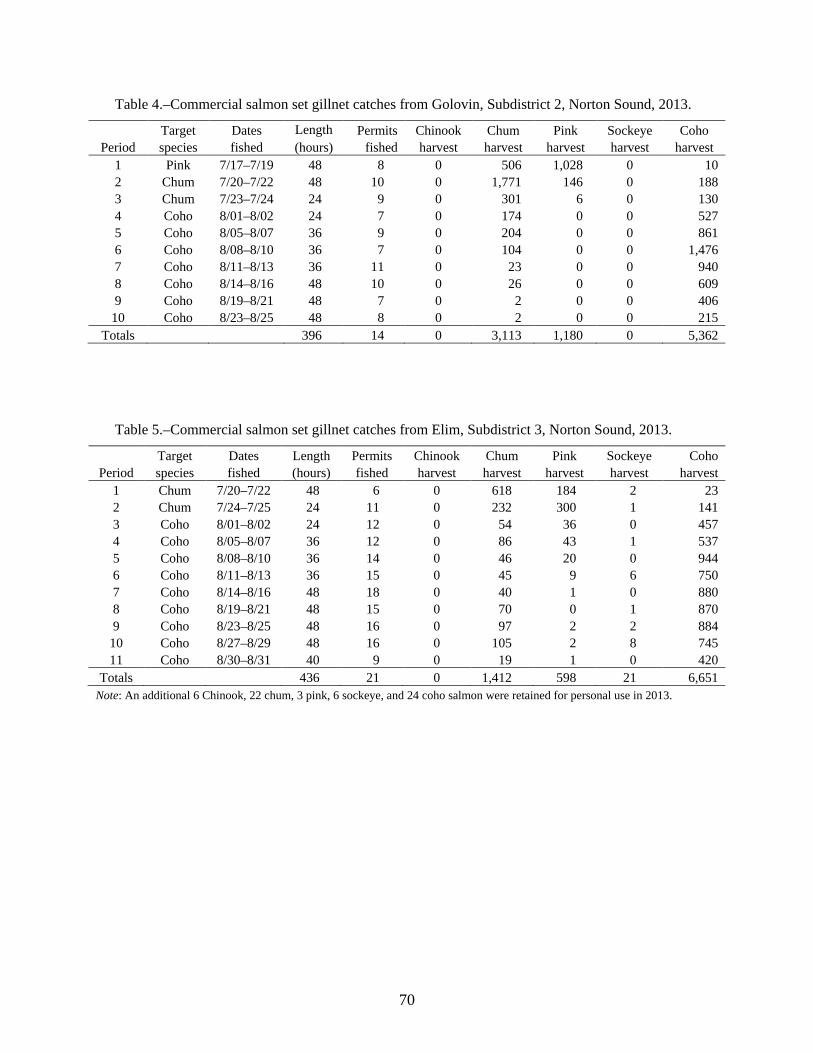
Table 4.–Commercial salmon set gillnet catches from Golovin, Subdistrict 2, Norton Sound, 2013.
Target Dates Length Permits Chinook Chum Pink Sockeye Coho Period species fished (hours) fished harvest harvest harvest harvest harvest
1 Pink 7/17–7/19 48 8 0 506 1,028 0 10 2 Chum 7/20–7/22 48 10 0 1,771 146 0 188 3 Chum 7/23–7/24 24 9 0 301 6 0 130 4 Coho 8/01–8/02 24 7 0 174 0 0 527 5 Coho 8/05–8/07 36 9 0 204 0 0 861 6 Coho 8/08–8/10 36 7 0 104 0 0 1,476 7 Coho 8/11–8/13 36 11 0 23 0 0 940 8 Coho 8/14–8/16 48 10 0 26 0 0 609 9 Coho 8/19–8/21 48 7 0 2 0 0 406
10 Coho 8/23–8/25 48 8 0 2 0 0 215 Totals 396 14 0 3,113 1,180 0 5,362
Table 5.–Commercial salmon set gillnet catches from Elim, Subdistrict 3, Norton Sound, 2013.
Target Dates Length Permits Chinook Chum Pink Sockeye Coho Period species fished (hours) fished harvest harvest harvest harvest harvest
1 Chum 7/20–7/22 48 6 0 618 184 2 23 2 Chum 7/24–7/25 24 11 0 232 300 1 141 3 Coho 8/01–8/02 24 12 0 54 36 0 457 4 Coho 8/05–8/07 36 12 0 86 43 1 537 5 Coho 8/08–8/10 36 14 0 46 20 0 944 6 Coho 8/11–8/13 36 15 0 45 9 6 750 7 Coho 8/14–8/16 48 18 0 40 1 0 880 8 Coho 8/19–8/21 48 15 0 70 0 1 870 9 Coho 8/23–8/25 48 16 0 97 2 2 884
10 Coho 8/27–8/29 48 16 0 105 2 8 745 11 Coho 8/30–8/31 40 9 0 19 1 0 420
Totals 436 21 0 1,412 598 21 6,651 Note: An additional 6 Chinook, 22 chum, 3 pink, 6 sockeye, and 24 coho salmon were retained for personal use in 2013.
70

Table 6.–Commercial salmon set gillnet catches from Norton Bay, Subdistrict 4, Norton Sound, 2013.
Target Dates Length Permits Chinook Chum Pink Sockeye Coho Period species fished (hours) fished harvest harvest harvest harvest harvest
1 Chum 6/25–6/27 48 5 0 1,388 0 0 0 2 Chum 6/28–6/30 48 8 0 4,323 0 0 0 3 Chum 7/02–7/04 48 9 0 5,137 0 0 0 4 Chum 7/05–7/07 48 12 0 5,755 0 0 0 5 Chum 7/09–7/11 48 9 0 3,660 0 0 2 6 Chum 7/12–7/15 48 11 0 4,350 0 0 5 7 Chum 7/16–7/19 72 9 0 3,280 0 2 91 8 Chum 7/20–7/23 72 3 0 1,935 131 0 228 9 Chum 7/25–7/27 72 12 0 1,948 308 0 821
10 Chum 7/28–7/31 64 10 0 1,513 8 0 1,220 11 Chum 8/02–8/04 72 13 0 689 4 0 556 12 Coho 8/05–8/07 48 6 0 467 0 0 569 13 Coho 8/09–8/11 48 11 0 528 3 0 758 14 Coho 8/12–8/14 48 7 0 349 0 0 337 15 Coho 8/15–8/17 48 6 0 247 0 0 391 16 Coho 8/19–8/21 48 6 0 221 0 0 333 17 Coho 8/23–8/25 48 4 0 179 0 0 148 18 Coho 8/27–8/29 48 3 0 52 0 2 26 19 Coho 8/30–9/01 48 No One Fished 20 Coho 9/03–9/05 48 No One Fished
Totals 1,072 18 0 36,021 454 4 5,485 Note: An additional 8 Chinook and 33 pink salmon were retained for personal use in 2013.
71
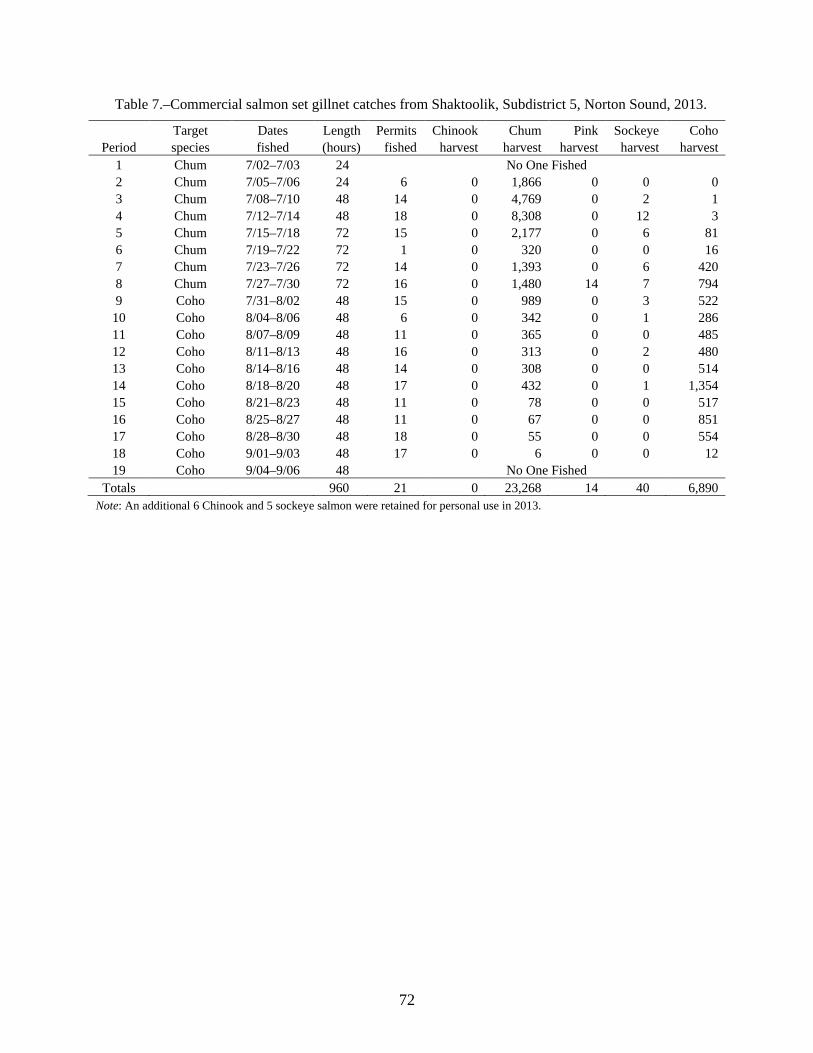
Table 7.–Commercial salmon set gillnet catches from Shaktoolik, Subdistrict 5, Norton Sound, 2013.
Target Dates Length Permits Chinook Chum Pink Sockeye Coho Period species fished (hours) fished harvest harvest harvest harvest harvest
1 Chum 7/02–7/03 24 No One Fished 2 Chum 7/05–7/06 24 6 0 1,866 0 0 0 3 Chum 7/08–7/10 48 14 0 4,769 0 2 1 4 Chum 7/12–7/14 48 18 0 8,308 0 12 3 5 Chum 7/15–7/18 72 15 0 2,177 0 6 81 6 Chum 7/19–7/22 72 1 0 320 0 0 16 7 Chum 7/23–7/26 72 14 0 1,393 0 6 420 8 Chum 7/27–7/30 72 16 0 1,480 14 7 794 9 Coho 7/31–8/02 48 15 0 989 0 3 522
10 Coho 8/04–8/06 48 6 0 342 0 1 286 11 Coho 8/07–8/09 48 11 0 365 0 0 485 12 Coho 8/11–8/13 48 16 0 313 0 2 480 13 Coho 8/14–8/16 48 14 0 308 0 0 514 14 Coho 8/18–8/20 48 17 0 432 0 1 1,354 15 Coho 8/21–8/23 48 11 0 78 0 0 517 16 Coho 8/25–8/27 48 11 0 67 0 0 851 17 Coho 8/28–8/30 48 18 0 55 0 0 554 18 Coho 9/01–9/03 48 17 0 6 0 0 12 19 Coho 9/04–9/06 48 No One Fished
Totals 960 21 0 23,268 14 40 6,890 Note: An additional 6 Chinook and 5 sockeye salmon were retained for personal use in 2013.
72

Table 8.–Commercial salmon set gillnet catches from Unalakleet, Subdistrict 6, Norton Sound, 2013.
Target Dates Length Permits Chinook Chum Pink Sockeye Coho Period species fished (hours) fished harvest harvest harvest harvest harvest
1 Chum 7/01–7/02 24 19 0 5,804 0 0 0 2 Chum 7/05–7/06 24 17 0 5,602 287 0 0 3 Chum 7/08–7/09 24 21 0 1,103 121 2 1 4 Chum 7/11–7/13 48 16 0 8,831 1,514 32 31 5 Chum 7/15–7/18 72 0 0 8,279 1,648 29 276 6 Chum 7/19–7/22 72 19 0 8,123 1,377 9 939 7 Chum 7/23–7/26 72 27 0 4,670 434 19 1,909 8 Chum 7/27–7/30 72 27 0 3,687 309 10 3,257 9 Coho 7/31–8/02 48 30 0 1,318 161 3 1,215
10 Coho 8/04–8/06 48 27 0 1,928 39 7 1,692 11 Coho 8/07–8/09 48 28 0 880 22 2 1,964 12 Coho 8/11–8/13 48 36 0 1,161 49 2 3,715 13 Coho 8/14–8/16 48 34 0 567 13 0 1,852 14 Coho 8/18–8/20 48 36 0 983 19 3 3,914 15 Coho 8/21–8/23 48 33 0 686 0 5 2,551 16 Coho 8/25–8/27 48 18 0 685 4 2 4,088 17 Coho 8/28–8/30 48 25 0 391 6 1 1,328 18 Coho 9/01–9/03 48 33 0 91 1 1 403 19 Coho 9/04–9/06 48 32 0 69 1 1 231
Totals 936 55 0 54,858 6,005 128 29,366 Note: There were an additional 131 Chinook, 15 chum, 51 pink, 43 sockeye, and 24 coho salmon retained for personal use in
2013.
73

Table 9.–Kotzebue District commercial chum salmon catch and average weight by date, 2013.
Number of Average Date fishermen Catch Pounds weight 7/10 10 1,360 10,870 8.0 7/11 12 1,535 12,321 8.0 7/12 9 2,368 19,386 8.2 7/14 10 2,077 16,942 8.2 7/15 17 2,038 16,191 7.9 7/16 18 5,994 48,926 8.2 7/17 23 4,908 39,714 8.1 7/18 29 10,476 86,911 8.3 7/19 26 6,013 49,559 8.2 7/21 33 5,585 46,119 8.3 7/22 34 6,216 51,847 8.3 7/23 38 17,712 145,926 8.2 7/24 9 2,683 21,022 7.8 7/25 41 11,894 98,133 8.3 7/26 40 9,082 75,349 8.3 7/28 41 17,283 141,096 8.2 7/30 47 10,927 89,513 8.2 7/31 45 15,773 130,429 8.3 8/01 38 10,062 83,466 8.3 8/04 38 9,453 75,974 8.0 8/05 40 9,672 78,190 8.1 8/06 34 7,300 60,105 8.2 8/07 41 12,427 99,541 8.0 8/08 43 10,875 85,858 7.9 8/11 35 11,830 92,091 7.8 8/12 40 11,067 87,602 7.9 8/13 40 10,917 86,257 7.9 8/14 44 12,057 93,852 7.8 8/15 44 15,805 125,682 8.0 8/16 39 8,385 65,160 7.8 8/18 35 9,706 76,075 7.8 8/19 35 4,229 32,865 7.8 8/20 31 3,210 24,603 7.7 8/21 18 3,160 24,213 7.7 8/22 29 6,134 47,977 7.8 8/23 14 2,779 20,764 7.5 8/25 11 2,180 16,085 7.4 8/26 6 113 768 6.8 8/27 22 439 3,033 6.9 8/28 17 792 5,535 7.0 8/29 14 1,142 8,168 7.2 8/30 8 0 0
8/31 8 0 0 Total 65 297,658 2,394,118 8.0
Note: Catch by date is for Great Pacific Seafoods only. Maniilaq had a catch of 21,312 chum salmon (160,952 pounds) by 21 permit holders. There was one catcher–seller who reported a catch of 25 chum salmon (230 pounds). Both buyers and the catcher–seller signed waivers allowing ADF&G to report their harvest figures. Also harvested during the 2013 commercial fishery and kept for personal use were 16 Chinook, 67 chum, 13 sockeye, 42 pink, and 43 coho salmon, and 302 Dolly Varden, 705 sheefish, and 50 whitefish.
74
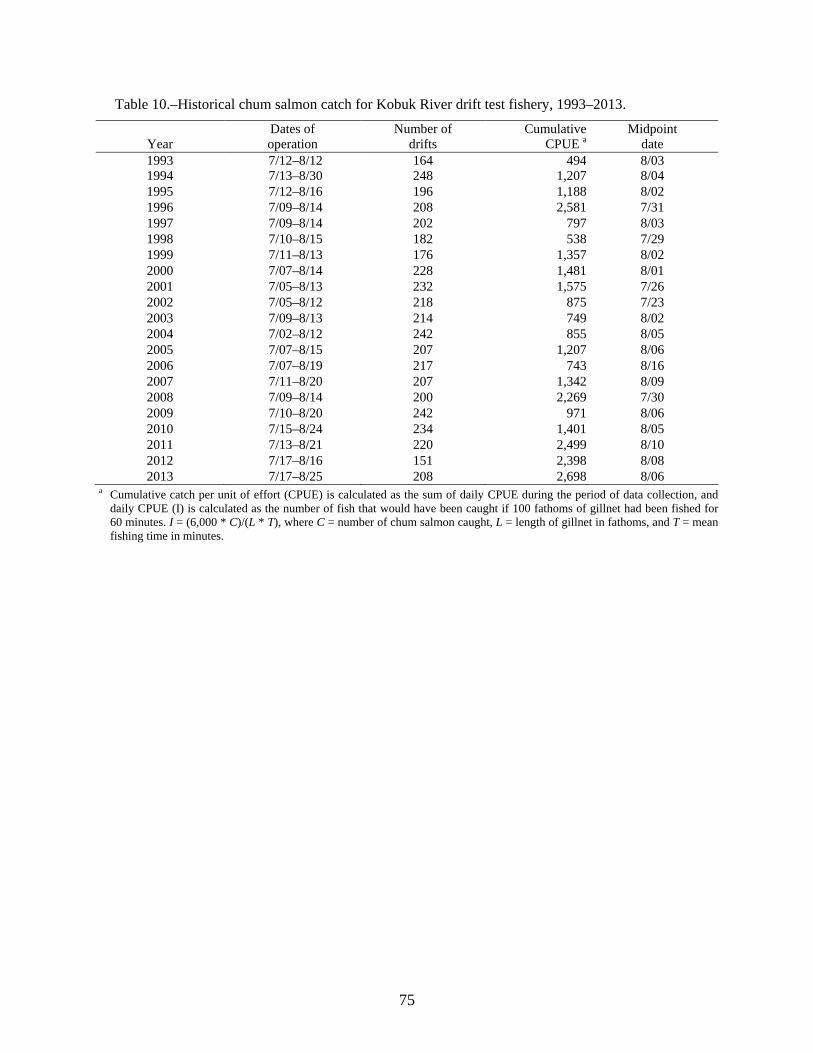
Table 10.–Historical chum salmon catch for Kobuk River drift test fishery, 1993–2013.
Dates of Number of Cumulative Midpoint Year operation drifts CPUE a date 1993 7/12–8/12 164 494 8/03 1994 7/13–8/30 248 1,207 8/04 1995 7/12–8/16 196 1,188 8/02 1996 7/09–8/14 208 2,581 7/31 1997 7/09–8/14 202 797 8/03 1998 7/10–8/15 182 538 7/29 1999 7/11–8/13 176 1,357 8/02 2000 7/07–8/14 228 1,481 8/01 2001 7/05–8/13 232 1,575 7/26 2002 7/05–8/12 218 875 7/23 2003 7/09–8/13 214 749 8/02 2004 7/02–8/12 242 855 8/05 2005 7/07–8/15 207 1,207 8/06 2006 7/07–8/19 217 743 8/16 2007 7/11–8/20 207 1,342 8/09 2008 7/09–8/14 200 2,269 7/30 2009 7/10–8/20 242 971 8/06 2010 7/15–8/24 234 1,401 8/05 2011 7/13–8/21 220 2,499 8/10 2012 7/17–8/16 151 2,398 8/08 2013 7/17–8/25 208 2,698 8/06
a Cumulative catch per unit of effort (CPUE) is calculated as the sum of daily CPUE during the period of data collection, and daily CPUE (I) is calculated as the number of fish that would have been caught if 100 fathoms of gillnet had been fished for 60 minutes. I = (6,000 * C)/(L * T), where C = number of chum salmon caught, L = length of gillnet in fathoms, and T = mean fishing time in minutes.
75

Table 11.–Commercial herring sac roe harvest summary by subdistrict, Norton Sound District, 2013.
St. Michael Subdistrict (333-70) Unalakleet Subdistrict (333-72) Cape Denbigh Subdistrict (333-74) Norton Sound District Total
Number of permit holders
Sac roe short tons
Percent roe
Number of permit holders
Sac Roe short tons
Percent roe
Number of rermit holders
Sac Roe short tons
Percent roe
Number of permit
holders
Sac Roe short tons
Percent roe
Total 27 107.1 13.6 17 82 13.4 17 301.5 13.0 40 490.6 13.2
76

Table 12.–Daily catch for the open access and CDQ summer commercial king crab harvests, Norton Sound Section, Eastern Bering Sea, July 3–September 14, 2013.
Crab Cumulative Number Average Number harvested total pots weight
Date a Landings of crab (lbs) (lbs) Pulled (lbs) CPUE Open Access
7/05 1 144 453 453 20 3.1 7 7/06 4 755 2,187 2,640 113 2.9 7 7/07 9 3,036 9,124 11,764 359 3.0 8 7/08 3 880 2,591 14,355 89 2.9 10 7/09 3 374 1,097 15,452 57 2.9 7 7/10 2 666 2,016 17,468 79 3.0 8 7/11 9 3,189 9,438 26,906 305 3.0 10 7/12 11 4,151 12,604 39,510 391 3.0 11 7/13 5 1,144 3,417 42,927 159 3.0 7 7/14 3 1,446 4,537 47,464 120 3.1 12 7/15 1 269 823 48,287 40 3.1 7 7/16 10 3,999 12,319 60,606 328 3.1 12 7/17 2 195 562 61,168 41 2.9 5 7/18 17 6,871 20,496 81,664 596 3.0 12 7/19 11 2,976 8,777 90,441 296 2.9 10 7/20 4 1,884 5,329 95,770 160 2.8 12 7/21 3 651 1,912 97,682 118 2.9 6 7/23 3 776 2,360 100,042 81 3.0 10 7/24 15 4,314 12,853 112,895 560 3.0 8 7/25 12 3,423 10,356 123,251 399 3.0 9 7/26 4 1,313 3,971 127,222 131 3.0 10 7/27 3 502 1,657 128,879 32 3.3 16 7/28 12 2,896 8,578 137,457 394 3.0 7 7/29 2 304 903 138,360 60 3.0 5 7/30 15 3,071 9,096 147,456 468 3.0 7 7/31 9 1,905 5,690 153,146 327 3.0 6 8/01 6 876 2,661 155,807 160 3.0 5 8/02 8 2,091 6,199 162,006 356 3.0 6 8/03 12 2,427 7,117 169,123 351 2.9 7 8/04 11 2,971 8,748 177,871 336 2.9 9 8/05 1 311 929 178,800 39 3.0 8 8/06 6 1,846 5,411 184,211 210 2.9 9 8/07 5 1,529 4,452 188,663 134 2.9 11 8/08 4 696 2,096 190,759 158 3.0 4 8/09 7 2,815 8,209 198,968 280 2.9 10 8/10 9 1,969 5,955 204,923 320 3.0 6 8/11 10 3,727 11,093 216,016 369 3.0 10 8/12 4 1,168 3,581 219,597 117 3.1 10
-continued-
77

Table 12.–Page 2 of 3.
Crab Cumulative Number Average Number harvested total pots weight
Date a Landings of crab (lbs) (lbs) pulled (lbs) CPUE Open Access
8/13 6 1,917 5,714 225,311 194 3.0 10 8/14 8 2,153 6,368 231,679 216 3.0 10 8/15 10 2,468 7,439 239,118 371 3.0 7 8/16 9 1,811 5,326 244,444 285 2.9 6 8/17 11 1,369 4,002 248,446 326 2.9 4 8/18 3 1,146 3,422 251,868 160 3.0 7 8/19 3 451 1,317 253,185 80 2.9 6 8/20 7 1,130 3,365 256,550 252 3.0 4 8/21 11 1,317 3,896 260,446 372 3.0 4 8/22 3 331 997 261,443 120 3.0 3 8/23 1 4 13 261,456 40 3.3 0 8/24 3 616 2,076 263,532 88 3.4 7 8/25 9 1,069 3,244 266,776 243 3.0 4 8/27 3 396 1,170 267,946 69 3.0 6 8/28 10 2,359 7,181 275,127 351 3.0 7 8/29 5 1,403 4,223 279,350 135 3.0 10 8/30 2 915 2,784 282,134 78 3.0 12 8/31 5 2,798 8,568 290,702 189 3.1 15 9/04 8 3,899 12,228 302,930 270 3.1 14 9/05 3 1,777 5,237 308,167 71 2.9 25 9/06 6 2,617 7,694 315,861 200 2.9 13 9/07 8 2,851 8,430 324,291 237 3.0 12 9/08 4 1,485 4,440 328,731 131 3.0 11 9/09 6 2,195 6,817 335,548 204 3.1 11 9/10 12 2,920 8,826 344,374 314 3.0 9 9/11 5 1,368 4,065 348,439 155 3.0 9 9/12 1 123 367 348,806 12 3.0 10 9/13 6 2,854 8,660 357,466 177 3.0 16 9/14 3 1,747 5,386 362,852 91 3.1 19 9/15 8 3,436 10,426 373,278 212 3.0 16
Total 435 124,485 373,278 373,278 14,196 3.0 9 -continued-
78
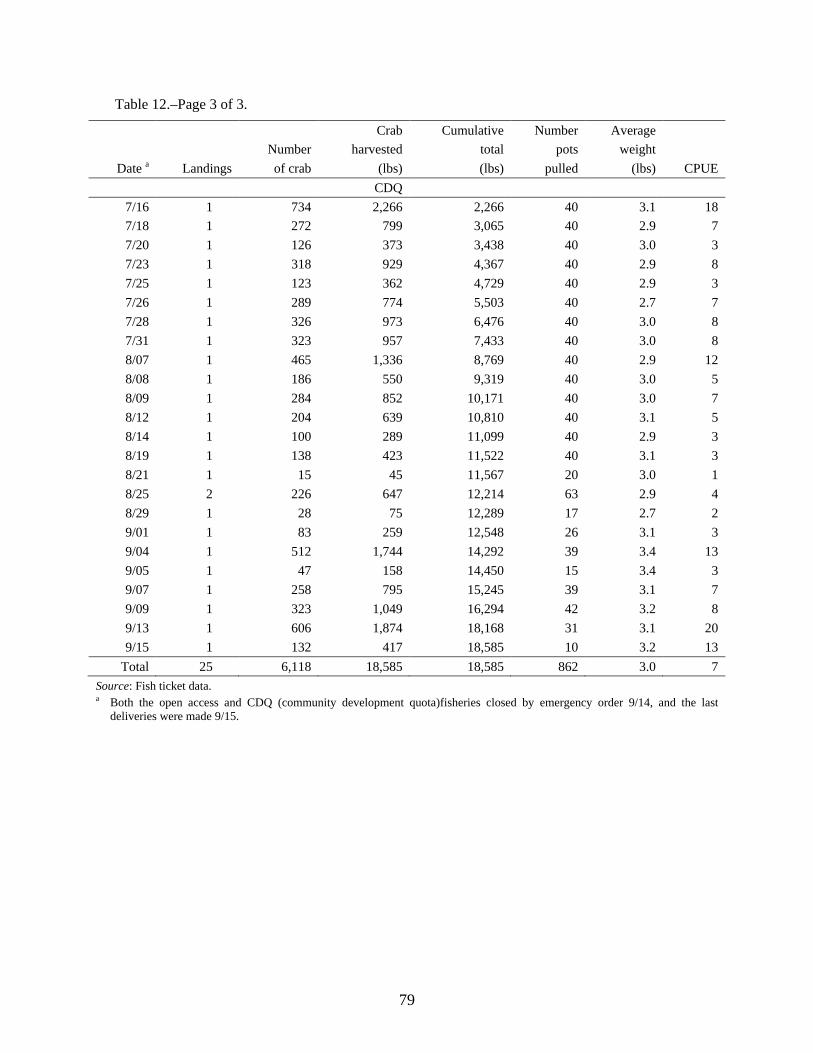
Table 12.–Page 3 of 3.
Crab Cumulative Number Average Number harvested total pots weight
Date a Landings of crab (lbs) (lbs) pulled (lbs) CPUE CDQ
7/16 1 734 2,266 2,266 40 3.1 18 7/18 1 272 799 3,065 40 2.9 7 7/20 1 126 373 3,438 40 3.0 3 7/23 1 318 929 4,367 40 2.9 8 7/25 1 123 362 4,729 40 2.9 3 7/26 1 289 774 5,503 40 2.7 7 7/28 1 326 973 6,476 40 3.0 8 7/31 1 323 957 7,433 40 3.0 8 8/07 1 465 1,336 8,769 40 2.9 12 8/08 1 186 550 9,319 40 3.0 5 8/09 1 284 852 10,171 40 3.0 7 8/12 1 204 639 10,810 40 3.1 5 8/14 1 100 289 11,099 40 2.9 3 8/19 1 138 423 11,522 40 3.1 3 8/21 1 15 45 11,567 20 3.0 1 8/25 2 226 647 12,214 63 2.9 4 8/29 1 28 75 12,289 17 2.7 2 9/01 1 83 259 12,548 26 3.1 3 9/04 1 512 1,744 14,292 39 3.4 13 9/05 1 47 158 14,450 15 3.4 3 9/07 1 258 795 15,245 39 3.1 7 9/09 1 323 1,049 16,294 42 3.2 8 9/13 1 606 1,874 18,168 31 3.1 20 9/15 1 132 417 18,585 10 3.2 13
Total 25 6,118 18,585 18,585 862 3.0 7 Source: Fish ticket data. a Both the open access and CDQ (community development quota)fisheries closed by emergency order 9/14, and the last
deliveries were made 9/15.
79
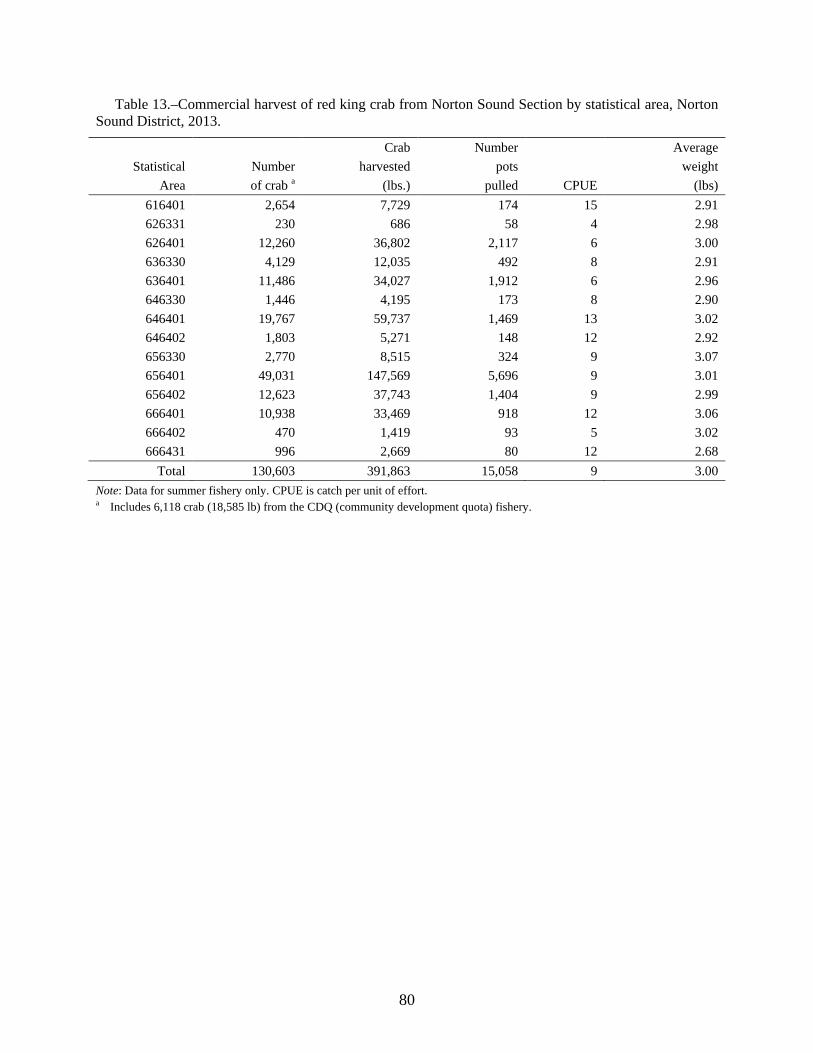
Table 13.–Commercial harvest of red king crab from Norton Sound Section by statistical area, Norton Sound District, 2013.
Crab Number Average Statistical Number harvested pots weight
Area of crab a (lbs.) pulled CPUE (lbs) 616401 2,654 7,729 174 15 2.91 626331 230 686 58 4 2.98 626401 12,260 36,802 2,117 6 3.00 636330 4,129 12,035 492 8 2.91 636401 11,486 34,027 1,912 6 2.96 646330 1,446 4,195 173 8 2.90 646401 19,767 59,737 1,469 13 3.02 646402 1,803 5,271 148 12 2.92 656330 2,770 8,515 324 9 3.07 656401 49,031 147,569 5,696 9 3.01 656402 12,623 37,743 1,404 9 2.99 666401 10,938 33,469 918 12 3.06 666402 470 1,419 93 5 3.02 666431 996 2,669 80 12 2.68
Total 130,603 391,863 15,058 9 3.00 Note: Data for summer fishery only. CPUE is catch per unit of effort. a Includes 6,118 crab (18,585 lb) from the CDQ (community development quota) fishery.
80

APPENDIX A: NORTON SOUND FISHERIES
81
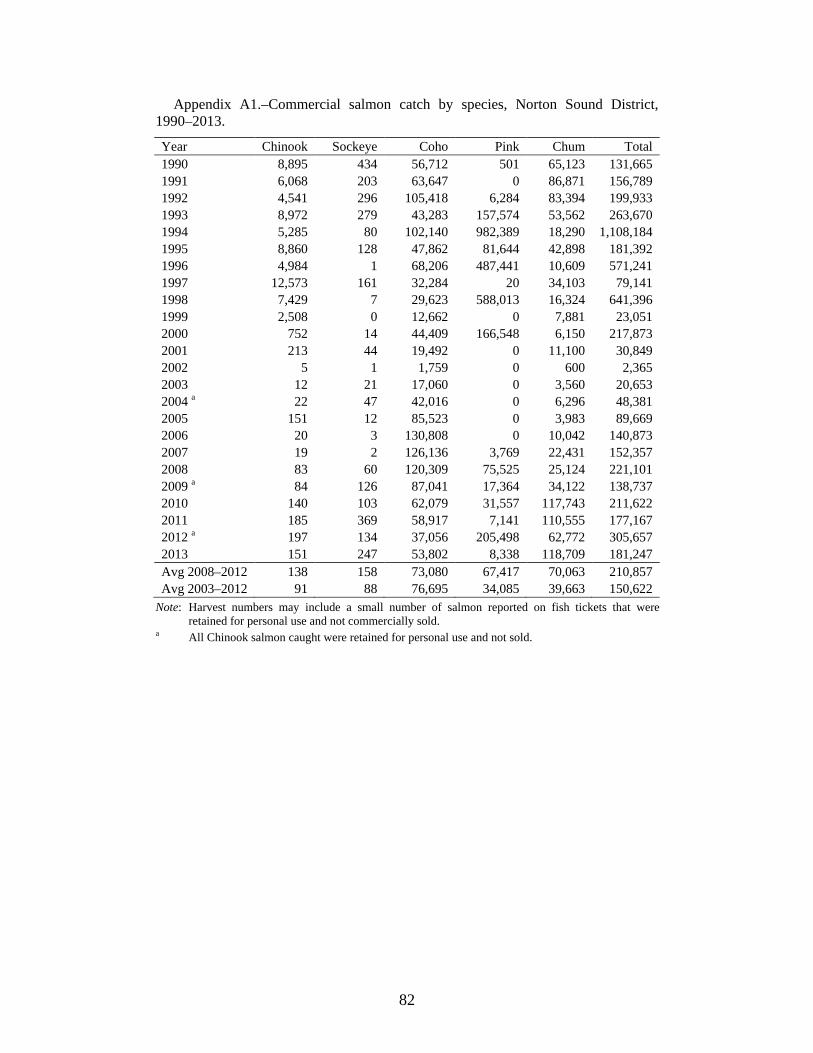
Appendix A1.–Commercial salmon catch by species, Norton Sound District, 1990–2013.
Year Chinook Sockeye Coho Pink Chum Total 1990 8,895 434 56,712 501 65,123 131,665 1991 6,068 203 63,647 0 86,871 156,789 1992 4,541 296 105,418 6,284 83,394 199,933 1993 8,972 279 43,283 157,574 53,562 263,670 1994 5,285 80 102,140 982,389 18,290 1,108,184 1995 8,860 128 47,862 81,644 42,898 181,392 1996 4,984 1 68,206 487,441 10,609 571,241 1997 12,573 161 32,284 20 34,103 79,141 1998 7,429 7 29,623 588,013 16,324 641,396 1999 2,508 0 12,662 0 7,881 23,051 2000 752 14 44,409 166,548 6,150 217,873 2001 213 44 19,492 0 11,100 30,849 2002 5 1 1,759 0 600 2,365 2003 12 21 17,060 0 3,560 20,653 2004 a 22 47 42,016 0 6,296 48,381 2005 151 12 85,523 0 3,983 89,669 2006 20 3 130,808 0 10,042 140,873 2007 19 2 126,136 3,769 22,431 152,357 2008 83 60 120,309 75,525 25,124 221,101 2009 a 84 126 87,041 17,364 34,122 138,737 2010 140 103 62,079 31,557 117,743 211,622 2011 185 369 58,917 7,141 110,555 177,167 2012 a 197 134 37,056 205,498 62,772 305,657 2013 151 247 53,802 8,338 118,709 181,247 Avg 2008–2012 138 158 73,080 67,417 70,063 210,857 Avg 2003–2012 91 88 76,695 34,085 39,663 150,622
Note: Harvest numbers may include a small number of salmon reported on fish tickets that were retained for personal use and not commercially sold.
a All Chinook salmon caught were retained for personal use and not sold.
82

Appendix A2.–Number of commercial salmon permits fished, Norton Sound, 1990–2013.
Subdistrict District Year 1 2 3 4 5 6 Total a 1990 0 15 23 0 28 73 128
1991 0 16 24 0 25 75 126 1992 2 1 21 9 25 71 110 1993 1 8 26 15 37 66 153 1994 1 5 21 0 39 71 119 1995 2 7 12 0 26 58 105 1996 1 4 12 0 20 54 86 1997 0 11 21 9 19 57 102 1998 0 16 23 0 28 52 82 1999 0 0 0 0 15 45 60 2000 0 12 13 0 26 49 79 2001 0 5 5 0 13 29 51 2002 0 0 0 0 7 5 12 2003 0 0 0 0 10 20 30 2004 0 0 0 0 11 25 36
2005 0 0 0 0 12 28 40 2006 0 0 0 0 22 40 61 2007 0 0 11 0 15 47 71 2008 0 4 12 4 23 58 91 2009 0 5 17 7 21 49 88 2010 0 10 19 5 35 59 115 2011 0 13 32 12 30 65 123 2012 0 14 24 18 21 55 123 2013 1 14 21 18 24 57 124
Avg 2008–2012 0 9 21 9 26 57 108 Avg 2003–2012 0 5 12 5 20 45 78
a District total is the number of fishermen that actually fished in Norton Sound; some fishermen may have fished more than one subdistrict.
83
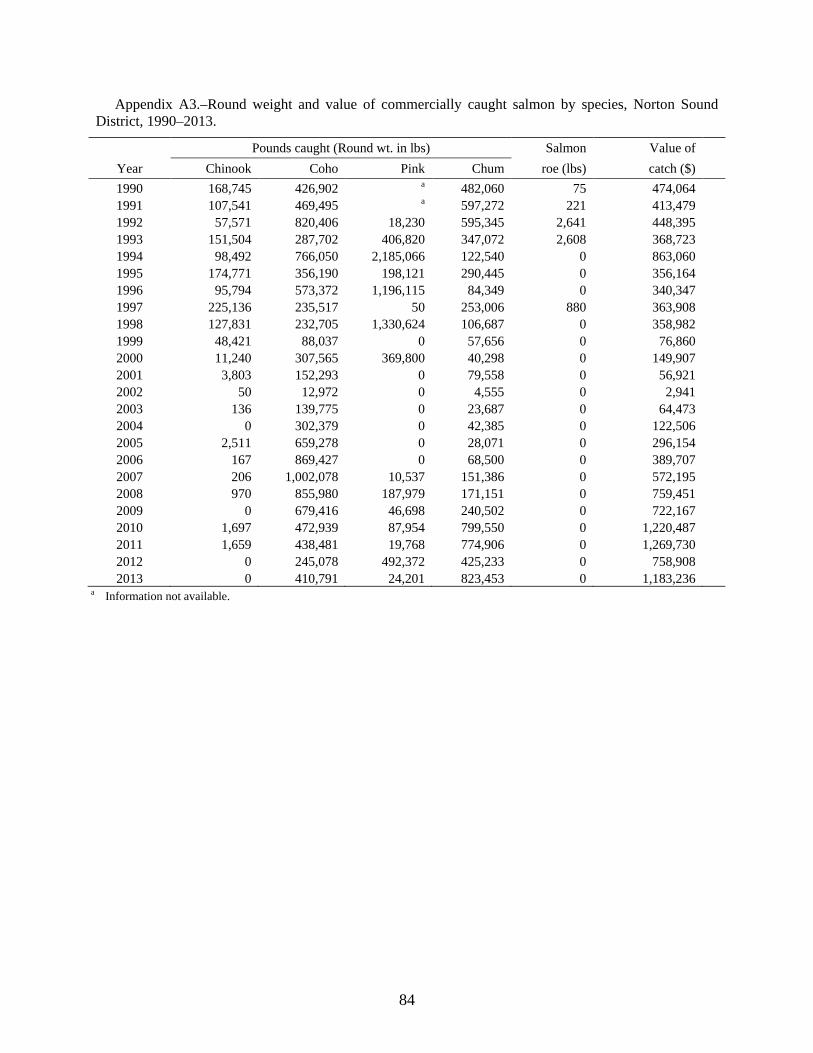
Appendix A3.–Round weight and value of commercially caught salmon by species, Norton Sound District, 1990–2013.
Pounds caught (Round wt. in lbs) Salmon Value of Year Chinook Coho Pink Chum roe (lbs) catch ($) 1990 168,745 426,902 a 482,060 75 474,064 1991 107,541 469,495 a 597,272 221 413,479 1992 57,571 820,406 18,230 595,345 2,641 448,395 1993 151,504 287,702 406,820 347,072 2,608 368,723 1994 98,492 766,050 2,185,066 122,540 0 863,060 1995 174,771 356,190 198,121 290,445 0 356,164 1996 95,794 573,372 1,196,115 84,349 0 340,347 1997 225,136 235,517 50 253,006 880 363,908 1998 127,831 232,705 1,330,624 106,687 0 358,982 1999 48,421 88,037 0 57,656 0 76,860 2000 11,240 307,565 369,800 40,298 0 149,907 2001 3,803 152,293 0 79,558 0 56,921 2002 50 12,972 0 4,555 0 2,941 2003 136 139,775 0 23,687 0 64,473 2004 0 302,379 0 42,385 0 122,506 2005 2,511 659,278 0 28,071 0 296,154 2006 167 869,427 0 68,500 0 389,707 2007 206 1,002,078 10,537 151,386 0 572,195 2008 970 855,980 187,979 171,151 0 759,451 2009 0 679,416 46,698 240,502 0 722,167 2010 1,697 472,939 87,954 799,550 0 1,220,487 2011 1,659 438,481 19,768 774,906 0 1,269,730 2012 0 245,078 492,372 425,233 0 758,908 2013 0 410,791 24,201 823,453 0 1,183,236
a Information not available.
84

Appendix A4.–Estimated mean prices paid to commercial salmon fishermen in dollars, Norton Sound District, 1990–2013.
Year Chinook Coho Pink Chum Sockeye 1990 1.01 0.50 (0.75 for roe) 0.23
1991 0.87 0.36 (3.00 for roe)
0.27 (3.00 for roe) 1992 0.66 0.33 (1.50 for roe) 0.16 0.22 1993 0.72 0.22 (1.76 for roe) 0.15 0.24 0.40
1994 1.02 0.52 0.15 0.29 1995 0.66 0.43 0.18 0.18 1996 0.54 0.28 0.10 0.08 1997 1.00 0.47 0.06 0.11 1998 0.74 0.29 0.14 0.09 1999 0.82 0.35
0.11
2000 1.30 0.30 0.10 0.15 2001 1.00 0.25
0.19 0.37
2002 0.39 0.20
0.07 2003 0.64 0.44
0.14 0.45
2004
0.39
0.14 2005 1.22 0.44
0.15 0.45
2006 1.49 0.44
0.14 2007 0.55 0.53 0.14 0.24 0.55
2008 0.73 0.77 0.23 0.34 0.56 2009
0.93 0.18 0.33 0.34
2010 2.25 1.47 0.32 0.62 0.63 2011 3.01 1.70 0.25 0.68 1.04 2012
1.47 0.36 0.52 1.45
2013 1.77 0.22 0.55 1.49 Avg 2008–2012 1.50 1.59 0.34 0.62 1.01 Note: Blank cells indicate no known purchases were made.
85

Appendix A5.–Mean commercial salmon harvest weights, Norton Sound District, 1990–2013.
Mean round weight in pounds a
Year Chinook Coho Pink Chum 1990 19.0 7.5 NA 7.4
1991 17.7 7.4 c 6.9 1992 b 12.7 7.8 2.9 7.1 1993 16.9 6.6 2.6 6.5 1994 18.6 7.5 2.2 6.7 1995 19.7 7.4 2.4 6.7 1996 19.2 8.4 2.4 7.9 1997 17.9 7.3 2.5 7.4 1998 17.2 7.9 2.3 6.5 1999 19.3 6.9 c 7.3 2000 14.9 6.9 2.2 6.5 2001 17.8 7.8 c 7.2 2002 b 10.0 7.4 c 7.6 2003 b 11.3 8.2 c 6.7 2004 c 7.2 c 6.7 2005 16.6 7.7 c 7.0 2006 b 14.4 6.6 c 6.8 2007 b 10.8 7.9 2.8 6.7 2008 b 14.7 7.1 2.5 6.8 2009 c 7.8 2.7 7.0 2010 14.4 7.6 2.8 6.8 2011 11.4 7.3 2.8 7.0 2012 c 6.6 2.4 6.8 2013 c 7.6 2.9 6.9
a Based on age-weight-length samples or fish tickets.
b Low Chinook salmon weight due to utilization of restricted mesh size.
c None sold.
86

Appendix A6.–Commercial and subsistence salmon catch by species, by year in Nome Subdistrict, Norton Sound District, 1990–2013. NOME (SUBDISTRICT 1)
Commercial Subsistence Combined
Year Chinook Sockeye Coho Pink Chum Total Chinook Sockeye Coho Pink Chum Total Chinook Sockeye Coho Pink Chum Total 1990 0 0 0 0 0 0 58 234 510 2,233 4,246 7,281 58 234 510 2,233 4,246 7,281 1991 0 0 0 0 0 0 83 166 1,279 194 3,715 5,437 83 166 1,279 194 3,715 5,437 1992 1 2 693 185 881 1,762 152 163 1,481 7,351 1,684 10,831 153 165 2,174 7,536 2,565 12,593 1993 0 2 611 0 132 745 52 80 2,070 873 1,766 4,841 52 82 2,681 873 1,898 5,586 1994 0 1 287 0 66 354 23 69 983 6,556 1,673 9,304 23 70 1,270 6,556 1,739 9,658 1995 0 1 369 0 122 492 26 148 1,365 336 3,794 5,669 26 149 1,734 336 3,916 6,161 1996 0 0 9 13 3 25 9 185 828 3,510 2,287 6,819 9 185 837 3,523 2,290 6,844 1997 0 0 0 0 0 0 10 50 325 175 2,696 3,256 10 50 325 175 2,696 3,256 1998 0 0 0 0 0 0 15 14 1,057 4,797 964 6,847 15 14 1,057 4,797 964 6,847
1999 a 0 0 0 0 0 0 11 85 161 58 337 652 11 85 161 58 337 652 2000 0 0 0 0 0 0 7 26 747 2,657 535 3,972 7 26 747 2,657 535 3,972 2001 0 0 0 0 0 0 2 92 425 113 858 1,490 2 92 425 113 858 1,490 2002 0 0 0 0 0 0 4 79 666 3,161 1,114 5,024 4 79 666 3,161 1,114 5,024 2003 0 0 0 0 0 0 63 76 351 507 565 1,562 63 76 351 507 565 1,562 2004 0 0 0 0 0 0 100 106 1,574 15,047 685 17,512 100 106 1,574 15,047 685 17,512 2005 0 0 0 0 0 0 62 177 1,287 5,075 803 7,404 62 177 1,287 5,075 803 7,404
2006 b 0 0 0 0 0 0 24 159 3,865 9,329 890 14,267 24 159 3,865 9,329 890 14,267 2007 0 0 0 0 0 0 18 297 1,103 850 2,938 5,206 18 297 1,103 850 2,938 5,206 2008 0 0 0 0 0 0 39 127 3,423 12,592 739 16,920 39 127 3,423 12,592 739 16,920 2009 0 0 0 0 0 0 32 64 1,132 487 387 2,102 32 64 1,132 487 387 2,102 2010 0 0 0 0 0 0 39 77 1,983 6,281 3,124 11,504 39 77 1,983 6,281 3,124 11,504 2011 0 0 0 0 0 0 19 47 1,229 1,389 1,428 4,112 19 47 1,229 1,389 1,428 4,112 2012 0 0 0 0 0 0 11 171 1,150 8,376 2,521 12,229 11 171 1,150 8,376 2,521 12,229 2013 c c c c c c 48 211 1,804 805 3,065 5,973 c c c c c c
5-year
avg d 0 0 0 0 0 0 28 97 1,783 5,825 1,640 9,373 28 97 1,783 5,825 1,640 9,373
10-year
avg e 0 0 0 0 0 0 41 130 1,710 5,993 1,408 9,282 41 130 1,710 5,993 1,408 9,282
Note: Commercial harvest numbers may include a small number of salmon reported on fish tickets that were retained for personal use and not commercially sold. a Beginning in 1999, Tier II chum salmon fishing restrictions limited the number of permit holders that could fish for chum salmon. b Beginning in 2006, Tier II chum salmon fishing restrictions were suspended. c Confidential. d 2008–2012. e 2003–2012.
87

Appendix A7.–Commercial and subsistence salmon catch by species, by year in Golovin Subdistrict, Norton Sound District, 1990–2013. GOLOVIN (SUBDISTRICT 2)
Commercial Subsistence Combined
Year Chinook Sockeye Coho Pink Chum Total Chinook Sockeye Coho Pink Chum Total Chinook Sockeye Coho Pink Chum Total 1990 52 21 0 0 15,993 16,066 a a a a a a a a a a a a 1991 49 1 0 0 14,839 14,889 a a a a a a a a a a a a 1992 6 9 2,085 0 1,002 3,102 a a a a a a a a a a a a 1993 1 4 2 8,480 2,803 11,290 a a a a a a a a a a a a
1994 b 0 0 3,424 0 111 3,535 253 168 733 8,410 1,337 10,901 253 168 4,157 8,410 1,448 14,436 1995 b 0 0 1,616 4,296 1,987 7,899 165 34 1,649 7,818 10,373 20,039 165 34 3,265 12,114 12,360 27,938 1996 b 0 0 638 0 0 638 86 134 3,014 17,399 2,867 23,500 86 134 3,652 17,399 2,867 24,138 1997 b 19 2 102 20 8,003 8,146 138 427 555 4,570 4,891 10,581 157 429 657 4,590 12,894 18,727 1998 b 1 0 3 106,761 723 107,488 184 37 1,292 13,340 1,893 16,746 185 37 1,295 120,101 2,616 124,234 1999 b 0 0 0 0 0 0 60 48 1,234 469 3,656 5,467 60 48 1,234 469 3,656 5,467 2000 b 0 0 1,645 17,408 164 19,217 169 18 2,335 10,906 1,155 14,583 169 18 3,980 28,314 1,319 33,800 2001 b 0 43 30 0 7,094 7,167 89 72 880 1,665 3,291 5,997 89 115 910 1,665 10,385 13,164 2002 b 0 0 0 0 0 0 69 66 1,640 14,430 1,882 18,087 69 66 1,640 14,430 1,882 18,087 2003 b 0 0 0 0 0 0 166 28 309 5,012 1,477 6,992 166 28 309 5,012 1,477 6,992 2004 c 0 0 0 0 0 0 164 6 654 19,936 880 21,640 164 6 654 19,936 880 21,640 2005 c 0 0 0 0 0 0 96 15 686 11,467 1,852 14,116 96 15 686 11,467 1,852 14,116 2006 c 0 0 0 0 0 0 136 38 1,760 14,670 722 17,326 136 38 1,760 14,670 722 17,326 2007 c 0 0 0 0 0 0 188 321 1,179 3,980 4,217 9,885 188 321 1,179 3,980 4,217 9,885 2008 c 0 0 256 2,699 623 3,578 146 95 2,337 10,155 350 13,083 146 95 2,593 12,854 973 16,661 2009 c 0 0 2,452 0 87 2,539 237 33 1,377 3,787 1,694 7,128 237 33 3,829 3,787 1,781 9,667 2010 c 3 2 5,586 2,039 17,212 24,842 59 32 2,020 9,620 1,133 12,864 62 34 7,606 11,659 18,345 37,706 2011 c 7 0 859 3 20,075 20,944 99 74 1,345 5,652 2,122 9,292 106 74 2,204 5,655 22,197 30,236 2012 c 2 14 573 31,055 3,791 35,435 57 52 1,143 7,635 1,056 9,943 59 66 1,716 38,690 4,847 45,378 2013 c 0 0 5,362 1,180 3,113 9,655 47 15 964 3,655 3,256 7,937 47 15 6,326 4,835 6,369 17,592 5-year
avg d 2 3 1,945 7,159 8,358 17,468 120 57 1,644 7,370 1,271 10,462 122 60 3,590 14,529 9,629 27,930 10-year
avg e 1 2 973 3,580 4,179 8,734 135 69 1,281 9,191 1,550 12,227 136 71 2,254 12,771 5,729 20,961 Note: Commercial harvest numbers may include a small number of salmon reported on fish tickets that were retained for personal use and not commercially sold. a Subsistence surveys were not conducted. b Subsistence harvests were estimated from Division of Subsistence household surveys. Previous surveys often were partial surveys and did not capture late-season harvests like
coho salmon. c Beginning in 2004 a permit was required for the subdistrict, replacing household surveys. The permit system helped to record harvest by residents living outside the subdistrict. d 2008–2012. e 2003–2012.
88

Appendix A8.–Commercial and subsistence salmon catch by species, by year in Elim Subdistrict, Norton Sound District, 1990–2013. ELIM (SUBDISTRICT 3)
Commercial Subsistence Combined
Year Chinook Sockeye Coho Pink Chum Total Chinook Sockeye Coho Pink Chum Total Chinook Sockeye Coho Pink Chum Total 1990 202 0 0 501 3,723 4,426 a a a a a a a a a a a a
1991 b 161 0 0 0 804 965 312 0 2,153 3,555 2,660 8,680 473 0 2,153 3,555 3,464 9,645 1992 b 0 0 3,531 0 6 3,537 100 0 1,281 6,152 1,260 8,793 100 0 4,812 6,152 1,266 12,330 1993 b 3 0 4,065 0 167 4,235 368 0 1,217 1,726 1,635 4,946 371 0 5,282 1,726 1,802 9,181 1994 b 0 0 5,345 0 414 5,759 322 104 1,180 9,345 3,476 14,427 322 104 6,525 9,345 3,890 20,186 1995 b 4 44 3,742 2,962 1,171 7,923 284 17 1,353 2,046 3,774 7,474 288 61 5,095 5,008 4,945 15,397 1996 b 0 0 1,915 68,609 0 70,524 417 52 1,720 9,442 2,319 13,950 417 52 3,635 78,051 2,319 84,474 1997 b 844 0 1,409 0 2,683 4,936 619 50 1,213 1,314 2,064 5,260 1,463 50 2,622 1,314 4,747 10,196 1998 b 105 0 1,462 145,669 2,311 149,547 414 49 1,831 6,891 1,376 10,561 519 49 3,293 152,560 3,687 160,108 1999 b 0 0 0 0 0 0 424 13 975 1,564 744 3,720 424 13 975 1,564 744 3,720 2000 b 10 0 5,182 46,369 535 52,096 248 46 1,429 5,983 1,173 8,879 258 46 6,611 52,352 1,708 60,975 2001 b 7 0 1,696 0 681 2,384 427 70 1,352 1,390 898 4,137 434 70 3,048 1,390 1,579 6,521 2002 b 0 0 0 0 0 0 565 14 1,801 8,345 1,451 12,176 565 14 1,801 8,345 1,451 12,176 2003 b 0 0 0 0 0 0 660 39 1,143 2,524 1,687 6,053 660 39 1,143 2,524 1,687 6,053 2004 c 0 0 0 0 0 0 412 0 704 7,858 683 9,657 412 0 704 7,858 683 9,657 2005 c 0 0 0 0 0 0 225 9 1,011 3,721 598 5,564 225 9 1,011 3,721 598 5,564 2006 c 0 0 0 0 0 0 179 13 1,769 5,216 1,267 8,444 179 13 1,769 5,216 1,267 8,444 2007 c 1 0 5,908 1,648 4,567 12,124 260 0 2,295 1,742 2,334 6,631 261 0 8,203 3,390 6,901 18,755 2008 c 5 0 4,602 14,536 304 19,447 269 0 1,804 7,655 1,284 11,012 274 0 6,406 22,191 1,588 30,459 2009 c 0 1 9,582 35 597 10,215 545 13 2,434 1,522 600 5,114 545 14 12,016 1,557 1,197 15,329 2010 c 9 5 10,180 11,658 23,453 45,305 97 7 1,679 7,830 3,925 13,538 106 12 11,859 19,488 27,378 58,843 2011 c 4 12 8,336 165 23,531 32,048 160 3 1,688 704 3,671 6,226 164 15 10,024 869 27,202 38,274 2012 c 3 1 2,003 52,775 2,262 57,044 42 0 1,302 10,848 1,494 13,686 45 1 3,305 63,623 3,756 70,730 2013 c 6 27 6,675 601 1,434 8,743 39 15 1,515 1,134 1,218 3,921 45 42 8,190 1,735 2,652 12,664 5-year
avg. d 4 4 6,941 15,834 10,029 32,812 223 5 1,781 5,712 2,195 9,915 227 8 8,722 21,546 12,224 42,727 10-year
avg. e 2 2 4,061 8,082 5,471 17,618 285 8 1,583 4,962 1,754 8,593 287 10 5,644 13,044 7,226 26,211 Note: Commercial harvest numbers may include a small number of salmon reported on fish tickets that were retained for personal use and not commercially sold. a Subsistence surveys were not conducted. b Subsistence harvests were estimated from Division of Subsistence household surveys. Previous surveys often were partial surveys and did not capture later season harvest like
coho salmon. c Beginning in 2004 a permit was required for the subdistrict, replacing household surveys. The permit system helped to record harvest by residents living outside the subdistrict. d 2008–2012. e 2003–2012.
89

Appendix A9.–Commercial and subsistence salmon catch by species, by year in Norton Bay Subdistrict, Norton Sound District, 1990–2013.
NORTON BAY (SUBDISTRICT 4)
Commercial Subsistence Combined
Year Chinook Sockeye Coho Pink Chum Total Chinook Sockeye Coho Pink Chum Total Chinook Sockeye Coho Pink Chum Total 1990 0 0 0 0 0 0 a a a a a a a a a a a a 1991 0 0 0 0 0 0 a a a a a a a a a a a a 1992 27 0 0 0 1,787 1,814 a a a a a a a a a a a a 1993 267 0 0 290 1,378 1,935 a a a a a a a a a a a a
1994 b 0 0 0 0 0 0 308 1 370 6,049 4,581 11,309 308 1 370 6,049 4,581 11,309 1995 b 0 0 0 0 0 0 475 46 985 3,514 5,828 10,848 475 46 985 3,514 5,828 10,848 1996 b 0 0 0 0 0 0 295 3 676 3,929 4,161 9,064 295 3 676 3,929 4,161 9,064 1997 b 194 0 0 0 531 725 656 54 322 1,795 4,040 6,867 850 54 322 1,795 4,571 7,592 1998 b 0 0 0 0 0 0 684 0 388 2,009 6,192 9,273 684 0 388 2,009 6,192 9,273 1999 b 0 0 0 0 0 0 327 0 167 1,943 4,153 6,590 327 0 167 1,943 4,153 6,590 2000 b 0 0 0 0 0 0 397 2 267 2,255 4,714 7,635 397 2 267 2,255 4,714 7,635 2001 b 0 0 0 0 0 0 460 14 276 5,203 4,445 10,398 460 14 276 5,203 4,445 10,398 2002 b 0 0 0 0 0 0 557 0 509 6,049 3,971 11,086 557 0 509 6,049 3,971 11,086 2003 b 0 0 0 0 0 0 373 46 510 4,184 3,397 8,510 373 46 510 4,184 3,397 8,510
2004 0 0 0 0 0 0 a a a a a a a a a a a a 2005 0 0 0 0 0 0 a a a a a a a a a a a a 2006 0 0 0 0 0 0 a a a a a a a a a a a a 2007 0 0 0 0 0 0 a a a a a a a a a a a a 2008 7 0 600 1,232 507 2,346 187 2 1,084 4,489 3,330 9,092 194 2 1,684 5,721 3,837 11,438 2009 0 0 1,714 558 1,850 4,122 259 2 891 2,508 3,183 6,843 259 2 2,605 3,066 5,033 10,965 2010 0 7 1,606 2,597 6,007 10,217 341 21 461 3,115 3,180 7,118 341 28 2,067 5,712 9,187 17,335 2011 5 9 4,836 652 7,558 13,060 239 1 549 1,132 3,529 5,450 6 558 5,968 4,181 13,008 13,066 2012 10 16 4,378 49,970 8,417 62,791 103 0 310 2,623 2,721 5,757 113 16 4,688 52,593 11,138 68,548 2013 8 4 5,485 487 36,021 42,005 123 2 826 1,341 3,853 6,145 131 6 6,311 1,828 39,874 48,150
5-year
avg. c 6 8 3,284 13,752 6,085 23,134 282 7 824 3,467 3,986 8,565 228 152 4,253 17,818 10,551 30,338
Note: Commercial harvest numbers may include a small number of salmon reported on fish tickets that were retained for personal use and not commercially sold. a Subsistence surveys were not conducted. b Subsistence harvests were estimated from Division of Subsistence household surveys. Previous surveys often were partial surveys that did not capture later season harvests like
coho salmon. c 2008–2012.
90
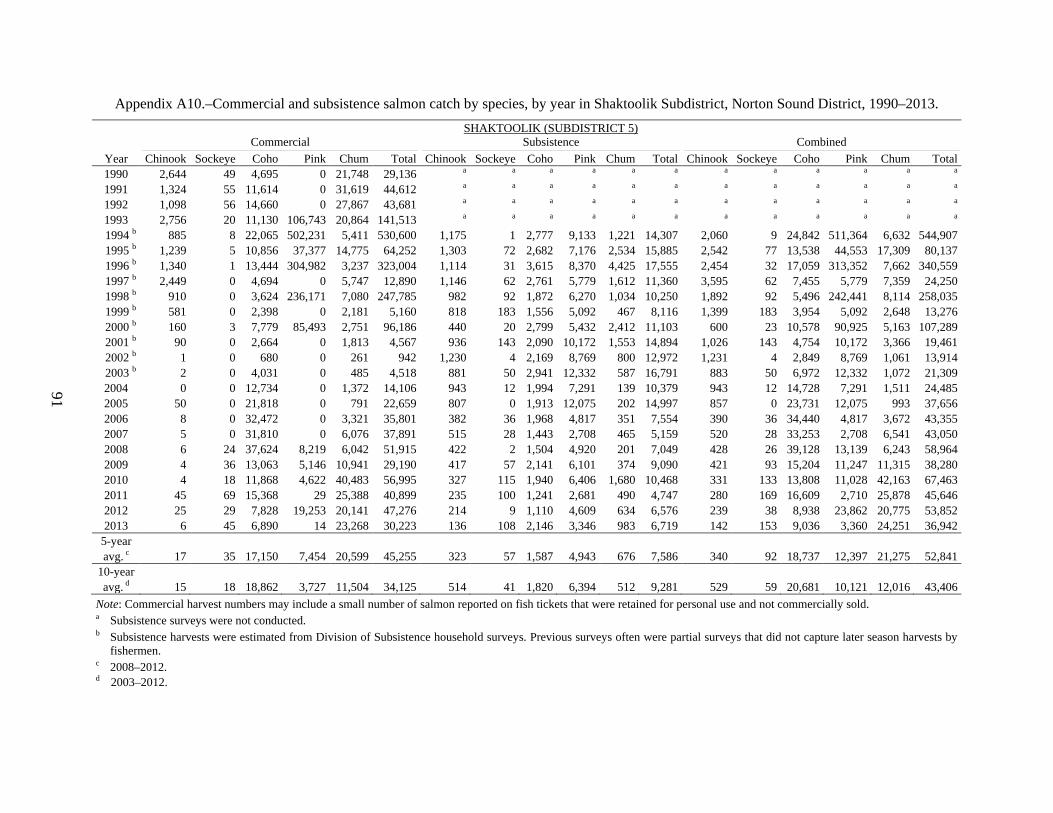
Appendix A10.–Commercial and subsistence salmon catch by species, by year in Shaktoolik Subdistrict, Norton Sound District, 1990–2013. SHAKTOOLIK (SUBDISTRICT 5)
Commercial Subsistence Combined
Year Chinook Sockeye Coho Pink Chum Total Chinook Sockeye Coho Pink Chum Total Chinook Sockeye Coho Pink Chum Total 1990 2,644 49 4,695 0 21,748 29,136 a a a a a a a a a a a a 1991 1,324 55 11,614 0 31,619 44,612 a a a a a a a a a a a a 1992 1,098 56 14,660 0 27,867 43,681 a a a a a a a a a a a a 1993 2,756 20 11,130 106,743 20,864 141,513 a a a a a a a a a a a a
1994 b 885 8 22,065 502,231 5,411 530,600 1,175 1 2,777 9,133 1,221 14,307 2,060 9 24,842 511,364 6,632 544,907 1995 b 1,239 5 10,856 37,377 14,775 64,252 1,303 72 2,682 7,176 2,534 15,885 2,542 77 13,538 44,553 17,309 80,137 1996 b 1,340 1 13,444 304,982 3,237 323,004 1,114 31 3,615 8,370 4,425 17,555 2,454 32 17,059 313,352 7,662 340,559 1997 b 2,449 0 4,694 0 5,747 12,890 1,146 62 2,761 5,779 1,612 11,360 3,595 62 7,455 5,779 7,359 24,250 1998 b 910 0 3,624 236,171 7,080 247,785 982 92 1,872 6,270 1,034 10,250 1,892 92 5,496 242,441 8,114 258,035 1999 b 581 0 2,398 0 2,181 5,160 818 183 1,556 5,092 467 8,116 1,399 183 3,954 5,092 2,648 13,276 2000 b 160 3 7,779 85,493 2,751 96,186 440 20 2,799 5,432 2,412 11,103 600 23 10,578 90,925 5,163 107,289 2001 b 90 0 2,664 0 1,813 4,567 936 143 2,090 10,172 1,553 14,894 1,026 143 4,754 10,172 3,366 19,461 2002 b 1 0 680 0 261 942 1,230 4 2,169 8,769 800 12,972 1,231 4 2,849 8,769 1,061 13,914 2003 b 2 0 4,031 0 485 4,518 881 50 2,941 12,332 587 16,791 883 50 6,972 12,332 1,072 21,309
2004 0 0 12,734 0 1,372 14,106 943 12 1,994 7,291 139 10,379 943 12 14,728 7,291 1,511 24,485 2005 50 0 21,818 0 791 22,659 807 0 1,913 12,075 202 14,997 857 0 23,731 12,075 993 37,656 2006 8 0 32,472 0 3,321 35,801 382 36 1,968 4,817 351 7,554 390 36 34,440 4,817 3,672 43,355 2007 5 0 31,810 0 6,076 37,891 515 28 1,443 2,708 465 5,159 520 28 33,253 2,708 6,541 43,050 2008 6 24 37,624 8,219 6,042 51,915 422 2 1,504 4,920 201 7,049 428 26 39,128 13,139 6,243 58,964 2009 4 36 13,063 5,146 10,941 29,190 417 57 2,141 6,101 374 9,090 421 93 15,204 11,247 11,315 38,280 2010 4 18 11,868 4,622 40,483 56,995 327 115 1,940 6,406 1,680 10,468 331 133 13,808 11,028 42,163 67,463 2011 45 69 15,368 29 25,388 40,899 235 100 1,241 2,681 490 4,747 280 169 16,609 2,710 25,878 45,646 2012 25 29 7,828 19,253 20,141 47,276 214 9 1,110 4,609 634 6,576 239 38 8,938 23,862 20,775 53,852 2013 6 45 6,890 14 23,268 30,223 136 108 2,146 3,346 983 6,719 142 153 9,036 3,360 24,251 36,942
5-year
avg. c 17 35 17,150 7,454 20,599 45,255 323 57 1,587 4,943 676 7,586 340 92 18,737 12,397 21,275 52,841
10-year
avg. d 15 18 18,862 3,727 11,504 34,125 514 41 1,820 6,394 512 9,281 529 59 20,681 10,121 12,016 43,406
Note: Commercial harvest numbers may include a small number of salmon reported on fish tickets that were retained for personal use and not commercially sold. a Subsistence surveys were not conducted. b Subsistence harvests were estimated from Division of Subsistence household surveys. Previous surveys often were partial surveys that did not capture later season harvests by
fishermen. c 2008–2012. d 2003–2012.
91
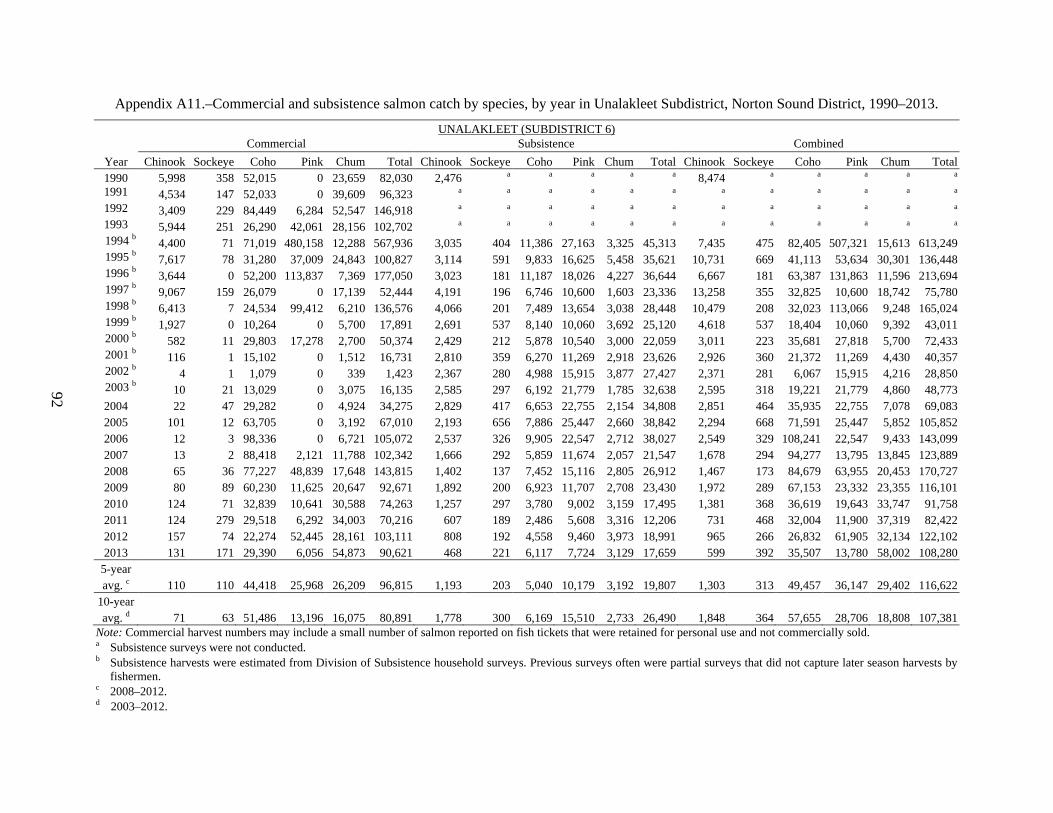
Appendix A11.–Commercial and subsistence salmon catch by species, by year in Unalakleet Subdistrict, Norton Sound District, 1990–2013.
UNALAKLEET (SUBDISTRICT 6)
Commercial Subsistence Combined
Year Chinook Sockeye Coho Pink Chum Total Chinook Sockeye Coho Pink Chum Total Chinook Sockeye Coho Pink Chum Total 1990 5,998 358 52,015 0 23,659 82,030 2,476 a a a a a 8,474 a a a a a 1991 4,534 147 52,033 0 39,609 96,323 a a a a a a a a a a a a 1992 3,409 229 84,449 6,284 52,547 146,918 a a a a a a a a a a a a 1993 5,944 251 26,290 42,061 28,156 102,702 a a a a a a a a a a a a
1994 b 4,400 71 71,019 480,158 12,288 567,936 3,035 404 11,386 27,163 3,325 45,313 7,435 475 82,405 507,321 15,613 613,249 1995 b 7,617 78 31,280 37,009 24,843 100,827 3,114 591 9,833 16,625 5,458 35,621 10,731 669 41,113 53,634 30,301 136,448 1996 b 3,644 0 52,200 113,837 7,369 177,050 3,023 181 11,187 18,026 4,227 36,644 6,667 181 63,387 131,863 11,596 213,694 1997 b 9,067 159 26,079 0 17,139 52,444 4,191 196 6,746 10,600 1,603 23,336 13,258 355 32,825 10,600 18,742 75,780 1998 b 6,413 7 24,534 99,412 6,210 136,576 4,066 201 7,489 13,654 3,038 28,448 10,479 208 32,023 113,066 9,248 165,024 1999 b 1,927 0 10,264 0 5,700 17,891 2,691 537 8,140 10,060 3,692 25,120 4,618 537 18,404 10,060 9,392 43,011 2000 b 582 11 29,803 17,278 2,700 50,374 2,429 212 5,878 10,540 3,000 22,059 3,011 223 35,681 27,818 5,700 72,433 2001 b 116 1 15,102 0 1,512 16,731 2,810 359 6,270 11,269 2,918 23,626 2,926 360 21,372 11,269 4,430 40,357 2002 b 4 1 1,079 0 339 1,423 2,367 280 4,988 15,915 3,877 27,427 2,371 281 6,067 15,915 4,216 28,850 2003 b 10 21 13,029 0 3,075 16,135 2,585 297 6,192 21,779 1,785 32,638 2,595 318 19,221 21,779 4,860 48,773
2004 22 47 29,282 0 4,924 34,275 2,829 417 6,653 22,755 2,154 34,808 2,851 464 35,935 22,755 7,078 69,083 2005 101 12 63,705 0 3,192 67,010 2,193 656 7,886 25,447 2,660 38,842 2,294 668 71,591 25,447 5,852 105,852 2006 12 3 98,336 0 6,721 105,072 2,537 326 9,905 22,547 2,712 38,027 2,549 329 108,241 22,547 9,433 143,099 2007 13 2 88,418 2,121 11,788 102,342 1,666 292 5,859 11,674 2,057 21,547 1,678 294 94,277 13,795 13,845 123,889 2008 65 36 77,227 48,839 17,648 143,815 1,402 137 7,452 15,116 2,805 26,912 1,467 173 84,679 63,955 20,453 170,727 2009 80 89 60,230 11,625 20,647 92,671 1,892 200 6,923 11,707 2,708 23,430 1,972 289 67,153 23,332 23,355 116,101 2010 124 71 32,839 10,641 30,588 74,263 1,257 297 3,780 9,002 3,159 17,495 1,381 368 36,619 19,643 33,747 91,758 2011 124 279 29,518 6,292 34,003 70,216 607 189 2,486 5,608 3,316 12,206 731 468 32,004 11,900 37,319 82,422 2012 157 74 22,274 52,445 28,161 103,111 808 192 4,558 9,460 3,973 18,991 965 266 26,832 61,905 32,134 122,102 2013 131 171 29,390 6,056 54,873 90,621 468 221 6,117 7,724 3,129 17,659 599 392 35,507 13,780 58,002 108,280
5-year
avg. c 110 110 44,418 25,968 26,209 96,815 1,193 203 5,040 10,179 3,192 19,807 1,303 313 49,457 36,147 29,402 116,622
10-year
avg. d 71 63 51,486 13,196 16,075 80,891 1,778 300 6,169 15,510 2,733 26,490 1,848 364 57,655 28,706 18,808 107,381
Note: Commercial harvest numbers may include a small number of salmon reported on fish tickets that were retained for personal use and not commercially sold. a Subsistence surveys were not conducted. b Subsistence harvests were estimated from Division of Subsistence household surveys. Previous surveys often were partial surveys that did not capture later season harvests by
fishermen. c 2008–2012. d 2003–2012.
92

Appendix A12.–Subsistence salmon catch by species and year for St. Michael and Stebbins in Norton Sound District, 1994–2013.
Year Chinook Chum Pink Sockeye Coho Total St Michael
1994 769 4,309 2,673 127 1,022 8,900 1995 1,267 5,778 391 45 2,235 9,716 1996 1,400 6,352 1,503 3 1,641 10,899 1997 970 2,816 84 41 547 4,458 1998 542 1,502 961 143 1,406 4,554 1999 1,053 3,036 365 111 798 5,363 2000 160 1,381 80 16 1,180 2,817 2001 282 2,246 229 17 490 3,264 2002 227 1,136 583 20 989 2,955 2003 295 1,994 577 89 1,438 4,393 2004 Subsistence surveys were not conducted. 2005 998 3,614 1,742 61 1,497 7,912 2006 271 2,628 480 347 1,256 4,982 2007 452 2,119 265 9 622 3,467 2008 Subsistence surveys were not conducted. 2009 825 921 169 24 1,088 3,027 2010 Subsistence surveys were not conducted. 2011 Subsistence surveys were not conducted. 2012 80 2,172 457 20 911 3,640 2013 Subsistence surveys were not conducted.
Stebbins
1994 1,525 5,989 5,552 288 3,948 17,302 1995 1,211 5,042 758 207 2,570 9,788 1996 1,030 7,401 2,375 424 3,746 14,976 1997 1,164 3,230 243 116 1,826 6,579 1998 1,410 3,909 3,125 295 3,116 11,855 1999 760 3,312 459 200 1,312 6,043 2000 298 2,913 364 341 2,429 6,345 2001 570 3,999 202 0 2,759 7,530 2002 450 3,586 7,459 300 2,324 14,119 2003 265 2,399 2,685 171 1,215 6,735 2004 Subsistence surveys were not conducted. 2005 485 5,164 4,353 59 2,702 12,763 2006 355 4,236 4,321 140 4,856 13,908 2007 763 4,980 1,881 0 2,006 9,630 2008 Subsistence surveys were not conducted. 2009 713 1,461 328 0 1,114 3,616 2010 Subsistence surveys were not conducted. 2011 Subsistence surveys were not conducted. 2012 109 3,456 3,659 0 1,256 8,480 2013 Subsistence surveys were not conducted.
Note: Harvest numbers shown have been expanded to include households not contacted.
93

Appendix A13.–Commercial, subsistence, and sport salmon catch by species, by year for Subdistricts 1–6 in Norton Sound District, 1990–2013. SUBDISTRICTS 1–6
Commercial Subsistence Sport fish
Year Chinook Sockeye Coho Pink Chum Total Chinook Sockeye Coho Pink Chum Total Chinook Sockeye Coho Pink Chum Total 1990 a 8,895 434 56,712 501 65,123 131,665 2,534 234 510 2,233 4,246 7,281 364 198 3,305 7,647 925 12,439 1991 a 6,068 203 63,647 0 86,871 156,789 395 166 3,432 3,749 6,375 14,117 404 237 5,800 1,738 1,415 9,594 1992 a 4,541 296 105,418 6,284 83,394 199,933 252 163 2,762 13,503 2,944 19,624 204 131 4,671 6,403 523 11,932 1993 a 8,972 279 43,283 157,574 53,562 263,670 420 80 3,287 2,599 3,401 9,787 595 10 3,783 2,250 691 7,329
1994 5,285 80 102,140 982,389 18,290 1,108,184 5,116 747 17,429 66,656 15,613 105,561 600 18 5,547 7,051 536 13,752 1995 8,860 128 47,863 81,644 42,898 181,393 5,367 908 17,867 37,515 31,761 95,536 438 104 3,705 928 394 5,569 1996 4,984 1 68,206 487,441 10,609 571,241 4,944 586 21,040 60,676 20,286 107,532 662 100 7,289 5,972 662 14,685 1997 12,573 161 32,284 20 34,103 79,141 6,760 839 11,922 24,233 16,906 60,660 1,106 30 4,393 1,458 278 7,265 1998 7,429 7 29,623 588,013 16,324 641,396 6,345 393 13,929 46,961 14,497 82,125 590 16 4,441 6,939 682 12,668 1999 2,508 0 12,662 0 7,881 23,051 4,331 866 12,233 19,186 13,049 49,665 630 0 5,582 3,039 211 9,462 2000 752 14 44,409 166,548 6,150 217,873 3,690 324 13,455 37,773 12,989 68,231 889 45 7,441 2,886 1,097 12,358 2001 213 44 19,492 0 11,100 30,849 4,724 750 11,293 29,812 13,963 60,542 271 39 4,802 360 1,709 7,181 2002 5 1 1,759 0 600 2,365 4,792 443 11,773 56,669 13,095 86,772 802 0 4,211 4,303 818 10,134 2003 12 21 17,060 0 3,560 20,653 4,728 536 11,446 46,338 9,498 72,546 239 572 3,039 2,222 292 6,364
2004 a 22 47 42,016 0 6,296 48,381 4,448 541 11,579 72,887 4,541 93,996 535 404 5,806 8,309 498 15,552 2005 a 151 12 85,523 0 3,983 89,669 3,383 857 12,783 57,785 6,115 80,923 216 0 3,959 473 36 4,684 2006 a 20 3 130,808 0 10,042 140,873 3,258 572 19,267 56,579 5,942 85,618 427 22 11,427 5,317 344 17,537 2007 a 19 2 126,136 3,769 22,431 152,357 2,647 938 11,879 20,954 12,011 48,428 147 15 6,179 1,331 96 7,768
2008 83 60 120,309 75,525 25,124 221,101 2,465 363 17,604 54,927 8,709 84,068 580 63 10,756 6,855 341 18,595 2009 84 126 87,041 17,364 34,122 138,737 3,382 369 14,898 26,112 8,946 53,707 277 0 6,664 1,321 417 8,679 2010 140 103 62,079 31,557 117,743 211,622 2,120 549 11,863 42,254 16,201 72,987 61 0 5,876 2,717 118 8,772 2011 185 369 58,917 7,141 110,555 177,167 1,359 414 8,538 17,166 14,556 42,033 61 58 3,582 566 139 4,406 2012 197 134 37,056 205,498 62,772 305,657 1,235 424 9,573 43,551 12,399 67,182 0 28 5,099 3,220 209 8,556 2013 151 247 53,802 8,338 118,709 181,247 861 572 13,372 18,045 15,504 48,354 0 23 7,567 1,806 2,267 11,663
5-year
avg. b 138 158 73,080 67,417 70,063 210,857 2,112 424 12,495 36,802 12,162 63,995 196 30 6,395 2,936 245 9,802
10-year
avg. c 91 88 76,695 34,085 39,663 150,622 2,903 556 12,943 43,855 9,892 70,149 254 116 6,239 3,233 249 10,091
Note: Commercial harvest may include a small number of salmon reported on fish tickets that were retained for personal use and not commercially sold. ND is no data or insufficient data.
a Not all subdistricts were surveyed. b 2008–2012. c 2003–2012.
94

Appendix A14.–Sport salmon harvest by species, by year for the Unalakleet River, 1990–2013.
Year Chinook Coho Chum Pink Total 1990 276
1,826
298
1,180 3,580
1991 296 2,180 497 437 3,410 1992 117
1,555
379
779
2,830
1993 382
643
116
89
1,230 1994 379
2,425
220
402
3,426
1995 259
2,033
207
222
2,721 1996 384
3,411
463
59
4,317
1997 842
2,784
228
1,055
4,909 1998 513
2,742
447
434
4,136
1999 415
2,691
211
2,946
6,263 2000 345
4,150
403
961
5,859
2001 250
2,766
714
188
3,918 2002 544
2,937
607
1,378
5,466
2003 97
1,604
191
29
1,921 2004 356
3,524
47
2,003
5,930
2005 216
3,959
36
473
4,684 2006 394
4,985
224
891
6,494
2007 147
4,117
85
618
4,967 2008 580
6,029
175
2,077
8,861
2009 236
5,095
260
586
6,177 2010 61
3,006
59
535
3,661
2011 54
2,493
77
391
3,015 2012 0
3,283
118
20
3,421
2013 0 4,068 354 886 5,308 Avg 2008–2012 186
3,981
138
722
5,027
Avg 2003–2012 214 3,810 127 762 4,913
95

Appendix A15.–Sport salmon harvest by species, by year for the Fish/Niukluk rivers, 1990–2013.
Year Chinook Coho Chum Pink Total 1990 0
267
216
638 1,121
1991 14 977 272 356 1,619 1992 0
753
15
357
1,125
1993 9
1,185
514
278
1,986 1994 10
1,122
119
231
1,482
1995 18
818
27
136
999 1996 11
1,652
166
404
2,233
1997 71
462
0
58
591 1998 0
316
0
0
316
1999 44
1,365
0
80
1,489 2000 174
1,165
0
51
1,390
2001 0
969
439
161
1,569 2002 75
298
45
254
672
2003 39
216
101
196
552 2004 22
291
435
353
1,101
2005 37
400
0
58
495 2006 0
948
0
134
1,082
2007 0
786
11
30
827 2008 0
1,986
166
969
3,121
2009 30
939
72
25
1,066 2010 0
1,069
0
99
1,168
2011 0
700
29
10
739 2012 0
1,163
74
636
1,873
2013 0 1,227 0 0 1,227 Avg 2008–2012 6
1,171
68
348
1,593
Avg 2003–2012 13 850 89 251 1,202
96

Appendix A16.–Sport salmon harvest by species, by year for the Nome River, 1990–2013.
Year Chinook Coho Chum Pink Total 1990 39
407
122
2,651
3,219
1991 22
417
241
356
1,036 1992 16
713
0
4,397
5,126
1993 93
602
0
723
1,418 1994 0
326
0
4,103
4,429
1995 0
143
0
230
373 1996 0
598
0
3,280
3,878
1997 10
295
0
83
388 1998 0
189
0
1,985
2,174
1999 0
219
0
0
219 2000 0
342
0
578
920
2001 0
297
0
0
297 2002 0
217
0
312
529
2003 0
68
0
12
80 2004 0
270
0
3,369
3,639
2005 0
1,001
0
1,193
2,194 2006 0
2,768
0
2,422
5,190
2007 0
797
0
402
1,199 2008 0
1,793
0
2,954
4,747
2009 0
229
0
178
407 2010 13
602
0
1,716
2,331
2011 0
68
0
85
153 2012 0
259
0
1,264
1,523
2013 0 279 139 302 720 Avg 2008–2012 3
590
0
1,239
1,832
Avg 2003–2012 1 786 0 1,360 2,146
97

Appendix A17.–Comparative salmon aerial survey escapement indices of Norton Sound streams unless noted otherwise, 1990–2013.
Sinuk River Nome River Year a Chinook Chum Pink Coho Chinook Chum Pink Coho 1990 ND 95 29,040 161
ND 541 13,085 377
1991 3 5,420 14,680 701
11 3,520 4,690 611 1992 1 470 292,400 422
3 813 255,700 691
1993 7 1,570 5,120 104
8 1,520 8,941 276 1994 10 1,140 492,000 307
2 350 265,450 631
1995 ND 3,110 1,250 290
ND 1,865 182 517 1996 5 1,815 74,100 367
1 799 34,520 723
1997 ND 2,975 1,200 57
4 956 65 544 1998 ND 630 372,850 322
3 335 179,680 515
1999 ND 1,697 180 217
ND 375 345 620 2000 ND 10 12,608 912
ND 658 6,380 1,032
2001 ND 3,746 115 b 750
ND 946 b 790 b 1,307 b 2002 ND 1,682 28,487 1,290 b
ND 127 b 295 b 1,796
2003 ND 677 9,885 190
8 337 2,841 604 2004 ND 100 b 1,267,100 b 2,085
ND 3 b 707,350 b 1,687
2005 ND 1,072 b 211,000 b 2,045
2 b 2,082 b 212,000 b 3,541 2006 0 b 1115 b 515,000 b 2,147
0 b 394 b 441,550 b 3,650
2007 3 b 7,210 b 6,810 b 668
4 b 1,449 b 3,378 b 1,442 2008 ND ND 1,496,000 b 1,633
ND 106 b 528,000 b 2,051
2009 0 b 344 b 6,730 b 508 b
ND ND ND 877 b 2010 0 b 3,955 b 168,600 b 5,507 b
0 b 2,998 b 98,272 b 0 b
2011 0 b 6,265 b 21,100 b 479 b
0 b 1,317 b 9,575 b 870 b 2012 0 b 3,650 b 506,500 b ND
No survey occurred.
2013 0 b 19,500 b 23,000 b 1,054 b No survey occurred. -continued-
98

Appendix A17.–Page 2 of 4.
Flambeau River Eldorado River Year a Chinook Chum Pink Coho Chinook Chum Pink Coho 1990 ND 905 ND 96
17 884 2,050 44
1991 ND 2,828 7,180 ND
76 5,755 1,590 98 1992 ND 55 ND 42
2 4,887 6,615 113
1993 ND 819 640 11
38 2,895 120 111 1994 ND 3,612 4 213
ND 5,140 53,890 242
1995 ND 1,876 1,102 186
4 9,025 50 247 1996 ND 647 355 71
21 20,710 40,100 254
1997 ND 2,250 b 200 b 751
40 5,967 10 37 1998 ND 2,828 7,180 ND
ND 3,000 123,950 71
1999 ND 55 ND 42
2 1,741 6 45 2000 ND 819 640 11
2 3,383 16,080 24
2001 ND 3,612 4 213
2 4,450 8 232 2002 ND 1,876 1,102 186
8 139 58,700 463
2003 ND 647 355 71
12 1,257 821 71 2004 ND 2,250 b 200 b 751
ND 109 b 52,000 b 755
2005 ND 2,261 b 100 b 154
2 b 5,445 b 2,050 b 376 2006 0 b 16,000 b 8,800 b ND
0 b 2,355 b 156,500 b 523
2007 1 b 4,452 b 0 b 38
2 b 6,315 b 318 b 34 2008 0 b 4,235 b 106,200 b 918
No survey occurred.
2009 0 b 860 b 1,598 b 627 b
14 b 1,069 b 210 b 301 b 2010 0 b 13,600 b 36,000 b ND
0 b 30,600 b 84,582 b ND
2011 0 b 5,283 b 1,810 b 292 b
0 b 9,225 b 260 b 120 b 2012 0 b 7,911 b ND ND
No survey occurred.
2013 0 b 16,088 b ND ND 4 b 16,859 b 52 b ND -continued-
99

Appendix A17.–Page 3 of 4.
Fish River Boston Creek Year a Chinook Chum Pink Coho Chinook Chum Pink Coho 1990 No survey occurred.
112 1,455 8,440 ND
1991 58 10,470 51,190 ND
152 2,560 3,210 ND 1992 4 390 1,387,000 ND
68 1,540 50,850 ND
1993 48 12,695 13,440 ND
227 4,563 1,930 ND 1994 55 16,500 910,000 ND
95 4,270 355,600 ND
1995 40 13,433 780 1,829
78 4,221 ND 230 1996 189 5,840 c 684,780 ND
ND 3,505 c 35,980 ND
1997 110 19,515 800 465
452 4,545 ND ND 1998 96 28,010 663,050 ND
255 1,570 175,330 ND
1999 ND 50 20 821
ND ND ND 319 2000 ND ND ND 805
ND ND ND 414
2001 8 3,220 1,744 1,055
33 3,533 1,038 155 2003 95 3,200 1,014 ND
145 750 701 ND
2004 19 621 404,930 90
93 55 135,000 140 2005 0 6,875 319,170 ND
46 1,675 5,850 ND
2010 No survey occurred.
29 b 3,010 b 5,110 b 73 b 2013 15 b 2,550 b ND ND 19 b 16,100 b ND ND
Niukluk River
Kwiniuk River
Year a Chinook Chum Pink Coho Chinookd Chum d Pink d Coho d 1990 15 6,200 115,250 170
744 13,735 416,511 746 e
1991 42 10,700 37,410 1,783f
587 18,802 53,499 809 e 1992 ND 7,770 803,200 812
479 12,077 1,464,717 532 e
1993 15 19,910 2,840 2,104
565 15,823 43,065 1,238 e 1994 7 16,470 1,294,100 274
627 33,010 2,304,099 2,547
1995 48 25,358 200 2,136
468 42,161 17,509 1,625 e 1996 25 9,732 c 153,150 2,047
567 27,256 907,894 1,410 e
1997 131 16,550 ND 983
972 20,118 9,536 610 e 1998 51 2,556 205,110 593
296 24,248 655,933 610 e
1999 ND 640 ND 619
115 8,763 608 223 e 2000 ND ND ND 3,812
144 12,878 750,173 541 e
2001 6 2,448 2,856 809
258 16,598 8,423 9,532 2002 ND ND ND 1,122
778 37,995 111,410 6,459
2003 55 2,315 272 146
744 12,123 22,329 5,490 2004 15 173 277,900 828
663 10,362 3,054,684 11,240
2005 6 3,225 154,000 ND
342 12,083 341,048 12,950 2006 ND ND ND 737 g
195 39,519 1,347,090 22,341
2007 ND ND ND ND
258 27,756 54,225 9,429 2008 ND ND ND 1,715
237 9,483 1,444,213 10,461
2009 No survey occurred.
444 8,739 42,960 9,036 2010 No survey occurred.
135 71,388 634,220 8,049
2011 4 b 9,735 b 375 b 838 b
57 31,604 30,023 3,288 2012 ND ND ND 928 b
54 5,577 393,302 777
2013 68 b 17,203 b 9,700 b 2,279 b 15 5,631 13,212 3,940 -continued-
100

Appendix A17.–Page 4 of 4.
Tubutulik River North River Year a Chinook Chum Pink Coho Chinook Chum Pink Coho 1990 397 4,350 186,400 ND
255 1,345 25,685 ND
1991 661 7,085 26,870 ND
656 2,435 119,140 2,510 1992 260 2,595 138,600 ND
329 ND 631,140 398
1993 1,061 8,740 18,650 1,395
900 445 13,570 1,397 1995 377 16,158 4,020 930
622 1,370 18,300 690 h
1996 439 10,790 226,750 ND
106 270 c 125,500 917 1997 1,946 3,105 16,890 ND
1,605 9,045 17,870 ND
1998 894 10,180 1,124,800 ND
591 50 153,150 233 1999 No survey occurred.
18 1,480 3,790 533
2001 77 863 ND ND
367 330 ND ND 2002 42 180 182,000 ND
122 217 4,590 800
2003 50 1,352 60 292
131 222 11,010 ND 2004 321 1,117 391,000 779
189 283 264,000 1,386
2005 78 1,336 48,203 ND
156 310 381,150 1,963 2007 823 7,045 32,250 4,552
554 295 50,100 2,349
2008 ND ND ND 4,197
ND ND ND 2,774 2009 627 3,161 12,695 ND
438 3,263 189,939 2,830
2010 122 16,097 16,520 50
124 1,627 1,480 200 2011 141 b 14,127 b 3,875 b 1,606
433 9,785 20,920 898
2012 ND ND ND 2,889 b
No survey occurred. 2013 2 4,532 700 ND 339 2,425 5,025 867
Note: Years for which there are no survey or weir count data are excluded. a Represents “high count” for season. b Helicopter survey. c Numerous pink salmon made enumerating of chum salmon difficult; pink count may include some chum. d Total counts obtained from counting tower. e Aerial survey, not tower count. f Includes counts from Casadepaga and Ophir Creeks. g Includes counts from Ophir Creek. h Poor survey conditions or partial survey, poor counting tower conditions.
101

Appendix A18.–Combined aerial survey numbers of chum, pink, coho, and Chinook salmon for Norton Sound, 1990–2013.
Yeara Chum Pink Coho Chinook 1990 29,510 796,461 1,594 1,540
1991 69,575 319,459 6,512 2,246 1992 30,597 5,030,222 3,010 1,146 1993 68,980 108,316 6,636 2,869 1994 80,492 5,675,143 4,214 796 1995 118,577 43,393 8,680 1,637 1996 81,364 2,283,129 5,789 1,353 1997 85,026 46,571 3,447 5,260 1998 73,407 3,661,033 2,344 2,186 1999 14,801 4,949 3,439 135 2000 17,748 785,881 7,551 146 2001 39,746 14,978 14,053 751 2002 42,216 386,584 12,116 950 2003 22,880 49,288 6,864 1,240 2004 15,073 6,554,164 19,741 1,300 2005 36,364 1,674,571 21,029 632 2006 59,383 2,468,940 29,398 195 2007 54,522 147,081 18,512 1,645 2008 13,824 3,574,413 23,749 237 2009 17,436 254,132 14,179 1,523 2010 143,275 1,044,784 13,879 410 2011 87,341 87,563 8,391 633 2012 17,138 899,802 4,594 54 2013 100,888 51,689 8,140 462
a Rivers surveyed were the Sinuk, Nome, Flambeau, Eldorado, Fish, Niukluk, Kwiniuk, Tubutulik, North, and Boston Creek. Not all rivers were surveyed for all the years. Kwiniuk numbers are from tower counts.
102

Appendix A19.–Total escapement for chum, pink, coho, and Chinook salmon from weir and tower projects at Kwiniuk, Niukluk, Nome, and Snake rivers (starting 1995), North River (starting 1996), and Eldorado River (starting 1997).
Year Chum Pink Coho a Chinook 1995 138,318 49,409 7,333 626
1996 b 124,571 2,535,593 16,175 2,027 1997 109,961 163,728 11,434 5,550 1998 98,166 3,070,848 4,496 2,741 1999 55,352 73,077 10,069 1,846 2000 65,007 1,883,867 19,678 1,324 2001 70,451 79,706 30,645 1,718 2002 93,931 2,239,565 21,625 2,925 2003 49,749 392,827 13,761 2,466 2004 40,494 6,432,486 28,399 2,022 2005 68,585 2,594,334 44,351 1,530 2006 126,045 5,763,830 56,484 1,256 2007 123,394 708,669 37,112 2,324 2008 41,660 3,930,689 49,737 1,250 2009 41,800 275,835 39,236 3,050 2010 191,571 1,490,227 31,058 1,481 2011 99,261 191,243 11,494 955
2012 c 50,916 994,745 6,003 1,078 2013 d 49,836 72,495 16,616 605
a Most projects did not operate during the coho season until 2001. b In 1996 the majority of pink salmon for Nome River escaped through the pickets and were not counted c Most projects were only operational for a short duration during coho season because of high water. d Starting in 2013, there was no longer a counting tower at Niukluk.
103

Appendix A20.–Total escapement (6 rivers) and catch (commercial, subsistence, and sport fish) for chum, pink, coho, and Chinook salmon for Norton Sound District, 1995–2013.
Year a, b Chum Pink Coho Chinook 1995 213,371 169,496 76,768 15,291
1996 c 156,128 3,089,682 112,710 12,617 1997 d 161,248 189,439 60,033 25,989 1998 d 129,669 3,712,761 52,489 17,105
1999 76,493 95,302 40,546 9,315 2000 85,243 2,091,074 84,983 6,655 2001 97,223 109,878 66,232 6,926 2002 108,444 2,300,537 39,368 8,524 2003 63,099 441,387 45,306 7,445 2004 51,829 6,513,682 87,800 7,027 2005 78,719 2,652,592 146,616 5,280 2006 142,373 5,825,726 217,986 4,961 2007 157,932 734,723 181,306 5,137 2008 75,834 4,067,996 198,406 4,378 2009 85,285 320,632 147,839 6,793 2010 325,633 1,566,755 110,876 3,802 2011 224,511 216,116 82,531 2,560 2012 126,296 1,247,014 57,731 2,510 2013 186,316 100,684 91,357 1,617
a Kwiniuk, Niukluk, Nome, and Snake rivers (starting 1995), North River (starting 1996), Eldorado River (starting 1997). b Not all subdistricts from 2004 to 2007 were surveyed for subsistence use. c In 1996, the majority of pink salmon for Nome River escaped through the pickets and were not counted. d Subsistence totals for 1997 and 1998 include data from Savoonga and Gambell.
104

Appendix A21.–Nome Subdistrict chum salmon estimated escapement, 1999–2013.
Aerial Survey Estimated Aerial Survey Estimated Year Rivers Counts Escapement a Year Rivers Counts Escapement a 1999 Nome
1,048
2000 Nome 658 4,056
Snakeb
484
Snakeb
1,911
Eldoradob
4,218
Eldoradob 3,383 11,617
Flambeau 51 637
Flambeau 819 3,947
Solomon 51 637
Solomon 150 1,294
Sinuk 1,697 6,370
Sinukc
7,198
Bonanza 361 2,304
Bonanza 1,130 4,876
15,698
34,898
2001 Nome 946 2,859
2002 Nome
1,720
Snakeb 752 2,182
Snakeb 402 2,776
Eldoradob 4,450 11,635
Eldoradob
10,215
Flambeau 3,612 10,465
Flambeau 1,876 6,804
Solomon 280 1,949
Solomon 325 2,150
Sinuk 3,746 10,718
Sinuk 1,682 6,333
Bonanza 1,084 4,745
Bonanza 595 3,199
44,553
33,197
2003 Nome 888 1,957
2004 Nome
3,903
Snake 440 2,201
Snake
2,146
Eldorado 1,257 3,591
Eldorado
3,277
Flambeau 647 3,380
Flambeau 2,250 7,667
Solomon 73 806
Solomonc
1,436
Sinuk 677 3,482
Sinukc
3,197
Bonanza 220 1,664
Bonanzac
2,166
17,081
23,792
2005 Nome 2,082 5,584
2006 Nome 394 5,677
Snake 1,842 2,967
Snake 840 4,160
Eldorado 5,445 10,369
Eldorado 2,355 42,105
Flambeau 2,261 7,692
Flambeau 16,000 27,828
Solomon 775 3,806
Solomon 305 2,062
Sinuk 1,072 4,710
Sinuk 1,115 4,834
Bonanza 1,370 5,534
Bonanza 60 708
40,662
87,374
2007 Nome 1,449 7,034
2008 Nome 106 2,607
Snake 1,702 8,147
Snake
1,244
Eldorado 6,315 21,312
Eldorado
6,746
Flambeau 4,452 12,006
Flambeau 4,235 11,618
Solomon 673 3,469
Solomonc
959
Sinuk 7,210 16,481
Sinukc
5,367
Bonanza 2,628 8,491
Bonanzac
3,636
76,940 32,177 -continued-
105

Appendix A21.–Page 2 of 2.
Aerial Survey Estimated Aerial Survey Estimated Year Rivers Counts Escapement a Year Rivers Counts Escapement a 2009 Nome 1,565 2010 Nome 2,998 5,906
Snake
891
Snake 2,625 6,973
Eldorado 1,069 4,943
Eldoradod 30,600 42,612
Flambeau 860 4,075
Flambeau 13,600 25,009
Solomon 89 918
Solomon 454 2,678
Sinuk 344 2,232
Sinuk 3,955 11,107
Bonanza 1,851 6,744
Bonanza 686 3,513
21,368
97,798
2011 Nome
3,582
2012 Nome
2,015
Snake
4,343
Snake
1,235
Eldorado
16,227
Eldorado
13,393
Flambeau 6,283 15,056
Flambeau 7,911 17,517
Solomon 1,010 4,529
Solomon 165 1,377
Sinuk 6,265 15,028
Sinuk 3,650 10,537
Bonanza 2,113 7,357
Bonanza 1,550 6,002
66,122
52,076
2013 Nome
4,811
Snake
2,755
Eldorado
26,121
Flambeau 16,088 27,928
Solomon
1,377
Sinuk 19,500 31,691
Bonanza 5,284 13,437 108,120
a Escapement is estimated by adding Nome, Snake, and Eldorado weir counts and the aerial survey expansion estimates of the other 4 rivers. Aerial survey expansion is calculated as aerial survey count to 0.657142 power multiplied by 48.059 (Clark, 2001), unless otherwise footnoted.
b Escapement was estimated by counting tower. c Because of the lack of aerial survey estimates, method used (from Clark, 2001) was Solomon = 0.368 multiplied by Nome
escapement, Sinuk = 1.476 multiplied by Bonanza escapement, and Bonanza = 0.198 multiplied by Eldorado and Flambeau escapements combined.
d Weir was breached and aerial survey expansion count was used.
106

Appendix A22.–Historical escapement of salmon and Dolly Varden at Eldorado River counting tower, 1997–2002 and weir, 2003–2013.
Operating Dolly Year Period Chinook Chum Pink Coho Sockeye Varden 1997 June 29–Aug 19 98 14,302 1,022 194 n/a n/a 1998 June 29–Aug 12 8 13,808 137,283 21 n/a n/a 1999 July 10–Sept 01 28 4,218 977 510 n/a n/a 2000 June 29–Aug 25 33 11,617 55,992 192 n/a n/a 2001 July 08–Sept 13 50 11,635 488 1,509 n/a n/a 2002 June 24–Sept 10 26 10,215 119,098 540 10 377 2003 June 21–Sept 08 29 3,591 173 115 0 60 2004 June 22–Sept 09 25 3,277 60,866 1,151 57 0 2005 June 23–Sept 02 32 10,369 12,356 689 10 23 2006 June 26–Aug 03 41 42,105 222,348 55 1 65 2007 June 26–Aug 06 14 21,312 833 2 22 60 2008 June 27–July 31 36 6,746 244,641 38 3 14 2009 July 02–Aug 03 31 4,943 1,119 2 0 72
2010 a June 30–July 24 23 42,612 48,136 2 8 72 2011 June 30–Aug 03 3 16,227 489 1 0 2 2012 July 04–Aug 15 0 13,393 59,952 1 0 30 2013 July 01–Aug 06 9 26,121 1,025 15 0 2
a Numerous breaches in weir during the season resulted in minimal counts, except for chum salmon count that was determined by aerial survey expansion from the aerial survey count.
107

Appendix A23.–Historical escapement of salmon and Dolly Varden at Snake River counting tower 1995–2002 and weir 2003–2013.
Operating Dolly Year Period Chinook Chum Pink Coho Sockeye Varden 1995 July 01–Aug 18 0 4,393 917 856 0 NA 1996 July 03–Aug 22 5 2,772 44,558 1,638 0 NA 1997 July 07 –Aug 18 12 6,184 6,742 1,157 0 NA 1998 July 01–Aug 11 0 11,067 219,679 178 0 NA 1999 July 01–Aug 14 20 484 116 90 0 NA 2000 June 29–Aug 25 28 1,911 4,723 406 0 NA 2001 July 08–Sept 05 33 2,182 1,295 1,335 0 NA 2002 June 28–Sept 16 9 2,776 4,103 851 a 8 149 2003 June 26–Sept 11 50 2,201 2,856 489 84 111 2004 June 23–Sept 03 17 2,146 126,917 474 22 290 2005 June 27–Sept 11 31 2,967 13,813 2,948 275 28 2006 July 01–Sept 11 32 4,160 74,028 4,776 302 614 2007 July 01–Sept 14 61 8,147 4,634 1,781 1,354 121 2008 July 06–Sept 06 13 1,244 145,761 5,206 143 452 2009 July 08–Aug 30 b 6 891 769 50 2 14 2010 July 03–Sept 11 43 6,973 51,099 2,243 124 198 2011 July 08–Sept 11 1 4,343 7,011 343 14 5 2012 July 06–Aug 15 c 1 1,235 5,954 14 3 3 2013 July 19–Sept 10 8 2,755 1,333 1,203 163 1
a Includes 442 coho salmon estimated by aerial survey to be holding below the weir site after the weir was removed. b Weir was not fish tight last week of August and hundreds of coho salmon passed through the weir without being counted. c Weir was knocked out for 13 days in late July and early August. An interpolation was made for chum salmon.
108

Appendix A24.–Historical salmon escapement at Kwiniuk River counting tower, 1990–2013.
Year Operating Period Chum Pink Chinook Coho 1990 June 21–July 25 13,957 416,512 900 0 1991 June 18–July 27 19,801 53,499 708 0 1992 June 27–July 28 12,077 1,464,716 479 0 1993 June 27–July 27 15,824 43,063 600 0 1994 June 23–Aug 09 33,012 2,303,114 625 2,547 1995 June 21–July 26 42,500 17,511 498 114 1996 June 20–July 25 28,493 907,893 577 461 1997 June 18–July 27 20,119 9,535 974 0 1998 June 18–July 27 24,247 655,934 303 0 1999 June 25–July 28 8,763 607 116 0 2000 June 22–July 27 12,879 750,173 144 41 2001 June 27–Sept 15 16,598 8,423 261 9,532 2002 June 17–Sept 11 37,995 1,114,410 778 6,459 2003 June 15–Sept 15 12,123 22,329 744 5,490 2004 June 16–Sept 14 10,362 3,054,684 663 11,240 2005 June 17–Sept 13 12,083 341,048 342 12,950 2006 June 22–Sept 12 39,519 1,347,090 195 22,341 2007 June 21–Sept 10 27,756 54,255 258 9,429 2008 June 23–Sept 07 9,483 1,444,213 237 10,461 2009 June 24–Sept 13 8,739 42,962 444 8,677 2010 June 25–Sept 7 71,388 634,220 135 8,049 2011 June 20–Sept 11 31,604 30,023 57 3,288 2012 June 23–Aug 16 5,577 393,302 54 777 2013 June 24–Sept 16 5,631 13,212 15 3,940
109

Appendix A25.–Historical salmon escapement at Niukluk River counting tower, 1995–2012.
Year Operating Period Chum Pink Chinook Coho 1995 June 29–Sept 12 86,332 17,088 123 4,713
1996 June 23–Sept 12 80,178 1,154,922 243 12,781 1997 June 28–Sept 09 57,305 10,468 259 3,994 1998 July 04–Aug 13 45,588 1,624,438 260 840 1999 July 04–Sept 04 35,239 20,351 40 4,260 2000 July 04–Aug 27 29,573 961,603 48 11,382 2001 July 10–Sept 08 30,662 41,625 30 3,468 2002 June 25–Sept 10 35,307 645,141 621 7,391 2003 June 25–Sept 10 20,018 75,855 179 1,282 2004 June 25–Sept 08 10,770 975,895 141 2,064 2005 June 28–Sept 09 25,598 270,424 41 2,727 2006 June 26–Sept 08 29,199 1,371,919 39 11,169 2007 July 01–Sept 04 50,994 43,617 30 3,498 2008 July 01–Sept 06 12,078 669,234 33 13,779 2009 July 03–Sept 02 15,879 24,204 204 6,861 2010 July 01–Sept 01 48,561 434,205 15 9,042
2011 June 28–Sept 06 23,607 15,425 18 2,405 2012 July 04–Aug 17 19,576 249,212 21 1,729
Note: The Niukluk River counting tower project was discontinued after 2012.
Appendix A26.–Historical salmon escapement at Nome River counting tower, 1993–1995, and weir, 1996–2013.
Year Operating Period Chum Pink Chinook Coho Sockeye 1993 July 25–Aug 28 1,859 13,036 63 4,349
1994 June 24–Aug 15 2,893 142,604 54 726 1995 June 22–Sept 06 5,093 13,893 5 1,650 1996 June 26–July 23 3,339 95,681 a 5 66 1997 June 27–Aug 27 5,147 8,035 22 321 1998 July 01–Aug 11 1,930 359,469 70 96 1999 July 02–Aug 25 1,048 2,033 3 417 6
2000 June 29–Aug 25 4,056 41,673 25 698 19 2001 July 08–Sept 11 2,859 3,138 7 2,418 55 2002 June 29–Sept 11 1,720 35,057 7 3,418 29 2003 July 05–Sept 10 1,957 11,402 12 548 47 2004 June 25–Sept 12 3,903 1,051,146 51 2,283 114 2005 June 27–Sept 11 5,584 285,759 69 5,848 381 2006 July 02–Sept 07 5,677 578,555 43 8,308 188 2007 July 03–Sept 16 7,034 24,395 13 2,437 534 2008 July 02–Sept 17 2,607 1,186,554 28 4,605 90 2009 July 01–Sept 20 1,565 16,490 10 1,370 103 2010 June 30–Sept 16 5,906 171,760 9 4,114 43 2011 July 01–Sept 12 3,582 14,403 12 1,833 22 2012 July 04–Aug 15 2,015 149,119 6 224 48 2013 July 05–Sept 16 4,811 10,257 9 2,624 38
a In 1996 the majority of pink salmon escaped through the pickets and was not counted.
110

Appendix A27.–Salmon escapement at Solomon River weir, 2013.
Year Operating Period Chum Pink Chinook Coho Sockeye 2013 July 05–Aug 26 1,377 2,733 0 178 3
Note: The Solomon River weir was initiated in 2013.
Appendix A28.–Historical sockeye salmon escapement at Glacial Lake weir, 2000–2013.
Year Operating Period Chum a Pink b Sockeye 2000 July 11–July 30
884
2001 July 02–July 28 1
2,487 2002 June 25–July 26
1,047
2003 June 24–July 28
2,004 2004 June 18–July 25 1
8,115
2005 June 20–July 25
11,135 2006 July 04–July 18
6,849
2007 July 05–July 20
4,533 2008 June 27–July 28 10 614 1,794 2009 June 20–July 27
826
2010 June 26–July 28
1,047 2011 June 28–July 26 4
1,697
2012 c July 01–Aug 09 25 165 1,636 2013 d June 20–Aug 12 35 2 2,544
a Chum salmon will pass upstream through the Glacial Lake weir and often exit the lake back downstream through the weir. b Pink salmon have been observed often in even-numbered years, but 2008 was the first year the crew was instructed to
enumerate pink salmon passage. c A video project was tested during 2012 and was in operation 11 days (July 31 to August 9) after human occupation of the weir
site. Included in totals are 34 sockeye, 12 pink, and 10 chum salmon that were counted by camera during that time. d A video project was in operation from July 14 to August 12.
111

Appendix A29.–Historical salmon escapement at Inglutalik River counting tower, 2011–2013.
Year Operating Period Chum Pink Chinook Coho 2011 June 24–Aug 14 64,892 494,099 1,467 870 2012 June 23–Aug 23 32,832 90,349 1,134 1,431 2013 June 21–Aug 11 61,259 268,537 860 5,904
Note: Due to speciation problems in 2013, the Chinook and coho counts are probably inaccurate.
Appendix A30.–Historical salmon escapement at North River counting tower, 1996–2013.
Year Operating Period Chum Pink Chinook Coho 1996 June 16–July 25 9,789 332,539 1,197 1,229 1997 June 16–Aug 21 6,904 127,926 4,185 5,768 1998 June 15–Aug 12 1,526 74,045 2,100 3,361 1999 June 30–Aug 31 5,600 48,993 1,639 4,792 2000 June 17–Aug 12 4,971 69,703 1,046 6,959 2001 July 05–Sept 15 6,515 24,737 1,337 12,383 2002 June 19–Aug 29 5,918 321,756 1,484 2,966 2003 June 15–Sept 13 9,859 280,212 1,452 5,837 2004 June 15–Sept 14 10,036 1,162,978 1,125 11,187 2005 June 15–Sept 15 11,984 1,670,934 1,015 19,189 2006 June 18–Sept 11 5,385 2,169,890 906 9,835 2007 June 16–Sept 05 8,151 580,935 1,948 19,965 2008 June 19–Sept 13 9,502 240,286 903 15,648 2009 June 19–Sept 11 9,783 190,291 2,355 22,276 2010 June 19–Sept 07 16,131 150,807 1,256 7,608 2011 June 17–Sept 08 19,898 123,892 864 3,624 2012 June 21–Aug 19 9,120 137,006 996 3,258 2013 July 01–Aug 05 10,518 46,668 564 8,834
Appendix A31.–Historical salmon escapement at Unalakleet River weir, 2010–2013.
Year Operating Period Chum Pink Chinook Coho Sockeye 2010 June 22–July 31 70,811 832,904 1,021 5,382 130 2011 June 17–Aug 07 108,770 363,906 1,111 10,418 190 2012 June 24–Aug 15 70,669 672,083 807 17,766 245 2013 June 20–Aug 22 113,953 144,225 767 25,566 243
112

Appendix A32.–Chum salmon escapement by river, Nome Subdistrict, 1993–2013.
Rivers West of Cape Nome Rivers East of Cape Nome Year Sinuk a Snake b Nome c Flambeau a Eldorado d Bonanza a Solomon a Total e 1993 6,052 2,115 5,925
6,103 9,048 3,007 2,525 34,775
1994 4,905 3,519 2,893
12,889 13,202 5,178 1,066 43,652 1995 9,464 4,395 5,093
16,474 18,955 11,182 2,106 67,669
1996 6,658 2,772 3,339
13,613 32,970 7,049 2,141 68,542 1997 9,212 6,184 5,147
9,455 14,302 4,140 2,111 50,551
1998 6,720 11,067 1,930
9,129 13,808 4,552 925 48,131 1999 6,370 484 1,048
637 4,218 2,304 637 15,698
2000 7,198 1,911 4,056
3,947 11,617 4,876 1,294 34,899 2001 10,718 2,182 2,859
10,465 11,635 4,745 1,949 44,553
2002 6,333 2,776 1,720
6,804 10,243 3,199 2,150 33,225 2003 3,482 2,201 1,957
3,380 3,591 1,664 806 17,081
2004 3,197 2,145 3,903
7,667 3,273 2,166 1,436 23,787 2005 4,710 2,948 5,584
7,692 10,426 5,534 1,914 38,808
2006 4,834 4,128 5,677
27,828 41,985 708 2,062 87,222 2007 16,481 8,147 7,034
12,006 21,312 8,491 3,469 76,940
2008 5,367 1,244 2,607
11,618 6,746 3,636 959 32,177 2009 2,232 891 1,565
4,075 4,943 6,744 918 21,368
2010 11,107 6,973 5,906
25,009 42,612 3,513 2,678 97,798 2011 15,028 4,343 3,582
15,056 16,227 7,357 4,529 66,122
2012 10,537 1,235 2,015
17,517 13,393 6,002 1,377 52,076 2013 31,691 2,755 4,811 27,928 26,121 13,437 1,377 108,120 Total 182,296 74,415 78,651 249,292 330,627 109,484 38,429 1,063,194
a Sinuk, Flambeau, Bonanza, and Solomon rivers’ escapements are estimated by aerial survey, but in 2013, Solomon River escapement was a weir count.
b Snake River escapements are estimated by aerial survey (1993–1994), tower counts (1995–2002), and weir counts (2003–2012). Escapement goal range is 1,600–2,500 chum salmon.
c Nome River escapements are estimated by aerial survey expansion (1993), tower counts (1994–1995), and weir counts (1996–2012). Escapement goal range is 2,900–4,300 chum salmon.
d Eldorado River escapements are estimated by aerial survey (1993–1996), tower counts (1997–2002), and weir counts (2003–2012). Escapement goal range is 6,000–9,200 chum salmon.
e Subdistrict 1 BEG is 23,000–35,000 chum salmon.
113

Appendix A33.–Pink salmon escapement by year and river, Nome Subdistrict, 1993–2013.
Rivers West of Cape Nome Rivers East of Cape Nome
Year Sinuk a Snake b Nome c Flambeau a Eldorado d Bonanza a Solomon a Total
1993 5,120
13,036
5,584 120 ND ND 23,860 1994 492,100 63,860 142,604
19,202 53,890 20 ND 771,676
1995 1,250 917 13,893
8,086 4,243 619 350 29,358 1996 74,400 44,558 95,681
17,182 46,100 40,510 15,230 333,661
1997 1,200 6,742 8,035
2,117 1,022 ND 80 19,196 1998 342,100 219,679 359,469
8,720 137,283 167,130 45,175 1,279,556
1999 180 116 2,033
1,251 977 245 90 4,892 2000 12,175 4,723 41,673
2,159 55,992 12,410 2,899 132,031
2001 115 1,295 3,138
924 488 221 ND 6,181 2002 28,487 4,103 35,057
2,233 119,098 17,095 9,170 215,243
2003 9,907 2,856 11,402
194 173 1,540 157 26,229 2004 1,267,100 126,917 1,051,146
7,351 60,866 185,000 109,000 2,807,380
2005 211,285 13,813 285,759
873 12,356 55,000 11,100 590,186 2006 515,000 74,028 578,555
6,556 222,348 268,500 165,215 1,830,202
2007 6,810 4,634 24,395
336 833 1,360 2,400 40,768 2008 1,496,000 145,761 1,186,554
3,510 244,641 212,000 81,000 3,369,466
2009 6,740 769 16,490
175 1,119 3,276 1,565 30,134 2010 168,600 51,099 171,760
4,797 48,136 106,000 21,804 572,196
2011 21,100 7,011 14,403
58 489 11,050 5,580 59,691 2012 506,500 5,954 149,119
2,657 59,318 54,700 15,000 793,248
2013 143,921 1,333 10,257 ND 1,025 800 2,733 160,069 Total 5,310,090 780,168 4,214,459 93,965 1,070,517 1,137,476 488,548 13,095,223
a Sinuk, Flambeau, Bonanza, and Solomon rivers’ escapements are estimated by aerial survey, but in 2013, Solomon River escapement was a weir count.
b Snake River escapements are estimated by aerial survey (1993–1994), tower counts (1995–2002), and weir counts (2003–2013).
c Nome River escapements are estimated by tower counts (1993–1995) and weir counts (1996–2013). Escapement goal range is 13,000 pink salmon in even-numbered years and 3,200 pink salmon in odd-numbered years.
d Eldorado River escapements are estimated by aerial survey (1993–1996), tower counts (1997–2002), and weir counts (2003–2013).
114
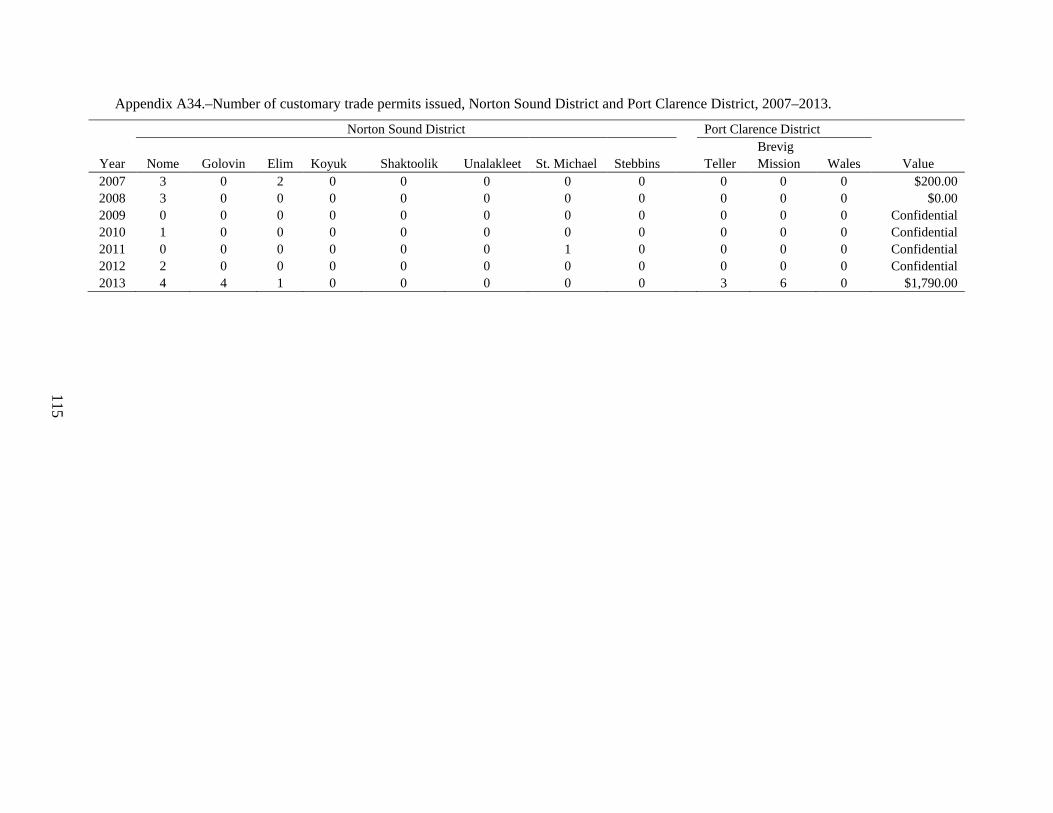
Appendix A34.–Number of customary trade permits issued, Norton Sound District and Port Clarence District, 2007–2013.
Norton Sound District Port Clarence District
Brevig Year Nome Golovin Elim Koyuk Shaktoolik Unalakleet St. Michael Stebbins Teller Mission Wales Value 2007 3 0 2 0 0 0 0 0 0 0 0 $200.00 2008 3 0 0 0 0 0 0 0 0 0 0 $0.00 2009 0 0 0 0 0 0 0 0 0 0 0 Confidential 2010 1 0 0 0 0 0 0 0 0 0 0 Confidential 2011 0 0 0 0 0 0 1 0 0 0 0 Confidential 2012 2 0 0 0 0 0 0 0 0 0 0 Confidential 2013 4 4 1 0 0 0 0 0 3 6 0 $1,790.00
115

116
APPENDIX B: PORT CLARENCE FISHERIES
117

Appendix B1.–Comparative sockeye salmon aerial survey indices, Port Clarence District, 1990–2013.
Salmon Grand Central Year Lake River Total 1990 2,834 926 3,760
1991 3,790 1,570 5,360 1992 1,500 a 1,500 1993 2,885 216 3,092 1994 3,740 1,230 4,970 1995 5,433 628 b 6,061 1996 6,610 770 7,380 1997 8,760 1,520 10,280 1998 5,210 1,977 7,187 1999 31,720 1,780 33,500 2000 12,772 a 12,772 2001 9,400 155 9,555 2002 3,520 71 3,591 2003 19,275 1,015 20,290 2004 23,005 2,855 25,860 2005 41,500 740 42,240 2006 39,400 2,380 41,780 2007 14,920 5,692 20,612 2008 9,420 2,252 11,672 2009 136 50 186 2010 73 711 784 2011 4,604 540 5,144 2012 4,730 1,100 5,830 2013 5,820 1,151 6,971
a No survey occurred. b Early count.
118

Appendix B2.–Historical escapement of salmon and Dolly Varden at Pilgrim River counting tower (1997–2002) and weir (2003–2013).
Operating Dolly Year Period Chinook Chum Pink Coho Sockeye Varden 1997 July 12–Aug 21 356 15,619 a 5,557 452
15,619 a NA
1998 Did not operate 1999 July 13–Aug 06 6 2,617 35,577 104
4,650 NA
2000 July 05–Aug 18 72 861 374 21
12,141 NA 2001 Did not operate
2002 July 04–Aug 04 150 5,590 3,882 246
3,888 NA 2003 June 21–Sept 14 1,016 15,200 14,100 677
42,729 550
2004 June 21–Sept 14 925 10,239 50,760 1,573 b
85,417 264 2005 June 24–Sept 05 216 9,685 13,218 304
55,951 112
2006 June 30–Sept 09 275 45,361 17,701 973
52,323 505 2007 June 29–Sept 10 501 35,334 3,616 605
43,432 339
2008 June 25–Sept 01 137 24,550 92,471 260
20,452 409 2009 June 26–Aug 31 52 5,427 483 18
953 130
2010 June 24–Sept 01 44 25,379 29,239 272
1,654 285 2011 June 28–Sept 01 44 41,740 3,364 269
8,449 229
2012 June 26–Aug 18 64 25,521 46,135 95
7,085 65 2013 June 27–Sept 08 47 47,557 1,060 890 12,428 27
a Chum and sockeye salmon escapements were combined due to species identification problems during 1997. b Coho salmon were misidentified. Nearly 30% of scale samples in 2004 were actually sockeye salmon.
119

Appendix B3.–Estimated number of subsistence fishing families and harvest in Port Clarence District, 1994–2013.
Number of
fishing families
Year interviewed Chinook Sockeye Coho Pink Chum Total 1994 a 127
203 2,220 1,892 4,309 2,294 10,918
1995 a 122
76 4,481 1,739 3,293 6,011 15,600 1996 a 117
194 2,634 1,258 2,236 4,707 11,029
1997 a 126
158 3,177 829 755 2,099 7,018 1998 a 138
289 1,696 1,759 7,815 2,621 14,180
1999 a 155
89 2,392 1,030 786 1,936 6,233 2000 a 134
72 2,851 935 1,387 1,275 6,520
2001 a 160
84 3,692 1,299 1,183 1,910 8,168 2002 a 159
133 3,732 2,194 3,394 2,699 12,152
2003 a,b 204
177 4,495 1,434 4,113 2,430 12,649 2004 c 376 d 278 8,688 1,131 5,918 2,505 18,520 2005 c 335 d 152 8,492 726 6,615 2,479 18,464 2006 c 345 d 102 9,940 1,061 4,939 4,353 20,395 2007 c 363 d 85 9,484 705 1,468 4,454 16,196 2008 c 408 d 125 5,069 512 7,527 2,449 15,682 2009 c 326 d 40 1,643 804 1,882 3,060 7,429 2010 c 290 d 63 824 596 5,202 5,232 11,917 2011 c 267 d 57 1,611 393 2,610 4,338 9,008 2012 c 335 d 44 1,422 703 5,200 7,802 15,171 2013 c 431 d 38 5,243 651 1,788 6,588 14,308
a Harvest estimate from ADF&G Division of Subsistence survey. b Includes harvest reported from 59 Pilgrim River permits. In total, 101 permits were issued and 79 were returned. c Beginning in 2004 a permit was required for Port Clarence District (including Pilgrim River and Salmon Lake) that replaced
household surveys. d The number is all permits issued for the Port Clarence District (including Pilgrim River and Salmon Lake permits).
120
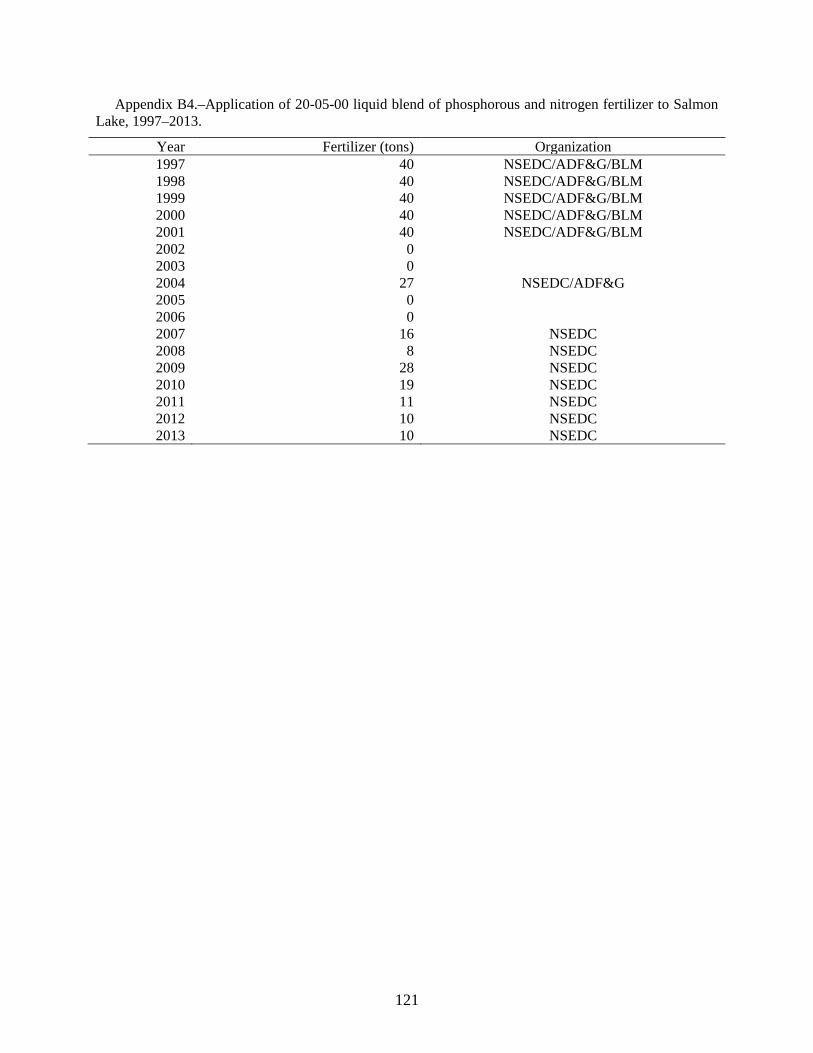
Appendix B4.–Application of 20-05-00 liquid blend of phosphorous and nitrogen fertilizer to Salmon Lake, 1997–2013.
Year Fertilizer (tons) Organization 1997 40 NSEDC/ADF&G/BLM 1998 40 NSEDC/ADF&G/BLM 1999 40 NSEDC/ADF&G/BLM 2000 40 NSEDC/ADF&G/BLM 2001 40 NSEDC/ADF&G/BLM 2002 0
2003 0 2004 27 NSEDC/ADF&G
2005 0 2006 0 2007 16 NSEDC
2008 8 NSEDC 2009 28 NSEDC 2010 19 NSEDC 2011 11 NSEDC 2012 10 NSEDC 2013 10 NSEDC
121

122

APPENDIX C: KOTZEBUE FISHERIES
123
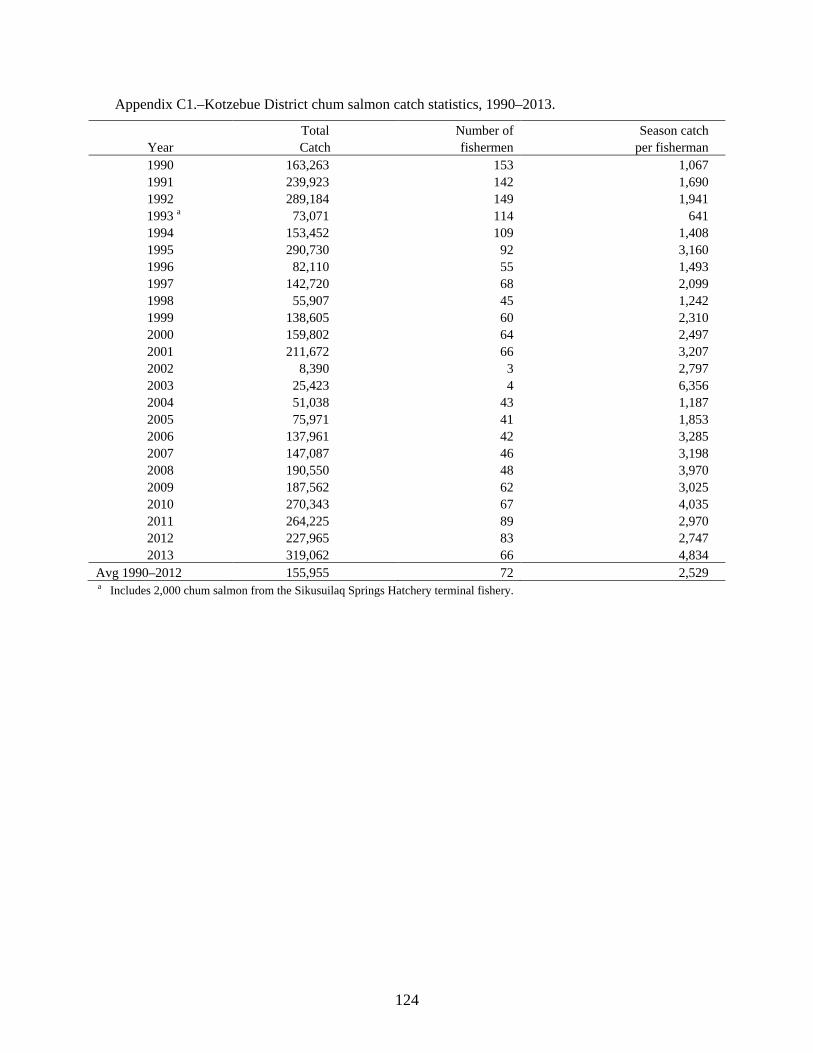
Appendix C1.–Kotzebue District chum salmon catch statistics, 1990–2013.
Total Number of Season catch Year Catch fishermen per fisherman 1990 163,263 153 1,067 1991 239,923 142 1,690 1992 289,184 149 1,941
1993 a 73,071 114 641 1994 153,452 109 1,408 1995 290,730 92 3,160 1996 82,110 55 1,493 1997 142,720 68 2,099 1998 55,907 45 1,242 1999 138,605 60 2,310 2000 159,802 64 2,497 2001 211,672 66 3,207 2002 8,390 3 2,797 2003 25,423 4 6,356 2004 51,038 43 1,187 2005 75,971 41 1,853 2006 137,961 42 3,285 2007 147,087 46 3,198 2008 190,550 48 3,970 2009 187,562 62 3,025 2010 270,343 67 4,035 2011 264,225 89 2,970 2012 227,965 83 2,747 2013 319,062 66 4,834
Avg 1990–2012 155,955 72 2,529 a Includes 2,000 chum salmon from the Sikusuilaq Springs Hatchery terminal fishery.
124

Appendix C2.–Kotzebue District chum salmon type of processing and weights, 1990–2013.
Fresh frozen
Chum salmon
salmon roe
Year (pounds) Other a (pounds) 1990 1,453,040 538
1991 1,951,041 714 1992 2,397,302 2,714 1993 b 613,968 1,507 1,000
1994 c 1,166,494 73 1995 2,329,898 93 1996 d 97,510 51 1997 1,141,741 649 1998 447,256 2,971 1999 1,108,898 87 2000 1,370,637 106 2001 1,847,361 64 2002 74,341 0 2003 218,091 0 2004 419,059 1,450 2005 621,573 1,258 2006 1,040,023 0 2007 1,209,842 0 2008 1,541,922 0 2009 1,505,734 0 2010 2,160,264 0 2011 2,158,365 0 2012 1,751,473 0 2013 2,555,304 0
Note: Data not available for all years. a Chinook and pink salmon, and Dolly Varden. b Includes 11,160 pounds from the Sikusuilaq Springs Hatchery terminal fishery. Pounds of roe stripped are from a verbal report. c Includes 31,500 pounds commercially caught but not reported on fish tickets. d Includes 17,600 pounds commercially caught but not sold on fish tickets.
125

Appendix C3.–Kotzebue District mean prices paid per pound in dollars to salmon fishermen by species, 1990–2013.
Chum salmon
Average Average Chinook
Dolly
Year weight price salmon Inconnu Varden 1990 8.9 0.31 2.00
0.25
1991 8.1 0.22 1.64 0.50 0.18 1992 8.3 0.22 1.89 0.58 0.10 1993 8.5 0.38 2.37 0.50 0.10 1994 7.8 0.20 1.14
0.17
1995 8.0 0.13 1.00 0.50 0.20 1996 8.0 0.09 1.00 0.44 0.25 1997 8.0 0.16 1.02
0.20
1998 a 8.0 0.15 1.00
0.20 1999 a 8.0 0.16 1.00
0.20
2000 8.6 0.18 1.00
0.20 2001 8.7 0.17 1.00
2002 8.9 0.10 0.00 2003 8.6 0.12 0.00
0.50 2004 8.2 0.15 0.72
0.26
2005 8.2 0.20 0.50
0.30 2006 7.5 0.22
2007 8.2 0.20 2008 8.1 0.25 2009 8.0 0.25 2010 8.0 0.40
2011 8.2 0.40 2012 7.7 0.32 2013 8.0 0.27
Note: Information is not available for some species in some years. a Each chum salmon was assumed to weigh 8 pounds, but no fish were weighed individually.
126

Appendix C4.–Kotzebue District commercial fishery dollar value estimates, 1990–2013.
Gross value of Number of Average value Year catch to fishermen a fishermen per fisherman 1990 $438,044 153 $2,863 1991 $437,948 142 $3,084 1992 $533,731 149 $3,582
1993 b $235,061 114 $2,062 1994 $233,512 109 $2,142 1995 $316,031 92 $3,435 1996 $56,310 55 $1,024 1997 $187,978 68 $2,764 1998 $70,587 45 $1,569 1999 $179,781 60 $2,996 2000 $246,786 64 $3,856 2001 $322,650 66 $4,889 2002 $7,572 3 $2,524 2003 $26,377 4 $6,594 2004 $64,420 43 $1,498 2005 $124,820 41 $3,044 2006 $229,086 42 $5,454 2007 $243,149 46 $5,286 2008 $385,270 48 $8,026 2009 $376,554 62 $6,073 2010 $860,125 67 $12,838 2011 $867,085 89 $9,743 2012 $567,664 83 $6,839 2013 $689,163 66 $10,442
Avg 1990–2012 $304,806 72 $4,443 a Values represent chum salmon value and incidental species such as char, whitefish, and other salmon. b Includes $3,648 from Sikusuilaq Springs Hatchery terminal fishery.
127
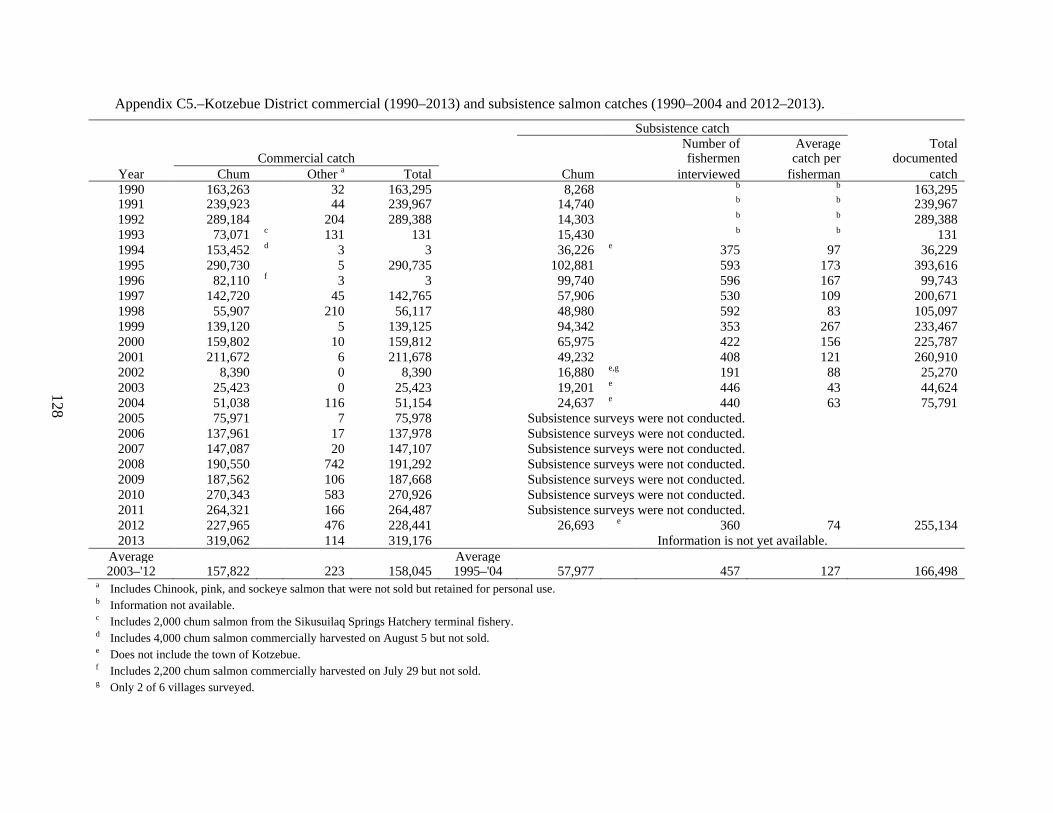
Appendix C5.–Kotzebue District commercial (1990–2013) and subsistence salmon catches (1990–2004 and 2012–2013).
Subsistence catch
Number of Average Total
Commercial catch
fishermen catch per documented
Year Chum Other a Total Chum interviewed fisherman catch 1990 163,263
32 163,295
8,268
b b 163,295
1991 239,923
44 239,967
14,740
b b 239,967 1992 289,184
204 289,388
14,303
b b 289,388
1993 73,071 c 131 131
15,430
b b 131 1994 153,452 d 3 3
36,226 e 375 97 36,229
1995 290,730
5 290,735
102,881
593 173 393,616 1996 82,110 f 3 3
99,740
596 167 99,743
1997 142,720
45 142,765
57,906
530 109 200,671 1998 55,907
210 56,117
48,980
592 83 105,097
1999 139,120
5 139,125
94,342
353 267 233,467 2000 159,802
10 159,812
65,975
422 156 225,787
2001 211,672
6 211,678
49,232
408 121 260,910 2002 8,390
0 8,390
16,880 e,g 191 88 25,270
2003 25,423
0 25,423
19,201 e 446 43 44,624 2004 51,038
116 51,154
24,637 e 440 63 75,791
2005 75,971
7 75,978
Subsistence surveys were not conducted. 2006 137,961
17 137,978
Subsistence surveys were not conducted.
2007 147,087
20 147,107
Subsistence surveys were not conducted. 2008 190,550
742 191,292
Subsistence surveys were not conducted.
2009 187,562
106 187,668
Subsistence surveys were not conducted. 2010 270,343
583 270,926
Subsistence surveys were not conducted.
2011 264,321
166 264,487
Subsistence surveys were not conducted. 2012 227,965
476 228,441
26,693 e 360 74 255,134
2013 319,062 114 319,176 Information is not yet available. Average
Average
2003–'12 157,822 223 158,045 1995–'04 57,977 457 127 166,498 a Includes Chinook, pink, and sockeye salmon that were not sold but retained for personal use. b Information not available. c Includes 2,000 chum salmon from the Sikusuilaq Springs Hatchery terminal fishery. d Includes 4,000 chum salmon commercially harvested on August 5 but not sold. e Does not include the town of Kotzebue. f Includes 2,200 chum salmon commercially harvested on July 29 but not sold. g Only 2 of 6 villages surveyed.
128

Appendix C6.–Kotzebue District subsistence chum salmon catches by village, 1990–2004 and 2012–2013.
Kobuk
Village River Noatak Village District
Year Noorvik Kiana Ambler Shungnak Kobuk Villages Village Kotzebue Deering Kivalina Buckland Shishmaref Total 1990 4,353 a a a a 4,353 3,915 a a a a a 8,268 1991 6,855 a a 4,248 a 11,103 3,637 a a a a a 14,740 1992 8,370 a a 3,890 a 12,260 2,043 a a a a a 14,303 1993 8,430 a a 3,730 a 12,160 3,270 a a a a a 15,430 1994 8,157 1,891 2,860 7,982 5,722 26,612 6,126 a 3,488 a a a 36,226 1995 15,485 5,985 8,558 5,880 2,959 38,867 6,359 50,708 a a a 6,947 102,881 1996 13,611 5,935 9,062 8,649 1,819 39,076 10,091 50,573 a a a a 99,740 1997 14,323 3,064 2,713 5,513 629 26,242 5,309 26,355 a a a a 57,906 1998 9,845 3,414 2,432 4,676 1,031 21,398 2,614 24,968 a a a a 48,980 1999 17,843 3,788 590 3,868 1,869 27,958 1,616 64,768 a a a a 94,342 2000 10,391 2,876 5,009 2,944 318 21,538 7,293 37,144 a a a a 65,975 2001 16,540 5,500 a 4,310 2,843 29,193 2,326 17,713 a a a a 49,232 2002 13,943 b b b b b 2,937 b a a a a 16,880 2003 7,982 3,010 1,719 2,860 1,453 17,024 2,177 a a a a a 19,201 2004 6,025 3,896 3,446 4,186 3,087 20,640 3,997 a a a a a 24,637
2012 9,584 2,442 1,621 2,595 2,637 18,879 7,814 a a a a a 2013 Information is not yet available. a a a a a
Note: No subsistence surveys were conducted from 2005 to 2011. Kotzebue area villages were surveyed by the Division of Subsistence in 2012 and 2013, but data are not yet available for 2013.
a Not surveyed. b The Kotzebue Sound communities of Ambler, Kiana, Kobuk, Kotzebue, and Shungnak, although normally included, were not surveyed in 2002 (Georgette et al. 2003).
129

Appendix C7.–Kotzebue District average subsistence chum salmon harvest per household by village, 1990–2004 and 2012–2013.
Year Kotzebue Noatak Noorvik Kiana Ambler Shungnak Kobuk Deering 1990 a 135 198 a a a a a 1991 a 145 311 a a 283 a a 1992 a 89 310 a a 243 a a 1993 a 136 312 a a 196 a a 1994 a 90 133 32 99 154 260 92 1995 71 69 123 59 110 111 110 a 1996 73 115 117 58 111 154 76 a 1997 41 71 125 35 39 117 28 a 1998 35 27 79 34 30 84 41 a 1999 78 18 151 42 8 76 81 a 2000 48 72 93 33 72 64 11 a 2001 23 24 152 62 a 94 109 a 2002 a 29 121 a a a a a 2003 a 21 58 32 26 57 43 a 2004 a 50 56 46 56 75 111 a
- - - - - - - - - 2012 a 94 115 38 31 56 88 a 2013 a Information is not yet available. a
Note: No subsistence surveys were conducted from 2005 to 2011. a Not surveyed.
130
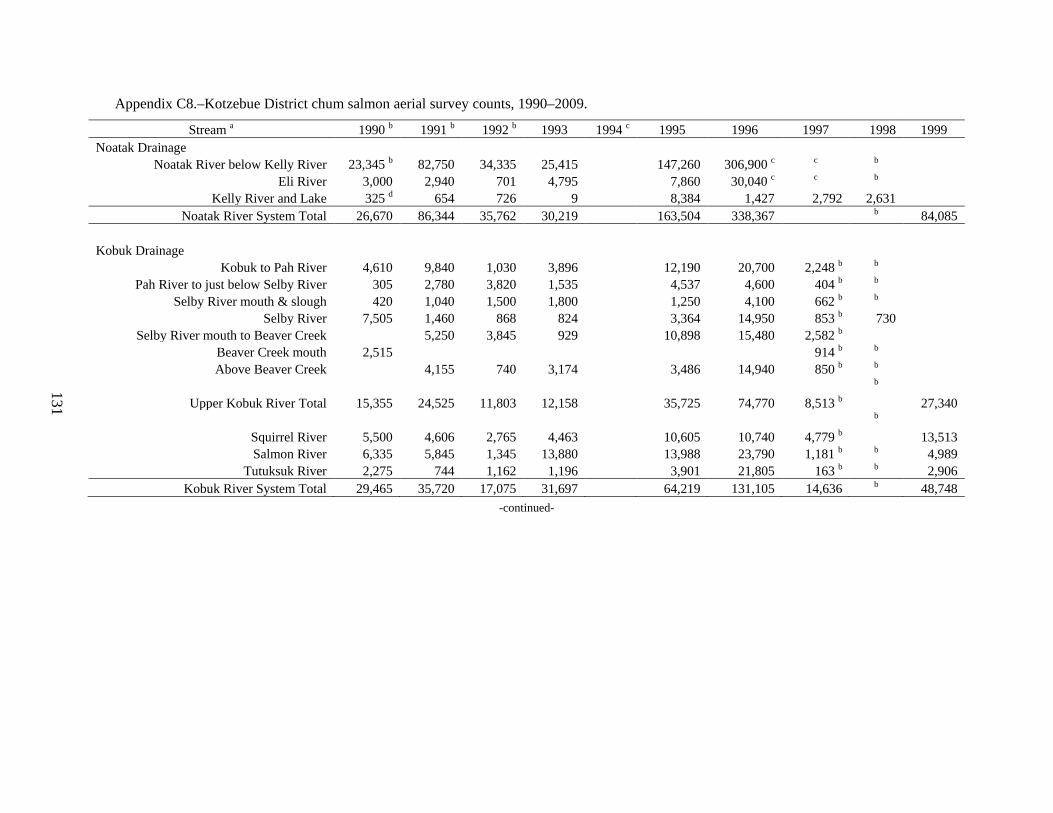
Appendix C8.–Kotzebue District chum salmon aerial survey counts, 1990–2009.
Stream a 1990 b 1991 b 1992 b 1993 1994 c 1995 1996 1997 1998 1999 Noatak Drainage
Noatak River below Kelly River 23,345 b 82,750 34,335 25,415
147,260 306,900 c c b Eli River 3,000 2,940 701 4,795
7,860 30,040 c c b
Kelly River and Lake 325 d 654 726 9
8,384 1,427 2,792 2,631 Noatak River System Total 26,670 86,344 35,762 30,219 163,504 338,367 b 84,085
Kobuk Drainage Kobuk to Pah River 4,610 9,840 1,030 3,896
12,190 20,700 2,248 b b
Pah River to just below Selby River 305 2,780 3,820 1,535
4,537 4,600 404 b b Selby River mouth & slough 420 1,040 1,500 1,800
1,250 4,100 662 b b
Selby River 7,505 1,460 868 824
3,364 14,950 853 b 730 Selby River mouth to Beaver Creek
5,250 3,845 929
10,898 15,480 2,582 b
Beaver Creek mouth 2,515
914 b b Above Beaver Creek
4,155 740 3,174
3,486 14,940 850 b b
b Upper Kobuk River Total 15,355 24,525 11,803 12,158
35,725 74,770 8,513 b
27,340
b
Squirrel River 5,500 4,606 2,765 4,463
10,605 10,740 4,779 b
13,513 Salmon River 6,335 5,845 1,345 13,880
13,988 23,790 1,181 b b 4,989
Tutuksuk River 2,275 744 1,162 1,196
3,901 21,805 163 b b 2,906 Kobuk River System Total 29,465 35,720 17,075 31,697 64,219 131,105 14,636 b 48,748
-continued-
131
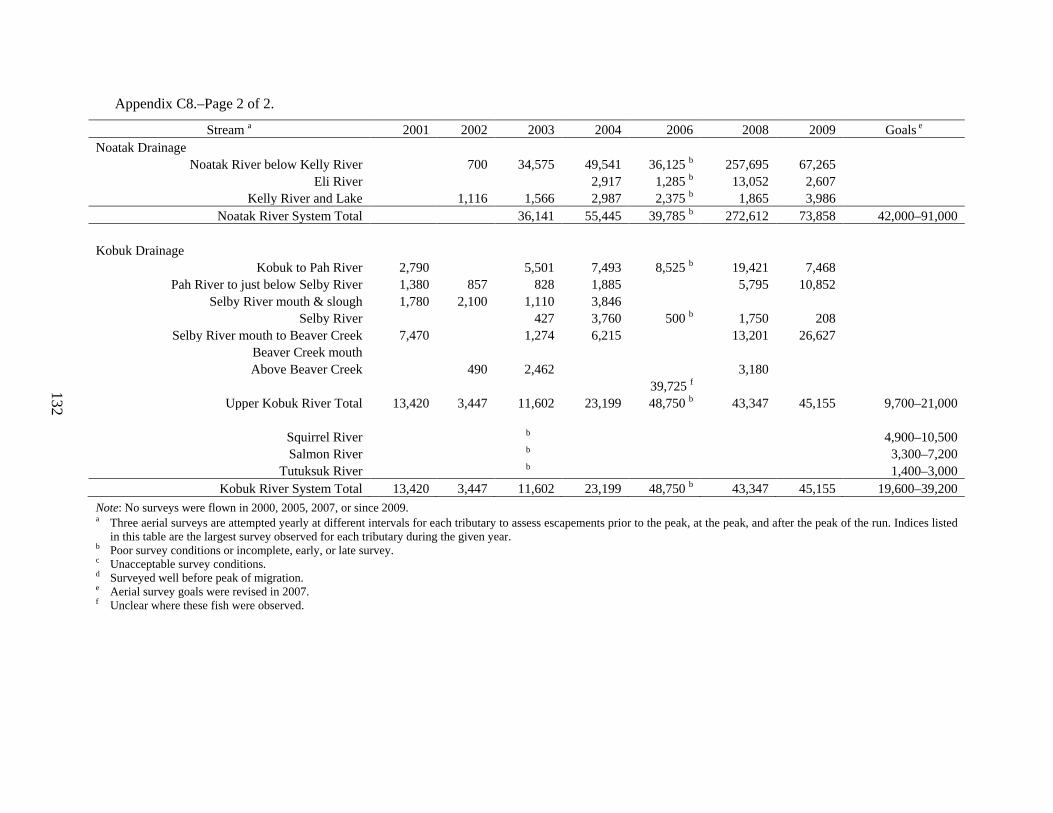
Appendix C8.–Page 2 of 2.
Stream a 2001 2002 2003 2004 2006 2008 2009 Goals e Noatak Drainage
Noatak River below Kelly River
700 34,575 49,541 36,125 b 257,695 67,265 Eli River
2,917 1,285 b 13,052 2,607
Kelly River and Lake
1,116 1,566 2,987 2,375 b 1,865 3,986 Noatak River System Total 36,141 55,445 39,785 b 272,612 73,858 42,000–91,000
Kobuk Drainage Kobuk to Pah River 2,790
5,501 7,493 8,525 b 19,421 7,468
Pah River to just below Selby River 1,380 857 828 1,885
5,795 10,852 Selby River mouth & slough 1,780 2,100 1,110 3,846
Selby River
427 3,760 500 b 1,750 208 Selby River mouth to Beaver Creek 7,470
1,274 6,215
13,201 26,627
Beaver Creek mouth Above Beaver Creek
490 2,462
3,180
39,725 f
Upper Kobuk River Total 13,420 3,447 11,602 23,199 48,750 b 43,347 45,155 9,700–21,000
Squirrel River
b
4,900–10,500 Salmon River
b
3,300–7,200
Tutuksuk River
b
1,400–3,000 Kobuk River System Total 13,420 3,447 11,602 23,199 48,750 b 43,347 45,155 19,600–39,200
Note: No surveys were flown in 2000, 2005, 2007, or since 2009. a Three aerial surveys are attempted yearly at different intervals for each tributary to assess escapements prior to the peak, at the peak, and after the peak of the run. Indices listed
in this table are the largest survey observed for each tributary during the given year. b Poor survey conditions or incomplete, early, or late survey. c Unacceptable survey conditions. d Surveyed well before peak of migration. e Aerial survey goals were revised in 2007. f Unclear where these fish were observed.
132

Appendix C9.–Kobuk River chum salmon drift test fish cumulative catch per unit effort (CPUE),
2007–2013.
133

134

APPENDIX D: HERRING FISHERIES
135

Appendix D1.–Norton Sound herring and spawn-on-kelp harvests (in tons) by U.S. commercial fishermen, 1990–2013.
Sac Roe Food or Total Spawn Year a Herring bait herring herring on kelp 1990 5,253
1,026 6,279 0
1991 5,465
207 5,672 0 1992 b 0
0 0 0
1993 4,713
321 5,034 0 1994 958
2 960 0
1995 6,647
116 6,763 0 1996 c 6,061
109 6,220 0
1997 d 3,709
262 3,976 0 1998 2,623
8 2,631 9.04 e
1999 2,693 f 53 2,751 3.74 2000 4,487 g 0 4,487 2.25 2001 2,245
0 2,245 2.20
2002 1,059
64 1,123 0 2003 1,587
21 1,608 0.88
2004 b 0
11 11 0 2005 1,951
0 1,951 0
2006 646
25 671 0.57 2007 b 0
33 33 0.14
2008 b 0
91 91 0.18 2009 b 0
28 28 0
2010 623
65 688 0 2011 739
67 806 0
2012 b 0
7 7 0 2013 490 2 492 0
a From 1990 to present, the fishery has occurred in southeastern Norton Sound. b No commercial fishery took place in 1992, and no sac roe fishery took place in 2004, 2007–2009, and 2012. c Total includes an estimated 50 short tons (st) of wastage. d Total includes an estimated 5 st of wastage and approximately 1,000 lb taken as bait. e Includes 2,100 lb of wild kelp and 16,083 lb of Macrocystis kelp. f Includes an estimated 5 st of wastage. g Includes an estimated 15 st of wastage.
136

Appendix D2.–Commercial herring fishery summary information, Norton Sound District, 1990–2013.
Estimated Catch Beach Wild Macrocystis Dollar
biomass
gillnet
seine
kelp kelp Number of value Number of Average Peak Fishery
Year (tons) (tons) (tons) (tons) (lbs.) fishermen (millions) buyers roe % catch day duration 1990 39,384
6,032
347
365 3.60 8 8.8 5/29 5/28–05/30
1991 42,854
5,150
522
279 2.40 8 9.3 5/25 5/23–05/25 1992 57,974
0 a 0 a
a 0.00 a a 6/20 b a
1993 46,549
4,291
742
264 1.50 5 9.9 5/25 5/24–06/05 1994 31,088
921
40
215 0.30 6 10.3 6/8 6/05–06/09
1995 37,779
6,033
614
215 4.20 6 10.4 5/24 5/23–05/30 1996 26,596
5,581
589
287 4.50 10 10.6 5/25 5/24–05/25
1997 47,748
3,459
513
220 0.61 9 9.9 5/22 5/20–05/24 1998 52,033
2,632
0
1.00 16,083 47 0.20 2 9.2 5/25 5/22–06/09
1999 34,314
2,755
0
7,482 122 0.61 4 10.5 6/17 6/13–06/22 2000 32,680
4,390
81
4,500 97 0.89 4 9.5 6/11 6/07–06/15
2001 26,305
2,245
0
4,400 76 0.35 3 12.3 6/12 6/12–06/16 2002 27,068
1,123
0
0 46 0.16 2 10.6 5/24 5/22–06/03
2003 32,918
1,608
0
1,750 32 0.22 2 10.5 5/18 5/16–05/25 2004 a 34,180
11 c 0
0 4 0.00 0 a 5/24 b c
2005 43,013
1,951
0
0 56 0.32 1 11.4 6/04 6/03–06/10 2006 38,833 d 671 e 0
0.57 0 41 0.14 1 10.2 6/09 6/08–06/11
2007 a 38,415 d 33
0
0.14 0 7 0.02 1 a 6/09 6/09–06/15 2008 a 37,401 d 91
0
0 14 0.18 1 a 6/11 6/10–06/24
2009 a 36,917 d 28
0
0 6 0.02 1 a 6/12 6/12–06/15 2010 42,889 d 688
0
0 30 0.19 1 13.5 6/17 6/11–06/19
2011 53,786
807
0
0 35 0.27 1 14.8 6/04 6/01–06/10 2012 a 52,949 d 7
0
0 8 0.01 1 a 6/25 6/16–06/25
2013 58,594 d 492 0 0 40 0.15 1 13.2 6/15 6/14–06/20 a No fishery in 1992 and very limited fishery in 2012 due to late sea ice breakup, and no sac roe fishery in 2004 and 2007–2009 due to lack of a buyer. b Date of peak aerial survey biomass estimate, typically 1 or 2 days prior to peak catch. The 2004 catch was by king crab permit holders for bait. c All fish caught were kept as bait; none were sold. d Conditions did not allow for a peak survey; therefore, biomass was estimated by extrapolation. e Twenty-five tons out of total sac roe herring catch was sold off as bait to NSEDC.
137

Appendix D3.–Norton Sound commercial herring harvest (tons) by subdistrict, by year, 1990–2013.
Subdistricts Year a 1 2 3 4 5 6 7 Totals 1990 4,498 950 931 0 0 0 0
6,379 b
1991 0 880 4,792 0 0 0 0
5,672 c 1992 d 0 0 0 0 0 0 0
0
1993 2,288 587 1,881 0 278 0 0
5,034 e 1994 250 36 634 0 40 0 0
960
1995 2,359 604 1,524 0 2,108 167 0
6,762 1996 3,074 111 2,831 0 153 0 0
6,170 f
1997 2,046 62 1,864 0 0 0 1 g 3,976 h 1998 1,543 0 1,081 0 0 0 0
2,624
1999 285 323 2,050 0 0 0 8
2,746 i 2000 j 2,623 81 1,767 0 0 0 0
4,471
2001 j 898 0 1,347 0 0 0 0
2,245 2002 j 373 0 750 0 0 0 0
1,123
2003 j 283 0 1,325 0 0 0 0
1,608 2004 0 0 0 0 0 0 11
11
2005 j 783 9 1,149 0 10 0 0
1,951 2006 191 0 480 0 0 0 0
671
2007 0 33 0 0 0 0 0
33 2008 0 91 0 0 0 0 0
91
2009 0 28 0 0 0 0 0
28 2010 314 300 74 0 0 0 0
688
2011 600 84 123 0 0 0 0
807 2012 6 0 0 0 0 0 1
7
2013 107 84 302 0 0 0 0 492 a Includes herring taken for sac roe and bait. b Does not include an estimated wastage of 60 short tons (st) in abandoned gillnets. c Does not include an estimated wastage of 125 st in abandoned gillnets. d No commercial fishery in 1992. e Does not include an estimated wastage of 45 st in abandoned beach seine sets. f Does not include an estimated 50 st of wastage. g Approximately 1,000 lb of herring bait was taken under 5 AAC 27.971 in June (not during sac roe fishery). h Does not include an estimated 5 st of wastage. i There were 75.8 tons added to the sac roe total due to dewatering by buyers. Three tons were added to the bait total due to
dewatering by the buyer. Does not include an estimated 5 st of wastage. j There was 10% added to sac roe total due to dewatering by buyers.
138

Appendix D4.–Port Clarence District commercial herring fishery, 1986–1996.
Gillnet Purse Seine Harvest Year Fishery Permits Permits (pounds)
1986 Fall Bait 1 130
1987 Sac Roe 3 3 291,000
1987 Fall Bait Unknown 1,100
1988 Sac Roe 3 3 160,000
1994 Fall Bait 4 8,706
1995 Spring Bait 8 19,193
1995 Fall Bait 2 9,119
1996 Spring Bait 4 5,546
139

Perc
ent o
f Cat
ch
0
20
40
60 1987
0
20
40
60 1988
0
20
40
60 1989
0
20
40
60 1990
0
20
40
60 1991
0
20
40
60
3 4 5 6 7 8 9 10 11 12 13+
1993
Age Group
Appendix D5.–Norton Sound herring age class composition by percentage of commercial catch, commercial gear combined (beach seine and gillnet), 1987–1993. Note: No commercial fishing occurred in 1992.
140

Perc
ent o
f Cat
ch
0
20
40
60 1994
0
20
40
60 1995
0
20
40
60 1996
0
20
40
60 1997
0
20
40
60 1998
0
20
40
60
3 4 5 6 7 8 9 10 11 12 13+
1999
Age Group
Appendix D6.–Norton Sound herring age class composition by percentage of commercial catch, commercial gear combined (beach seine and gillnet), 1994–1999. Note: No commercial catch from beach seine gear in 1998 and 1999.
141

142
0
20
40
60 2000
0
20
40
60
3 4 5 6 7 8 9 10 11 12 13+
2001
0
20
40
60
3 4 5 6 7 8 9 10 11 12 13+
2002
Age Group
Perc
ent o
f Cat
ch
0
20
40
60 2003
0
20
40
60 2005
0
20
40
60
3 4 5 6 7 8 9 10 11 12 13+
2006
Appendix D7.–Norton Sound herring age class composition by percentage of commercial catch,
commercial gear combined (beach seine and gillnet), 2000–2006. Note: No commercial catch from beach seine gear after 2000. No fishery in 2004.

143
Appendix D8.–Norton Sound herring age class composition by percentage of commercial catch, commercial gear (gillnet only), 2013.
Note: No commercial samples were available 2007–2012.

Perc
ent o
f Cat
ch
0204060
1987
0204060 1988
0204060 1989
0204060 1990
0204060 1991
0204060
3 4 5 6 7 8 9 10 11 12 13+
1992
Age Group Appendix D9.–Norton Sound herring age class composition by percentage of total catch, variable
mesh gillnets, 1987–1992.
144

Perc
ent o
f Cat
ch
0204060 1993
0
20
40
601994
0204060 1995
0204060 1996
Age Group
0204060 1997
0204060
3 4 5 6 7 8 9 10 11 12 13+
1998
Appendix D10.–Norton Sound herring age class composition by percentage of total catch, variable
mesh gillnets, 1993–1998.
145

0
20
40
60 1999
0
20
40
60 2000
0
20
40
60 2001
0
20
40
60 2002
0
20
40
602003
0204060
3 4 5 6 7 8 9 10 11 12 13+
2004
Age Group
Perc
ent o
f Cat
ch
Appendix D11.–Norton Sound herring age class composition by percentage of total catch, variable
mesh gillnets, 1999–2004.
146

0204060
0204060
2005Pe
rcen
t of C
atch
0204060
2006
Age
0204060
2008
2007
0204060 2009
0204060
3 4 5 6 7 8 9 10 11 12 13+
2011
Appendix D12.–Norton Sound herring age class composition by percentage of total catch, variable
mesh gillnets, 2005–2012. Note: Herring age class composition by percentage of total catch for 2010 and 2012 was not available.
147

Perc
ent A
ge C
ompo
sitio
n
0
20
40
60
3 4 5 6 7 8 9 10 11 12 13+
2014 Projected Total Run
Age Group
0
20
40
60
3 4 5 6 7 8 9 10 11 12 13+
2013 Variable Mesh
Appendix D13.–Norton Sound Pacific herring age composition comparison of the 2013 variable-mesh
gear and the projected age composition of the 2014 return.
148

APPENDIX E: KING CRAB FISHERIES
149

Appendix E1.–Historical commercial summer harvest of red king crab from Norton Sound Section, Eastern Bering Sea, by statistical areas, 1990–2013 (catch in pounds).
Statistical Area 1990 1992 1993 1994 1995 1996 a 1997 1998 1999
616331
48
633 616401
35
626331
61 626401
18,971 45,045 18,066 8,065 508
626402 636330
4,560 3,838 2,449 636401
1,159 1,373 3,340 24,329 70,677 59,206 10,771 14,201
636402
1,754 3,466 646301
4,628 13,888
646330
1,493 2,894 314
3,021 646401
1,963 37,510 105,045 22,834 1,052 3,194 221
646402
730 139,661 66,821 656300
656330
4,814 265
19,745 15,446 4,661 4,078 1,300 656401 171 53,119 105,341 34,686 32,289 9,985 4,035 1,127 2,739 656402
193,079 110,289 44,000
666230 666300
25,519 666330 27,185 4,305 31,758
730
666401 162,263 10,632 746 396
3,001 1,816
930 666402
535 1,221
666431
1,124 676300
546
676330 676400 3,212
9,775
676430 676501 686330 686431 Total
(tons) 96 37 168 164 161 112 46 15 12 -continued-
150
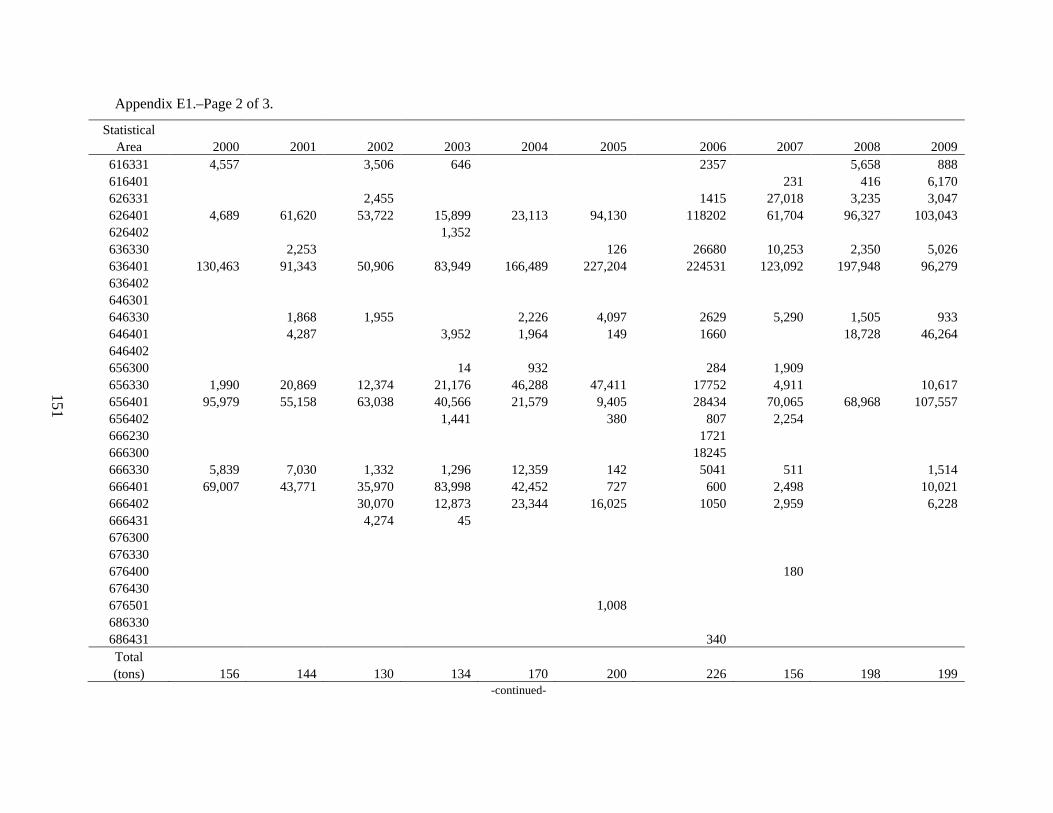
Appendix E1.–Page 2 of 3.
Statistical Area 2000 2001 2002 2003 2004 2005 2006 2007 2008 2009
616331 4,557
3,506 646
2357
5,658 888 616401
231 416 6,170
626331
2,455
1415 27,018 3,235 3,047 626401 4,689 61,620 53,722 15,899 23,113 94,130 118202 61,704 96,327 103,043 626402
1,352
636330
2,253
126 26680 10,253 2,350 5,026 636401 130,463 91,343 50,906 83,949 166,489 227,204 224531 123,092 197,948 96,279 636402
646301 646330
1,868 1,955
2,226 4,097 2629 5,290 1,505 933 646401
4,287
3,952 1,964 149 1660
18,728 46,264
646402 656300
14 932
284 1,909 656330 1,990 20,869 12,374 21,176 46,288 47,411 17752 4,911
10,617 656401 95,979 55,158 63,038 40,566 21,579 9,405 28434 70,065 68,968 107,557 656402
1,441
380 807 2,254
666230
1721 666300
18245
666330 5,839 7,030 1,332 1,296 12,359 142 5041 511
1,514 666401 69,007 43,771 35,970 83,998 42,452 727 600 2,498
10,021
666402
30,070 12,873 23,344 16,025 1050 2,959
6,228 666431
4,274 45
676300 676330 676400
180 676430
676501
1,008 686330
686431
340 Total
(tons) 156 144 130 134 170 200 226 156 198 199 -continued-
151
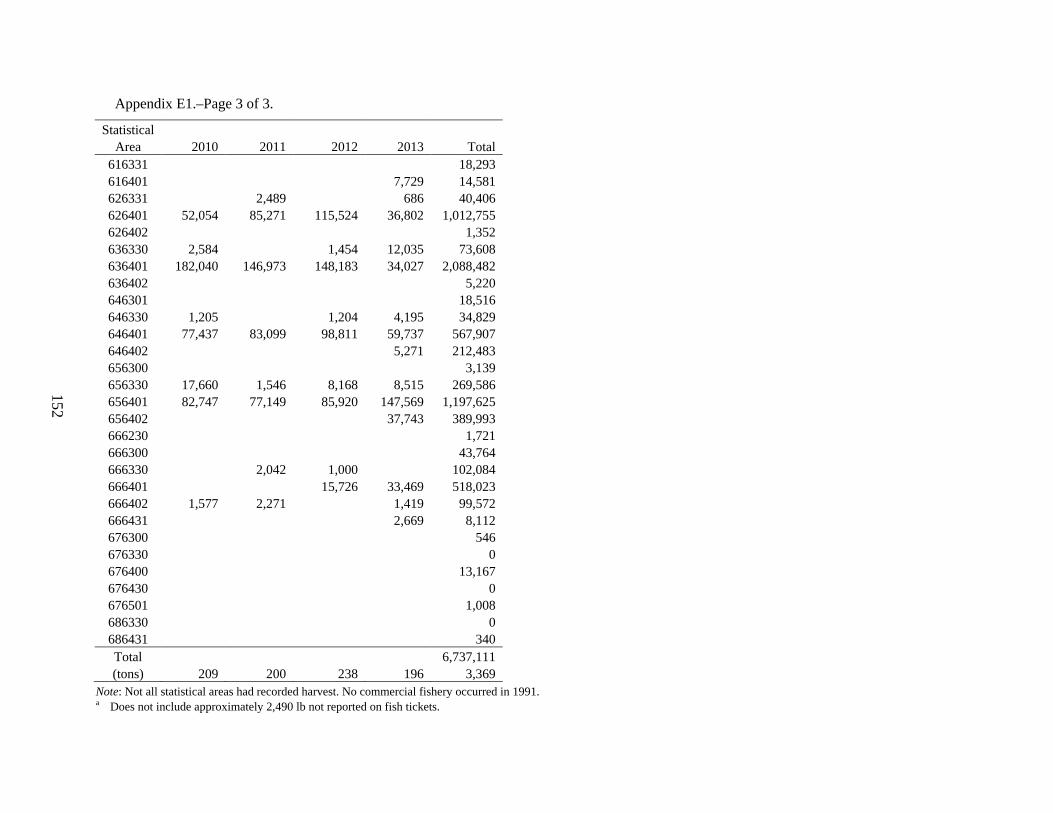
Appendix E1.–Page 3 of 3.
Statistical Area 2010 2011 2012 2013 Total
616331
18,293 616401
7,729 14,581
626331
2,489
686 40,406 626401 52,054 85,271 115,524 36,802 1,012,755 626402
1,352
636330 2,584
1,454 12,035 73,608 636401 182,040 146,973 148,183 34,027 2,088,482 636402
5,220
646301
18,516 646330 1,205
1,204 4,195 34,829
646401 77,437 83,099 98,811 59,737 567,907 646402
5,271 212,483
656300
3,139 656330 17,660 1,546 8,168 8,515 269,586 656401 82,747 77,149 85,920 147,569 1,197,625 656402
37,743 389,993
666230
1,721 666300
43,764
666330
2,042 1,000
102,084 666401
15,726 33,469 518,023
666402 1,577 2,271
1,419 99,572 666431
2,669 8,112
676300
546 676330
0
676400
13,167 676430
0
676501
1,008 686330
0
686431
340 Total
6,737,111
(tons) 209 200 238 196 3,369 Note: Not all statistical areas had recorded harvest. No commercial fishery occurred in 1991. a Does not include approximately 2,490 lb not reported on fish tickets.
152

Appendix E2.–The results of the population assessment surveys conducted for red king crab in Norton Sound since 1976.
Population Abundance Estimates Legal Male
Research
Number of crab a Biomass
Year Date Agency Gear Pre-2 males b Pre-1 Males b Legal Males c (millions of pounds) 1976
9/02–09/05 NMFS Trawl 331,555 808,091 1,742,755 5,228,265
9/16–10/07
1979 d
7/26–08/05 NMFS Trawl
809,799 2,429,397
1980 e
7/04–07/14 ADF&G Pots
1,900,000 5,700,000
1981
6/28–07/14 ADF&G Pots
1,285,195 3,855,585 1982
7/06–07/20 ADF&G Pots
353,273 1,059,819
1982
9/05–09/11 NMFS Trawl 356,724 832,581 877,722 2,633,166 1985
7/01–07/14 ADF&G Pots
907,579 2,722,737
1985
9/16–10/01 NMFS Trawl 466,858 707,140 1,051,857 3,155,571 1988
8/16–08/30 NMFS Trawl 565,255 493,030 978,748 2,936,244
1991
8/22–08/30 NMFS Trawl 294,801 303,682 1,287,486 3,862,458 1996
9/07–09/18 ADF&G Trawl 452,580 325,699 536,235 1,608,705
1999
7/28–08/07 ADF&G Trawl 103,832 940,198 1,594,341 4,783,023 2002
7/27–08/06 ADF&G Trawl 427,703 518,638 771,569 2,314,707
2006
7/25–08/08 ADF&G Trawl 775,076 569,833 726,251 2,178,753 2008 7/24–08/11 ADF&G Trawl 795,777 697,442 811,727 2,435,182 2011 7/18–08/15 ADF&G Trawl 431,153 311,550 1,310,634 3,931,902
Note: Data not available for all years. a Population estimates are valid for the date of the survey (i.e., either before or after the summer commercial fishery). b Pre-2 male crab were defined as 76–89 mm in carapace length (CL), and pre-1 male crab were defined as 90–104 mm in CL. c Legal male red king crab were defined as ≥ 121 mm (4.75 in) in carapace width for the pot surveys and all ADF&G trawl surveys (except for 1996, when legal male crab were
defined as at least 105 mm CL), and ≥ 104 mm CL for all of the NMFS trawl surveys (except the 1979 survey, which defined legal male crab as at least 100 mm CL). d Pre-2 male and pre-1 male crab data are unavailable for the 1979 NMFS trawl survey. e The 1980 pot survey estimate has been revised from the original estimate of 13.4 million pounds, which was thought inaccurate due to under-reporting of recovered tagged crab.
153

Appendix E3.–Historical summer commercial red king crab fishery economic performance, Norton Sound Section, Eastern Bering Sea, 1990–2013.
Guideline Legal male Commercial
harvest population est.
harvest (lbs) a,b
Total Total
level No. crab
Open
Total number of
Total number of pots exvessel fishery value Season length Year (lbs) b (millions) lbs b access CDQ Vessels Permits Landings Registered Pulls price/lb (millions $) Days Dates 1990 0.20
0.19
4 4 c
1,388 3,172 c c 4 8/01–8/05
1991 0.34 1.3 3.9
No Summer Fishery 1992 0.34
0.07
27 27 c
2,635 5,746 1.75 0.130 2 8/01–8/03
1993 0.34
0.33
14 20 208
560 7,063 1.28 0.430 52 7/01–8/28 d 1994 0.34
0.32
34 52 407
1,360 11,729 2.02 0.646 31 7/01–7/31
1995 0.34
0.32
48 81 665
1,900 18,782 2.87 0.926 67 7/01–9/05 1996 0.34 0.5 1.5
0.22
41 50 264
1,640 10,453 2.29 0.519 57 7/01–9/03 e
1997 0.08
0.09
13 15 100
520 2,982 1.98 0.184 44 7/01–8/13 f 1998 0.08
0.03 0.00 8 11 50
360 1,639 1.47 0.041 65 7/01–9/03 g
1999 0.08 1.6 4.8
0.02 0.00 10 9 53
360 1,630 3.08 0.073 66 7/01–9/04 h 2000 0.33 1.4 4.2
0.29 0.01 15 22 201
560 6,345 2.32 0.715 91 7/01– 9/29 i
2001 0.30 1.3 3.8
0.28 0.00 30 37 319
1,200 11,918 2.34 0.674 97 7/01– 9/09 j 2002 0.24 1.0 3.1
0.24 0.01 32 49 201
1,120 6,491 2.81 0.729 77 6/15–9/03 k
2003 0.25 1.0 3.1
0.25 0.01 25 43 236 960 8,494 3.09 0.823 68 6/15–8/24 l 2004 0.35 1.6 4.4
0.31 0.03 26 39 227
1,120 8,066 3.12 1.063 51 6/15–8/08 m
2005 0.37 1.7 4.8
0.37 0.03 31 42 255
1,320 8,867 3.14 1.264 73 6/15–8/27 n 2006 0.45 1.6 4.5
0.42 0.03 28 40 249
1,120 8,867 2.26 1.021 68 6/15–8/22 m
2007 0.32 1.1 3.1
0.29 0.02 38 30 251
1,200 9,118 2.49 0.750 52 6/15–8/17 m 2008 0.41 1.5 4.1
0.36 0.03 23 30 248
920 8,721 3.20 1.231 73 6/23–9/03 o
2009 0.38 1.3 3.8
0.37 0.03 22 27 359
920 11,934 3.17 1.225 98 6/15–9/20 p 2010 0.40 1.7 4.5 0.39 0.03 23 32 286 1,040 9,698 3.73 1.528 58 6/28–8/24 q
-continued-
154

Appendix E3.–Page 2 of 2.
Guideline Legal Male Commercial
Harvest Population Est.
Harvest (lbs) a,b
Total Total
Level No. crab
Open
Total Number of
Total Number of Pots Exvessel Fishery Value Season Length Year (lbs) b (millions) lbs b Access CDQ Vessels Permits Landings Registered Pulls Price/lb (millions $) Days Dates 2011 0.36 1.5 4.0
0.37 0.03 24 25 173
1,040 6,808 5.23 2.016 33 6/28–7/30 r
2012 0.47 1.4 3.7
0.44 0.03 40 29 312
1,200 10,041 5.41 2.556 72 6/29–9/08 s 2013 0.50 1.6 4.1 0.37 0.02 37 33 460 1,420 15,058 5.63 2.165 74 7/03–9/14 t
a Deadloss included in total. Data not available for all years. b Millions of pounds. c Information not available. d Fishing actually began 7/8. e Fishing began 7/9 due to fishermen strike. f First delivery was made 7/10. g First delivery was made 7/16. h The season was extended 24 hours due to bad weather. i Open access fishery (OA) closed 8/29. CDQ fishery opened 9/1–9/29. j OA closed 9/1. CDQ fishery opened 9/1–9/9. k OA was 7/1–8/6. CDQ fishery opened 6/15–6/28 and 8/9–9/3. l OA was 7/1–8/13. CDQ fishery opened 6/15–6/28 and 8/15–8/24. m CDQ fishery opened 6/15–6/28. OA opened 7/1 to the end date. o OA opened 6/23–8/18. CDQ opened 8/17–9/3. n OA was 7/1–8/15. CDQ fishery opened 6/15–6/28 and 8/17–8/27. p CDQ opened 6/15 – 7/28. OA opened 6/15 to the end date. q CDQ opened 6/28 – 7/16. OA opened 7/1 to the end date. r CDQ opened 6/28 – 7/8. OA opened 6/28 to the end date. s CDQ opened 6/29 to the end date. OA opened 6/29–8/11. t CDQ and OA opened and closed at the same time.
155

Appendix E4.–Average length and percentage of recruit and postrecruit male red king crab from summer commercial fishery catch samples in Norton Sound Section, Eastern Bering Sea, 1990–2013.
Average Year Length (mm) Recruits a Postrecruits b 1990 121 21 79
1991 c
1992 120 28 72 1993 119 31 69 1994 119 20 80 1995 118 36 64 1996 117 30 70 1997 116 49 51 1998 117 32 68 1999 118 42 58 2000 116 41 60 2001 119 33 67 2002 120 33 67 2003 117 48 52 2004 117 49 51 2005 118 36 64 2006 119 25 75 2007 117 45 55 2008 115 45 55 2009 116 43 57 2010 115 49 51 2011 116 43 57 2012 118 33 67 2013 120 32 68
a Recruits = all new-shell, legal size, male king crab of carapace length < 116mm.
b Postrecruits = all other male king crab of legal size. c No summer commercial fishery.
156

Appendix E5.–Winter commercial and subsistence red king crab harvests, Norton Sound, Eastern Bering Sea, 1990–2013.
Commercial Subsistence Number Pounds
Number of Number of Number of Total Total Average
Number of of crab of crab
permits permits permits crab crab number kept/
Year a fishermen harvested harvested Winter b issued returned fished caught c harvested d permits fished 1990 13 3,626 9,792 1989–90 136 118 107 16,635 12,152 114 1991 11 3,800 10,064 1990–91 119 104 79 9,295 7,366 93 1992 13 7,478 21,177 1991–92 158 105 105 15,051 11,736 112 1993 8 1,788 4,926 1992–93 88 79 37 1,193 1,097 30 1994 25 5,753 17,214 1993–94 118 95 71 4,894 4,113 58 1995 42 7,538 18,845 1994–95 166 131 97 7,777 5,426 56 1996 9 1,999 5,064 1995–96 84 44 35 2,936 1,679 48 1997 2 e e 1996–97 38 22 13 1,617 745 57 1998 5 984 2,349 1997–98 94 73 64 20,327 8,622 135 1999 5 2,714 7,041 1998–99 95 80 71 10,651 7,533 106 2000 10 3,045 7,894 1999–00 98 64 52 9,816 5,723 107 2001 3 1,098 2,943 2000–01 50 27 12 366 256 21 2002 11 2,591 6,860 2001–02 114 101 67 8,805 3,669 55 2003 13 6,853 16,827 2002–03 107 73 64 9,052 4,140 65
2004 f 2 522 1,293 2003–04 96 77 41 1,775 1,181 29 2005 4 2,121 5,619 2004–05 g 170 102 60 6,496 3,973 66 2006 1 e e 2005–06 98 97 67 2,083 1,239 18 2007 8 3,313 8,023 2006–07 129 127 116 21,444 10,690 92 2008 9 5,796 14,676 2007–08 139 137 108 18,621 9,485 88 2009 7 4,951 12,348 2008–09 105 105 70 6,971 4,752 68 2010 10 4,834 12,028 2009–10 125 123 85 9,004 7,044 83 2011 9 3,365 8,669 2010–11 148 148 95 9,183 6,640 70 2012 35 9,157 24,142 2011–12 204 204 138 11,341 7,371 53 2013 26 22,639 62,179 2012–13 149 148 104 21,752 7,662 74
Avg 1990–2012 11 3,620 9,486 Avg 1990–2012 116 97 72 8,928 5,506 71 a Fishing may occur from November 15 to May 15. b The winter subsistence fishery is open December through May. c The number of crab actually caught; some may have been released. d The number of crab harvested is the number of crab retained. e Confidential under AS 16.05.815. f Confidentiality was waived by the fishermen. g Permits were only given out of the Nome ADF&G office, except during the 2004–2005 season, when permits were also given out in Elim, Golovin, Shaktoolik, and White
Mountain.
157

Appendix E6.–Summer subsistence red king crab harvests, Norton Sound, Eastern Bering Sea, 2004–2013.
Number Number Number Total Total Average
Permits Permits Permits Crab Crab Number Kept/
Year Issued Returned Fished Caught Harvested Permits Fished 2004 38 18 5 996 350 70 2005 14 12 4 753 304 76 2006 6 4 3 67 62 21 2007 19 19 5 1,425 1,008 202 2008 30 30 14 1,816 1,176 84 2009 20 20 13 1,874 653 50 2010 27 27 15 1,086 660 44 2011 43 42 27 4,026 2,658 98 2012 45 44 13 1,346 912 70 2013 47 46 26 3,102 1,865 72
Avg. 2008–2012 33 33 16 2,030 1,212 69
158

Appendix E7.–Number of crab pots lost during the subsistence and commercial winter crab fisheries and ADF&G winter studies, 2006–2013.
Year Subsistence Commercial ADF&G Winter Study Total 2005–06 50 ND 6 56 2006–07 132 ND 7 139 2007–08 6 ND 4 10 2008–09 8 ND 2 10 2009–10 23 30 2 55 2010–11 8 3 0 11 2011–12 19 64 0 83 2012–13 4 23 No winter study in 2013. 27
159

Appendix E8.–Size composition by percent of red king crab from winter research pots near Nome, Norton Sound, Eastern Bering Sea, 1990–2012.
Undersized a Legal a
Prerecruit Prerecruit
Post
Year 2 1 Total Recruits recruits Total 1990 16 33 49
25 26 51
1991 5 30 36
34 31 65 1992 b b b
b b b
1993 3 9 12
17 71 88 1994 b b b
b b b
1995 10 11 23 c
32 45 77 1996 22 33 64 c
10 26 36
1997 32 21 64 c
14 22 36 1998 36 44 82 c
9 9 18
1999 7 42 50 c
39 11 50 2000 16 20 37 c
39 25 64
2001 23 16 39 c
14 48 61 2002 43 26 79 c
9 12 21
2003 20 42 66 c
20 14 34 2004 9 40 50 c
37 13 50
2005 16 24 41 c
25 34 59 2006 29 33 63 c
16 22 38
2007 16 53 78 c
11 11 22 2008 36 31 71 c
18 12 30
2009 11 42 54 c
24 22 46 2010 10 32 43 c
30 27 57
2011 15 26 44 c
23 33 56 2012 25 29 57 c 14 29 43
Note: No winter study occurred in 2013. a Undersized crab are male crab less than 4-¾ inch carapace width (CW). Legal crab are male king crab greater than or equal to
4-¾ inch CW. b No winter crab research study occurred in 1992 or 1994. c Includes prerecruit 3.
160

161
Appendix E9.–Current and historical catch performance for the Norton Sound summer commercial crab fishery, 2008–2013. Note: CDQ catch is not included in years prior to 2009 because the open access and CDQ portions of the crab fishery did not occur concurrently in those years.

Appendix E10.–Norton Sound crab exvessel value and fishery price per pound, 1994–2013.
162

Appendix E11.–Closed water regulations in effect for the Norton Sound summer commercial crab fishery, with dotted line showing temporary
boundaries for 2013 fishery only. Note: Line drawn around the coastline delineates the 3-mile state waters zone.
163

164
Appendix E12.–The percent of crab harvested during the Norton Sound summer commercial red king
crab fishery east of 164º W longitude, 1990–2013.

Perc
ent o
f mal
e red
king
cra
b ca
ptur
ed
0
5
10
15
20
25
10 35 60 85 110 135 160
N = 380
0
5
10
15
20
25
10 35 60 85 110 135 160
Mean Length = 85 mmN = 314
Carapace Length (mm)
0
5
10
15
20
25
10 35 60 85 110 135 160
Mean Length = 97 mmN = 316
0
5
10
15
20
25
10 35 60 85 110 135 160
1991
1996
1999
2002 Mean Length = 115 mmN = 287
Appendix E13.–Norton Sound male red king crab size distribution from trawl assessment surveys conducted by the National Marine Fisheries Service in 1991, and by ADF&G in 1996, 1999, and 2002.
Note: Mean length information is not available for 1991.
165

Perc
ent o
f Mal
e Red
Kin
g Cr
ab C
aptu
red
Carapace Length (mm)
05
10152025
10 35 60 85 110 135 160
2006 Mean Length = 88 mmN = 416
0
5
10
15
20
25
10 35 60 85 110 135 160
2008
05
10152025
10 35 60 85 110 135 160
2011
Mean Length = 90 mmN = 316
Mean Length = 92 mmN = 394
Appendix E14.–Norton Sound male red king crab size distribution from trawl assessment surveys conducted by ADF&G in 2006, 2008, and 2011.
166

Perc
ent o
f Tot
al S
ampl
e
0
5
10
15
100 120 140 160
1990 Mean Length = 121N = 1,289
0
5
10
15
100 120 140 160
1992 Mean Length = 120N = 2,566
0
5
10
15
100 120 140 160
1993 Mean Length = 119N = 1,813
0
5
10
15
100 120 140 160
1994 Mean Length = 119N = 404
Carapace Length (mm)
Appendix E15.–Length composition of Norton Sound red king crab summer commercial harvests, 1990–1994.
Note: No fishery in 1991.
167

Perc
ent o
f Tot
al S
ampl
e
0
5
10
15
100 120 140 160
1995 Mean Length = 118N = 1,174
0
5
10
15
100 120 140 160
1996 Mean Length = 117N = 787
0
5
10
15
100 120 140 160
1997 Mean length = 116N=1,198
Carapace Length (mm)
0
5
10
15
100 120 140 160
1998 Mean Length = 117N = 1,055
Appendix E16.–Length composition of Norton Sound red king crab summer commercial harvests,
1995–1998.
168

0
5
10
15
100 120 140 160
1999 Mean Length = 118N = 561
0
5
10
15
100 120 140 160
2000 Mean Length = 116N = 17,213
0
5
10
15
100 120 140 160
2001 Mean Length = 119N = 20,030
0
5
10
15
100 120 140 160
Mean Length = 119N = 5,198
2002
Perc
ent o
f Tot
al S
ampl
e
Carapace Length (mm) Appendix E17.–Length composition of Norton Sound red king crab summer commercial harvests,
1999–2002.
169

Perc
ent o
f Tot
al S
ampl
e
0
5
10
15
100 120 140 160
Mean Length = 117N = 5,220
2003
Carapace Length (mm)
0
5
10
15
100 120 140 160
0
5
10
15
100 120 140 160
2004
Mean Length = 118N = 5,360
2005
Mean Length = 117N = 9,605
0
5
10
15
100 120 140 160
2006 Mean Length = 119N = 6,707
Appendix E18.–Length composition of Norton Sound red king crab summer commercial harvests,
2003–2006.
170

Carapace Length (mm)
Perc
ent o
f Tot
al S
ampl
e
0
5
10
15
100 120 140 160
2007 Mean Length = 117N = 6,125
0
5
10
15
100 120 140 160
2008 Mean Length = 115N = 5,766
0
5
10
15
100 120 140 160
2009 Mean Length = 116N = 6,021
0
5
10
15
100 120 140 160
Mean Length = 115N = 5,902
2010
Appendix E19.–Length composition of Norton Sound red king crab summer commercial harvests,
2007–2010.
171

Perc
ent o
f Tot
al S
ampl
e
Carapace Length (mm)
0
5
10
15
100 120 140 160
Mean Length = 116N = 2,551
2011
0
5
10
15
100 120 140 160
Mean Length = 118N = 5,056
2012
0
5
10
15
100 120 140 160
Mean Length = 120N = 6,072
2013
Appendix E20.–Length composition of Norton Sound red king crab summer commercial harvests,
2011–2013.
172
APPENDIX F: MISCELLANEOUS FISHERIES
173

Appendix F1.–Kotzebue District winter commercial sheefish harvest statistics, 1990–2013.
Number of Number Pounds a Price per Estimated Year b Fishermen of Fish Total Average Pound ($) Value ($)
1990 c 6 687 5,617
8.2 1991 5 852 8,224
9.7 0.50 4,112
1992 3 289 2,850
9.9 0.65 1,853 1993 1 210 d 1,700
8.1 0.50 850
1994 e 1995 1 226 2,240
9.9 0.50 1,120
1996 2 308 3,002
9.7 0.44 1,321 1997 e
1998 1 254 2,400
9.4 0.43 1,032 1999 e
2000 e 2001 1 19 200
10.5 1.00 200
2002 4 30 300
10.0 1.00 300 2003 1 122 1,250
10.2 0.56 700
2004 1 37 474
12.8 1.91 905 2005 f All Information Confidential
2006–2011 e 2012 f All Information Confidential
2013 e a Data are not exact; in some instances total catch poundage was determined from average weight and catch data. Similarly,
various price-per-pound figures were determined from price-per-fish and average weight data. b Season was from October 1 to September 30. Year indicated would be the year the commercial season ended. For example,
the year 1980 would represent October 1, 1979, to September 30, 1980. c Data unavailable or incomplete. d Number of fish is not always reported. Estimates were based on average weight from reported sales that documented the
number of fish. e No reported commercial catches. f Less than 4 deliveries; data confidential under Alaska Statute 16.05.815. Prior to 2005, confidentiality was waived by permit
holders.
174

Appendix F2.–Kotzebue District reported subsistence harvests of sheefish, 1991–2004 and 2012–2013.
Number of
Average
fishermen Reported catch per
Year a interviewed harvest fisherman 1991 40 2,180 55 1992 43 2,821 66 1993 46 2,441 53 1994 171 3,181 19
1995 b 314 9,465 30 1996 b 389 6,953 18 1997 b 338 9,805 25 1998 b 435 5,350 14 1999 b 191 8,256 19 2000 b 237 7,446 17 2001 b 363 3,838 9
2002 101 3,882 38 2003 488 7,823 c 0
2004 d 440 10,163 23
2012 d 360 11,693 32 2013 Information is not yet available
Note: Subsistence surveys were not conducted from 2005 to 2011. a Due to limited survey effort during many years, total catch and effort should be regarded as minimum numbers only and are
not comparable year to year. b Subsistence sheefish harvests are from villages on Kobuk River. c Includes 10 fish reported from commercial salmon fishery and used for subsistence. d Subsistence surveys were not conducted in the town of Kotzebue.
175

Appendix F3.–Non-salmon sport fish harvests in Norton Sound and Kotzebue/Chukchi Sea, 1990–2013.
Norton Sound Kotzebue / Chukchi Sea
Dolly Arctic
Dolly Arctic Inconnu/
Year Varden Grayling Varden Grayling Sheefish 1990 3,765 1,378
806 622 151
1991 10,365 5,121
1,149 1,981 603 1992 2,382 492
582 968 1,904
1993 5,907 1,584
914 916 1,029 1994 3,071 1,331
2,365 814 564
1995 2,908 1,037
939 910 1,142 1996 4,285 1,485
913 2,136 485
1997 4,467 1,262
598 1,903 906 1998 2,240 298
440 1,788 414
1999 6,708 1,600
796 1,247 635 2000 7,952 1,203
1,599 1,233 1,201
2001 3,174 994
1,693 1,244 1,305 2002 2,252 1,565
1,884 1,994 500
2003 5,531 1,778
533 1,473 2,509 2004 4,318 824
1,285 1,983 1,634
2005 2,617 595
239 269 393 2006 3,180 419
2,328 760 810
2007 2,808 314
2,924 836 1,066 2008 3,319 965
852 293 61
2009 3,373 1,185
1,406 445 957 2010 1,835 232
493 366 595
2011 4,041 1,398
865 486 385 2012 252 520
781 626 104
2013 1,184 500 1,074 563 218 Average
2008–2012 2,564 860
879 443 420 2003–2012 3,127 823 1,171 754 851
176

Appendix F4.–Kotzebue District incidentally caught and sold Dolly Varden during the commercial salmon fishery, 1990–2013.
Number of Estimated Pounds Average Average Year fish sold Total catch a sold weight b price 1990 604 c 4,219 7.0 0.25 1991 6,136 c 40,747 6.6 0.18 1992 1,977 c 11,951 6.0 0.10 1993 76 c 540 7.1 0.10 1994 149 c 767 5.1 0.17 1995 2,090 c 13,195 6.3 0.20 1996 188 c 1,153 6.1 0.25 1997 3,320 c 23,203 7.0 0.20 1998 349 c 2,640 7.6 0.20 1999 1,502 c 11,352 7.6 0.20 2000 7 c 44 6.3 0.20 2001 0 c 0 d 0.00 2002 0 30 0 d 0.00 2003 20 176 160 8.0 0.50 2004 124 c 846 6.8 0.26 2005 181 c 1,158 6.4 0.30 2006 0 278 0 d 0.00 2007 0 960 0 d 0.00 2008 0 1,629 0 d 0.00 2009 0 960 0 d 0.00 2010 0 1,323 0 d 0.00 2011 0 400 0 d 0.00 2012 0 300 0 d 0.00 2013 0 302 0 d 0.00
a Estimate includes fish caught but not sold based on interviews of fishermen or fish tickets. b Some data extrapolated from average reported weight. c No estimates were made of Dolly Varden caught but not sold. d Dolly Varden caught but not sold were not weighed.
177
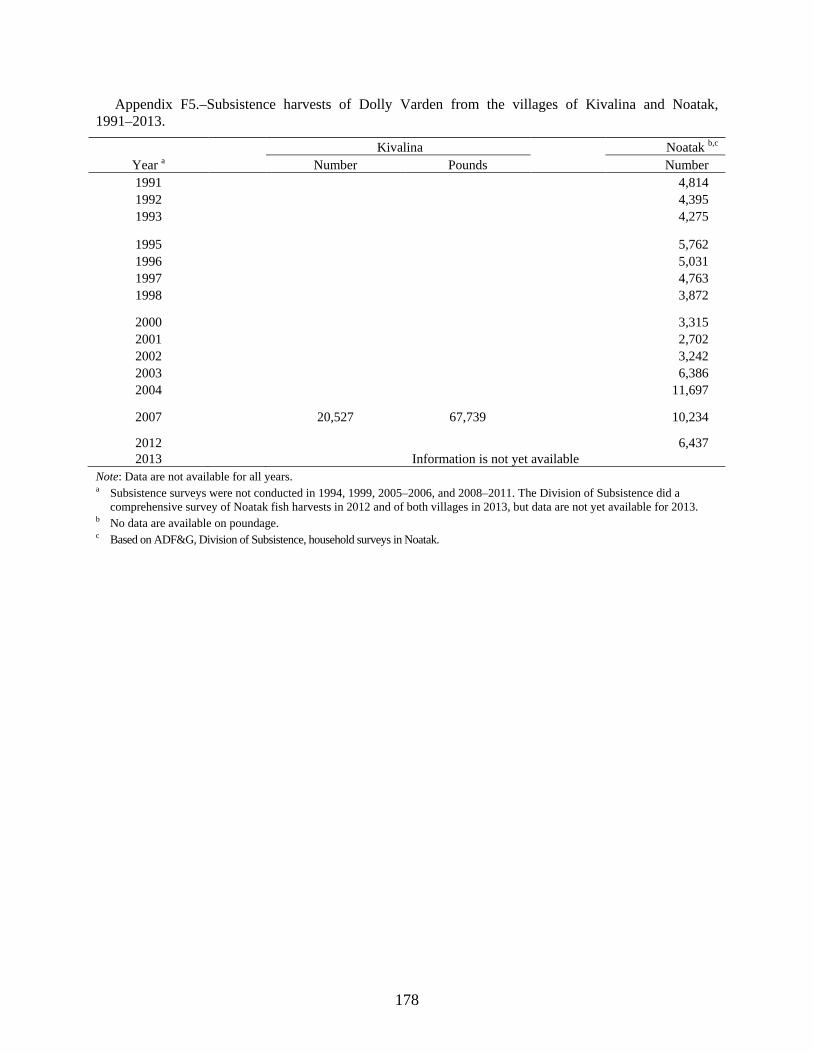
Appendix F5.–Subsistence harvests of Dolly Varden from the villages of Kivalina and Noatak, 1991–2013.
Kivalina Noatak b,c Year a Number Pounds Number 1991
4,814
1992
4,395 1993
4,275
1995
5,762 1996
5,031
1997
4,763 1998
3,872
2000
3,315 2001
2,702
2002
3,242 2003
6,386
2004
11,697
2007
20,527 67,739
10,234
2012
6,437 2013 Information is not yet available
Note: Data are not available for all years. a Subsistence surveys were not conducted in 1994, 1999, 2005–2006, and 2008–2011. The Division of Subsistence did a
comprehensive survey of Noatak fish harvests in 2012 and of both villages in 2013, but data are not yet available for 2013. b No data are available on poundage. c Based on ADF&G, Division of Subsistence, household surveys in Noatak.
178

Appendix F6.–Dolly Varden sport fish harvests in Norton Sound, by river, 1990–2013.
Location
Marine Fish- Other
Year Water Nome Pilgrim Unalakleet Niukluk Sinuk Snake Solomon Streams Total 1990 183 1,078 166 614 348
1,227 3,616
1991 0 1,220 856 1,474 1,474 729 1,252 2,219 1,141 10,365 1992 204 557 131 746 270 139 115 131 89 2,382 1993 205 917 448 427 1,003 536 331 893 1,147 5,907 1994 90 431 63 410 699 305 117 197 759 3,071 1995 0 462 74 976 346 158 131 366 395 2,908 1996 12 873 388 1,506 402 485 97 49 473 4,285 1997 189 328 65 936 2,071 346 81 186 265 4,467 1998 0 302 14 588 160 311 0 383 482 2,240 1999 330 791 45 2,384 1,952 88 44 154 920 6,708 2000 1,069 340 0 4,462 1,687 59 199 0 136 7,952 2001 166 43 270 1,002 1,197 86 108 162 140 3,174 2002 67 511 72 789 259 47 18 18 471 2,252 2003 0 1,223 482 134 110 712 13 0 2,857 5,531 2004 72 226 0 3,593 120 42 0 53 212 4,318 2005 95 553 12 500 1,148 141 27 0 141 2,617 2006 0 959 0 1,307 0 531 51 153 179 3,180 2007 14 625 0 731 193 144 461 481 159 2,808 2008 0 46 0 1,062 1,061 107 46 0 997 3,319 2009 0 253 0 2,794 108 50 50 0 118 3,373 2010 0 165 0 1,411 12 117 0 24 106 1,835 2011 0 0 11 2,219 1,631 0 10 0 170 4,041 2012 0 111 0 88 0 9 33 0 11 252 2013 0 17 0 483 0 0 0 0 684 1,184
Average 2008–2012 0 115 2 1,515 562 57 28 5 280 2,564 2003–2012 18 416 51 1,384 438 185 69 71 495 3,127
Note: Data are not available for all years.
179
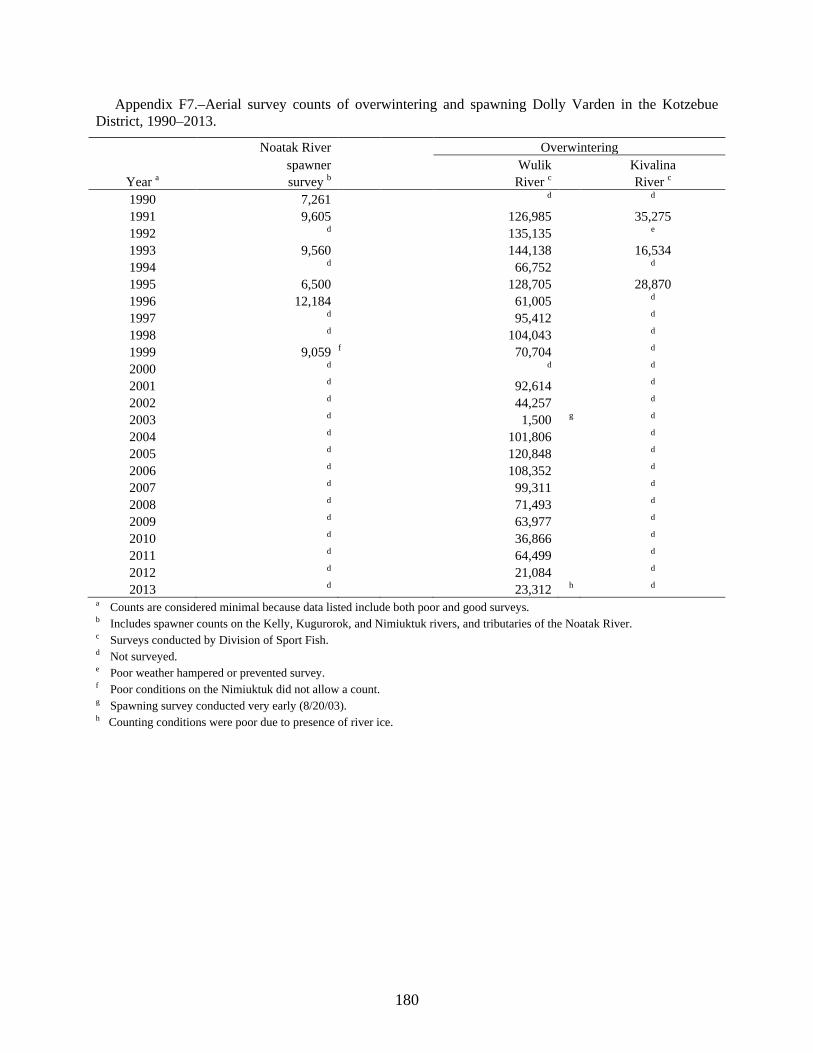
Appendix F7.–Aerial survey counts of overwintering and spawning Dolly Varden in the Kotzebue District, 1990–2013.
Noatak River Overwintering
spawner
Wulik
Kivalina
Year a survey b River c River c 1990 7,261
d
d
1991 9,605
126,985
35,275 1992 d
135,135
e
1993 9,560
144,138
16,534 1994 d
66,752
d
1995 6,500
128,705
28,870 1996 12,184
61,005
d
1997 d
95,412
d 1998 d
104,043
d
1999 9,059 f
70,704
d 2000 d
d
d
2001 d
92,614
d 2002 d
44,257
d
2003 d
1,500 g d 2004 d
101,806
d
2005 d
120,848
d 2006 d
108,352
d
2007 d
99,311
d 2008 d
71,493
d
2009 d
63,977
d 2010 d
36,866
d
2011 d
64,499
d 2012 d
21,084
d
2013 d 23,312 h d a Counts are considered minimal because data listed include both poor and good surveys. b Includes spawner counts on the Kelly, Kugurorok, and Nimiuktuk rivers, and tributaries of the Noatak River. c Surveys conducted by Division of Sport Fish. d Not surveyed. e Poor weather hampered or prevented survey. f Poor conditions on the Nimiuktuk did not allow a count. g Spawning survey conducted very early (8/20/03). h Counting conditions were poor due to presence of river ice.
180

Appendix F8.–Subsistence whitefish catch and effort in the Kotzebue District, 1991–1993, 1997–2004, and 2012–2013.
Number of Number of Average
fishermen
whitefish catch per
Year a interviewed harvested fisherman 1991 b 63
16,015 254
1992 b 66
17,485 265 1993 b 70
19,060 272
1997 413 c 84,851 205 1998 435 c 39,754 91 1999 191 c 56,326 295 2000 237 c 70,097 296 2001 363 c 30,976 85 2002 101 d 25,607 254 2003 446
73,242 164
2004 440 c 50,501 115
2012 360 c 41,229 115 2013 Information is not yet available
Note: Subsistence surveys were not conducted from 1994 to 1996 and from 2005 to 2011. a Whitefish harvest information was collected during chum salmon subsistence surveys and is considered a fraction of the
annual catch. Whitefish numbers include all species of whitefish, except sheefish. b Subsistence interviews from Noatak, Noorvik, and Shungnak villages only. c Subsistence harvest information is from Ambler, Kiana, Kobuk, Noatak, Noorvik, and Shungnak. d Subsistence harvest information is from Noatak and Noorvik.
181

Appendix F9.–Norton Sound District winter commercial whitefish harvest statistics, 2007–2013.
Number of Total Price per Estimated Year a fishermen pounds pound ($) value ($)
2006–2007 1 3,723 0.44 2,635 2007–2008 b
2008–2009 b 2009–2010 b 2010–2011 1 2,009 0.50 1,005
2011–2012 1 2,148 0.50 859 2012–2013 2 105 0.50 53
a Season was from September 15 to June 15. Confidentiality was waived by fishermen. b No reported sales.
Appendix F10.–Norton Sound District winter commercial saffron cod harvest statistics, 1994–1995 and 2010–2013.
Number of Total Price per Estimated Year a fishermen pounds pound ($) value ($)
1993–1994 b 1,402 b b 1994–1995 b 52 0.50 26
2009–2010 c 1 1,748 0.30 524 2010–2011 5 8,031 0.50 4,016 2011–2012 9 3,780 0.47 1,772 2012–2013 25 33,939 0.50 16,970
a Season was from September 15 to June 15. b Information is not available. c Confidentiality was waived by the fisherman.
182

APPENDIX G: OVERVIEW OF 2013
183

Appendix G1.–List of common and scientific names of finfish species of the Norton Sound, Port Clarence, Kotzebue, and Arctic Districts.
Common Name Scientific Name
Arctic lamprey Lampetra camtschatica Arctic char Salvelinus alpinus Arctic cod Boreogadus saida Arctic flounder Liopsetta glacialis Arctic grayling Thymallus arcticus Alaska plaice Pleuronectes quadrituberculatus Burbot Lota lota Bering cisco Coregonus laurettae Bering poacher Ocella dodecaedria Bering wolfish Anarjicas orientalis Blackfish Dallia pectoralis Boreal smelt (rainbow-toothed) Osmerus mordax Broad whitefish Coregonus nasus Capelin Mallotus villosus Dolly Varden Salvinus malma Pond smelt Hypomesus olidus Humpback whitefish Coregonus pidschian Inconnu (sheefish) Stenodus leucichthys Lake trout Salvelinus namaycush Least cisco Coregonus sardinella Longhead dab Liranda probiscidea Ringtail snailfish Liparis rutteri Northern Pike Esox lucius Longnose sucker Casostomus catostomus Pricklebacks Stichaeidae Pacific herring Clupea harengus pallasii Rock flounder Lepidosetta bilineata Rock greenling (terpug) Hexagrammus lagocephalus Round whitefish Prosopium cylindraceum Sculpins Cottodae Pink salmon Oncorhynchus gorbuscha Chum salmon Oncorhynchus keta Coho salmon Oncorhynchus kisutch Sockeye salmon Oncorhynchus nerka Chinook salmon Oncorhynchus tshawytscha Saffron cod Eleginus gracilis Starry flounder Platichthys stellatus Sandlance Amrodytes hexapterus Sturgeon poacher Angonus acipenserinus Threespine stickleback Gasterocteus aculeatus Ninespine stickleback Pungitius pungitius Tubenose poacher Pallasina barbata aix Whitespotted greenling Hexagrammus stelleri Yellowfin sole Limanda aspera
184

Appendix G2.–Alaska Department of Fish and Game and associated cooperative studies conducted within the Norton Sound, Port Clarence, Kotzebue and Arctic Districts, 2013.
HERRING
Herring Test Fishing a) Location: Norton Sound ocean waters, with field camp at Cape Denbigh, and base camp in
Unalakleet. b) Description: To determine age class composition through test fishing with variable mesh-gillnets and
collection of commercial catch samples. Alaska Department of Fish and Game (ADF&G) project.
SALMON
Eldorado River Weir a) Location: Eldorado River, approximately 15 miles upstream from the Safety Sound highway
bridge, and approximately 3 miles above the furthest upstream connecting channel to the Flambeau River.
b) Description: Determine daily and seasonal timing and magnitude of chum and pink salmon escapements. Collect age, sex, and length data from chum salmon from weir trap. Cooperative project operated by NSEDC with assistance from ADF&G.
Glacial Lake Weir and Video Enumeration Project
a) Location: At outlet of Glacial Lake. b) Description: Determine daily and seasonal timing and magnitude of sockeye salmon escapement.
Compare aerial survey totals with weir counts in order to improve survey accuracy. Weir is cooperative project operated by ADF&G with assistance from NSEDC. Video project is operated by ADF&G.
Inglutalik River Tower
a) Location: Inglutalik River, approximately 18 miles upstream from the mouth at Norton Bay. b) Description: Determine daily and seasonal timing and magnitude of Chinook, chum, pink, and coho
salmon escapements. Collect age, sex, and length data from Chinook, chum, and coho salmon from beach seine. Cooperative project operated by NSEDC with assistance from ADF&G.
Kwiniuk River Tower
a) Location: Kwiniuk River, approximately five miles upstream from mouth. b) Description: Determine daily and seasonal timing and magnitude of salmon escapements. Determine
age, sex, and length of Chinook and chum salmon in the Kwiniuk River escapement from beach seining. ADF&G project with additional funding from NSEDC.
Nome River Weir
a) Location: Nome River, approximately one mile upstream of the VOR site. b) Description: To determine daily and seasonal timing and magnitude of salmon escapement. Compare
aerial survey totals with weir counts in order to improve survey accuracy. Collect age and sex data through escapement sampling of weir trap. ADF&G project with additional funding from NSEDC.
North River Tower
a) Location: North River, approximately two miles below bridge. b) Description: Determine daily and seasonal timing and magnitude of salmon escapements. Cooperative
project operated by NSEDC with assistance from ADF&G.
-continued-
185

Appendix G2.–Page 2 of 3.
Pilgrim River Weir a) Location: Pilgrim River, approximately six miles downstream of Pilgrim River bridge at mile 65 of
the Kougarok Road / Nome–Taylor Highway. b) Description: Determine daily and seasonal timing and magnitude of the salmon escapements. Collect
age, sex, and length data from weir trap. Cooperative project operated by NSEDC with assistance from ADF&G.
Snake River Weir
a) Location: Snake River, approximately five miles upstream of boat harbor, where river turns north. b) Description: Determine daily and seasonal timing and magnitude of salmon escapements. Cooperative
project operated by ADF&G and NSEDC. Solomon River Weir
a) Location: Solomon River, at approximately mile 35.5 on the Nome-Council road. b) Description: Determine daily and seasonal timing and magnitude of salmon escapements. ADF&G
project. Unalakleet River Weir
a) Location: Unalakleet River, approximately 15 miles upstream from village of Unalakleet. b) Description: Determine daily and seasonal timing and magnitude of Chinook, chum, and pink
escapements. Collect age, sex, and length data from Chinook and chum salmon from weir trap. Cooperative ADF&G, BLM, NSEDC, and Unalakleet IRA project.
Kobuk River Test Fish
a) Location: Lower Kobuk River, approximately two miles downriver of Kiana. b) Description: Evaluate chum salmon abundance migrating into the Kobuk River drainage using
systematic drift gillnet catches and qualitatively assess the impact of the Kotzebue District commercial salmon fishery on chum abundance into the Kobuk River drainage for fisheries management purposes. Describe migratory timing in the lower Kobuk River. Sample for age, sex, and length. ADF&G project.
Salmon Lake Limnology Project / Sockeye Salmon Restoration
a) Location: Salmon Lake, throughout; and smolt trap two miles downstream from lake, on Pilgrim River.
b) Description: Restore sockeye salmon population to higher historical levels. Biological (age, weight, and length) samples taken from emigrating smolt and enumerated by mark–recapture. Hydroacoustic-tow net studies conducted to estimate rearing fry population and gather growth data. Fertilization of Salmon Lake. NSEDC project.
Subsistence Salmon Fishing Surveys
a) Location: Norton Sound District. b) Description: Determine subsistence utilization of salmon for formulating management procedures and
goals. Subsistence salmon permits were issued in northern Norton Sound and Port Clarence District by Commercial Fisheries Division. Koyuk, Shaktoolik, and Unalakleet were also surveyed by Commercial Fisheries Division. ADF&G project.
-continued-
186
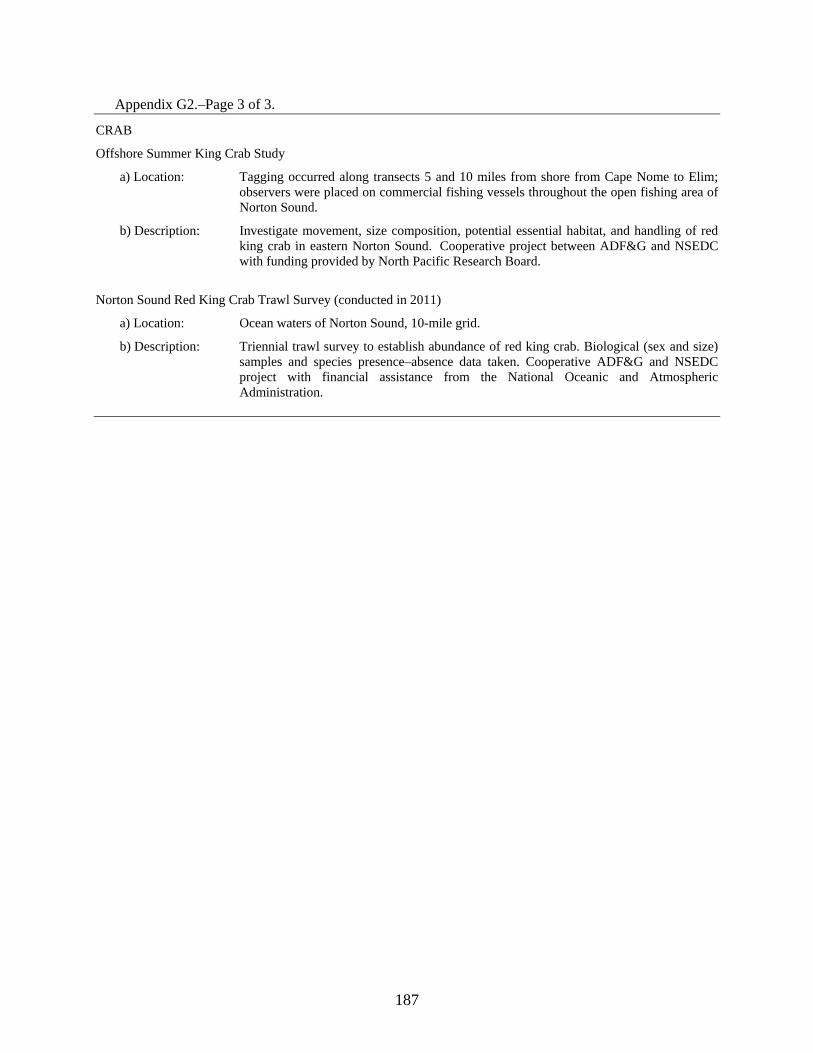
Appendix G2.–Page 3 of 3.
CRAB
Offshore Summer King Crab Study
a) Location: Tagging occurred along transects 5 and 10 miles from shore from Cape Nome to Elim; observers were placed on commercial fishing vessels throughout the open fishing area of Norton Sound.
b) Description: Investigate movement, size composition, potential essential habitat, and handling of red king crab in eastern Norton Sound. Cooperative project between ADF&G and NSEDC with funding provided by North Pacific Research Board.
Norton Sound Red King Crab Trawl Survey (conducted in 2011)
a) Location: Ocean waters of Norton Sound, 10-mile grid.
b) Description: Triennial trawl survey to establish abundance of red king crab. Biological (sex and size) samples and species presence–absence data taken. Cooperative ADF&G and NSEDC project with financial assistance from the National Oceanic and Atmospheric Administration.
187
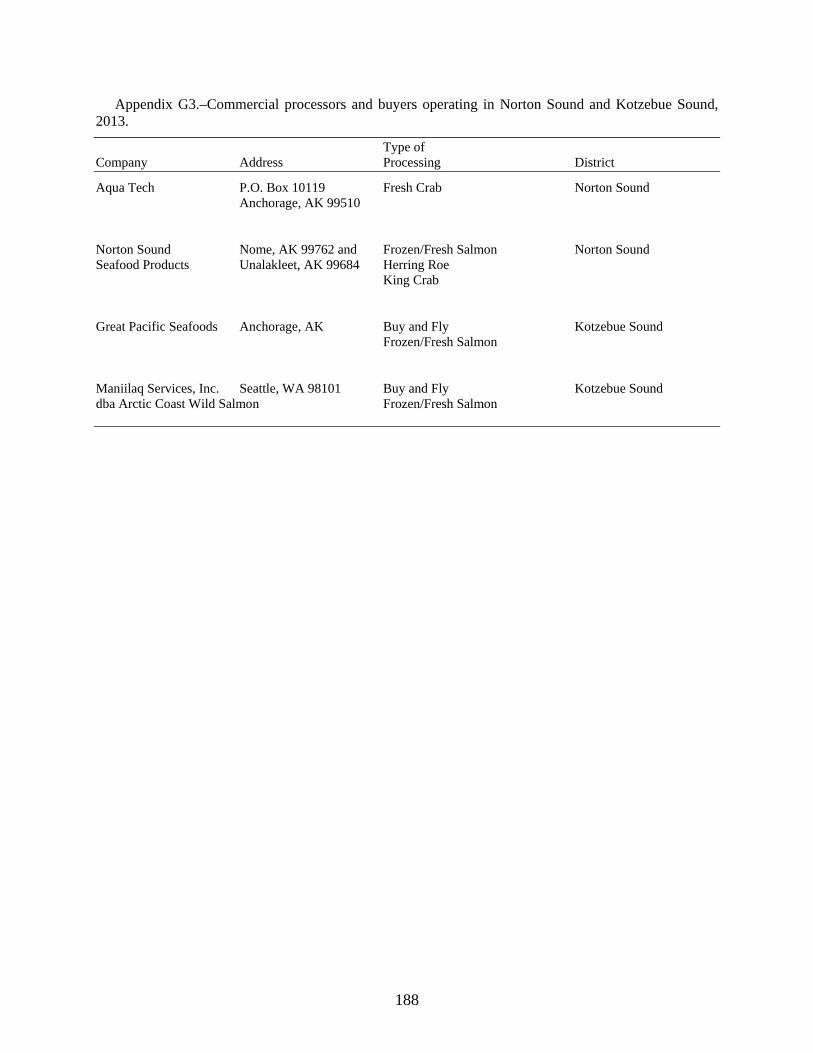
Appendix G3.–Commercial processors and buyers operating in Norton Sound and Kotzebue Sound, 2013.
Type of Company Address Processing District
Aqua Tech P.O. Box 10119 Fresh Crab Norton Sound Anchorage, AK 99510
Norton Sound Nome, AK 99762 and Frozen/Fresh Salmon Norton Sound Seafood Products Unalakleet, AK 99684 Herring Roe King Crab
Great Pacific Seafoods Anchorage, AK Buy and Fly Kotzebue Sound Frozen/Fresh Salmon
Maniilaq Services, Inc. Seattle, WA 98101 Buy and Fly Kotzebue Sound dba Arctic Coast Wild Salmon Frozen/Fresh Salmon
188

Appendix G4.–Unalakleet subsistence salmon harvest survey form, 2013.
NORTON SOUND 2013 SUBSISTENCE SALMON HARVEST SURVEY Community ID# 357
Alaska Department of Fish and Game
Household ID#________
Community: UNALAKLEET
Survey Date:
Household Size: _______
Interviewer:
(If new household) PO Box:_______
Household participation is voluntary. Individual household data will not be released without permission of household head.
1. Did your household fish for salmon for subsistence use this year? (Include fishing with a rod and reel) YES NO
2. Does your household usually subsistence fish for salmon? YES NO
FOR SALMON FISHING HOUSEHOLDS ONLY ("Yes" to #1) 3. Please estimate how many salmon your household caught for subsistence use this year, including with a
rod and reel. It is important not to double count fish harvests. Report only your share of the catch if fishing with others. Include salmon you gave away, ate fresh, fed to dogs, lost to spoilage, or obtained from helping others process fish.
NUMBER OF SALMON
YOUR HOUSEHOLD HARVESTED
NUMBER OF SALMON
(BY GEAR TYPE)
YOUR HOUSEHOLD HARVESTED
SUBSISTENCE ROD
(BY LOCATION)
GILL NET &
or SEINE REEL MARINE UNALAKLEET NORTH
SPECIES (Number of fish) (Number of fish) WATERS RIVER RIVER CHUM SALMON
Dog
CHINOOK SALMON
King
PINK SALMON
Humpy
SOCKEYE SALMON
Red
COHO SALMON
Silver
4. Comments or Suggestions?
189

Appendix G5.–Shaktoolik subsistence salmon harvest survey form, 2013.
NORTON SOUND 2013 SUBSISTENCE SALMON HARVEST SURVEY Community ID# 307
Alaska Department of Fish and Game-
Household ID#________
Community: SHAKTOOLIK
Survey Date:
Household Size: _______
Interviewer:
(If new household) PO Box:_______
Household participation is voluntary. Individual household data will not be released without permission of household head.
1. Did your household fish for salmon for subsistence use this year? (Include fishing with a rod and reel) YES NO
2. Does your household usually subsistence fish for salmon? YES NO
FOR SALMON FISHING HOUSEHOLDS ONLY ("Yes" to #1) 3. Please estimate how many salmon your household caught for subsistence use this year, including with a
rod and reel. It is important not to double count fish harvests. Report only your share of the catch if fishing with others. Include salmon you gave away, ate fresh, fed to dogs, lost to spoilage, or obtained from helping others process fish.
NUMBER OF SALMON
YOUR HOUSEHOLD HARVESTED
NUMBER OF SALMON
(BY GEAR TYPE)
YOUR HOUSEHOLD HARVESTED
SUBSISTENCE ROD
(BY LOCATION)
GILL NET &
or SEINE REEL MARINE SHAKTOOLIK
SPECIES (Number of fish) (Number of fish) WATERS RIVER CHUM SALMON
Dog
CHINOOK SALMON
King
PINK SALMON
Humpy
SOCKEYE SALMON
Red
COHO SALMON
Silver
4. Comments or Suggestions?
190

Appendix G6.–Koyuk Subdistrict subsistence salmon harvest survey form, 2013.
NORTON SOUND 2013 SUBSISTENCE SALMON HARVEST SURVEY Community ID# 204
Alaska Department of Fish and Game- Household ID#________
Community: KOYUK
Survey Date:
Household Size: _______
Interviewer:
(If new household) PO Box:_______
Household participation is voluntary. Individual household data will not be released without permission of household head.
1. Did your household fish for salmon for subsistence use this year? (Include fishing with a rod and reel) YES
NO
2. Does your household usually subsistence fish for salmon? YES NO
FOR SALMON FISHING HOUSEHOLDS ONLY ("Yes" to #1)
3. Please estimate how many salmon your household caught for subsistence use this year, including with a rod and reel. It is important not to double count fish harvests. Report only your share of the catch if fishing with others. Include salmon you gave away, ate fresh, fed to dogs, lost to spoilage, or obtained from helping others process fish.
NUMBER OF SALMON
YOUR HOUSEHOLD HARVESTED
NUMBER OF SALMON
(BY GEAR TYPE)
YOUR HOUSEHOLD HARVESTED
SUBSISTENCE ROD
(BY LOCATION)
GILL NET &
or SEINE REEL MARINE KOYUK INGLUTALIK UNGALIK
SPECIES (Number of fish) (Number of fish) WATERS RIVER RIVER RIVER CHUM
Dog
CHINOOK
King
PINK
Humpy
SOCKEYE
Red
COHO
Silver
4. Comments or Suggestions?
191

Appendix G7.–Emergency Orders issued during 2013.
RED KING CRAB
Emergency Order: 3-C-Z-01-13 Effective Date: July 3, 2013
EXPLANATION: This emergency order opens both the CDQ fishery and the commercial open access crab fishery in Norton Sound from 12:00 noon Wednesday, July 3 until 12:00 noon Monday, September 2, or when the CDQ and the open access quota is reached.
JUSTIFICATION: By regulation the open access king crab fishery can open anytime on or after June 15 by Emergency Order. Currently two land-based processor-buyers are registered and both buyers are ready to purchase open access crab. The guideline harvest level for the 2013 Norton Sound open access fishery is 458,430 pounds. By regulation the CDQ crab fishery can open anytime the CDQ group is ready to harvest the crab. The CDQ crab can only be harvested by permit holders approved by Norton Sound Economic Development Corporation and the quota is 37,170 pounds. The CDQ group has notified the department they are ready to harvest crab.
Emergency Order: 3-C-Z-02-13 Effective Date: August 1, 2013
EXPLANATION: This emergency order moves the closed boundary line between 166°15’W (Sledge Island) and 163°30’W (near Square Rock) north by 3 miles, to 64°18’N from the current 64°15’N. JUSTIFICATION: As of July 30, approximately 145,000 pounds have been harvested out of the total GHL of 495,600 pounds. Based on the current catch rate, the GHL is projected to be reached in mid- to late-September. The department is reducing the area closed to commercial crab fishermen by an incremental amount in order to give fishermen access to additional fishing grounds so they can more efficiently harvest the allowable quota of red king crab. Analysis of results from the spring tagging project and known distribution patterns from trawl surveys suggests this expanded area will allow additional access to legal king crab while minimizing handling of non-target king crab such as females and juvenile crab. Due to the particularly large biomass of crab available for all fisheries, this small increase in area available to commercial harvest is not expected to adversely impact the subsistence king crab fisheries or the future health of the king crab population.
Emergency Order: 3-C-Z-03-13 Effective Date: August 7, 2013
EXPLANATION: This emergency order moves the closed boundary line between 162°38’W (Carson Creek) and 162°W (the eastern border of statistical area 626401) north by 5 miles to 64°15’N from the current 64°10’N. Additionally, the closure line between 162°W and 161°30’W (Cape Denbigh) will be moved north, by 3 miles to 64°18’N from the current 64°15’N.
JUSTIFICATION: As of August 6, approximately 191,000 pounds have been harvested out of the total GHL of 495,600 pounds. Based on the current catch rate, the GHL is projected to be reached in mid- to late-September. The department is reducing the area on the east side of Norton Sound closed to commercial crab fishermen by an incremental amount in order to give east side fishermen access to additional fishing grounds so they can more efficiently harvest the allowable quota of red king crab. Results from the spring tagging project indicate this newly opened area is likely to have an appreciable amount of large male red king crab.
Emergency Order: 3-C-Z-04-13 Effective Date: September 3, 2013
EXPLANATION: This emergency order extends both the CDQ fishery and the commercial open access crab fishery in Norton Sound from 12:00 noon Tuesday, September 3 until 12:00 noon Tuesday, September 10, unless there are conservation concerns or there is no longer any buyer interest. In addition, the closed boundary line between 166°15’W (Sledge Island) and 163°30’W (near Square Rock) that was moved north by 3 miles, to 64°18’N from 64°15’N on August 1, will remain at 64°18’N. The closed boundary line between 162°38’W (Carson Creek) and 162°W (the eastern border of statistical area 626401) that was moved north by 5 miles to 64°15’N from 64°10’N, and the closure line between 162°W and 161°30’W (Cape Denbigh) that was moved north by 3 miles to 64°18’N
-continued-
192

Appendix G7.–Page 2 of 34.
from 64°15’N on August 7, will both remain at the new location until September 10.
JUSTIFICATION: Currently four processor-buyers are registered and most buyers continue to be interested in purchasing open access crab. The guideline harvest level for the 2013 Norton Sound open access fishery is 458,430 pounds and for the CDQ fishery, the quota is 37,170 pounds. Through the morning of September 3, total reported open access harvest is ~289,800 pounds, and total CDQ harvest is 13,480 pounds. Roughly 168,600 pounds remain of the open access quota and 23,690 pounds remain of the CDQ quota. Based on the current catch rate, the GHL is not expected to be reached this year. However, the season is being extended to provide fishermen with additional harvest opportunity on the remaining quotas unless there are indications that crab are molting. In 2009, during a similar temperature regime to this current year, molting crab began appearing in the harvest during mid-September. Therefore, the fishery may be able to extend for an additional week without harvesting appreciable quantities of molting crab.
Emergency Order: 3-C-Z-05-13 Effective Date: September 10, 2013
EXPLANATION: This emergency order extends both the CDQ fishery and the commercial open access crab fishery in Norton Sound from 12:00 noon Tuesday, September 10 until 6:00 PM Friday, September 13, unless there are conservation concerns or there is no longer any buyer interest. In addition, the closed boundary line between 166°15’W (Sledge Island) and 163°30’W (near Square Rock) that was moved north by 3 miles, to 64°18’N from 64°15’N on August 1, will remain at 64°18’N. The closed boundary line between 162°38’W (Carson Creek) and 162°W (the eastern border of statistical area 626401) that was moved north by 5 miles to 64°15’N from 64°10’N, and the closure line between 162°W and 161°30’W (Cape Denbigh) that was moved north by 3 miles to 64°18’N from 64°15’N on August 7, will both remain at the new location until September 13.
JUSTIFICATION: Currently four processor-buyers are registered and all buyers continue to be interested in purchasing crab. The guideline harvest level for the 2013 Norton Sound open access fishery is 458,430 pounds and for the CDQ fishery, the quota is 37,170 pounds. Through the morning of September 10, total reported open access harvest is ~336,100 pounds, and total CDQ harvest is 16,252 pounds. Roughly 122,300 pounds remain of the open access quota and 20,918 pounds remain of the CDQ quota. The GHL will not be reached this year. However, the season is being extended again to provide fishermen with additional harvest opportunity on the remaining quotas. A handful of newly molted crab has shown up in the commercial fishery, but meat fill samples from the major buyer have remained consistent in the 60-70% range by weight since early August. Therefore, the fishery may be able to extend for an additional 3 days without harvesting appreciable quantities of molting crab.
Emergency Order: 3-C-Z-06-13 Effective Date: September 13, 2013
EXPLANATION: This emergency order extends by one day the Norton Sound CDQ and commercial open access king crab fishery, which will close at 6:00PM on Saturday, September 14. Permit holders must have all pots unbaited and secured open by 6:00PM, Saturday, September 14 and all pots must be removed from the water by Saturday, September 21, 2013.
JUSTIFICATION: The guideline harvest level for the 2013 Norton Sound king crab fishery of 495,600 pounds will not be reached. However, because of sudden adverse marine conditions, the commercial open access and CDQ king crab fishery in Norton Sound originally scheduled to close at 6:00 PM Friday, September 13 will now have fishing time extended to 6:00 PM Saturday, September 14. All pot gear must have doors open and bait containers removed by 6:00 PM Saturday, September 14. All crab must be delivered by 6:00 PM Sunday, September 15 and all crab gear used in the commercial fishery must be out of the water by Saturday, September 21. Weather is expected to lay down by Saturday morning.
HERRING Emergency Order: 3-H-Z-1-13 Effective Date: June 7, 2013
EXPLANATION: This emergency order opens the Norton Sound District to commercial gillnet fishing for sac roe herring beginning 6:00 p.m. Friday, June 7, 2013 until Monday, July 1, 2013, unless superseded by another
-continued-
193

Appendix G7.–Page 3 of 34.
emergency order.
JUSTIFICATION: As of this morning, water temperatures between 5–6 degrees Celsius have been recorded amidst the floating ice and farther away from melt water plumes, water temperatures as high as 7 degrees have been observed. Approximately 50 tons of herring were also observed by NSEDC biologists on June 5 near Cape Denbigh. Taken collectively, all available assessment information suggests that large schools of ripe herring are accumulating offshore in deeper, relatively warm water, but will soon approach the southeastern Norton Sound coastline to spawn in abundance, possibly as early as this weekend. Once major spawning begins, excellent catch rates with high roe recovery are expected in the fishery for 2–4 days, which will be followed by a sharp decline in catch rates and percent roe as the larger, older age-class herring vacate the spawning grounds. Any herring not purchased by the buyer must be retained for personal or subsistence uses.
KOTZEBUE SALMON Emergency Order: 3-S-X-01-13 Effective Date: July 10, 2013
EXPLANATION: This emergency order opens commercial salmon fishing in the Kotzebue District for 8 hours from the hours of 8 p.m. Wednesday, July 10 until 4 a.m. Thursday, July 11.
JUSTIFICATION: One major commercial salmon buyer has registered to purchase Kotzebue chum salmon this season. The buyer has limited quantities of ice and airline schedules will affect the buyer’s ability to ship fish out. Regulation allows the season to be open from July 10 through August 31. The buyer has notified the department that they would like to begin purchasing fish on the evening of July 10. This 8 hour opening will serve as test of earlier run strength.
Emergency Order: 3-S-X-02-13 Effective Date: July 11, 2013
EXPLANATION: This emergency order opens commercial salmon fishing in the Kotzebue District for 6 hours from the hours of 8 p.m. Thursday, July 11 until 2 a.m. Friday, July 12.
JUSTIFICATION: The first commercial salmon fishing period of the season was 8 hours last night and 10 permit holders caught 1,360 chum salmon. The catch was average for this date. Continuing with short duration commercial openings should not jeopardize subsistence opportunity or escapement.
Emergency Order: 3-S-X-03-13 Effective Date: July 12, 2013
EXPLANATION: This emergency order opens commercial salmon fishing in the Kotzebue District for 8 hours from the hours of 6 p.m. Friday, July 12 until 2 a.m. Saturday, July 13.
JUSTIFICATION: The second commercial salmon fishing period of the season was 6 hours last night and 12 permit holders caught 1,535 chum salmon. The catch was average for this date. Continuing with short duration commercial openings should not jeopardize subsistence opportunity or escapement.
Emergency Order: 3-S-X-04-13 Effective Date: July 13, 2013
EXPLANATION: This emergency order opens commercial salmon fishing in the Kotzebue District from the hours of 8 a.m. to 1 p.m. daily beginning on Saturday, July 13 until 1 p.m. Saturday, July 20.
JUSTIFICATION: There is a small market buyer interested in buying salmon from one permit holder. Compared to the normal fishing effort of over 30 permit holders during some periods during this time last year the small effort should not jeopardize making escapement goals or subsistence opportunity.
Emergency Order: 3-S-X-05-13 Effective Date: July 14, 2013
-continued-
194

Appendix G7.–Page 4 of 34.
EXPLANATION: This emergency order opens commercial salmon fishing in the Kotzebue District for 8 hours from the hours of 6 p.m. Sunday, July 14 until 2 a.m. Monday, July 15.
JUSTIFICATION: The third commercial salmon fishing period of the season was 8 hours Friday night and 9 permit holders caught 2,368 chum salmon. The catch was average for this date. Continuing with short duration commercial openings should not jeopardize subsistence opportunity or escapement.
Emergency Order: 3-S-X-06-13 Effective Date: July 15, 2013
EXPLANATION: This emergency order opens commercial salmon fishing in the Kotzebue District for 8 hours from the hours of 6 p.m. Monday, July 15 until 2 a.m. Tuesday, July 16.
JUSTIFICATION: The fourth commercial salmon fishing period of the season was 8 hours Sunday night and 10 permit holders caught 2,077 chum salmon. The catch was average for this date. Continuing with short duration commercial openings should not jeopardize subsistence opportunity or escapement.
Emergency Order: 3-S-X-07-13 Effective Date: July 16, 2013
EXPLANATION: This emergency order opens commercial salmon fishing in the Kotzebue District for 8 hours from the hours of 6 p.m. Tuesday, July 16 until 2 a.m. Wednesday, July 17.
JUSTIFICATION: The fifth commercial salmon fishing period of the season was 8 hours Monday night and 17 permit holders caught 2,038 chum salmon. The catch was average for this date. Continuing with short duration commercial openings should not jeopardize subsistence opportunity or escapement.
Emergency Order: 3-S-X-08-13 Effective Date: July 17, 2013
EXPLANATION: This emergency order opens commercial salmon fishing in the Kotzebue District for 8 hours from the hours of 6 p.m. Wednesday, July 17 until 2 a.m. Thursday, July 18.
JUSTIFICATION: The sixth commercial salmon fishing period of the season was 8 hours Tuesday night and 18 permit holders caught 5,994 chum salmon. The catch was more than double the previous 8-hour opening, but was average for this date. Usually commercial catch jumps up the in mid-July and will continue to build until early August during normal run timing years. Continuing with short duration commercial openings should not jeopardize subsistence opportunity or escapement.
Emergency Order: 3-S-X-09-13 Effective Date: July 18, 2013
EXPLANATION: This emergency order opens commercial salmon fishing in the Kotzebue District for 8 hours from the hours of 6 p.m. Thursday, July 18 until 2 a.m. Friday, July 19.
JUSTIFICATION: The seventh commercial salmon fishing period of the season was 8 hours Wednesday night and 23 permit holders caught 4,908 chum salmon. The catch was average for this date. The cumulative catch is now over 20,000 chum salmon. Continuing with short duration commercial openings should not jeopardize subsistence opportunity or escapement.
Emergency Order: 3-S-X-10-13 Effective Date: July 19, 2013
EXPLANATION: This emergency order opens commercial salmon fishing in the Kotzebue District for 4 hours from the hours of 8 p.m. Friday, July 19 until 12 a.m. Saturday, July 20.
JUSTIFICATION: The eighth commercial salmon fishing period of the season was 8 hours Thursday night and 29 permit holders caught 10,476 chum salmon. Usually during the second week of July the catch often does jump to 10,000 plus fish. The cumulative catch is now over 30,000 chum salmon. Continuing with short duration commercial openings should not jeopardize subsistence opportunity or escapement.
-continued-
195

Appendix G7.–Page 5 of 34.
Emergency Order: 3-S-X-11-13 Effective Date: July 21, 2013
EXPLANATION: This emergency order opens commercial salmon fishing in the Kotzebue District from the hours of 7 a.m. to 1 p.m. daily beginning on Sunday, July 21 until 1 p.m. Saturday, July 27.
JUSTIFICATION: There is a small market buyer interested in buying salmon from one permit holder. Compared to the normal fishing effort of over 30 permit holders during some periods during this time last year the small effort should not jeopardize making escapement goals or subsistence opportunity.
Emergency Order: 3-S-X-12-13 Effective Date: July 21, 2013
EXPLANATION: This emergency order opens commercial salmon fishing in the Kotzebue District for 6 hours from the hours of 8 p.m. Sunday, July 21 until 2 a.m. Monday, July 22.
JUSTIFICATION: The ninth commercial salmon fishing period of the season was 4 hours Friday night and 26 permit holders caught 6,013 chum salmon. Increasing run strength necessitated the buyer to reduce fishing time from 8 hours to 4 hours. Because the run is building normally the buyer has capacity concerns and will likely continue with openings less than 8 hours. The Kobuk River test fishing project has been operational since Wednesday with catches better than last year over the same time period. Last year’s season catch index ranked third out of 20 years. Continuing with short duration commercial openings should not jeopardize subsistence opportunity or escapement.
Emergency Order: 3-S-X-13-13 Effective Date: July 22, 2013
EXPLANATION: This emergency order opens commercial salmon fishing in the Kotzebue District for 6 hours from the hours of 8 p.m. Monday, July 22 until 2 a.m. Tuesday, July 23.
JUSTIFICATION: The tenth commercial salmon fishing period of the season was 6 hours Sunday night and 33 permit holders caught 5,586 chum salmon. The Kobuk River test fishing project has been operational since Wednesday with catches better than last year over the same time period. Last year’s season catch index ranked third out of 20 years. Continuing with short duration commercial openings should not jeopardize subsistence opportunity or escapement.
Emergency Order: 3-S-X-14-13 Effective Date: July 23, 2013
EXPLANATION: This emergency order opens commercial salmon fishing in the Kotzebue District for 6 hours from the hours of 6 p.m. Tuesday, July 23 until 12 a.m. Wednesday, July 24.
JUSTIFICATION: The eleventh commercial salmon fishing period of the season was 6 hours Monday night and 34 permit holders caught 6,216 chum salmon. Catch and fishing effort were average for this time period. Continuing with short duration commercial openings should not jeopardize subsistence opportunity or escapement.
Emergency Order: 3-S-X-15-13 Effective Date: July 24, 2013
EXPLANATION: This emergency order opens commercial salmon fishing in the Kotzebue District for 4 hours from the hours of 8 p.m. Wednesday, July 24 until 12 a.m. Thursday, July 25.
JUSTIFICATION: The twelfth commercial salmon fishing period of the season was 4 hours Tuesday night and 38 permit holders caught 17,712 chum salmon. The catch was the second highest catch for one fishing period since a buyer returned to the Kotzebue commercial fishery in 2004. Continuing with short duration commercial openings should not jeopardize subsistence opportunity or escapement.
Emergency Order: 3-S-X-16-13 Effective Date: July 25, 2013
-continued-
196

Appendix G7.–Page 6 of 34.
EXPLANATION: This emergency order opens commercial salmon fishing in the Kotzebue District for 6 hours from the hours of 6 p.m. Thursday, July 25 until 12 a.m. Friday, July 26.
JUSTIFICATION: Catch during last night’s 4-hour opening was 2,683 chum salmon by 9 permit holders. Windy conditions likely resulted in a reduced fishing effort last night. The commercial harvest this season is expected to be within the range of 225,000 to 250,000 chum salmon if market conditions can accept that level of harvest. The total commercial harvest to date is nearly 70,000 chum salmon. Last year by this date the harvest was 60,000 chum salmon and total harvest for the season was nearly 228,000 chum salmon. Continuing with short duration commercial openings should not jeopardize subsistence opportunity or escapement.
Emergency Order: 3-S-X-17-13 Effective Date: July 28, 2013
EXPLANATION: This emergency order opens commercial salmon fishing in the Kotzebue District from the hours of 7 a.m. to 1 p.m. daily beginning on Sunday, July 28 until 1 p.m. Saturday, August 10.
JUSTIFICATION: There is a small market buyer interested in buying salmon from one permit holder. The major buyer is restricting fishing time with the peak weeks of salmon passage now and plans to request fishing openings for limited hours in the evening. Compared to the normal fishing effort of over 30 permit holders during some periods this season the small effort should not jeopardize making escapement goals or subsistence opportunity.
Emergency Order: 3-S-X-18-13 Effective Date: July 26, 2013
EXPLANATION: This emergency order opens commercial salmon fishing in the Kotzebue District for 4 hours from the hours of 6 p.m. until 10 p.m. Friday, July 26.
JUSTIFICATION: Catch during last night’s 6-hour opening was 11,894 chum salmon by 41 permit holders. The commercial harvest this season is expected to be within the range of 225,000 to 250,000 chum salmon if market conditions can accept that level of harvest. The commercial harvest to date is over 80,000 chum salmon. Last year by this date the harvest was 63,000 chum salmon and total harvest for the season was nearly 228,000 chum salmon. Continuing with short duration commercial openings should not jeopardize subsistence opportunity or escapement.
Emergency Order: 3-S-X-19-13 Effective Date: July 28, 2013
EXPLANATION: This emergency order opens commercial salmon fishing in the Kotzebue District for 6 hours from the hours of 6 p.m. Sunday, July 28 until 12 a.m. Monday, July 29.
JUSTIFICATION: Catch during Friday night’s 4-hour opening was 9,083 chum salmon by 40 permit holders. Chum salmon catch index at the department test fish project on Kobuk River near Kiana ranks sixth highest in 21-year project history indicating a good chum salmon run to the Kobuk River system. Continuing with short duration commercial openings should not jeopardize subsistence opportunity or escapement.
Emergency Order: 3-S-X-20-13 Effective Date: July 30, 2013
EXPLANATION: This emergency order opens commercial salmon fishing in the Kotzebue District for 5 hours from the hours of 6 p.m. until 11 p.m. Tuesday, July 30.
JUSTIFICATION: Catch during Sunday night’s 6-hour opening was 17,283 chum salmon by 41 permit holders. Chum salmon catch index at the department test fish project on Kobuk River near Kiana ranks sixth highest in 21-year project history indicating a good chum salmon run to the Kobuk River system. Continuing with short duration commercial openings should not jeopardize subsistence opportunity or escapement.
Emergency Order: 3-S-X-21-13 Effective Date: July 31, 2013
-continued-
197

Appendix G7.–Page 7 of 34.
EXPLANATION: This emergency order opens commercial salmon fishing in the Kotzebue District for 6 hours daily from the hours of 6 p.m. to 12 a.m. beginning on Wednesday, July 31 until 12 a.m. Tuesday, August 6.
JUSTIFICATION: Cumulative test fish catch ranks sixth highest out of 21 years at the Kobuk River test fish project. The cumulative test fish index is expected to reach 600 today and that is the minimum amount needed to ensure escapement and allow continued commercial fishing. Continued short duration openings the coming week should not jeopardize subsistence opportunity.
Emergency Order: 3-S-X-22-13 Effective Date: August 1, 2013
EXPLANATION: This emergency order amends emergency order 3-S-X-21-13 by reducing commercial fishing time from 6 hours to 4 hours for period on Thursday, August 1 in the Kotzebue District. Effective 6:00 p.m. Thursday, August 1, this emergency order reopens the Kotzebue District for 4 hours from 6:00 p.m. to 10:00 p.m. Effective Friday, August 2, this emergency order permits commercial salmon fishing to resume on a fishing schedule of 6 hours a day from 6:00 p.m. to 12:00 midnight, until 12:00 a.m. Tuesday, August 6.
JUSTIFICATION: Cumulative test fish catch ranks sixth highest out of 21 years at the Kobuk River test fish project. The cumulative test fish index is expected to reach 600 today and that is the minimum amount needed to ensure escapement and allow continued commercial fishing. Continued short duration openings the coming week should not jeopardize subsistence opportunity.
Emergency Order: 3-S-X-23-13 Effective Date: August 4, 2013
EXPLANATION: This emergency order amends emergency order 3-S-X-22-13 by reducing commercial fishing time from 6 hours to 4 hours for period on Sunday, August 4 in the Kotzebue District. Effective 6:00 p.m. Sunday, August 4, this emergency order reopens the Kotzebue District for 4 hours from 6:00 p.m. to 10:00 p.m. Effective Monday, August 5, this emergency order permits commercial salmon fishing to resume on a fishing schedule of 6 hours a day from 6:00 p.m. to 12:00 midnight, until 12:00 a.m. Tuesday, August 6.
JUSTIFICATION: Cumulative test fish catch ranks fourth highest out of 21 years at the Kobuk River test fish project. The cumulative test fish index is at 997 index points which is well above the minimum amount (600 points) needed to ensure escapement and allow continued commercial fishing. Continued short duration openings the coming week should not jeopardize subsistence opportunity.
Emergency Order: 3-S-X-24-13 Effective Date: August 5, 2013
EXPLANATION: This emergency order supersedes emergency order 3-S-X-23-13 by reducing commercial fishing time from 6 hours to 4 hours for period on Sunday, August 4 in the Kotzebue District. Effective 6:00 p.m. Sunday, August 4, this emergency order reopens the Kotzebue District for 4 hours from 6:00 p.m. to 10:00 p.m.
JUSTIFICATION: Cumulative test fish catch ranks fourth highest out of 21 years at the Kobuk River test fish project. The cumulative test fish catch has reached 1,100 index points yesterday and that is well above the minimum index of 600 fish needed to ensure escapement and allow continued commercial fishing. Continued short duration openings the coming week should not jeopardize subsistence opportunity.
Emergency Order: 3-S-X-25-13 Effective Date: August 6, 2013
EXPLANATION: This emergency order opens commercial salmon fishing in the Kotzebue District for 4 hours from the hours of 6 p.m. until 10 p.m. Tuesday, August 6.
JUSTIFICATION: Catch during last night’s 4-hour opening was 9,672 chum salmon by 40 permit holders. The commercial harvest this season is tracking ahead the department forecast range of 225,000 to 250,000 chum salmon. The commercial harvest to date is over 165,000 chum salmon. Last year by this date the harvest was 151,000 chum salmon and total harvest for the season was nearly 228,000 chum salmon. Continuing with short duration
-continued-
198

Appendix G7.–Page 8 of 34.
commercial openings should not jeopardize subsistence opportunity or escapement.
Emergency Order: 3-S-X-26-13 Effective Date: August 7, 2013
EXPLANATION: This emergency order opens commercial salmon fishing in the Kotzebue District for 4 hours from the hours of 7 p.m. until 11 p.m. Wednesday, August 7.
JUSTIFICATION: Catch during last night’s 4-hour opening was 7,300 chum salmon by 34 permit holders. The commercial harvest this season is tracking ahead the department forecast range of 225,000 to 250,000 chum salmon. The commercial harvest to date is over 172,000 chum salmon. Last year by this date the harvest was 158,000 chum salmon and total harvest for the season was nearly 228,000 chum salmon. Continuing with short duration commercial openings should not jeopardize subsistence opportunity or escapement.
Emergency Order: 3-S-X-27-13 Effective Date: August 8, 2013
EXPLANATION: This emergency order opens commercial salmon fishing in the Kotzebue District for 4 hours from the hours of 5 p.m. until 9 p.m. Thursday, August 8.
JUSTIFICATION: Catch during last night’s 4-hour opening was 12,427 chum salmon by 41 permit holders. The commercial harvest this season is tracking ahead the department forecast range of 225,000 to 250,000 chum salmon. The commercial harvest to date is over 185,000 chum salmon. Last year by this date the harvest was 175,000 chum salmon and total harvest for the season was nearly 228,000 chum salmon. Continuing with short duration commercial openings should not jeopardize subsistence opportunity or escapement.
Emergency Order: 3-S-X-28-13 Effective Date: August 11, 2013
EXPLANATION: This emergency order opens commercial salmon fishing in the Kotzebue District from the hours of 7 a.m. to 1 p.m. daily beginning on Sunday, August 11 until 1 p.m. Saturday, August 17.
JUSTIFICATION: There is a small market buyer interested in buying salmon from a few permit holders. The major buyer is restricting fishing time with the peak weeks of salmon passage now and plans to request fishing openings for limited hours in the evening. Compared to the normal fishing effort of over 40 permit holders during some periods this season the small effort should not jeopardize making escapement goals or subsistence opportunity.
Emergency Order: 3-S-X-29-13 Effective Date: August 11, 2013
EXPLANATION: This emergency order opens commercial salmon fishing in the Kotzebue District for 4 hours from the hours of 5 p.m. until 9 p.m. Sunday, August 11.
JUSTIFICATION: Catch during Thursday night’s 4-hour opening was 10,875 chum salmon by 43 permit holders. The commercial harvest to date is over 195,000 chum salmon. Last year by this date the harvest was 188,000 chum salmon and total harvest for the season was nearly 228,000 chum salmon. Continuing with short duration commercial openings should not jeopardize subsistence opportunity or escapement.
Emergency Order: 3-S-X-30-13 Effective Date: August 12, 2013
EXPLANATION: This emergency order opens commercial salmon fishing in the Kotzebue District for 4 hours from the hours of 5 p.m. until 9 p.m. Monday, August 12.
JUSTIFICATION: Catch during Sunday night’s 4-hour opening was 11,830 chum salmon by 35 permit holders. The catch was average for this date. The commercial harvest to date is over 208,000 chum salmon. The department forecast was for a commercial harvest of 225,000 to 250,000 chum salmon in 2013. Last year by this date the harvest was 188,000 chum salmon and total harvest for the season was nearly 228,000 chum salmon. Catch at the Kobuk River test fish project continues to be well above average and ranks second best in the 21-year project
-continued-
199
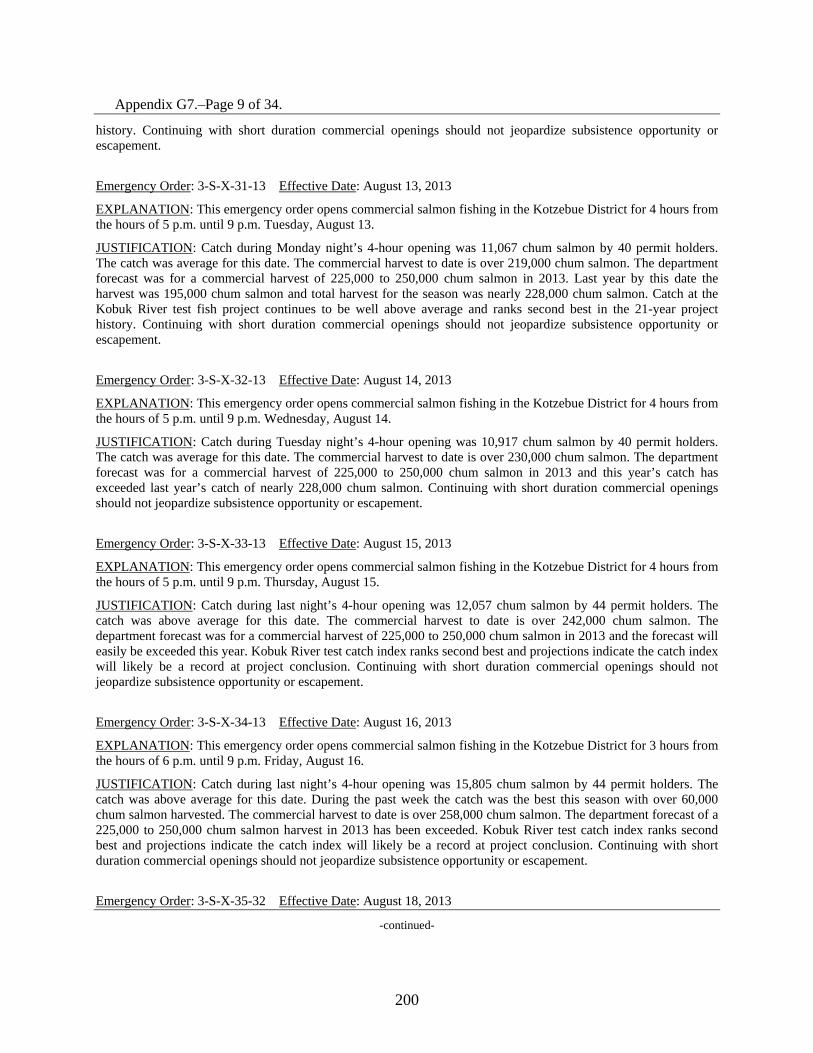
Appendix G7.–Page 9 of 34.
history. Continuing with short duration commercial openings should not jeopardize subsistence opportunity or escapement.
Emergency Order: 3-S-X-31-13 Effective Date: August 13, 2013
EXPLANATION: This emergency order opens commercial salmon fishing in the Kotzebue District for 4 hours from the hours of 5 p.m. until 9 p.m. Tuesday, August 13.
JUSTIFICATION: Catch during Monday night’s 4-hour opening was 11,067 chum salmon by 40 permit holders. The catch was average for this date. The commercial harvest to date is over 219,000 chum salmon. The department forecast was for a commercial harvest of 225,000 to 250,000 chum salmon in 2013. Last year by this date the harvest was 195,000 chum salmon and total harvest for the season was nearly 228,000 chum salmon. Catch at the Kobuk River test fish project continues to be well above average and ranks second best in the 21-year project history. Continuing with short duration commercial openings should not jeopardize subsistence opportunity or escapement.
Emergency Order: 3-S-X-32-13 Effective Date: August 14, 2013
EXPLANATION: This emergency order opens commercial salmon fishing in the Kotzebue District for 4 hours from the hours of 5 p.m. until 9 p.m. Wednesday, August 14.
JUSTIFICATION: Catch during Tuesday night’s 4-hour opening was 10,917 chum salmon by 40 permit holders. The catch was average for this date. The commercial harvest to date is over 230,000 chum salmon. The department forecast was for a commercial harvest of 225,000 to 250,000 chum salmon in 2013 and this year’s catch has exceeded last year’s catch of nearly 228,000 chum salmon. Continuing with short duration commercial openings should not jeopardize subsistence opportunity or escapement.
Emergency Order: 3-S-X-33-13 Effective Date: August 15, 2013
EXPLANATION: This emergency order opens commercial salmon fishing in the Kotzebue District for 4 hours from the hours of 5 p.m. until 9 p.m. Thursday, August 15.
JUSTIFICATION: Catch during last night’s 4-hour opening was 12,057 chum salmon by 44 permit holders. The catch was above average for this date. The commercial harvest to date is over 242,000 chum salmon. The department forecast was for a commercial harvest of 225,000 to 250,000 chum salmon in 2013 and the forecast will easily be exceeded this year. Kobuk River test catch index ranks second best and projections indicate the catch index will likely be a record at project conclusion. Continuing with short duration commercial openings should not jeopardize subsistence opportunity or escapement.
Emergency Order: 3-S-X-34-13 Effective Date: August 16, 2013
EXPLANATION: This emergency order opens commercial salmon fishing in the Kotzebue District for 3 hours from the hours of 6 p.m. until 9 p.m. Friday, August 16.
JUSTIFICATION: Catch during last night’s 4-hour opening was 15,805 chum salmon by 44 permit holders. The catch was above average for this date. During the past week the catch was the best this season with over 60,000 chum salmon harvested. The commercial harvest to date is over 258,000 chum salmon. The department forecast of a 225,000 to 250,000 chum salmon harvest in 2013 has been exceeded. Kobuk River test catch index ranks second best and projections indicate the catch index will likely be a record at project conclusion. Continuing with short duration commercial openings should not jeopardize subsistence opportunity or escapement.
Emergency Order: 3-S-X-35-32 Effective Date: August 18, 2013
-continued-
200

Appendix G7.–Page 10 of 34.
EXPLANATION: This emergency order opens commercial salmon fishing in the Kotzebue District from the hours of 7 a.m. to 1 p.m. daily beginning on Sunday, August 18 until 1 p.m. Saturday, August 24.
JUSTIFICATION: There is a small market buyer interested in buying salmon from a few permit holders. The major buyer is restricting fishing time with the peak week of salmon catch this week and plans to request fishing openings for limited hours in the evening. Compared to the normal fishing effort of over 40 permit holders during some periods this season the small effort should not jeopardize making escapement goals or subsistence opportunity.
Emergency Order: 3-S-X-36-13 Effective Date: August 18, 2013
EXPLANATION: This emergency order opens commercial salmon fishing in the Kotzebue District for 3 hours from the hours of 6 p.m. until 9 p.m. Sunday, August 18.
JUSTIFICATION: Catch during Friday night’s 3-hour opening was 8,385 chum salmon by 38 permit holders. The catch was above average for the time fished. During the past week the catch was the best this season with over 70,000 chum salmon harvested. The commercial harvest to date is over 266,000 chum salmon. The department forecast of a 225,000 to 250,000 chum salmon harvest in 2013 has been exceeded. Kobuk River test catch index ranks second best and projections indicate the catch index will likely be a record at project conclusion. Continuing with short duration commercial openings should not jeopardize subsistence opportunity or escapement.
Emergency Order: 3-S-X-37-13 Effective Date: August 19, 2013
EXPLANATION: This emergency order opens commercial salmon fishing in the Kotzebue District for 2 hours from the hours of 7 p.m. until 9 p.m. Monday, August 19.
JUSTIFICATION: Catch during Sunday night’s 3-hour opening was 9706 chum salmon by 36 permit holders. The catch was above average for this time of the year. The commercial harvest to date is over 276,000 chum salmon and is a record for the 2000s. Kobuk River test catch index ranks second best and projections indicate the catch index be a record by the conclusion test fishing today or tomorrow. Continuing with short duration commercial openings should not jeopardize subsistence opportunity or escapement.
Emergency Order: 3-S-X-38-13 Effective Date: August 20, 2013
EXPLANATION: This emergency order opens commercial salmon fishing in the Kotzebue District for 3 hours from the hours of 6 p.m. until 9 p.m. Tuesday, August 20.
JUSTIFICATION: Catch during Monday night’s 2-hour opening was 4,229 chum salmon by 35 permit holders. The catch was above average for the time fished. The commercial harvest to date is over 280,000 chum salmon. The department forecast of a 225,000 to 250,000 chum salmon harvest in 2013 has been exceeded. Kobuk River test catch index had the best catch index this season in the 21-year project history. Continuing with short duration commercial openings should not jeopardize subsistence opportunity or escapement.
Emergency Order: 3-S-X-39-13 Effective Date: August 21, 2013
EXPLANATION: This emergency order opens commercial salmon fishing in the Kotzebue District for 4 hours from the hours of 5 p.m. until 9 p.m. Wednesday, August 21.
JUSTIFICATION: Catch during Tuesday night’s 3-hour opening was 3,467 chum salmon. The catch was average for the time fished. The commercial harvest to date is over 286,000 chum salmon and has exceeded the department forecast of a 225,000 to 250,000 chum salmon harvest. Kobuk River test catch index had the best catch index this season in the 21-year project history. Continuing with short duration commercial openings should not jeopardize subsistence opportunity or escapement.
-continued-
201

Appendix G7.–Page 11 of 34.
Emergency Order: 3-S-X-40-13 Effective Date: August 22, 2013
EXPLANATION: This emergency order opens commercial salmon fishing in the Kotzebue District for 5 hours from the hours of 4 p.m. until 9 p.m. Thursday, August 22.
JUSTIFICATION: Catch during Wednesday night’s 4-hour opening was nearly 4,000 chum salmon by 23 permit holders. The catch was average for this date. The commercial harvest for the season is nearly 290,000 chum salmon and with the upcoming period will likely push past 291,000 chum salmon harvested making it the best commercial harvest in 25 years. This season’s Kobuk River test catch index has been the best in the 21-year project history. Continuing with short duration commercial openings should not jeopardize subsistence opportunity or escapement.
Emergency Order: 3-S-X-41-13 Effective Date: August 23, 2013
EXPLANATION: This emergency order opens commercial salmon fishing in the Kotzebue District for 5 hours from the hours of 4 p.m. until 9 p.m. Friday, August 23.
JUSTIFICATION: Catch during Thursday night’s 5-hour opening was 7,052 chum salmon by 35 permit holders. The catch was well above average for this date. The commercial harvest for the season is over 296,000 chum salmon and with the upcoming period will likely push past 300,000 chum salmon harvested for only the tenth time in the 52-year history of the fishery. This season’s Kobuk River test catch index has been the best in the 21-year project history. Continuing with short duration commercial openings should not jeopardize subsistence opportunity or escapement.
Emergency Order: 3-S-X-42-13 Effective Date: August 25, 2013
EXPLANATION: This emergency order opens commercial salmon fishing in the Kotzebue District for 5 hours from the hours of 4 p.m. until 9 p.m. Sunday, August 25.
JUSTIFICATION: Catch during Thursday night’s 5-hour opening was 2,973 chum salmon by 16 permit holders. The catch and CPUE was above average for this date. The commercial harvest for the season is over 299,000 chum salmon and with the upcoming period will likely push past 300,000 chum salmon harvested for only the tenth time in the 52-year history of the fishery. This season’s Kobuk River test catch index has been the best in the 21-year project history. Continuing with short duration commercial openings should not jeopardize subsistence opportunity or escapement.
Emergency Order: 3-S-X-43-13 Effective Date: August 26, 2013
EXPLANATION: This emergency order opens commercial salmon fishing in the Kotzebue District for 6 hours from the hours of 3 p.m. until 9 p.m. Monday, August 26.
JUSTIFICATION: Catch during Sunday night’s 5-hour opening was 2,874 chum salmon by 13 permit holders. The catch was average for this date. The commercial harvest for the season is over 300,000 chum salmon and is the best since 1988. The Kobuk River test fishing crew has finished for the season and the chum salmon catch index was the highest in the 21 year project history. Continuing with short duration commercial openings should not jeopardize subsistence opportunity or escapement.
Emergency Order: 3-S-X-44-13 Effective Date: August 27, 2013
EXPLANATION: This emergency order opens commercial salmon fishing in the Kotzebue District for 6 hours, from the hours of 6 a.m. to 12 p.m. daily, beginning on Tuesday, August 27 until 12 p.m. Saturday, August 31.
JUSTIFICATION: There is a small market buyer interested in buying salmon from a few permit holders. The major buyer is buying during a fishing period later in the day. Compared to the normal fishing effort of over 40 permit
-continued-
202

Appendix G7.–Page 12 of 34.
holders during some periods this season the small effort should not jeopardize making escapement goals or subsistence opportunity.
Emergency Order: 3-S-X-45-13 Effective Date: August 27, 2013
EXPLANATION: This emergency order opens commercial salmon fishing in the Kotzebue District for 6 hours from the hours of 3 p.m. until 9 p.m. Tuesday, August 27.
JUSTIFICATION: Catch during Monday night’s 6-hour opening was 392 chum salmon by 6 permit holders. The catch was well below average for this date, but most permit holders were kept on the beach by weather. The commercial harvest for the season is over 300,000 chum salmon and is the best since 1988. The Kobuk River test fishing crew has finished for the season and the chum salmon catch index was the highest in the 21 year project history. Continuing with short duration commercial openings should not jeopardize subsistence opportunity or escapement.
Emergency Order: 3-S-X-46-13 Effective Date: August 28, 2013
EXPLANATION: This emergency order opens commercial salmon fishing in the Kotzebue District for 6 hours from the hours of 3 p.m. until 9 p.m. Wednesday, August 28.
JUSTIFICATION: Catch during Tuesday two 6-hour opening was 2,903 chum salmon. The catch was average for the fished. The commercial harvest for the season is over 300,000 chum salmon and is the best since 1988. Continuing with short duration commercial openings should not jeopardize subsistence opportunity or escapement.
Emergency Order: 3-S-X-47-13 Effective Date: August 29, 2013
EXPLANATION: This emergency order opens commercial salmon fishing in the Kotzebue District for 6 hours from the hours of 12 p.m. until 6 p.m. Thursday, August 29.
JUSTIFICATION: There are two buyers registered in the Kotzebue District and one had requested a six hour morning fishing period and the department had issued a previous emergency order for a six hour fishing period starting at 6 a.m. The second buyer requested a six hour afternoon fishing period. Because the commercial fishing season is winding down and there are no longer any buyer capacity concerns the department is allowing a combined 12 hour fishing period. The commercial harvest for the season is over 300,000 chum salmon and is the best since 1988. The last scheduled day of commercial salmon fishing is August 31. Continuing with short duration commercial openings should not jeopardize subsistence opportunity or escapement.
Emergency Order: 3-S-X-48-13 Effective Date: August 30, 2013
EXPLANATION: This emergency order opens commercial salmon fishing in the Kotzebue District for 6 hours from the hours of 12 p.m. until 6 p.m. Friday, August 30.
JUSTIFICATION: There are two buyers registered in the Kotzebue District and one had requested a six hour morning fishing period and the department had issued a previous emergency order for a six hour fishing period starting at 6 a.m. The second buyer requested a six hour afternoon fishing period. Because the commercial fishing season is winding down and there are no longer any buyer capacity concerns the department is allowing a combined 12 hour fishing period. The commercial harvest for the season is over 300,000 chum salmon and is the best since 1988. The last scheduled day of commercial salmon fishing is August 31. Continuing with short duration commercial openings should not jeopardize subsistence opportunity or escapement.
-continued-
203

Appendix G7.–Page 13 of 34.
NORTON SOUND SALMON Emergency Order: 3-S-Z-01-13 Effective Date: June 15, 2013
EXPLANATION: This emergency order sets the subsistence salmon gillnet fishing schedule for the Nome Subdistrict and catch limits for the Nome Subdistrict (Subdistrict 1), and Pilgrim and Kuzitrin Rivers in the Port Clarence District. The subsistence salmon gillnet schedule will be from 6 p.m. Wednesday until 6 p.m. Saturday in the Nome Subdistrict marine waters west of Cape Nome and the catch limits for all locations are listed on the permits. Beach seines are allowed to be used during the salmon gillnet schedule.
JUSTIFICATION: The department forecast for 2013 is that the chum salmon run will exceed the ANS and Tier II restrictions will not be required. Because of the late spring the department is allowing beach seines to be used to increase the efficiency of the harvest and will reassess the use of beach seines when the peak of the run enters Nome Subdistrict rivers in July. Catch limits are still in effect for the various marine and fresh water subsistence areas. All catch limits are listed on the permits. The department staff will be flying frequent aerial surveys and boating some of the rivers to track the salmon migration strength and progress. The weirs and towers on the Nome, Snake, Eldorado, Solomon and Pilgrim Rivers, will also be used to track the various salmon migrations. If a stream appears to have adequate escapement, catch limits will be lifted in that area.
Emergency Order: 3-S-Z-02-13 Effective Date: June 17, 2013
EXPLANATION: This emergency order closes all marine waters in Norton Sound Subdistricts 5 and 6, the Shaktoolik and Unalakleet Subdistricts to subsistence salmon fishing effective 8:00 a.m. Monday, June 17 and reopens Subdistricts 5 and 6 to subsistence fishing schedules and gear restrictions in Subdistrict 5 until midnight Sunday evening, July 14. Effective 8:00 a.m. Monday, June 17, subsistence salmon fishing will reopen in the marine waters of Subdistrict 5 to a subsistence fishing schedule of two 48-hour periods per week, but will be restricted to set gillnets with a mesh size no greater than 6 inches. Subsistence fishing periods in the Shaktoolik Subdistrict will be from 6:00 p.m. Mondays to 6:00 p.m. Wednesdays, and from 6:00 p.m. Thursdays to 6:00 p.m. Saturdays. Also effective 8:00 a.m. Monday, June 17, the marine waters of Subdistrict 6, the Unalakleet Subdistrict, will reopen to subsistence salmon fishing on a schedule of two 24-hour periods per week. Subsistence fishing periods in the Unalakleet Subdistrict will be from 6:00 p.m. Mondays to 6:00 p.m. Tuesdays and from 6:00 p.m. Fridays to 6:00 p.m. Saturdays.
JUSTIFICATION: Chinook salmon runs to southeastern Norton Sound are expected to be very poor this season. The combined Subdistricts 5 and 6 Chinook salmon run could be as low as 4,500 fish this season, and this level of abundance is not sufficient to justify sport fishery harvests or support historical Chinook salmon harvest rates. These preemptive restrictions are being implemented this season to significantly reduce harvest rates of Chinook salmon and ensure that escapement goals are achieved in the Shaktoolik and Unalakleet River drainages. In addition to restrictions, subsistence users are also strongly encouraged to redirect harvest pressure on other more numerous species this season, such as chum salmon which are anticipated to be abundant in southern Norton Sound. Once the Chinook salmon run begins, inseason management will be based upon escapement counts and subsistence fishing reports. Fishing restrictions may be relaxed or further restrictions may be necessary depending on run assessment.
Emergency Order: 3-S-Z-03-13 Effective Date: June 17, 2013
EXPLANATION: This emergency order closes all fresh waters of the Shaktoolik and Unalakleet River drainages to subsistence salmon fishing effective 8:00 a.m. Monday, June 17, and immediately reopens subsistence fishing in the Shaktoolik and Unalakleet River drainages to subsistence fishing with set gillnets with a mesh size not greater than 4 ½ inches. Additionally, this emergency order establishes a subsistence fishing schedule for the Unalakleet River drainage effective 8:00 a.m. Monday, June 17, of two 36-hour periods per week.
-continued-
204

Appendix G7.–Page 14 of 34.
Effective 8:00 a.m. Monday, June 17, subsistence salmon fishing will reopen in the Shaktoolik River drainage but will be limited to set gillnets with a mesh size no greater than 4 ½ inches. Also effective 8:00 a.m. Monday, June 17, the Unalakleet River drainage will reopen to subsistence salmon fishing on a schedule of two 36-hour periods per week. Subsistence fishing periods in the Unalakleet River drainage will be from 8:00 a.m. Mondays to 8:00 p.m. Tuesdays and from 8:00 a.m. Fridays to 8:00 p.m. Saturdays.
JUSTIFICATION: Chinook salmon runs to southeastern Norton Sound are expected to be very poor this season. The combined Subdistricts 5 and 6 Chinook salmon run could be as low as 4,500 fish this season, and this level of abundance is not sufficient to justify sport fishery harvests or support historical Chinook salmon harvest rates. These preemptive restrictions are being implemented this season to significantly reduce harvest rates of Chinook salmon and ensure that escapement goals are achieved in the Shaktoolik and Unalakleet River drainages. In addition to restrictions, subsistence users are also strongly encouraged to redirect harvest pressure on other more numerous species this season, such as chum salmon which are anticipated to be abundant in southern Norton Sound. Once the Chinook salmon run begins, inseason management will be based upon escapement counts and subsistence fishing reports. Fishing restrictions may be relaxed or further restrictions may be necessary depending on run assessment.
Emergency Order: 3-S-Z-04-13 Effective Date: June 25, 2013
EXPLANATION: This emergency order opens Subdistrict 4 of the Norton Sound Subdistrict, the Norton Bay Subdistrict, to two 48-hour periods from 6:00 p.m. Tuesday, June 25 to 6:00 p.m. Thursday, June 27 and from 6:00 p.m. Friday, June 28 to 6:00 p.m. Sunday, June 30. Permit holders in Subdistrict 4 are limited to 100 fathoms of net in aggregate length and set gillnets must have a stretched-mesh size no greater than 6 inches.
JUSTIFICATION: An average to above average run of chum salmon is anticipated this season in Norton Sound Subdistrict 4, the Norton Bay Subdistrict. Escapement and subsistence harvest needs are expected to easily be met and additional surplus should be available for commercial harvest. Norton Sound Seafood Products has expressed interest in purchasing salmon in the Norton Bay Subdistrict. The department will allow two 48-hour commercial openings to gauge early chum salmon run strength and provide commercial harvest opportunity.
Emergency Order: 3-S-Z-05-13 Effective Date: July 1, 2013
EXPLANATION: Effective 12:00 a.m. Monday, July 1, the marine waters of Subdistricts 5 and 6, and all freshwaters of the Shaktoolik and Unalakleet River drainages will open to subsistence salmon fishing with beach seines 24 hours a day, seven days a week until Saturday, August 10. This emergency order also prohibits the retention of any king salmon incidentally captured in beach seines while targeting other salmon for subsistence uses. All king salmon incidentally captured in beach seines must be immediately released back into the water unharmed.
JUSTIFICATION: Effective July 1, subsistence salmon fishing in all fresh and marine waters of the Shaktoolik and Unalakleet Subdistricts will open to the use of beach seines 24 hours a day, seven days a week to target salmon other than Chinook salmon. The Alaska Board of Fisheries passed two new regulations in 2013: one requires that beach seines in the Shaktoolik and Unalakleet Subdistricts have a mesh size of 4 ½ inches or less; the other prohibits the retention of any Chinook salmon captured in beach seine gear. Chinook salmon incidentally captured in beach seines must be immediately released unharmed back into the water. Using beach seine gear provides additional opportunity for subsistence users to target abundant pink and chum salmon while ensuring that king salmon can reach spawning areas of the Shaktoolik and Unalakleet River drainages unharmed.
Emergency Order: 3-S-Z-06-13 Effective Date: July 2, 2013
EXPLANATION: This emergency order reopens Subdistrict 4 of the Norton Sound Subdistrict, the Norton Bay Subdistrict, to two 48-hour periods from 6:00 p.m. Tuesday, July 2 to 6:00 p.m. Thursday, July 4 and from 6:00 p.m. Friday, July 5 to 6:00 p.m. Sunday, July 7. Permit holders in Subdistrict 4 are limited to 100 fathoms of net in aggregate length and set gillnets must have a stretched-mesh size no greater than 6 inches.
-continued-
205

Appendix G7.–Page 15 of 34.
JUSTIFICATION: The commercial catch of chum salmon during the most recent period in Norton Bay Subdistrict was 4,323 chum salmon by 8 permit holders. Harvest and catch per unit of effort were the most for any period in the history of the Norton Bay commercial salmon fishery. Thus far, 8 permit holders have harvested nearly 5,700 chum salmon in the fishery, which is also record setting for late June. Inglutalik River tower personnel have enumerated over 600 chum salmon as of June 28, which is similar to previous years when 30,000–65,000 chum salmon were counted for the season. Inriver abundance of Norton Bay salmon producing drainages as indexed by the Inglutalik River tower appears more than sufficient to provide for escapements and subsistence use by Koyuk residents.
Emergency Order: 3-S-Z-07-13 Effective Date: July 2, 2013
EXPLANATION: This emergency order opens Subdistrict 5 of the Norton Sound Subdistrict, the Shaktoolik Subdistrict, to two 24-hour periods from 6:00 p.m. Tuesday, July 2 to 6:00 p.m. Wednesday, July 3, and from 6:00 p.m. Friday, July 5 to 6:00 p.m. Saturday, July 6. Permit holders in Subdistricts 5 are limited to 100 fathoms of net in aggregate length and set gillnets must have a stretched-mesh size no greater than 6 inches. This emergency order also prohibits the sale of king salmon incidentally harvested during these directed chum salmon openings.
JUSTIFICATION: This index opening will provide opportunity to gauge early run strength of chum salmon to Subdistrict 5 and utilize projected commercial harvest surpluses of chum salmon. Shaktoolik sonar estimated passage of chum salmon is over 7,600 fish, which indicates that inriver abundance of chum salmon will be sufficient to provide for subsistence uses and escapement needs in the Shaktoolik Subdistrict. Thus, these periods should not jeopardize escapement needs or subsistence uses of chum salmon in Subdistrict 5. Although chum salmon abundance is sufficient to warrant additional fishing time in Subdistricts 5, periods will be brief for early July to minimize incidental harvest of king salmon. The department will evaluate escapement counts of king salmon this week to determine if additional chum salmon commercial harvest opportunity can be provided. This brief period will also provide an opportunity to evaluate incidental harvest of king salmon in commercial 6-inch mesh set net gear, which will factor in determining the location and extent of future openings directed on chum salmon in Subdistrict 5. Per the Subdistricts 5 and 6 King Salmon Management Plan, permit holders may retain but cannot sell king salmon incidentally harvested in the commercial salmon fishery. King salmon retained for subsistence purposes must be recorded in the personal use section of each fish ticket at the time of delivery.
Emergency Order: 3-S-Z-08-13 Effective Date: July 1, 2013
EXPLANATION: This emergency order opens Norton Sound Subdistrict 6, the Unalakleet Subdistrict to commercial salmon fishing for two 24-hour periods from 6:00 p.m. Monday, July 1 to 6:00 p.m. Tuesday, July 2 and from 6:00 p.m. Friday, July 5 to 6:00 p.m. Saturday, July 6. Permit holders in Subdistricts 6 are limited to 100 fathoms of net in aggregate length and set gillnets must have a stretched-mesh size no greater than 6 inches. This emergency order also prohibits the sale of king salmon incidentally harvested during these directed chum salmon openings.
JUSTIFICATION: This index opening will provide opportunity to gauge early run strength of chum salmon to Subdistrict 6 and utilize projected commercial harvest surpluses of chum salmon. Chum salmon counts at the Unalakleet River weir are 3,200 chum salmon and the Unalakleet River aerial survey goal of 2,400–4,800 chum salmon is projected to easily be reached. This indicates that inriver abundance of chum salmon will be sufficient to provide for subsistence uses and escapement needs in the Unalakleet Subdistrict. Thus, these periods should not jeopardize escapement needs or subsistence uses of chum salmon in Subdistrict 6. Although chum salmon abundance is sufficient to warrant additional fishing time in Subdistrict 6, periods will be brief for early July to minimize incidental harvest of king salmon. The department will evaluate escapement counts of king salmon this week to determine if additional chum salmon commercial harvest opportunity can be provided. This brief period will also provide an opportunity to evaluate incidental harvest of king salmon in commercial 6-inch mesh set net gear, which will factor in determining the location and extent of future openings directed on chum salmon in Subdistrict 6.
-continued-
206

Appendix G7.–Page 16 of 34.
Per the Subdistricts 5 and 6 King Salmon Management Plan, permit holders may retain but cannot sell king salmon incidentally harvested in the commercial salmon fishery. King salmon retained for subsistence purposes must be recorded in the personal use section of each fish ticket at the time of delivery.
Emergency Order: 3-S-Z-09-13 Effective Date: July 8, 2013
EXPLANATION: This emergency order closes all marine waters in Norton Sound Subdistrict 6, the Unalakleet Subdistrict, to subsistence salmon fishing effective 6:00 p.m. Monday, July 8 and immediately reopens Subdistrict 6 to a subsistence fishing schedule with fishermen restricted to set gillnets with a mesh size no larger than 6 inches. The schedule will be from 6:00 p.m. Monday, July 8 to 6:00 p.m. Tuesday, July 9, and from 6:00 p.m. Friday, July 12 to 6:00 p.m. Thursday, July 13. After July 13, the Subdistrict 6 marine subsistence fishery will remain restricted to 6 inches or less until midnight Sunday evening, July 21.
JUSTIFICATION: As expected, the Chinook salmon run to the Unalakleet River drainage is showing very late timing and poor initial run strength. As of July 1, a total of 31 Chinook salmon have been enumerated at the mainstem Unalakleet River weir. North River tower has not been operational since July 1 due to high water levels. However, the Unalakleet River mainstem comprises 45–60% of the drainagewide escapement, which suggests the projected North River Chinook salmon escapement is likely to fall short of the tower-based escapement goal range of 1,200–2,600 fish. Therefore, additional conservation measures are necessary if there is to be any chance of meeting Chinook salmon escapement needs in the Unalakleet River drainage.
Emergency Order: 3-S-Z-10-13 Effective Date: July 6, 2013
EXPLANATION: This emergency order closes all fresh waters of the Unalakleet River drainage to subsistence salmon fishing with set gillnets effective 8:00 p.m. Monday, July 6 until 12:00 a.m. Monday, July 22. Additionally, this emergency order rescinds the subsistence fishing schedule for the Unalakleet River drainage effective 8:00 p.m. Saturday, July 6 until further notice. Subsistence fishermen may continue to use beach seine gear 24 hours a day, 7 days a week to target other salmon, but king salmon must be immediately released unharmed back into the water. Beach seines must have a mesh size of 4 ½ inches or less.
JUSTIFICATION: As expected, the Chinook salmon run to the Unalakleet River drainage is showing very late timing and poor initial run strength. As of July 2, a total of 31 Chinook salmon have been enumerated at the mainstem Unalakleet River weir. North River tower has not been operational since July 1 due to high water levels. However, the Unalakleet River mainstem comprises 45–60% of the drainagewide escapement, which suggests the projected North River Chinook salmon escapement is likely to fall short of the tower-based escapement goal range of 1,200–2,600 fish. Therefore, additional conservation measures are necessary if there is to be any chance of meeting Chinook salmon escapement needs in the Unalakleet River drainage.
Emergency Order: 3-S-Z-11-13 Effective Date: July 9, 2013
EXPLANATION: This emergency order reopens Subdistrict 4 of the Norton Sound Subdistrict, the Norton Bay Subdistrict, for two 48-hour periods from 6:00 p.m. Tuesday, July 9 to 6:00 p.m. Thursday, July 11 and from 6:00 p.m. Friday, July 12 to 6:00 p.m. Sunday, July 14. Permit holders in Subdistrict 4 are limited to 100 fathoms of net in aggregate length and set gillnets must have a stretched-mesh size no greater than 6 inches.
JUSTIFICATION: The commercial catch of chum salmon during the most recent period in Norton Bay Subdistrict was 5,700 chum salmon by 8 permit holders. This was the second period in a row with a record high harvest for a single period in the Norton Bay Subdistrict commercial fishery. The total harvest to date of 16,595 chum salmon is now on track to exceed the record harvest of 21,973 chum salmon caught during the 1978 season. Inglutalik River tower personnel have enumerated over 5,600 chum salmon as of July 7, which is more than the July 7 cumulative count of 4,521 in 2012; 32,832 chum salmon were counted during the 2012 season. Current levels of inriver abundance of chum salmon for Norton Bay drainages as indexed by the Inglutalik River tower appear more than sufficient to provide for escapement and subsistence uses by Koyuk residents.
-continued-
207

Appendix G7.–Page 17 of 34.
Emergency Order: 3-S-Z-12-13 Effective Date: July 8, 2013
EXPLANATION: This emergency order reopens Subdistrict 5 of the Norton Sound Subdistrict, the Shaktoolik Subdistrict, for one 48-hour period from 6:00 p.m. Monday, July 8 to 6:00 p.m. Wednesday, July 10, and one 24-hour period from 6:00 p.m. Friday, July 12 to 6:00 p.m. Saturday, July 13. Permit holders in Subdistricts 5 are limited to 100 fathoms of net in aggregate length and set gillnets must have a stretched-mesh size no greater than 6 inches. This emergency order also prohibits the sale of king salmon incidentally harvested during these directed chum salmon openings.
JUSTIFICATION: Chum salmon abundance in the Shaktoolik River drainage is more than sufficient to warrant additional fishing time in Subdistricts 5. Periods have been brief thus far in order to minimize incidental harvest of king salmon. Permit holders were largely stuck on the beach due to hazardous surf conditions arising from southerly winds. The first period is 48 hours in duration in order to mitigate foregone chum salmon harvest opportunities that were lost last week. Historical run timing information suggests that the bulk of the Shaktoolik River king salmon run is in the lower reaches of the Shaktoolik River drainage. Therefore, incidental catches of king salmon for these periods are expected to be very minimal. Per the Subdistricts 5 and 6 King Salmon Management Plan, permit holders may retain but cannot sell king salmon incidentally harvested in the commercial salmon fishery. King salmon retained for subsistence purposes must be recorded in the personal use section of each fish ticket at the time of delivery.
Emergency Order: 3-S-Z-13-13 Effective Date: July 8, 2013
EXPLANATION: This emergency order reopens Norton Sound Subdistrict 6, the Unalakleet Subdistrict to commercial salmon fishing for two 24-hour periods from 6:00 p.m. Monday, July 8 to 6:00 p.m. Tuesday, July 9 and from 6:00 p.m. Friday, July 12 to 6:00 p.m. Saturday, July 13. Permit holders in Subdistricts 6 are limited to 100 fathoms of net in aggregate length and set gillnets must have a stretched-mesh size no greater than 6 inches. This emergency order also prohibits the sale of king salmon incidentally harvested during these directed chum salmon openings.
JUSTIFICATION: This index opening will provide opportunity to utilize commercial harvest surpluses of chum salmon. Cumulative chum salmon passage at the Unalakleet River weir now stands at 21,208 chum salmon as of July 7. This is the highest count of chum salmon for July 7 in the project’s 4-year history and the Unalakleet River aerial survey goal of 2,400–4,800 chum salmon has been exceeded. Inriver abundance of chum salmon will be sufficient to provide for subsistence uses and escapement needs in the Unalakleet Subdistrict. Chum salmon abundance is more than sufficient to warrant longer commercial periods directed on chum salmon in Subdistrict 6. However, more aggressive fishing periods will not be scheduled until Monday, July 15 in order to allow the remainder of the king salmon run to enter the Unalakleet River drainage unharmed. Beginning Monday, July 15, 48-hour periods are expected after the bulk of the king salmon run has entered the lower Unalakleet River drainage, with extended (72-hour) periods possible to more efficiently harvest chum salmon surpluses. Per the Subdistricts 5 and 6 King Salmon Management Plan, permit holders may retain but cannot sell king salmon incidentally harvested in the commercial salmon fishery. King salmon retained for subsistence purposes must be recorded in the personal use section of each fish ticket at the time of delivery.
Emergency Order: 3-S-Z-14-13 Effective Date: July 12, 2013
EXPLANATION: This emergency order supersedes emergency orders 3-S-Z-02-13 and 3-S-Z-09-1,3 and closes all marine waters of Norton Sound Subdistricts 5 and 6, the Shaktoolik and Unalakleet Subdistricts, to subsistence salmon fishing effective 6:00 p.m. Friday, July 12. This emergency order rescinds subsistence fishing schedules of two 48-hour openings per week in the Shaktoolik Subdistrict, and two 24-hour periods per week in the Unalakleet Subdistrict. This emergency order also immediately reopens subsistence salmon fishing in the marine waters of both Subdistricts 5 and 6 for 24 hours a day, 7 days a week, but fishing is restricted to set gillnets with a mesh size of 6 inches or less.
-continued-
208

Appendix G7.–Page 18 of 34.
JUSTIFICATION: Westerly winds and high water levels hastened the entry of king salmon into the lower reaches of the Shaktoolik and Unalakleet River drainages as indicated by a major decline in incidental catches of king salmon in the commercial chum salmon fishery this past week. All available information suggests that the bulk of the king salmon run is now protected within the lower reaches of the Shaktoolik and Unalakleet River drainages. King salmon runs to southern Norton Sound have been very weak and have exhibited later than average run timing. However, closures and restrictions are in place to conserve these king salmon so they may reach known spawning reaches and provide for future returns. Consequently, the department is increasing fishing time in the marine waters to provide additional subsistence opportunity for users to target chum salmon which are in abundance this season.
Emergency Order: 3-S-Z-15-13 Effective Date: July 11, 2013
EXPLANATION: This emergency order supersedes emergency order 3-S-Z-13-13 and extends the July 12 24-hour opening in Norton Sound Subdistrict 6, the Unalakleet Subdistrict, by an additional 24 hours, effectively creating a 48-hour period. This emergency order permits commercial salmon fishing for 48 hours from 6:00 p.m. Thursday, July 11 to 6:00 p.m. Saturday, July 13. Permit holders in Subdistricts 6 are limited to 100 fathoms of net in aggregate length and set gillnets must have a stretched-mesh size no greater than 6 inches. This emergency order also prohibits the sale of king salmon incidentally harvested during these directed chum salmon openings.
JUSTIFICATION: Chum salmon abundance is more than sufficient to warrant longer commercial periods directed on chum salmon in Subdistrict 6. Additional opportunity to target chum salmon for commercial purposes is being provided because recent incidental harvests of king salmon have been very low. Inclement weather from westerly winds kept many fishermen on the beach but also appears to have had the dual effect of pushing the remainder of the king salmon run into the lower reach of the Unalakleet River unharmed. Per the Subdistricts 5 and 6 King Salmon Management Plan, permit holders may retain but cannot sell king salmon incidentally harvested in the commercial salmon fishery. King salmon retained for subsistence purposes must be recorded in the personal use section of each fish ticket at the time of delivery.
Emergency Order: 3-S-Z-16-13 Effective Date: July 12, 2013
EXPLANATION: This emergency order supersedes emergency order 3-S-Z-12-13 and extends fishing time in the Norton Sound Subdistrict 5, the Shaktoolik Subdistrict, by 24 hours, thereby creating one 48-hour commercial salmon fishing period from 6:00 p.m. Friday, July 12 to 6:00 p.m. Sunday, July 14. Permit holders in Subdistricts 5 are limited to 100 fathoms of net in aggregate length and set gillnets must have a stretched-mesh size no greater than 6 inches. This emergency order also prohibits the sale of king salmon incidentally harvested during these directed chum salmon openings.
JUSTIFICATION: Chum salmon abundance in the Shaktoolik River drainage is more than sufficient to warrant additional fishing time in Subdistricts 5. Apportioned sonar count estimated passage for the Shaktoolik River is 35,510 chum salmon which is tracking similar to the 39,000 chum salmon observed at the Unalakleet River weir. Additional opportunity to target chum salmon for commercial purposes is being provided because recent incidental harvests of king salmon have been very low. Inclement weather from westerly winds kept many fishermen on the beach in the Shaktoolik Subdistrict, but also appears to have had the dual effect of pushing the remainder of the king salmon run into the lower reach of the Shaktoolik River unharmed. Estimated apportioned Shaktoolik sonar passage as of July 10 is between 1,100–2,200 king salmon. Per the Subdistricts 5 and 6 King Salmon Management Plan, permit holders may retain but cannot sell king salmon incidentally harvested in the commercial salmon fishery. King salmon retained for subsistence purposes must be recorded in the personal use section of each fish ticket at the time of delivery.
Emergency Order: 3-S-Z-17-13 Effective Date: July 12, 2013
EXPLANATION: This emergency order supersedes emergency order 3-S-Z-11-13 and extends fishing time in Norton Sound Subdistrict 4, the Norton Bay Subdistrict, by an additional 24 hours. This emergency order therefore,
-continued-
209

Appendix G7.–Page 19 of 34.
reopens commercial salmon fishing in Subdistrict 4 for 72 hours from 6:00 p.m. Friday, July 12 to 6:00 p.m. Monday, July 15. Permit holders in Subdistrict 4 are limited to 100 fathoms of net in aggregate length and set gillnets must have a stretched-mesh size no greater than 6 inches.
JUSTIFICATION: The commercial catch of chum salmon during the most recent period in Norton Bay Subdistrict was 3,600 chum salmon by 8 permit holders. Harvests of chum salmon per period continue to be well above average for mid-July. Total harvest of chum salmon in Norton Bay Subdistrict is expected to easily surpass the record harvest of 21,973 chum salmon set in 1978 during this period. Thus far, a total of 20,254 chum salmon have been harvested in the commercial fishery. Inglutalik River tower personnel have enumerated a minimum count of over 6,500 chum salmon as of July 11. High water levels and poor water clarity have made counting operations difficult since July 7 and chum salmon passage is most likely underestimated. Regardless, current levels of inriver abundance of chum salmon for Norton Bay drainages as indexed by the Inglutalik River tower appear more than sufficient to provide for escapement needs and subsistence uses by Koyuk residents.
Emergency Order: 3-S-Z-18-13 Effective Date: July 15, 2013
EXPLANATION: This emergency order reopens Subdistrict 5 of the Norton Sound Subdistrict, the Shaktoolik Subdistrict, for one 72-hour period from 6:00 p.m. Monday, July 15 to 6:00 p.m. Thursday, July 18. Permit holders in Subdistricts 5 are limited to 100 fathoms of net in aggregate length and set gillnets must have a stretched-mesh size no greater than 6 inches. This emergency order also prohibits the sale of king salmon incidentally harvested during these directed chum salmon openings.
JUSTIFICATION Chum salmon abundance in the Shaktoolik River drainage is more than sufficient to warrant additional fishing time in Subdistricts 5. Apportioned sonar count estimated passage for the Shaktoolik River is 35,510 chum salmon which is tracking similar to the 39,000 chum salmon observed at the Unalakleet River weir. Additional opportunity to target chum salmon for commercial purposes is being provided because recent incidental harvests of king salmon have been very low. Inclement weather from westerly winds kept many fishermen on the beach in the Shaktoolik Subdistrict, but also appears to have had the dual effect of pushing the remainder of the king salmon run into the lower reach of the Shaktoolik River unharmed. Estimated apportioned Shaktoolik sonar passage as of July 10 is between 1,100–2,200 king salmon. This 72-hour period will provide additional opportunity to efficiently harvest commercial chum salmon harvestable surpluses during the second peak of the southern Norton Sound chum salmon run. Per the Subdistricts 5 and 6 King Salmon Management Plan, permit holders may retain but cannot sell king salmon incidentally harvested in the commercial salmon fishery. King salmon retained for subsistence purposes must be recorded in the personal use section of each fish ticket at the time of delivery.
Emergency Order: 3-S-Z-19-13 Effective Date: July 15, 2013
EXPLANATION: This emergency order reopens Norton Sound Subdistrict 6, the Unalakleet Subdistrict, for one 72-hour period from 6:00 p.m. Monday, July 15 to 6:00 p.m. Thursday, July 18. Permit holders in Subdistricts 6 are limited to 100 fathoms of net in aggregate length and set gillnets must have a stretched-mesh size no greater than 6 inches. This emergency order also prohibits the sale of king salmon incidentally harvested during these directed chum salmon openings.
JUSTIFICATION: Cumulative chum salmon passage at the Unalakleet River weir now stands at over 39,000 chum salmon as of July 11, which is the highest count of chum salmon for July 11 in the project’s 4-year history. Escapement needs of chum salmon have been achieved and inriver abundance of chum salmon is more than sufficient to provide for subsistence uses of Unalakleet Subdistrict residents. Given the record abundance of chum salmon, longer commercial periods directed on chum salmon are warranted in Subdistrict 6. This additional opportunity to target chum salmon for commercial purposes is being provided because recent incidental harvests of king salmon have been very low. Inclement weather from westerly winds kept many fishermen on the beach but also appears to have had the dual effect of pushing the remainder of the king salmon run into the lower reach of the Unalakleet River unharmed. Weir counts of king salmon have picked up in recent days
-continued-
210

Appendix G7.–Page 20 of 34.
with a total of 313 king salmon enumerated as of July 11.
Per the Subdistricts 5 and 6 King Salmon Management Plan, permit holders may retain but cannot sell king salmon incidentally harvested in the commercial salmon fishery. King salmon retained for subsistence purposes must be recorded in the personal use section of each fish ticket at the time of delivery.
Emergency Order: 3-S-Z-20-13 Effective Date: July 16, 2013
EXPLANATION: This emergency order reopens Subdistrict 4 of the Norton Sound Subdistrict, the Norton Bay Subdistrict, for one 72-hour period from 6:00 p.m. Tuesday, July 16 to 6:00 p.m. Friday, July 19. Permit holders in Subdistrict 4 are limited to 100 fathoms of net in aggregate length and set gillnets must have a stretched-mesh size no greater than 6 inches.
JUSTIFICATION: Norton Bay fishermen have already harvested nearly 24,000 chum salmon this season, which is above the previous record harvest of 21,973 taken back in 1978. Escapement of chum salmon into Norton Bay salmon-producing drainages has also been strong as indexed by the NSEDC-operated Inglutalik River tower. Cumulative passage of chum salmon at Inglutalik River tower is over 30,000 fish, which is tracking similar to the 2011 season when over 64,000 chum salmon were counted. Current levels of inriver chum salmon abundance are more than sufficient to meet subsistence needs and provide escapements to ensure future returns of chum salmon. The increase in commercial fishing time is warranted because large harvestable surpluses of chum salmon remain in Norton Bay and there continues to be buyer interest.
Emergency Order: 3-S-Z-21-13 Effective Date: July 15, 2013
EXPLANATION: This emergency order adds 48-hours to the subsistence salmon gillnet fishing schedule for Subdistrict 1 west of Cape Nome The subsistence salmon gillnet schedule will change from 6 p.m. Wednesday to 6 p.m. Saturday to the expanded schedule from 6 p.m. Monday until 6 p.m. Saturday in Subdistrict 1 marine waters west of Cape Nome.
JUSTIFICATION: The Nome Subdistrict escapement range goal of 23,000-35,000 chum salmon will easily be exceeded this year. At the Eldorado River, escapement is 11,000 chum salmon and that exceeds the escapement goal range of 6,000 to 9,200 chum salmon. Historically, mid-July is average midpoint of the chum salmon run at Eldorado River weir. At Snake River, 800 chum salmon have passed the weir (escapement goal range is 1,600 to 2,500 chum salmon). At Nome River, 1,150 chum salmon have passed the weir (escapement goal range is 2,900 to 4,300 chum salmon). Mid-July is average first-quarter point of the chum salmon run at both Snake and Nome weirs. Nome and Snake rivers are the index rivers for escapement west of Cape Nome and with both projected to reach escapement goal ranges the department is expanding to a 5-day a week subsistence set gillnet fishing schedule west of Cape Nome.
Emergency Order: 3-S-Z-22-13 Effective Date: July 18, 2013
EXPLANATION: This emergency order opens the marine waters from the Cape Nome jetty eastward to Topkok Head in Subdistrict 1 of the Norton Sound Subdistrict, the Nome Subdistrict, for one 24-hour period from 6:00 p.m. Thursday, July 18 to 6:00 p.m. Friday, July 19. Permit holders in Subdistrict 1 are limited to 100 fathoms of net in aggregate length and set gillnets must have a stretched-mesh size no greater than 6 inches.
JUSTIFICATION: The Nome Subdistrict commercial chum salmon fishery was closed in 1991 due to chronically low runs and difficulty meeting escapement needs. Since the mid-2000s, runs of chum salmon to the Nome Subdistrict have been sufficient to meet escapement goals in most years and provide surpluses for subsistence harvest needs. As a result, the State of Alaska Board of Fisheries passed regulations in January, 2013 allowing for a commercial chum salmon fishery based on conservative management guidelines. Additionally, the board adopted regulations that divided Nome Subdistrict into two management areas: one from Cape Nome east to Topkok Head, and another from Cape Nome west to Cape Rodney. This regulation was adopted to provide the department with
-continued-
211

Appendix G7.–Page 21 of 34.
guidance to manage subsistence and commercial salmon fisheries east or west of Cape Nome based on escapement information from drainages located east or west of Cape Nome. The chum salmon escapement goal range has already been achieved at Eldorado River, the index river for chum salmon escapement east of Cape Nome, and a limited commercial chum salmon fishery should not jeopardize subsistence uses or escapement needs. Projections of chum salmon escapement based on historical data for western Nome Subdistrict drainages will most likely approach or exceed the upper bound of established escapement goal ranges. As of July 16, cumulative escapement counts of chum salmon at the Eldorado, Nome, and Snake Rivers are 12,788, 1,263, and 872 chum salmon, respectively. Harvestable surpluses of chum salmon are available east of Cape Nome and there is buyer interest to purchase these fish.
Emergency Order: 3-S-Z-23-13 Effective Date: July 17, 2013
EXPLANATION: This emergency order opens Subdistrict 2, the Golovnin Bay Subdistrict of the Norton Sound District, to commercial salmon fishing for one 48-hour period directed at pink salmon from 6:00 p.m. Wednesday, July 17 to 6:00 p.m. Friday, July 19. Permit holders are restricted to gillnets with a mesh size of four and one-half inches or less.
JUSTIFICATION: Golovin Subdistrict salmon fisheries are being managed this season based on escapement data from the Kwiniuk River tower, located in Subdistrict 3, the nearby Elim Subdistrict. The Niukluk River tower project is no longer operational to assess escapements in season in the Golovin Subdistrict. However, the Kwiniuk River tower-based escapement goal threshold of 8,400 pink salmon is projected to be reached and there is buyer interest in pink salmon. Additionally, the former Niukluk River escapement goal threshold of 10,500 pink salmon has been achieved continually since 1998, and there are no concerns meeting subsistence and escapement needs this season. There were no directed chum salmon openings this season in Subdistrict 2 as a result of a weak chum salmon run. The Subdistricts 2 and 3 management plan does not allow for commercial pink salmon fishing to occur before July 14 in the Golovin Subdistrict in years of low chum salmon abundance. However, the bulk of the chum salmon run is believed to be in river by this time and pink salmon commercial fishing should not have a negative impact on chum salmon escapements in the Fish River drainage. Pink salmon run strength will be indexed using comparative catch statistics from this opening and Kwiniuk River tower counts in order to determine if more commercial fishing opportunity can be provided while not jeopardizing subsistence uses of pink salmon.
Emergency Order: 3-S-Z-24-13 Effective Date: July 19, 2013
EXPLANATION: This emergency order reopens Subdistrict 5 of the Norton Sound Subdistrict, the Shaktoolik Subdistrict, for one 72-hour period from 6:00 p.m. Friday, July 19 to 6:00 p.m. Monday, July 22. Permit holders in Subdistricts 5 are limited to 100 fathoms of net in aggregate length and set gillnets must have a stretched-mesh size no greater than 6 inches. This emergency order also prohibits the sale of king salmon incidentally harvested during these directed chum salmon openings.
JUSTIFICATION: Chum salmon abundance in the Shaktoolik River drainage is more than sufficient to warrant additional fishing time in Subdistricts 5. Apportioned sonar count estimated passage for the Shaktoolik River is 36,000 chum salmon. Additional opportunity to target chum salmon for commercial purposes is warranted due to the large chum salmon surplus. Per the Subdistricts 5 and 6 King Salmon Management Plan, permit holders may retain but cannot sell king salmon incidentally harvested in the commercial salmon fishery. King salmon retained for subsistence purposes must be recorded in the personal use section of each fish ticket at the time of delivery.
Emergency Order: 3-S-Z-25-13 Effective Date: July 19, 2013
EXPLANATION: This emergency order reopens Norton Sound Subdistrict 6, the Unalakleet Subdistrict, for one 72-hour period from 6:00 p.m. Friday, July 19 to 6:00 p.m. Monday, July 22. Permit holders in Subdistricts 6 are limited to 100 fathoms of net in aggregate length and set gillnets must have a stretched-mesh size no greater than 6
-continued-
212

Appendix G7.–Page 22 of 34.
inches. This emergency order also prohibits the sale of king salmon incidentally harvested during these directed chum salmon openings.
JUSTIFICATION: Cumulative chum salmon passage at the Unalakleet River weir now stands at over 63,000 chum salmon as of July 18. Escapement needs of chum salmon have been achieved and inriver abundance of chum salmon is more than sufficient to provide for subsistence uses of Unalakleet Subdistrict residents. Given the near record abundance of chum salmon, longer commercial periods directed on chum salmon are warranted in Subdistrict 6. This additional opportunity to target chum salmon for commercial purposes is being provided because recent incidental harvests of king salmon have been very low. Per the Subdistricts 5 and 6 King Salmon Management Plan, permit holders may retain but cannot sell king salmon incidentally harvested in the commercial salmon fishery. King salmon retained for subsistence purposes must be recorded in the personal use section of each fish ticket at the time of delivery.
Emergency Order: 3-S-Z-26-13 Effective Date: July 20, 2013
EXPLANATION: This emergency order reopens Subdistrict 4 of the Norton Sound Subdistrict, the Norton Bay Subdistrict, for one 72-hour period from 6:00 p.m. Saturday, July 20 to 6:00 p.m. Tuesday, July 23. Permit holders in Subdistrict 4 are limited to 100 fathoms of net in aggregate length and set gillnets must have a stretched-mesh size no greater than 6 inches.
JUSTIFICATION: Norton Bay fishermen have already harvested over 27,000 chum salmon this season, which is above the previous record harvest of 21,973 taken back in 1978. Escapement of chum salmon into Norton Bay salmon-producing drainages has also been strong as indexed by the NSEDC-operated Inglutalik River tower. Cumulative passage of chum salmon at Inglutalik River tower is over 42,000 fish, which is tracking similar to the 2011 season when over 64,000 chum salmon were counted. Current levels of inriver chum salmon abundance are more than sufficient to meet subsistence needs and provide escapements to ensure future returns of chum salmon. The increase in commercial fishing time is warranted because large harvestable surpluses of chum salmon remain in Norton Bay and there continues to be buyer interest.
Emergency Order: 3-S-Z-27-13 Effective Date: July 20, 2013
EXPLANATION: This emergency order reopens the marine waters from the Cape Nome jetty eastward to Topkok Head in Subdistrict 1 of the Norton Sound Subdistrict, the Nome Subdistrict, for one 24-hour period from 12:00 p.m. Saturday, July 20 to 12:00 p.m. Sunday, July 21. Permit holders in Subdistrict 1 are limited to 100 fathoms of net in aggregate length and set gillnets must have a stretched-mesh size no greater than 6 inches.
JUSTIFICATION: The Nome Subdistrict commercial chum salmon fishery was closed in 1991 due to chronically low runs and difficulty meeting escapement needs. Since the mid-2000s, runs of chum salmon to the Nome Subdistrict have been sufficient to meet escapement goals in most years and provide surpluses for subsistence harvest needs. As a result, the State of Alaska Board of Fisheries passed regulations in January, 2013 allowing for a commercial chum salmon fishery based on conservative management guidelines. Additionally, the board adopted regulations that divided Nome Subdistrict into two management areas: one from Cape Nome east to Topkok Head, and another from Cape Nome west to Cape Rodney. This regulation was adopted to provide the department with guidance to manage subsistence and commercial salmon fisheries east or west of Cape Nome based on escapement information from drainages located east or west of Cape Nome. Escapement needs of chum salmon in drainages east of Cape Nome have already been met. Eldorado River weir chum salmon passage is nearly 16,000 fish, which is well above the escapement goal range of 6,000–9,200 chum salmon. Harvestable surpluses of chum salmon are available for commercial utilization east of Cape Nome. Normal and late run timing projections also suggest the upper end the Nome and Snake River escapement goal ranges in the western half of the Nome Subdistrict will also be reached. Commercial openings west of Cape Nome are possible next week if escapement counts continue to improve.
-continued-
213

Appendix G7.–Page 23 of 34.
Emergency Order: 3-S-Z-28-13 Effective Date: July 20, 2013
EXPLANATION: This emergency order reopens Subdistrict 2, the Golovnin Bay Subdistrict of the Norton Sound District, to commercial salmon fishing for 48 hours from 6:00 p.m. Saturday, July 20 to 6:00 p.m. Monday, July 22. This period is directed at chum salmon and permit holders will be restricted to gillnets with a mesh size of 6 inches or less.
JUSTIFICATION: Commercial chum salmon fishing was not allowed in Golovin Bay this season until now. This period is being established because department biologists observed an estimated 16,000 chum salmon in the Boston Creek tributary alone, as well as several thousand chum salmon at the confluence of the Niukluk and Fish Rivers during an aerial survey July 18. The chum salmon run to the Fish River appears to be very late this season, but escapement of chum salmon into the Fish River has improved dramatically from counts from a July 9 survey. July 18 survey results indicate chum salmon escapement to the Niukluk River has a good chance of nearing the former tower-based escapement goal threshold of 23,000 chum salmon. Additionally, the bulk of the Niukluk River chum salmon run is now considered to be in river by this date. Thus, Niukluk River chum salmon should comprise a miniscule proportion of the commercial harvest during the upcoming opening. Niukluk River tower is no longer operational, but department will fly a peak spawning ground survey at the end of the month to index overall escapement of chum salmon into the Niukluk River. Incidental coho salmon harvests from this period will also provide an early index of coho salmon run strength to Golovin Subdistrict.
Emergency Order: 3-S-Z-29-13 Effective Date: July 20, 2013
EXPLANATION: This emergency order opens all marine waters from Carson Creek eastward to Iron Creek in Norton Sound Subdistrict 3, the Elim Subdistrict, to commercial salmon fishing for 48 hours from 6:00 p.m. Saturday, July 20 to 6:00 p.m. Monday, July 22.
JUSTIFICATION: Elim Subdistrict has not been opened this season because of conservation concerns with chum salmon based on Kwiniuk River tower escapement falling short of the escapement goal. Interestingly, however, the nearby Tubutulik River escapement goal range is projected to be reached based on an early July survey of 4,600 chum salmon. A commercial fishing period is being allowed for 48 hours, but commercial fishing will be limited to the western half of the Elim Subdistrict from Carson Creek eastward to Iron Creek. This will provide commercial permit holders with some late opportunity to target chum salmon, while minimizing the impact to the Kwiniuk River chum salmon escapement. Spawning ground surveys will also be flown later this month to index this season’s Tubutulik River chum salmon escapement. The department will evaluate catch statistics and escapement information following these openings to determine if additional commercial opportunity is warranted.
Emergency Order: 3-S-Z-30-13 Effective Date: July 19, 2013
EXPLANATION: This emergency order raises the sockeye salmon subsistence catch limit to 50 fish at Pilgrim River.
JUSTIFICATION: The Pilgrim River weir count for sockeye salmon is 9,309 fish through July 18. This year’s sockeye salmon run is already the best since 2008 and run timing projections give a final count of between 15,000 and 20,000 fish. Raising the limit to 50 sockeye salmon should not jeopardize the escapement goal of 4,000 to 8,000 sockeye salmon observed by aerial survey in Salmon Lake.
Emergency Order: 3-S-Z-31-13 Effective Date: July 22, 2013
EXPLANATION: This emergency order closes all fresh waters of the Shaktoolik and Unalakleet River drainages to subsistence salmon fishing effective 12:01 a.m. Monday, July 22, and immediately reopens subsistence salmon fishing in the Shaktoolik and Unalakleet River drainages 24 hours a day, 7 days a week. However, this emergency limits subsistence salmon fishing to set gillnets with a mesh size not greater than 6 inches.
JUSTIFICATION: Current cumulative escapement counts of Chinook salmon on the North and Unalakleet River
-continued-
214
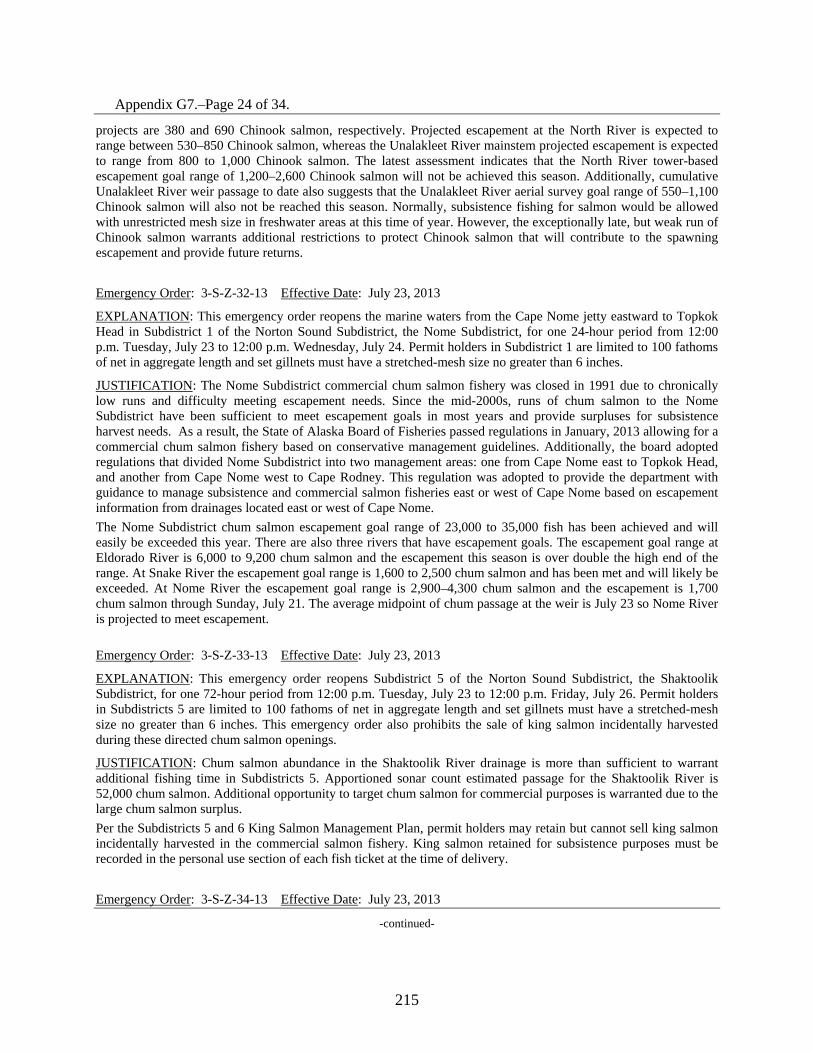
Appendix G7.–Page 24 of 34.
projects are 380 and 690 Chinook salmon, respectively. Projected escapement at the North River is expected to range between 530–850 Chinook salmon, whereas the Unalakleet River mainstem projected escapement is expected to range from 800 to 1,000 Chinook salmon. The latest assessment indicates that the North River tower-based escapement goal range of 1,200–2,600 Chinook salmon will not be achieved this season. Additionally, cumulative Unalakleet River weir passage to date also suggests that the Unalakleet River aerial survey goal range of 550–1,100 Chinook salmon will also not be reached this season. Normally, subsistence fishing for salmon would be allowed with unrestricted mesh size in freshwater areas at this time of year. However, the exceptionally late, but weak run of Chinook salmon warrants additional restrictions to protect Chinook salmon that will contribute to the spawning escapement and provide future returns.
Emergency Order: 3-S-Z-32-13 Effective Date: July 23, 2013
EXPLANATION: This emergency order reopens the marine waters from the Cape Nome jetty eastward to Topkok Head in Subdistrict 1 of the Norton Sound Subdistrict, the Nome Subdistrict, for one 24-hour period from 12:00 p.m. Tuesday, July 23 to 12:00 p.m. Wednesday, July 24. Permit holders in Subdistrict 1 are limited to 100 fathoms of net in aggregate length and set gillnets must have a stretched-mesh size no greater than 6 inches.
JUSTIFICATION: The Nome Subdistrict commercial chum salmon fishery was closed in 1991 due to chronically low runs and difficulty meeting escapement needs. Since the mid-2000s, runs of chum salmon to the Nome Subdistrict have been sufficient to meet escapement goals in most years and provide surpluses for subsistence harvest needs. As a result, the State of Alaska Board of Fisheries passed regulations in January, 2013 allowing for a commercial chum salmon fishery based on conservative management guidelines. Additionally, the board adopted regulations that divided Nome Subdistrict into two management areas: one from Cape Nome east to Topkok Head, and another from Cape Nome west to Cape Rodney. This regulation was adopted to provide the department with guidance to manage subsistence and commercial salmon fisheries east or west of Cape Nome based on escapement information from drainages located east or west of Cape Nome. The Nome Subdistrict chum salmon escapement goal range of 23,000 to 35,000 fish has been achieved and will easily be exceeded this year. There are also three rivers that have escapement goals. The escapement goal range at Eldorado River is 6,000 to 9,200 chum salmon and the escapement this season is over double the high end of the range. At Snake River the escapement goal range is 1,600 to 2,500 chum salmon and has been met and will likely be exceeded. At Nome River the escapement goal range is 2,900–4,300 chum salmon and the escapement is 1,700 chum salmon through Sunday, July 21. The average midpoint of chum passage at the weir is July 23 so Nome River is projected to meet escapement.
Emergency Order: 3-S-Z-33-13 Effective Date: July 23, 2013
EXPLANATION: This emergency order reopens Subdistrict 5 of the Norton Sound Subdistrict, the Shaktoolik Subdistrict, for one 72-hour period from 12:00 p.m. Tuesday, July 23 to 12:00 p.m. Friday, July 26. Permit holders in Subdistricts 5 are limited to 100 fathoms of net in aggregate length and set gillnets must have a stretched-mesh size no greater than 6 inches. This emergency order also prohibits the sale of king salmon incidentally harvested during these directed chum salmon openings.
JUSTIFICATION: Chum salmon abundance in the Shaktoolik River drainage is more than sufficient to warrant additional fishing time in Subdistricts 5. Apportioned sonar count estimated passage for the Shaktoolik River is 52,000 chum salmon. Additional opportunity to target chum salmon for commercial purposes is warranted due to the large chum salmon surplus. Per the Subdistricts 5 and 6 King Salmon Management Plan, permit holders may retain but cannot sell king salmon incidentally harvested in the commercial salmon fishery. King salmon retained for subsistence purposes must be recorded in the personal use section of each fish ticket at the time of delivery.
Emergency Order: 3-S-Z-34-13 Effective Date: July 23, 2013
-continued-
215

Appendix G7.–Page 25 of 34.
EXPLANATION: This emergency order reopens Norton Sound Subdistrict 6, the Unalakleet Subdistrict, for one 72-hour period from 6:00 p.m. Tuesday, July 23 to 6:00 p.m. Friday, July 26. Permit holders in Subdistricts 6 are limited to 100 fathoms of net in aggregate length and set gillnets must have a stretched-mesh size no greater than 6 inches. This emergency order also prohibits the sale of king salmon incidentally harvested during these directed chum salmon openings.
JUSTIFICATION: Cumulative chum salmon passage at the Unalakleet River weir now stands at over 76,000 chum salmon as of July 18. Escapement needs of chum salmon have been achieved and inriver abundance of chum salmon is more than sufficient to provide for subsistence uses of Unalakleet Subdistrict residents. Given the above average abundance of chum salmon, longer commercial periods directed on chum salmon are warranted in Subdistrict 6. Per the Subdistricts 5 and 6 King Salmon Management Plan, permit holders may retain but cannot sell king salmon incidentally harvested in the commercial salmon fishery. King salmon retained for subsistence purposes must be recorded in the personal use section of each fish ticket at the time of delivery.
Emergency Order: 3-S-Z-35-13 Effective Date: July 23, 2013
EXPLANATION: This emergency order reopens Subdistrict 2, the Golovnin Bay Subdistrict of the Norton Sound District, to commercial salmon fishing for 24 hours from 6:00 p.m. Tuesday, July 23 to 6:00 p.m. Wednesday, July 24. This period is directed at chum salmon and permit holders will be restricted to gillnets with a mesh size of 6 inches or less.
JUSTIFICATION: Commercial chum salmon fishing was not allowed in Golovin Bay this season until now. This period is being established because department biologists observed an estimated 16,000 chum salmon in the Boston Creek tributary alone, as well as several thousand chum salmon at the confluence of the Niukluk and Fish Rivers during an aerial survey July 18. The chum salmon run to the Fish River appears to be very late this season, but escapement of chum salmon into the Fish River has improved dramatically from counts from a July 9 survey. July 18 survey results indicate chum salmon escapement to the Niukluk River has a good chance of nearing the former tower-based escapement goal threshold of 23,000 chum salmon. Additionally, the bulk of the Niukluk River chum salmon run is now considered to be in river by this date. Thus, Niukluk River chum salmon should comprise a miniscule proportion of the commercial harvest during the upcoming opening. Niukluk River tower is no longer operational, but department will fly a peak spawning ground survey at the end of the month to index overall escapement of chum salmon into the Niukluk River. Incidental coho salmon harvests from this period will also provide an early index of coho salmon run strength to Golovin Subdistrict.
Emergency Order: 3-S-Z-36-13 Effective Date: July 24, 2013
EXPLANATION: This emergency order opens all marine waters from Carson Creek eastward to Iron Creek in Norton Sound Subdistrict 3, the Elim Subdistrict, to commercial salmon fishing for 24 hours from 6:00 p.m. Wednesday July 24 to 6:00 p.m. Thursday July 25.
JUSTIFICATION: Elim Subdistrict has not been opened this season because of conservation concerns with chum salmon based on Kwiniuk River tower escapement falling short of the escapement goal. Interestingly, however, the nearby Tubutulik River escapement goal range is projected to be reached based on an early July survey of 4,600 chum salmon. A commercial fishing period is being allowed for 48 hours, but commercial fishing will be limited to the western half of the Elim Subdistrict from Carson Creek eastward to Iron Creek. This will provide commercial permit holders with some late opportunity to target chum salmon, while minimizing the impact to the Kwiniuk River chum salmon escapement. Spawning ground surveys will also be flown later this month to index this season’s Tubutulik River chum salmon escapement. The department will evaluate catch statistics and escapement information following these openings to determine if additional commercial opportunity is warranted.
Emergency Order: 3-S-Z-37-13 Effective Date: July 25, 2013
EXPLANATION: This emergency order reopens Subdistrict 4 of the Norton Sound Subdistrict, the Norton Bay
-continued-
216

Appendix G7.–Page 26 of 34.
Subdistrict, for one 64-hour period from 8:00 a.m. Thursday, July 25 to 12:00 midnight Saturday evening, July 27. Permit holders in Subdistrict 4 are limited to 100 fathoms of net in aggregate length and set gillnets must have a stretched-mesh size no greater than 6 inches.
JUSTIFICATION: Norton Bay fishermen have already harvested nearly 30,000 chum salmon this season, which is above the previous record harvest of 21,973 taken back in 1978. Escapement of chum salmon into Norton Bay salmon-producing drainages has also been strong as indexed by the NSEDC-operated Inglutalik River tower. Cumulative passage of chum salmon at Inglutalik River tower is over 42,000 fish, which is more than sufficient to meet subsistence needs and provide escapements to ensure future returns of chum salmon. The increase in commercial fishing time is warranted because large harvestable surpluses of chum salmon remain in Norton Bay and there continues to be buyer interest. The department will switch to coho salmon management once coho salmon catches exceed chum salmon catches.
Emergency Order: 3-S-Z-38-13 Effective Date: July 26, 2013
EXPLANATION: This emergency order reopens the all marine waters in Subdistrict 1 of the Norton Sound Subdistrict, the Nome Subdistrict, for one 24-hour period from 12:00 p.m. Friday, July 26 to 12:00 p.m. Saturday, July 27. Permit holders in Subdistrict 1 are limited to 100 fathoms of net in aggregate length and set gillnets must have a stretched-mesh size no greater than 6 inches.
JUSTIFICATION: The Nome Subdistrict commercial chum salmon fishery was closed in 1991 due to chronically low runs and difficulty meeting escapement needs. Since the mid-2000s, runs of chum salmon to the Nome Subdistrict have been sufficient to meet escapement goals in most years and provide surpluses for subsistence harvest needs. As a result, the State of Alaska Board of Fisheries passed regulations in January, 2013 allowing for a commercial chum salmon fishery based on conservative management guidelines. Additionally, the board adopted regulations that divided Nome Subdistrict into two management areas: one from Cape Nome east to Topkok Head, and another from Cape Nome west to Cape Rodney. This regulation was adopted to provide the department with guidance to manage subsistence and commercial salmon fisheries east or west of Cape Nome based on escapement information from drainages located east or west of Cape Nome. The Nome Subdistrict chum salmon escapement goal range of 23,000 to 35,000 fish has been achieved and will easily be exceeded this year. There are also three rivers that have escapement goals. The escapement goal range at Eldorado River is 6,000 to 9,200 chum salmon and the escapement this season is over double the high end of the range. The Snake and Nome River escapement goals have also been achieved and escapements at these rivers will likely approach or exceed the upper bound of their respective escapement goal ranges. This brief commercial period will also not jeopardize subsistence uses or escapement needs of chum salmon in the Nome Subdistrict.
Emergency Order: 3-S-Z-39-13 Effective Date: July 27, 2013
EXPLANATION: This emergency order reopens Subdistrict 5 of the Norton Sound Subdistrict, the Shaktoolik Subdistrict, for one 72-hour period from 6:00 p.m. Saturday, July 27 to 6:00 p.m. Tuesday, July 30. Permit holders in Subdistricts 5 are limited to 100 fathoms of net in aggregate length and set gillnets must have a stretched-mesh size no greater than 6 inches. This emergency order also prohibits the sale of king salmon incidentally harvested during these directed chum salmon openings.
JUSTIFICATION: Chum salmon abundance in the Shaktoolik River drainage is more than sufficient to warrant additional fishing time in Subdistricts 5. Apportioned sonar count estimated passage for the Shaktoolik River is 52,000 chum salmon. Additional opportunity to target chum salmon for commercial purposes is warranted due to the large chum salmon surplus. The department will transition to coho salmon management next week. Per the Subdistricts 5 and 6 King Salmon Management Plan, permit holders may retain but cannot sell king salmon incidentally harvested in the commercial salmon fishery. King salmon retained for subsistence purposes must be recorded in the personal use section of each fish ticket at the time of delivery.
Emergency Order: 3-S-Z-40-13 Effective Date: July 27, 2013
-continued-
217

Appendix G7.–Page 27 of 34.
EXPLANATION: This emergency order reopens Norton Sound Subdistrict 6, the Unalakleet Subdistrict, from 6:00 p.m. Saturday, July 27 to 6:00 p.m. Tuesday, July 30. Permit holders in Subdistricts 6 are limited to 100 fathoms of net in aggregate length and set gillnets must have a stretched-mesh size no greater than 6 inches. This emergency order also prohibits the sale of king salmon incidentally harvested during these directed chum salmon openings.
JUSTIFICATION: Cumulative chum salmon passage at the Unalakleet River weir is nearly 84,000 chum salmon as of July 25. Escapement needs of chum salmon have been achieved and inriver abundance of chum salmon is more than sufficient to provide for subsistence uses of Unalakleet Subdistrict residents. Given the above average abundance of chum salmon, longer commercial periods directed on chum salmon are warranted in Subdistrict 6. However, the department will switch to coho salmon management next week and use shorter index periods of 48 hours in duration in order to assess coho salmon run strength. Per the Subdistricts 5 and 6 King Salmon Management Plan, permit holders may retain but cannot sell king salmon incidentally harvested in the commercial salmon fishery. King salmon retained for subsistence purposes must be recorded in the personal use section of each fish ticket at the time of delivery.
Emergency Order: 3-S-Z-41-13 Effective Date: July 28, 2013
EXPLANATION: This emergency order reopens Subdistrict 4 of the Norton Sound Subdistrict, the Norton Bay Subdistrict, for 72 hours from 6:00 p.m. Sunday, July 28 to 6:00 p.m. Wednesday, July 31. Permit holders in Subdistrict 4 are limited to 100 fathoms of net in aggregate length and set gillnets must have a stretched-mesh size no greater than 6 inches.
JUSTIFICATION: Norton Bay fishermen have already harvested 30,000 chum salmon this season, which is well above the previous record harvest of 21,973 taken back in 1978. Escapement of chum salmon into Norton Bay salmon-producing drainages has also been strong as indexed by the NSEDC-operated Inglutalik River tower. Cumulative passage of chum salmon at Inglutalik River tower is over 46,000 fish, which is more than sufficient to meet subsistence needs and provide escapements to ensure future returns of chum salmon. The increase in commercial fishing time is warranted because large harvestable surpluses of chum salmon remain in Norton Bay and there continues to be buyer interest. The department will switch to coho salmon management next week and use historical catch statistic comparisons with current year catch statistics to adjust fishing time in Norton Bay.
Emergency Order: 3-S-Z-42-13 Effective Date: July 31, 2013
EXPLANATION: This emergency order reopens the all marine waters in Subdistrict 1 of the Norton Sound Subdistrict, the Nome Subdistrict, for one 24-hour period from 12:00 p.m. Wednesday, July 31 to 12:00 p.m. Thursday, August 1. Permit holders in Subdistrict 1 are limited to 100 fathoms of net in aggregate length and set gillnets must have a stretched-mesh size no greater than 6 inches.
JUSTIFICATION: The Nome Subdistrict chum salmon escapement goal range of 23,000 to 35,000 fish has been exceeded this year. There are also three rivers that have escapement goals. The Snake and Nome River escapement goals have also been achieved and escapements at these rivers will likely approach or exceed the upper bound of their respective escapement goal ranges. This brief commercial period will also not jeopardize subsistence uses or escapement needs of chum salmon in the Nome Subdistrict.
Emergency Order: 3-S-Z-43-13 Effective Date: August 1, 2013
EXPLANATION: This emergency order reopens Subdistrict 2, the Golovnin Bay Subdistrict of the Norton Sound District, to commercial salmon fishing for 24 hours from 6:00 p.m. Thursday, August 1 to 6:00 p.m. Friday, August 2. This period is directed at chum salmon and permit holders will be restricted to gillnets with a mesh size of 6 inches or less.
JUSTIFICATION: This period is being established to index early run strength of coho salmon. Catch statistics from this period will be compared to historical catch statistics to determine if additional commercial fishing is justified. Additional periods may be allowed if catch statistics indicate that continued commercial fishing will not jeopardize
-continued-
218

Appendix G7.–Page 28 of 34.
subsistence uses or escapement needs of coho salmon in the Fish River drainage and other drainages emptying into Golovin Lagoon. Aerial surveys will be flown on the spawning grounds in late August or early September to index spawning escapement of coho salmon in the Fish River drainage.
Emergency Order: 3-S-Z-44-13 Effective Date: August 1, 2013
EXPLANATION: This emergency order opens all marine waters from Carson Creek eastward to Iron Creek in Norton Sound Subdistrict 3, the Elim Subdistrict, to commercial salmon fishing for 24 hours from 6:00 p.m. Thursday, August 1 to 6:00 p.m. Friday August 2.
JUSTIFICATION: This will provide commercial permit holders with some early opportunity to target coho salmon and provide an early index of coho salmon run strength. Kwiniuk River tower personnel have enumerated 100 coho salmon as of July 28, which is above counts from the 2010–2012 seasons for this date. In all years with counts this high for July 28, escapements of coho salmon have been more than sufficient to meet the aerial survey escapement goal (650–1,300 cohos), provide for inriver subsistence harvests, and allow for commercial harvests. However, it is too early to ascertain if the run is merely early or if the good initial counts indicate good early run strength. Tower counts and catch statistics from this index opening will be evaluated to determine if additional commercial harvest opportunities can be allowed. Spawning ground surveys will also be flown later this month to index this season’s Tubutulik River coho salmon escapement.
Emergency Order: 3-S-Z-45-13 Effective Date: July 31, 2013
EXPLANATION: This emergency order reopens Subdistrict 5 and 6 of the Norton Sound Subdistrict, the Shaktoolik and Unalakleet Subdistricts, for one 48-hour period from 6:00 p.m. Wednesday, July 31 to 6:00 p.m. Friday, August 2. Permit holders in Subdistricts 5 and 6 are limited to 100 fathoms of net in aggregate length and set gillnets must have a stretched-mesh size no greater than 6 inches. This emergency order also prohibits the sale of king salmon incidentally harvested during this directed coho salmon opening.
JUSTIFICATION: Coho salmon abundance in southern Norton Sound as indexed by the Unalakleet River weir passage and North River tower passage is tracking ahead of counts during the 2011 and 2012 seasons. This initial opportunity to target coho salmon for commercial purposes is warranted to index early coho salmon run strength and recent run performance history suggests that this period will not negatively impact subsistence uses of coho salmon or jeopardize escapement needs of coho salmon in the Shaktoolik and Unalakleet River drainages. North River tower counts and historical radiotelemetry data will be analyzed to estimate inriver abundance of coho salmon to ensure that escapement and inriver subsistence uses of coho salmon will be met before committing to longer periods or a set schedule for the remainder of the season. Per the Subdistricts 5 and 6 King Salmon Management Plan, permit holders may retain but cannot sell king salmon incidentally harvested in the commercial salmon fishery. King salmon retained for subsistence purposes must be recorded in the personal use section of each fish ticket at the time of delivery.
Emergency Order: 3-S-Z-46-13 Effective Date: August 2, 2013
EXPLANATION: This emergency order reopens Subdistrict 4 of the Norton Sound Subdistrict, the Norton Bay Subdistrict, for 48 hours from 6:00 p.m. Friday, August 2 to 6:00 p.m. Sunday, August 4. Permit holders in Subdistrict 4 are limited to 100 fathoms of net in aggregate length and set gillnets must have a stretched-mesh size no greater than 6 inches.
JUSTIFICATION: Coho salmon management begins this week and the department will use historical catch statistic comparisons with current year catch statistics to adjust fishing time in Norton Bay. Spawning ground surveys will be flown in late August to index the coho salmon spawning escapement to the Ungalik and Inglutalik Rivers, the major salmon producing drainages in Norton Bay.
Emergency Order: 3-S-Z-47-13 Effective Date: August 5, 2013
-continued-
219

Appendix G7.–Page 29 of 34.
EXPLANATION: This emergency order reopens Subdistrict 2, the Golovnin Bay Subdistrict of the Norton Sound District, to commercial salmon fishing for 36 hours from 12:00 p.m. Monday, August 5 to 12:00 a.m. Wednesday, August 7. This period is directed at coho salmon and permit holders will be restricted to gillnets with a mesh size of 6 inches or less.
JUSTIFICATION: This period is being established to provide additional commercial harvest opportunity directed on coho salmon. Catch statistics from this period will be compared to historical catch statistics to determine if additional commercial fishing is justified. The August 1st opening catch of 527 coho salmon in Golovin Subdistrict by 7 permit holders was 92% above the long-term average catch of 274 coho salmon for the first week of August. The latest catch statistics indicate that abundance of coho salmon will be sufficient to achieve escapement needs and provide for inriver subsistence uses of coho salmon. Catch statistics will be evaluated from this 36-hour opening to determine if additional fishing or periods of longer duration can be allowed without jeopardizing escapement or subsistence needs. Additional periods may be allowed if catch statistics indicate that continued commercial fishing will not jeopardize subsistence uses or escapement needs of coho salmon in the Fish River drainage and other drainages emptying into Golovin Lagoon. Aerial surveys will be flown on the spawning grounds in late August or early September to index spawning escapement of coho salmon in the Fish River drainage.
Emergency Order: 3-S-Z-48-13 Effective Date: August 5, 2013
EXPLANATION: This emergency order opens all marine waters from Carson Creek eastward to Iron Creek in Norton Sound Subdistrict 3, the Elim Subdistrict, to commercial salmon fishing for 36 hours from 12:00 p.m. Monday, August 5 to 12:00 a.m. Wednesday August 7.
JUSTIFICATION: This brief opening will provide commercial permit holders with harvest opportunity to target coho salmon and provide an additional index of coho salmon run strength. In the Elim Subdistrict, 12 permit holders caught 457 cohos during the most recent 24 hours opening. This catch was slightly above average for the first week of August. There have been 657 coho salmon enumerated at the Kwiniuk River as of midnight August 3, which is 21% below the 2008–2012 average count of 797 cohos for August 2. However, projected escapement estimates of coho salmon based on this count range from 3,900–6,800 coho salmon for the season for runs with early and normal migration timing, respectively. Current comparative catch statistics and escapement information indicate that abundance of coho salmon is on track achieve escapement needs and provide for inriver subsistence uses of coho salmon in the Elim Subdistrict. Escapements and catch statistics will be evaluated from this 36-hour opening to determine if additional fishing or periods of longer duration can be allowed without jeopardizing escapement or subsistence needs. Escapement of coho salmon to Subdistrict 3 will be evaluated using tower counts at the Kwiniuk River and the Kwiniuk River aerial survey goal range of 650–1,300 fish. Spawning ground surveys will also be flown later this month to index this season’s Tubutulik River coho salmon escapement.
Emergency Order: 3-S-Z-49-13 Effective Date: August 5, 2013
EXPLANATION: This emergency order reopens Subdistrict 4 of the Norton Sound Subdistrict, the Norton Bay Subdistrict, for 48 hours from 6:00 p.m. Monday, August 5 to 6:00 p.m. Wednesday, August 7. Permit holders in Subdistrict 4 are limited to 100 fathoms of net in aggregate length and set gillnets must have a stretched-mesh size no greater than 6 inches.
JUSTIFICATION: Coho salmon season is underway. Recent catches of coho salmon from the Norton Bay Subdistrict this past week were average to above average for early August. Additionally, 2,700 cohos have been harvested to date in Norton Bay which is on track to establish a new record harvest for Norton Bay Subdistrict. During a July 30 aerial survey of the Ungalik River, department biologists observed over 1,000 coho salmon in the lower reach of the Ungalik. The good early survey count of coho salmon suggests that inriver abundance of coho salmon will be more than sufficient to provide for future returns and meet the subsistence priority. Peak spawning
-continued-
220

Appendix G7.–Page 30 of 34.
ground surveys will be flown in late August to index the coho salmon spawning escapement to the Ungalik River, the major coho salmon producing drainage in Norton Bay.
Emergency Order: 3-S-Z-50-13 Effective Date: August 4, 2013
EXPLANATION: This emergency order reopens Subdistrict 5 and 6 of the Norton Sound Subdistrict, the Shaktoolik and Unalakleet Subdistricts, to a commercial fishing schedule of two 48-hour periods per week until the end of the Subdistricts 5 and 6 season. Periods will be from 6:00 p.m. Sundays to 6:00 p.m. Tuesdays and from 6:00 p.m. Wednesdays to 6:00 p.m. Fridays. Permit holders in Subdistricts 5 and 6 are limited to 100 fathoms of net in aggregate length and set gillnets must have a stretched-mesh size no greater than 6 inches. This emergency order also prohibits the sale of king salmon incidentally harvested during the directed coho salmon fishery.
JUSTIFICATION: Coho salmon abundance in southern Norton Sound as indexed by the North River tower passage is tracking well ahead of counts during the 2011 and 2012 seasons. This schedule will provide fishermen and the buyer with an orderly fishery. The schedule is warranted based on current projections of North River coho salmon escapement, projected Unalakleet River inriver coho salmon abundance, and recent run performance trends. This schedule is not expected to negatively impact subsistence uses of coho salmon or jeopardize escapement needs of coho salmon in the Shaktoolik and Unalakleet River drainages. Escapement to the North River tributary is at 1,602 coho salmon as of August 3. Drainagewide escapement projections based on the North River tower count and historical radiotelemetry data range from 38,000–54,000 coho salmon for runs with early and normal migration timing, respectively. More importantly, this level of inriver abundance will be more than sufficient to achieve the North River aerial survey goal range of 550–1,100 fish and provide for inriver subsistence and sport fish harvest needs. Shaktoolik and Unalakleet Subdistricts will remain on this schedule for the remainder of the season unless projections decrease dramatically and reductions in fishing time are needed to ensure that subsistence harvest needs will not be jeopardized by commercial fishing. Per the Subdistricts 5 and 6 King Salmon Management Plan, permit holders may retain but cannot sell king salmon incidentally harvested in the commercial salmon fishery. King salmon retained for subsistence purposes must be recorded in the personal use section of each fish ticket at the time of delivery.
Emergency Order: 3-S-Z-51-13 Effective Date: August 8, 2013
EXPLANATION: This emergency order reopens Subdistrict 2, the Golovnin Bay Subdistrict of the Norton Sound District, to commercial salmon fishing for 36 hours from 12:00 p.m. Thursday, August 8 to 12:00 a.m. Saturday, August 10. This period is directed at coho salmon and permit holders will be restricted to gillnets with a mesh size of 6 inches or less.
JUSTIFICATION: This period is being established to provide additional commercial harvest opportunity directed on coho salmon. The August 5th opening catch of 861 coho salmon in Golovin Subdistrict by 8 permit holders was 192% above the long-term average catch of 282 coho salmon for the first week of August. The August 5th catch was also the fifth best ever for a single period and the 2013 cumulative harvest of 1,700 cohos lags only behind the record 2010 season’s catch for this date. Additional periods may be allowed if catch statistics indicate that continued commercial fishing will not jeopardize subsistence uses or escapement needs of coho salmon in the Fish River drainage and other drainages emptying into Golovin Lagoon. Aerial surveys will be flown on the spawning grounds in late August or early September to index spawning escapement of coho salmon in the Fish River drainage.
Emergency Order: 3-S-Z-52-13 Effective Date: August 8, 2013
EXPLANATION: This emergency order opens all marine waters of Norton Sound Subdistrict 3, the Elim Subdistrict, to commercial salmon fishing for 36 hours from 12:00 p.m. Thursday, August 8 to 12:00 a.m. Saturday August 10.
JUSTIFICATION: This brief opening will provide commercial permit holders with harvest opportunity to target coho salmon and provide an additional index of coho salmon run strength. In the Elim Subdistrict, 9 permit holders
-continued-
221

Appendix G7.–Page 31 of 34.
caught 511 cohos during the most recent 36-hour opening. This catch was 19% above the average catch of 421 cohos for the first week of August. There have been nearly 1,200 coho salmon enumerated at the Kwiniuk River as of 8:00 a.m. August 8, which is 18% below the 2008–2012 average count of 1,448 cohos for August 8. However, projected escapement estimates of coho salmon based on this count range from 4,200–5,700 coho salmon for runs with early and normal migration timing, respectively. Current catch statistics and escapement information indicate that abundance of coho salmon continues to build in Subdistrict 3 and will be sufficient to achieve escapement needs and provide for subsistence uses. Escapements and catch statistics will be evaluated from this 36-hour opening to determine if additional fishing or periods of longer duration can be allowed without jeopardizing escapement or subsistence needs. Escapement of coho salmon to Subdistricts 2 and 3 will be evaluated using tower counts at the Kwiniuk River and the Kwiniuk River aerial survey goal range of 650–1,300 fish.
Emergency Order: 3-S-Z-53-13 Effective Date: August 9, 2013
EXPLANATION: This emergency order reopens Subdistrict 4 of the Norton Sound Subdistrict, the Norton Bay Subdistrict, for 48 hours from 6:00 p.m. Friday, August 9 to 6:00 p.m. Sunday, August 11. Permit holders in Subdistrict 4 are limited to 100 fathoms of net in aggregate length and set gillnets must have a stretched-mesh size no greater than 6 inches.
JUSTIFICATION: Coho salmon season is underway. Recent catches of coho salmon from the Norton Bay Subdistrict this past week were average to above average for early August. Additionally, nearly 3,500 cohos have been harvested to date in Norton Bay which is on track to establish a new record harvest for Norton Bay Subdistrict this season. During a July 30 aerial survey of the Ungalik River, department biologists observed over 1,000 coho salmon in the lower reach of the Ungalik. The good early survey count of coho salmon suggests that inriver abundance of coho salmon will be more than sufficient to provide for future returns and meet the subsistence priority. Peak spawning ground surveys will be flown in late August to index the coho salmon spawning escapement to the Ungalik River, the major coho salmon producing drainage in Norton Bay.
Emergency Order: 3-S-Z-54-13 Effective Date: August 11, 2013
EXPLANATION: This emergency order reopens Subdistricts 2 and 3 of the Norton Sound District, to commercial salmon fishing for 36 hours from 12:00 p.m. Sunday, August 11 to 12:00 a.m. Tuesday, August 13. This period is directed at coho salmon and permit holders will be restricted to gillnets with a mesh size of 6 inches or less.
JUSTIFICATION: This period is being established to provide additional commercial harvest opportunity directed on coho salmon. The August 8 opening catch of 1,476 coho salmon in Golovin Subdistrict by 7 permit holders was a record catch for one fishing period. Department staff plan to fly an aerial survey next week of the Niukluk River drainage to estimate early escapement numbers. In Elim Subdistrict the catch was 886 coho salmon by 14 permit holders and was average for this date. Escapement at Kwiniuk River counting tower is 1,254 coho salmon with the average first quarter point of passage at the tower on August 10. Projections show that escapement will be met. Continuing with short duration openings should not jeopardize reaching escapement goals or subsistence fishing opportunity.
Emergency Order: 3-S-Z-55-13 Effective Date: August 12, 2013
EXPLANATION: This emergency order opens Subdistrict 4 of the Norton Sound District to a fishing schedule of two 48-hour commercial fishing periods per week from 6:00 p.m. Monday to 6:00 p.m. Wednesday and from 6 p.m. Thursday until 6 p.m. Saturday through September 7. Permit holders in Subdistrict 4 are limited to 100 fathoms of net in aggregate length and set gillnets must have a stretched-mesh size no greater than 6 inches.
JUSTIFICATION: Catches of coho salmon from the Norton Bay Subdistrict during recent 48 hour fishing periods have been average for mid-August. Additionally, nearly 4,200 coho salmon have been harvested to date in Norton
-continued-
222

Appendix G7.–Page 32 of 34.
Bay which is on track to establish a new record harvest for Norton Bay Subdistrict this season. During a July 30 aerial survey of the Ungalik River, department biologists observed over 1,000 coho salmon in the lower reach of the Ungalik. The tower crew has enumerated over 5,000 coho salmon through August 11, but water has been high and turbid so there may some doubt as to accurate speciation. The good early survey count of coho salmon suggests that inriver abundance of coho salmon will be more than sufficient to provide for future returns and meet the subsistence priority. Peak spawning ground surveys will be flown in late August to index the coho salmon spawning escapement to the Ungalik River, the major coho salmon producing drainage in Norton Bay.
Emergency Order: 3-S-Z-56-13 Effective Date: August 14, 2013
EXPLANATION: This emergency order reopens Subdistricts 2 and 3 of the Norton Sound District, the Golovin and Elim Subdistricts, to commercial salmon fishing for 48 hours from 6:00 p.m. Wednesday, August 14 to 6:00 p.m. Friday, August 16. This period is directed at coho salmon and permit holders will be restricted to gillnets with a mesh size of 6 inches or less.
JUSTIFICATION: This period is being established to maximize commercial harvest opportunity of coho salmon at the historical peak of the coho salmon run. The August 8 opening catch of 1,476 coho salmon in the Golovin Subdistrict was a record catch for one fishing period, and the August 11th catch of 940 was more than double the historical average catch for mid-August. On August 13th, department staff flew an early aerial survey of the Niukluk River drainage to estimate initial escapement numbers. There is no longer an escapement counting project at Niukluk River in the Golovin Subdistrict. However, 630 coho salmon were counted in the Niukluk River from Ophir Creek downstream to the Fish River confluence during an August 13 aerial survey conducted by department personnel under fair to poor viewing conditions. These early survey results suggest that coho salmon escapement will be achieved as the old aerial survey goal of 950–1,900 coho salmon correlated well with the tower-based goal of 2,400–7,200 coho salmon. The survey count of 630 fish is also considered to be very conservative because of the difficult viewing conditions. To ensure that escapement and subsistence needs of coho salmon are met, the department may need to reduce commercial fishing opportunity in Golovin Subdistrict if catch statistics drop below historical average catch statistics during this opening. In Elim Subdistrict the catch was 734 coho salmon by 15 permit holders and was below average for this date. However, escapement at Kwiniuk River counting tower is nearly 1,800 coho salmon with the average first quarter point of passage at the tower on August 10. Projections show that the Kwiniuk River aerial survey escapement goal of 650–1,300 will be easily achieved. This 48-hour opening should also not jeopardize reaching escapement goals or subsistence fishing opportunity.
Emergency Order: 3-S-Z-57-13 Effective Date: August 19, 2013
EXPLANATION: This emergency order reopens Subdistricts 2 and 3 of the Norton Sound District, the Golovin and Elim Subdistricts, to commercial salmon fishing for 48 hours from 6:00 p.m. Monday, August 19 to 6:00 p.m. Wednesday, August 21. This period is directed at coho salmon and permit holders will be restricted to gillnets with a mesh size of 6 inches or less.
JUSTIFICATION: This period is being established to provide additional commercial harvest opportunity of coho salmon. An estimated 609 and 880 coho salmon were harvested in the Golovin and Elim Subdistricts during the most recent 48-hour opening ending Friday, August 16. Catches were above average in Golovin and average in Elim for the third week of August. On August 13th, department staff flew an early aerial survey of the Niukluk River drainage to estimate initial escapement numbers. There is no longer an escapement counting project at Niukluk River in the Golovin Subdistrict. However, 630 coho salmon were counted in the Niukluk River from Ophir Creek downstream to the Fish River confluence during an August 13 aerial survey conducted by department personnel under fair to poor viewing conditions. These early survey results suggest that coho salmon escapement will be achieved as the old aerial survey goal of 950–1,900 coho salmon correlated well with the tower-based goal of 2,400–7,200 coho salmon.
-continued-
223

Appendix G7.–Page 33 of 34.
The survey count of 630 fish is also considered to be very conservative because of the difficult viewing conditions. Peak spawning ground surveys will be flown later this month. Escapement of coho salmon in the Elim Subdistrict as indexed by Kwiniuk River counting tower is 2,250 coho salmon with the average midpoint of passage at the tower on August 20. Projections show that the Kwiniuk River aerial survey escapement goal of 650–1,300 will be easily achieved. Furthermore, continued commercial fishing with 48-hour openings and escapement windows between periods should also not jeopardize subsistence uses of coho salmon for Elim residents.
Emergency Order: 3-S-Z-58-13 Effective Date: August 22, 2013
EXPLANATION: This emergency order supersedes 3-S-Z-55-13 and closes the fishing period beginning at 6 p.m. August 22 and moves that scheduled 48-hour fishing period 24 hours later to now start at 6 p.m. Friday, August 23 and conclude at 6 p.m. Sunday, August 25. Permit holders in Subdistrict 4 are limited to 100 fathoms of net in aggregate length and set gillnets must have a stretched-mesh size no greater than 6 inches.
JUSTIFICATION: The buyer has requested that the scheduled fishing period be shifted to one day later. Because Subdistrict 4 is on a schedule of two 48-hour commercial salmon fishing periods per week there is no concern with shifting the fishing period to one day later.
Emergency Order: 3-S-Z-59-13 Effective Date: August 23, 2013
EXPLANATION: This emergency order reopens Subdistricts 2 and 3 of the Norton Sound District, the Golovin and Elim Subdistricts, to commercial salmon fishing for 48 hours from 6:00 p.m. Friday, August 23 to 6:00 p.m. Sunday, August 25. This period is directed at coho salmon and permit holders are restricted to gillnets with a mesh size of 6 inches or less.
JUSTIFICATION: The recent 48-hour fishing period in Subdistricts 2 and 3 had average catches when compared to the historical averages. The escapement goal is projected to be made in each subdistrict. The escapement goal is determined by aerial survey in Subdistrict 2 and is expected to be made based on an earlier aerial survey projection. The escapement goal in Subdistrict 3 is also determined by aerial survey and Kwiniuk River counting crew has enumerated four times the lower end of the coho salmon escapement goal needed by aerial survey. The upcoming fishing period should not jeopardize subsistence opportunity or escapement.
Emergency Order: 3-S-Z-60-13 Effective Date: August 27, 2013
EXPLANATION: This emergency order opens all marine waters of Norton Sound Subdistrict 3, the Elim Subdistrict, to commercial salmon fishing for one 48-hour period from 6:00 p.m. Tuesday, August 27 to 6:00 p.m. Thursday, August 29, and one 40-hour period from 8:00 a.m. Friday, August 30 to 12:00 midnight Saturday evening, August 31. Permit holders are limited to 100 fathoms of net with a mesh size no greater than 6 inches. This emergency order also closes the commercial salmon season in the Elim Subdistrict effect 12:00 midnight.
JUSTIFICATION: Escapement of coho salmon to Subdistrict 3 as indexed by Kwiniuk River tower counts is over 3,200 coho salmon. Current projections of inriver abundance based on these tower counts range from 4,100 and 5,300 cohos. This level of inriver abundance is sufficient to provide for upriver subsistence harvests of coho salmon and enough fish to achieve the Kwiniuk River aerial survey goal range of 650–1,300 fish. Catches of coho salmon in the commercial fishery continue to be average to above average for late August and these additional periods are warranted to utilize remaining harvestable surpluses.
Emergency Order: 3-S-Z-61-13 Effective Date: August 27, 2013
EXPLANATION: This emergency order supersedes emergency order 3-S-Z-55-13 and reopens Subdistrict 4 of the Norton Sound Subdistrict, the Norton Bay Subdistrict, to a new commercial fishing schedule of two 48-hour periods per week until the end of the Subdistrict 4 season, which closes by emergency order effective 6:00 p.m. Thursday,
-continued-
224
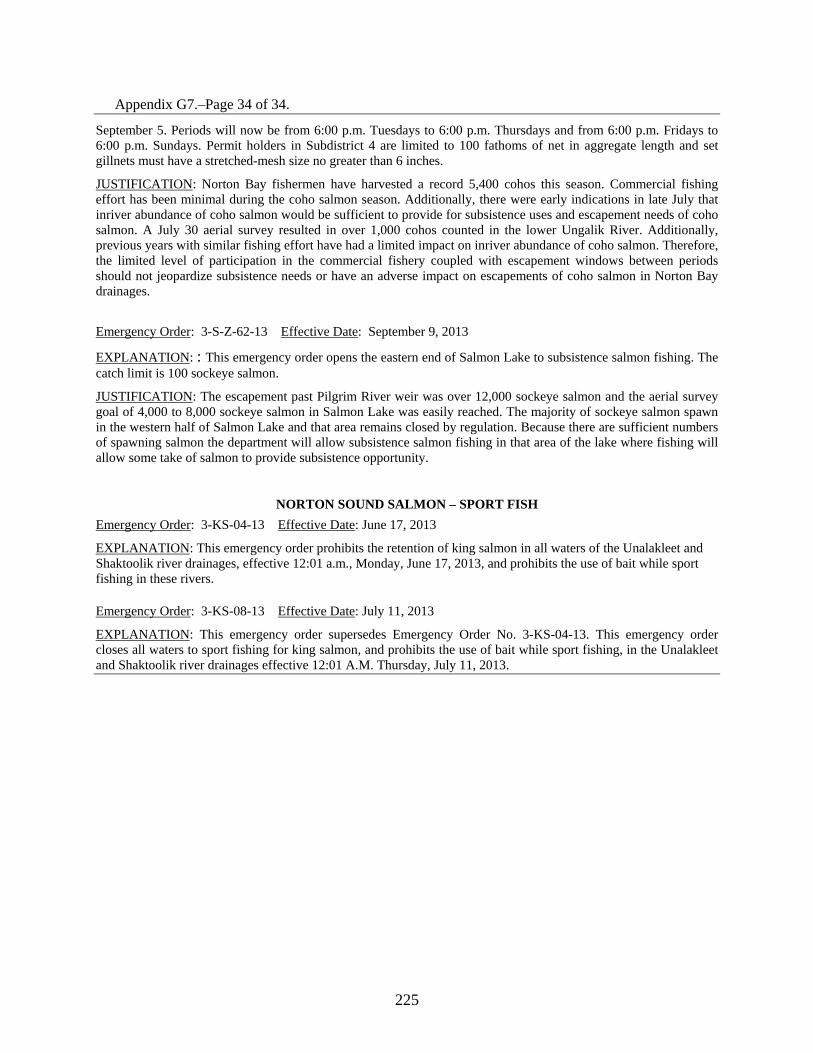
Appendix G7.–Page 34 of 34.
September 5. Periods will now be from 6:00 p.m. Tuesdays to 6:00 p.m. Thursdays and from 6:00 p.m. Fridays to 6:00 p.m. Sundays. Permit holders in Subdistrict 4 are limited to 100 fathoms of net in aggregate length and set gillnets must have a stretched-mesh size no greater than 6 inches.
JUSTIFICATION: Norton Bay fishermen have harvested a record 5,400 cohos this season. Commercial fishing effort has been minimal during the coho salmon season. Additionally, there were early indications in late July that inriver abundance of coho salmon would be sufficient to provide for subsistence uses and escapement needs of coho salmon. A July 30 aerial survey resulted in over 1,000 cohos counted in the lower Ungalik River. Additionally, previous years with similar fishing effort have had a limited impact on inriver abundance of coho salmon. Therefore, the limited level of participation in the commercial fishery coupled with escapement windows between periods should not jeopardize subsistence needs or have an adverse impact on escapements of coho salmon in Norton Bay drainages.
Emergency Order: 3-S-Z-62-13 Effective Date: September 9, 2013
EXPLANATION: : This emergency order opens the eastern end of Salmon Lake to subsistence salmon fishing. The catch limit is 100 sockeye salmon.
JUSTIFICATION: The escapement past Pilgrim River weir was over 12,000 sockeye salmon and the aerial survey goal of 4,000 to 8,000 sockeye salmon in Salmon Lake was easily reached. The majority of sockeye salmon spawn in the western half of Salmon Lake and that area remains closed by regulation. Because there are sufficient numbers of spawning salmon the department will allow subsistence salmon fishing in that area of the lake where fishing will allow some take of salmon to provide subsistence opportunity.
NORTON SOUND SALMON – SPORT FISH Emergency Order: 3-KS-04-13 Effective Date: June 17, 2013
EXPLANATION: This emergency order prohibits the retention of king salmon in all waters of the Unalakleet and Shaktoolik river drainages, effective 12:01 a.m., Monday, June 17, 2013, and prohibits the use of bait while sport fishing in these rivers.
Emergency Order: 3-KS-08-13 Effective Date: July 11, 2013
EXPLANATION: This emergency order supersedes Emergency Order No. 3-KS-04-13. This emergency order closes all waters to sport fishing for king salmon, and prohibits the use of bait while sport fishing, in the Unalakleet and Shaktoolik river drainages effective 12:01 A.M. Thursday, July 11, 2013.
225

226

APPENDIX H: ARCTIC FISHERIES
227
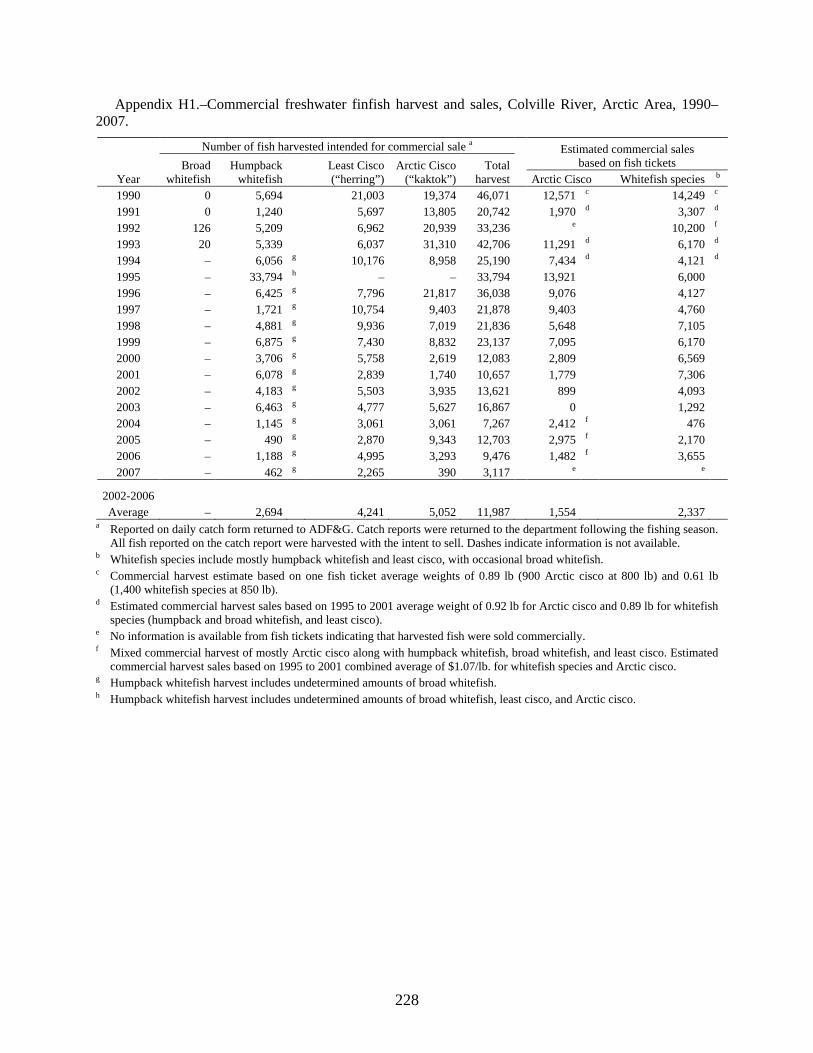
Appendix H1.–Commercial freshwater finfish harvest and sales, Colville River, Arctic Area, 1990–2007.
Number of fish harvested intended for commercial sale a Estimated commercial sales based on fish tickets
Broad
whitefish Humpback
whitefish Least Cisco (“herring”)
Arctic Cisco (“kaktok”)
Total harvest Year Arctic Cisco Whitefish species b
1990 0 5,694
21,003 19,374 46,071
12,571 c 14,249 c 1991 0 1,240
5,697 13,805 20,742
1,970 d 3,307 d
1992 126 5,209
6,962 20,939 33,236
e
10,200 f 1993 20 5,339
6,037 31,310 42,706
11,291 d 6,170 d
1994 – 6,056 g 10,176 8,958 25,190
7,434 d 4,121 d 1995 – 33,794 h – – 33,794
13,921
6,000
1996 – 6,425 g 7,796 21,817 36,038
9,076
4,127 1997 – 1,721 g 10,754 9,403 21,878
9,403
4,760
1998 – 4,881 g 9,936 7,019 21,836
5,648
7,105 1999 – 6,875 g 7,430 8,832 23,137
7,095
6,170
2000 – 3,706 g 5,758 2,619 12,083
2,809
6,569 2001 – 6,078 g 2,839 1,740 10,657
1,779
7,306
2002 – 4,183 g 5,503 3,935 13,621
899
4,093 2003 – 6,463 g 4,777 5,627 16,867
0
1,292
2004 – 1,145 g 3,061 3,061 7,267
2,412 f 476 2005 – 490 g 2,870 9,343 12,703
2,975 f 2,170
2006 – 1,188 g 4,995 3,293 9,476 1,482 f 3,655 2007 – 462 g 2,265 390 3,117 e
e
2002-2006
Average – 2,694 4,241 5,052 11,987 1,554 2,337 a Reported on daily catch form returned to ADF&G. Catch reports were returned to the department following the fishing season.
All fish reported on the catch report were harvested with the intent to sell. Dashes indicate information is not available. b Whitefish species include mostly humpback whitefish and least cisco, with occasional broad whitefish. c Commercial harvest estimate based on one fish ticket average weights of 0.89 lb (900 Arctic cisco at 800 lb) and 0.61 lb
(1,400 whitefish species at 850 lb). d Estimated commercial harvest sales based on 1995 to 2001 average weight of 0.92 lb for Arctic cisco and 0.89 lb for whitefish
species (humpback and broad whitefish, and least cisco). e No information is available from fish tickets indicating that harvested fish were sold commercially. f Mixed commercial harvest of mostly Arctic cisco along with humpback whitefish, broad whitefish, and least cisco. Estimated
commercial harvest sales based on 1995 to 2001 combined average of $1.07/lb. for whitefish species and Arctic cisco. g Humpback whitefish harvest includes undetermined amounts of broad whitefish. h Humpback whitefish harvest includes undetermined amounts of broad whitefish, least cisco, and Arctic cisco.
228