Embed Size (px)
Citation preview


Town of HullFiscal Year 2014 Projected Revenue and Expenditures
Revenue Summary FY 13 FY 14 Dollar Change Percent Change
1 Real Estate/Property Taxes
2 Base Tax Levy 23,344,777 24,046,365 701,588 3.01%
3 Statutory 2 1/2 Increase 583,619 601,159 17,540 3.01%
4 Growth in Tax Base 117,969 140,000 22,031 18.68%
5 Debt Exclusion-High School 497,038 486,563 (10,475) -2.11%
6 Maximum Allowable Tax Levy 24,543,403 25,274,087 730,684 2.98%
7 Intergovernmental Revenues
8 State Revenue Sharing 5,875,638 5,875,638 0 0.00%
9 Less School & Library Offsets (14,048) (14,048) 0 0.00%
10 Projected Net State Aid 5,861,590 5,861,590 0 0.00%
11 Local Receipts
12 Estimated Local Receipts 2,735,830 3,027,706 291,876 10.67%
13 Overlay Surplus 75,000 200,000 125,000 166.67%
14 Available Funds (Free Cash) 850,000 1,246,369 396,369 46.63%
15 Stabilization Fund 252,144 0 (252,144) -100.00%
16 Additional PILOT-Light 0 0 0
17 PILOT-HRA 65,000 55,000 (10,000) -15.38%
18 Reserved for Appropriation 20,000 58,000 38,000 190.00%
19 Transfer from Enterprise-ROB 159,315 166,240 6,925 4.35%
20 Total Local Receipts 4,157,289 4,753,315 596,026 14.34%
21 Enterprise Funds
22 Sewer Operating Budget 2,301,448 2,355,226 53,778 2.34%
23 Sewer Debt 568,267 561,630 (6,637) -1.17%
24 Harbormaster 132,451 142,911 10,460 7.90%
25 Harbor Debt 19,375 108,160 88,785 458.25%
26 Enterprise OPEB 0 48,000 48,000 400.00%
27 Total Enterprise Fund Revenue 3,021,541 3,215,927 194,386 6.43%
28 TOTAL RECEIPTS 37,583,823 39,104,919 1,521,096 4.05%
II Expenditure Summary FY13 FY14 Dollar Change Percent Change
29 General Government 22,232,976 23,052,404 819,428 3.69%
30 General Reserve 50,000 50,000 0 0.00%
31 Health Insurance 3,906,089 3,925,000 18,911 0.48%
32 Other Insurances 1,158,600 1,261,291 102,691 8.86%
33 Town Wide 281,500 269,625 (11,875) -4.22%
34 Unemployment 85,000 75,000 (10,000) -11.76%
35 Pension Total 3,206,926 3,315,000 108,074 3.37%
36 Debt & Interest 1,971,197 2,059,362 88,165 4.47%
37 Capital Improvements-General 210,000 344,000 134,000 63.81%
38 Reserve for State Aid reduction 222,684 0
39 Total Services Costs 33,324,972 34,351,682 1,026,710 3.08%
40 Enterprise Funds
41 Sewer Operating Budget 2,301,448 2,355,226 53,778 2.34%
42 Sewer Debt 568,267 561,630 (6,637) -1.17%
43 Harbormaster Operating Budget 132,451 142,911 10,460 7.90%
44 Harbormaster Debt 19,375 108,160 88,785 458.25%
45 Enterprise OPEB 0 48,000 48,000 100.00%
46 Enterprise Fund Expenditures 3,021,541 3,215,927 194,386 6.43%
47 Other
48 Overlay 325,000 305,000 (20,000) -6.15%
49 Snow Removal Deficit 20,000 200,000 180,000 900.00%
50 Blizzard Deficit 0 50,000 50,000 0.00%
51 Other Total: 345,000 555,000 210,000 60.87%
52 Intergovernmental Charges
53 State County Assessments 309,396 309,396 0 0.00%
54 Charter School Assessment 307,914 307,914 0 0.00%
55 Regional Dispatch 275,000 365,000 90,000 32.73%
56 Intergovernmental Total 892,310 982,310 90,000 10.09%
57 TOTAL EXPENDITURES 37,583,823 39,104,919 1,521,096 4.05%
NET EXCESS/(DEFICIT) 0 0 0
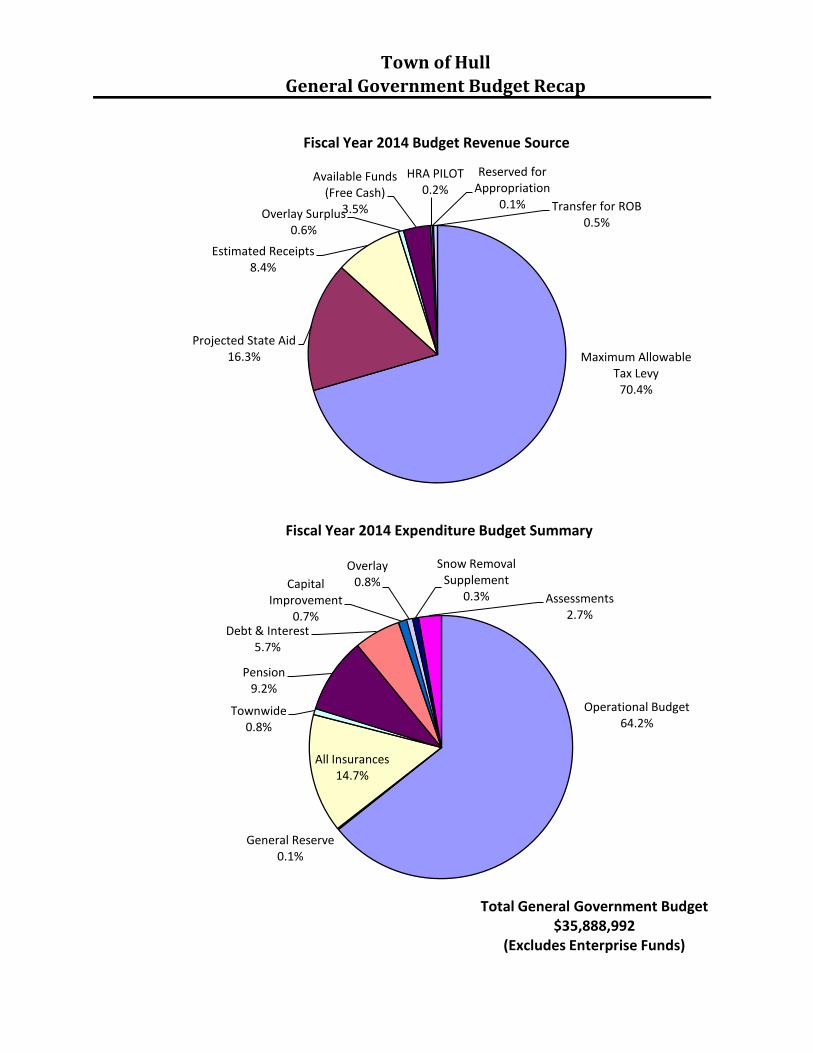
Town of Hull
General Government Budget Recap
Maximum Allowable Tax Levy
70.4%
Projected State Aid 16.3%
Estimated Receipts 8.4%
Overlay Surplus 0.6%
Available Funds (Free Cash)
3.5%
HRA PILOT 0.2%
Reserved for Appropriation
0.1% Transfer for ROB 0.5%
Fiscal Year 2014 Budget Revenue Source
Fiscal Year 2014 Expenditure Budget Summary
Operational Budget 64.2%
General Reserve 0.1%
All Insurances 14.7%
Townwide 0.8%
Pension 9.2%
Debt & Interest 5.7%
Capital Improvement
0.7%
Overlay 0.8%
Snow Removal Supplement
0.3% Assessments 2.7%
Total General Government Budget $35,888,992
(Excludes Enterprise Funds)

Town of Hull
Fiscal 2014 General Government Budget Summary
FY12 FY13 FY14 Town Mgr Advisory Bd % Dept % Total Dollar PercentDepartment Actual Approp Request Recommends Recommends Budget Budget Change Change
Elections 113 7,957 9,900 5,816 9,250 9,250 0.04% 0.03% (650) -6.57%Town Manager 121 214,387 221,125 227,136 227,136 227,136 0.99% 0.66% 6,011 2.72%Selectmen 122 135,797 142,264 146,988 129,988 129,988 0.56% 0.38% (12,276) -8.63%General Government Support 124 75,746 62,544 62,544 79,544 79,544 0.35% 0.23% 17,000 27.18%Advisory Board/Reserve 131 5,548 6,750 6,750 6,750 6,750 0.03% 0.02% 0 0.00%Accounting 135 146,923 150,234 156,544 156,544 156,544 0.68% 0.46% 6,310 4.20%Assessors 141 158,659 169,960 177,560 177,560 177,560 0.77% 0.52% 7,600 4.47%Treasurer/Collector 145 303,848 312,613 321,941 321,941 321,941 1.40% 0.94% 9,328 2.98%Law Department 151 125,759 116,018 119,460 119,460 119,460 0.52% 0.35% 3,442 2.97%Boards & Commissioners 152 1,500 1,750 2,250 2,250 2,250 0.01% 0.01% 500 28.57%MIS/IT 155 125,498 163,632 168,530 168,530 168,530 0.73% 0.49% 4,898 2.99%Town Clerk 161 21,976 23,325 20,975 20,975 20,975 0.09% 0.06% (2,350) -10.08%Board of Registrars 163 4,836 7,475 5,045 5,045 5,045 0.02% 0.01% (2,430) -32.51%Conservation 171 76,466 94,855 96,610 96,610 96,610 0.42% 0.28% 1,755 1.85%Planning Board 175 47,999 77,438 98,814 98,814 98,814 0.43% 0.29% 21,376 27.60%Board of Appeals 176 10,266 12,000 10,681 10,681 10,681 0.05% 0.03% (1,319) -10.99%Town Buildings 192 141,531 137,920 142,092 142,092 142,092 0.62% 0.41% 4,172 3.02%Police Department 210 2,344,849 2,551,640 2,628,034 2,628,034 2,628,034 11.40% 7.65% 76,394 2.99%Public Safety/Dispatch 215 392,258 0 0 0 0 0.00% 0.00% 0 0.00%Fire Department 220 2,696,685 2,900,832 2,987,207 2,987,207 2,987,207 12.96% 8.70% 86,375 2.98%Building Department 241 144,480 181,954 169,089 169,089 169,089 0.73% 0.49% (12,865) -7.07%Emergency Preparedness 291 6,416 33,000 33,990 33,990 33,990 0.15% 0.10% 990 3.00%Animal Control 292 11,101 20,000 22,487 22,487 22,487 0.10% 0.07% 2,487 12.44%Shellfish 297 11,700 11,700 12,103 12,103 12,103 0.05% 0.04% 403 3.44%School 301 12,795,439 13,049,658 13,996,776 13,571,644 13,571,644 58.87% 39.51% 521,986 4.00%Highway 421 780,510 821,056 859,668 859,668 859,668 3.73% 2.50% 38,612 4.70%Snow Removal 423 89,046 74,830 74,830 74,830 74,830 0.32% 0.22% 0 0.00%Landfill 430 59,299 65,700 63,913 63,913 63,913 0.28% 0.19% (1,787) -2.72%Grounds Maintenance 491 65,738 82,900 82,900 82,900 82,900 0.36% 0.24% 0 0.00%Watershed Management 495 6,625 7,200 7,200 7,200 7,200 0.03% 0.02% 0 0.00%Park Maintenance 496 51,531 54,510 59,510 59,510 59,510 0.26% 0.17% 5,000 9.17%Board of Health 511 158,688 185,489 197,326 197,326 197,326 0.86% 0.57% 11,837 6.38%Council on Aging 541 122,654 139,671 156,869 150,193 150,193 0.65% 0.44% 10,522 7.53%Veterans' Services 543 21,874 26,050 26,420 26,420 26,420 0.11% 0.08% 370 1.42%Library 610 235,000 273,383 282,720 282,720 282,720 1.23% 0.82% 9,337 3.42%Park and Recreation 650 21,031 50,000 50,000 50,000 50,000 0.22% 0.15% 0 0.00%War Memorial 692 0 0 0 0 0 0.00% 0.00% 0 0.00%Department Budgets 21,619,621 22,239,376 23,480,778 23,052,404 23,052,404 100.00% 67.11% 813,028 3.66%Worker's Comp 912 48,591 35,000 36,750 36,750 36,750 0.11% 1,750 5.00%Unemployment Comp 913 29,172 85,000 75,000 75,000 75,000 0.22% (10,000) -11.76%Health & Life Insurance 914 3,810,805 3,906,089 4,218,518 3,925,000 3,925,000 11.43% 312,429 8.00%Townwide Insurance 915 327,259 362,500 371,560 371,560 371,560 1.08% 9,060 2.50%FICA Payments 916 230,191 247,100 254,513 254,513 254,513 0.74% 7,413 3.00%Uninsured Medical Payments 920 57,198 59,000 61,950 61,950 61,950 0.18% 2,950 5.00%Veteran's Benefits 543 338,292 345,000 400,000 425,000 425,000 1.24% 55,000 15.94%Fuel Reserve 131 69,866 110,000 111,518 111,518 111,518 0.32% 1,518 1.38%Insurance Total 4,911,373 5,149,689 5,529,809 5,261,291 5,261,291 15.32% 380,120 7.38%Hydrant 124 184,096 215,000 225,750 225,750 225,750 0.66% 10,750 5.00%Derelict Property Services 124 0 20,000 20,000 0 0 0.00% 0 0.00%Audit/Consultant 124 73,900 46,500 43,875 43,875 43,875 0.13% (2,625) -5.65%Town Wide Total 257,996 281,500 289,625 269,625 269,625 0.78% 8,125 2.89%Non Contributory 911 61,632 80,000 65,000 65,000 65,000 0.19% (15,000) -18.75%Contributory 918 3,020,137 3,126,926 3,250,000 3,250,000 3,250,000 9.46% 123,074 3.94%Pension Total 3,081,769 3,206,926 3,315,000 3,315,000 3,315,000 9.65% 108,074 3.37%Principal-Debt Excluded 712 334,000 325,000 325,000 325,000 325,000 0.95% 0 0.00%Interest-Debt Excluded 752 183,306 172,038 161,563 161,563 161,563 0.47% (10,475) -6.09%Principal-General Long Term 710 909,882 909,882 1,039,882 1,039,882 1,039,882 3.03% 130,000 14.29%Interest-General Long Term 750 500,369 536,777 532,917 532,917 532,917 1.55% (3,860) -0.72%Interest-Temp Borrowing 751 0 7,500 0 0 0 0.00% (7,500) -100.00%Fees on Borrowing 751 0 20,000 0 0 0 0.00% (20,000) -100.00%Transfer to Capital Projects 751 0 0 0 0 0 0.00% 0 0.00%Debt Service Total 1,927,558 1,971,197 2,059,362 2,059,362 2,059,362 5.99% 88,165 4.47%Reserve Fund 43,672 50,000 50,000 50,000 50,000 0.15% 0 0.00%Capital 256,401 210,000 350,000 344,000 344,000 1.00% 140,000 66.67%Total Budget 32,054,718 33,108,688 35,074,574 34,351,682 34,351,682 100.00% 1,965,886 5.94%

Schools 58.9%
Police Services 11.5%
Fire Department 13.1%
Public Works 5.0%
Administration & Finance
3.8%
Regulatory 1.3%
Library 1.2%
Seniors/Veterans 0.8%
All Other 4.4%
Town of Hull General Government Operational Budget Share
Fiscal 2014 Budget
Total General Government Operational Budget
$23,052,404
![[XLS] · Web viewPATEL SAURABH ARVINDBHAI WARRANT NO. :1033 SURESH A DALASANIA WARRANT NO. :1036 RAJESH PATEL WARRANT NO. :1037 RAKESH P PATEL WARRANT NO. :1038 ANILA P CHALLA WARRANT](https://img.pdfslide.us/doc/110x75/5aba371c7f8b9a321b8b6573/xls-viewpatel-saurabh-arvindbhai-warrant-no-1033-suresh-a-dalasania-warrant.jpg)