Embed Size (px)
Citation preview

2013
Investment Products Offered • Are Not FDIC Insured • May Lose Value • Are Not Bank Guaranteed
The information herein reflects prevailing market conditions and our judgments as of the date of this document, which are subject to change. In preparing this document, we have relied upon and assumed, without independent verification, the accuracy and completeness of all information available from public sources. Opinions and estimates may be changed without notice and involve a number of assumptions which may not prove valid. There is no guarantee that any forecasts or opinions in this material will be realized. Information should not be construed as investment advice.
Clouds Parting, Revealing Opportunities

AllianceBernstein.com
Widespread Global Uncertainties…
United States Fiscal Cliff
Presidential and Congressional Election
Supreme Court Ruling on Healthcare
Slow Economic Growth
Brazil Economic Slowdown
China Hard Landing
Leadership Change and Policy Direction
Japan Restructuring Activities
Trade Balance Issues
Bank of Japan (BOJ) Policy/Election
Europe Bank Recapitalization
Greece’s Future in the Euro
Future of the Eurozone
Role of the European Central Bank (ECB)
Move to Fiscal Union
Current analysis does not guarantee future results. As of December 31, 2012 Source: AllianceBernstein
Asia ex Japan Economic
Slowdown
Trade Balance Issues
Presidential Election Mexico
Venezuela Presidential Election
Argentina Policy Risk
EMEA
CMO 1Q 2013 | 1
Economic Slowdown
Arab Spring
CMO 1Q 2013 | 1AllianceBernstein.com

AllianceBernstein.com
…Have Weighed on the Global Economy
Trade Volume Is Trending Down
Historical analysis does not guarantee future results. *PMI: Purchasing Managers’ Index. PMI through December 31, 2012. An investor cannot invest directly in an index and its performance does not reflect the performance of any AllianceBernstein portfolio. The unmanaged index does not reflect fees and expenses associated with the active management of a portfolio. Euro-area consumer confidence through August 31, 2012. CEO business confidence through September 30, 2012. Trade volume through September 30, 2012. Cash ratios through December 31, 2012. **Standard deviation: a measure of the dispersion of a set of data from its mean. The more spread apart the data, the higher the deviation. †G7 countries: Canada, France, Germany, Italy, Japan, UK and US. BRIC countries: Brazil, Russia, India and China Source: Deutsche Bank, Eurostat, Haver Analytics, International Monetary Fund (IMF), J.P. Morgan, Markit and AllianceBernstein
Global Manufacturing Output Has Contracted
Global Manufacturing PMI*
–40
–20
0
20
40
01 03 05 07 09 11Year
-ove
r-Ye
ar %
Cha
nge
Confidence Has Declined
Companies Have Slowed Spending
Cash Ratios: S&P 500 Index Companies ex Financials
–50
0
50
100
150
–4
–3
–2
–1
0
1
2
02 03 04 05 06 07 08 09 10 11 12
Index
Sta
ndar
d D
evia
tions
**
Euro-Area Consumer Confidence (Left Scale)
CEO Business Confidence
30
40
50
60
06 07 08 09 10 11 12
Inde
x
2
6
10
14
82 89 96 03 10
Perc
ent
Cash/ Market Cap
Cash/Assets
Exports: G7 + BRIC†
CMO 1Q 2013 | 2 CMO 1Q 2013 | 2AllianceBernstein.com

AllianceBernstein.com
0.0
0.5
1.0
1.5
2.0
Jan 12 Feb 12 Mar 12 Apr 12 May 12 Jun 12 Jul 12 Aug 12 Sep 12 Oct 12 Nov 12 Dec 12
Glo
bal R
isk
Aver
sion
Indi
cato
r*
First Greek
General Election
Some Global Uncertainties Have Been Addressed
Historical analysis does not guarantee future results. Through December 31, 2012 *Incorporates equity index–implied volatilities, bond spreads, currency index–implied volatilities and equity mutual fund flows. **Long-Term Refinancing Operations I was on December 8, 2011. †European Union. ‡Outright Monetary Transactions Source: AllianceBernstein
UPDATED
Through 11/30/12
Received Data From
Guoan Du Mexican Elections
Venezuelan Elections Settled
Japanese Election
China’s Industrial Production and Manufacturing
Expand
China’s Leadership Transition Uneventful Fiscal
Cliff
Obama Reelected
Healthcare Ruling
Spanish Bank
Recaps
EU† Summit (ECB Bond
Buying, Bank
Recaps)
Greece Passes 2013 Austerity
Budget
LTRO II
ECB’s OMT‡ Announcement
US QE3
EU Summit Agreement to Finalize Single
Supervisory Mechanism
Greek Program
US Federal Reserve Sets Numerical Guidelines Based on Inflation and
Unemployment
Draghi’s “Whatever it
Takes to Preserve the Euro” Speech
Second Greek
General Election
LTRO I**
United Kingdom Additional
Asset Purchases
CMO 1Q 2013 | 3 CMO 1Q 2013 | 3AllianceBernstein.com

AllianceBernstein.com CMO 1Q 2013 | 4AllianceBernstein.com
5.8% 0.7%
–6.3%
3.1% 0.0%
–9.0% 0.7%
1.7% 3.5% 4.2%
5.6% 6.8%
–0.4% 1.9%
4Q:2012 Returns
28.7% 7.0%
–1.1%
11.2% 2.2% 2.0%
6.8%
10.9% 18.1% 19.3%
18.2% 17.3%
16.0% 16.4%
Annualized Returns Since February 2009
Returns in US dollars
Markets Performed Better than They Felt in 2012
2012 Returns
Past performance does not guarantee future results. As of December 31, 2012 *Europe, Australasia and the Far East. **Treasury Inflation-Protected Securities. †Global Real Estate Investment Trusts Global high yield, global corporates, Japan and euro-area government bonds in hedged USD terms. All other non-US returns in unhedged USD terms. Please see end of presentation for index information. An investor cannot invest directly in an index and its performance does not reflect the performance of any AllianceBernstein portfolio. The unmanaged index does not reflect fees and expenses associated with the active management of a portfolio. Source: Barclays Capital, FactSet, FTSE, MSCI, S&P/Dow Jones and AllianceBernstein
Japan
Global High Yield
US
Euro Area
Emerging-Market Debt Global Corporates
EAFE*
US Small-Cap
Emerging Markets
Equities
Credit
Government Bonds
Commodities Alternatives
Global REITs† TIPS**
Municipals
US Large-Cap
30.2% 10.1%
7.4%
5.0% 2.4%
4.5% 7.3%
10.7% 18.0%
22.6%
24.5% 16.7%
21.5% 24.3%
CMO 1Q 2013 | 4
AllianceBernstein.com CMO 1Q 2013 | 5AllianceBernstein.com
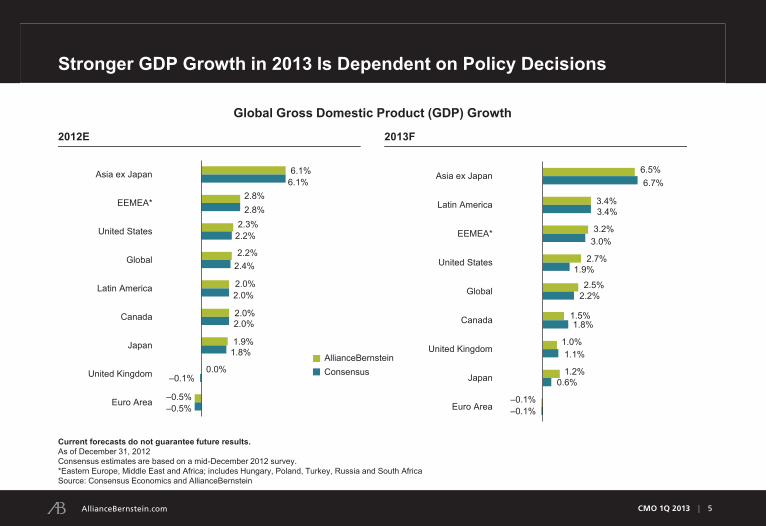
Stronger GDP Growth in 2013 Is Dependent on Policy Decisions
Current forecasts do not guarantee future results. As of December 31, 2012 Consensus estimates are based on a mid-December 2012 survey. *Eastern Europe, Middle East and Africa; includes Hungary, Poland, Turkey, Russia and South Africa Source: Consensus Economics and AllianceBernstein
6.1%
2.8%
2.3%
2.2%
2.0%
2.0%
1.9%
0.0%
–0.5%
6.1%
2.8%
2.2%
2.4%
2.0%
2.0%
1.8%
–0.1%
–0.5%
-3.0% 2.0% 7.0%
Asia ex Japan
EEMEA*
United States
Global
Latin America
Canada
Japan
United Kingdom
Euro Area
6.5%
3.4%
3.2%
2.7%
2.5%
1.5%
1.0%
1.2%
–0.1%
6.7%
3.4%
3.0%
1.9%
2.2%
1.8%
1.1%
0.6%
–0.1%
-3.0% 2.0% 7.0%
Asia ex Japan
Latin America
EEMEA*
United States
Global
Canada
United Kingdom
Japan
Euro Area
2012E
2013F
AllianceBernstein Consensus
Global Gross Domestic Product (GDP) Growth
CMO 1Q 2013 | 5

AllianceBernstein.com CMO 1Q 2013 | 6AllianceBernstein.com
0.5 0.1 0.3
2.8
1.5 1.1
1.7
2.2
0.8
0.4
–0.3
0.8
–0.8 –1.2
0.1
A Broader US Economic Recovery
Public-Sector Growth Has Turned Positive
–12
–8
–4
0
4
8
12
02 03 04 05 06 07 08 09 10 11 12
Perc
ent
Contribution to US GDP Growth Rate Percent
4.6% 2.2% Real GDP
Seasonally Adjusted Annual GDP Growth
Rebound in Early Cyclical Sectors
Historical analysis does not guarantee future results. Left chart through September 30, 2012. Right chart: Historical data are recessional from January 1, 1960, to December 31, 2004. Current data are from July 1, 2009, to June 30, 2012. *Quarter-over-quarter seasonally adjusted annual rate Numbers may not sum due to rounding. Source: Haver Analytics, National Bureau of Economic Research and AllianceBernstein
Government Housing Exports and Investment Imports Consumption
Historical Current
Public Growth
(QoQ SAAR*)
Private Growth
(QoQ SAAR*)
3.1%
3Q:12
CMO 1Q 2013 | 6

AllianceBernstein.com CMO 1Q 2013 | 7AllianceBernstein.com
Housing: Building Permits
90
110
130
150
170
1 4 7 10 13 16 19 22 25 28 31 34 37 40 43Months of Recovery
Inde
x
1991
Current
1983
2001
Housing and Public Spending Improve
Historical analysis does not guarantee future results. Upper left chart through September 30, 2012. Lower left chart through October 31, 2012. Upper right chart through December 31, 2012. Lower right chart through November 1, 2012. Source: Haver Analytics, National Association of Realtors, US Bureau of Economic Analysis, US Census Bureau and US Federal Reserve Board
Housing: Owner-Occupied Housing
95
105
115
125
1 4 7 10 13 16 19 22 25 28 31 34 37 40
1Q:61 4Q:70 Q1:754Q:82 1Q:91 4Q:012Q:09
Number of Months
Inde
x
–1.0
–0.5
0.0
0.5
1.0
1.5
08 09 10 11 12
% C
hang
e (S
AAR
)
Federal
Public Sector: Contribution to Real GDP
Housing: Construction Employment as Share of Total
0
2
4
6
8
10
12
70 76 82 88 94 00 06 12Pe
rcen
t
Unemployment
Construction Participation
State and Local
CMO 1Q 2013 | 7

AllianceBernstein.com CMO 1Q 2013 | 8AllianceBernstein.com
What Stage of the Business Cycle Are We in?
Current analysis does not guarantee future results. July 2009 through December 31, 2012 Source: AllianceBernstein
Early Mid Late
Cycle Length (Duration) Sector Leadership in GDP Labor Markets (Jobless Rate) Wage and Price Trends Household Leverage Nonfinancial Business Leverage Operating Profits Real Profit Margins Monetary Policy Fiscal Policy
Current US Business Cycle
CMO 1Q 2013 | 8

AllianceBernstein.com CMO 1Q 2013 | 9AllianceBernstein.com
Fiscal Cliff Avoided for Now
Fiscal Deal Reduces Tax Cliff
Pending Expenditure Issues: First Quarter
Long-Term Issue of Spending Remains
Debt-ceiling negotiations
Automatic spending cuts
Continuing budget resolution
0
20
40
60
80
100
120
62 68 74 80 86 92 98 04 10 16 22
Per
cent
Current and historical analysis do not guarantee future results. Left chart as of January 8, 2013; bottom right chart as of January 1, 2013 *AllianceBernstein estimates **PEP: Personal Exemption Phaseout. EITC: Earned Income Tax Credit. CTC: Child Tax Credit. AOTC: American Opportunity Tax Credit Numbers may not sum due to rounding. Source: Office of Management and Budget; Urban-Brookings Tax Policy Center (TPC) Microsimulation Model (version 0412-7) and TPC calculations based on Congressional Budget Office and Joint Committee of Taxation (JCT) estimates; and AllianceBernstein
Provision Fiscal Cliff
Fiscal Deal*
Payroll Tax $115 $115
Healthcare Law Provisions 24 24
High-Income Capital Gains and Dividends 8 4
High-Income Rates, Pease and PEP** 44 44
Stimulus Legislation EITC, CTC and AOTC** 27 0
Extenders 75 0
Estate Tax 31 5
Remainder of 2001–2003 Tax Provisions 171 0
Alternative Minimum Tax Patch 40 0
Total $536 $192
Mandatory Spending Post–Fiscal Cliff % of Revenues
Fiscal Cliff vs. Fiscal Deal (USD Billions)
CMO 1Q 2013 | 9
E E
AllianceBernstein.com CMO 1Q 2013 | 10AllianceBernstein.com
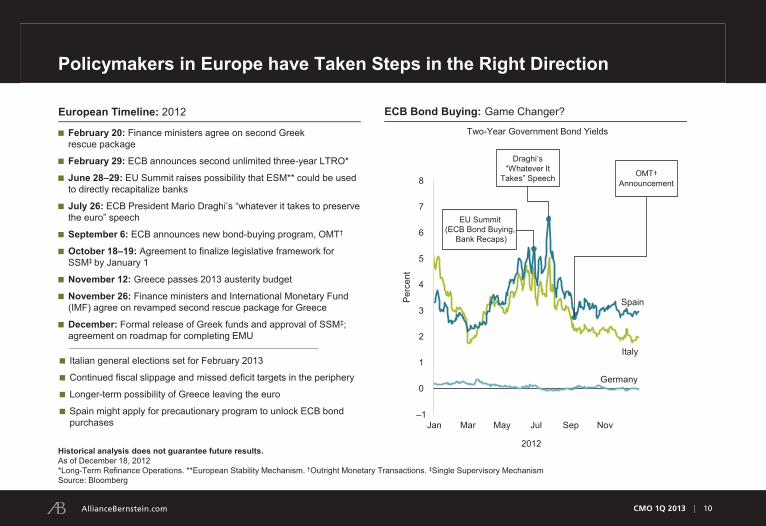
ECB Bond Buying: Game Changer?
Policymakers in Europe have Taken Steps in the Right Direction
Two-Year Government Bond Yields February 20: Finance ministers agree on second Greek rescue package
February 29: ECB announces second unlimited three-year LTRO*
June 28–29: EU Summit raises possibility that ESM** could be used to directly recapitalize banks
July 26: ECB President Mario Draghi’s “whatever it takes to preserve the euro” speech
September 6: ECB announces new bond-buying program, OMT†
October 18–19: Agreement to finalize legislative framework for SSM‡ by January 1
November 12: Greece passes 2013 austerity budget
November 26: Finance ministers and International Monetary Fund (IMF) agree on revamped second rescue package for Greece
December: Formal release of Greek funds and approval of SSM‡; agreement on roadmap for completing EMU
Italian general elections set for February 2013
Continued fiscal slippage and missed deficit targets in the periphery
Longer-term possibility of Greece leaving the euro
Spain might apply for precautionary program to unlock ECB bond purchases
Historical analysis does not guarantee future results. As of December 18, 2012 *Long-Term Refinance Operations. **European Stability Mechanism. †Outright Monetary Transactions. ‡Single Supervisory Mechanism Source: Bloomberg
European Timeline: 2012
CMO 1Q 2013 | 10
–1
0
1
2
3
4
5
6
7
8
Jan Mar May Jul Sep Nov
Germany
Italy
Spain
2012
Perc
ent
EU Summit (ECB Bond Buying,
Bank Recaps)
Draghi’s “Whatever It
Takes” Speech OMT† Announcement

AllianceBernstein.com CMO 1Q 2013 | 11AllianceBernstein.com
European Periphery Starts to Rebalance but Fundamentals Are Still Poor
Historical analysis does not guarantee future results. Current account balances as of September 30, 2012 Change in domestic demand as of June 30, 2012 *Real exchange rate against the rest of the euro area **Greek numbers are for 1Q01 rather than 1Q99. Source: European Commission and Haver Analytics
Domestic Demand Has Been Chronically Weak
Change in Domestic Demand: First Half 2008 to First Half 2012
–24.7 –23.0
–12.5 –11.8
–6.4 –3.5
–0.2 0.8 0.9
3.1 3.2
GreeceIrelandSpain
PortugalItaly
NetherlandsFinlandFrance
BelgiumAustria
Germany
–19.2
3.2 9.9
16.4 7.9
2.6
–5.3
14.2
–0.7
27.7
9.2 3.0 2.0 0.8
–11.0
1.0 2.8 1.9
–10.6
4.7
–20.8
–6.0
Ger
man
y
Fran
ce
Italy
Spa
in
Net
herla
nds
Bel
gium
Aus
tria
Gre
ece*
*
Finl
and
Irela
nd
Por
tuga
l
1Q:99–2Q:08 2Q:08–2Q:12
Peripheral Real Exchange Rates Are More Competitive
–18
–15
–12
–9
–6
–3
0
3
6
07 08 09 10 11 12
Italy
% o
f GD
P; 4
Q M
ovin
g Av
g.
Ireland
Greece
Spain
Portugal
Current Accounts Have Improved on the Surface
Current Account Balances Change in Real Exchange Rate*
CMO 1Q 2013 | 11

AllianceBernstein.com CMO 1Q 2013 | 12AllianceBernstein.com
China: Fundamentals Have Turned Around…
Historical analysis does not guarantee future results. As of November 30, 2012 4Q:2012 industrial production growth assumes an average of October and November. 4Q:2012 GDP is AllianceBernstein forecast at 7.8% year over year. Source: CEIC Data, Direction of Trade Statistics, IMF and AllianceBernstein
Economic Output Remains Solid
Investment Remains Robust
0
2
4
6
8
10
12
14
16
18
0
5
10
15
20
25
00 02 04 06 08 10 12
Year-over-Year % C
hange Year
-ove
r-Ye
ar %
Cha
nge
Industrial Production
(Left Scale)
GDP
10
15
20
25
30
35
40
45
50
55
Jan
Feb
Mar
Apr
May Jun
Jul
Aug
Sep Oct
Nov
Year
-ove
r-Ye
ar %
Cha
nge
Fixed-Asset Investment (FAI)
FAI New Project Starts
2012
CMO 1Q 2013 | 12

AllianceBernstein.com CMO 1Q 2013 | 13AllianceBernstein.com
…but Headwinds Remain
Historical analysis does not guarantee future results. Left chart as of December 31, 2012. Gray arrows are theoretical and reflect desired policy outcomes. Middle chart and right chart as of November 30, 2012. Source: Bernstein Research, CEIC Data and AllianceBernstein
More Consumption Is Needed…
20
25
30
35
40
45
50
55
79 87 95 03 11 19
Perc
ent o
f GD
P
Investment Rate
Consumption Rate
Saving Rate
…but Imports Remain Weak and Vulnerable…
–30
–20
–10
0
10
20
30
40
50
60
70
05 06 07 08 09 10 11 12
Year
-ove
r-Ye
ar P
erce
nt C
hang
e
Real Export Volume
Real Import Volume
…and Domestic Demand Is Weak
–30
–20
–10
0
10
20
30
40
50
60
Jan
11M
ar 1
1M
ay 1
1Ju
l 11
Sep
11
Nov
11
Jan
12M
ar 1
2M
ay 1
2Ju
l 12
Sep
12
Nov
12
Year
-ove
r-Ye
ar P
erce
nt C
hang
e
Imports for Nominal
Domestic Demand
Processing Items for Nominal Exports
Desired Outcomes
CMO 1Q 2013 | 13
E

AllianceBernstein.com CMO 1Q 2013 | 14AllianceBernstein.com
Market Environments Inform Portfolio Strategy
As of December 31, 2012 There is no guarantee that the portfolio strategies presented will yield positive results or that the market environments presented will occur. *Beta is a measure of the volatility, or systemic risk, of a security or a portfolio in comparison to the market as a whole. Source: AllianceBernstein
Financial Crisis/ Recession Risk-On, Risk-Off Recovery/Normalization
Economic Outlook Negative real growth Fears of deflation
1%–2% global GDP growth Fears shift between inflation
and deflation
3%–5% global GDP growth Healthy reflation
Market Volatility High and sustained Frequent shifts between high and low volatility Low and sustained
Market Return Negative Modest High
Investment Focus Preservation Income Appreciation
Bonds Governments Credits High-beta* credit
Real Assets TIPS Real estate Commodities
Equities Defensives US
Stability Global
Cyclical Non-US EM
Currencies Hedged Partially hedged Unhedged/carry exposure
Potential Market Environments and Portfolio Strategies
CMO 1Q 2013 | 14

AllianceBernstein.com CMO 1Q 2013 | 15AllianceBernstein.com
Attractive Equity Potential Has Been Overshadowed by Uncertainty
Long-Term Expected
Return (%)
1.6
5.6
7.2
5.9
2.9
8.8
GlobalSovereigns
Equity RiskPremium
GlobalStocks
Long-Term Average
December 31, 2012
14.3
15.5 Normal
Historical analysis and current forecasts do not guarantee future results. Data do not represent past performance and are not a promise of actual results or range of future results. Left chart as of December 31, 2012. Global sovereign bonds are represented by global, developed, sovereign, seven-year constant-maturity nominal bonds; global stocks by a universe similar to MSCI World. Both are reported in and hedged into US dollars. Source: Lipper, Morningstar, MSCI, Strategic Insight and AllianceBernstein
Investment Flows Reflect Risk Aversion
Net New Flows: Jul 2008–Nov 2012 (USD Millions)
–453,355
400,889
94,887 96,966 234,078
1,038,587
127,937
Act
ive
Equ
ities
Pas
sive
Equ
ities
Com
mod
ities
Alte
rnat
ive
Bal
ance
d/Al
loca
tion
Taxa
ble
Bond
s
Mun
icip
al B
onds
Near-Term Expected
Global Equity Volatility (%)
CMO 1Q 2013 | 15

AllianceBernstein.com CMO 1Q 2013 | 16AllianceBernstein.com
Visibility Has Been Low, but Appears to Be Improving
Past performance is no guarantee of future results. Historical analysis is not a guarantee of future results. Left chart through October 31, 2012. Right chart through December 31, 2012 *Six-month rolling intra-market correlations of returns within the S&P 500 Index. An investor cannot invest directly in an index and its performance does not reflect the performance of any AllianceBernstein portfolio. The unmanaged index does not reflect fees and expenses associated with the active management of a portfolio. Correlation is a statistical measure of how two values move in relation to each other. Source: Commodity Research Bureau, Credit Suisse HOLT, Energy Information Administration, IHS Global Insight, S&P, US Federal Reserve, Yahoo! and AllianceBernstein
–0.8
–0.4
0.0
0.4
0.8
67 72 77 82 87 92 97 02 07 12
Inde
x
Crude Oil
US Dollar
Correlation of S&P 500 36-Month Rolling
Macro Currents Have Receded
0.0
0.2
0.4
0.6
0.8
95 97 99 01 03 05 07 09 11
Inde
x
Stock Correlations Have Declined
US Intra-Market Correlations*
CMO 1Q 2013 | 16

AllianceBernstein.com CMO 1Q 2013 | 17AllianceBernstein.com
92%
78% 77% 87% 89%
Wor
ld
Fina
ncia
ls
Res
ourc
es
Def
ensi
ves
Cyc
lical
s
Current Long-Term Range
Valuations Are Compelling and Alpha Opportunities Are Emerging
The Value of Sector Selection
Sizable Valuation Differences Among Stocks
90
95
100
105
110
115
120
125
130
Dec
11
Feb
12
Apr
12
Jun
12
Aug
12
Oct
12
Dec
12
Gro
wth
of U
S$10
0
Dow Industrial
Financials
Consumer Discretionary
Utilities
Information Technology
0
200
400
600
800
95 97 99 01 03 05 07 09 11
Inde
x
High-ROIC Stocks
Global Equity Market
High-ROIC Stocks Have Beaten the Market**
Highest vs. Lowest Price/Book Spread by Supersector†
Market Segment Performance: 2012*
Historical analysis does not guarantee future results. Left and middle charts through December 31, 2012. Right chart as of November 30, 2012 *Sector returns based on the S&P 500 GICS sector indices. An investor cannot invest directly in an index and its performance does not reflect the performance of any AllianceBernstein portfolio. The unmanaged index does not reflect fees and expenses associated with the active management of a portfolio **Graph shows performance of a portfolio made up of companies that are in the top 50% of the universe in terms of the following criteria: cash-flow return on capital, asset growth and potential for share-price upside on a discounted cash-flow basis. Portfolio is equally weighted and rebalanced monthly. Global equity market data are based on the equally weighted performance of a broad universe of stocks with a market capitalization in excess of US$1 billion. ROIC: Return on invested capital †Percentile ranks within the fifth (lowest) and 95th (highest) percentile of Q5/Q1 price/book spreads from January 1, 1971, to November 30, 2012. Resources consists of energy, industrial commodities and gold; defensives consists of consumer staples, medical, telecom and utilities; and cyclicals consists of capital equipment, construction and housing, consumer cyclicals, technology and transportation. Source: Center for Research in Security Prices (CRSP), Credit Suisse HOLT, MSCI, S&P/Dow Jones, Thomson Reuters, Worldscope and AllianceBernstein
CMO 1Q 2013 | 17
AllianceBernstein.com CMO 1Q 2013 | 18AllianceBernstein.com
0.2
0.6
1.0
1.4
1.8
66 71 76 81 86 91 96 01 06 11
Rat
io (×
)
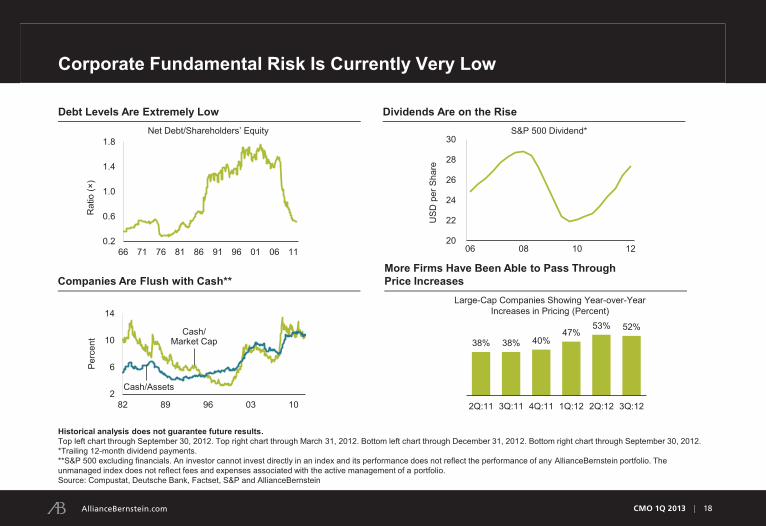
Corporate Fundamental Risk Is Currently Very Low
Historical analysis does not guarantee future results. Top left chart through September 30, 2012. Top right chart through March 31, 2012. Bottom left chart through December 31, 2012. Bottom right chart through September 30, 2012. *Trailing 12-month dividend payments. **S&P 500 excluding financials. An investor cannot invest directly in an index and its performance does not reflect the performance of any AllianceBernstein portfolio. The unmanaged index does not reflect fees and expenses associated with the active management of a portfolio. Source: Compustat, Deutsche Bank, Factset, S&P and AllianceBernstein
Net Debt/Shareholders’ Equity
Debt Levels Are Extremely Low
Companies Are Flush with Cash**
20
22
24
26
28
30
06 08 10 12
USD
per
Sha
re
Dividends Are on the Rise
More Firms Have Been Able to Pass Through Price Increases
S&P 500 Dividend*
38% 38% 40% 47%
53% 52%
2Q:11 3Q:11 4Q:11 1Q:12 2Q:12 3Q:12
Large-Cap Companies Showing Year-over-Year Increases in Pricing (Percent)
2
6
10
14
82 89 96 03 10
Per
cent
Cash/ Market Cap
Cash/Assets
CMO 1Q 2013 | 18

AllianceBernstein.com CMO 1Q 2013 | 19AllianceBernstein.com
Current Environment Seems Right for Active Management
Past performance is no guarantee of future results. Upper and lower left charts are illustrative. Right chart through November 30, 2012 *Three-month rolling dispersion of returns within the Bernstein US large-cap universe. Capitalization-weighted; trailing-earnings yields, minus the core consumer price index **Alpha is a measure of performance on a risk-adjusted basis. Six-month rolling premium of top quartile of US large-cap managers versus the S&P 500 Index. An investor cannot invest directly in an index and its performance does not reflect the performance of any AllianceBernstein portfolio. The unmanaged index does not reflect fees and expenses associated with the active management of a portfolio. Source: Center for Research in Security Prices, eVestment Alliance, S&P/Dow Jones and AllianceBernstein
–4
–2
0
2
4
6
8
0
10
20
30
40
50
60
95 97 99 01 03 05 07 09 11
Percent Perc
ent
Active Management Has Thrived in High Dispersion
Manager Alpha**
Dispersion (Left Scale)*
Theoretical Dispersion of Returns
Dividends Real Total
Return
Time
Ret
urns
Equities
Time
Ret
urns
Yield
High-Grade Sovereign Bonds
Real Total Return
Return Dispersion vs. Manager Alpha
CMO 1Q 2013 | 19
AllianceBernstein.com CMO 1Q 2013 | 20AllianceBernstein.com
0
20
40
60
80
95 97 99 01 03 05 07 09 11
Perc
ent
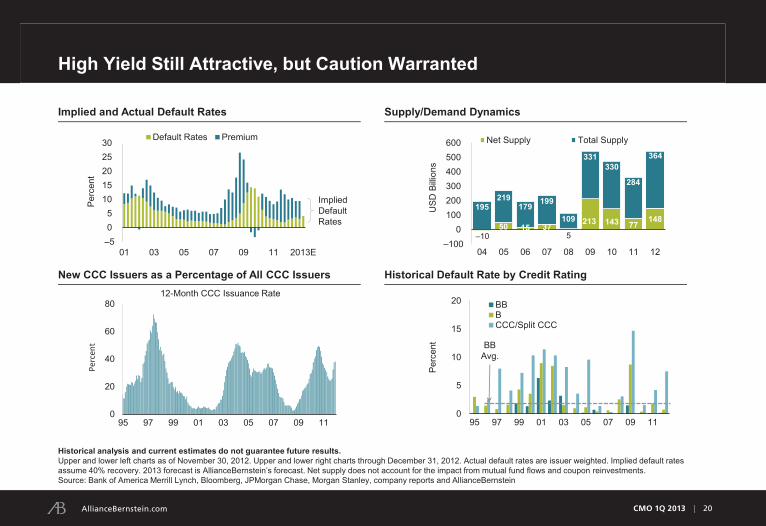
High Yield Still Attractive, but Caution Warranted
Historical analysis and current estimates do not guarantee future results. Upper and lower left charts as of November 30, 2012. Upper and lower right charts through December 31, 2012. Actual default rates are issuer weighted. Implied default rates assume 40% recovery. 2013 forecast is AllianceBernstein’s forecast. Net supply does not account for the impact from mutual fund flows and coupon reinvestments. Source: Bank of America Merrill Lynch, Bloomberg, JPMorgan Chase, Morgan Stanley, company reports and AllianceBernstein
Supply/Demand Dynamics
–10 50 15 37
5
213 143 77 148
195 219
179 199
109
331 330
284
364
–100 0
100200300400500600
04 05 06 07 08 09 10 11 12
USD
Billi
ons
Net Supply Total Supply
New CCC Issuers as a Percentage of All CCC Issuers
12-Month CCC Issuance Rate
Historical Default Rate by Credit Rating
0
5
10
15
20
95 97 99 01 03 05 07 09 11
BBBCCC/Split CCC
BB Avg.
Perc
ent
Implied Default Rates
Implied and Actual Default Rates
–5 05
1015202530
01 03 05 07 09 11 2013E
Default Rates Premium
Perc
ent
CMO 1Q 2013 | 20
AllianceBernstein.com CMO 1Q 2013 | 21AllianceBernstein.com
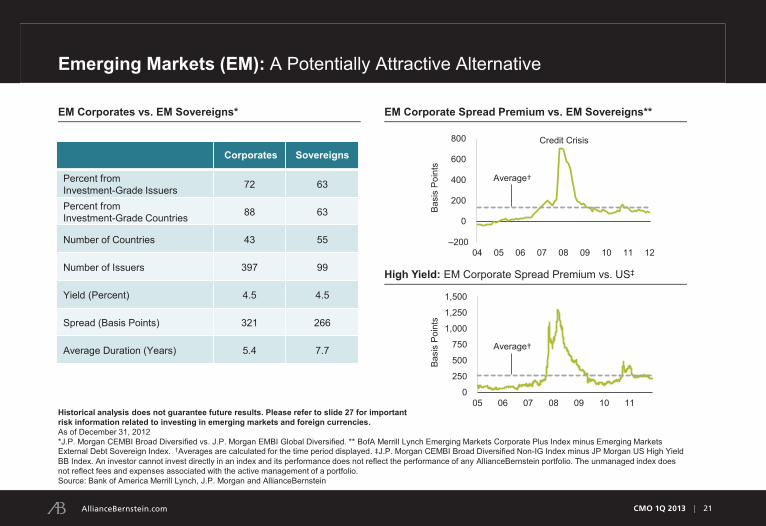
Emerging Markets (EM): A Potentially Attractive Alternative
Historical analysis does not guarantee future results. Please refer to slide 27 for important risk information related to investing in emerging markets and foreign currencies. As of December 31, 2012 *J.P. Morgan CEMBI Broad Diversified vs. J.P. Morgan EMBI Global Diversified. ** BofA Merrill Lynch Emerging Markets Corporate Plus Index minus Emerging Markets External Debt Sovereign Index. †Averages are calculated for the time period displayed. ‡J.P. Morgan CEMBI Broad Diversified Non-IG Index minus JP Morgan US High Yield BB Index. An investor cannot invest directly in an index and its performance does not reflect the performance of any AllianceBernstein portfolio. The unmanaged index does not reflect fees and expenses associated with the active management of a portfolio. Source: Bank of America Merrill Lynch, J.P. Morgan and AllianceBernstein
EM Corporates vs. EM Sovereigns*
EM Corporate Spread Premium vs. EM Sovereigns**
High Yield: EM Corporate Spread Premium vs. US‡
Corporates Sovereigns
Percent from Investment-Grade Issuers 72 63
Percent from Investment-Grade Countries 88 63
Number of Countries 43 55
Number of Issuers 397 99
Yield (Percent) 4.5 4.5
Spread (Basis Points) 321 266
Average Duration (Years) 5.4 7.7
–200
0
200
400
600
800
04 05 06 07 08 09 10 11 12
Basi
s Po
ints
Credit Crisis
0
250
500
750
1,000
1,250
1,500
05 06 07 08 09 10 11
Basi
s Po
ints
Average†
Average†
CMO 1Q 2013 | 21

AllianceBernstein.com CMO 1Q 2013 | 22AllianceBernstein.com
Demand for Income Likely to Remain Strong
Historical analysis does not guarantee future results. As of September 30, 2012 *Average from 2005 to December 31, 2012 Source: Barclays Capital; Investment Company Institute; US Federal Reserve, Flow of Funds Accounts of the United States, 3Q:2012; and AllianceBernstein
Municipal Bonds Subject to Redemption: Next 18 Months
8.2%
18.4%
7.8%
10.7%
Investment Grade High Yield
Current Average*
Changes in Municipal Supply and Demand (USD Billions)
155
100
–53
0
69
11
–12
49
09 10 11 12
Net Supply Municipal Fund Flows
CMO 1Q 2013 | 22

AllianceBernstein.com CMO 1Q 2013 | 23AllianceBernstein.com
Municipals Seem Attractive vs. Taxable Bonds
Past performance and historical analysis do not guarantee future results. As of October 31, 2012 There is no guarantee that this, or any, investment strategy will be successful in the short or long term. *Roll is the natural price gain that a bond experiences as it ages, assuming interest rates are unchanged. Source: Barclays Capital, Bloomberg, Delphis Hanover, Municipal Market Data and AllianceBernstein
Yield Plus Roll:* A-Rated Municipals
0.5%
1.7%
2.9% 3.1%
3.4%
2.7%
3.1% 2.9%
2 5 8 9 10 15 20 30
Yield Roll
Maturity (Years)
0
1
2
3
4
5
Short Intermediate Long
After-Tax Yield Curves
A-Rated Corporates 35% Federal + 5% State Tax Yi
eld
(Per
cent
)
A-Rated Municipals 5% State Tax
Adding Short Corporate Bonds to Municipal Portfolios
Income Advantage of BBB-Rated over AAA-Rated Municipals
0
1
2
3
4
87 92 97 02 07 12
Perc
ent
Dec. 31, 2012 1.4%
Average 1.0%
CMO 1Q 2013 | 23
AllianceBernstein.com CMO 1Q 2013 | 24AllianceBernstein.com
Australia 8.9
Canada 8.3
UK 16.1
Japan 2.6
US 9.8
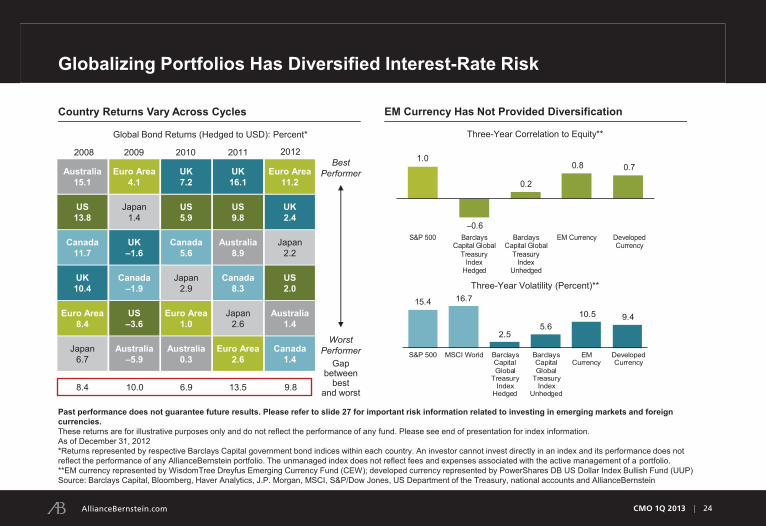
Globalizing Portfolios Has Diversified Interest-Rate Risk
Euro Area 1.0
US 5.9
Japan 2.9
UK 7.2
Australia 0.3
Canada 5.6
Japan 1.4
UK –1.6
US –3.6
Euro Area 4.1
Australia –5.9
Canada –1.9
2009 2008
UK 10.4
Euro Area 8.4
Australia 15.1
US 13.8
Japan 6.7
Canada 11.7
Euro Area 2.6
2011
9.8 8.4 10.0 6.9
Country Returns Vary Across Cycles
Global Bond Returns (Hedged to USD): Percent*
2010
13.5
Best Performer
Worst Performer
Gap between
best and worst
Past performance does not guarantee future results. Please refer to slide 27 for important risk information related to investing in emerging markets and foreign currencies. These returns are for illustrative purposes only and do not reflect the performance of any fund. Please see end of presentation for index information. As of December 31, 2012 *Returns represented by respective Barclays Capital government bond indices within each country. An investor cannot invest directly in an index and its performance does not reflect the performance of any AllianceBernstein portfolio. The unmanaged index does not reflect fees and expenses associated with the active management of a portfolio. **EM currency represented by WisdomTree Dreyfus Emerging Currency Fund (CEW); developed currency represented by PowerShares DB US Dollar Index Bullish Fund (UUP) Source: Barclays Capital, Bloomberg, Haver Analytics, J.P. Morgan, MSCI, S&P/Dow Jones, US Department of the Treasury, national accounts and AllianceBernstein
2012
Euro Area 11.2
US 2.0
Canada 1.4
Australia 1.4
UK 2.4
Japan 2.2
1.0
–0.6
0.2
0.8 0.7
S&P 500 BarclaysCapital Global
TreasuryIndex
Hedged
BarclaysCapital Global
TreasuryIndex
Unhedged
EM Currency DevelopedCurrency
15.4 16.7
2.55.6
10.5 9.4
S&P 500 MSCI World BarclaysCapitalGlobal
TreasuryIndex
Hedged
BarclaysCapitalGlobal
TreasuryIndex
Unhedged
EMCurrency
DevelopedCurrency
Three-Year Correlation to Equity**
Three-Year Volatility (Percent)**
EM Currency Has Not Provided Diversification
CMO 1Q 2013 | 24

AllianceBernstein.com CMO 1Q 2013 | 25AllianceBernstein.com
The Big Picture
There was much talk about things to fear in 2012
Fundamentals have continued to improve, particularly in the US
In key countries, headwinds have eased, but more work remains
In the “three worlds”* balance remains key, with important emphases:
Safety: be efficient
Income/Cash Flow: be selective
Appreciation: be active
As of December 31, 2012 *Referring to the potential market environments on slide 14 Source: AllianceBernstein
CMO 1Q 2013 | 25

AllianceBernstein.com CMO 1Q 2013 | 26AllianceBernstein.com
Important Mutual Fund Information
Investors should consider the investment objectives, risks, charges and expenses of any Fund/Portfolio carefully before investing. For copies of our prospectus or summary prospectus, which contain this and other information, visit us online at www.alliancebernstein.com or contact your AllianceBernstein Investments representative. Please read the prospectus and/or summary prospectus carefully before investing.
AllianceBernstein Investments, Inc. (ABI) is the distributor of the AllianceBernstein family of mutual funds. ABI is a member of FINRA and is an affiliate of AllianceBernstein L.P., the manager of the funds.
CMO 1Q 2013 | 26

AllianceBernstein.com CMO 1Q 2013 | 27AllianceBernstein.com
Important Risk Information Related to Investing in Emerging Markets and Foreign Currencies
Investing in emerging-market debt poses risks, including those generally associated with fixed-income investments. Fixed-income securities may lose value due to market fluctuations or changes in interest rates. Longer maturity bonds are more vulnerable to rising interest rates. A bond issuer’s credit rating may be lowered due to deteriorating financial condition, which may result in losses and potentially default or failure to meet payment obligations. The default probability is higher in bonds with lower, non-investment-grade ratings (commonly known as “junk bonds”). There are other potential risks when investing in emerging-market debt. Non-US securities may be more volatile because of the associated political, regulatory, market and economic uncertainties; these risks can be magnified in emerging-market securities. Emerging-market bonds may also be exposed to fluctuating currency values. If a bond’s currency weakens against the US dollar, this can negatively affect its value when translated back into US dollar terms.
CMO 1Q 2013 | 27

AllianceBernstein.com CMO 1Q 2013 | 28AllianceBernstein.com
Index Definitions
Barclays Capital Global Aggregate–Corporate Index: Tracks the performance of investment-grade corporate bonds publicly issued in the global market found in the Global Aggregate. (Represents Global Corporates on slide 4.)
Barclays Capital Global Emerging Markets Index: Represents the union of the USD-denominated U.S. Emerging Markets Index and the predominately EUR-denominated Pan Euro Emerging Markets Index, covering emerging markets in the Americas, Europe, Middle East, Africa and Asia. (Represents Emerging-Market Debt on slide 4.)
Barclays Capital Global High Yield Index: Provides a broad-based measure of the global high-yield fixed-income markets. It represents the union of the U.S. High Yield, Pan European High Yield, U.S. Emerging Markets High Yield, CMBS High Yield and Pan European Emerging Markets High Yield Indices. (Represents Global High Yield on slide 4.)
Barclays Capital Global Treasury: Australia Bond Index: Includes fixed-rate, local-currency sovereign debt that makes up the Australian Treasury sector of the Global Aggregate Index.
Barclays Capital Global Treasury: Canada Bond Index: Includes fixed-rate, local-currency sovereign debt that makes up the Canadian Treasury sector of the Global Aggregate Index.
Barclays Capital Global Treasury: Euro Bond Index: Includes fixed-rate, local-currency sovereign debt that makes up the Euro Area Treasury sector of the Global Aggregate Index. (Represents Euro Area Gov’t on slide 4.)
Barclays Capital Global Treasury: Japan Bond Index: Includes fixed-rate, local-currency sovereign debt that makes up the Japanese Treasury sector of the Global Aggregate Index. (Represents Japan Gov’t on slide 4.)
Barclays Capital Global Treasury: United Kingdom Bond Index: Includes fixed-rate, local-currency sovereign debt that makes up the UK Treasury sector of the Global Aggregate Index.
Barclays Capital Municipal Bond Index: A rules-based, market value–weighted index engineered for the long-term tax-exempt bond market. (Represents Municipals on slide 4.)
Barclays Capital U.S. Treasury–U.S. TIPS Index: Consists of inflation-protected securities issued by the US Treasury. (Represents TIPS on slide 4.)
Barclays Capital U.S. Treasury Index: Includes fixed-rate, local-currency sovereign debt that makes up the US Treasury sector of the Global Aggregate Index. (Represents US Gov’t on slide 4.)
Following are definitions of the indices referred to in this presentation. It is important to recognize that all indices are unmanaged and do not reflect fees and expenses associated with the active management of a mutual fund portfolio. Investors cannot invest directly in an index, and its performance does not reflect the performance of any AllianceBernstein mutual fund.
CMO 1Q 2013 | 28

AllianceBernstein.com CMO 1Q 2013 | 29AllianceBernstein.com
Index Definitions (continued)
BofA Merrill Lynch Emerging Markets Corporate Plus Index: This index tracks the performance of US dollar– and Euro–denominated emerging-markets non-sovereign debt publicly issued within the major domestic and Eurobond markets.
DJ-UBS Total Return Commodity Index: Consists of exchange-traded futures on 19 physical commodities that are weighted to account for economic significance and market liquidity. (Represents Commodities on slide 4.)
FTSE EPRA/NAREIT Global Real Estate Index: Designed to represent general trends in eligible real estate equities worldwide. (Represents Global REITs on slide 4.)
J.P. Morgan Corporate Emerging Markets Bond Index–Broad Diversified: This index is a global, liquid corporate emerging-market benchmark that tracks US dollar–denominated corporate bonds issued by emerging-market entities. It includes smaller issues to cover a wider array of corporate bonds.
J.P. Morgan Emerging Markets Bond Index Global Diversified: Limits the weights of countries with larger debt stocks by only including a specified portion of these countries' eligible current face amounts of debt outstanding.
MSCI EAFE Index: A free float–adjusted, market capitalization–weighted index designed to measure developed-market equity performance, excluding the US and Canada. It consists of 22 developed-market country indices. (Represents EAFE on slide 4.)
MSCI Emerging Markets Index: A free float–adjusted, market capitalization–weighted index designed to measure equity-market performance in the global emerging markets. It consists of 21 emerging-market country indices. (Represents Emerging Markets on slide 4.)
Russell 2000 Index: Measures the performance of the small-cap segment of the US equity universe. It is a subset of the Russell 3000 Index representing approximately 8% of the total market capitalization of that index. It includes approximately 2,000 of the smallest securities based on a combination of their market cap and current index membership. (Represents US Small-Cap on slide 4.)
S&P 500 Index: Includes a representative sample of 500 leading companies in leading industries of the US economy. (Represents US Large-Cap on slide 4.)
The WisdomTree Dreyfus Emerging Currency Fund (CEW): Includes the following constituent currencies: Mexican peso, Brazilian real, Chilean peso, South African rand, Polish zloty, Russian ruble, Turkish new lira, Chinese yuan, South Korean won, Indonesian rupiah, Indian rupee and Malaysian ringgit.
The PowerShares DB US Dollar Index Bullish Fund (UUP): Designed for investors who want a cost-effective and convenient way to track the value of the US dollar relative to a basket of the six major world currencies—the euro, yen, British pound, Canadian dollar, Swedish krona and Swiss franc (collectively, the “Basket Currencies”).
MSCI makes no express or implied warranties or representations, and shall have no liability whatsoever with respect to any MSCI data contained herein. The MSCI data may not be further redistributed or used as a basis for other indices, any securities or financial products. This report is not approved, reviewed or produced by MSCI.
CMO 1Q 2013 | 29