Embed Size (px)
Citation preview

Western UniversityScholarship@WesternEconomic Policy Research Institute. EPRI WorkingPapers Economics Working Papers Archive
2013
2013-3 The Effects of Central Bank Independenceand Inflation Targeting on MacroeconomicPerformance: Evidence from Natural ExperimentsMichael Parkin
Follow this and additional works at: https://ir.lib.uwo.ca/economicsepri_wp
Part of the Economics Commons
Citation of this paper:Parkin, Michael. "2013-3 The Effects of Central Bank Independence and Inflation Targeting on Macroeconomic Performance:Evidence from Natural Experiments." Economic Policy Research Institute. EPRI Working Papers, 2013-3. London, ON: Departmentof Economics, University of Western Ontario (2013).

The Effects of Central Bank Independence and Inflation Targeting on Macroeconomic
Performance: Evidence from Natural Experiments
by
Michael Parkin
Working Paper # 2013-3 June 2013
Economic Policy Research Institute EPRI Working Paper Series
Department of Economics Department of Political Science
Social Science Centre The University of Western Ontario
London, Ontario, N6A 5C2 Canada
This working paper is available as a downloadable pdf file on our website http://economics.uwo.ca/centres/epri/
The Effects of Central Bank Independence and Inflation Targeting on Macroeconomic
Performance: Evidence from Natural Experiments
Michael Parkin
University of Western Ontario
May 2013
Preliminary draft: I thank David Laidler, Jim MacGee, Larry White, Peter Tulip and others at the
University of Western Ontario and Reserve Bank of Australia for comments on an earlier version
of this work. An Excel spreadsheet containing the data and calculations is available on request.

1
Does a central bank that is independent of political influence deliver a better macroeconomic
performance than one that implements monetary policy decisions taken by government? Does an
inflation targeting agreement between central bank and government improve macroeconomic
performance? And does the combination of an independent central bank and inflation targeting
deliver an even better performance than either on its own? This paper addresses these questions
by examining the outcomes of some natural experiments.
Questions about the design of the monetary policy framework—the set of institutional
arrangements under which monetary policy decisions are made and executed—have always been
important but have not always, indeed not often, occupied an agenda topping position. They have
taken second place to questions about the appropriate choice of policy targets and instruments
and the appropriate rules or discretion considerations in their setting. Yet the institutional
arrangements play a crucial role in either constraining or failing to constrain the monetary policy
process; and they are central to the current monetary policy debate on how to support expansion
and eventually exit an era of extraordinary monetary stimulus.
Making a fiat money system work has never been easy and such a system stands in permanent
threat from inflationary forces that have two sources. The first is the ever-present temptation
faced by the sovereign (regardless of whether it is a despot or a constitutional democracy) to
finance expenditure by creating money. The second is the appealing but wrong idea that inflation
and its concomitant, currency depreciation, stimulate employment and economic growth.
We have seen these two forces at work since the mid-1960s. As inflation pressures emerged
in different countries at different rates, the Bretton Woods fixed-exchange rate system came
under severe stress. This stress became so acute that on August 15, 1971, the United States
closed the gold window, and initiated the modern era of monetary arrangements—a world of
multiple fiat monies with no common nominal anchor. The 1970s were the opening years of a
rare period in history in which the world is without a global standard of value, a situation that
required central banks to develop an entirely new approach to monetary policy.
For the two decades that followed, the world struggled to contain inflation and was unable to
return the real economy to a growth path that matched that of the 1960s. Eventually, and working
against these forces, advances in our understanding of how monetary policy influences the
economy led to a new calm. During the 1990s, some central banks became more independent,
some adopted inflation targeting, and some just got better at making monetary policy decisions,
learning from experience and implementing ideas from advances in the theory of monetary
policy. Inflation was checked, and the Great Moderation took hold.
But inflationary forces had not disappeared and during 2004 and 2005, the Federal Reserve
departed from its price-stability script and kept the federal funds rate too low for too long
facilitating a house prices bubble. Omitting all detail, when the interest rate started to rise, as it
2
did relentlessly through 2006, and as house prices fell, bringing a global financial crash, the
response was to create ever more money and flood the banks with reserves.
After more than 3 years of near-zero interest rates, and trillions of dollars of quantitative
easing, and with no signs of a return to pre-crisis growth rates and employment levels, the call
again goes out for more inflation. Central bank independence and inflation targeting must be the
problem. Create more money, run larger deficits, target unemployment and real GDP growth,
dress it up by targeting nominal GDP, raise inflation expectations, and depreciate the currency.
The call is the same in all the major countries. With central bank independence and inflation
targeting under threat, it is timely to evaluate these institutional arrangements.
The literature on the effects of central bank independence on macroeconomic outcomes is
large1. It begins with Bade and Parkin (1978), which found limited effects of central bank
independence on inflation. Three decades and 59 empirical studies later, Klomp and de Haan
(2010),2 concluded that there exists a significant negative relationship between central bank
independence and inflation—independent central banks deliver lower inflation—and the
particular measure of central bank independence used has little effect on its estimated effect.
Fry, Julius, Mahadeva, Roger, and Sterne (2000) provided the most comprehensive
measurement of central bank independence “over a range of characteristics covering legal
objectives, goals, instruments, finance of the government deficit, and term of office of the
Governor” with data for 93 central banks generated by a survey conducted in 1998 by the Bank
of England Centre for Banking Studies. Carlstrom and Fuerst (2009) used these data along with
earlier indexes to argue that not only does central bank independence lower the inflation rate but
the 1990s had lower inflation than earlier decades because central banks became more
independent. They attribute nearly two-thirds of the fall in inflation to this cause—central bank
independence is the source of two-thirds of the Great Moderation.
Cargill (2013) challenges the prevailing consensus and argues that the negative correlations
between measures of central bank independence and inflation are not robust and that actual (de
facto) independence dominates legal (de jure) independence.
A further concern about the consensus view is that the cross-country data are contaminated by
social and political variables that might influence both the nation’s central bank law and its
attitude toward inflation. For example, Germany’s social memory of hyperinflation might be the
cause of the independence of its post-war central bank and its low inflation rate and that given
Germany’s strong inflation-aversion, even a government-dominated central bank might have
delivered the same low inflation. Similarly, the equivalent memory in the psyche of the United
1 Parkin (2012) surveys and provides a critical appraisal of this large literature. This paper also contains an earlier and now superseded version of
the natural experiments reported here. 2 Klomp and de Haan provide the details of the 59 studies.

3
Kingdom is the depressed inter-war years. A social memory of this period might be the cause of
the U.K. government taking over and running the Bank of England in 1946 and of the country’s
pursuit of full employment at the cost of rising inflation and occasional devaluation. And given
the British aversion to unemployment, even an independent Bank of England might have
delivered the same inflation performance.
To control for these possible deeper influences and isolate the effects of central bank law, we
need natural experiments in which some central banking arrangements change and some do not.
When the central bank laws literature started, such experiments were unavailable. But we now
have several examples of changes in central banking arrangements that make it possible to
examine the relationship between the changes in inflation and other aspects of macroeconomic
performance and the change in central bank independence. The only existing attempt at this
exercise is Carlstrom and Fuerst (2009), but this attempt examines changes between two time
periods that are common to all central banks and not changes between periods defined by
individual country changes in the monetary policy framework3.
There is less controversy about inflation targeting. A consensus has emerged that inflation
targeting delivers lower inflation. When the central bank and government agree an inflation
control target, which is pursued by the central bank setting the policy interest rate in a
transparent, rule-like manner that satisfies the Taylor principle4 and that is well explained in a
periodic clearly written report, the inflation rate falls. A comprehensive study by Bernanke,
Laubach, Mishkin, and Posen (1999) concludes, “The clearest finding from the international
experience is that inflation targeting does indeed lead to lower inflation. In all the cases we have
studied, countries using inflation targets significantly reduced both the rate of inflation and the
public’s expectations relative to their previous experience and, probably, relative to what they
would have been in the absence of inflation targets.”5
The effects of central bank laws and inflation targeting on real macroeconomic performance
are less studied than the effects on inflation. The most cited work, Alesina and Summers (1993)
finds no effects of central bank laws on the real economy.
Who is correct about central banking independence and macroeconomic performance? And is
the consensus on the effectiveness of inflation targeting well-founded? This paper attempts to
answer these questions by studying some natural experiments. It begins by defining a framework
for assessing the effects of greater independence and inflation targeting. It then describes the data
and events that constitute the natural experiments. Finally, it reports and interprets the results of
the experiments and considers alternative interpretations.
3 Other issues arise in interpreting Carlstrom and Fuerst’s findings that I examine in Parkin (2012). 4 The real interest rate must move in the same direction as the inflation rate to satisfy the Taylor principle. 5 Bernanke et al p. 297. The cases they studied were New Zealand, Canada, United Kingdom, Sweden, Israel, Australia, and Spain.

4
The main conclusions are: (1) When a central bank becomes more independent, it lowers the
inflation rate and lowers the variability of inflation but has no effect on real GDP or
unemployment. (2) When a central bank becomes an inflation targeter, it lowers the inflation
rate, lowers the variability of inflation, lowers the variability of real GDP growth and the output
gap, and has no adverse effect on the unemployment rate. The real GDP growth rate also
increases but the source of this increase is unlikely to be inflation targeting. (3) An inflation
targeter that becomes more independent delivers a similar outcome to that of a more independent
bank that does not target inflation.
I FRAMEWORK FOR ASSESSING EFFECTS
The monetary policy framework might influence macroeconomic activity in three ways. It
might operate through its effects on:
1) The short-run tradeoff between the levels of inflation and unemployment (or output)—
the Phillips curve tradeoff;
2) The long-run tradeoff between the fluctuations in inflation and real activity—the Taylor
curve tradeoff;
3) The trend growth rate of real GDP.
The Short-Run Phillips Curve Tradeoff
When a central bank becomes more independent with a price stability mandate, or when
inflation targeting is adopted, short-run macroeconomic activity might change in either of two
ways. The expected inflation might fall and bring a lower inflation rate with no change in the
unemployment rate—a downward shift of the short-run Phillips curve. Or the actual inflation rate
might fall with no change in the expected inflation rate, so that the unemployment rate increases–
a movement downward along the short-run Phillips curve.
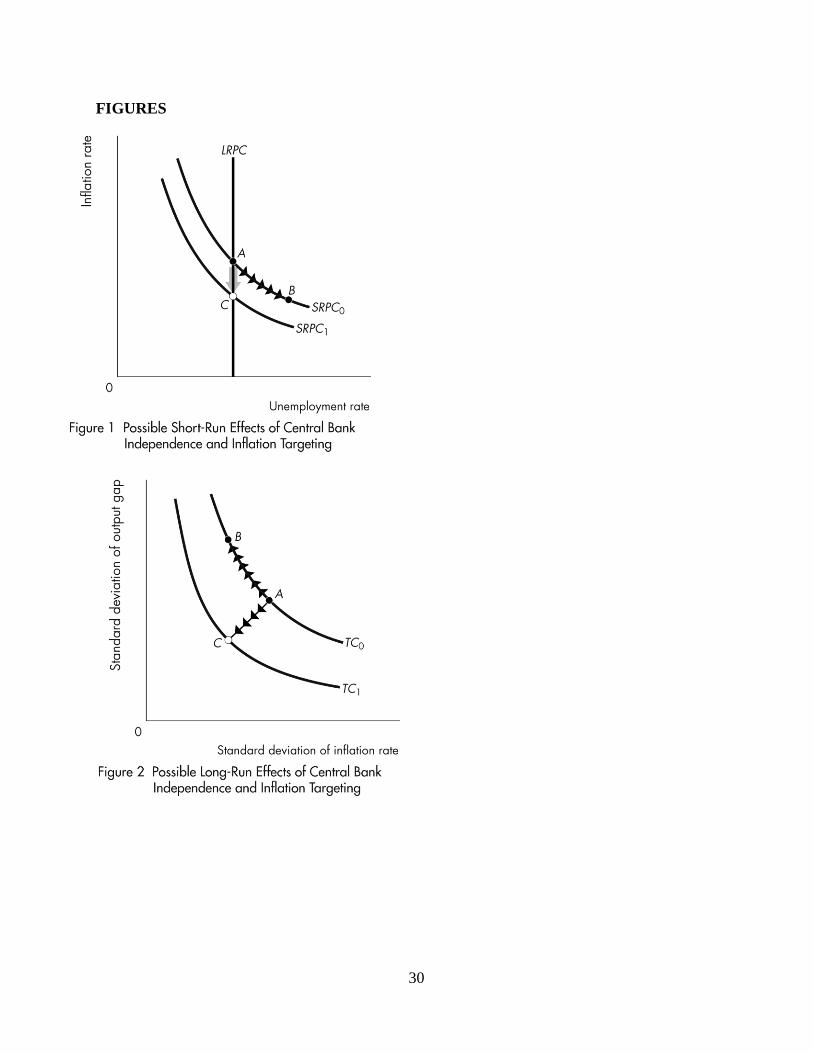
Figure 1 illustrates these two possibilities. The curves, SRPC0 and SRPC1 are two short-run
Phillips curves and the vertical line LRPC is the long-run Phillips curve, located at the natural
unemployment rate. For a given expected inflation rate and natural unemployment rate the short-
run Phillips curve describes the tradeoff faced by the central bank. Monetary policy can deliver
any inflation target at the natural unemployment rate. For example, the central bank can target
point A or point C.
If inflation is at point A and the central bank wants to move to point C, there are two paths, a
direct one with no change in the unemployment rate or an indirect one by way of point B. To
move directly from A to C, a central bank must lower the expected inflation rate in step with
lowering the actual inflation rate. By lowering the expected inflation rate, it shifts the short-run
Phillips curve downward and avoids unemployment rising above the natural rate.

5
If the central bank lowers the inflation ahead of a fall in the expected inflation rate, the
economy moves downward along SRPC0 to point B. Eventually, the expected inflation rate falls
and the unemployment rate returns to the natural rate. In the transition from high inflation at A to
low inflation at C, the unemployment rate exceeded the natural rate and the economy had a
higher average unemployment rate than one that moves directly from A to C.
It is generally supposed that if a central bank raises the interest rate and slows the pace of
monetary expansion, but takes no special steps to signal its resolve to lower inflation, it will
create a recession. Unemployment will rise above the natural rate as the inflation rate slowly
falls. It is hoped that either by changing the independence status and price stability focus of the
central bank, or by implementing an inflation targeting regime, the credibility of the banks plan
to lower inflation will bring a simultaneous fall in expected inflation and avoid recession.
Is this hope justified? Does a move toward greater central bank independence lower the
inflation rate? Does inflation targeting deliver a lower inflation rate? And does an independent
central bank or one that targets inflation deliver lower inflation without the cost of higher
average unemployment?
The short-run Phillips curve is a temporary tradeoff. It moves when the expected inflation rate
changes, and in the long run expected inflation equals actual inflation. The second tradeoff
confronting a central bank is more durable.
The Long-Run Taylor Curve Tradeoff
The Taylor curve6 is a tradeoff is between the variability of output and the variability of
inflation. In a Taylor curve graph, the x-axis measures the variability of inflation as its standard
deviation over some relevant period and the y-axis measures the variability of aggregate output
(again, as the standard deviation over the same relevant period). Figure 2 shows two Taylor
curves, TC0 and TC1.
In any given setting, the curve describes the tradeoff faced by the central bank. It is an
efficiency frontier. It the tradeoff is TC0, points below this curve are unattainable. Points above
TC0 are inefficient—there is a better monetary policy that delivers a point on the curve.
On the Taylor curve, monetary policy can target inflation closely only by permitting output to
fluctuate more widely. For example, when a negative aggregate supply shock occurs, with no
policy response the inflation rate rises and real GDP falls. If the central bank’s policy response in
such a situation is to increase aggregate demand, the fall in real GDP is smaller but the rise in the
inflation rate is larger. Conversely, if the central bank’s policy response to a negative supply
shock is to lower aggregate demand in order to avoid a rise in the inflation rate, real GDP falls by
6 See Taylor (1979) The Taylor curve graph is on p. 1281.

6
a larger amount. These alternative policy responses to an aggregate supply shock are two points
on a tradeoff between inflation variability and output variability—two points on a Taylor curve.
If the Taylor curve is TC0, a central bank that responds in a neutral manner and tries with
similar firmness to avoid volatility in both output and inflation operates at point A. A central
bank that has a greater dislike of inflation and is less concerned about output volatility operates
at point like B.
The position and shape of the Taylor curve depends on features of the economy that include
the size and persistence of exogenous shocks, the degree of wage and price rigidity, and the
credibility and transparency of monetary policy. For example, an economy with large and
persistent exogenous shocks, rigid wages and prices, and a reputation for arbitrary monetary
policy, might be on curve TC0, while an economy with smaller and less persistent exogenous
shocks, more flexible wages and prices, and credible and transparent monetary policy, might be
on curve TC1.
Central bank independence, its focus on price stability, and whether it is an inflation targeter
are among the institutional settings that might influence the credibility and transparency of
monetary policy and might, therefore, influence the position of the Taylor curve. These
institutional features of monetary policy might also influence the point on the Taylor curve at
which the economy operates.
So the second set of questions to be investigated are: Does the position of the Taylor curve
depend on whether the central bank is independent with a price stability focus or on whether the
central bank is an inflation targeter? Or do these features on the monetary policy institutions
have little effect on the position of the Taylor curve and merely influence the point on the curve
chosen by the central bank. Put differently, do greater independence and the pursuit of an
inflation target bring greater real volatility? Or is there a free lunch with the variability of both
inflation and the real economy subsiding?
The third effect is that of low inflation on long-term economic growth.
The Effect of Inflation on Long-Term Growth
Studies of the relationship between inflation and economic growth have found that low
inflation is good for growth7. The relationship is not strong and has not so far been detected at
low inflation rates. Barro describes it thus: “The basic finding is that higher inflation goes along
with a lower rate of economic growth. Moreover, the adverse effect of higher inflation on
economic outcomes is quantitatively important. This pattern shows up clearly for inflation rates
in excess of 15–20% annually, but cannot be isolated statistically for the more moderate
7 See, Barro (1998).

7
experiences. However, there is no evidence in any range of a positive relation between inflation
and growth. The analysis also suggests that the estimates isolate the direction of causation from
inflation to growth, rather than the reverse.” Low variability of inflation is also a contributor to
faster real growth. The view that low inflation promotes economic growth is widely accepted and
even finds a place in central bank monetary policy reports8.
So the third set of questions for investigation are do central bank independence and inflation
targeting lower the level and the variability of inflation and boost the real GDP growth rate?
We now turn to the data and the events that constitute the natural experiments.
II DATA AND EVENTS
A nation’s macroeconomic performance will be described by the mean and standard deviation
of its inflation rate and real GDP growth rate, the standard deviation of its output gap, and its
mean unemployment rate.
Inflation, Real Fluctuations, and Unemployment
The macroeconomic performance of 26 advanced economies is described using annual data
on CPI inflation, the real GDP growth rate, the output gap (the percentage deviation of real GDP
from potential GDP), and the unemployment rate from 1980 through 20119. Using data starting
in 1980 has the advantage that it avoids contaminating the experiments with the confusions of
the early post-Bretton Woods world in which central banks were groping for procedures to cope
with the new flexible exchange rate world.
Annual data rather than higher frequency quarterly or monthly data are used because the
objective of this investigation is discover how long term average measures of macroeconomic
performance respond to structural changes in monetary policy arrangements. Annual data serves
this purpose better than nosier high frequency data.
CPI inflation is used in preference to the other available measures such as the GDP deflator or
the PCE deflator for two reasons. First, for most countries, the CPI is the index on which the
central bank focusses for making monetary policy decisions. Second, the correlation between the
CPI and other broad price indexes is high.
The output gap is the variable of choice for measuring real fluctuations but it is available for
only 22 advanced economies. The real GDP growth rate is available for all of them. There is a
marked difference in the variability of the two measures and the correlation between them is only
8 The Bank of Canada Monetary Policy Report preamble repeats each issue the view that “Canada’s experience with inflation targeting since 1991 has shown that the best way to foster confidence in the value of money and to contribute to sustained economic growth, employment gains
and improved living standards is by keeping inflation low, stable and predictable.” 9 The data source is the International Monetary Fund, World Economic Outlook Database, October 2012, downloaded 31 January 2013 and the initial sample is the 35 economies that the IMF defines as “Advanced”.

8
0.34. For this reason, two sets of results are reported, one based on real GDP growth for the full
26-country sample and another based on the output gap for the smaller 22-country sample.
The unemployment rate data in the IMF World Economic Outlook database is a mixture of
national definition for 14 economies, the ILO harmonized measure for 11 economies, and the
OECD harmonized measure for one economy.
The samples of 26 (and 22) countries are a subset of the 35 economies that the IMF classifies
as “Advanced.” Seven of the countries were excluded because their data runs are seriously
incomplete or because they are too small to be given the same weight as the other countries10
. A
further two countries, Iceland and Israel, were excluded because their average inflation rates and
variability of inflation place them in a different distribution than the other countries. For the 26
countries remaining in the sample, between 1980 and 2011, the mean inflation rate is 4.1 percent
and the standard deviation of inflation is 4.5 percent. For Iceland and Israel, the mean inflation
rate over the same period is 28 percent and the standard deviation is 60 percent. On the scale of
these two countries, the other 26 compress to a single data point and the significance of the
variability across them that we want to reveal is lost.
Central Bank Independence and Inflation Targeting Events
The central banking arrangements in the 26 economies are examined focusing on central bank
independence and inflation targeting. Between 1989 and 2001, these arrangements changed in 16
of the 26 economies in ways that constitute natural experiments that enable us to isolate the
effects of central bank independence and inflation targeting on macroeconomic performance.
Table 1 summarizes the changes in chronological order.
The information in Table 1 enables us to place the economies in four groups:
1) More independent
2) Inflation targeters
3) More independent inflation targeters
4) Others (controls)
More Independent
A central bank is independent if its governor and board set the monetary policy instrument
(typically the overnight interest rate target) without political pressure in pursuit of goals that
include, and ideally alone include price stability. Previous attempts to estimate the influence of
central bank independence on macroeconomic performance have coded the features of central
banks and created independence indexes. But as shown in earlier work, this detailed approach to
describing central bank independence turns out to be no more informative than a dichotomy
10 The 7 countries are Cyprus, Czech Republic, Estonia, Malta, San Marino, Slovak Republic, and Slovenia.

9
between more and less independent11
. We can exploit that finding by looking for central banks
that have become more independent.
New Zealand made the first move toward greater central bank independence with the
sweeping Reserve Bank of New Zealand Act 198912
, which created an independent central bank
with the single mandate to achieve price stability. The Bank of Japan Act, 199713
, the Bank of
Korea Act, 199814
, the Bank of England Act, 199815
, and the Bank of Sweden Act, 199916
all
saw a similarly clear enunciation of a commitment to price stability by the policy decisions of an
independent central bank. The details differ but the broad thrust is common: explicit instrument
independence for the central bank in pursuit of the goal of price stability. These events are
regarded as creating more-independent central banks.
The ECB became fully operational on January 1, 1999. Before that date, Austria, Belgium,
Finland, France, Germany, Ireland, Italy, Luxembourg, the Netherlands, Portugal, and Spain had
their own central banks. After January 1, 1999, these country’s central banks ceded their
monetary policy powers to the ECB. Other nations joined the Eurozone and their central banks
were replaced by the ECB in the years that followed (1 January 2001, Greece; 1 January 2007,
Slovenia; 1 January 2008, Cyprus and Malta; 1 January 2009, Slovakia; and 1 January 2011,
Estonia).
The ECB was established as an independent central bank with a mandate to achieve price
stability, defined as an inflation rate of around 2 percent per year. Most of the national central
banks replaced by the ECB were not independent, so for most of the Eurozone economies, the
change was to a more independent central bank. But there was no such change for Germany. The
independence of the ECB is similar to that of the Bundesbank. Further, the Bundesbank is the
most influential owner of the ECB.
Also, there was no material change in independence status of four other Eurozone members:
Austria, Belgium, Luxembourg, and the Netherlands. The reason why these countries had no
change in independence is that the exchange rates of their national currencies were pegged to the
Deutsch mark (DM). The Austrian schilling was pegged at 7.04 per DM and the Dutch guilder at
1.12 per DM for the entire period from 1980 to 1999. The Belgian franc was effectively pegged
at 20.5 per DM after 1982 and the Luxembourg franc was pegged at 1 Belgian franc. With
rigidly fixed exchange rates against the DM, the monetary policy actions of these countries were
constrained by those of the Bundesbank, which effectively set their monetary policies.
11 See Cargill (2013) and Parkin (2012). 12 See http://www.legislation.govt.nz/act/public/1989/0157/latest/DLM199892.html and http://www.rbnz.govt.nz/about/acct.pdf 13 See http://www.japaneselawtranslation.go.jp/law/detail/?id=92&vm=02&re=01 and http://www.boj.or.jp/en/announcements/release_1996/un9611a.htm/ 14 See http://www.akes.or.kr/akes/downfile/01_Thomas_Cargill_rev_.pdf 15 See http://www.bankofengland.co.uk/about/Documents/legislation/act1998.pdf 16 See http://www.riksbank.se/en/The-Riksbank/Historia1/Sveriges-Riksbank-10-years-as-an-independent-central-bank/

10
Summarizing the above, we have 11 countries with more independent central banking
arrangements: New Zealand, Japan, Korea, the United Kingdom, Sweden, Finland, France,
Ireland, Italy, Portugal, and Spain.
Inflation Targeting
Inflation targeting is an approach to monetary policy-making with three key features. First, a
price index and a target range for its inflation rate is set. The target might be agreed with
government, imposed by the government, or self-imposed by the central bank. Second, the
central bank aims to achieve the mid-point of the range but flexibly moves toward either extreme
to moderate fluctuations in the real economy. Third, a frequent report (variously titled “inflation
report” or “monetary policy report” or “monetary policy statement”) provides a detailed account
of the bank’s forecasts and explanation for its policy decision. More succinctly, inflation
targeting is the credible, transparent, and flexible pursuit of an inflation target along with
minimum attainable output and inflation variability.
This description of inflation targeting is clearly not the single-minded pursuit of an inflation
target to the exclusion of real output and employment objectives. It is effectively a dual mandate,
but one in which the dual goals are low inflation and low variability of output and employment,
not low inflation and a high level of output or employment. The distinction is a vital one.
Monetary policy does influence variability, so the dual mandate of the flexible inflation targeter
is attainable. In contrast, monetary policy is powerless to influence the level of real variables,
except temporarily, so the pursuit of a real level objective is not compatible with price stability.
To emphasize the dual mandate nature of the approach, one prominent targeter now uses the
phrase Flexible Inflation Targeting17
to describe its approach.
Many central banks count themselves among the ranks of inflation targeters, but only five of
the advanced economies belong to this group: New Zealand, Canada, the United Kingdom,
Australia, and Sweden, and they are all ‘flexible inflation targeters’.
New Zealand’s inflation targeting is mandated by the 1989 Act and carries penalties against
the governor for failure to achieve the target. Canada’s targeting is done under an explicit 5-year
(renewable) agreement between the Bank of Canada and central government. Inflation targeting
in the United Kingdom and Sweden began as voluntary targets set by the respective central
banks and then became formal with Acts that made the central banks more independent.
Australia is different from the other four countries in the manner of its adoption of inflation
targeting. The political environment made it necessary for the Reserve Bank to proceed
surreptitiously. Consequently, Australia’s adoption of inflation targeting was gradual, initially
17 The Bank of Canada uses this term, with the words capitalized for further emphasis.

11
unannounced, later floated as a trial balloon by Governor Bernie Fraser18
, and eventually but
long after the event, ratified in a joint agreement by the Treasurer and Governor.19
All of these central banks go on the record every few months with their view of the likely
future course of inflation and other macroeconomic variables over a period that usually runs two
years into the future. Two of them, the Bank of England and the Riksbank, quantify their own
uncertainty by publishing fan charts that capture the forecast distribution. And the Riksbank even
publishes forecasts of its own future interest rate decisions. This clarity and transparency is a
crucial feature of inflation targeting.
More Independent Inflation Targeters
Three countries, New Zealand, Sweden, and the United Kingdom became more independent
and adopted inflation targeting. New Zealand made these two changes simultaneously, but
Sweden and the United Kingdom first became inflation targeters and subsequently became more
independent. So these three countries are both inflation targeters and more independent inflation
targeters.
Treatment Groups and Control Group
The central banks that became more independent or adopted inflation targeting are those that
received treatments. By comparing the performances of the treatment groups with those that
didn’t change—with controls—we can isolate the effects of the treatments,
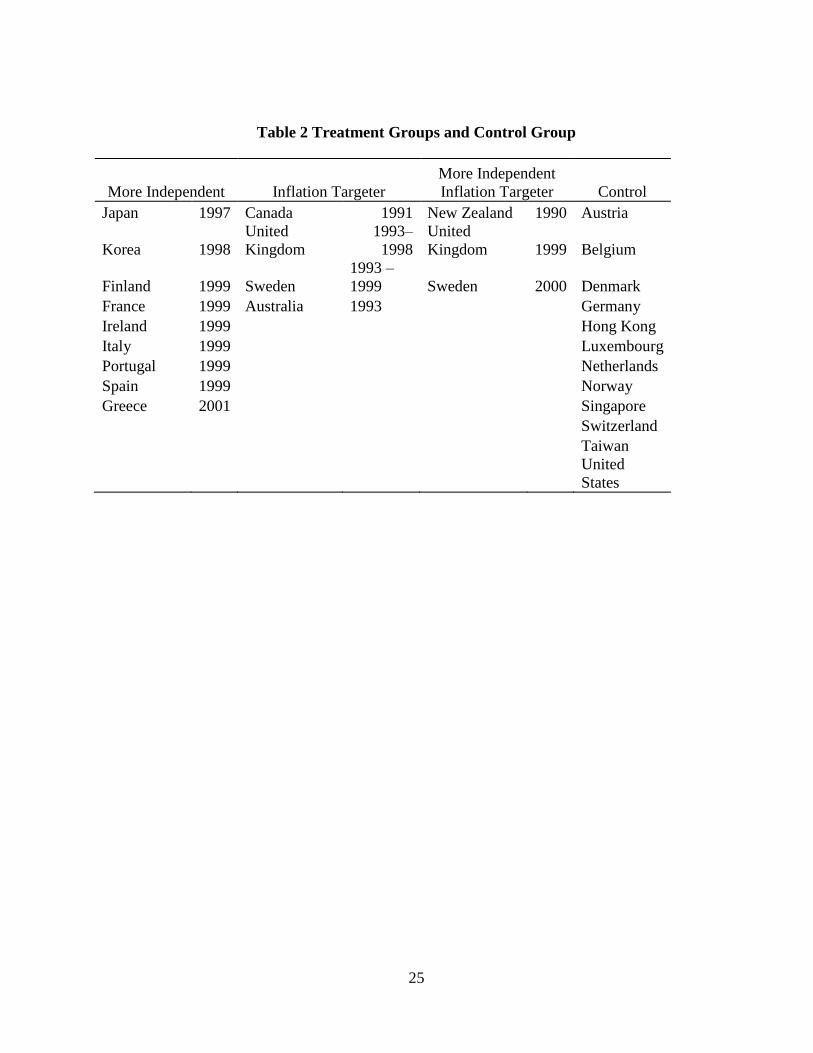
Table 2 lists the 26 economies and their assignment to the three treatment groups and a
control group. The table also shows the years in which a country’s central bank became more
independent and/or adopted inflation targets20
.
III LOOKING FOR THE EFFECTS
If central bank independence and inflation targeting influence monetary policy outcomes,
these influences should be visible after countries modified the central bank laws and after
countries became inflation targeters.
To reveal these influences, we must control for other factors that act on inflation and
macroeconomic performance that were different during the 2000s from the 1980s and 1990s.
Listing and measuring all these potential influences is neither feasible nor necessary. Instead, we
can regard the countries with more independent central banks as one treatment group, the
countries that adopted inflation targeting as a second treatment group, and those that made both
18 See Bernie Fraser (1993) and Glenn Stevens (1999). 19 Ian Macfarlane (1998) provides a detailed and authoritative account of the political environment navigated by the Reserve Bank in its under-
the-radar and gradual adoption of inflation targeting and its eventual ratification with a joint agreement. 20 The dating of the adoption of inflation targeting in Australia is the generally accepted one and based on the date of Governor Bernie Fraser’s trial balloon.

12
changes as a third treatment group. We can compare the changes in macroeconomic
performances of the countries in these groups with those of a control group of countries, a group
of otherwise similar countries in otherwise similar times that did not change their central bank
law or become inflation targeters. The natural choice for the control group is the advanced
economies listed in Table 2.
“Before” and “After”
For the 26 countries listed in Table 2 and for a “before” and an “after,” the mean and the
standard deviation of inflation rates and real GDP growth rates, the mean unemployment rate
were calculated. Also for the 22 countries for which output gap data are available, “before” and
“after” standard deviations were calculated.
For the 3 treatment groups, the “before” period ended 1 year after the policy change date
shown in Table 2 and the “after” period began 2 years after the change date. The rationale for
this time lag is that it reasonably represents the types of lags found in time-series studies. These
lags also provide time for the new institutional arrangement to be clear of any transition effects
that follow the change.
For the control group of economies, 11 “before” and “after” sets correspond to the 11
different break dates for the 3 treatment groups: 1997, 1998, 1999, and 2001 for the more
independent comparisons; 1991, 1993, 1993 – 1998, and 1993 – 1999 for the inflation targeters;
and 1990, 1999, and 2000 for the more independent inflation targeters.
What Do Greater Independence and Inflation Targeting Achieve?
Table 3 provides summary statistics that show how macroeconomic performance changed
after a country made its central bank more independent or after it became an inflation targeter, or
after both of these changes occurred.
The changes described in Table 3 are those that accompanied the change in central bank
status. They are not the effects of the change. To see the effects, we must compare the changes in
the treatment economies with the changes in the control economies. First the changes will be
summarized, then the treatment changes will be compared with changes in the control
economies, and finally the findings will be interpreted in terms of the framework established
earlier.
Absolute Changes: More Independent
The countries in which the central bank became more independent lowered their annual
inflation rates by almost 5 percentage points from 7.05 percent before the change to 2.18 percent
after the change. They also lowered the variability of inflation, with a fall in the standard
deviation of annual inflation from 5.34 percent to 1.06 percent. The standard errors of these

13
changes are small: The changes are strongly significant. These are the only significant changes
that accompany a change in the independence of the central bank. Changes in both the mean and
standard deviation of real GDP growth, changes in the variability of the output gap, and changes
in the mean unemployment rate are small and insignificant.
Absolute Changes: Inflation Targeters
Central banks that became flexible inflation targeters but did not change their independence
status delivered strong and widespread changes in macroeconomic performance. The annual
inflation rate fell by almost 5 percentage points from 6.56 percent before targeting to 1.86
percent with targeting. The variability of inflation and the variability of real GDP—both its
growth rate and output gap—also fell. Further, the mean annual growth rate of real GDP rose by
almost 1 percentage point. All these changes have small standard errors and are significant. The
inflation effects are particularly strongly significant with very high t-statistics. Of the variables
studied, unemployment alone was unaffected by the adoption of inflation targeting.
These numbers provide a ringing endorsement of flexible inflation targeting as a procedure
for delivering all round improved macroeconomic performance at no cost in terms of lost jobs.
Absolute Changes: More Independent Inflation Targeters
Three central banks combined more independence with inflation targeting. For New Zealand,
these two events occurred at the same time and for Sweden and the United Kingdom, greater
independence came some years after inflation targeting had started. These central banks
performed almost exactly the same as the central banks that became more independent but did
not adopt inflation targeting. They lowered the inflation rate and lowered the variability of
inflation by amounts similar to those for the central banks that became more independent but did
not become inflation targeters. No other significant changes occurred for this group.
Absolute Changes: Controls
The absolute changes achieved by the central banks in the control group are averages for
“before” and “after” of the 11 sets of dates weighted by the number of treatments at each of the
11 dates. The bottom panel of Table 3 shows the results of these weighted average changes. Like
the central banks that became more independent, these central banks significantly lowered the
inflation rate and its variability and saw no other significant changes.
Notice that the mean inflation rates in Table 3 for the control groups are lower than for the
three treatment groups. So, although the treatment groups saw large falls in their inflation rates,
they began with higher rates than the control countries. But note further that the control group
includes Germany and the other Eurozone economies linked to it and Switzerland, considered to
be the countries with the most independent central banks.

14
For present purposes, what matters is not the independence status of the control central banks
but the fact that during the sample time period, neither their independence nor inflation targeting
status changed.
Changes Compared to Control
Absolute changes in monetary policy outcomes don’t tell us the effects of the change in central
bank status. To see those effects, we need to ask how the changes for the three treatment groups
compare with the changes for the controls. Table 4 provides the relevant data.
More Independent Relative to Control
The countries in which the central bank became more independent lowered their annual
inflation rates by 3 percentage points more than in the controls and the difference is significant.
They also lowered the variability of inflation by significantly more than did the control group.
These are the only significant effects. The other large effect is on unemployment, which the
more independent group lowers and the control group increases. But the confidence in this
change is low.
Inflation Targeters Relative to Control
The inflation targeting countries beat the controls on both the mean and standard deviation of
both inflation and real GDP growth. They lowered the annual inflation rate by 2 percentage
points more than did the control countries and they increased the annual real GDP growth rate by
1.5 percentage points more than the control countries achieved. They also achieved better
outcomes for the unemployment rate and the output gap, though these differences are not
significant.
More Independent Inflation Targeters Relative to Control
The more independent inflation targeters have only two significant differences from the
controls and one of these goes the wrong way. They lowered the variability of inflation but
increased the variability of the output gap. None of their other effects is significant.
More Independence versus Inflation Targeting
We can also compare the treatments against each other. Does being a more independent
inflation targeter give a better performance than just being more independent? Does it improve
on just being an inflation targeter? And which delivers the better outcome, being an inflation
targeter or becoming more independent?
Table 5 provides the relevant data to address these questions.

15
More Independent Inflation Targeter Relative to Inflation Targeter
Only one significant difference is present in the comparison between more independent
inflation targeters and more independent: The more independent inflation targeter delivers a
higher mean real GDP growth rate, and the difference is large 1.86 percentage points. The other
differences between these two groups are small and insignificant.
More Independent Inflation Targeter Relative to More Independent
Two significant differences are present in the comparison between more independent inflation
targeters and inflation targeters, and they both favor the inflation targeter that does not become
more independent. The inflation targeter delivers a less volatile real GDP, in both its growth rate
and output gap. Again, the differences are large. The differences in inflation and unemployment
between these two groups are small and insignificant.
More Independent Relative to Inflation Targeter
The comparison between more independent and inflation targeters reveals a tradeoff. A
central bank that becomes more independent does significantly better on inflation variability
while an inflation targeter wins on the mean and variability of real GDP.
IV INTERPRETING THE RESULTS
The results of these experiments have ready interpretations in terms of the framework laid out
earlier.
The Short-Run Tradeoff
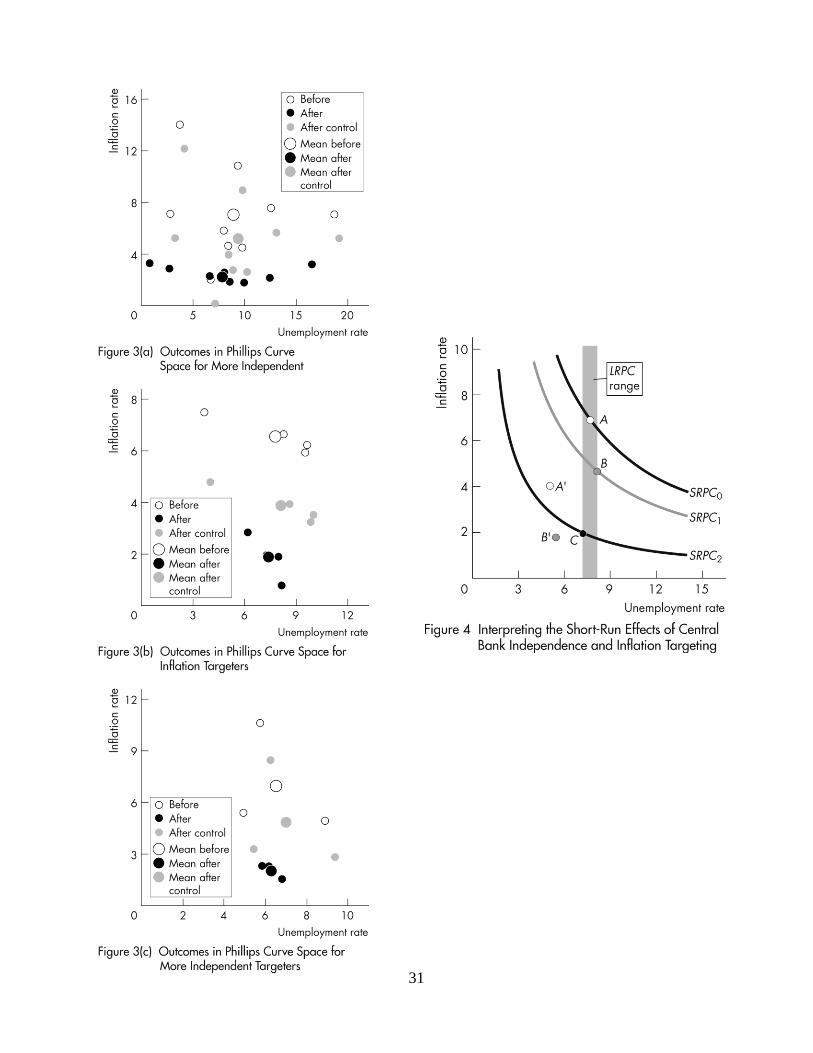
Figure 3 shows the outcomes of the experiments in Phillips curve space—the inflation rate
(y-axis) and unemployment rate (x-axis). The open dots show the data before the change and the
black dots show the data after the change. The grey dots show what the data would have been if
the change had equaled the average change of the control group. The large dots are the sample
means and the small dots are the data for the individual economies.
Figure 3(a) shows that central banks that became more independent massively lowered the
inflation rate, and from widely different initial inflation rates they converged on similar rates.
But the unemployment rates in these economies, presumably the natural unemployment rates
because they are averages over many years, remained highly dispersed across the economies.
Figures 3(b) and 3(c) show a similar outcome for inflation targeters and more independent
inflation targeters, but in these two graphs, it is possible to see the distance between the ‘before’
and ‘after’ data points and see why the effects on inflation are significant and those on
unemployment are small, dispersed, and insignificant.

16
The data in all three parts of Figure 3 are consistent with the natural rate hypotheses. The
natural unemployment rate (averaged over all the economies) is 8.4 percent for ‘more
independent’, 7.6 percent for ‘inflation targeters’, and 6.4 percent for ‘more independent
inflation targeters.’
The short-run Phillips curves shifted downward. The scatter of unemployment rates is wide,
hence the lack of statistical significance in the changes in unemployment but the changes in
inflation are clearly seen in the graphs with the ‘after’ dots distinctly lower than the ‘after
control’ dots and the ‘before’ dots.
Figure 4 illustrates this interpretation. The three sets of experiments deliver sufficiently
similar outcomes for them to be examined on average rather than individually. The natural
unemployment rate is in the range 6.9 percent to 8.1 percent. Before the changes, the short-run
tradeoff was SRPC0. With no change in the institutional arrangements, an outcome the same as
that of the controls would have lowered the inflation rate and the expected inflation rate to shift
the short-run tradeoff to SRPC1. But greater independence and/or inflation targeting shifted the
short-run tradeoff by more to SRPC2.
Basically, the short-run tradeoff is too short-lived to show up on the time-scale of these
experiments. It constrains monetary policy on the time-scale of months and quarters, but not on
the time-scale of multi-year averages.
The two dots in Figure 4 A' and B' show respectively the ‘before’ and ‘after’ points for the
control economies. These economies have a lower natural unemployment rate than the treatment
economies and began with a lower inflation rate but after the treatments of greater independence
or inflation targeting, the treatment economies end up with a slightly lower (though
insignificantly lower) average inflation rate than that of the control economies.
The Taylor Curve Tradeoff
Figure 5 shows the outcomes of the experiments in Taylor curve space—the standard
deviation of inflation on the x-axis and the standard deviation of the real GDP growth rate21
on
the y-axis. The dots use the same conventions as those for the short-run tradeoff in Figure 3.
In all three parts of the figure, the clearest effect is the large and significant fall in the
variability of inflation. The black ‘after’ dots cluster at or below a standard deviation of 1 percent
but have a large spread in the standard deviation of real GDP growth rates.
Figure 5(b), inflation targeters, contrasts with 5(a) and 5(c), more independents, in the
direction of change of output variability. For both cases of greater independence, the real GDP
growth rate becomes more variable, while for the inflation targeters it becomes less variable.
21 Figure A1 shows the equivalent scatter diagrams with the variability of the output gap (the output measure normally used do depict the Taylor curve) replacing the variability of the real GDP growth rate.

17
Both a move to greater independence and the adoption of inflation targeting make monetary
policy more efficient in the sense that they improve the Taylor curve tradeoff. But only the
inflation targeters exploit this efficiency gain to lower the variability of both inflation and real
economic activity. The central banks that become more independent take the entire efficiency
gain in the form of a decrease in the variability of inflation and keep the variability of real GDP
growth unchanged.
Figure 6 illustrates this interpretation of the effects on the Taylor curve. Part (a) illustrates the
effects of greater independence. These central banks begin at point A on TC0. Improving by the
same amount as the controls would take them to point B on TC1. But they performed much better
than this and moved to a point on TC2. Point C on TC2 lies on a ray between the origin and point
A, and is where the more independent central banks would have operated if they maintained the
same ratio for the two standard deviations. Instead, they chose to put a greater emphasis on
targeting inflation and keeping its variability low and ended at point D, where all the gains were
assigned to lowering inflation variability and none to lowering output variability.
The control central banks started at point A' and ended at B', a point almost identical to D. The
near equality of performance of the control and more independent central banks and large
improvement in performance after becoming more independent is consistent with the view that
central bank independence does deliver lower and more predictable inflation. That the controls
and more independent end up in the same place is a consequence of the independence of the
controls, which, as noted earlier include the United States, Germany and its associated countries
pegged to the D-mark, and Switzerland. Although the U.S. Federal Reserve is less independent
than was the Bundesbank or is the Swiss National Bank, this group occupies a space toward the
more independent end of the range of central bank types.
The effects of inflation targeting are larger than those of greater independence and Figure 6(b)
illustrates why. These central banks begin at point A on TC0. Improving by the same amount as
the controls would take them to point B on TC1. But they performed much better than this and
moved to a point on TC2. Point C on TC2 lies on a ray between the origin and point A, and is
where the inflation targeters would have operated if they maintained the same ratio for the two
standard deviations. That is almost where they ended up. They chose to put slightly greater
emphasis on targeting inflation and keeping its variability low and moved to point D. Unlike the
more independent central banks that assigned all their efficiency gains to inflation and none to
lowering output variability, the inflation targets almost maintained their earlier balance between
nominal and real volatility.
The contrast between the inflation targeters and their control group is also instructive. The
inflation targeting control central banks started at point A', a point close to where the targeters
started out, and ended at B' with greater variability of both inflation and real activity.

18
Flexible Inflation Targeting and Real GDP Growth
The increase in the mean real GDP growth rate of flexible inflation targeters is a remarkable
outcome. Is it truly an effect of good monetary policy, or does the credit for it lay elsewhere?
The magnitude of the effect suggests that other forces must have contributed to the increase in
real GDP growth. The standard view, based on Barro (1996), is that a 1 percentage point fall in
the inflation rate increases the real GDP growth rate by 0.04 percentage points. In Table 4,
inflation targeters lower the annual inflation rate by 4.70 percentage points and raise the annual
growth rate of real GDP by 0.88 percentage points. If no other changes influenced the real GDP
growth rate, these numbers imply that a 1 percentage point fall in the inflation rate increases the
real GDP growth rate by 0.19 percentage points, an effect almost 5 times as large as Barro’s
estimate.
A further reason to doubt the magnitude of the increase in real GDP growth comes from the
distribution of the increase across the four flexible inflation targeting economies. The individual
country effects of a 1 percentage point fall in the inflation rate on the real GDP growth rate
implied by the data are: Australia +0.08, Canada +0.12, Sweden +0.27, and United Kingdom
+0.23. The changes for Sweden and the United Kingdom are the source of the large average
effect. Sweden was classified as an inflation targeter until 2000, when its classification changed
to more independent inflation targeter. The United Kingdom has the same reclassification in
2000. If we continue to classify these countries as inflation targeters through to 2011, the
estimated effects of a 1 percentage point fall in the inflation rate on the real GDP growth rate are
+0.13 for Sweden and −0.02 for the United Kingdom. The average effect of a 1 percent fall in
the inflation rate becomes an increase in the annual growth rate of real GDP of 0.08 percentage
points. The change remains significant. It also looks more reasonable, being only twice the size
of Barro’s estimate of the effect.
But other factors can be identified that might have increased the real GDP growth rates of
Australia, Canada, Sweden, and the United Kingdom. The North American Free Trade
Agreement became operational in 1994 and increased Canada’s growth rate. The growth of
China and its increased demand for minerals and energy products from Australia boosted its
growth rate. The 1990s saw large structural change, improved tax and welfare incentives, and
other growth-oriented changes in Sweden. The United Kingdom had a faster growth of
population driven by immigration. All of these real rather than monetary factors had effects that
cloud the separate effect of inflation targeting on real GDP growth.
V ALTERNATIVE INTERPRETATIONS OF THE DATA
Are there alternative interpretations of the data that weaken our confidence in the estimated
effects of central bank independence and inflation targeting on macroeconomic performance?

19
Three possible reasons for caution merit attention. First, inflation rates were already low before
the treatment events in the control economies. Did this fact provide too little room for
improvement in the control economies and bias upward our estimates of the effects on the
treatments? Second, did central banks first get inflation under control and then embark on
inflation targeting so that causation run in the opposite direction to that assumed? And third, is
there a common joint cause of institutional change and improvement in macroeconomic
performance that creates a lack of independence among the treatments?22
Are the Estimated Effects Biased Because Controls Have Lower Inflation?
It is a feature of the data that the average inflation rate of the control economies was lower
than that of the treatment economies, both before and after the treatments. Annual inflation in the
controls decreased from 4.08 percent to 1.85 percent while in the treatment economies, it
decreased from 6.91 percent to 2.07 percent. But the treatments do correlate with a large fall in
the inflation rate. They also correlate with other aspects of macroeconomic performance that are
independent of the mean inflation rates.
For example, the standard deviation of inflation was lower in the control economies before
treatments but after the treatments, it was higher, decreasing from 2.94 percent to 1.22 percent in
the controls and from 4.76 to 1.03 in the treatment economies. Real GDP growth fell but by more
in the control economies than in the treatment groups. The standard deviation of real GDP
increased for the controls and the more independents, but decreased for the inflation targeters.
There is no reason to suppose that these comparative changes are biased by the inflation
differences.
What is the Direction of Causation?
No serious case could be made that the creation of the ECB was caused by lower inflation in
the European nations whose central banking arrangements became more independent when they
adopted the euro. But a case might be made that a fall in inflation caused the adoption of
inflation targets. The argument would be that having lowered its inflation rate and long-term
inflation expectations, a central bank formally adopts inflation targeting knowing that it is now
safe to do so. The formal adoption would be an ex-post ratification of an objective already
achieved and inflation targeting would be incorrectly credited with the lower inflation rate. A
more detailed examination of the data rejects this possible reverse causation.
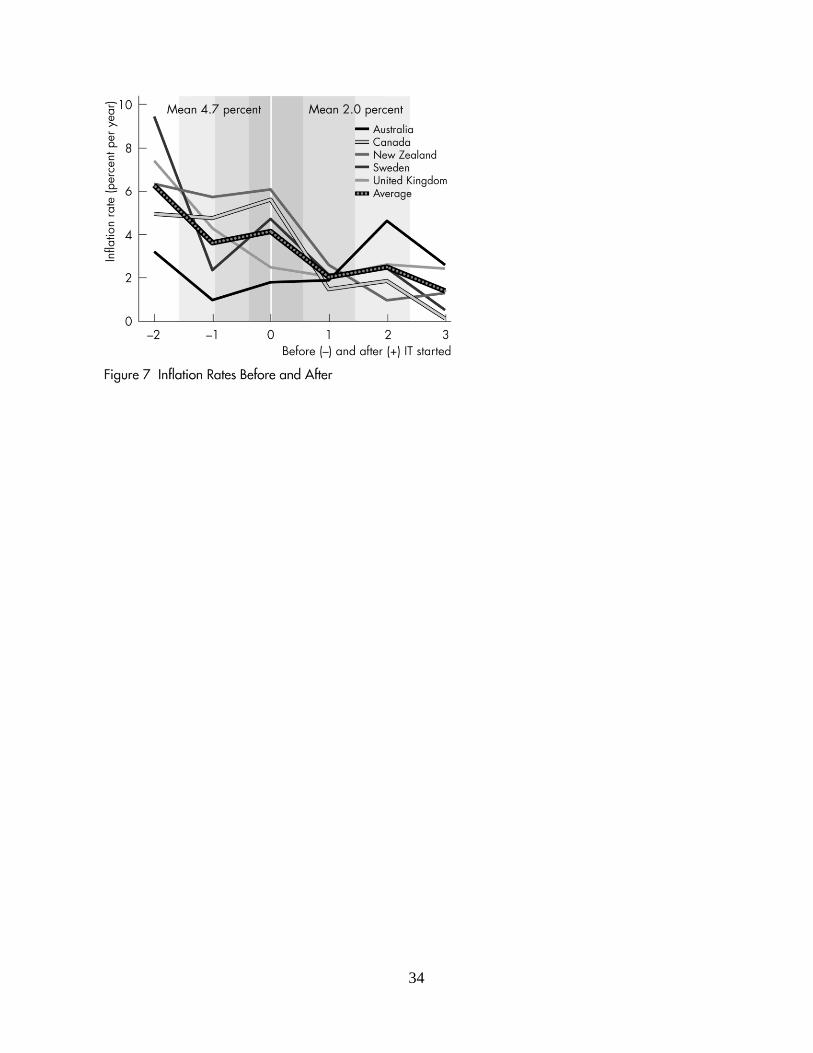
Figure 7 shows the inflation rates in the five inflation targeters with each country aligned on
the same x-axis date of adoption of targeting. It is clear that inflation rates had not fallen before
targeting was formally adopted. The mean inflation rate in the three years to when targeting
22 Peter Tulip and his colleagues in the research department of the Reserve Bank of Australia pressed me on the last two of these reasons for caution.
20
began is 4.7 percent and in the three years after targeting it is 2.0 percent. There is an interesting
variability across the five countries. Comparing the three years before targeting with the three
years after, the inflation rate fell in Canada (5.1 to 1.2), in New Zealand (6.1 to 1.6), in Sweden
(5.5 to 1.7), and in the United Kingdom (4.7 to 2.4). But in Australia, inflation increased from 2
percent to 3 percent.
As noted earlier, Australia is different from the other four countries in the manner of its
adoption of inflation targeting because of the political environment in which the Reserve Bank
was operating. If we date the start two years earlier (1991), when the Reserve Bank was already
pursuing in inflation-targeting-like policy, we would find that in Australia too, the inflation rate
had not fallen before de facto targeting began. The country’s average inflation rate in 1989 –
1991 was 6.0 percent, and in 1992 – 1994, it was 1.6 percent. During those years, a global
recession lowered the inflation rate in the control countries from 4.1 percent in 1989 – 1991 to
3.4 percent in 1992 – 1994. So with unannounced inflation targeting, the Reserve Bank beat the
controls by 3.7 percentage points (down 4.4 compared to 0.7). In the light of the outcomes of the
other four targeting experiences, it is a reasonable bet that much of Australia’s lower inflation
resulted from the Reserve Bank’s surreptitious inflation targeting.
A further check on the direction of causation is provided by indirect evidence on changes in
long-term inflation expectations. Did a fall in the expected inflation rate precede the adoption of
inflation targeting, and was this fact rather than targeting itself, the source of the lower inflation
rate?
The behavior of long-term interest rates answers this question. Figure 8 shows the
government bond yields in the inflation targeting economies, again with each country aligned on
the same x-axis date of the start of targeting. Nominal interest rates fell by an average of 2.2
percentage-points, which is a fall similar to that of the inflation rate. A fall in nominal interest
rates of this magnitude suggests that medium to long-term inflation expectations also fell. It is
clear that inflation expectations fell after targeting began: not before.
The credibility of reverse causation is further weakened by the timing of the “before” and
“after” date breaks adopted in the calculations, the break being one year after the adoption of
targeting.
The behavior of inflation rates and nominal interest rates immediately before and after the
adoption of inflation targeting, and taking due account of Australia’s exceptional transition to
targeting, suggest that the significant changes in macroeconomic performance found in the data
are not capable of a reverse causation interpretation.
Is There a Common Influence that Invalidates the “Natural Experiment”?
21
Is there a common influence that makes the institutional changes proposed as independent
natural experiments a single event? If there were such an influence, we would have a sample
with one data point and no degrees of freedom.
The leading candidate common influence is ideas about monetary policy, which changed
dramatically during the 1970s. The Keynesian view of the world lost popularity and the idea of a
permanent output (or unemployment) and inflation tradeoff was replaced by the natural rate
hypotheses. Adaptive expectations were replaced by rational expectations. The seminal work of
Kydland and Prescott (1977) demonstrated the general superiority of rules versus discretion. The
Taylor Rule23
viewed both as prescription and description revolutionized central banker’s ideas
about how to conduct monetary policy. There can be little doubt that the fall in inflation rates
during the Great Moderation owes much to this intellectual revolution and that it was a common
influence on all central banks. But does it render the “natural experiments” too interdependent to
be a source of valid inferences?
One basic fact says that we can make inferences about the effects of the treatments: Some
central banks became more independent and some did not; some adopted inflation targeting and
some did not. The fact that central banks display variety in their responses to this common
intellectual milieu provides at least one observation for each type of response.
But we can do better. The decisions that led to central banks becoming more independent
were clearly not driven exclusively by a single joint influence. The European nations that
decided to join the euro did so for a variety of their own self-interested reasons. Some decided to
not join. The decisions in Japan, Korea, Sweden and the United Kingdom to strengthen the
independence of their central banks were the subject of separate and independent political
debates. In the light of this variety of reasons and decision processes, it is entirely reasonable to
treat these 8 events as independent random natural experiments.
Inflation targeting is a little different: It had some origins in the intellectual revolution
described above and there can be no doubt that its adoption was contagious. But the events were
spread over a period of almost four years and they differed in the detailed targets chosen. In the
light of the details of how inflation targeting began and its timing, it is reasonable to assume that
the events constitute independent natural experiments.
Nonetheless it is worth exploring an alternative view of the adoption of inflation targeting.
New Zealand clearly started the process and that action counts as one natural experiment. If we
treat the copiers, Canada, Australia, Sweden, and the United Kingdom, as constituting a second
experiment, we can look for the effects of inflation targeting based on two independent
experiments rather than five.
23 John Taylor (1979)
22
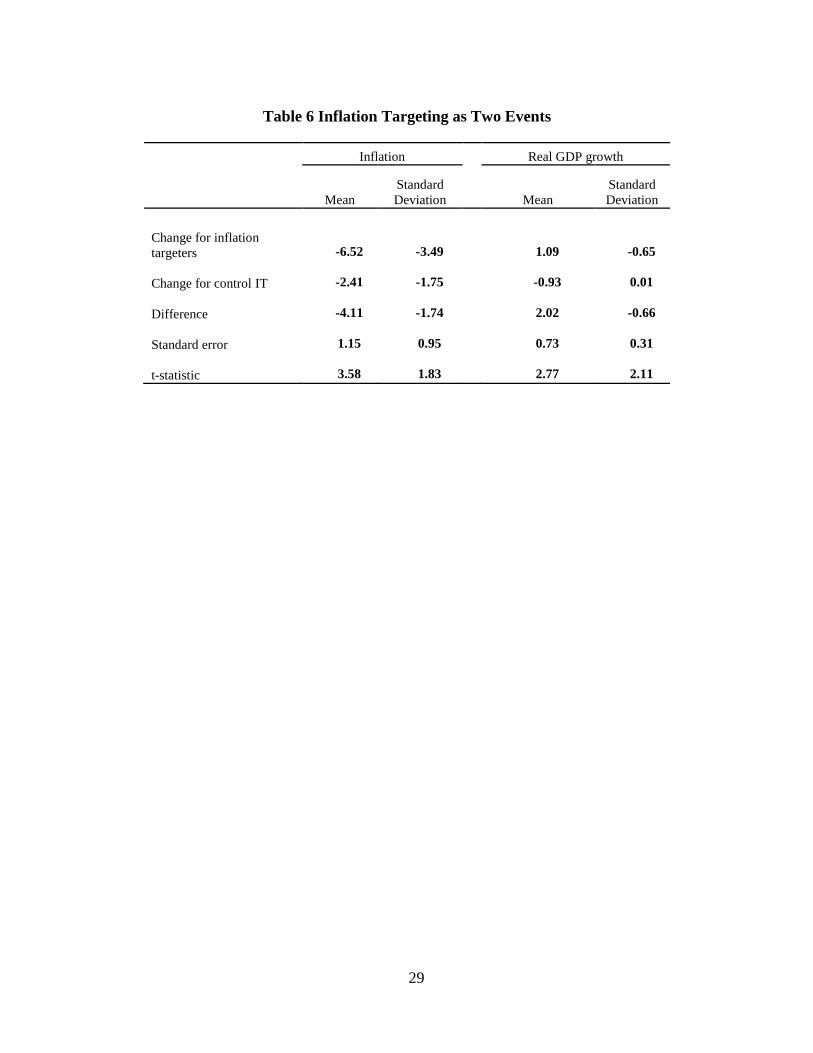
Table 6 summarizes the effects of inflation targeting viewed as only two independent events:
NZ and the copiers. All the previously found significant effects remain. Viewed either as two
independent events or as five events, inflation targeting lowers the inflation rate, raises the real
GDP growth rate, and lowers the variability of both inflation and real GDP growth.
There is a final alternative interpretation of the data to consider: We’ve been lucky and cannot
count on sustained success with the tools that have worked well for most of the past 20 years.
Have We Been Lucky?
During most of the past 20 years, even through the Great Recession, most central banks have
enjoyed the benefits that arise from inflation expectations anchored at around 2 percent per year.
For the central banks in the control group, this inflation rate is only modestly lower than their
earlier rate. For the treatment group, a 2 percent inflation rate is substantially lower than their
previous rate. What determines inflation expectations and why they have been steady and low for
so many years is not well understood. So long as inflation expectations remain anchored,
inflation will be tame and monetary policy will make its best contribution to overall
macroeconomic performance, even if that performance is not ideal. But if inflation expectations
drift away from the current anchor, in either direction, inflation (or deflation) will ensue and the
real economy will perform below its potential.
Two features of current monetary policy arrangements lend support to the worrying idea that
expected inflation will break loose of its anchor, regardless of the institutional arrangements.
First, inflation targeting is beyond the reach of current forecasting capabilities. It is widely
accepted that monetary policy operates with a long and variable time lag, and the consensus is
that it takes about two years for a policy action to influence the inflation rate. But we have no
reasonable chance of knowing what influences will be operating on the inflation rate two years
hence when today’s monetary policy decisions are having their effects. Further, we don’t know
with any precision the effect of an x-basis point change in the interest rate on the inflation rate.
Forecasting uncertainty is recognized by central bankers and two of them, the Bank of
England and the Sveriges Riksbank (Bank of Sweden) graphically illustrate it in their inflation
reports with the help of the ‘fan chart’, a projection of inflation and real GDP over the next two
years with a probability distribution around the mean that widens as the projection becomes more
distant. The Bank of England’s fan chart for March 2013 has an initial actual inflation rate of 2.5
percent tracking to 2 percent by 2016 with a distribution fanning out to a range of 4.5 percent to
– 0.5 percent by mid-2014. The Riksbank has a projection starting from a zero inflation rate at
the beginning of 2013 to 2.5 percent by 2015 but with range of zero to 5 percent.
These forecasts rely on anchored inflation expectations with no chance that they will become
unanchored, even if the inflation rate reaches one of the extremes of the fan. In other words, the

23
fan charts show massive uncertainty about future inflation even assuming a well-anchored
inflation expectation. There can be no reasonable assurance that this assumption will be correct.
Luck is a necessary ingredient.
Second, there is a great deal of uncertainty about future monetary policy. This uncertainty
works two ways on inflation expectations. With a wide, possibly uniform, Bayesian prior, there
is no reason for inflation expectations to change. Uniform uncertainty is an anchor. But it is a
high-risk anchor. If some event occurs that increases the probability of a rise in inflation, that
event would trigger a shift in inflation expectations and bring an immediate and potentially large
departure of inflation from its anchor.
VI CONCLUSIONS
The conclusions that emerge from the experiment of more independence agree with earlier
findings on the effects of central bank independence. Lower inflation and lower inflation
variability with no change in output variability are what earlier cross-country studies have
shown.
The conclusions from the flexible inflation targeting experiment suggest that this institutional
arrangement is even more effective than central bank independence. Flexible inflation targeting,
credibly and transparently pursued, can apparently do a very good job of keeping inflation low,
volatility low, and real growth high. As practiced in Australia, Canada, Sweden, and the United
Kingdom, this approach to monetary policy has been extremely successful. It perhaps can be
refined and improved upon, but not by placing a misguided emphasis on the wrong dual
mandate. Flexible inflation targeting is the best currently known dual mandate policy. It is
today’s “gold standard”.

24
TABLES
Table 1 Events that Changed Central Banking Arrangements
Date Event
December 20,
1989
Reserve Bank of New Zealand becomes more independent and begins inflation
targeting
February 26, 1991 Bank of Canada begins inflation targeting
September 1,
1992
Bank of England begins inflation targeting
January 1, 1993 Bank of Sweden begins inflation targeting
March 31, 1993 Reserve Bank of Australia begins inflation targeting
June 18, 1997 Bank of Japan becomes more independent
December 27,
1997
Bank of Korea becomes more independent
June 1, 1998 Bank of England becomes more independent
January 1, 1999 European Central Bank assumes full powers and issues euro
September 11,
1999
Bank of Sweden becomes more independent
January 1, 2001 Greece joins the Eurozone
25
Table 2 Treatment Groups and Control Group
More Independent Inflation Targeter
More Independent
Inflation Targeter Control
Japan 1997 Canada 1991 New Zealand 1990 Austria
Korea 1998
United
Kingdom
1993–
1998
United
Kingdom 1999 Belgium
Finland 1999 Sweden
1993 –
1999 Sweden 2000 Denmark
France 1999 Australia 1993 Germany
Ireland 1999
Hong Kong
Italy 1999
Luxembourg
Portugal 1999
Netherlands
Spain 1999
Norway
Greece 2001
Singapore
Switzerland
Taiwan
United
States

26
Table 3 Before and After: Absolute Changes24
Inflation Real GDP growth Output gap Unemployment
Mean
Standard
Deviation
Mean
Standard
Deviation
Standard
Deviation Mean
More independent
Before 7.05 5.34 3.35 2.48 2.52 8.94
After 2.18 1.06 1.61 2.74 2.33 7.87
Change -4.87 -4.27 -1.74 0.25 -0.20 -1.06
Standard error 1.25 0.71 1.76 0.48 0.37 1.84
t-statistic 3.90 5.99 0.99 0.52 0.54 0.58
Inflation targeters
Before 6.56 3.62 2.38 2.31 2.01 7.76
After 1.86 0.87 3.26 1.07 1.16 7.39
Change -4.70 -2.75 0.88 -1.24 -0.85 -0.38
Standard error 0.53 0.24 0.31 0.35 0.38 1.47
t-statistic 8.78 11.30 2.84 3.55 2.28 0.26
More independent inflation targeters
Before 6.99 4.56 2.17 2.03 1.78 6.52
After 2.05 1.12 2.29 2.50 2.17 6.30
Change -4.95 -3.44 0.12 0.47 0.39 -0.22
Standard error 1.83 0.42 0.06 0.33 0.34 1.23
t-statistic 2.70 8.22 1.91 1.43 1.13 -0.18
Controls (average all)
Before 4.08 2.94 3.76 2.26 2.73 5.04
After 1.85 1.22 2.69 2.39 1.85 5.42
Change -2.23 -1.72 -1.07 0.13 -0.88 0.39
Standard error 0.44 0.38 0.75 0.39 0.66 1.13
t-statistic 5.09 4.48 1.43 0.35 1.33 0.34
24 Bold faced entries in the table indicate significant at the 95 percent level on a one-tail test

27
Table 4 Treatments Relative to Controls25
Inflation Real GDP growth Output gap Unemployment
Mean
Standard
Deviation
Mean
Standard
Deviation
Standard
Deviation Mean
More independent
Change for more
independent -4.87 -4.27
-1.74 0.25 -0.20 -1.06
Change for control MI -1.87 -1.67 -1.87 0.37 -0.76 1.14
Difference -3.00 -2.60 0.13 -0.12 0.57 -2.21
Standard error 1.05 0.72 0.13 0.45 0.64 1.54
t-statistic 2.86 3.60 0.99 0.26 0.89 1.43
Inflation targeters
Change for inflation
targeters -4.70 -2.75
0.88 -1.24 -0.85 -0.38
Change for control IT -2.70 -1.81 -0.65 -0.21 -1.18 2.19
Difference -1.99 -0.94 1.53 -1.03 0.32 -2.57
Standard error 0.77 0.53 0.54 0.35 0.73 5.95
t-statistic 2.60 1.78 2.84 2.97 0.44 0.43
More independent
inflation targeters
Change for more
independent inflation
targeters -4.95 -3.44
0.12 0.47 0.39 -0.22
Change for control MI IT -2.11 -1.69 -2.11 0.23 -0.70 1.64
Difference -2.83 -1.74 2.23 0.23 1.09 -1.86
Standard error 1.78 0.52 1.17 0.43 0.46 3.88
t-statistic 1.59 3.32 1.91 0.55 2.37 0.48
25 Bold faced entries in Tables 4, 5, and 6 indicate that the means are significant different at the 95 percent level on a one-tail test. Italic bold indicates significant but adverse effect.

28
Table 5 Alternative Treatments Compared
Inflation Real GDP growth Output gap Unemployment
Mean
Standard
Deviation
Mean
Standard
Deviation
Standard
Deviation Mean
Does MIIT improve on
MI?
Change for more
independent inflation
targeter -4.95 -3.44 0.12 0.47 0.39 -0.22
Change for more
independent (control) -4.87 -4.27 -1.74 0.25 -0.20 -1.06
Difference -0.08 0.84 1.86 0.21 0.58 0.84
Standard error 1.97 0.79 0.74 0.58 0.42 1.74
t-statistic 0.04 1.06 2.52 0.37 1.37 0.48
Does MIIT improve on
IT?
Change for more
independent inflation
targeter -4.95 -3.44 0.12 0.47 0.39 -0.22
Change for inflation
targeters (control) -4.70 -2.75 0.88 -1.24 -0.85 -0.38
Difference -0.25 -0.69 -0.76 1.71 1.24 0.15
Standard error 1.86 0.51 0.75 0.51 0.29 2.18
t-statistic 0.13 1.36 1.02 3.32 4.24 0.07
Does MI improve on IT?
Change for more
independent -4.87 -4.27 -1.74 0.25 -0.20 -1.06
Change for inflation
targeters (control) -4.70 -2.75 0.88 -1.24 -0.85 -0.38
Difference -0.17 -1.53 -2.62 1.49 0.66 -0.69
Standard error 1.16 0.72 0.46 0.52 0.48 -1.89
t-statistic 0.15 2.12 5.70 2.85 1.36 0.36
29
Table 6 Inflation Targeting as Two Events
Inflation Real GDP growth
Mean
Standard
Deviation
Mean
Standard
Deviation
Change for inflation
targeters -6.52 -3.49 1.09 -0.65
Change for control IT -2.41 -1.75 -0.93 0.01
Difference -4.11 -1.74 2.02 -0.66
Standard error 1.15 0.95 0.73 0.31
t-statistic 3.58 1.83 2.77 2.11
30
FIGURES
31

32

33
34

35

36
APPENDIX

37
REFERENCES
Alesina, A., and L. H. Summers. (1993) “Central Bank Independence and Macroeconomic
Performance: Some Comparative Evidence.” Journal of Money, Credit and Banking, 25, 151–62.
Bade, R. and M. Parkin (1978) “Central Bank Laws and Monetary Policies: A Preliminary
Investigation,” in M. Porter (ed.), The Australian Monetary System in the 1970s, Monash
University.
Bank of England (1998) Bank of England Act 1998
http://www.bankofengland.co.uk/about/Documents/legislation/1998act.pdf
Bank of Japan, 1996, www.japaneselawtranslation.go.jp/law/detail/?id=92&vm=02&re=01 and
http://www.boj.or.jp/en/announcements/release_1996/un9611a.htm/
Bank of Japan Act 1997, http://www.cas.go.jp/jp/seisaku/hourei/data/boja.pdf
Barro, Robert J. 1998. “Determinants of Economic Growth: A Cross-Country Empirical Study,”
MIT Press Books, The MIT Press, edition 1, volume 1, number 0262522543, April.
Bernanke, Ben S., Thomas Laubach, Frederic S. Mishkin, and Adam S. Posen (1999) Inflation
Targeting: Lessons from the International Experience, Princeton University Press.
Cargill, T. F. (2013) “A Critical Assessment of Measures of Central Bank Independence”
Economic Inquiry, Vol 51, Issue 1, January, 260 – 272; first published online 16 January 2012.
Cargill, T. F. “Central Bank Independence in Korea.” Journal of the Korean Economy, 2, 2001,
1–33 and available at http://www.akes.or.kr/akes/downfile/01_Thomas_Cargill_rev_.pdf.
Carlstrom, C. T., and T. S. Fuerst (2009) “Central Bank Independence and Inflation: A Note.”
Economic Inquiry, 47, 182–86.
Fraser, B.W. (1993), “Some Aspects of Monetary Policy”, Reserve Bank of Australia Bulletin,
April, pp. 1–7.
Fry, M., D. Julius, L. Mahadeva, S. Roger, and G. Sterne. (2000) “Key Issues in the Choice of
Monetary Policy Framework,” in Monetary Policy Frameworks in a Global Context, edited by L.
Mahadeva and G. Sterne. London: Routledge, and available with Excel spread sheet at
http://www.bankofengland.co.uk/education/Pages/ccbs/publications/mpfagc.aspx.
Klomp, J. G., and J. de Haan. (2010) “Inflation and Central Bank Independence: A Meta
Regression Analysis.” Journal of Economic Surveys, 24, 593–621.
Kydland, Finn E., and Edward C. Prescott. (1977) “Rules Rather than Discretion: The
Inconsistency of Optimal Plans” Journal of Political Economy, 85 3 (June), 473–492.
Macfarlane, Ian. (1998), “Australian Monetary Policy in the Last Quarter of the Twentieth
Century”, Reserve Bank of Australia Bulletin, October, pp. 6–19.
Parkin, Michael. (2012) “Central Bank Laws and Monetary Policy Outcomes: A Three Decade
Perspective”, Presented in the session “Central Bank Independence: Reality or Myth?” organized
by Thomas Cargill (University of Nevada-Reno) at the meetings of the American Economic
Association, San Diego, January 4, 2013, University of Western Ontario Economic Policy
Research Institute Working Paper Series, 2013-1.

38
Reserve Bank of New Zealand, (1998) The Reserve Bank of New Zealand Act 1989: Our
Accountability to New Zealanders, March, http://www.rbnz.govt.nz/about/acct.pdf
Reserve Bank of New Zealand, (1989)
http://www.legislation.govt.nz/act/public/1989/0157/latest/DLM199892.html and
http://www.rbnz.govt.nz/about/acct.pdf
Stevens, Glenn R., (1999) “Six Years of Inflation Targeting”, Reserve Bank of Australia Bulletin,
May, pp. 46 – 61.
Sveriges Riksbank (2012) The Sveriges Riksbank Act, http://www.riksbank.se/en/The-
Riksbank/Legislation/The-Sveriges-Riksbank-Act/ and http://www.riksbank.se/en/The-
Riksbank/Historia1/Sveriges-Riksbank-10-years-as-an-independent-central-bank/
Taylor, John B, (1979) “Estimation and Control of a Macroeconomic Model with Rational
Expectations,” Econometrica, 47 (5), September, 1267-1286