Embed Size (px)
Citation preview

20
13INFLATION REPORT / IV


INFLATION REPORT / IV


3
Czech National Bank / Inflation Report IV/2013
In 1998, the Czech National Bank switched to inflation targeting. In the inflation targeting regime, the central bank’s communication with the public plays a significant role. One of the core elements of this communication is the publishing of quarterly Inflation Reports. Section II of the Inflation Report contains a description of the Czech National Bank’s new quarterly macroeconomic forecast, and section III presents its assessment of past economic and monetary developments.
The inflation forecast and the assumptions underlying it are published with the aim of making monetary policy as transparent, comprehensible, predictable and therefore credible as possible. The Czech National Bank is convinced that credible monetary policy effectively influences inflation expectations and minimises the costs of maintaining price stability. Maintaining price stability is the Czech National Bank’s primary objective.
The forecast for the Czech economy is drawn up by the CNB’s Monetary and Statistics Department. The forecast for inflation at the “monetary policy horizon” (about 12–18 months ahead) is of greatest relevance to the decision-making on the current interest rate settings.
The forecast is the key, but not the only, input to the Bank Board’s decision-making. At its meetings during the quarter, the Bank Board discusses the current forecast and the balance of risks and uncertainties surrounding it. The arrival of new information since the forecast was drawn up and the possibility of asymmetric assessment of the risks of the forecast and divergent views of some board members on the development of the external environment or the linkages between the various indicators within the Czech economy mean that the Bank Board’s final decision need not correspond to the message of the forecast.
This Inflation Report was approved by the CNB Bank Board on 14 November 2013 and contains the information available as of 25 October 2013. Unless stated otherwise, the sources of the data contained in this Inflation Report are the CZSO or the CNB. All the Inflation Reports published to date are available on the CNB website. Underlying data for the tables and charts presented in the text of this Inflation Report, minutes of Bank Board meetings, and time series of selected economic and monetary indicators (available in the ARAD database) are published at the same internet address.
FOREWORD


5CONTENTS
FOREWORD 3CONTENTS 5I. SUMMARY 6 BOX 1 Using the exchange rate as an instrument to ease the monetary conditions 8II. THEFORECAST,ITSCHANGESANDRISKS 11 II.1 Externalassumptionsoftheforecast 11 II.2 Theforecast 13 II.3 Comparisonwiththepreviousforecast 23 BOX 2 New steady-state settings in the g3 model 24 II.4 Alternativescenario–useoftheexchangerateasamonetarypolicyinstrument 27 II.5 Forecastsbyotherentities 29III.CURRENTECONOMICDEVELOPMENTS 31 III.1 Inflation 31 III.1.1 Fulfilment of the inflation target 31 III.1.2 Current inflation 33 III.2 Importpricesandproducerprices 36 III.2.1 Import prices 36 III.2.2 Producer prices 37 III.3 Demandandoutput 40 III.3.1 Domestic demand 40 BOX 3 Comparison of corporate investment and employment from the perspective
of ownership and reinvestment 42 III.3.2 Net external demand 44 III.3.3 Output 45 III.3.4 Potential output and estimate of the cyclical position of the economy 46 III.4 Thelabourmarket 48 III.4.1 Employment and unemployment 48 III.4.2 Wages and productivity 50 III.5 Financialandmonetarydevelopments 52 III.5.1 Money 52 III.5.2 Credit 53 III.5.3 Interest rates 55 III.5.4 The exchange rate 58 III.5.5 Economic results of non-financial corporations 59 III.5.6 Financial position of corporations and households 60 III.5.7 The property market 61 III.6 Balanceofpayments 62 III.6.1 The current account 62 III.6.2 The capital account 63 III.6.3 The financial account 63 III.7 Theexternalenvironment 65 III.7.1 The euro area 65 III.7.2 The United States 67 III.7.3 The exchange rate of the euro against the dollar and other major currencies 68 III.7.4 Prices of oil and other commodities 69 BOX 4 The impact of the growth in unconventional gas extraction on global prices of energy commodities 70CHARTSINTHETEXT 72TABLESINTHETEXT 75ABBREVIATIONS 76BOXESANDANNEXESCONTAINEDININFLATIONREPORTS 77GLOSSARY 78KEYMACROECONOMICINDICATORS 82
Czech National Bank / Inflation Report IV/2013

Czech National Bank / Inflation Report IV/2013
6
I.SUMMARY
The year-on-year decline of the Czech economy slowed in 2013 Q2. In 2013 Q3, headline inflation fell to the lower boundary of the tolerance band around the target and monetary-policy relevant inflation was well below this boundary. In addition to tax changes, food prices and administered prices remain sources of inflation, although their contribution is decreasing. The domestic economy remains strongly anti-inflationary, whereas the previous depreciation of the koruna is having the opposite effect. Real economic activity will drop by 0.9% this year, but has been slowly recovering since 2013 Q2. GDP will grow by 1.5% next year thanks to rising external demand and the unwinding of the dampening effect of domestic fiscal consolidation. The growth will pick up further in 2015. Both headline and monetary-policy relevant inflation will drop to zero or be slightly negative at the start of 2014 and will then gradually return towards the target over the monetary policy horizon. The exchange rate of the koruna against the euro will stay at its current level initially and appreciate very slowly at the longer end of the forecast. Consistent with the forecast is a significant decline in market interest rates well below zero, followed by a rise in rates above the current levels only at the end of 2014. Given the zero lower bound on interest rates, this points to a significant need to ease monetary policy using other instruments. An alternative scenario quantifying the use of the exchange rate of the koruna confirms that a sustained weakening of the exchange rate is an effective instrument for accelerating the return of inflation towards the target.
TheCzecheconomycontracted by 1.3% year on year in2013Q2, owing mainly to a fall in gross capital formation. The contributions of the other components were positive, that of net exports being the largest. In quarter-on-quarter terms, however, GDP increased after six quarters of decline. The forecast assumes a further moderation of the year-on-year decline in GDP in 2013 Q3, with economic activity increasing slightly again in quarter-on-quarter terms.
In 2013 Q3, headline inflation decreased to the lower boundary of the tolerance band around the CNB’s target (see Chart I.1) and monetary-policy relevant inflation was well below this boundary. In addition to tax changes, food prices and administered prices remain sources of inflation, although their contribution is decreasing. Negative adjusted inflation excluding fuels continues to reflect the strongly anti-inflationary effect of the domestic economy, whereas the weaker exchange rate of the koruna is acting in the opposite direction via import prices.
Economic activity in the effective euro area rose slightly in 2013 H1. According to the assumptions of the forecast, growth is expected to reach 0.5% in effective terms in 2013 and pick up in the following years. Inflation remains subdued due to falling commodity prices amid only a gradual recovery of economic activity in the euro area, but will steadily increase. The low outlook for 3M EURIBOR rates
Inflation target
July – September 2013
1263/12 912/11 3/136 9 12
-2
-1
0
1
2
3
4
5
6
FULFILMENTOFTHEINFLATIONTARGETHeadlineinflationwaswellbelowtheCNB’stargetin2013Q3(year on year in %)
Chart I.1
-2
-1
0
1
2
3
4
5
6
III IV I/15II IIIVI/12 I/13IIIIV/11 II IIIV I/14III
Inflation target
90% 70% 50% 30% confidence interval
Monetary policy horizon
HEADLINEINFLATIONFORECASTHeadlineinflationwilldeclinetozeroatthestartof2014andthenrisetowardstheCNB’s2%target(year on year in %)
Chart I.2
Inflation target
90% 70% 50%
-2
-1
0
1
2
3
4
5
6
III IV I/15II IIIVI/12 I/13IIIIV/11 II IIIV I/14III
30% confidence interval
Monetary policy horizon
MONETARY-POLICYRELEVANTINFLATIONFORECASTMonetary-policyrelevantinflationwilltemporarilyturnslightlynegativeatthestartofnextyearandthenreturntowardstheCNB’starget(year on year in %)
Chart I.3
I. SUMMARY

Czech National Bank / Inflation Report IV/2013
7
takes into account the ECB’s still easy current and expected monetary policy. The euro-dollar exchange rate has recently appreciated, but its outlook is for depreciation. Oil prices are expected to fall gradually over the forecast horizon.
Accordingtotheforecast,headlineinflation will decline to zero at the start of 2014 after the effect of the VAT change drops out and amid falling administered prices. It will then rise again towards the target (see Chart I.2). Monetary-policyrelevantinflation, i.e. inflation adjusted for the first-round effects of changes to indirect taxes, will temporarily turn slightly negative at the start of next year. It will stay below the lower boundary of the tolerance band around the target until 2014 Q3. Together with headline inflation it will then approach the CNB’s 2% target over the monetary policy horizon (see Chart I.3). The overall upward pressures on consumer prices will increase in the near future from the current low level as the anti-inflationary effect of the domestic economy subsides. In the longer term, as economic activity recovers, the domestic economy will start to push prices slightly upwards. The inflationary effect of import prices will weaken during 2014 owing to a stable koruna exchange rate and low foreign producer price inflation, but will later increase again due to a pick-up in producer price inflation abroad. Adjusted inflation excluding fuels will turn slightly positive in mid-2014 and then rise steadily on the back of recovering domestic economic activity. Food price inflation will slow significantly as a result of a better harvest than last year. Fuel prices and administered prices will be falling next year.
Consistent with the forecast is a significant decline in market interestrates well below zero, followed by a rise in rates above the current levels only at the end of 2014 (see Chart I.4). Given the zero lower bound on interest rates, this points to a significant need to ease monetary policy using other instruments. In particular, the very low outlook for administered prices and slow growth in wages and other costs are fostering a decline in interest rates. The koruna depreciated slightly against the euro in 2013 Q3 and – given the hypothetically negative domestic interest rates – will be broadly flat in the near future. At the longer end of the forecast it will appreciate only very slowly (see Chart I.5) due to a low outlook for foreign interest rates and rising net exports thanks to a recovery in external demand.
Generally weak domestic demand due to fiscal consolidation and an only gradual recovery in external demand will lead to a 0.9% decline in theCzecheconomy this year (see Chart I.6). Economic activity will be strongly hampered by a fall in gross capital formation. By contrast, the contributions of net exports and household and government consumption will be positive. However, a gradual recovery has been observed since 2013 Q2, thanks to external demand developments. Next year, the previous years’ dampening factors will largely subside and the economy will grow by 1.5%. In 2015, GDP growth will pick up to 3%. On the labourmarket, the currently subdued economic activity will cause the unemployment rate to increase. At the same
90% 70% 50%
-2
-1
0
1
2
3
4
30% confidence interval
III IV I/15II IIIVI/12 I/13IIIIV/11 II IIIV I/14III
INTERESTRATEFORECASTConsistentwiththeforecastisasignificantdeclineinmarketinterestrateswellbelowzero,followedbyariseinratesabovethecurrentlevelsonlyattheendof2014(3M PRIBOR in %)
Chart I.4
90% 70% 50% 30% confidence interval
21
23
25
27
29
III IV I/15II IIIVI/12 I/13IIIIV/11 II IIIV I/14III
EXCHANGERATEFORECASTThekorunawillappreciateonlyveryslowlyagainsttheeuroatthelongerendoftheforecast(CZK/EUR)
Chart I.5
90% 70% 50% 30% confidence interval
-4
-2
0
2
4
6
8
10
III IV I/15II IIIVI/12 I/13IIIIV/11 II IIIV I/14III
GDPGROWTHFORECASTGDPwilldeclinethisyearoverall,butwillgraduallystarttorecover(annual percentage changes; seasonally adjusted)
Chart I.6
I. SUMMARY

8
time, wage growth in the business sector will remain low in the near future and will pick up only in 2014 as economic activity recovers more significantly. Wages in the non-business sector will continue to rise at a modest rate.
The current economic forecast points to a significant need to ease monetary policy further as market interest rates fall well below zero in the baseline scenario (see Chart I.7). Given the 0.4 percentage point premium in the interbank market, this implies a hypothetically negative repo rate level from 2013 Q4 until almost the end of 2014. Because of the existence of the zero lower bound on interest rates, an alternativescenario was drawn up that quantifies the consequences of usingthekorunaexchangerateasaninstrumentforeasingmonetarypolicy. The CNB has been communicating this possibility since autumn 2012.
In the alternative scenario, the exchange rate of the koruna shifts close to CZK 27/EUR and is thus much weaker than in the baseline scenario. The weaker exchange rate level is reflected in an increase in import prices, which pushes up both headline and monetary-policy relevant inflation (see Chart I.8). This is followed by faster resurgence of inflationary pressures from the domestic economy. Inflation thus returns to the CNB’s target in 2014 H2, then moves into the upper half of the tolerance band around the target and approaches the target slowly from above during 2015. The temporary overshooting of the inflation target in this scenario offsets the significant undershooting in 2013 and 2014 H1 and facilitates an exit from the zero lower bound on interest rates through a decline in real interest rates. Turning to GDP, there are several contrary factors fostering a recovery in economic activity overall in 2014 and, by contrast, reducing economic growth in 2015.
At its monetary policy meeting on 7 November 2013, the Bank Board decided unanimously to leave the two-week repo rate unchanged at 0.05 %. Interest rates will be kept at their current levels (i.e. at “technical zero”) over a longer horizon until inflation pressures increase significantly. The Bank Board also decided to start usingthe exchange rate as an additional instrument for easingthe monetary conditions. The CNB will intervene in the foreign exchange market to weaken the koruna so as to maintain the exchange rate of the koruna against the euro close to CZK 27/EUR. Owing to this decision, the alternative scenario of using the exchange rate has become the most likely description of expected future economic developments.
90% 70% 50%
-2
-1
0
1
2
3
4
30% confidence interval
III IV I/15II IIIVI/12 I/13IIIIV/11 II IIIV I/14III
Baseline Alternative scenario
3MPRIBOR–COMPARISONOFTHEBASELINEANDALTERNATIVESCENARIOThealternativescenariorespectsthezerolowerboundoninterestrates,withmonetarypolicyeasingdeliveredthroughaweakeningoftheexchangerate(3M PRIBOR in %)
Chart I.7
90% 70% 50% 30% confidence interval
-2
-1
0
1
2
3
4
5
6
III IV I/15II IIIVI/12 I/13IIIIV/11 II IIIV I/14III
Inflation target
Baseline Alternative scenario
Monetary policy horizon
HEADLINEINFLATION–COMPARISONOFTHEBASELINEANDALTERNATIVESCENARIOTheuseoftheexchangerateasamonetarypolicyinstrumentacceleratesthereturnofinflationtowardstheCNB’starget(year on year in %)
Chart I.8
I. SUMMARY
Czech National Bank / Inflation Report IV/2013

Czech National Bank / Inflation Report IV/2013
9
BOX1Usingtheexchangerateasaninstrumenttoeasethemonetaryconditions
The global financial and economic crisis forced many central banks to start using extraordinary (sometimes referred to as non-standard or unconventional) monetary policy instruments. The Federal Reserve, the Bank of England and the European Central Bank launched asset purchases and massive provision of liquidity into the economy. The Swiss central bank de facto fixed a minimum exchange rate of the franc against the euro by intervening in the foreign exchange market. Up to now, the CNB has used its standard monetary policy instruments to dampen the impacts of the financial crisis and subsequently also the debt crisis on the Czech economy. It gradually lowered its key interest rates to technical zero in autumn 2012. However, the latest macroeconomic developments necessitate a further easing of monetary policy by the CNB. For this reason, the CNB has started to use the exchange rate as an additional monetary policy instrument in order to keep inflation close to the CNB’s target and expedite a return to a situation where the CNB will again be able to use its standard tool, i.e. interest rates.
The exchange rate was selected from the relatively wide range of possible instruments back in autumn 2012, because, in a small open economy, weakening the exchange rate of the koruna is an effective tool for raising import prices and thus also the domestic price level, and for stabilising inflation expectations close to the CNB’s target. To a lesser extent, a weakening of the exchange rate also boosts domestic economic activity. The rise in import prices can be expected to reduce households’ purchasing power, but their demand may be redirected towards domestic goods and services to a greater extent and additionally supported by lower real interest rates as a result of higher inflation expectations. At the same time, the weaker exchange rate will support Czech exports and the profitability of corporations and their willingness to invest. The recovery in production will then contribute to a rise in employment and wages, which will increase the purchasing power of households. The above impacts of exchange rate changes on the Czech economy are quite well mapped from the CNB’s point of view. In addition, according to analyses conducted using the CNB’s forecasting system, the impacts of exchange rate changes can be expected to be stronger than usual if the koruna exchange rate is used as a systematic monetary policy instrument given the zero lower bound on interest rates.
The alternative scenario contained in this Inflation Report took into account the fact that the scope for lowering monetary policy rates had been exhausted on reaching technical zero
I. SUMMARY

Czech National Bank / Inflation Report IV/2013
10
(0.05%). Consistent with this limitation, it is impossible to lower 3M PRIBOR market interest rates below technical zero plus the risk premium between PRIBOR rates and the 2W repo rate. In the alternative scenario, the exchange rate of the koruna takes over the stabilising role of monetary policy. The future evolution of the exchange rate reflects the CNB’s presence in the foreign exchange market, in line with the Bank Board’s decision of November 2013 to start using the exchange rate as an additional instrument for easing the monetary conditions. In the alternative scenario, the exchange rate weakening to CZK 27/EUR accelerates the return of inflation towards the CNB’s 2% inflation target and allows for an earlier exit from the zero lower bound on monetary policy interest rates. As before, the Bank Board may assess this forecast scenario from the perspective of the risks it perceives and take this assessment into account in its decision on the necessary exchange rate weakening. The level close to which the CNB will maintain the exchange rate will be publicly announced on the day the decision is made.
I. SUMMARY

Czech National Bank / Inflation Report IV/2013
11
II.THEFORECAST,ITSCHANGESANDRISKS
II.1EXTERNALASSUMPTIONSOFTHEFORECAST
The rate of economic growth in the effective euro area will be only modest this year, but a more pronounced recovery in economic activity is expected in the next two years. The substantial decline in commodity prices and the gradually emerging economic recovery are reflected in consumer and, in particular, producer prices, whose growth should start slowly rising from its currently subdued levels. The low outlook for 3M EURIBOR market rates takes into account the ECB’s still easy current and expected monetary policy. In the longer run, the euro is expected to depreciate gradually against the dollar from its current strengthened level. The outlook for the Brent crude oil price continues to expect a gradual decline.
The outlook for the effectiveindicatorofeuroareaGDP foresees only modest economic growth of 0.5% this year (see Chart II.1.1).1 The forecast takes into account the faster GDP growth in euro area countries in 2013 Q2, which, together with some leading indicators, suggests an emerging recovery in economic activity. Economic growth in the effective euro area should pick up to 1.5% next year and to 1.9% in 2015. Compared to the previous forecast, this means a modest shift towards higher growth this year, but the outlook for the next two years has changed only slightly. The still unresolved debt problems of a number of euro area countries remain a risk.
The observed substantial decline in commodity prices and the still subdued economic activity are reflected in the effectiveindicatorofproducerprices in the euro area (see Chart II.1.2). This indicator should be broadly flat on average this year. At the end of the year, however, these prices are expected to fall year on year. Producer prices are expected to rise by 1.5% on average next year as the economy gradually recovers and then accelerate to 2.2% in 2015. This means much lower levels over almost the entire horizon than in the previous forecast.
The outlook for growth in the effective indicator of consumerprices in the euro area in the period ahead reflects the subdued economic activity and consumer demand, a decline in energy prices and appreciation of the euro this year (see Chart II.1.3). Consumer price inflation is expected to slow significantly on average for 2013 as a whole to 1.7%, and is currently even lower. Next year, it should increase slightly on average (to 1.8%) and in 2015 it should be very close to the 2% level. Compared to the previous forecast, the outlook is broadly unchanged from the whole-year perspective.
1 The outlooks for euro area GDP, PPI and CPI and the dollar-euro exchange rate are based on the October Consensus Forecasts (CF). The outlooks for the 3M EURIBOR and Brent crude oil are derived from prices of market contracts as of 14 October 2013. The outlook is indicated by the grey areas in the charts. This convention is used throughout this Report. The differences between the previous and new forecast in the past are due, in addition to revisions, to an update of the weights of individual countries in Czech exports.
II. THE FORECAST, ITS CHANGES AND RISKS
-0.3
-0.0
0.3
0.6
0.9
-1
0
1
2
3
I/10 I/15I/09 I/11 I/12 I/13 I/14
DifferencesPrevious forecast New forecast
EFFECTIVECPIINTHEEUROAREAEffectiveinflationwillreboundfromitscurrentlowlevelandreturntowardsthe2%levelovertheforecasthorizon(year on year in %; differences in percentage points – right-hand scale; seasonally adjusted)
Chart II.1.3
-2.1
-1.4
-0.7
0.0
0.7
1.4
2.1
I/11I/10 I/15I/09 I/12 I/13 I/14
-9
-6
-3
0
3
6
9
-9
-6
-3
0
3
6
9
DifferencesPrevious forecast New forecast
EFFECTIVEPPIINTHEEUROAREAThecurrentlyfallingproducerpricesreflectthedeclineincommoditypricesandsubduedeconomicactivity,butwillgraduallystartrisingagain(year on year in %; differences in percentage points – right-hand scale; seasonally adjusted)
Chart II.1.2
-0.9
-0.6
-0.3
0.0
0.3
0.6
-6
-4
-2
0
2
4
I/11I/10 I/15I/09 I/12 I/13 I/14
DifferencesPrevious forecast New forecast
EFFECTIVEGDPINTHEEUROAREAAfterrecordingmodesteconomicgrowththisyear,theeuroareaeconomyshouldpickuppaceoverthenexttwoyears(annual percentage changes; differences in percentage points – right-hand scale; seasonally adjusted)
Chart II.1.1

Czech National Bank / Inflation Report IV/2013
12
The market outlook for 3M EURIBOR interest rates reflects the subdued inflation expected in the medium term and the corresponding accommodative monetary policy of the ECB, whose representatives, moreover, do not rule out the possibility of a further easing. The market outlook expects the 3M EURIBOR to average 0.2% this year (see Chart II.1.4). In the subsequent two years, the average 3M EURIBOR should increase to 0.4% and 0.8% respectively in a context of accelerating economic growth. The market outlook for rates shifted slightly upwards compared to the previous forecast owing to the positive trend in economic activity in Q2 and to a continuing fall in liquidity on the euro area interbank market as a result of LTRO repayments. The market outlook for foreign rates is about 0.1 percentage point higher than the expectations of the analysts surveyed in the October CF. They were expecting 3M EURIBOR rates to stay at the current level of 0.2% at the three-month horizon and to rise to 0.3% at the one-year horizon. Most analysts were expecting the ECB’s main refinancing rate to stay at the current level of 0.5% at least until the end of October 2014.
The outlook for the euro-dollar exchange rate foresees the euro staying at USD 1.32/EUR on average in 2013 (see Chart II.1.5). The strengthening of the euro so far in 2013 reflects a moderation of the effects of the euro area debt crisis on financial markets and the continuing quantitative easing in the USA. The current trend also takes into account the favourable news pointing to an economic recovery in the euro area and the problems with approving the budget and raising the debt ceiling in the USA. Compared with the previous forecast, the euro exchange rate is expected to be 1% stronger over the entire forecast horizon. However, the outlook still indicates gradual depreciation of the euro to USD 1.29/EUR on average in 2014 and to USD 1.27/EUR in 2015.
The outlook for the Brentcrudeoilprice based on market futures contracts continues to expect a falling path over the entire forecast horizon (see Chart II.1.6) from the current level of roughly USD 110 a barrel to about USD 97 a barrel at the end of 2015. This means an upward shift of USD 4 a barrel over the entire forecast horizon compared to the previous forecast, due mainly to the continuing political instability in the Middle East and an oil production shortfall in Libya. Higher prices of Brent crude oil are also currently being fostered by renewed growth in demand from China and a weaker US dollar. The analysts surveyed in the October CF predict the price of Brent crude oil to fall to around USD 107 a barrel at the 12-month horizon, somewhat higher than the market outlook for the period.
II. THE FORECAST, ITS CHANGES AND RISKS
-0.2
-0.1
0.0
0.1
0
1
2
3
I/10 I/15I/09 I/11 I/12 I/13 I/14
DifferencesPrevious forecast New forecast
3MEURIBORExpectationsofcontinuedaccommodativeECBmonetarypolicyarereflectedinalowoutlookforforeigninterestrates(in %; differences in percentage points – right-hand scale)
Chart II.1.4
-3
0
3
6
1.2
1.3
1.4
1.5
I/10 I/15I/09 I/11 I/12 I/13 I/14
DifferencesPrevious forecast New forecast
EURO-DOLLAREXCHANGERATEAfterthecurrentappreciation,theexchangerateoftheeuroshouldgraduallydepreciateoverthenexttwoyears(USD/EUR; differences in % – right-hand scale)
Chart II.1.5
0
2
4
6
8
40
60
80
100
120
I/10 I/15I/09 I/11 I/12 I/13 I/14
DifferencesPrevious forecast New forecast
PRICEOFBRENTCRUDEOILThemarketoutlookforthecrudeoilpriceexpectsaverygradualdeclinefromthecurrentelevatedlevelovertheentireforecasthorizon(USD/barrel; differences in % – right-hand scale)
Chart II.1.6

Czech National Bank / Inflation Report IV/2013
13
II.2THEFORECAST
Headline inflation dropped significantly owing to slowing growth in food prices and administered prices amid still negative adjusted inflation excluding fuels. The forecast expects headline inflation to decline to zero in the near term, with low net inflation being accompanied by a fall in administered prices and an unwinding of the first-round effects of the VAT change. Both headline and monetary-policy relevant inflation will remain below the lower boundary of the tolerance band around the CNB’s target until 2014 Q3 and then approach the target over the monetary policy horizon. Import prices will remain inflationary because of the current depreciation of the koruna against the euro and subsequent stability or only very slow appreciation amid an accelerating increase in prices abroad from their currently subdued levels. The anti-inflationary effect of the domestic economy will subside only slowly and developments in the Czech economy will start to push prices slightly upwards in 2014. Subdued external and domestic demand due to fiscal consolidation will lead to a 0.9% decline in GDP in 2013. The economy will grow by 1.5% next year thanks to a recovery in external demand and the unwinding of the effect of government consolidation measures. In 2015 the growth will pick up further to about 3%. Consistent with the forecast is a significant decline in market interest rates well below zero, followed by a rise in rates above the current levels only at the end of 2014. Given the zero lower bound on interest rates, this points to a significant need to ease monetary policy using other instruments.
Annualheadlineinflationdropped to 1.2% on average in 2013 Q3. Monetary-policy relevant inflation, i.e. inflation adjusted for the first-round effects of changes to indirect taxes, was 0.4% in the same period, i.e. well below the lower boundary of the tolerance band around the CNB’s target. According to the forecast, headline inflation will fall further to zero levels at the start of 2014 as the first-round effects of changes to indirect taxes made in January this year drop out and administered prices decrease. Headline inflation will thus diverge further from the target (see Chart II.2.1). Inflation will return close to the target in 2015 thanks to an increase in administered price inflation back into positive figures amid gradually rising net inflation. Monetary-policy relevant inflation will temporarily turn slightly negative at the start of next year and stay below the lower boundary of the tolerance band around the target until 2014 Q3. Together with headline inflation it will then approach the CNB’s 2% target over the monetary policy horizon. The modest price growth in the near term will be due mainly to subdued – although gradually recovering – domestic economic activity, very low wage growth and a fall in administered prices at the start of next year. Inflationary pressures will re-emerge only slowly over the forecast horizon, with import price growth contributing to rising costs this year in particular. The inflationary effect of import prices will weaken next year as the exchange rate gradually appreciates, but this will be more than offset by a recovery in the domestic economy.
II. THE FORECAST, ITS CHANGES AND RISKS
table II.2.1
2012 2013 2014 2015
actual forecast forecast forecast
Administered prices – totala) 6.2 1.16 1.3 0.24 -0.4 -0.08 2.8 0.49
of which (main changes):
electricity 4.2 0.18 2.7 0.12 -9.0 -0.40 3.5 0.15
natural gas 4.3 0.12 -6.9 -0.20 0.4 0.01 -0.4 -0.01
heat 8.4 0.17 3.8 0.08 3.5 0.07 5.0 0.10
water 12.0 0.12 6.9 0.07 6.0 0.06 6.0 0.06
health care 8.3 0.15 1.3 0.02 2.0 0.04 2.0 0.04
First-round impacts of tax changes in non-administered prices
0.99 0.70 0.25 0.00
FORECASTOFADMINISTRATIVEEFFECTSThefallinadministeredpricesin2014willbeduetoasharpdeclineinelectricityprices(annual percentage changes; impacts in percentage points)
a) Including effects of indirect tax changes
Fuel pricesAdministered prices
I/09 I/14 I/15I/10 I/11 I/12 I/13
-20
-10
0
10
20
ADMINISTEREDPRICESANDFUELPRICESAdministeredpricesandfuelpriceswillfallnextyear(annual percentage changes; fuel prices excluding first-round effects of indirect tax changes)
Chart II.2.2
Monetary-policy relevant inflation Headline inflation
I/09 I/14 I/15I/10 I/13I/11 I/12
Inflation target
Monetarypolicy
horizon
-2
0
2
4
6
8
HEADLINEINFLATIONANDMONETARY-POLICYRELEVANTINFLATIONHeadlineandmonetary-policyrelevantinflationwillfalltozeroatthestartof2014andthenconvergetowardsthetargetoverthemonetarypolicyhorizon(year on year in %)
Chart II.2.1

Czech National Bank / Inflation Report IV/2013
14
Annual administered price inflation fell to 1.6% on average in 2013 Q3 (including the effect of the VAT increase; see Chart II.2.2), thanks mainly to a fall in prices of gas for households (see Box 4 in section III.7 for details on global gas prices) and lower year-on-year growth in heat prices. Annual administered price inflation will remain close to the current level in Q4. Electricity prices will fall slightly, with one major distributor incorporating the decline in electricity generation prices into its final prices. This will be partly offset by an increase in rail fares. At the start of next year, administered prices will be greatly affected by a sudden drop in electricity prices of 9%. Final prices will reflect the decline in electricity generation prices on European exchanges and a fall in households’ contribution to support for renewable sources2 and an expected reduction in distribution fees.3 Administered prices will decline year on year throughout 2014, mainly due to lower housing-related energy prices. In 2015, their dynamics will turn positive again (see Table II.2.1).
The contribution of changes to indirect taxes to non-administered prices averaged 0.7 percentage point in 2013 Q3. The first-round effect on headline inflation was 0.8 percentage point. This was due to a rise in both VAT rates of one percentage point in January 2013 and a “harmonisation increase” in excise duty on cigarettes. In January 2014, another harmonisation increase in excise duty on cigarettes4 will take place. Its effect on headline inflation is calculated at about 0.25 percentage point. Because of the usual frontloading of cigarettes, the forecast assumes later pass-through of the above tax change to consumer prices. As in past years, this pass-through is assumed to be full.
Annual netinflation fell slightly in 2013 Q3 to 0.4% on average (see Chart II.2.3). Food price inflation went down, while adjusted inflation excluding fuels remained stable in negative values. The forecast expects a further fall in net inflation at the end of this year to almost zero, with slowing food price inflation prevailing over a gradual moderation of the year-on-year decline in prices in the segment of adjusted inflation excluding fuels. The latter will turn positive in mid-2014, and its subsequent gradual rise will be reflected in net inflation, which will rise to around 1.7% at the end of 2014. Net inflation will then stay close to that level in 2015.
2 On 13 September 2013, the Czech Senate passed a government amendment reducing the contribution to renewable energy sources paid by consumers in electricity prices. The amendment also reduces support for the generation of electricity from renewable energy sources.
3 The Energy Regulatory Office will probably make a decision about the announced reduction in distribution fees in November 2013.
4 The Czech Republic is obliged to comply with a specific minimum excise duty requirement of EUR 90 per 1,000 cigarettes with effect from 1 January 2014. According to the directive, the requirement must be met on the basis of the koruna-euro exchange rate as of the first working day of October 2013. Because the koruna-euro rate is weaker than when the legislation was adopted last year, the proposed increase in excise duty on tobacco products is higher.
II. THE FORECAST, ITS CHANGES AND RISKS
-50
-25
0
25
50
-20
-10
0
10
20
Oil price (in CZK) Fuel prices (right-hand scale)
I/09 I/14 I/15I/10 I/11 I/12 I/13
FUELPRICESANDOILPRICESTheyear-on-yeardeclineinfuelpriceswillpersistin2014(annual percentage changes)
Chart II.2.5
-40
-30
-20
-10
0
10
20
30
40
-6
-3
0
3
6
Agricultural producer pricesFood prices (right-hand scale)
I/09 I/14 I/15I/10 I/11 I/12 I/13
FOODPRICESANDAGRICULTURALPRODUCERPRICESFoodpriceinflationwillslowuntilmid-2014inlinewithagriculturalproducerpriceinflation(annual percentage changes)
Chart II.2.4
Adjusted inflation excluding fuelsNet inflation
I/09 I/14 I/15I/10 I/11 I/12 I/13
-2
-1
0
1
2
NETINFLATIONANDADJUSTEDINFLATIONEXCLUDINGFUELSMarketpriceinflationwillrisesteadilyasfromthestartof2014onthebackofrecoveringeconomicactivity(year on year in %)
Chart II.2.3

Czech National Bank / Inflation Report IV/2013
15
Annual adjusted inflationexcludingfuels remained negative and broadly stable in 2013 Q3 (see Chart II.2.3), thus continuing to reflect the anti-inflationary effect of the domestic economy and the low annual growth rate of import prices. Adjusted inflation excluding fuels will become less negative in the next few quarters, partly because of renewed annual growth in import prices. In 2014, adjusted inflation will turn positive and rise steadily on the back of recovering domestic economic activity. In 2015, it will increase to around 1.7%.
Annualfoodprice inflation (excluding the first-round effect of tax changes) moderated in 2013 Q3 due to fading year-on-year growth in prices in agriculture. A gradual weakening of the annual growth rate of food prices will be apparent until mid-2014 in connection with a deepening decline in agricultural producer prices (see Chart II.2.4). Food prices will later gradually pick up to around 2% in 2015.
The annual decline in fuel prices slowed on average in 2013 Q3, copying the volatile prices of oil and petrol on world markets (see Chart II.2.5). Fuel prices should continue to decline slightly in the period ahead in line with a year-on-year fall in petrol prices on world markets amid an only slightly depreciating koruna-dollar exchange rate. Fuel prices will flatten out at the end of next year and remain at the same level for most of 2015.
Interestrateson the Czech money market remained low in 2013 Q3, reflecting the easy monetary policy in the Czech Republic due to the anti-inflationary effect of the domestic economy and low interest rates in the euro area. Rates with maturities longer than one year increased until the start of September and later decreased again in line with long-term rates abroad. Consistent with the forecast is a significant decline in market interest rates well below zero, followed by a rise in rates above the current levels only at the end of 2014 (see Chart II.2.6). Due to the existence of the interest rate premium, which is assumed at the current 0.4 percentage point over the entire forecast horizon, the forecast implies a hypothetical need for a negative repo rate of up to around -0.85%. Given the zero lower bound on interest rates, this points to a significant need to ease monetary policy using other instruments. In particular, the very low outlook for administered prices and slow growth in wages and other costs are fostering a decline in interest rates.
Thekoruna depreciated slightly against theeuro to CZK 25.9 on average in 2013 Q3. The short-term forecast for 2013 Q4 assumes an exchange rate of CZK 25.8 to the euro (see Chart II.2.7). Given the hypothetically negative domestic interest rates, the stable exchange rate at the start of the forecast reflects subdued external demand and the CNB’s previous communication regarding its preparedness to use the exchange rate as an instrument for easing monetary policy. However, the low outlook for interest rates and a recovery in external demand, reflected in increasing net exports, will gradually prevail slightly. This leads to very slow appreciation of the exchange rate at the longer end of the forecast to CZK 25.5 against the euro at the Total
I/09 I/15I/10 I/11 I/12 I/13 I/14
-3
-2
-1
0
1
2
3
Export-specific technologyImport pricesIntermediate goods prices
COSTSINTHECONSUMERSECTORTheoverallinflationarypressuresintheconsumersectorwillincreasegraduallyfromtheircurrentlowlevels(quarterly percentage changes; contributions in percentage points; annualised)
Chart II.2.8
-1
0
1
2
3
3M EURIBOR3M PRIBOR
I/09 I/14 I/15I/10 I/11 I/12 I/13
INTERESTRATEFORECASTConsistentwiththeforecastisasignificantdeclineinmarketinterestrateswellbelowzero,followedbyariseinratesabovethecurrentlevelsonlyattheendof2014(3M PRIBOR and 3M EURIBOR in %)
Chart II.2.6
15
20
25
30
CZK/USD exchange rate CZK/EUR exchange rate
I/09 I/15I/10 I/11 I/12 I/13 I/14
EXCHANGERATEFORECASTTheexchangerateofthekorunaagainsttheeuroovertheforecasthorizonwillinitiallybestableandthenstarttoappreciateonlyveryslowly(CZK/EUR and CZK/USD)
Chart II.2.7
II. THE FORECAST, ITS CHANGES AND RISKS

Czech National Bank / Inflation Report IV/2013
16
end of 2015. In light of the CF outlook for a gradually depreciating exchange rate of the euro against the dollar (see section II.1), this implies a slight depreciation of the koruna-dollar rate over the entire forecast horizon.
Quarterly growth in nominal marginal costs in the consumergoods sector edged up in 2013 Q3 from very low levels in the previous period (see Chart II.2.8). This was due mainly to an increase in the contribution of import prices, with the impact of the previous depreciation of the koruna and renewed quarterly growth in producer prices abroad gradually manifesting itself. Owing to continued subdued economic activity, the effect of the domestic economy, approximated by intermediate goods price inflation, remains anti-inflationary. The estimated impact of growth in export-specific technology is linked to the difference in the evolution of prices of tradables and non-tradables (the Balassa-Samuelson effect), which for some time now has been contributing less markedly to inflation than in the pre-crisis period. The overall pressures on consumer price inflation will gradually increase over the forecast horizon as the anti-inflationary effect of the domestic economy fades and starts to have an upward effect on prices in 2014 Q2. The inflationary effect of import prices will gradually weaken in 2014 owing to a stable koruna exchange rate and low foreign producer price inflation. It will later increase again in early 2015, however, due to rising producer price inflation abroad. The contribution of export-specific technology will increase as economic activity gradually recovers.
Nominal marginal costs in the intermediate goods sectorcontinued to decline in 2013 Q3, albeit to a lesser extent than in the previous two quarters. Nominal wage growth in the business sector remained very low (after the one-off effect of tax optimisation had faded away) and was thus outweighed by the estimated still declining price of capital, which reflects subdued economic activity and weak investment activity. Domestic nominal costs will decline moderately until the end of 2013 (see Chart II.2.9) and then begin to rise again at the start of 2014 due to gradually accelerating wage growth, although this will be partly offset by rising productivity growth. At the same time, the currently negative contribution of the price of capital will have a broadly neutral effect as from the start of 2014.
The estimated gap in profitmark-upsintheconsumergoodssectorwas slightly positive in 2013 Q3 (see Chart II.2.10). In an environment of weak growth in prices of consumer goods, this reflects the fact that estimated costs in this sector grew even more slowly. The gap in profit mark-ups will turn negative again at the start of the forecast horizon, as the weak domestic demand will prevent prices from rising in line with growth in costs stemming mainly from import prices. The gap in profit mark-ups will converge towards zero again in 2015.
The year-on-year decline in whole-economy labour productivitymoderated further in 2013 Q3. Labour productivity will turn positive in 2014 Q1 and its growth will gradually pick up to levels of around 3% during 2015. This will be fostered mainly by growth in economic activity.
II. THE FORECAST, ITS CHANGES AND RISKS
Nominal wages in the business sectorNominal wages in the non-business sector
-4
-2
0
2
4
6
I/09 I/15I/10 I/11 I/12 I/13 I/14
AVERAGENOMINALWAGEWagegrowthwillpickupfromitscurrentlevelsaseconomicactivityrecovers(annual percentage changes; business sector – seasonally adjusted; non-business sector – seasonally unadjusted)
Chart II.2.11
Gap in profit mark-ups in the consumer sector
I/09 I/15I/10 I/11 I/12 I/13 I/14
-1.0
-0.5
0.0
0.5
1.0
GAPINPROFITMARK-UPSINTHECONSUMERSECTORThegapinprofitmark-upswillbenegativeovermostoftheforecasthorizon(percentages)
Chart II.2.10
I/09 I/15I/10 I/11 I/12 I/13 I/14
-4
-2
0
2
4
TotalWagesLabour-augmenting technology
Price of capital
COSTSINTHEINTERMEDIATEGOODSSECTORDomesticcostswillbegintoriseatthestartofnextyearduetoacceleratingwagegrowthandafadingdeclineinthepriceofcapital(quarterly percentage changes; contributions in percentage points; annualised)
Chart II.2.9
17
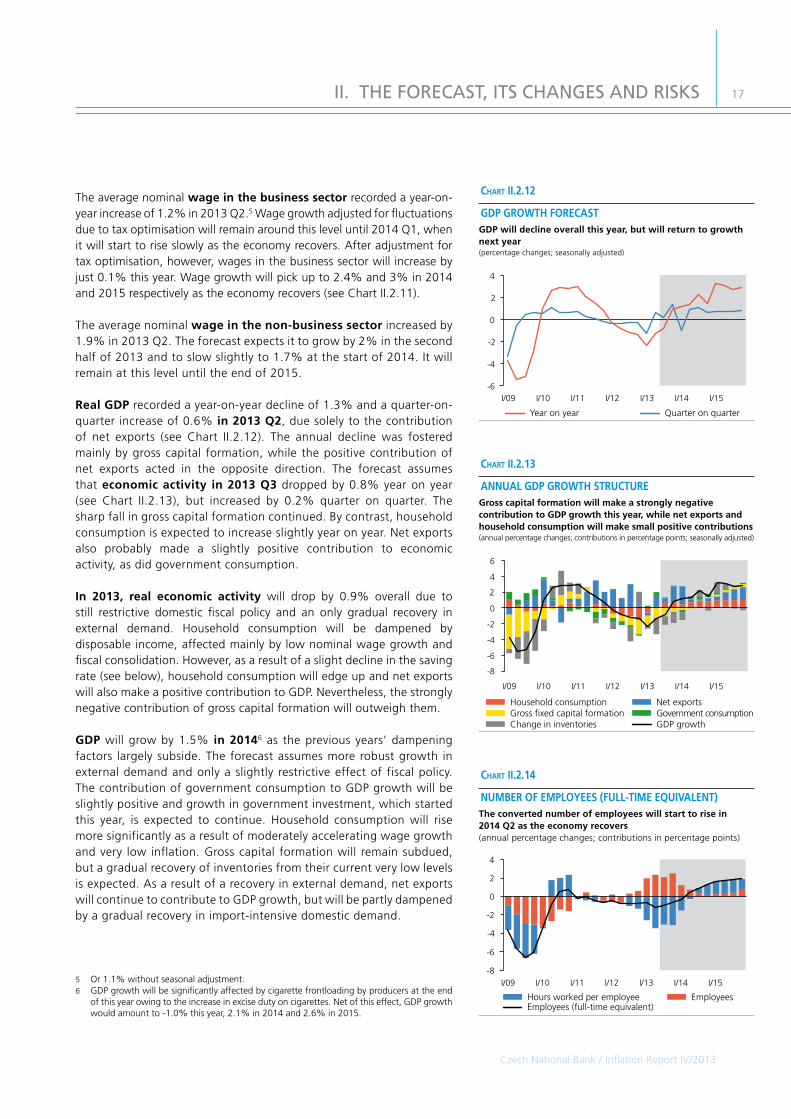
The average nominal wageinthebusinesssector recorded a year-on-year increase of 1.2% in 2013 Q2.5 Wage growth adjusted for fluctuations due to tax optimisation will remain around this level until 2014 Q1, when it will start to rise slowly as the economy recovers. After adjustment for tax optimisation, however, wages in the business sector will increase by just 0.1% this year. Wage growth will pick up to 2.4% and 3% in 2014 and 2015 respectively as the economy recovers (see Chart II.2.11).
The average nominal wageinthenon-businesssectorincreased by 1.9% in 2013 Q2. The forecast expects it to grow by 2% in the second half of 2013 and to slow slightly to 1.7% at the start of 2014. It will remain at this level until the end of 2015.
RealGDPrecorded a year-on-year decline of 1.3% and a quarter-on-quarter increase of 0.6%in2013Q2, due solely to the contribution of net exports (see Chart II.2.12). The annual decline was fostered mainly by gross capital formation, while the positive contribution of net exports acted in the opposite direction. The forecast assumes that economicactivity in2013Q3 dropped by 0.8% year on year (see Chart II.2.13), but increased by 0.2% quarter on quarter. The sharp fall in gross capital formation continued. By contrast, household consumption is expected to increase slightly year on year. Net exports also probably made a slightly positive contribution to economic activity, as did government consumption.
In 2013, real economic activity will drop by 0.9% overall due to still restrictive domestic fiscal policy and an only gradual recovery in external demand. Household consumption will be dampened by disposable income, affected mainly by low nominal wage growth and fiscal consolidation. However, as a result of a slight decline in the saving rate (see below), household consumption will edge up and net exports will also make a positive contribution to GDP. Nevertheless, the strongly negative contribution of gross capital formation will outweigh them.
GDPwill grow by 1.5% in20146 as the previous years’ dampening factors largely subside. The forecast assumes more robust growth in external demand and only a slightly restrictive effect of fiscal policy. The contribution of government consumption to GDP growth will be slightly positive and growth in government investment, which started this year, is expected to continue. Household consumption will rise more significantly as a result of moderately accelerating wage growth and very low inflation. Gross capital formation will remain subdued, but a gradual recovery of inventories from their current very low levels is expected. As a result of a recovery in external demand, net exports will continue to contribute to GDP growth, but will be partly dampened by a gradual recovery in import-intensive domestic demand.
5 Or 1.1% without seasonal adjustment.6 GDP growth will be significantly affected by cigarette frontloading by producers at the end
of this year owing to the increase in excise duty on cigarettes. Net of this effect, GDP growth would amount to -1.0% this year, 2.1% in 2014 and 2.6% in 2015.
-8
-6
-4
-2
0
2
4
I/09 I/15I/10 I/11 I/12 I/13 I/14
EmployeesHours worked per employeeEmployees (full-time equivalent)
NUMBEROFEMPLOYEES(FULL-TIMEEQUIVALENT)Theconvertednumberofemployeeswillstarttorisein2014Q2astheeconomyrecovers(annual percentage changes; contributions in percentage points)
Chart II.2.14
Quarter on quarterYear on year
-6
-4
-2
0
2
4
I/09 I/15I/10 I/11 I/12 I/13 I/14
GDPGROWTHFORECASTGDPwilldeclineoverallthisyear,butwillreturntogrowthnextyear(percentage changes; seasonally adjusted)
Chart II.2.12
Government consumptionGross fixed capital formationChange in inventories
Net exportsHousehold consumption
GDP growth
I/15I/09 I/10 I/11 I/12 I/13 I/14
-8
-6
-4
-2
0
2
4
6
ANNUALGDPGROWTHSTRUCTUREGrosscapitalformationwillmakeastronglynegativecontributiontoGDPgrowththisyear,whilenetexportsandhouseholdconsumptionwillmakesmallpositivecontributions(annual percentage changes; contributions in percentage points; seasonally adjusted)
Chart II.2.13
II. THE FORECAST, ITS CHANGES AND RISKS
Czech National Bank / Inflation Report IV/2013

18
Total GDPgrowth will reach 3%in2015. This will start to be fostered more significantly by a recovery in domestic demand, especially household consumption. Owing to a continuing recovery abroad, net exports will still contribute positively to GDP growth, despite continued growth in imports for consumption and for production of export goods. The contribution of gross capital formation will also be positive in 2015.
The observed decline in thenumberofemployeesconvertedintofull-timeequivalents will gradually moderate in subsequent quarters (see Chart II.2.14). The converted number of employees will start to rise again in 2014 Q2 as the economy recovers. Totalemployment will rise in year-on-year terms until mid-2014 and subsequently flatten out (see Chart II.2.15), with the recovery in economic activity being reflected in a renewed increase in the average hours worked rather than a rise in the number of employees. Total employment will start growing again in 2015 H2.
The forecast assumes that the seasonally adjusted generalunemploymentrate was flat at 7% in 2013 Q3. However, given the gradual slowdown in employment growth and persisting growth in the labour force, the general unemployment rate will rise gradually to 7.7% in 2014 Q3. It will fluctuate around this level until mid-2015, when it will start to decline gradually (see Chart II.2.15). Over the next few quarters, a continuing increase can also be expected for the seasonally adjusted share of unemployed persons according totheMLSA, which will rise to just above 8% owing to a further cyclical increase in the number of job applicants registered with labour offices amid a decrease in the population aged 15–64. However, the share of unemployed persons will start to decline gradually in 2014 H2.
As predicted by the forecast, annual growth in real householdconsumption accelerated in 2013 Q3. Household consumption will increase by 0.4% in real terms for 2013 as a whole (see Chart II.2.16). Real and nominal consumption will increase in the near future due mainly to a continued gradual decline in the saving rate, while the growth rate of nominal and real income remains weak. A slight rise in consumer demand is also indicated by the available leading indicators, such as a significant improvement in consumer confidence and retail sales in July and August this year (see section III.3). Real consumption will be supported by slowing inflation, reflecting the fading rise in food prices and the expected decrease in energy prices for households. Household consumption will rise in 2014 and 2015 as a result of a recovery in economic activity and an ensuing gradual pick-up in growth in the volume of wages as the impacts of fiscal consolidation subside.
Gross nominal disposable income will decrease slightly (by 0.2%) for 2013 as a whole, mainly because of a slight decline in the volume of wages and salaries. In the remainder of the year, its volatile annual growth rate will also be strongly affected by the tax optimisation observed in late 2012 and early 2013 (see Chart II.2.17). The annual growth rate of wages and salaries will pick up markedly at the start of
Czech National Bank / Inflation Report IV/2013
II. THE FORECAST, ITS CHANGES AND RISKS
Property income
Social benefitsGross operating surplus and mixed income
I/15I/09 I/10 I/11 I/13I/12 I/14
Individual consumption expenditure
Gross disposable income
Current taxes and social contributions
Wages and salaries
Other current transfers
-4
0
4
8
NOMINALDISPOSABLEINCOMEDisposableincomewillincreaseoverthenexttwoyearsthanksmainlytogrowthinwagesandsalaries(annual percentage changes; contributions in percentage points)
Chart II.2.17
Employment General unemployment rate (right-hand scale)
-3
-2
-1
0
1
2
4
5
6
7
8
9
I/09 I/15I/10 I/11 I/12 I/13 I/14
LABOURMARKETFORECASTAnnualgrowthintotalemploymentwillfallandtheunemploymentratewillrise(annual percentage changes in employment; general unemployment rate in percentages; seasonally adjusted)
Chart II.2.15
Household consumption Government consumption
-6
-4
-2
0
2
4
6
I/09 I/15I/10 I/11 I/12 I/13 I/14
REALHOUSEHOLDANDGOVERNMENTCONSUMPTIONHouseholdconsumptionwillriseatapaceofalmost2%overtheforecasthorizon(annual percentage changes; seasonally adjusted)
Chart II.2.16
Czech National Bank / Inflation Report IV/2013
19
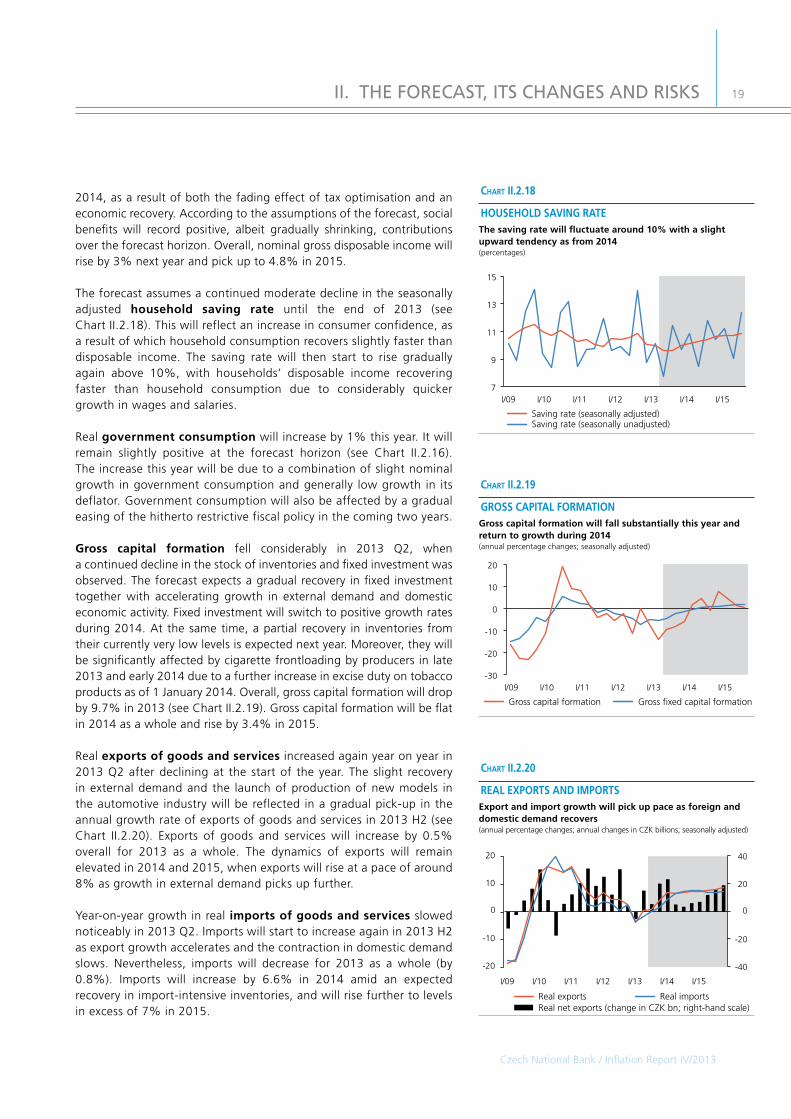
2014, as a result of both the fading effect of tax optimisation and an economic recovery. According to the assumptions of the forecast, social benefits will record positive, albeit gradually shrinking, contributions over the forecast horizon. Overall, nominal gross disposable income will rise by 3% next year and pick up to 4.8% in 2015.
The forecast assumes a continued moderate decline in the seasonally adjusted household saving rate until the end of 2013 (see Chart II.2.18). This will reflect an increase in consumer confidence, as a result of which household consumption recovers slightly faster than disposable income. The saving rate will then start to rise gradually again above 10%, with households’ disposable income recovering faster than household consumption due to considerably quicker growth in wages and salaries.
Real governmentconsumption will increase by 1% this year. It will remain slightly positive at the forecast horizon (see Chart II.2.16). The increase this year will be due to a combination of slight nominal growth in government consumption and generally low growth in its deflator. Government consumption will also be affected by a gradual easing of the hitherto restrictive fiscal policy in the coming two years.
Gross capital formation fell considerably in 2013 Q2, when a continued decline in the stock of inventories and fixed investment was observed. The forecast expects a gradual recovery in fixed investment together with accelerating growth in external demand and domestic economic activity. Fixed investment will switch to positive growth rates during 2014. At the same time, a partial recovery in inventories from their currently very low levels is expected next year. Moreover, they will be significantly affected by cigarette frontloading by producers in late 2013 and early 2014 due to a further increase in excise duty on tobacco products as of 1 January 2014. Overall, gross capital formation will drop by 9.7% in 2013 (see Chart II.2.19). Gross capital formation will be flat in 2014 as a whole and rise by 3.4% in 2015.
Real exportsofgoodsandservices increased again year on year in 2013 Q2 after declining at the start of the year. The slight recovery in external demand and the launch of production of new models in the automotive industry will be reflected in a gradual pick-up in the annual growth rate of exports of goods and services in 2013 H2 (see Chart II.2.20). Exports of goods and services will increase by 0.5% overall for 2013 as a whole. The dynamics of exports will remain elevated in 2014 and 2015, when exports will rise at a pace of around 8% as growth in external demand picks up further.
Year-on-year growth in realimportsofgoodsandservicesslowed noticeably in 2013 Q2. Imports will start to increase again in 2013 H2 as export growth accelerates and the contraction in domestic demand slows. Nevertheless, imports will decrease for 2013 as a whole (by 0.8%). Imports will increase by 6.6% in 2014 amid an expected recovery in import-intensive inventories, and will rise further to levels in excess of 7% in 2015.
-40
-20
0
20
40
-20
-10
0
10
20
Real net exports (change in CZK bn; right-hand scale)Real importsReal exports
I/10 I/15I/09 I/11 I/12 I/13 I/14
REALEXPORTSANDIMPORTSExportandimportgrowthwillpickuppaceasforeignanddomesticdemandrecovers(annual percentage changes; annual changes in CZK billions; seasonally adjusted)
Chart II.2.20
Saving rate (seasonally adjusted)Saving rate (seasonally unadjusted)
7
9
11
13
15
I/09 I/15I/10 I/11 I/12 I/13 I/14
HOUSEHOLDSAVINGRATEThesavingratewillfluctuatearound10%withaslightupwardtendencyasfrom2014(percentages)
Chart II.2.18
Gross capital formation Gross fixed capital formation
-30
-20
-10
0
10
20
I/09 I/15I/10 I/11 I/12 I/13 I/14
GROSSCAPITALFORMATIONGrosscapitalformationwillfallsubstantiallythisyearandreturntogrowthduring2014(annual percentage changes; seasonally adjusted)
Chart II.2.19
II. THE FORECAST, ITS CHANGES AND RISKS
Czech National Bank / Inflation Report IV/2013
20
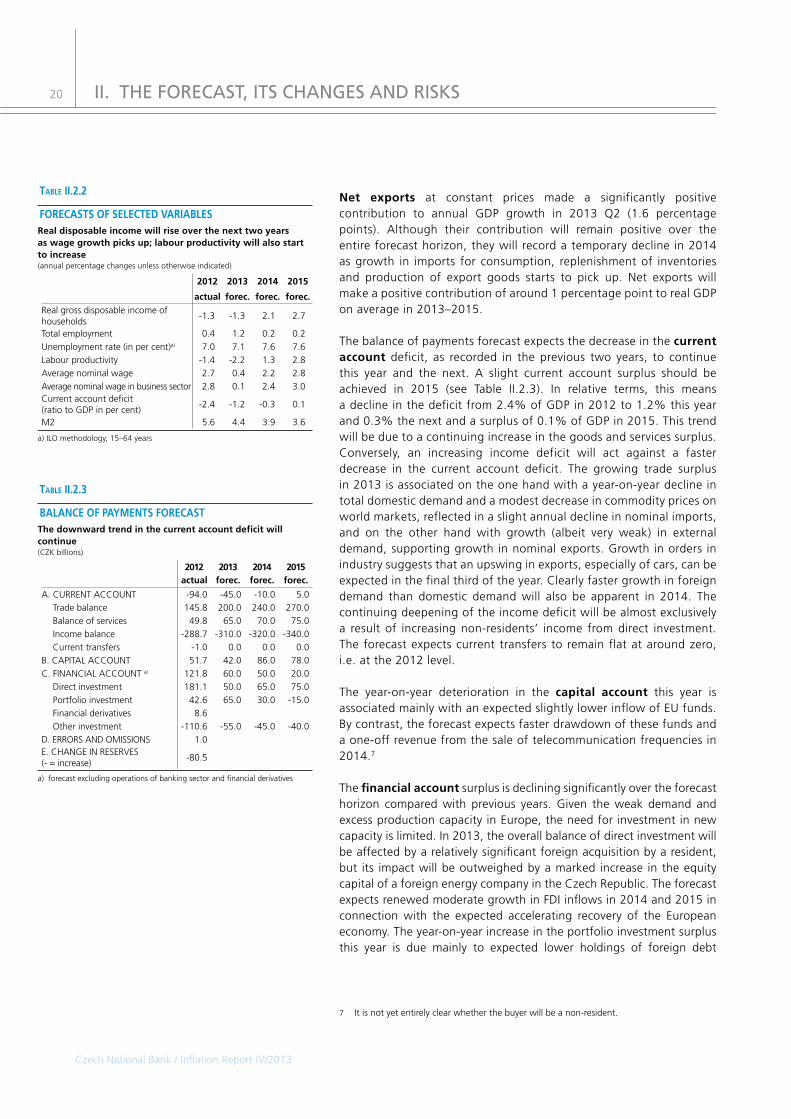
Net exports at constant prices made a significantly positive contribution to annual GDP growth in 2013 Q2 (1.6 percentage points). Although their contribution will remain positive over the entire forecast horizon, they will record a temporary decline in 2014 as growth in imports for consumption, replenishment of inventories and production of export goods starts to pick up. Net exports will make a positive contribution of around 1 percentage point to real GDP on average in 2013–2015.
The balance of payments forecast expects the decrease in the currentaccount deficit, as recorded in the previous two years, to continue this year and the next. A slight current account surplus should be achieved in 2015 (see Table II.2.3). In relative terms, this means a decline in the deficit from 2.4% of GDP in 2012 to 1.2% this year and 0.3% the next and a surplus of 0.1% of GDP in 2015. This trend will be due to a continuing increase in the goods and services surplus. Conversely, an increasing income deficit will act against a faster decrease in the current account deficit. The growing trade surplus in 2013 is associated on the one hand with a year-on-year decline in total domestic demand and a modest decrease in commodity prices on world markets, reflected in a slight annual decline in nominal imports, and on the other hand with growth (albeit very weak) in external demand, supporting growth in nominal exports. Growth in orders in industry suggests that an upswing in exports, especially of cars, can be expected in the final third of the year. Clearly faster growth in foreign demand than domestic demand will also be apparent in 2014. The continuing deepening of the income deficit will be almost exclusively a result of increasing non-residents’ income from direct investment. The forecast expects current transfers to remain flat at around zero, i.e. at the 2012 level.
The year-on-year deterioration in the capital account this year is associated mainly with an expected slightly lower inflow of EU funds. By contrast, the forecast expects faster drawdown of these funds and a one-off revenue from the sale of telecommunication frequencies in 2014.7
Thefinancialaccountsurplus is declining significantly over the forecast horizon compared with previous years. Given the weak demand and excess production capacity in Europe, the need for investment in new capacity is limited. In 2013, the overall balance of direct investment will be affected by a relatively significant foreign acquisition by a resident, but its impact will be outweighed by a marked increase in the equity capital of a foreign energy company in the Czech Republic. The forecast expects renewed moderate growth in FDI inflows in 2014 and 2015 in connection with the expected accelerating recovery of the European economy. The year-on-year increase in the portfolio investment surplus this year is due mainly to expected lower holdings of foreign debt
7 It is not yet entirely clear whether the buyer will be a non-resident.
II. THE FORECAST, ITS CHANGES AND RISKS
a) ILO methodology, 15–64 years
table II.2.2
FORECASTSOFSELECTEDVARIABLESRealdisposableincomewillriseoverthenexttwoyearsaswagegrowthpicksup;labourproductivitywillalsostarttoincrease(annual percentage changes unless otherwise indicated)
a) forecast excluding operations of banking sector and financial derivatives
table II.2.3
BALANCEOFPAYMENTSFORECASTThedownwardtrendinthecurrentaccountdeficitwillcontinue(CZK billions)
2012 2013 2014 2015
actual forec. forec. forec.
Real gross disposable income of households
-1.3 -1.3 2.1 2.7
Total employment 0.4 1.2 0.2 0.2
Unemployment rate (in per cent)a) 7.0 7.1 7.6 7.6
Labour productivity -1.4 -2.2 1.3 2.8
Average nominal wage 2.7 0.4 2.2 2.8
Average nominal wage in business sector 2.8 0.1 2.4 3.0Current account deficit (ratio to GDP in per cent)
-2.4 -1.2 -0.3 0.1
M2 5.6 4.4 3.9 3.6
2012 2013 2014 2015actual forec. forec. forec.
A. CURRENT ACCOUNT -94.0 -45.0 -10.0 5.0Trade balance 145.8 200.0 240.0 270.0
Balance of services 49.8 65.0 70.0 75.0
Income balance -288.7 -310.0 -320.0 -340.0
Current transfers -1.0 0.0 0.0 0.0
B. CAPITAL ACCOUNT 51.7 42.0 86.0 78.0
C. FINANCIAL ACCOUNT a) 121.8 60.0 50.0 20.0
Direct investment 181.1 50.0 65.0 75.0
Portfolio investment 42.6 65.0 30.0 -15.0
Financial derivatives 8.6
Other investment -110.6 -55.0 -45.0 -40.0
D. ERRORS AND OMISSIONS 1.0E. CHANGE IN RESERVES (- = increase)
-80.5

Czech National Bank / Inflation Report IV/2013
21
securities by residents. By contrast, expected slightly lower drawdown of foreign funds by the government and government-controlled companies and increased demand of residents for foreign shares will be acting towards a lower deficit. The expected lower net portfolio investment inflow in 2014 and 2015 is connected with predicted higher interest among residents in investing abroad due to the economic recovery and a further decrease in foreign funding of the government and government-controlled companies.
The future macroeconomic developments described above and the current fiscal policy settings are reflected in thegovernmentfinanceoutlook for 2013–2015 (see Table II.2.4).8
The government deficit should fall to 2.6% of GDP in 2013 owing to consolidation measures.9 Counteracting this is the abating decline in real economic activity and a continuing labour market downturn. Growth in compensation per employee in the non-business sector is continuing to recover. This will be reflected in a slight pick-up in nominal growth in government consumption. At the same time, the forecast for this year continues to expect a partial recovery in government investment connected with the drawdown of EU funds. Nevertheless, the domestic component of government investment will remain subdued in 2013. Overall, the forecast expects a negative contribution of fiscal policy to economic activity of around 0.6 percentage point this year, i.e. roughly at the previous year’s level. The consolidation measures are affecting the economy both through the price effect stemming from the increase in VAT and through lower nominal disposable income, with both factors reducing real household consumption. The shortfall in social security contributions associated with the launch of the second pillar of the pension system will be very small due to the low observed interest in participation in this pillar. A decline in the general government deficit below 3% of GDP in 2013 will enable the Excessive Deficit Procedure (EDP) to be ended on time.
A slight decrease in the government deficit to 2.5% of GDP is expected in 2014, owing mainly to renewed growth in economic activity. The forecast takes into account the continuing effect of the consolidation measures adopted in 2012 (for example, a smaller increase in pensions) and the harmonisation changes to indirect taxes, but their restrictive impact on economic growth will be offset by an intensifying recovery in government investment and continued wage growth in the non-business sector. In 2014, therefore, the overall effect of fiscal policy will be broadly neutral to slightly restrictive.
8 At the end of September, the CZSO sent Eurostat data on government finance in 2009–2012, including the outlook for 2013 under the ESA 95 methodology, as part of the autumn government deficit and debt notifications. The data on the general government deficit saw only minor changes. The government debt figures were increased on the basis of a revision of the valuation of foreign currency bonds issued by general government. The government debt to GDP ratio for 2009–2012 was increased by 0.4–0.6 percentage point.
9 The marked fall in the government deficit this year compared to 2012 is also due to the unwinding of the effect of the financial settlement with churches, which led to a one-off widening of the general government deficit last year under ESA 95 methodology.
a) government budget balance minus interest paymentsb) 2012: impact of property settlement between state and churches. 2013–2015:
impacts of pension reform.c) adjusted for one-off measures; CNB estimated) CNB estimatee) year-on-year change in structural balance (positive value indicates fiscal restric-
tion, negative value fiscal expansion)
table II.2.4
2012 2013 2014 2015
actual forec. forec. forec.
Government revenue 40.1 41.2 42.1 41.2
Government expenditure 44.5 43.8 44.6 43.8
of which: interest payments 1.5 1.5 1.6 1.7
GOVERNMENT BUDGET BALANCE -4.4 -2.6 -2.5 -2.6
of which:
primary balance a) -2.9 -1.1 -0.9 -0.9
one-off measures b) -1.5 0.0 0.0 0.0
ADJUSTED BUDGET BALANCE c) -2.9 -2.6 -2.5 -2.6
Cyclical component (ESCB method) d) -0.4 -0.9 -0.7 -0.3
Structural balance (ESCB method) d) -2.4 -1.8 -1.8 -2.3
Fiscal stance in pp (ESCB method) e) 0.9 0.7 -0.1 -0.4
Cyclical component (EC method) d) -0.5 -1.2 -1.0 -0.4
Structural balance (EC method) d) -2.4 -1.5 -1.5 -2.2
Fiscal stance in pp (EC method) e) 0.9 0.9 0.0 -0.7
Government debt 46.2 46.9 48.4 48.7
FISCALFORECASTFiscalconsolidationwillendin2013andfiscalpolicywillstarttobebroadlyneutralorslightlyloosein2014(% of nominal GDP)
II. THE FORECAST, ITS CHANGES AND RISKS

Czech National Bank / Inflation Report IV/2013
22
The general government deficit can be expected to grow to 2.6% in 2015 despite the already relatively robust economic growth. This is because a tax reform10 resulting in a considerable decline in direct tax revenue (of 0.7% of GDP) takes effect under the applicable legislation in 2015. Fiscal policy will therefore be slightly expansionary in 2015, with a positive contribution to economic activity of around 0.3 percentage point.
The general governmentstructuraldeficitwas around 2.4% of GDP in 2012. It is expected to fall below 2% of GDP in 2013 and to remain at this level in 2014 owing to the consolidation measures. In 2015, by contrast, it will rise back above 2% of GDP. The wider structural deficit coupled with the expected economic recovery will imply pro-cyclical fiscal policy and divergence from the medium-term objective of a general government structural deficit of 1% of GDP.
The expected evolution of the general government deficit will cause generalgovernmentdebt to increase gradually to 48.7% of GDP in 2015. In addition to the expected borrowing requirements of general government owing to persisting public finance deficits and the positive effect of the recovery in nominal GDP growth, the prediction of this ratio reflects this year’s release of the debt reserve created in the past, which reduces the level of debt.
A potential weaker recovery in general government investment activity is a risk to the fiscal forecast towards lower deficits and a more restrictive effect of fiscal policy. The future direction of fiscal policy following the recent early elections is also a source of uncertainty.
10 The reform consists mainly of changes to indirect taxes and social security contributions, a lower VAT registration threshold and higher limits for tax deductions on gifts.
II. THE FORECAST, ITS CHANGES AND RISKS

Czech National Bank / Inflation Report IV/2013
23
II.3COMPARISONWITHTHEPREVIOUSFORECAST
The forecast for headline and monetary-policy relevant inflation has shifted significantly downwards until the end of 2014 owing to a lower outlook for administered prices and net inflation. The interest rate path has fallen significantly below the previous forecast for the next few quarters, mainly reflecting the expected drop in administered prices and the observed evolution of inflation and wages. The exchange rate path has moved to slightly weaker values over the entire forecast horizon, chiefly as a result of changes in the external environment outlook. A change in the GDP forecast towards a less pronounced decrease in 2013 but slower growth in the following two years is due mainly to the developments observed in 2013 Q2 and the incorporation of an assumption of frontloading of cigarettes in late 2013/early 2014 as a result of a “harmonisation increase” in excise duty on tobacco products in January 2014. The expected pace of nominal wage growth in the business sector has been revised considerably downwards.
The forecast for annual headlineinflation is significantly lower until the end of 2014 compared to the previous forecast (see Chart II.3.1). The change is due to the incorporation of a decrease in administered prices in 2014 and a lower prediction for net inflation, reflecting a more anti-inflationary effect of the domestic economy and the slower price growth observed in the previous quarter. The assumptions regarding the impacts of changes to indirect taxes have increased only slightly compared to the previous forecast, so the outlook for monetary-policy relevant inflation has changed in a similar way to that for headline inflation.
Expectedadministeredprice inflation in the rest of 2013 is lower than in the previous forecast. A marked fall in the commodity component of the gas price for households had already been expected in the previous forecast, but the decline was even more pronounced in reality. In addition, the outlook incorporates an assumption of a 9% drop in electricity prices in 2014 and slower growth in heat prices. Administered price inflation will therefore turn negative next year, a development which had not been foreseen in the previous prediction. No information changing the administered price outlook for 2015 is available at the moment.
The forecast for annual net inflation is lower until the end of 2014 compared to the previous forecast (see Chart II.3.2). All its components have been revised downwards. Slightly lower dynamics of agricultural producer prices are reflected in lower food prices. The fuel price outlooks are also lower in connection with a sharper-than-expected annual decrease in petrol prices on world markets. Lower adjusted inflation excluding fuels reflects above all a lower initial level, a currently more anti-inflationary effect of the domestic economy and slower growth in import prices.
-1.5
0.0
1.5
3.0
4.5
6.0
I/09 I/15I/10 I/11 I/12 I/13 I/14
-1
0
1
2
3
4
DifferencesPrevious forecast New forecast
CHANGEINTHEHEADLINEINFLATIONFORECASTTheforecastforheadlineinflationhasbeenrevisedtoasignificantlylowerleveluntiltheendof2014(year on year in %; differences in pp – right-hand scale)
Chart II.3.1
-0.8
-0.4
0.0
0.4
0.8
-2
-1
0
1
2
I/09 I/15I/10 I/11 I/12 I/13 I/14
DifferencesPrevious forecast New forecast
CHANGEINTHENETINFLATIONFORECASTTheforecastfornetinflationintherestofthisyearandin2014hasmovednoticeablydownwards(year on year in %; differences in pp – right-hand scale)
Chart II.3.2
II. THE FORECAST, ITS CHANGES AND RISKS
Czech National Bank / Inflation Report IV/2013
24
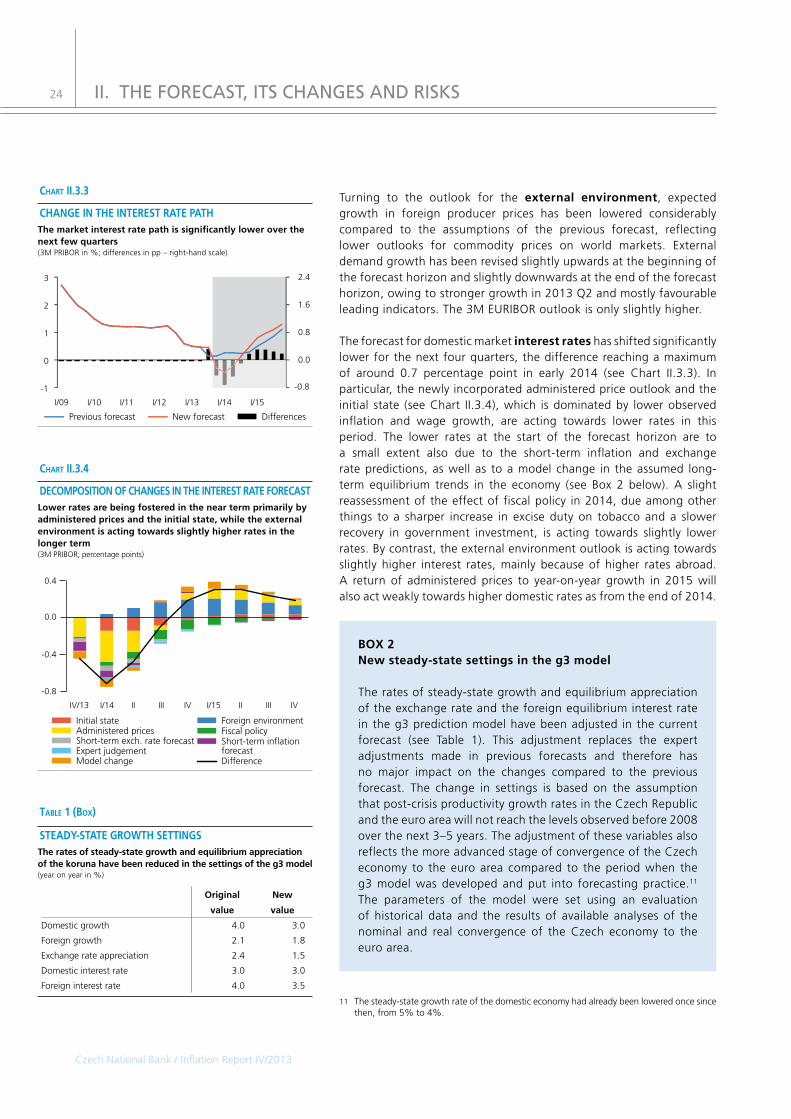
Turning to the outlook for the external environment, expected growth in foreign producer prices has been lowered considerably compared to the assumptions of the previous forecast, reflecting lower outlooks for commodity prices on world markets. External demand growth has been revised slightly upwards at the beginning of the forecast horizon and slightly downwards at the end of the forecast horizon, owing to stronger growth in 2013 Q2 and mostly favourable leading indicators. The 3M EURIBOR outlook is only slightly higher.
The forecast for domestic marketinterestrates has shifted significantly lower for the next four quarters, the difference reaching a maximum of around 0.7 percentage point in early 2014 (see Chart II.3.3). In particular, the newly incorporated administered price outlook and the initial state (see Chart II.3.4), which is dominated by lower observed inflation and wage growth, are acting towards lower rates in this period. The lower rates at the start of the forecast horizon are to a small extent also due to the short-term inflation and exchange rate predictions, as well as to a model change in the assumed long-term equilibrium trends in the economy (see Box 2 below). A slight reassessment of the effect of fiscal policy in 2014, due among other things to a sharper increase in excise duty on tobacco and a slower recovery in government investment, is acting towards slightly lower rates. By contrast, the external environment outlook is acting towards slightly higher interest rates, mainly because of higher rates abroad. A return of administered prices to year-on-year growth in 2015 will also act weakly towards higher domestic rates as from the end of 2014.
BOX2Newsteady-statesettingsintheg3model
The rates of steady-state growth and equilibrium appreciation of the exchange rate and the foreign equilibrium interest rate in the g3 prediction model have been adjusted in the current forecast (see Table 1). This adjustment replaces the expert adjustments made in previous forecasts and therefore has no major impact on the changes compared to the previous forecast. The change in settings is based on the assumption that post-crisis productivity growth rates in the Czech Republic and the euro area will not reach the levels observed before 2008 over the next 3–5 years. The adjustment of these variables also reflects the more advanced stage of convergence of the Czech economy to the euro area compared to the period when the g3 model was developed and put into forecasting practice.11 The parameters of the model were set using an evaluation of historical data and the results of available analyses of the nominal and real convergence of the Czech economy to the euro area.
11 The steady-state growth rate of the domestic economy had already been lowered once since then, from 5% to 4%.
II. THE FORECAST, ITS CHANGES AND RISKS
table 1 (box)
Original New
value value
Domestic growth 4.0 3.0
Foreign growth 2.1 1.8
Exchange rate appreciation 2.4 1.5
Domestic interest rate 3.0 3.0
Foreign interest rate 4.0 3.5
STEADY-STATEGROWTHSETTINGSTheratesofsteady-stategrowthandequilibriumappreciationofthekorunahavebeenreducedinthesettingsoftheg3model(year on year in %)
Initial state Foreign environmentAdministered prices Fiscal policy
Expert judgementModel change
Short-term exch. rate forecast Short-term inflation forecast
IV/13 I/14 I/15II III II III IVIV
-0.8
-0.4
0.0
0.4
Difference
DECOMPOSITIONOFCHANGESINTHEINTERESTRATEFORECASTLowerratesarebeingfosteredintheneartermprimarilybyadministeredpricesandtheinitialstate,whiletheexternalenvironmentisactingtowardsslightlyhigherratesinthelongerterm(3M PRIBOR; percentage points)
Chart II.3.4
-0.8
0.0
0.8
1.6
2.4
I/09 I/15I/10 I/11 I/12 I/13 I/14
-1
0
1
2
3
DifferencesPrevious forecast New forecast
CHANGEINTHEINTERESTRATEPATHThemarketinterestratepathissignificantlyloweroverthenextfewquarters(3M PRIBOR in %; differences in pp – right-hand scale)
Chart II.3.3

Czech National Bank / Inflation Report IV/2013
25
The assumed steady-state rate of growth of the Czech economy has been lowered from 4% to 3% (since the end of 2012 the CNB forecasts had already been based on an expert judgement that the supply-side growth of the Czech economy after the unwinding of the crisis would be close to 3%). The 0.9 percentage point decrease in the equilibrium (nominal and real) rate of appreciation of the koruna against the euro reflects, in addition to the lower growth differential of the Czech economy vis-à-vis the euro area, the higher degree of price level convergence achieved in the pre-crisis period. As a result of the less pronounced exchange rate appreciation, the equilibrium contribution of import prices to inflation is stronger, but at the same time the contribution of the Balassa-Samuelson effect (export-specific technology) to inflation has been revised down.
A decrease in the steady-state rate of growth of effective external demand of 0.3 percentage point reflects the structural problems of some euro area countries and the negative impact of overindebtedness of both the public and private sector on the euro area’s growth potential. These factors also explain the assumed decrease in the real equilibrium interest rate, which also implies a proportional decrease in nominal interest rates assuming unchanged inflation abroad. The Czech economy (unlike some euro area countries) is currently facing no debt or structural problems leading to a decline in the equilibrium interest rate. The equilibrium real interest rate in the Czech Republic therefore remains at 1%, implying a nominal domestic interest rate of 3% given an unchanged inflation target of 2%. Moreover, the lowering of the rate of equilibrium real appreciation in a small open economy generates – following the logic of uncovered interest rate parity – upward pressure on real rates, thereby offsetting the factors acting in the opposite direction, namely the aforementioned lower equilibrium interest rates in the euro area coupled with a continuing decline in the Czech Republic’s risk premium.
The forecast for the nominal exchangerateofthekorunaagainstthe euro has been revised towards a slightly weaker level over the entire horizon (see Chart II.3.5). This is due mainly to a widening of the negative interest rate differential and a lower rate of equilibrium appreciation, which outweigh the effect of higher nominal net exports. At the end of the forecast horizon, a weaker exchange rate is also fostered by a lower external demand outlook for 2015.
The forecast for GDP growth in 2013 is 0.6 percentage point higher compared to the previous forecast (see Chart II.3.6). This is due to the stronger GDP growth observed in 2013 Q2 and to expected stronger export growth in 2013 H2, driven chiefly by faster export growth in the automotive industry. A revision of government consumption is
-0.6
-0.3
0.0
0.3
0.6
I/09 I/15I/10 I/11 I/12 I/13 I/14
DifferencesPrevious forecast New forecast
24
25
26
27
28
CHANGEINTHEEXCHANGERATEFORECASTTheexchangerateforecasthasmovedtoslightlyweakerlevels(CZK/EUR; differences in CZK – right-hand scale)
Chart II.3.5
II. THE FORECAST, ITS CHANGES AND RISKS

Czech National Bank / Inflation Report IV/2013
26
also contributing to slightly stronger growth, while the other demand components are affecting the forecast in the opposite direction. By contrast, the GDP forecast for 2014 is 0.6 percentage point lower, as it now takes into account the effect of frontloading by cigarette producers in late 2013/early 2014 (in response to a change in excise duty on tobacco products, part of the production is shifted from 2014 Q1 to 2013 Q4 and temporarily increases inventories). In addition, a slightly restrictive effect of fiscal policy is expected, as against a neutral effect in the previous forecast. In 2015 the GDP forecast is reduced by 0.4 percentage point, mainly as a result of slower export growth in reaction to slightly weaker external demand. At the same time, the new steady-state settings in the g3 model lower GDP growth in 2014 and 2015 by 0.1 percentage point.
The contribution ofnetexportsto GDP growth in 2013 will be higher compared to the previous forecast, primarily reflecting revisions of past data, newly published data and a slightly more favourable short-term outlook for external demand. In 2014, by contrast, the contribution of net exports will be lower than in the previous prediction owing to expected stronger inventory replenishment, which will take place via higher imports. The effect of weaker external demand growth compared to the previous forecast will also be apparent at the longer end of the forecast.
The forecast for averagenominalwagegrowth in the business sector has been lowered considerably compared to the previous prediction. This is due mainly to revisions of past data, newly published data and a lower outlook for growth in labour-augmenting technology.
II. THE FORECAST, ITS CHANGES AND RISKS
-2
-1
0
1
2
-6
-3
0
3
6
I/09 I/15I/10 I/11 I/12 I/13 I/14
DifferencesPrevious forecast New forecast
CHANGEINTHEGDPFORECASTTheGDPgrowthforecasthasbeenrevisedupwardsthisyear,butislowerin2014and2015(annual percentage changes; differences in pp – right-hand scale; seasonally adjusted)
Chart II.3.6
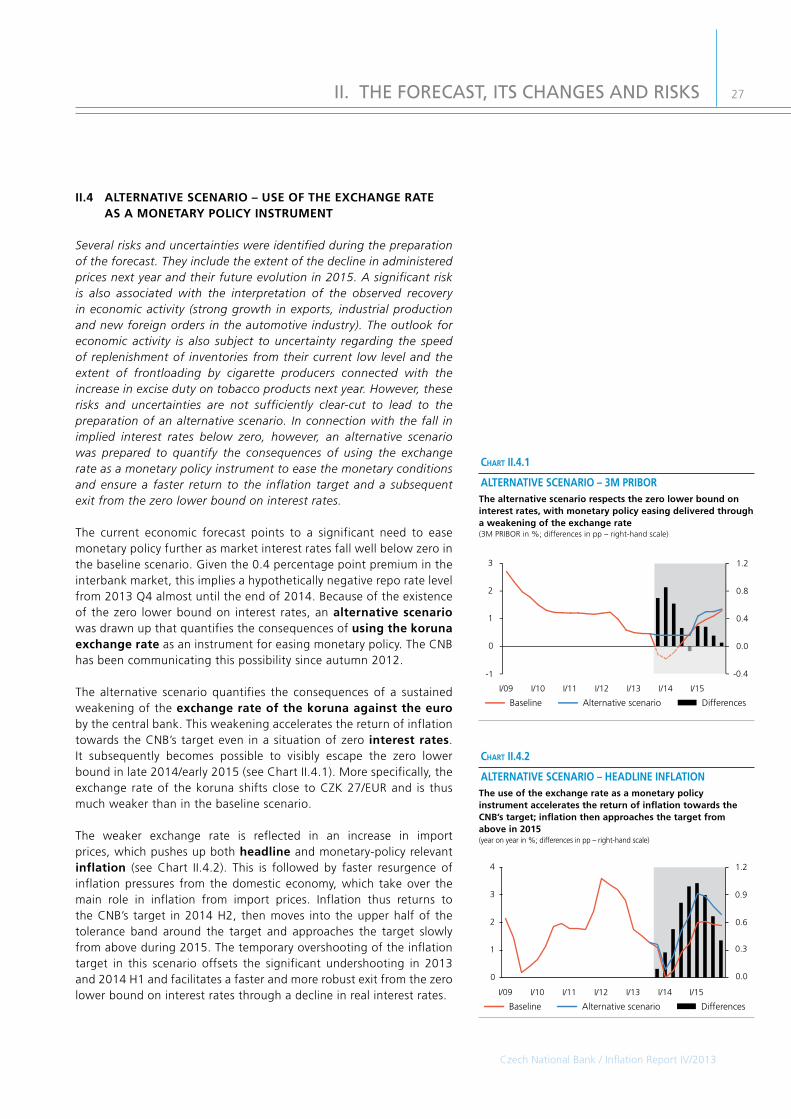
Czech National Bank / Inflation Report IV/2013
27
II.4ALTERNATIVESCENARIO–USEOFTHEEXCHANGERATEASAMONETARYPOLICYINSTRUMENT
Several risks and uncertainties were identified during the preparation of the forecast. They include the extent of the decline in administered prices next year and their future evolution in 2015. A significant risk is also associated with the interpretation of the observed recovery in economic activity (strong growth in exports, industrial production and new foreign orders in the automotive industry). The outlook for economic activity is also subject to uncertainty regarding the speed of replenishment of inventories from their current low level and the extent of frontloading by cigarette producers connected with the increase in excise duty on tobacco products next year. However, these risks and uncertainties are not sufficiently clear-cut to lead to the preparation of an alternative scenario. In connection with the fall in implied interest rates below zero, however, an alternative scenario was prepared to quantify the consequences of using the exchange rate as a monetary policy instrument to ease the monetary conditions and ensure a faster return to the inflation target and a subsequent exit from the zero lower bound on interest rates.
The current economic forecast points to a significant need to ease monetary policy further as market interest rates fall well below zero in the baseline scenario. Given the 0.4 percentage point premium in the interbank market, this implies a hypothetically negative repo rate level from 2013 Q4 almost until the end of 2014. Because of the existence of the zero lower bound on interest rates, an alternativescenario was drawn up that quantifies the consequences of usingthekorunaexchangerate as an instrument for easing monetary policy. The CNB has been communicating this possibility since autumn 2012.
The alternative scenario quantifies the consequences of a sustained weakening of the exchangerateofthekorunaagainsttheeuro by the central bank. This weakening accelerates the return of inflation towards the CNB’s target even in a situation of zero interestrates. It subsequently becomes possible to visibly escape the zero lower bound in late 2014/early 2015 (see Chart II.4.1). More specifically, the exchange rate of the koruna shifts close to CZK 27/EUR and is thus much weaker than in the baseline scenario.
The weaker exchange rate is reflected in an increase in import prices, which pushes up both headline and monetary-policy relevantinflation (see Chart II.4.2). This is followed by faster resurgence of inflation pressures from the domestic economy, which take over the main role in inflation from import prices. Inflation thus returns to the CNB’s target in 2014 H2, then moves into the upper half of the tolerance band around the target and approaches the target slowly from above during 2015. The temporary overshooting of the inflation target in this scenario offsets the significant undershooting in 2013 and 2014 H1 and facilitates a faster and more robust exit from the zero lower bound on interest rates through a decline in real interest rates.
0.0
0.3
0.6
0.9
1.2
0
1
2
3
4
I/10 I/15I/09 I/11 I/12 I/13 I/14
DifferencesAlternative scenarioBaseline
ALTERNATIVESCENARIO–HEADLINEINFLATIONTheuseoftheexchangerateasamonetarypolicyinstrumentacceleratesthereturnofinflationtowardstheCNB’starget;inflationthenapproachesthetargetfromabovein2015(year on year in %; differences in pp – right-hand scale)
Chart II.4.2
-0.4
0.0
0.4
0.8
1.2
-1
0
1
2
3
I/10 I/15I/09 I/11 I/12 I/13 I/14
DifferencesAlternative scenarioBaseline
ALTERNATIVESCENARIO–3MPRIBORThealternativescenariorespectsthezerolowerboundoninterestrates,withmonetarypolicyeasingdeliveredthroughaweakeningoftheexchangerate(3M PRIBOR in %; differences in pp – right-hand scale)
Chart II.4.1
II. THE FORECAST, ITS CHANGES AND RISKS

Czech National Bank / Inflation Report IV/2013
28
Turning to GDP, there are several contrary factors fostering a recovery in economic activity overall in 2014 and, by contrast, reducing economic growth in 2015 (see Chart II.4.3). Although the rise in import prices can be expected to reduce the purchasing power of households, temporarily dampening consumption, household demand is redirected towards domestic goods and services to a greater extent and additionally supported by lower real interest rates as a result of higher inflation expectations. At the same time, the weaker exchange rate supports Czech exports, boosting the competitiveness of corporations and their willingness to invest. The recovery in production then contributes to a rise in employment and wages, increasing the purchasing power of households and thereby also their consumption.Overall, GDP in the alternative scenario rises by 2.1% in 2014, i.e. 0.6 percentage point faster than in the baseline scenario. In 2015, by contrast, economic growth in the alternative scenario is slightly lower than in the baseline scenario.
II. THE FORECAST, ITS CHANGES AND RISKS
-1.2
-0.8
-0.4
-0.0
0.4
0.8
-6
-4
-2
0
2
4
I/10 I/15I/09 I/11 I/12 I/13 I/14
DifferencesAlternative scenarioBaseline
ALTERNATIVESCENARIO–REALGDPEasingmonetarypolicyusingtheexchangerateleadstohighergrowthineconomicactivityintheshortterm(annual percentage changes; differences in pp – right-hand scale)
Chart II.4.3

Czech National Bank / Inflation Report IV/2013
29
II.5FORECASTSBYOTHERENTITIES
Analysts’ inflation expectations declined at the one-year horizon, thus moving significantly below the CNB’s target of 2%, and were very close to the target at the three-year horizon. The indicator of inflation expected by households continued to fall gradually. The analysts expect a decline in GDP this year and a return to economic growth next year. All the analysts were expecting stable key rates before the CNB Bank Board meeting in November. Most of them were also expecting the monetary conditions not to be eased further using foreign exchange interventions. Almost all the analysts expect the koruna to appreciate and the CNB’s 2W repo rate as well as market interest rates to be flat in the following 12 months. The market rate outlook one year ahead also indicates expectations of broad stability and is considerably higher than the interest rate path consistent with the new CNB forecast over the entire forecast horizon as a result of interest rates having reached the zero lower bound.
Inflationexpectedby financialmarketanalystsat the one-year horizon has been below the CNB’s target since the start of 2013 and fell significantly below the target in October. The inflation expectations of business managers decreased close to the CNB’s target of 2% (see Table II.5.1). The inflation expected by analysts at the three-year horizon was also very close to the target.
The indicator of inflation perceived by households has been slightly positive since the end of 2011 (see Chart II.5.1). This means that households on average felt that prices rose moderately over the last 12 months. The indicator of expectedinflation is also positive, but is continuing to follow a gradual downward trend. This suggests that the number of respondents who expect prices to rise more rapidly over the next 12 months exceeds to a steadily decreasing extent the number of those who expect prices to stay the same or increase more slowly than in the recent past.
BoththeFMIEandCFanalysts expect GDP to fall by around 1% this year (see Table II.5.1 and Table II.5.2). Next year the economy should expand by almost 2%, and wage growth should also accelerate from this year’s very subdued levels. Compared to the average koruna exchange rate so far in October 2013, the analysts participating in both the FMIE and the CF expect the exchange rate to be stronger at the one-year horizon (by 2.3% and 1.1% respectively). Before the CNB Bank Board meeting in November, all 13 FMIE analysts were expecting no changes in key interest rates at this meeting. At the same time, most of them were expecting the monetary conditions not to be eased further using foreign exchange interventions.12 A large majority of the analysts also expect rates to remain flat at the current level at the one-year horizon. Their estimates for the 2W repo rate lie in the range of 0.05–0.25%.
12 Three analysts regarded foreign exchange interventions as possible, one of them with a probability of 50%.
table II.5.1
6/13 7/13 8/13 9/13 10/13
FMIE:
CPI 1.6 1.6 1.7 1.7 1.4
CPI, 3Y horizon 2.1 2.1 2.0 2.1 2.1
Real GDP in 2013 -0.7 -0.8 -0.9 -0.9 -0.9
Real GDP in 2014 1.8 1.7 1.8 1.8 1.8
Nominal wages in 2013 1.5 1.1 1.0 0.8 0.7
Nominal wages in 2014 2.8 2.5 2.5 2.5 2.5
CZK/EUR exchange rate (level)
25.1 25.2 25.3 25.1 25.1
2W repo rate (in per cent) 0.1 0.1 0.1 0.1 0.1
1Y PRIBOR (in per cent) 0.9 0.9 0.9 0.9 0.9
Corporations:
CPI 2.3 2.1
EXPECTEDINDICATORSOFFMIEANDCORPORATIONSTheinflationexpectationsofanalystsattheone-yearhorizonweresignificantlybelowtheCNB‘starget(at 1Y; annual percentage changes unless otherwise indicated)
table II.5.2
6/13 7/13 8/13 9/13 10/13
Real GDP in 2013 -0.7 -0.9 -0.9 -1.0 -1.0
Real GDP in 2014 1.7 1.8 1.7 1.8 1.8
Nominal wages in 2013 1.5 1.0 1.0 0.8 0.9
Nominal wages in 2014 2.7 2.6 2.5 2.6 2.7
CZK/EUR exchange rate (level) 25.5 25.3 25.3 25.4 25.4
3M PRIBOR (in per cent) 0.6 0.6 0.5 0.5 0.5
CFEXPECTEDINDICATORSTheCFanalystsexpecttheeconomytoexpandnextyearfollowingafallinGDPthisyear(at 1Y; annual percentage changes unless otherwise indicated)
Next 12 monthsLast 12 months
1/09 1/10 1/12 1/131/11-100
-75
-50
-25
0
25
50
75
100
PERCEIVEDANDEXPECTEDINFLATIONTheinflationexpectationsofhouseholdsdecreasedslightlyfurtherin2013Q3(source: European Commission Business and Consumer Survey)
Chart II.5.1
II. THE FORECAST, ITS CHANGES AND RISKS

Czech National Bank / Inflation Report IV/2013
30
Overall, compared to the CNB’s new forecast, the analysts expect roughly the same decline in real GDP this year, but next year they expect the economy to grow at a slightly higher pace than predicted by the CNB. Inflation expected by the analysts at the one-year horizon is just above the CNB forecast. The exchange rate at the one-year horizon is stronger in the analysts’ predictions than in the CNB forecast. The analysts’ expectations regarding the 2W repo rate and market rates at the one-year horizon are roughly at the level implied by the 3M PRIBOR path consistent with the new CNB forecast. However, at the shorter end the CNB forecast is considerably lower than the analysts’ outlooks, falling to (hypothetically) negative territory.
Chart II.5.2 provides a comparisonofexpected3Mmarketratesderived from FRA quotations and the interest rate path consistent with the new CNB forecast. The current market outlook for 3M rates implies broad stability at least until 2014 Q3, roughly in line with the prevailing expectations of monetary policy rates being left at technical zero with an unchanged money market premium. The market outlook is considerably higher than the interest rate path consistent with the new CNB forecast over the entire horizon. The market outlook reflects the zero lower bound on monetary policy rates, while the hypothetically negative interest rates in the CNB forecast point to a significant need to ease monetary policy using other instruments.
II. THE FORECAST, ITS CHANGES AND RISKS
I/14IVIII/13 IIIII
Market rates a)CNB forecast
-0.50
-0.25
0.00
0.25
0.50
FRARATESVERSUSTHECNBFORECASTTheFRArateoutlookisconsiderablyhigherthantheratesconsistentwiththeCNBforecastovertheentirehorizonasaresultofinterestrateshavingreachedthezerolowerbound(percentages)
Chart II.5.2
a) for 2013 Q3 and 2013 Q4 the 3M PRIBOR and for 2014 Q1–2014 Q3 the average values of the FRA 3*6, 6*9 and 9*12 rates for the last 10 trading days as of 25 October 2013
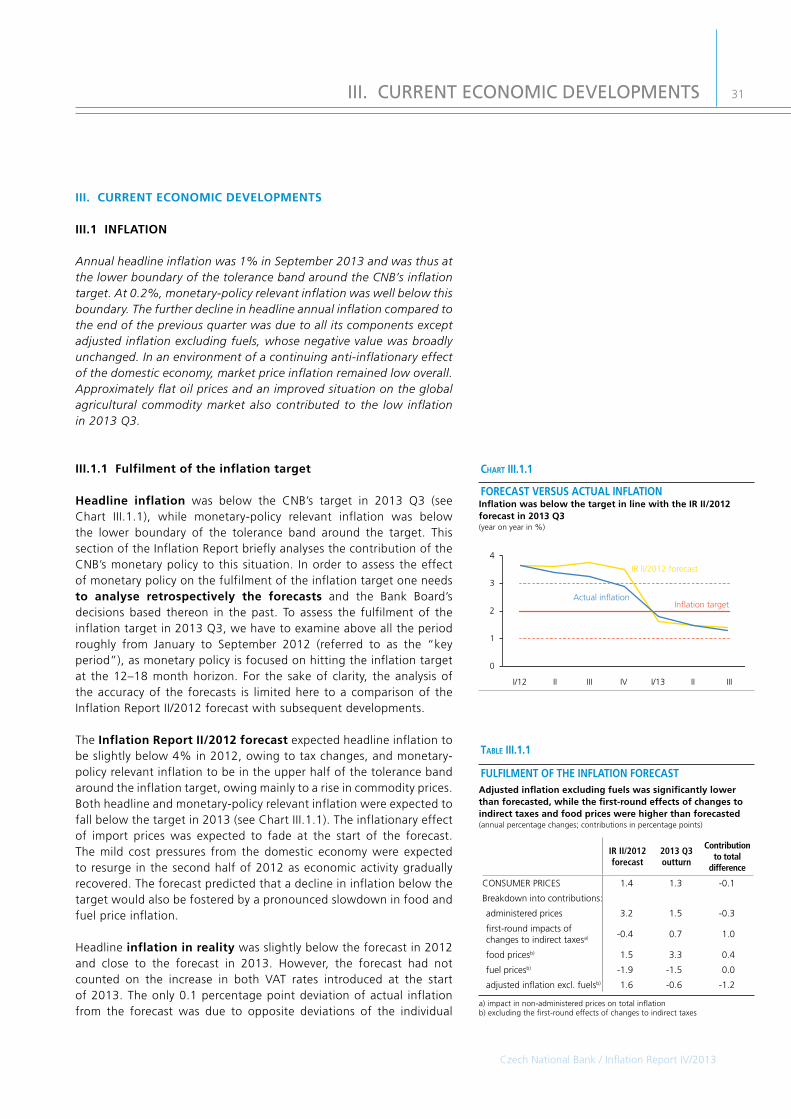
Czech National Bank / Inflation Report IV/2013
31
III.CURRENTECONOMICDEVELOPMENTS
III.1INFLATION
Annual headline inflation was 1% in September 2013 and was thus at the lower boundary of the tolerance band around the CNB’s inflation target. At 0.2%, monetary-policy relevant inflation was well below this boundary. The further decline in headline annual inflation compared to the end of the previous quarter was due to all its components except adjusted inflation excluding fuels, whose negative value was broadly unchanged. In an environment of a continuing anti-inflationary effect of the domestic economy, market price inflation remained low overall. Approximately flat oil prices and an improved situation on the global agricultural commodity market also contributed to the low inflation in 2013 Q3.
III.1.1Fulfilmentoftheinflationtarget
Headline inflation was below the CNB’s target in 2013 Q3 (see Chart III.1.1), while monetary-policy relevant inflation was below the lower boundary of the tolerance band around the target. This section of the Inflation Report briefly analyses the contribution of the CNB’s monetary policy to this situation. In order to assess the effect of monetary policy on the fulfilment of the inflation target one needs to analyse retrospectively the forecasts and the Bank Board’s decisions based thereon in the past. To assess the fulfilment of the inflation target in 2013 Q3, we have to examine above all the period roughly from January to September 2012 (referred to as the “key period”), as monetary policy is focused on hitting the inflation target at the 12–18 month horizon. For the sake of clarity, the analysis of the accuracy of the forecasts is limited here to a comparison of the Inflation Report II/2012 forecast with subsequent developments.
TheInflationReportII/2012forecastexpected headline inflation to be slightly below 4% in 2012, owing to tax changes, and monetary-policy relevant inflation to be in the upper half of the tolerance band around the inflation target, owing mainly to a rise in commodity prices. Both headline and monetary-policy relevant inflation were expected to fall below the target in 2013 (see Chart III.1.1). The inflationary effect of import prices was expected to fade at the start of the forecast. The mild cost pressures from the domestic economy were expected to resurge in the second half of 2012 as economic activity gradually recovered. The forecast predicted that a decline in inflation below the target would also be fostered by a pronounced slowdown in food and fuel price inflation.
Headlineinflationinrealitywas slightly below the forecast in 2012 and close to the forecast in 2013. However, the forecast had not counted on the increase in both VAT rates introduced at the start of 2013. The only 0.1 percentage point deviation of actual inflation from the forecast was due to opposite deviations of the individual
III. CURRENT ECONOMIC DEVELOPMENTS
IR II/2012 forecast
Actual inflationInflation target
I/12 II IIIII IIII/13IV
0
1
2
3
4
ForeCaSt VerSUS aCtUal INFlatIoNInflationwasbelowthetargetinlinewiththeIRII/2012forecastin2013Q3(year on year in %)
Chart III.1.1
a) impact in non-administered prices on total inflationb) excluding the first-round effects of changes to indirect taxes
table III.1.1
IR II/2012 forecast
2013 Q3 outturn
Contribution to total
difference
CONSUMER PRICES 1.4 1.3 -0.1
Breakdown into contributions:
administered prices 3.2 1.5 -0.3
first-round impacts of changes to indirect taxesa) -0.4 0.7 1.0
food pricesb) 1.5 3.3 0.4
fuel pricesb) -1.9 -1.5 0.0
adjusted inflation excl. fuelsb) 1.6 -0.6 -1.2
FULFILMENTOFTHEINFLATIONFORECASTAdjustedinflationexcludingfuelswassignificantlylowerthanforecasted,whilethefirst-roundeffectsofchangestoindirecttaxesandfoodpriceswerehigherthanforecasted(annual percentage changes; contributions in percentage points)

Czech National Bank / Inflation Report IV/2013
32
components of inflation. Lower adjusted inflation excluding fuels, reflecting anti-inflationary domestic pressures, and, to a lesser extent, administered prices, fostered lower inflation. VAT changes not expected by the forecast and higher food prices affected inflation in the opposite direction (see Table III.1.1). The observed developments thus to some extent matched the characteristics of the alternative scenario contained in the Inflation Report II/2012 forecast, which had expected an increase in both VAT rates and slightly lower monetary-policy relevant inflation. However, they were more anti-inflationary than in that scenario.
External economic factors contributed significantly to domestic inflation. External economic activity at first grew faster than forecasted and then, from the end of 2012, decreased by more than expected (see Table III.1.2). External production prices also grew faster than expected in 2012, but their growth rate was well below the forecast at the start of 2013. Foreign interest rates reacted to the escalation of the European debt crisis and the worse outlook for economic activity and were far below the expected path. The effect of external developments was slightly anti-inflationary overall and acted in the direction of much lower domestic interest rates from the end of 2012 onwards.
Domestic interestratesandtheexchangeratealso differed from the forecast. Market interest rates declined in response to a reduction in the CNB’s rates, whereas the forecast had not expected them to fall markedly (see Table III.1.3). The exchange rate was lower than predicted over the entire forecast period, owing – among other things – to CNB communication and subdued external demand.
Based on the CNB’s current knowledge, the developments sincethe forecast under review was drawn up can be summed up in the following way. Domestic economic activity was much lower than forecasted for almost the entire period owing to significantly lower external demand growth since the end of 2012 because of the euro area debt crisis. Subdued domestic demand in reaction to the uncertainty surrounding future developments and the impacts of domestic fiscal consolidation also had an adverse effect. These factors were reflected above all in an unexpected fall in consumption and investment and also in slower wage growth. Export and import volumes also lagged behind the forecast. The comparison of the current data on the GDP growth structure with the forecast is also affected by substantial revisions to the national accounts. These factors were only partly offset by easier domestic monetary conditions in both the interest rate and exchange rate components.
In addition to the forecast, an assessment of the risks associated with this forecast is important for the Bank Board’s decisions onmonetarypolicy rates. At the 2012 Q1 meetings, the risks to the forecast were assessed as being balanced. In 2012 Q2, the risks to the forecasts were assessed as being inflationary for headline inflation, or skewed towards the alternative scenario (which expected lower
III. CURRENT ECONOMIC DEVELOPMENTS
p – prediction, o – outturna) at constant pricesb) seasonally adjustedc) IR II/2012 outlook for effective indicator
table III.1.2
II/12 III/12 IV/12 I/13 II/13 III/13
GDP in euro areaa), b), c) p 0.5 0.2 0.4 0.9 1.4 1.9
o 0.9 0.8 0.3 -0.2 0.3 -
PPI in euro areab), c) p 2.0 2.0 2.1 1.7 2.0 2.3
o 2.3 2.2 2.2 1.3 0.2 -
3M EURIBOR p 0.8 0.7 0.7 0.7 0.7 0.8
(percentages) o 0.7 0.4 0.2 0.2 0.2 0.2
USD/EUR exchange rate p 1.32 1.29 1.29 1.29 1.29 1.28
(levels) o 1.28 1.25 1.30 1.32 1.31 1.32
Brent crude oil price p 123.1 118.5 116.7 115.0 113.2 111.4
(USD/barrel) o 108.7 109.9 110.5 112.8 103.3 109.7
FULFILMENTOFTHEEXTERNALASSUMPTIONSExternalfactorshadaslightdownwardeffectondomesticinflation(annual percentage changes unless otherwise indicated)
p – prediction, o – outturna) seasonally adjustedb) in the business sector
table III.1.3
II/12 III/12 IV/12 I/13 II/13 III/13
3M PRIBOR p 1.1 0.9 0.8 0.7 0.8 1.0
(percentages) o 1.2 1.0 0.6 0.5 0.5 0.5
CZK/EUR exchange rate p 24.7 24.6 24.5 24.4 24.3 24.3
(levels) o 25.3 25.1 25.2 25.6 25.8 25.9
Real GDPa) p -0.1 -0.1 0.3 0.9 1.4 2.3
(annual perc. changes) o -1.1 -1.4 -1.6 -2.4 -1.3 -
Nominal wagesb) p 2.8 2.9 3.1 3.4 3.7 4.0
(annual perc. changes) o 2.2 1.6 4.0 -0.5 1.1 -
FULFILMENTOFTHEFORECASTFORKEYVARIABLESObservedGDPgrowthwaswellbelowtheforecastthroughouttheperiod

Czech National Bank / Inflation Report IV/2013
33
monetary-policy relevant inflation and interest rates than the baseline scenario). At its June meeting the CNB Board lowered the 2W repo rate by 0.25 percentage point. In 2012 Q3, the risks to the forecast were assessed as being balanced or on the downside; the 2W repo rate was lowered by 0.25 percentage point at the September meeting.
Overall, monetary policy in the key period can be assessed as follows. Market interest rates declined in response to the CNB’s rate cuts. However, based on current knowledge, it seems that the monetary policy pursued between January and September 2012 should have been substantially easier. Headline inflation was below the target in 2013 Q3 despite strong impacts of tax changes, while monetary-policy relevant inflation was below the lower boundary of the tolerance band around the CNB’s target. Most of the identified risks materialised in the key period, with anti-inflationary risks prevailing overall.
III.1.2Currentinflation
Annualinflation13 decreased further in 2013 Q3. At 1% in September, it was 0.6 percentage point lower than at the end of the previous quarter (see Chart III.1.2). The slowdown in annual consumer price inflation was due to all components of inflation except adjusted inflation excluding fuels, which was approximately flat in the period under review (see Chart III.1.3).
Turning to thestructureofannualinflation, inflation continued to be affected in 2013 Q3 mainly by administrative factors, i.e. changes to indirect taxes and administered prices. However, the contribution of administered prices to inflation decreased. The contribution of market prices to overall annual consumer price inflation also fell, mainly because of weaker annual growth in food prices, although their contribution to inflation remained significant (see Chart III.1.4).
Owing to an increase in both VAT rates of one percentage point and a rise in excise duty on tobacco products at the start of this year, indirect taxes contributed about 0.7 percentage point to annual market price inflation in 2013 Q3. The overall first-round effect of tax changes on inflation including administered prices was roughly 0.8 percentage point. Monetary-policyrelevantinflation, i.e. inflation adjusted for the first-round effects of all the changes to indirect taxes, was therefore well below annual headline inflation again and stood at 0.2% in September (see Chart III.1.2). It was thus far below the lower boundary of the tolerance band around the CNB’s target.
Annual administered price inflation slowed to 1.5% in 2013 Q3 (including the effect of the VAT changes; see Chart III.1.3), thanks mainly to a fall in prices of gas for households in July. Annual growth
13 Measured by year-on-year growth in consumer prices.
III. CURRENT ECONOMIC DEVELOPMENTS
-8
-6
-4
-2
0
2
4
6
8
-25-20-15-10-50510152025
1/09 1/10 1/11 1/12 1/13
Administered prices (right-hand scale)
Food pricesAdjusted inflation excluding fuels
Fuel prices (right-hand scale)
INFLATIONCOMPONENTSFoodandadministeredpricescontributedinparticulartothedecreaseininflationin2013Q3(annual percentage changes; excluding indirect tax changes)
Chart III.1.3
Monetary-policy relevant inflationConsumer price inflation
1/09 1/10 1/11 1/12 1/13
-1
0
1
2
3
4
INFLATIONInflationdecreasedfurtherin2013Q3(year on year in %)
Chart III.1.2

34
in heat prices and administered prices in health care also decreased noticeably in this period. The main factor behind the fall in prices of gas and heat for households was the long-running decline in world natural gas and coal prices (see also Box 4 in section III.7), which strongly affected final housing-related energy prices amid tougher competition between distributors. The overall contribution of energy prices to headline inflation was negligible in 2013 Q3, as the year-on-year decline in gas prices was almost offset by a continuing rise in electricity prices and slowing year-on-year growth in heat prices. Annual administered price inflation was thus affected most strongly by still fast growing water supply and sewerage collection charges and waste collection charges. The following text assesses the evolution of the main components of market price inflation adjusted for the tax changes.
Annualmarketprice inflation, as measured by net inflation, slowed in 2013 Q3 (to 0.2% in September). The decline in net inflation was due to weaker annual growth in food prices and a stronger decline in fuel prices, whereas adjusted inflation excluding fuels was broadly flat in Q3.
The evolution of annual net inflation thus continued to indicate a persisting anti-inflationary effect of subdued domestic economic activity and slow growth in wages. Low net inflation was also fostered by a significant year-on-year slowdown in import prices of energy commodities. Import prices of final products for the consumer market continued rising (albeit modestly), owing to year-on-year depreciation of the koruna against the euro. The effect of food prices, which pushed net inflation upwards most strongly, weakened noticeably in 2013 Q3, thanks mainly to prices of agricultural commodities.
The renewed slowdown in annual foodprice inflation in 2013 Q3 (from 4.1% in June to 2.7% in September; see Chart III.1.5) was associated above all with a halt in annual agricultural producer price inflation connected with this year’s favourable harvest. A particularly marked slowdown was observed for vegetable and fruit prices, whose year-on-year growth was roughly half that in June.
As in previous quarters, the effect of subdued economic activity, slow wage growth and low consumer demand was most apparent in annualadjusted inflationexcludingfuels, whose negative values remained roughly at the previous quarter’s level in 2013 Q3 (-0.7% in September; see Chart III.1.6). This stagnation was a result of contrary movements in its two main components. A moderation of the annual decline in prices of other tradable commodities excluding food and fuels was fostered mainly by a renewed increase in prices in the clothing and footwear category. On the other hand, prices of other non-tradable commodities switched to a slight year-on-year decline for the first time since this price index started to be measured, mainly because of a year-on-year decline in prices of communication services and weaker price growth in some other items. From the perspective of macroeconomic factors, this reflects the business cycle and
Czech National Bank / Inflation Report IV/2013
III. CURRENT ECONOMIC DEVELOPMENTS
-6-5-4-3-2-101234
1/09 1/11 1/12 1/131/10
Prices of non-tradables (except administered prices)Prices of other tradables (except food and fuels)
Adjusted inflation (except fuels)
ADJUSTEDINFLATIONEXCLUDINGFUELSAdjustedinflationexcludingfuelswasmoreorlessflatin2013Q3(annual percentage changes)
Chart III.1.6
-10-8-6-4-202468
10
1/09 1/10 1/11 1/12 1/13
Food prices (including indirect tax changes)Food prices (excluding indirect tax changes)Producer prices in manufacture of food, beverages and tobaccoAgricultural producer prices (right-hand scale)
-40
-20
0
20
40
FOODPRICESFoodpriceinflationslowednoticeablyin2013Q3(annual percentage changes)
Chart III.1.5
Annual consumer price inflation (in per cent)
Administered pricesIndirect taxes in non-administered pricesFood prices (including alcoholic beverages and tobacco)
Adjusted inflation excluding fuels and food
Fuel prices
1/12 3 5 7 1/139 7 911 3 5
-1
0
1
2
3
4
STRUCTUREOFINFLATIONThecontributionofmarketpricestoinflationdecreased,mainlyduetofoodprices;thecontributionofadministeredpricesalsoshrank(annual percentage changes; contributions in percentage points)
Chart III.1.4

35
a decrease in the contribution of the Balassa-Samuelson effect owing to a slowdown in long-term convergence to advanced countries.
Fuelpricesfollowed the oil and petrol price volatility on global markets in 2013 Q3. Their decline deepened in year-on-year comparison (from -1.6% in June to -3.9% in September; see Chart III.1.3).
III. CURRENT ECONOMIC DEVELOPMENTS
Czech National Bank / Inflation Report IV/2013

Czech National Bank / Inflation Report IV/2013
36
III.2IMPORTPRICESANDPRODUCERPRICES
The continuing decline in import prices in the first two months of 2013 Q3 was due mostly to a significant fall in prices of imported energy and non-energy commodities associated with commodity price developments on global markets. Import prices of semi-finished products and commodities with a higher degree of processing also showed a modest decline. Increases were recorded only for prices of imported food and final products for the consumer market. Industrial producer price inflation remained low in 2013 Q3. Owing to falling commodity prices and persisting low demand, branches with falling or only slightly rising prices were predominant. Agricultural producer prices started to edge down in August. The year-on-year decline in construction work prices and prices of market services in the business sector continued amid persisting low domestic demand.
III.2.1Importprices
The modest annual decline in importprices which started in May this year continued in July and August (see Chart III.2.1). According to the latest data for August, import prices fell by 1.4% year on year. With the exception of food, live animals, beverages and tobacco and final products for the consumer market, import prices went down in all the main categories under review, and most of all in the categories of non-energy commodities and mineral fuels.
Import prices were most strongly affected in the first two months of 2013 Q3, by the high-weight import prices of mineral fuels, which have been falling year on year since the start of 2013 (down by 9.7% in August; see Chart III.2.2). Their negative contribution to annual import price inflation was 1.6 percentage points in August. The year-on-year decline in prices of imported mineral fuels was due in large part to natural gas prices. Import prices of mineral fuels were also strongly affected by volatile dollar prices of oil, which increased unexpectedly in June and July because of an escalation of the risks associated with the situation in the Middle East (see Chart III.2.3), but fell back again in August. The decline in import prices of mineral fuels was also due to year-on-year appreciation of the koruna against the dollar in July and August (see Chart III.2.3).14
The year-on-year decline in import prices of non-energycommodities, which has been observed for more than a year now, moderated to -7.2% in August. However, the contribution of these prices to annual import price inflation was negligible due to their low weight. Import prices of semi-finished products, whose year-on-year changes fluctuated around zero in 2013 Q1 and Q2, showed weak growth in August (see Table III.2.1). The year-on-year fall in import prices was
14 The koruna-dollar exchange rate appreciated by 4.4% and 3.9% year on year respectively in July and August.
III. CURRENT ECONOMIC DEVELOPMENTS
Import prices, total (annual percentage changes)
Non-energy commoditiesCommodities with a high degree of processing
Mineral fuels, lubricants and related materialsSemi-finished products
Food and live animals
95 7 73 531/12 1/1311
-4
-2
0
2
4
6
8
IMPORTPRICESImportpricesofmineralfuelswerethebiggestcontributortothedeclineinimportprices(annual percentage changes; contributions in percentage points)
Chart III.2.2
Construction work pricesIndustrial producer pricesMarket services prices
Import prices
Agricultural producer prices (right-hand scale)
1/09 1/11 1/12 1/131/10
-10
-5
0
5
10
-40
-20
0
20
40
IMPORTPRICESANDPRODUCERPRICESImportpricesdeclinedin2013Q3,industrialproducerpriceinflationwassubduedandagriculturalproducerpricesstartededgingdowninAugust(annual percentage changes)
Chart III.2.1
Natural gasBrent crude oilImport prices of mineral fuels, lubricants and related materials
CZK/USD exchange rate
1/09 1/11 1/12 1/131/10
-80
-60
-40
-20
0
20
40
60
80
100
MINERALFUELSPricesofimportedmineralfuelsandlubricantswentdownmainlybecauseoffallingglobalpricesofnaturalgasandastrongerkoruna-dollarexchangerate(annual percentage changes)
Chart III.2.3

Czech National Bank / Inflation Report IV/2013
37
also due to import prices of chemicalsand related products, which tend to follow oil price changes on world markets with a short lag.
Only import prices of food and live animals continued to record substantial year-on-year growth, picking up further in July and August to 7.7% and 7% respectively. This high growth was due to a sharp increase in prices of some volatile items on world markets15 and partly also to higher import prices of meat and dairy products. By contrast, global prices of major food commodities of vegetable origin decreased.
Having previously increased, import prices of higher-value-addedcommodities started to edge down year on year in June, mainly because of falling prices in the high-weight category of machinery and transport equipment (see Table III.2.1). However, import prices of final products for the consumer market continued to rise modestly, reflecting the weaker koruna-euro exchange rate and steady price growth abroad.
III.2.2Producerprices
Industrial producer pricesIn 2013 Q3, annual industrial producer price inflation remained at low levels, which have been below 1% since April16 (0.6% in September; see Chart III.2.4). The low annual growth suggests that the anti-inflationary factors were more or less across-the-board in their effect. This is also evidenced by the fact that more than half of the main industries recorded falling prices and only two had noticeably rising prices.
The structure of industrial producer price inflation also shows that the low growth rates were due mainly to a continuing decline in global prices of energy commodities and prices of imported non-energy inputs, and also to slightly falling or flat import prices of semi-finished products. Rising domestic prices of energy (electricity) and water-related services and increasing prices in the food industry (whose growth, however, slowed markedly at the end of 2013 Q3) acted in the opposite direction. Only slight growth in producer prices in other branches of manufacturing confirmed that there is a close link between these prices and the generally subdued demand and falling prices of most of the main production inputs.
The evolution of dollar oil prices was reflected most of all in producer prices in the manufacture of coke and refined petroleumproducts. Following weak growth in July, producer prices in this segment started to fall sharply year on year in August (-6.0% in September; see Chart III.2.6). The annual decline in producer prices in
15 Mainly vegetables, fruit and nuts.16 Except in July, when they increased by 1.1% year on year.
III. CURRENT ECONOMIC DEVELOPMENTS
table III.2.1
5/13 6/13 7/13 8/13
IMPORTS, TOTAL -1.1 -1.9 -1.0 -1.4of which: food and live animals 5.5 5.3 7.7 7.0 beverages and tobacco 9.7 8.7 9.4 9.2 crude materials inedible, except fuels -5.7 -8.5 -8.4 -7.2 mineral fuels and related products -8.8 -7.3 -6.2 -9.7 animal and vegetable oils -8.2 -8.6 -10.5 -10.8 chemicals and related products -2.3 -3.4 -1.3 -1.1 manufactured goods classified chiefly by material 0.1 -2.0 -0.8 0.1
machinery and transport equipment 0.8 -0.7 -0.4 -0.3 miscellaneous manufactured articles 2.2 0.2 1.0 1.3
STRUCTUREOFIMPORTPRICEINFLATIONImportpricesofcrudematerialswentdown,whileimportpricesoffoodandmiscellaneousmanufacturedarticleswentup(annual percentage changes)
Total PPI (annual percentage changes)
Mining and quarrying and power generationManufacture of food, beverages and tobacco
Manufacture of coke and refined petroleum productsManufacture of basic metals and fabricated metal products
Other branches of manufacturing
1/12 3 5 7 9 7 911 1/13 3 5
-2
-1
0
1
2
3
4
5
INDUSTRIALPRODUCERPRICESIndustrialproducerpriceinflationwassubduedin2013Q3(annual percentage changes; contributions in percentage points)
Chart III.2.4
Capital goodsNon-durable consumer goods
Industrial producer pricesDurable consumer goodsEnergy
Intermediate goods
1/09 1/11 1/12 1/131/10-12
-9
-6
-3
0
3
6
9
12
PRODUCERPRICESBYMAININDUSTRIALGROUPINGSPricesofintermediategoodsfellnotably,whilepricesofdurableandnon-durableconsumergoodsrecordedthefastestgrowth(annual percentage changes)
Chart III.2.5

Czech National Bank / Inflation Report IV/2013
38
themanufactureofbasicmetalsandfabricatedmetalproducts slowed gradually in 2013 Q3 (to -1.2% in September). Annual producer price inflation in the foodindustry moderated in 2013 Q3 from around 4% to 2.4% in September as a result of falling prices of domestic agricultural products of vegetable origin (by contrast, prices of livestock products increased).
By contrast, steady inflation has been recorded since the start of 2013 in the electricity,gas, steamandair-conditionedair industries, where prices rose by 3.6% in September. Even faster growth was recorded for prices in the water supply and sewerage-related services industry, which have been showing more or less stable annual growth of just below 6% since the start of 2013.17 Conversely, following a modest rise in 2013 Q2, prices in miningandquarrying switched to a decline, which deepened to -3.6%.
Annual inflation in the otherbranchesofmanufacturing, comprising the manufacture of high-value-added products, was broadly flat in 2013 Q3 (see Chart III.2.4). Prices went down in most branches of manufacturing. Slight or negligible price growth was recorded in just three branches.18
Agricultural producer prices The gradual slowdown in annual agricultural producer priceinflationthis year changed into a slight year-on-year decline in August (see Chart III.2.7). These prices had risen by 4.7% in July, but fell by 0.2% in August and by roughly the same amount in September. This fall was due to prices of crop products. In the first half of this year, their growth rate had exceeded 20%, but a subsequent slowdown in late Q2 and early Q3 changed into a 6.5% year-on-year decline in August. In September, the decline moderated to -4.9%. Livestock product prices showed the opposite trend. Their year-on-year growth rose gradually in 2013 Q3, reaching 7.6% in August.
The falling crop product prices were due mainly to this year’sharvest, particularly of cereals and oil plants. Unlike the very weak 2012 harvest, this year’s was above-average from the long-term perspective both in the Czech Republic and globally. Good harvests were recorded this year primarily in Europe and also in the Black Sea region, whose countries returned to global markets. North America, a major world exporter, also recorded a bigger harvest than last year. All this led to a fall in agricultural commodity prices around the world this year. However, the impact of these factors on agricultural producer prices in the Czech Republic was partly offset by a weaker exchange rate of the koruna.
17 Price agreements in these industries are usually signed for one year.18 In September, prices went up by 1.3% in furniture manufacture and other branches of
manufacturing, by 2.1% in the manufacture of transport equipment and by 0.5% in the manufacture of machinery and equipment.
III. CURRENT ECONOMIC DEVELOPMENTS
Livestock product prices
Agricultural producer pricesCrop product prices
1/09 1/11 1/12 1/131/10-60
-40
-20
0
20
40
60
80
AGRICULTURALPRODUCERPRICESAgriculturalproducerpricesstartedtoedgedowninAugust(annual percentage changes)
Chart III.2.7
Import prices of energy commoditiesProducer prices in manufacture of mineral fuels, lubricants and related materials
Import prices of semi-finished products (right-hand scale)
Producer prices in manufacture of basic metals and fabricated metal products (right-hand scale)
1/09 1/10 1/11 1/12 1/13
-60
-40
-20
0
20
40
60
-30
-20
-10
0
10
20
30
PRICESOFMETALSANDREFINEDPETROLEUMPRODUCTSPricesofcokeandrefinedpetroleumproductsandpricesofbasicmetalsandfabricatedmetalproductscontinuedtofall(annual percentage changes)
Chart III.2.6

Czech National Bank / Inflation Report IV/2013
39
Other producer pricesAmid persisting low construction work demand, pricesofconstructionwork in 2013 Q3 continued to follow the year-on-year decline observed since 2010 (see Chart III.2.8). In 2013 Q3, construction work prices fell by 1.4% year on year. The annual decline in prices of materials and products consumed in the construction industry was insignificant in September, at -0.1%.
The annual decline in pricesofmarketservicesfor the business sector moderated in 2013 Q3 (from -2.5% in June to -1.9% in September; see Chart III.2.8). The biggest price declines were recorded for telecommunication services, storage and road and pipeline transport. However, about half of the branches under review recorded modest price growth. The largest price rises in September were recorded by postal and courier services (8.3%) and by advertising services and market research, which usually show the biggest cyclical fluctuations.
III. CURRENT ECONOMIC DEVELOPMENTS
-3
-2
-1
0
1
2
3
4
Construction work pricesMarket services prices in the business sector
1/09 1/10 1/11 1/12 1/13
OTHERPRICECATEGORIESPricesofconstructionworkandpricesofmarketservicescontinuedtodecline(annual percentage changes)
Chart III.2.8

Czech National Bank / Inflation Report IV/2013
40
III.3DEMANDANDOUTPUT
The year-on-year decline in real GDP moderated to -1.3% in 2013 Q2,19 as economic activity increased by 0.6% in quarter-on-quarter terms thanks to net exports after six quarters of decline. The year-on-year decline was due solely to gross capital formation. By contrast, government consumption and net exports (with export growth overtaking import growth) made a positive contribution to economic activity. On the supply side, value added in manufacturing continued falling year on year, albeit more slowly than in the previous quarter. Positive contributions to year-on-year GDP growth came only from some services. The output gap remained strongly negative.
III.3.1Domesticdemand
The year-on-year decline in domesticdemand deepened noticeably further in 2013 Q2. This was mainly due to change in inventories. The negative contribution of fixed investment was roughly half that of inventories (see Chart III.3.2). The effect of household consumption was neutral. Only government consumption continued to rise, moderating the decline in aggregate domestic demand.
Final consumptionThe decline in householdfinalconsumptionexpenditure observed since the start of last year was replaced by year-on-year stagnation in 2013 Q2 (see Chart III.3.3).20 The adverse trend in household consumption halted thanks mainly to renewed growth in households’ nominal gross disposable income and to year-on-year stagnation in real terms. Gradually rising household confidence also probably boosted household final consumption expenditure in 2013 Q2 (see Chart III.3.6).
Gross nominal disposable income, which is the main source of financing of households’ consumption expenditure, switched back to annual growth in 2013 Q2. In conditions of subdued economic activity, its growth was only modest, however, at 1.2%. With annual inflation falling, its realpurchasingpower21 thus remained virtually unchanged (or decreased by only -0.1%; see Chart III.3.3).
The structure of nominal gross disposable income shows that most of its components, and in particular a year-on-year fall in taxes and social contributions paid, contributed to the annual decline in this income in 2013 Q2 (see Chart III.3.4). However, the contribution of wages and salaries, which are the largest component of households’ gross
19 The assessment of GDP expenditure and sources is based on seasonally adjusted data from the quarterly national accounts revised according to the publication of the annual national accounts for 2012.
20 In quarter-on-quarter terms, however, household consumption decreased slightly after revision of the national accounts.
21 As measured by the household consumption deflator.
III. CURRENT ECONOMIC DEVELOPMENTS
NPISH expenditure
Net exports
Change in inventoriesGross fixed capital formation Government consumptionHousehold consumption
I/13I/10I/09 I/11 I/12
-8
-6
-4
-2
0
2
4
6
STRUCTUREOFANNUALGDPGROWTHThepositivecontributionsofgovernmentconsumptionandnetexportstoGDPdevelopmentswereoutweighedbydeclinesininventoriesandfixedinvestment(contributions in percentage points; seasonally adjusted data)
Chart III.3.2
q-o-q GDP growth (right-hand scale)y-o-y GDP growth
I/09 I/13I/10 I/11 I/12
-4
-3
-2
-1
0
1
2
-8
-6
-4
-2
0
2
4
GROSSDOMESTICPRODUCTTheyear-on-yeardeclineinrealGDPmoderatedsignificantlyin2013Q2(annual and quarterly percentage changes at constant prices; seasonally adjusted data)
Chart III.3.1
Real individual consumption expenditureNominal individual consumption expenditureReal gross disposable incomeNominal gross disposable income
I/12 I/13I/09 I/10 I/11
-6
-4
-2
0
2
4
6
HOUSEHOLDCONSUMPTIONEXPENDITUREBothrealhouseholdexpenditureandrealdisposableincomestagnatedinyear-on-yearterms(annual percentage changes)
Chart III.3.3

Czech National Bank / Inflation Report IV/2013
41
disposable income in terms of volume, was only modest in the period under review, mainly due to weak average wage growth.22
With real disposable income and consumption expenditure stagnating in year-on-year terms, the saving rate of households remained at about 10% in 2013 Q2 (see Chart II.2.18).23
The first half of 2013 thus probably saw a partial change in the consumptionbehaviourofhouseholds compared to the previous year. In 2012, when household disposable income growth had outpaced consumption expenditure growth on average, the saving rate had risen (although quite insignificantly after data revision) and household behaviour had been dominated by the precautionary motive. At the same time, households’ real income and expenditure had decreased year on year. In 2013 Q2, however, it is possible – given the more favourable consumption growth and rather lower saving rate in year-on-year comparison – that improving confidence will affect households’ decision-making.
Consistent with the above developments are the latest CZSO statistics on the structureofhousehold consumption, according to which expenditure on most categories of consumer goods and services decreased in 2012. Increases were recorded only for durable goods purchases. Purchases in this category continued to go up in 2013 H1 and expenditure on services also started to grow. However, the long-running decline in household spending in the other categories continued (see Chart III.3.5).
The latest available leading indicators are sending mixed signals about the possible improvement in household consumption in the near future. Although retail sales rose year on year in both July and August,24 this increase was concentrated almost solely in the automotive segment. Annual growth in sales in the non-motor-vehicle segment fluctuated around zero in both months. On the other hand, the latest results of the CZSO’s October business survey signalled a further noticeable improvement in the consumer confidence indicator (see Chart III.3.6). The survey revealed not only more favourable perceptions of the economic and financial situation among consumers, but also a decline in the intention to save. These changes may be positively reflected in households’ consumption behaviour in the period ahead.
Annual growth in real governmentfinalconsumptionexpenditurerose to 1.8% in 2013 Q2.
22 See section III.4 The labour market. 23 Seasonally adjusted data. The saving rate increased by 0.1 percentage point quarter on
quarter and fell by 0.4 percentage point year on year.24 According to seasonally adjusted data.
III. CURRENT ECONOMIC DEVELOPMENTS
Composite confidence indicatorConsumer confidence indicatorBusiness confidence indicator
I/12 I/13I/09 I/10 I/11
60
70
80
90
100
CONFIDENCEINDICATORSConsumerconfidenceimprovednoticeably(2005 average = 100; source: CZSO)
Chart III.3.6
Social benefits
Other current transfers
Property income
Wages and salaries
Taxes and social contributions
Gross operating surplus and mixed income
Gross disposable income (y-o-y change)
I/10 I/13I/12I/09 I/11
-4
-2
0
2
4
6
8
DISPOSABLEINCOMENominalgrossdisposableincomeswitchedbacktoannualgrowthin2013Q2(annual percentage changes; contributions in percentage points; current prices)
Chart III.3.4
Expenditure on durable goodsExpenditure on semi-durable goodsExpenditure on non-durable goodsExpenditure on services
Household final consumption expenditure (annual percentage changes)
I/12 I/13I/09 I/10 I/11
-4
-3
-2
-1
0
1
2
3
STRUCTUREOFHOUSEHOLDCONSUMPTIONSpendingonnon-durablegoodscontinuedtodecline,whileexpenditureonservicesanddurablegoodsincreased(annual percentage changes; contributions in percentage points; constant prices)
Chart III.3.5

Czech National Bank / Inflation Report IV/2013
42
InvestmentInvestment remained very subdued in 2013 Q2 amid low economic activity and uncertainty among corporations and households regarding future economic developments (see Chart III.3.7). According to seasonally adjusted data, the year-on-year decline in fixedinvestmentreached -5.2% in 2013 Q2.
Investment continued falling in most economic sectors. Financial institutions were alone in recording a minor positive contribution to the year-on-year growth rate of total investment. The annual decline in total investment was mostly due to thenon-financialcorporationssector, although its negative contribution shrank considerably (to -2.9 percentage points; see Chart III.3.7) after deepening significantly in 2013 Q1.25 This was reflected in a noticeable weakening of the year-on-year decline in investment in machinery and equipment (see Chart III.3.8). The still low level of investment activity in the non-financial corporations sector can be viewed above all as a consequence of persisting low demand for its production. The latest CZSO data for July and August indicate a strong year-on-year recovery in new industrial orders, but this will probably not significantly affect corporations’ investment decisions in the near future given the negative output gap and uncertainty about how long the demand recovery will last. Box 3 provides a more detailed analysis of investment by non-financial corporations from the perspective of the form of ownership.
BOX3Comparisonofcorporateinvestmentandemploymentfromtheperspectiveofownershipandreinvestment
The aim of this box is to compare investment and employment by type of ownership of firms (private domestic, foreign) and show the trend in FDI earnings for foreign-controlled firms and the breakdown of those earnings into dividends and reinvested earnings. The behaviour of domestic and foreign corporations is compared using the CZSO’s quarterly financial flow indicators for gross capital formation and employment. The latest available data for 2013 Q2 were used as the reference period for the breakdown of corporations into domestic and foreign.26
Corporateinvestment is monitored by means of acquisitions of tangible and intangible assets, which, assuming a constant share of asset sales,27 can be used as a rough approximation of
25 According to seasonally unadjusted data. 26 To achieve comparability over time, the comparison of domestic and foreign corporations
was made on a constant sample containing 3,086 private corporations that reported complete and reliable data over the entire period of 2004–2013. In all, 1,190 foreign and 1,896 domestic corporations, employing a total of almost 870,000 persons in the period under review, were represented in this sample.
27 Gross fixed capital formation is estimated in the national accounts as the sum of the value of acquisitions of tangible and intangible assets minus the sum of income on the sale of those assets.
III. CURRENT ECONOMIC DEVELOPMENTS
Non-profit institutionsFinancial corporationsGeneral governmentHouseholdsNon-financial corporations
I/12 I/13I/09 I/10 I/11
Gross fixed capital formation (annual percentage changes)
-18
-15
-12
-9
-6
-3
0
3
6
9
INVESTMENTBYSECTORInvestmentwentdowninmostofthemonitoredsectors(annual percentage changes; contributions in percentage points; constant prices)
Chart III.3.7
Intangible fixed assetsOther buildings and structuresDwellingsTransport equipmentOther machinery and equipment
Cultivated assets
I/12 I/13I/09 I/10 I/11
Gross fixed capital formation (annual percentage changes)
-20
-16
-12
-8
-4
0
4
8
FIXEDCAPITALFORMATIONFixedinvestmentdeclinedinallcategoriesexceptintangibleassets(annual percentage changes; contributions in percentage points; constant prices)
Chart III.3.8
Total (acquisition of assets) Non-financial corporations (gross fixed capital formation)
Manufacturing (domestic)Manufacturing (foreign)
Others (domestic)Others (foreign)
I/05 I/06 I/07 I/08 I/09 I/12 I/13I/10 I/11
-40
-20
0
20
40
ACQUISITIONOFASSETSBYCORPORATEOWNERSHIPANDGROSSFIXEDCAPITALFORMATIONForeigncorporationsinmanufacturinghavehadthegreatesteffectoninvestmentinrecentyears(annual percentage changes; contributions in percentage points; current prices)
Chart 1 (box)

Czech National Bank / Inflation Report IV/2013
43
gross fixed capital formation. Chart 1 shows that investment in the sample of corporations under review is affected most significantly by investment by foreign corporations in export-oriented manufacturing, whose contributions have been strongly procyclical in recent years. This is reflected in the fact that the cyclicality of gross fixed capital formation in the Czech Republic is traditionally strongly correlated with external demand. The evolution of employment provides a similar picture to investment (see Chart 2). Domestic corporations tend to contribute to changes in both investment and employment to a much lesser extent. The period after the onset of the economic crisis, when the fall in investment and employment was also significant in domestic corporations, was an exception.
The greater variability of the indicators under review in foreign-controlled corporations probably reflects greater flexibility in both the labour market and production. In addition, FDI is concentrated in more cyclical industries. These two factors are in turn reflected in FDI earnings and their distribution (see Chart 3). FDI earnings fell in absolute terms at the beginning of the financial crisis. The ratio of reinvested earnings to FDI earnings then dropped as well, in line with the data on falling gross fixed capital formation in foreign-controlled corporations. The fall in reinvested earnings was also partly due to an outflow of retained profits at a time of insufficient liquidity in parent companies at the start of the global financial crisis.
The year-on-year decline in fixed investment in the governmentsectoralso shrank by about half in 2013 Q2 (from -9.7% in Q1 to -4.2%). Its negative contribution to the overall year-on-year decline in investment thus dropped below 1 percentage point.
However, the year-on-year decline in fixed investment in the household sector deepened significantly in 2013 Q2 (from -3.8% in Q1 to -9.8%). This was mainly due to investment in dwellings, which switched from modest growth in 2013 Q1 back to negative year-on-year figures (-4.1%; see Chart III.3.9). Uncertain prospects for economic growth and unemployment were again the main cause of the low household demand for investment in dwellings. Developers also showed a cautious approach to new investment in dwellings, as indicated by a continued long-term decline in the number of housing starts. The latest leading indicators signal a moderation of the adverse trends (a slower decline in the number of housing starts and improved consumer confidence), but no major improvement in household investment demand can be expected given the still low economic activity.
The negative contribution of year-on-year growth in changesin inventories to GDP growth also increased in 2013 Q2 (to -2.1 percentage points; see Chart III.3.2). The deeper decline in additions
III. CURRENT ECONOMIC DEVELOPMENTS
Total (employment) Employment in corporate sector
I/05 I/06 I/07 I/08 I/09 I/12 I/13I/10 I/11
Manufacturing (domestic)Manufacturing (foreign)
Others (domestic)Others (foreign)
-10
-8
-6
-4
-2
0
2
4
EMPLOYMENTINCORPORATIONSBYOWNERSHIPANDTOTALEMPLOYMENTEmploymentisusuallyinfluencedmainlybyforeign-controlledcorporations,butalsofellindomesticcorporationsduringthecrisis(annual percentage changes; contributions in percentage points)
Chart 2 (box)
2005 2006 2007 2008 2009 2010 2011 2012
Reinvested earnings DividendsInterestTotalReinvested earnings as % of FDI earnings (right-hand scale)
-120
-80
-40
0
40
80
120
0
10
20
30
40
50
60
FDIEARNINGSANDREINVESTMENTTheratioofreinvestedearningstototalFDIearningshasfallensignificantlysincethebeginningoftheglobalfinancialcrisis(annual percentage changes; share in %)
Chart 3 (box)
Note: Data for 2012 are preliminary.
-40
-30
-20
-10
0
10
20
30
I/13I/09 I/10 I/11 I/12
Housing startsHousing completionsInvestment in dwellings (constant prices)
INVESTMENTINDWELLINGSInvestmentindwellingsdeclinedagain(annual percentage changes)
Chart III.3.9

Czech National Bank / Inflation Report IV/2013
44
to inventories in this quarter was probably a result of the fading effect of cigarette frontloading by producers at the end of 2012 and a decrease in inventories in wholesale trade and in some branches of industry. Given the current unusually low level of inventories, it cannot be ruled out that inventories will be replenished over the forecast horizon. However, according to the latest business survey conducted by the CNB and the Confederation of Industry, no substantial increase in inventories can be expected in the near future.
III.3.2Netexternaldemand
After declining in 2013 Q1, net exports of goods and services28saw renewed year-on-year growth in Q2 (see Chart III.3.10). The net export surplus increased by more than CZK 15 billion year on year. In quarter-on-quarter terms, the growth was even more pronounced (almost CZK 18 billion). The renewed year-on-year growth in net exports was mainly due to the trade surplus, which increased after recording a decline in 2013 Q1. A slight increase in the services surplus also contributed to the growth in net exports. In these circumstances, the contribution of net exports to GDP growth was positive again in 2013 Q2 (1.6 percentage points), unlike in the previous quarter, when it had been slightly negative.
The year-on-year growth in net exports in 2013 Q2 was a result of a renewed lead of export growth over import growth (see Chart III. 3.11).29 The year-on-year decline in total trade turnover continued, but was more moderate than in the previous quarter thanks to the better export results. After a previous decline, totalexports rose again year on year in 2013 Q2 (by 0.6%). This meant an increase of more than 4 percentage points compared to Q1. The renewed year-on-year growth in exports was linked with external demand in the Czech Republic’s major trading partner countries switching from weak decline to very slight growth. As for its structure, the growth in total exports was due in roughly equal measure to exports of goods and exports of services.
Unlike exports, total imports kept falling year on year in 2013 Q2. The year-on-year decline, which moderated only slightly (to -1,6%), was associated with the continued fall in total domestic demand, particularly in commodity imports for investment purposes. By contrast, the moderation of the decline in total imports was due to a slight increase in imports of services.
28 At 2005 prices, seasonally adjusted.29 In 2013 Q1 exports had fallen more significantly year on year than imports, whereas in
2013 Q2 exports rose while imports kept falling.
III. CURRENT ECONOMIC DEVELOPMENTS
I/09 I/12 I/13I/10 I/11
Exports of goods and services Imports of goods and servicesDifference between export growth and import growth (in pp; right-hand scale)
-25-20-15-10-505
10152025
-15
-10
-5
0
5
10
15
EXPORTSANDIMPORTSForeigntradeturnovercontinuedtodecline,althoughatamoremoderatepace(annual percentage changes; percentage points; constant prices; seasonally adjusted data)
Chart III.3.11
Net exports (y-o-y changes in CZK billions)Net exports (q-o-q changes in CZK billions)
I/09 I/13I/10 I/11 I/12
-30
-20
-10
0
10
20
30
40
NETEXPORTSNetexportsincreasedagainyearonyearin2013Q2(seasonally adjusted data; constant prices)
Chart III.3.10

45
III.3.3Output
The year-on-year decline in gross value added at basic prices moderated in 2013 Q2 (to -0.8%; see Chart III.3.12). In quarter-on-quarter terms, value added increased again (by 0.6%) after six quarters of decline. The continued year-on-year decline in gross value added in Q2 was again due the effect of weak demand on performance in most branches. Only three services30 made positive contributions to the year-on-year evolution of gross value added.
The negative contribution of industry to the year-on-year evolution of gross value added moderated considerably in 2013 Q2 (to -0.4 percentage point). This was due to manufacturing, where the year-on-year decline in value added amounted to just -0.5%, representing only a marginal negative contribution to the year-on-year dynamics of gross value added in the quarter under review (-0.1 percentage point; see Chart III.3.12). This change was probably due mainly to a slight recovery in external demand, as direct export sales in industry recorded renewed year-on-year growth (of 3.1% at current prices). The fall in domestic sales remained quite pronounced in 2013 Q2 despite slowing slightly. In contrast to manufacturing, the year-on-year decline in gross value added in the miningandenergysupplysectors intensified significantly and affected gross value added in industry in the opposite direction.
The negative annual dynamics of gross value added in industry weakened further amid a considerably slower real decline in industrialproduction (-2.4%; see Chart III.3.13).31 Output continued to decline year on year in most branches of industry, although this decline was mostly more moderate than in the previous quarter. Manufacture of clothing, manufacture of wood and wood products, manufacture of basic pharmaceutical products and preparations and other manufacturing maintained the output growth observed in the previous quarter. Output growth also picked up in some other, lower-weight branches in 2013 Q2. This means that fewer branches saw worse industrial production growth than in 2013 Q1. The largest fall in production, exceeding 20%, was recorded in mining and quarrying.
The latest available seasonally adjusted data from August signal renewed year-on-year growth in industrial production (of 4.1%; see Chart III.3.13) after a year-long decline. According to the October results of the CZSO’s business survey, the effect of insufficient demand as abarriertogrowthinindustry decreased for the first time since the start of 2012 (see Chart III.3.14).Capacityutilisation increased slightly. At the same time, a year-on-year rise in both foreign and domestic newindustrialorders in the first two months of 2013 Q3 suggests an improvement in the conditions for growth in industrial production in the period ahead (see Chart III.3.15).
30 Specifically, real estate, financial intermediation and insurance and other services according to the CZSO’s national accounts (Sources of Gross Domestic Product).
31 According to seasonally adjusted data.
III. CURRENT ECONOMIC DEVELOPMENTS
None OtherFinancial constraints Material and/or equipment shortagesLabour shortages Insufficient demand
0
20
40
60
80
100
1/09 1/10 1/11 1/12 1/13
BARRIERSTOGROWTHININDUSTRYTheeffectofinsufficientdemandasthemainbarriertogrowthinindustrialproductiondecreasedforthefirsttimeinalongtime(percentages)
Chart III.3.14
Seasonally adjusted data
Production capacity utilisation in industry (in %, right-hand scale)Trend (CZSO)Industrial production
80
90
100
110
120
60
70
80
90
1/09 1/10 1/11 1/131/12
INDUSTRIALPRODUCTIONTheseasonallyadjustedvolumeofindustrialproductionjumpedupwardsinAugust(basic index; year 2010 = 100)
Chart III.3.13
Agriculture, forestry, fishing
Manufacturing
Mining, energyConstructionTrade, hotels, transport
Financial and business activitiesOther service activities
Gross value added at basic prices (annual percentage changes)
I/12 I/13I/10I/09 I/11
-8
-6
-4
-2
0
2
4
6
CONTRIBUTIONSOFBRANCHESTOGVAGROWTHThedeclineingrossvalueaddedslowedinyear-on-yearterms(contributions in percentage points; annual percentage changes)
Chart III.3.12
Czech National Bank / Inflation Report IV/2013
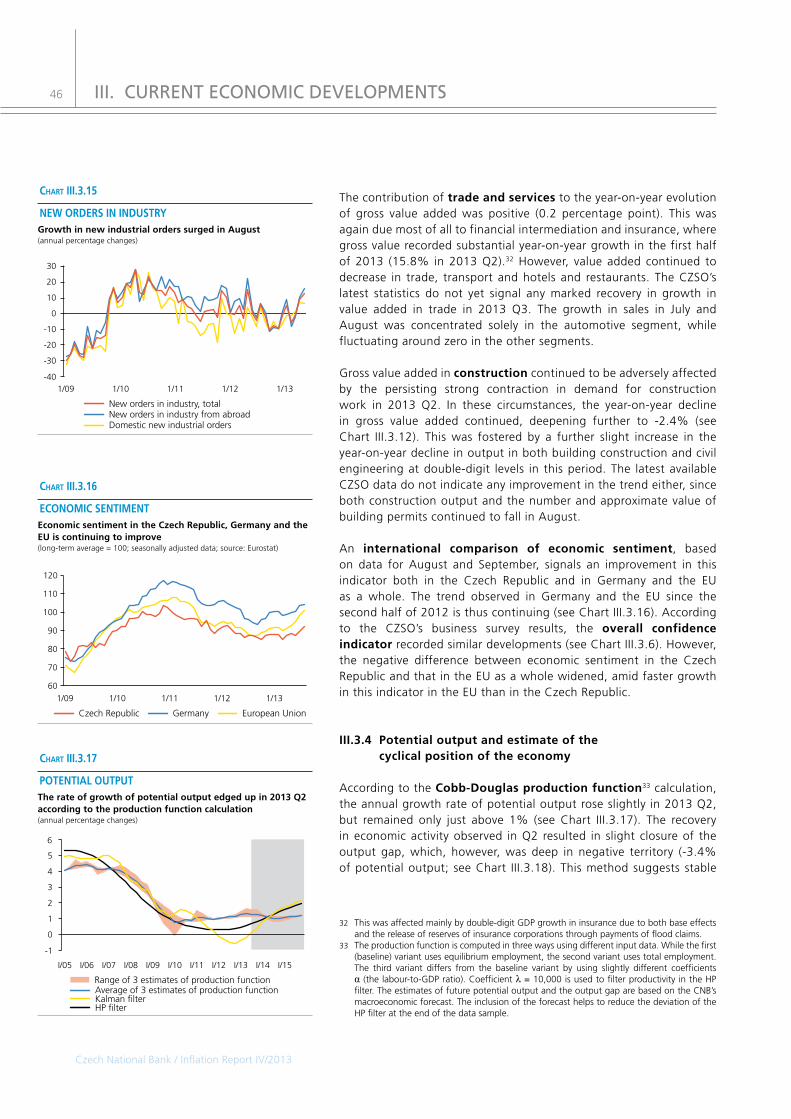
46
The contribution oftradeandservicesto the year-on-year evolution of gross value added was positive (0.2 percentage point). This was again due most of all to financial intermediation and insurance, where gross value recorded substantial year-on-year growth in the first half of 2013 (15.8% in 2013 Q2).32 However, value added continued to decrease in trade, transport and hotels and restaurants. The CZSO’s latest statistics do not yet signal any marked recovery in growth in value added in trade in 2013 Q3. The growth in sales in July and August was concentrated solely in the automotive segment, while fluctuating around zero in the other segments.
Gross value added inconstruction continued to be adversely affected by the persisting strong contraction in demand for construction work in 2013 Q2. In these circumstances, the year-on-year decline in gross value added continued, deepening further to -2.4% (see Chart III.3.12). This was fostered by a further slight increase in the year-on-year decline in output in both building construction and civil engineering at double-digit levels in this period. The latest available CZSO data do not indicate any improvement in the trend either, since both construction output and the number and approximate value of building permits continued to fall in August.
An international comparison of economic sentiment, based on data for August and September, signals an improvement in this indicator both in the Czech Republic and in Germany and the EU as a whole. The trend observed in Germany and the EU since the second half of 2012 is thus continuing (see Chart III.3.16). According to the CZSO’s business survey results, the overall confidenceindicatorrecorded similar developments (see Chart III.3.6). However, the negative difference between economic sentiment in the Czech Republic and that in the EU as a whole widened, amid faster growth in this indicator in the EU than in the Czech Republic.
III.3.4Potentialoutputandestimateofthecyclicalpositionoftheeconomy
According to the Cobb-Douglasproductionfunction33 calculation, the annual growth rate of potential output rose slightly in 2013 Q2, but remained only just above 1% (see Chart III.3.17). The recovery in economic activity observed in Q2 resulted in slight closure of the output gap, which, however, was deep in negative territory (-3.4% of potential output; see Chart III.3.18). This method suggests stable
32 This was affected mainly by double-digit GDP growth in insurance due to both base effects and the release of reserves of insurance corporations through payments of flood claims.
33 The production function is computed in three ways using different input data. While the first (baseline) variant uses equilibrium employment, the second variant uses total employment. The third variant differs from the baseline variant by using slightly different coefficients α (the labour-to-GDP ratio). Coefficient λ = 10,000 is used to filter productivity in the HP filter. The estimates of future potential output and the output gap are based on the CNB’s macroeconomic forecast. The inclusion of the forecast helps to reduce the deviation of the HP filter at the end of the data sample.
Czech National Bank / Inflation Report IV/2013
III. CURRENT ECONOMIC DEVELOPMENTS
Germany European UnionCzech Republic
60
70
80
90
100
110
120
1/09 1/10 1/12 1/131/11
ECONOMICSENTIMENTEconomicsentimentintheCzechRepublic,GermanyandtheEUiscontinuingtoimprove(long-term average = 100; seasonally adjusted data; source: Eurostat)
Chart III.3.16
Range of 3 estimates of production functionAverage of 3 estimates of production functionKalman filterHP filter
I/12 I/13 I/14I/05 I/15I/06 I/07 I/08 I/09 I/10 I/11
-1
0
1
2
3
4
5
6
POTENTIALOUTPUTTherateofgrowthofpotentialoutputedgedupin2013Q2accordingtotheproductionfunctioncalculation(annual percentage changes)
Chart III.3.17
New orders in industry from abroadDomestic new industrial orders
New orders in industry, total
1/09 1/11 1/12 1/131/10-40
-30
-20
-10
0
10
20
30
NEWORDERSININDUSTRYGrowthinnewindustrialorderssurgedinAugust(annual percentage changes)
Chart III.3.15

Czech National Bank / Inflation Report IV/2013
47
annual potential output growth this year, with a renewed gradual recovery at the longer end of the forecast horizon. The output gap should then gradually close as the economy starts to grow again, nearing zero in late 2015.
The breakdown of the contributions of the individual factors entering the production function34 also points to stability compared to 2013 Q1. However, the estimate indicates that the contributions of both capital and employment will gradually shrink over the forecast horizon, while the gradually increasing positive contribution of productivity will offset these effects. Overall, annual growth in potential output in the baseline variant will pick up only slightly to levels of around 1.2% in 2015 (see Chart III.3.19).
An alternative estimate using the HP filter35 indicates noticeably lower potential output growth (0.5% in 2013 Q2) than the production function calculation. Under this method, the output gap is slightly narrower in the near future and the HP filter indicates somewhat earlier closure of the output gap in 2015 amid slightly accelerating potential output growth. The Kalman filter indicates that annual potential output growth should stay negative in 2013 Q2. Over the forecast horizon, however, potential output will start rising again and accelerate above 2% in 2015. Compared to the Cobb-Douglas production function calculation, the Kalman filter also indicates a more moderate opening of the output gap to negative levels at present, but slower closure over the forecast horizon.
34 The baseline variant.35 The estimate using the HP filter used coefficient λ = 1600.
III. CURRENT ECONOMIC DEVELOPMENTS
EmploymentCapitalProductivityPotential output
I/12 I/13 I/14I/05 I/15I/06 I/07 I/08 I/09 I/10 I/11
-1
0
1
2
3
4
5
CONTRIBUTIONSTOPOTENTIALOUTPUTGROWTHThecontributionofproductivitywillgraduallyincreaseovertheforecasthorizon(baseline production function; annual percentage changes)
Chart III.3.19
Range of 3 estimates of production functionAverage of 3 estimates of production functionKalman filterHP filter
I/12 I/14I/13I/05 I/15I/06 I/07 I/08 I/09 I/10 I/11
-6
-4
-2
0
2
4
6
8
OUTPUTGAPTheoutputgapclosedslightlyin2013Q2,butremainssignificantlynegative(in % of potential output)
Chart III.3.18

Czech National Bank / Inflation Report IV/2013
48
III.4THELABOURMARKET
The labour market continued to be affected by the previous contraction in economic activity in 2013 Q2. Total employment and the number of employees increased, but with continuing cuts in hours worked in a number of industries due to low demand, the number of employees converted into full-time equivalents declined further. The general unemployment rate recorded an only marginal annual increase amid slightly higher growth in the labour force than in employment. However, the share of unemployed persons went up more significantly. The slowing decline in economic activity led to a slower decrease in whole-economy labour productivity and lower growth in unit labour costs.
III.4.1Employmentandunemployment
Employment in 2013 Q2 saw a continuation of the upward trend ongoing since the start of the previous year (see Chart III.4.1). Growth in total employment36 picked up further in both year-on-year and quarter-on-quarter comparison (to 1.3% and 0.4% respectively).37 This was due to the category of employees,38 whose growth increased to 2.4%, while the number of entrepreneurs continued to fall year on year.
As in previous quarters, the pronounced rise in the number of employees in 2013 Q2 was due to increased use of alternative forms of employment, especially shorter working hours. This was confirmed by a continued annual decline in the convertednumberofemployees(see Chart III.4.2), which takes into account the average number of hours worked by employees. This indicator, which reflects the cyclical position of the domestic economy better than total employment, fell by 1.2% year on year in 2013 Q2. This decline was attributable to the business sector (industry and construction in particular), since the converted number of employees in the non-business sector increased further.
By cutting hours worked, employers continued to address the issue of adjustment of employment in the face of uncertainty about future demand. In this way they managed to cut labour costs after the previous downturn in production and simultaneously reduce the risk of losing permanent qualified workers, who might be difficult to find during the – now commencing – recovery phase. Shorter hours worked were also used in other cases, especially upon returning to work after parental leave.
36 Employment according to the LFS.37 Seasonally adjusted data. 38 Including members of production cooperatives.
III. CURRENT ECONOMIC DEVELOPMENTS
Average nominal wage in business sectorNominal unit labour costs
Number of people employed in economyNumber of employees (full-time equivalent)
I/09 I/10 I/12 I/13I/11
-8
-6
-4
-2
0
2
4
6
LABOURMARKETINDICATORSThenumberofemployeesconvertedintofull-timeequivalentsdeclinedfurtherin2013Q2,butthenumberofemployedpersonsincreased(annual percentage changes)
Chart III.4.1
Number of employees (full-time equivalent) GDP
I/09 I/13I/10 I/11 I/12
-8
-6
-4
-2
0
2
4
Number of employeesHours worked per employee
NUMBEROFEMPLOYEES(FULL-TIMEEQUIVALENT)Thedeclineinaverageworkinghoursperemployeedeepenedfurther(contributions in percentage points; annual percentage changes)
Chart III.4.2

Czech National Bank / Inflation Report IV/2013
49
The annual rise in employment in 2013 Q2 was almost exclusively due to the tertiary sector, in particular non-market services (see Chart III.4.3), where the number of employed persons increased mainly in public administration and defence and to a lesser extent in health and social care. Growth in employment in market services strengthened and was concentrated mainly in information and communication activities, where the number of employed people increased by more than 20% year on year following a previous decline. The number of people employed in the primarysector (agriculture) also rose, but its share in total annual employment growth was much less significant than that in services (see Chart III.4.3).
However, the number of people employed in the secondarysectordecreased further amid persisting weak domestic and external demand (in construction in particular). The decline in employment in industry, where the annual downturn in output moderated in 2013 Q2, remained at the previous quarter’s level. In construction, however, the deep fall in demand persisted and the decline in employment intensified. According to the latest CZSO data, the decline in the number of employees in industry moderated in July and August 2013 (to -1.2% in August).39 By contrast, a sizeable fall continued in construction, amounting to -8.8% in August.
Only slightly faster growth in the labour force40 than employment in 2013 Q2 resulted in a weak year-on-year rise in the generalunemploymentrate41 (see Chart III.4.4). In quarter-on-quarter terms, it declined to 7% adjusted for seasonal effects. The annual growth in the labour force was due mainly to an increasing participationrate42 in all age groups. The overall participation rate reached a historical high for the Czech Republic (72.9% after seasonal adjustment). The higher participation rate was due among other things to an extension of the retirement age and to demographic developments. According to the July and August figures, the seasonally adjusted unemployment rate remained at 7% and the rate of economic activity was roughly unchanged.
The annual and quarterly growth in the share of unemployedpersons43 continued into 2013 Q2 (see Chart III.4.4). The seasonally adjusted share of unemployed persons increased further to 7.8% in 2013 Q3. This was due to both an increase in the registered unemployed and a continued decline in the population in the given age group.
39 Corporations with 50 employees or more, excluding agency workers.40 The labour force increased most of all in the age group of 60 and over.41 In the 15–64 age category. Measured by the ILO methodology according to the LFS. 42 The participation rate is defined as the ratio of employed and unemployed persons to the
population in each age category.43 The share of persons unemployed is the ratio of available job applicants aged 15–64 to the
population of the same age. It is an MLSA indicator.
III. CURRENT ECONOMIC DEVELOPMENTS
I/13 II/13
-1.0
-0.5
0.0
0.5
1.0
1.5
Tota
l
Agr
icul
ture
Indu
stry
Con
stru
ctio
n
Mar
ket
serv
ices
Non
-mar
ket
serv
ices
EMPLOYMENTBREAKDOWNBYBRANCHESThecontinuinggrowthinemploymentwasdrivenalmostexclusivelybyservices(contributions in percentage points to annual change; selected branches; source: LFS)
Chart III.4.3
Num
ber
of v
acan
cies
Number of people unemployed300 350 400 450 500 550 600
30405060708090
100110120130140150160
1/08
1/09
9/13
9/13
1/12
1/12
1/101/11
480 500 520 540 560 580 60035
37
39
41
43
BEVERIDGECURVEThenumberofunemployedpeopleincreasedfurther(seasonally adjusted numbers in thousands; source: MLSA)
Chart III.4.5
Share of unemployed personsGeneral unemployment rate
I/09 I/10 I/11 I/12 I/13
5
6
7
8
UNEMPLOYMENTRATEThegeneralunemploymentrateincreasedslightlyyearonyearin2013Q2,butdeclinedinquarter-on-quarterterms,unliketheshareofunemployedpersons(percentages; seasonally adjusted data; source: MLSA, CZSO)
Chart III.4.4
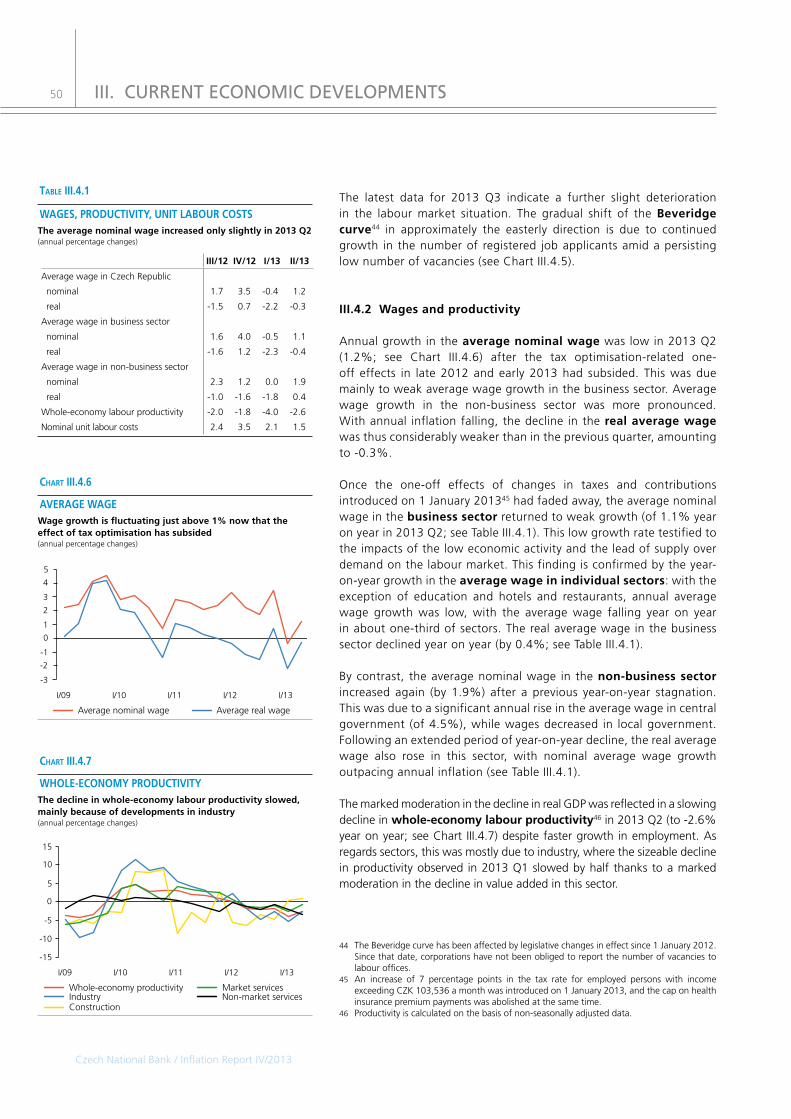
50
The latest data for 2013 Q3 indicate a further slight deterioration in the labour market situation. The gradual shift of the Beveridgecurve44 in approximately the easterly direction is due to continued growth in the number of registered job applicants amid a persisting low number of vacancies (see Chart III.4.5).
III.4.2Wagesandproductivity
Annual growth in the averagenominalwage was low in 2013 Q2 (1.2%; see Chart III.4.6) after the tax optimisation-related one-off effects in late 2012 and early 2013 had subsided. This was due mainly to weak average wage growth in the business sector. Average wage growth in the non-business sector was more pronounced. With annual inflation falling, the decline in therealaveragewage was thus considerably weaker than in the previous quarter, amounting to -0.3%.
Once the one-off effects of changes in taxes and contributions introduced on 1 January 201345 had faded away, the average nominal wage in the businesssector returned to weak growth (of 1.1% year on year in 2013 Q2; see Table III.4.1). This low growth rate testified to the impacts of the low economic activity and the lead of supply over demand on the labour market. This finding is confirmed by the year-on-year growth in theaveragewageinindividualsectors: with the exception of education and hotels and restaurants, annual average wage growth was low, with the average wage falling year on year in about one-third of sectors. The real average wage in the business sector declined year on year (by 0.4%; see Table III.4.1).
By contrast, the average nominal wage in thenon-businesssectorincreased again (by 1.9%) after a previous year-on-year stagnation. This was due to a significant annual rise in the average wage in central government (of 4.5%), while wages decreased in local government. Following an extended period of year-on-year decline, the real average wage also rose in this sector, with nominal average wage growth outpacing annual inflation (see Table III.4.1).
The marked moderation in the decline in real GDP was reflected in a slowing decline in whole-economylabourproductivity46 in 2013 Q2 (to -2.6% year on year; see Chart III.4.7) despite faster growth in employment. As regards sectors, this was mostly due to industry, where the sizeable decline in productivity observed in 2013 Q1 slowed by half thanks to a marked moderation in the decline in value added in this sector.
44 The Beveridge curve has been affected by legislative changes in effect since 1 January 2012. Since that date, corporations have not been obliged to report the number of vacancies to labour offices.
45 An increase of 7 percentage points in the tax rate for employed persons with income exceeding CZK 103,536 a month was introduced on 1 January 2013, and the cap on health insurance premium payments was abolished at the same time.
46 Productivity is calculated on the basis of non-seasonally adjusted data.
III. CURRENT ECONOMIC DEVELOPMENTS
Average real wageAverage nominal wage
I/09 I/12 I/13I/10 I/11
-3
-2
-1
0
1
2
3
4
5
AVERAGEWAGEWagegrowthisfluctuatingjustabove1%nowthattheeffectoftaxoptimisationhassubsided(annual percentage changes)
Chart III.4.6
IndustryWhole-economy productivity
Construction
Market servicesNon-market services
I/09 I/12 I/13I/10 I/11
-15
-10
-5
0
5
10
15
WHOLE-ECONOMYPRODUCTIVITYThedeclineinwhole-economylabourproductivityslowed,mainlybecauseofdevelopmentsinindustry(annual percentage changes)
Chart III.4.7
table III.4.1
III/12 IV/12 I/13 II/13
Average wage in Czech Republic
nominal 1.7 3.5 -0.4 1.2
real -1.5 0.7 -2.2 -0.3
Average wage in business sector
nominal 1.6 4.0 -0.5 1.1
real -1.6 1.2 -2.3 -0.4
Average wage in non-business sector
nominal 2.3 1.2 0.0 1.9
real -1.0 -1.6 -1.8 0.4
Whole-economy labour productivity -2.0 -1.8 -4.0 -2.6
Nominal unit labour costs 2.4 3.5 2.1 1.5
WAGES,PRODUCTIVITY,UNITLABOURCOSTSTheaveragenominalwageincreasedonlyslightlyin2013Q2(annual percentage changes)
Czech National Bank / Inflation Report IV/2013

Czech National Bank / Inflation Report IV/2013
51
These developments in economic activity coupled with a broadly flat volume of wages and salaries were reflected in a further slowdown in annual growth in unit labour costs47 in 2013 Q2 (to 1.5% year on year; see Chart III.4.8). As regards sectors, nominal unit wage costs increased by around 2% in industry and non-market services, where a decline in gross value added was accompanied by a rise in the volume of wages. Nominal unit wage costs declined in construction and market services.
47 The wage cost-output ratio as measured by nominal unit wage costs was calculated on the basis of non-seasonally adjusted data.
III. CURRENT ECONOMIC DEVELOPMENTS
Volume of wages and salaries GDPNominal unit labour costs (annual percentage changes)
I/09 I/12 I/13I/10 I/11
-4
-2
0
2
4
6
8
UNITLABOURCOSTSGrowthinnominalunitlabourcostsslowedfurther(contributions in percentage points; annual percentage changes)
Chart III.4.8

52
III.5FINANCIALANDMONETARYDEVELOPMENTS
The annual growth rate of M2 rose in 2013 Q3. There was continued growth in M1, which remains the only component contributing to M2 growth. Despite a slight pick-up in corporate loan growth, the annual rate of growth of loans to the private sector as a whole remains low, amounting to 3% in August. Growth in loans to households was flat. Household debt increased further as a percentage of income, while growth in the net financial assets of households slowed. The year-on-year decline in new corporate loans moderated. Growth in new loans to households was volatile and was also affected by refinancing and consolidation of old loans. Client interest rates on new loans showed a slight upward tendency in August, while the 3M PRIBOR was flat and long-term financial market rates reached a high for this year. The performance indicators of non-financial corporations improved slightly. Asking prices of older apartments saw a partial recovery. Transaction prices in Prague remained flat, while prices outside Prague continued to go down.
III.5.1Money
The annual growth rate of M2 increased during 2013 Q3, reaching 4.7% in August (see Chart III.5.1). The higher M2 dynamics were fostered by faster growth in corporate deposits. However, M2 growth remains significantly lower than in the pre-crisis period. The annual growth rate of M3 was similar to that of M2 and was about three percentage points higher than the euro area average. With nominal GDP returning to growth, the year-on-year decline in the velocity of M2 slowed in 2013 Q2.
A preference for liquidity maintained the growth rate of M1 at around 8%. Growth in overnight deposits of households and non-financial corporations remained relatively robust. By contrast, the annual growth rate of currency in circulation is only modest, with a slight upward tendency. The decline in short-term deposits (included in M2–M1) slowed as a result of an increase in deposits of non-financial corporations in non-marketable securities included in this category. Long-term deposits continued to decline slowly in an environment of low interest rates (see Chart III.5.2). The spread between the interest rates on short-term deposits and overnight deposits of households decreased.
Turning to thesectorstructure of M2 deposits, the contribution of deposits of non-financial corporations and non-monetary financial institutions (other than insurance companies and pension funds) to M2 growth increased in 2013 Q3. The annual growth rate of deposits of non-financial corporations reached 4.8%. Its increase corresponds primarily with renewed growth in the acid-test ratio of corporations. By contrast, the contribution of household deposits decreased further to a several-year low (see Chart III.5.3). This reflected a slowdown in the annual growth rate of household deposits to 2.7%.
Czech National Bank / Inflation Report IV/2013
III. CURRENT ECONOMIC DEVELOPMENTS
Total deposits included in M2 (annual perc. rates of growth)
1/11 1/134 7 10 1/12 4 7 4 710
HouseholdsNon-financial corporationsNon-monetary financial institutions
-2
0
2
4
6
8
DEPOSITSTRUCTUREOFM2Thecontributionofdepositsofnon-financialcorporationstoM2growthincreasedin2013Q3,whilethatofhouseholdskeptfalling(contributions in percentage points; annual percentage rates of growth)
Chart III.5.3
Long-term depositsOvernight depositsCurrencyOther short-term deposits
1/09 1/10 1/11 1/12 1/13-200
-150
-100
-50
0
50
100
150
200
MAINCOMPONENTSOFM2HighlyliquidmoneyremainedthesolecomponentcontributingtoM2growth,butthedeclineinshort-termdepositsslowed(annual flows in CZK billions)
Chart III.5.2
M2M1M3M2–M1
1/09 1/10 1/11 1/12 1/13
-10
-5
0
5
10
15
MONETARYAGGREGATESTheannualgrowthratesofM2andM3increasedin2013Q3(annual percentage rates of growth)
Chart III.5.1

53
Czech National Bank / Inflation Report IV/2013
III.5.2Credit
The annual growth rate of loanstotheprivatesector increased to 3% in August 2013. This reflected slightly higher growth in corporate loans. According to the bank lending survey, corporations’ demand for loans was almost unchanged in 2013 Q3. On the supply side, credit standards for approving loans also remained broadly unchanged in all major segments of the credit market (see Table III.5.1).48 The survey results are thus consistent with a bottoming-out of the economic cycle.
Loans to non-financial corporations recorded a year-on-year increase of 0.3% in August, after a previous decline. This reflected a slower decline in short-term loans and higher growth in loans with longer maturities (see Chart III.5.4). The growth in loans was fostered by loans provided to the real estate, manufacturing and agriculture sectors amid lower growth in loans to retail trade and a decline in loans to construction firms. The year-on-year decline in new loans to corporations slowed. According to banks, corporations’ demand for loans remained largely unchanged overall in 2013 Q3 (similar developments are expected for the end of this year). Corporations’ efforts to use internal funds to a larger extent had an adverse effect on demand in Q3, while financing of debt restructuring fostered higher demand amid slowing growth in demand for loans to finance mergers and acquisitions and business restructuring. The fall in demand for loans to finance fixed investment came to a halt. The need to finance operations and inventories had a neutral effect on demand.49
Growth in loans has been weak in domestic corporations and foreign-controlledcorporations in recent months (see Chart III.5.5). The growth in loans recorded at the start of this year was fostered mainly by loans to domestic corporations, while the contribution of loans to foreign-controlled corporations was negative. This seems to have reflected the efforts of the latter group of corporations to cut costs and reduce their debt burden, a trend also apparent in the euro area. However, the lower demand for loans was accompanied by increased issuance of debt securities, more so in the case of domestic corporations. According to CZSO data, bond issuance increased by around 81% and 28% year on year in domestic corporations and foreign-controlled corporations respectively in 2013 Q2.
48 In the euro area, according to the bank lending survey for 2013 Q2, the decline in demand for loans in net terms moderated most significantly for loans to households (which in the euro area usually precede real GDP by one quarter on average – ECB Monthly Bulletin, September 2013). This was accompanied by another, albeit weaker tightening of credit standards for loans to households compared to the previous period. Standards for corporate loans continued to be tightened to the same extent. Banks expected similar developments for 2013 Q3.
49 The survey reveals that banks left credit standards unchanged overall in 2013 Q3, as the risks associated with the outlook for the overall economic situation and specific sectors had a smaller (or neutral) effect on the tightening of credit standards than in previous periods. Standards were unchanged for loans to small and medium-sized enterprises and eased for large corporations for the first time last year.
III. CURRENT ECONOMIC DEVELOPMENTS
-50
-40
-30
-20
-10
0
10
20
30
Short-term loans to non-financial corporationsLoans to non-financial corporations, total
Medium- and long-term loans to non-financial corporations
1/09 1/11 1/12 1/131/10
-25
-20
-15
-10
-5
0
5
10
15
New loans to non-financial corporations (right-hand scale, annual percentage changes)
LOANSTONON-FINANCIALCORPORATIONSLoanstonon-financialcorporationsincreasedslightly(annual percentage rates of growth; annual percentage changes)
Chart III.5.4
table III.5.1
Supply Demand
Credittermsandconditions:ofwhich
Creditstandards
Averagemargin
forloansMarginon
riskierloansDemandforloans
Loans to non-financial corporations
I/13 a) 0 (22) 7 46 23 (-21)
II/13 b) 17 (9) -36 3 19 (-1)
III/13 c) 0 (20) -21 0 -7 (23)
IV/13 d) (0) (-8)
Loans for house purchase
I/13 a) -6 (-7) -27 -26 12 (-19)
II/13 b) 4 (-26) -43 -4 67 (17)
III/13 c) -4 (-22) -53 20 61 (-7)
IV/13 d) (27) (6)
Consumer credit
I/13 a) -1 (2) 23 1 5 (9)
II/13 b) 26 (30) 7 7 69 (-7)
III/13 c) 0 (0) -9 0 -34 (-15)
IV/13 d) (-7) (2)
CHANGESINBANKS’CREDITCONDITIONSDemandforloanswasbroadlyunchanged,whiledemandforhousepurchaseloansincreased;bankslefttheircreditstandardsvirtuallyunchanged(net percentages; positive value = tightening standards/conditions, demand growth; negative value = easing standards/conditions, demand decrease)
Note: Net percentages are calculated as the difference between the percentage share of loans provided by banks reporting that standards/conditions have been tightened (or demand increased) and the percentage share of loans provided by banks reporting that standards/conditions have been eased (or demand decreased). The individual responses are thus weighted by the volumes of loans of a given type.
a) Banks’ expectations reported in the IV/12 survey given in parentheses.b) Banks’ expectations reported in the I/13 survey given in parentheses.c) Banks’ expectations reported in the II/13 survey given in parentheses.d) Banks’ expectations reported in the III/13 survey given in parentheses.

54
The annual growth rate ofloanstohouseholds was 4.5% in August 2013. The steady growth in the stock of loans to households overall and in their both main components, i.e. loans for house purchase and consumer credit, contrasts somewhat with the high volatility of new loans in the said two segments (see Chart III.5.6).
The annual growth rate of loans forhousepurchase was broadly flat. The growth rate of mortgages stayed at 6% while the decline in building society loans deepened slightly. Banks left their credit standards for house purchase loans largely unchanged in 2013 Q3.50 The number and volume of new mortgages continued to go up. According to banks, demand for loans for house purchase increased in Q3 also because of an increased contribution of refinancing of old loans. The impact on growth in the stock of loans to finance house purchases and construction was therefore limited. Improving consumer confidence and an expected rise in property prices also had a positive effect on demand. According to Hypoindex, the proportion of the number of new mortgages associated with refinancing of old loans seems to be close to its peak and growth in the number of new mortgages was significantly boosted by mortgages for house purchase in September 2013 (see Chart III.5.7). The proportion of the number of mortgages for refinancing is much higher than last year, ranging between 25% and 29%.51
In August 2013, the annual growth rate of bank consumer creditremained at around 2%, while growth in consumer credit from non-banks slowed (to 3%). Year-on-year growth in new consumer credit fluctuated at fairly high levels (see Chart III.5.6). From the point of view of banks, demand for consumer credit was dampened by lower household spending on consumer durables in 2013 Q3 and by the termination of marketing campaigns that had been running in the first half of this year. On the other hand, households’ demand for consolidation of old consumer credit continued to increase.52
The ratio of total household debt to gross disposable income increased further to 55% in 2013 Q2 (or 65% including other accounts payable). However, it remains well below the average for the euro area, where the debt ratio is around 100%. The rise in the household debt ratio in the Czech Republic reflected a larger increase in debt than in income. The ratio of the net interest burden on households to gross disposable income fell slightly to 1.9% in the period under review owing to a decrease in interest rates (see Chart III.5.8).
50 According to banks, a further easing of standards was prevented by increased financing costs associated with rising long-term financial market interest rates. As regards the terms and conditions for approving loans, this factor was reflected in a fall in average interest margins as expressed by the spread between banks’ client and reference rates.
51 Banks expect credit standards to tighten slightly and demand to remain the same in 2013 Q4.
52 On the supply side, credit standards and the terms and conditions for approving consumer credit remained broadly unchanged in 2013 Q3. Banks expect the supply of and demand for consumer credit to show similar developments at the end of 2013.
III. CURRENT ECONOMIC DEVELOPMENTS
Housing loans (mortgages and building society loans)Loans to households, total
Consumer loansMortgages
New consumer loans (right-hand scale, annual percentage changes)New mortgages (right-hand scale, annual percentage changes)
1/11 4 7 10 1/12-1.5
0.0
1.5
3.0
4.5
6.0
7.5
9.0
10.5
-15
0
15
30
45
60
75
90
105
4 7 10 1/13 4 7
LOANSTOHOUSEHOLDSTheannualgrowthrateofloanstohouseholdshasbeenbroadlyflatinrecentmonths(annual percentage rates of growth; annual percentage changes)
Chart III.5.6
Total (annual percentage changes)OtherFor house purchase For construction
1/11 5 9 55 91/12 1/13-20
-10
0
10
20
30
40
50
60
9
STRUCTUREOFNUMBEROFNEWMORTGAGESTheproportionofthenumberofnewmortgagesassociatedwithrefinancingofoldloansseemstobeclosetoitspeak(contributions in percentage points; annual percentage changes; source: Fincentrum Hypoindex)
Chart III.5.7
Loans to non-financial corporations, total (annual percentage changes)
Loans to domestic non-financial corporationsLoans to non-financial corporations under foreign control
1/11 1/134 7 10 1/12 4 7 4 710
-2
-1
0
1
2
3
4
5
6
7
LOANSTONON-FINANCIALCORPORATIONSBROKENDOWNBYOWNERSHIPGrowthinloanswasweakindomesticcorporationsandincorporationsunderforeigncontrol(contributions in percentage points; annual percentage changes)
Chart III.5.5

55
III.5.3Interestrates
Monetary policy interest ratesThe monetary policy decision-making of the CNB Bank Board in 2013 Q3 was based on the macroeconomic forecast published in the previous Inflation Report. Consistent with this forecast and its assumptions was a decline in market interest rates to zero, followed by a noticeable rise in rates only in 2015.53 At the August meeting, the balance of risks to the previous forecast was assessed as being tilted to a need for easier monetary conditions. Energy prices and the risk of unfulfilled expectations of a recovery in the euro area were acting in this direction. The Bank Board decided unanimously to leave keyinterestrates54 unchanged (see Chart III.5.9); at the same time, the Bank Board stated that the probability of using the exchange rate to further ease monetary policy had increased. At the September meeting, the Bank Board assessed the risks as being slightly anti-inflationary and tilted to a need for slightly easier monetary conditions compared to the previous forecast. Lower domestic inflation, including the administered price outlook, and lower wage growth were acting in this direction. The Bank Board decided unanimously to leave key interest rates unchanged in September. At the same time, it stated that the likelihood of using the exchange rate was unchanged and remained high.
At its monetary policy meeting on 7 November 2013, the Bank Board decided unanimously to leave the two-week repo rate unchanged at 0.05 %. Interest rates will be kept at their current levels (i.e. at “technical zero”) over a longer horizon until inflation pressures increase significantly. The Bank Board also decided to start usingthe exchange rate as an additional instrument for easingthe monetary conditions. The CNB will intervene in the foreign exchange market to weaken the koruna so as to maintain the exchange rate of the koruna against the euro close to CZK 27/EUR. Owing to this decision, the alternative scenario of using the exchange rate has become the most likely description of expected future economic developments.
Financial market interest ratesMoney market interest rates remained at record-low levels in 2013 Q3. This was because the CNB’s key interest rates were set at technical zero. PRIBOR interest rates were flat at all maturities (see Chart III.5.10). FRAderivativeratesedged down compared to the end of June, especially at longer maturities. The quotations showed higher short-term volatility in response to published macroeconomic data (GDP, retail sales, purchasing managers’ index, inflation). The market outlook for 3M rates according to end-October FRA quotations
53 Given the zero lower bound on monetary policy rates, this implied a need to ease monetary policy using other instruments.
54 The two-week repo rate and the discount rate were thus set at 0.05% and the Lombard rate at 0.25% with effect from 2 November 2012.
Czech National Bank / Inflation Report IV/2013
III. CURRENT ECONOMIC DEVELOPMENTS
12M PRIBOR 5Y IRS3M PRIBOR
0
1
2
3
4
1/09 1/11 1/12 1/131/10
MARKETINTERESTRATESMoneymarketinterestrateswereflat,butrateswithlongermaturitiesreachedtheirhighestlevelthisyearatthestartofSeptemberandthenfellback(percentages)
Chart III.5.10
Lombard rate 2W repo rateDiscount rate
1/09 1/11 1/12 1/131/100
1
2
3
4
CNBKEYRATESTheCNBleftitskeyinterestratesat“technicalzero”in2013Q3(percentages)
Chart III.5.9
Net interest paid by households to banks (right-hand scale)Interest paid by households to banks (right-hand scale)
I/09 I/10 I/11 I/12 I/13
0
10
20
30
40
50
60
70
0.0
0.5
1.0
1.5
2.0
2.5
3.0
3.5
Housing loans from banks Consumer loans from banksOther loans Non-bank loans
HOUSEHOLDDEBTThedebtofhouseholdsinrelationtodisposableincomeedgedupfurtherin2013Q2(percentage ratios to gross disposable income)
Chart III.5.8
Note: Net interest paid represents the difference between households’ loan interest expenses and bank deposit interest income. Interest paid consists of households’ borrowing-related interest expenses.

56
implies expected approximate stability of these rates at least over the one-year horizon. The market outlook is significantly higher than the interest rate path consistent with the new forecast over the entire horizon (see section II).
Interest rates with longer maturities were primarily affected by external factors. There were initially concerns that the Fed would soon restrict its bond purchases as part of the tapering of the quantitative easing programme. These concerns were later dispelled by communications from the US central bank and by the decision it made at the meeting in September. Another factor underlying the rise in rates was the repayment of loans drawn by financial institutions from the ECB under the LTRO programme. Domestic IRS rates thus reached their highest level this year at the start of September before falling back slightly. Overall, rates with maturities of up to five years have declined by 0.1–0.2 percentage point since the end of June, while rates with longer maturities have increased to a similar extent.
The average 3MPRIBOR in 2013 Q3 was 0.5%, i.e. above the level assumed by the previous forecast, which, however, would have implied a hypothetical decline in the 2W repo rate to negative values. Money market interest rates continued to be influenced by the credit premium. This premium, as measured by the spread between the 3M PRIBOR and 2W repo rate, remained flat at 0.4 percentage point on average.
The positively sloped PRIBOR yield curve was unchanged in 2013 Q3. The spread between the 1Y PRIBOR and the 2W PRIBOR was flat at 0.5 percentage point. The IRSyieldcurve initially shifted to a higher level in 2013 Q3 and its positive slope increased, but opposite movements have prevailed since mid-September. In September, the average 5Y–1Y spread was 1.1 percentage points and the 10Y–1Y spread 1.7 percentage points.
Short-term interestratedifferentialsvis-à-vis the two main world currencies (PRIBOR/CZK–EURIBOR/EUR, or LIBOR/USD) reflected the only marginal changes in interest rates in the Czech Republic and foreign financial markets. The differentials vis-à-vis euro and dollar rates were thus almost unchanged (see Chart III.5.11). The 3M PRIBOR–3M EURIBOR interest rate differential was 0.2 percentage point on average in 2013 Q3 and was at the same level at the end of October.
Eight auctions of fixed coupon bonds and four auctions of variable coupon bonds have been held on the primary government bondmarketsince the start of July. The total volume of bonds issued was CZK 52.9 billion.55 Demand strongly exceeded supply in almost all the
55 Overall, sales of government bonds on the primary market have amounted to CZK 127.9 billion since the start of 2013; the revised Funding and Debt Management Strategy for 2013 assumes issues amounting to CZK 96.7–170.7 billion.
Czech National Bank / Inflation Report IV/2013
III. CURRENT ECONOMIC DEVELOPMENTS
6/1310/12 10/138/13
1Y 2Y 3Y 4Y 5Y 6Y 7Y 8Y 9Y 10Y 11Y 12Y 13Y 14Y 15Y0
1
2
3
4
GOVERNMENTBONDYIELDCURVETheshapeandslopeofthegovernmentbondyieldcurvewerelittlechanged(percentages)
Chart III.5.12
EUR 3M EUR 12MUSD 3M USD 12M
-1
0
1
2
3
1/09 1/10 1/11 1/12 1/13
INTERESTRATEDIFFERENTIALSInterestratedifferentialsvis-à-vistheeuroandthedollarwereflatatlowlevels(percentage points)
Chart III.5.11
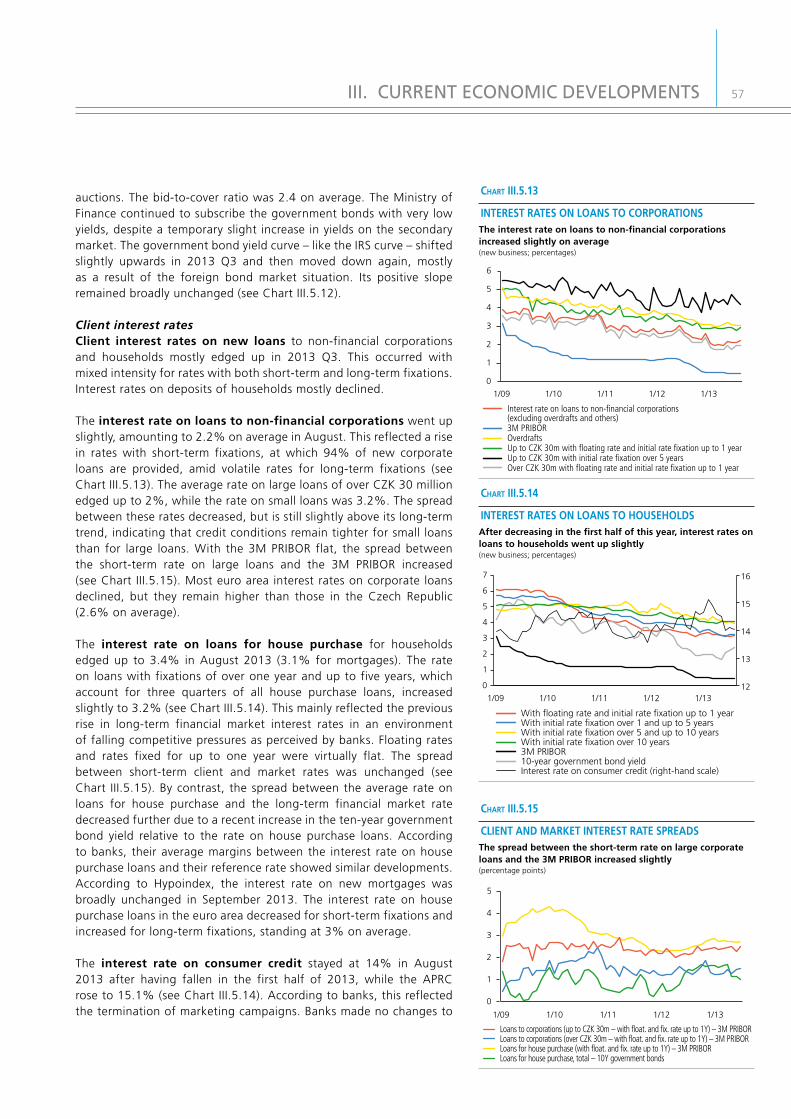
57
auctions. The bid-to-cover ratio was 2.4 on average. The Ministry of Finance continued to subscribe the government bonds with very low yields, despite a temporary slight increase in yields on the secondary market. The government bond yield curve – like the IRS curve – shifted slightly upwards in 2013 Q3 and then moved down again, mostly as a result of the foreign bond market situation. Its positive slope remained broadly unchanged (see Chart III.5.12).
Client interest rates Client interest rates on new loans to non-financial corporations and households mostly edged up in 2013 Q3. This occurred with mixed intensity for rates with both short-term and long-term fixations. Interest rates on deposits of households mostly declined.
Theinterestrateonloanstonon-financialcorporationswent up slightly, amounting to 2.2% on average in August. This reflected a rise in rates with short-term fixations, at which 94% of new corporate loans are provided, amid volatile rates for long-term fixations (see Chart III.5.13). The average rate on large loans of over CZK 30 million edged up to 2%, while the rate on small loans was 3.2%. The spread between these rates decreased, but is still slightly above its long-term trend, indicating that credit conditions remain tighter for small loans than for large loans. With the 3M PRIBOR flat, the spread between the short-term rate on large loans and the 3M PRIBOR increased (see Chart III.5.15). Most euro area interest rates on corporate loans declined, but they remain higher than those in the Czech Republic (2.6% on average).
The interest rate on loans for house purchase for households edged up to 3.4% in August 2013 (3.1% for mortgages). The rate on loans with fixations of over one year and up to five years, which account for three quarters of all house purchase loans, increased slightly to 3.2% (see Chart III.5.14). This mainly reflected the previous rise in long-term financial market interest rates in an environment of falling competitive pressures as perceived by banks. Floating rates and rates fixed for up to one year were virtually flat. The spread between short-term client and market rates was unchanged (see Chart III.5.15). By contrast, the spread between the average rate on loans for house purchase and the long-term financial market rate decreased further due to a recent increase in the ten-year government bond yield relative to the rate on house purchase loans. According to banks, their average margins between the interest rate on house purchase loans and their reference rate showed similar developments. According to Hypoindex, the interest rate on new mortgages was broadly unchanged in September 2013. The interest rate on house purchase loans in the euro area decreased for short-term fixations and increased for long-term fixations, standing at 3% on average.
The interest rate on consumer credit stayed at 14% in August 2013 after having fallen in the first half of 2013, while the APRC rose to 15.1% (see Chart III.5.14). According to banks, this reflected the termination of marketing campaigns. Banks made no changes to
III. CURRENT ECONOMIC DEVELOPMENTS
With floating rate and initial rate fixation up to 1 yearWith initial rate fixation over 1 and up to 5 yearsWith initial rate fixation over 5 and up to 10 yearsWith initial rate fixation over 10 years3M PRIBOR10-year government bond yieldInterest rate on consumer credit (right-hand scale)
0
1
2
3
4
5
6
7
1/11 1/12 1/131/09 1/1012
13
14
15
16
INTERESTRATESONLOANSTOHOUSEHOLDSAfterdecreasinginthefirsthalfofthisyear,interestratesonloanstohouseholdswentupslightly(new business; percentages)
Chart III.5.14
Interest rate on loans to non-financial corporations (excluding overdrafts and others)
Up to CZK 30m with initial rate fixation over 5 yearsUp to CZK 30m with floating rate and initial rate fixation up to 1 yearOverdrafts3M PRIBOR
Over CZK 30m with floating rate and initial rate fixation up to 1 year
1/11 1/12 1/131/09 1/10
0
1
2
3
4
5
6
INTERESTRATESONLOANSTOCORPORATIONSTheinterestrateonloanstonon-financialcorporationsincreasedslightlyonaverage(new business; percentages)
Chart III.5.13
Loans to corporations (up to CZK 30m – with float. and fix. rate up to 1Y) – 3M PRIBORLoans to corporations (over CZK 30m – with float. and fix. rate up to 1Y) – 3M PRIBOR
Loans for house purchase, total – 10Y government bondsLoans for house purchase (with float. and fix. rate up to 1Y) – 3M PRIBOR
1/09 1/10 1/11 1/12 1/13
0
1
2
3
4
5
CLIENTANDMARKETINTERESTRATESPREADSThespreadbetweentheshort-termrateonlargecorporateloansandthe3MPRIBORincreasedslightly(percentage points)
Chart III.5.15

Czech National Bank / Inflation Report IV/2013
58
credit standards for such loans in 2013 Q3. The rate on overdrafts and revolving loans edged up to 14.6% and the rate on credit card debt was flat at 24.1%. The rate remains significantly lower in the euro area than in the Czech Republic on average (6.6%).
Interest rates on deposits of households and corporations remained low with a downward tendency. Rates on overnight deposits edged down further to 0.5% and 0.2% for households and non-financial corporations respectively. The rate on deposits redeemable at notice has long been around 2% due to the significant proportion of relatively highly remunerated building society deposits. The short-term rate on household deposits with an agreed maturity of up to two years declined to 1.2% and the long-term rate dropped to 1.8% (the previous increases in these rates had been due to increased efforts by some banks to make them more attractive; see Chart III.5.16).
Realclientinterestrates56were little changed in 2013 Q3 owing to broadly flat nominal rates and expected inflation. Real rates on new loans were 4.6% in August, while real rates on time deposits were 0.1% (see Chart III.5.17).
III.5.4Theexchangerate
The average exchange rateof thekorunaagainst theeuro was CZK 25.9 in 2013 Q3. This represents a year-on-year depreciation of 3.1% (see Chart III.5.18). However, the average exchange rate was little changed from 2013 Q2. The exchange rate fluctuated within a relatively narrow band around its average from early July to mid-August. In late August, however, the koruna appreciated to CZK 25.6 to the euro. Although a correction occurred in September, the koruna strengthened again at the close of the month and stood at CZK 25.5 to the euro in the first week of October.
CNB monetary policy, which involves communication of readiness to start using the exchange rate as an instrument for easing the monetary conditions in addition to low monetary policy interest rates, was still a majorfactoraffecting the exchange rate in 2013 Q3. At its August meeting, the CNB Bank Board voted on this option for the first time. This led to a short-lived depreciation of the koruna against the euro. The Bank Board meeting in late September again resulted in a decision not to use the exchange rate as a monetary policy instrument for the time being. The koruna reacted by appreciating to its strongest level against the euro in three months. To a limited extent, the exchange rate is also being affected by data on the domestic economy (e.g. industrial production and inflation), which might indicate the future orientation of monetary policy, and by developments on foreign financial markets.
56 Ex ante real interest rates: nominal interest rates are deflated by the consumer price inflation expected by financial market analysts.
III. CURRENT ECONOMIC DEVELOPMENTS
2W PRIBORNewly extended loans
1Y PRIBORTime deposits
1/09 1/11 1/12 1/131/10
-3
-2
-1
0
1
2
3
4
5
EXANTEREALRATESExanterealinterestratesonnewloansanddepositsrecordednomajorchanges(percentages)
Chart III.5.17
CZK/EUR CZK/USD
1/11 1/12 1/131/101/09
14
16
18
20
22
24
26
28
30
CZK/EURANDCZK/USDEXCHANGERATESThekorunaweakenedfurtheryearonyearagainstboththeeuroandthedollarin2013Q3
Chart III.5.18
Interest rate on overnight deposits of householdsInterest rate on overnight deposits of non-financial corporationsInterest rate on household deposits with agreed maturity of up to two yearsInterest rate on household deposits with agreed maturity of over two yearsInterest rate on household deposits redeemable at notice of up to three months10-year government bond yield3M PRIBOR
1/09 1/11 1/12 1/131/10
0
1
2
3
4
5
6
INTERESTRATESONDEPOSITSInterestratesonhouseholddepositsmostlyfell(percentages)
Chart III.5.16
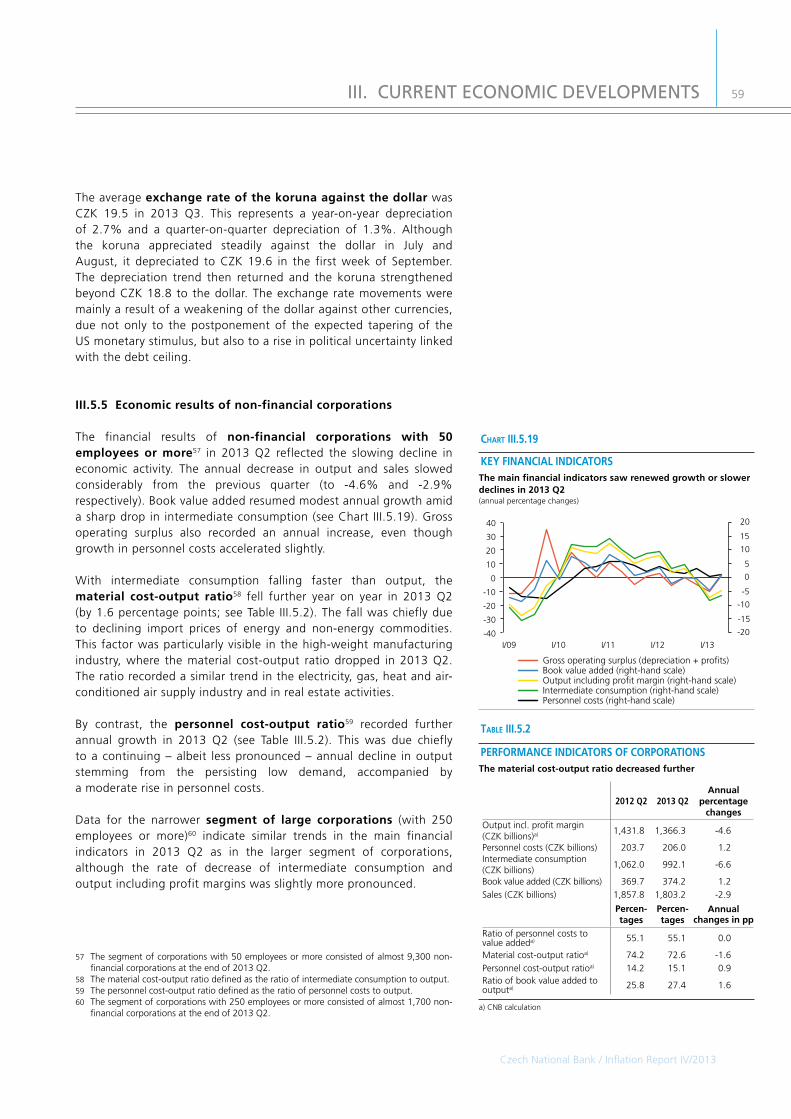
Czech National Bank / Inflation Report IV/2013
59
The averageexchangerateofthekorunaagainstthedollarwas CZK 19.5 in 2013 Q3. This represents a year-on-year depreciation of 2.7% and a quarter-on-quarter depreciation of 1.3%. Although the koruna appreciated steadily against the dollar in July and August, it depreciated to CZK 19.6 in the first week of September. The depreciation trend then returned and the koruna strengthened beyond CZK 18.8 to the dollar. The exchange rate movements were mainly a result of a weakening of the dollar against other currencies, due not only to the postponement of the expected tapering of the US monetary stimulus, but also to a rise in political uncertainty linked with the debt ceiling.
III.5.5Economicresultsofnon-financialcorporations
The financial results of non-financial corporations with 50employees or more57 in 2013 Q2 reflected the slowing decline in economic activity. The annual decrease in output and sales slowed considerably from the previous quarter (to -4.6% and -2.9% respectively). Book value added resumed modest annual growth amid a sharp drop in intermediate consumption (see Chart III.5.19). Gross operating surplus also recorded an annual increase, even though growth in personnel costs accelerated slightly.
With intermediate consumption falling faster than output, the material cost-output ratio58 fell further year on year in 2013 Q2 (by 1.6 percentage points; see Table III.5.2). The fall was chiefly due to declining import prices of energy and non-energy commodities. This factor was particularly visible in the high-weight manufacturing industry, where the material cost-output ratio dropped in 2013 Q2. The ratio recorded a similar trend in the electricity, gas, heat and air-conditioned air supply industry and in real estate activities.
By contrast, the personnel cost-output ratio59 recorded further annual growth in 2013 Q2 (see Table III.5.2). This was due chiefly to a continuing – albeit less pronounced – annual decline in output stemming from the persisting low demand, accompanied by a moderate rise in personnel costs.
Data for the narrower segment of large corporations (with 250 employees or more)60 indicate similar trends in the main financial indicators in 2013 Q2 as in the larger segment of corporations, although the rate of decrease of intermediate consumption and output including profit margins was slightly more pronounced.
57 The segment of corporations with 50 employees or more consisted of almost 9,300 non-financial corporations at the end of 2013 Q2.
58 The material cost-output ratio defined as the ratio of intermediate consumption to output.59 The personnel cost-output ratio defined as the ratio of personnel costs to output.60 The segment of corporations with 250 employees or more consisted of almost 1,700 non-
financial corporations at the end of 2013 Q2.
III. CURRENT ECONOMIC DEVELOPMENTS
table III.5.2
2012 Q2 2013 Q2Annual
percentagechanges
Output incl. profit margin (CZK billions)a) 1,431.8 1,366.3 -4.6
Personnel costs (CZK billions) 203.7 206.0 1.2Intermediate consumption (CZK billions)
1,062.0 992.1 -6.6
Book value added (CZK billions) 369.7 374.2 1.2
Sales (CZK billions) 1,857.8 1,803.2 -2.9
Percen-tages
Percen-tages
Annualchangesinpp
Ratio of personnel costs to value addeda) 55.1 55.1 0.0
Material cost-output ratioa) 74.2 72.6 -1.6
Personnel cost-output ratioa) 14.2 15.1 0.9Ratio of book value added to outputa) 25.8 27.4 1.6
PERFORMANCEINDICATORSOFCORPORATIONSThematerialcost-outputratiodecreasedfurther
a) CNB calculation
Book value added (right-hand scale)Gross operating surplus (depreciation + profits)
Intermediate consumption (right-hand scale)Personnel costs (right-hand scale)
Output including profit margin (right-hand scale)
I/09 I/13I/10 I/11 I/12-40
-30
-20
-10
0
10
20
30
40
-20
-15
-10
-5
0
5
10
15
20
KEYFINANCIALINDICATORSThemainfinancialindicatorssawrenewedgrowthorslowerdeclinesin2013Q2(annual percentage changes)
Chart III.5.19
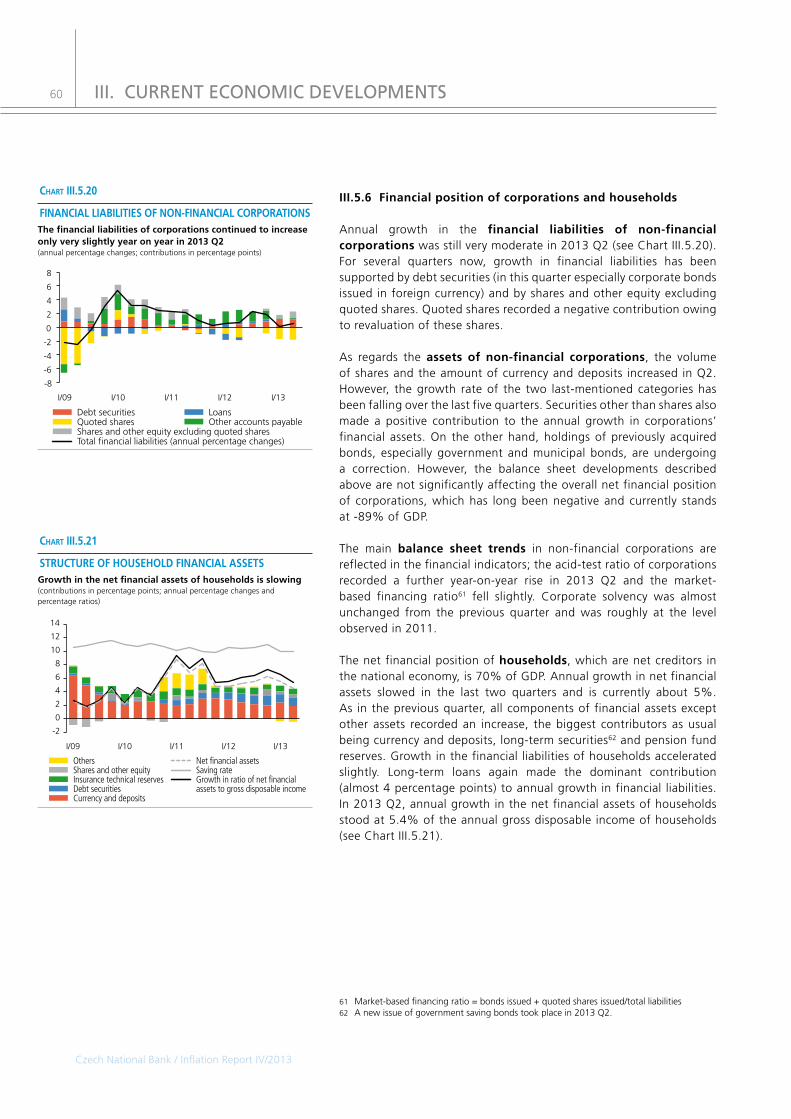
Czech National Bank / Inflation Report IV/2013
60
III.5.6Financialpositionofcorporationsandhouseholds
Annual growth in the financial liabilities of non-financialcorporationswas still very moderate in 2013 Q2 (see Chart III.5.20). For several quarters now, growth in financial liabilities has been supported by debt securities (in this quarter especially corporate bonds issued in foreign currency) and by shares and other equity excluding quoted shares. Quoted shares recorded a negative contribution owing to revaluation of these shares.
As regards the assets of non-financial corporations, the volume of shares and the amount of currency and deposits increased in Q2. However, the growth rate of the two last-mentioned categories has been falling over the last five quarters. Securities other than shares also made a positive contribution to the annual growth in corporations’ financial assets. On the other hand, holdings of previously acquired bonds, especially government and municipal bonds, are undergoing a correction. However, the balance sheet developments described above are not significantly affecting the overall net financial position of corporations, which has long been negative and currently stands at -89% of GDP.
The main balance sheet trends in non-financial corporations are reflected in the financial indicators; the acid-test ratio of corporations recorded a further year-on-year rise in 2013 Q2 and the market-based financing ratio61 fell slightly. Corporate solvency was almost unchanged from the previous quarter and was roughly at the level observed in 2011.
The net financial position of households, which are net creditors in the national economy, is 70% of GDP. Annual growth in net financial assets slowed in the last two quarters and is currently about 5%. As in the previous quarter, all components of financial assets except other assets recorded an increase, the biggest contributors as usual being currency and deposits, long-term securities62 and pension fund reserves. Growth in the financial liabilities of households accelerated slightly. Long-term loans again made the dominant contribution (almost 4 percentage points) to annual growth in financial liabilities. In 2013 Q2, annual growth in the net financial assets of households stood at 5.4% of the annual gross disposable income of households (see Chart III.5.21).
61 Market-based financing ratio = bonds issued + quoted shares issued/total liabilities62 A new issue of government saving bonds took place in 2013 Q2.
III. CURRENT ECONOMIC DEVELOPMENTS
Growth in ratio of net financial assets to gross disposable income
I/12I/09 I/13I/10 I/11
Insurance technical reservesShares and other equityOthers
Saving rateNet financial assets
Currency and depositsDebt securities
-2
0
2
4
6
8
10
12
14
STRUCTUREOFHOUSEHOLDFINANCIALASSETSGrowthinthenetfinancialassetsofhouseholdsisslowing(contributions in percentage points; annual percentage changes and percentage ratios)
Chart III.5.21
LoansDebt securitiesQuoted shares Other accounts payableShares and other equity excluding quoted sharesTotal financial liabilities (annual percentage changes)
I/09 I/12 I/13I/10 I/11
-8
-6
-4
-2
0
2
4
6
8
FINANCIALLIABILITIESOFNON-FINANCIALCORPORATIONSThefinancialliabilitiesofcorporationscontinuedtoincreaseonlyveryslightlyyearonyearin2013Q2(annual percentage changes; contributions in percentage points)
Chart III.5.20
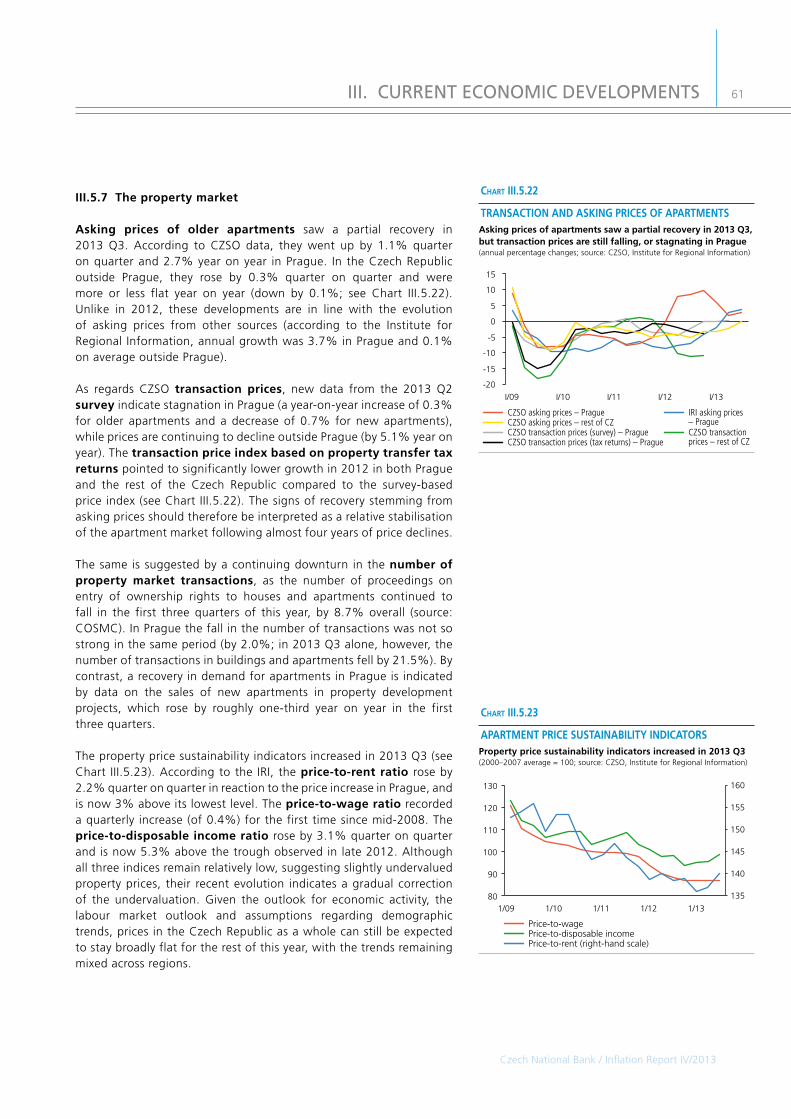
Czech National Bank / Inflation Report IV/2013
61
III.5.7Thepropertymarket
Asking prices of older apartments saw a partial recovery in 2013 Q3. According to CZSO data, they went up by 1.1% quarter on quarter and 2.7% year on year in Prague. In the Czech Republic outside Prague, they rose by 0.3% quarter on quarter and were more or less flat year on year (down by 0.1%; see Chart III.5.22). Unlike in 2012, these developments are in line with the evolution of asking prices from other sources (according to the Institute for Regional Information, annual growth was 3.7% in Prague and 0.1% on average outside Prague).
As regards CZSO transaction prices, new data from the 2013 Q2 survey indicate stagnation in Prague (a year-on-year increase of 0.3% for older apartments and a decrease of 0.7% for new apartments), while prices are continuing to decline outside Prague (by 5.1% year on year). Thetransactionpriceindexbasedonpropertytransfertaxreturns pointed to significantly lower growth in 2012 in both Prague and the rest of the Czech Republic compared to the survey-based price index (see Chart III.5.22). The signs of recovery stemming from asking prices should therefore be interpreted as a relative stabilisation of the apartment market following almost four years of price declines.
The same is suggested by a continuing downturn in the numberofproperty market transactions, as the number of proceedings on entry of ownership rights to houses and apartments continued to fall in the first three quarters of this year, by 8.7% overall (source: COSMC). In Prague the fall in the number of transactions was not so strong in the same period (by 2.0%; in 2013 Q3 alone, however, the number of transactions in buildings and apartments fell by 21.5%). By contrast, a recovery in demand for apartments in Prague is indicated by data on the sales of new apartments in property development projects, which rose by roughly one-third year on year in the first three quarters.
The property price sustainability indicators increased in 2013 Q3 (see Chart III.5.23). According to the IRI, the price-to-rentratio rose by 2.2% quarter on quarter in reaction to the price increase in Prague, and is now 3% above its lowest level. The price-to-wageratio recorded a quarterly increase (of 0.4%) for the first time since mid-2008. The price-to-disposableincomeratio rose by 3.1% quarter on quarter and is now 5.3% above the trough observed in late 2012. Although all three indices remain relatively low, suggesting slightly undervalued property prices, their recent evolution indicates a gradual correction of the undervaluation. Given the outlook for economic activity, the labour market outlook and assumptions regarding demographic trends, prices in the Czech Republic as a whole can still be expected to stay broadly flat for the rest of this year, with the trends remaining mixed across regions.
III. CURRENT ECONOMIC DEVELOPMENTS
Price-to-wagePrice-to-disposable incomePrice-to-rent (right-hand scale)
1/09 1/10 1/11 1/12 1/1380
90
100
110
120
130
135
140
145
150
155
160
APARTMENTPRICESUSTAINABILITYINDICATORSPropertypricesustainabilityindicatorsincreasedin2013Q3(2000–2007 average = 100; source: CZSO, Institute for Regional Information)
Chart III.5.23
I/09 I/10 I/11 I/13I/12
CZSO asking prices – Prague IRI asking prices – PragueCZSO transaction prices – rest of CZCZSO transaction prices (tax returns) – Prague
CZSO transaction prices (survey) – PragueCZSO asking prices – rest of CZ
-20
-15
-10
-5
0
5
10
15
TRANSACTIONANDASKINGPRICESOFAPARTMENTSAskingpricesofapartmentssawapartialrecoveryin2013Q3,buttransactionpricesarestillfalling,orstagnatinginPrague(annual percentage changes; source: CZSO, Institute for Regional Information)
Chart III.5.22

Czech National Bank / Inflation Report IV/2013
62
III.6BALANCEOFPAYMENTS
In 2013 H1, the balance of payments was characterised by a high goods and services surplus, linked mainly with a rise in the trade surplus. However, its effect on the current account was almost offset by an income deficit resulting from high foreign direct investment income. Portfolio investment recorded the biggest surplus on the financial account, followed by direct investment. However, these net inflows were largely offset by a net outflow of other investment due to rapid growth in long-term foreign deposits and loans by monetary financial institutions and by a high net outflow in the corporate sector.
III.6.1Thecurrentaccount
Thecurrentaccount recorded a surplus of CZK 8.6 billion in 2013 H1. In year-on-year terms, the balance increased by almost CZK 18 billion. The shift of the current account from deficit to surplus was due mainly to the year-on-year evolution of the trade balance. The annual moving current account deficit decreased by more than CZK 21 billion from the previous quarter (see Chart III.6.1). Compared to 2013 Q1, the annual moving ratio of the current account deficit to GDP also decreased, to 2%.
The tradesurplusincreased by more than CZK 25 billion year on year to CZK 111.3 billion in 2013 H1. Roughly two-thirds of the increase in the trade surplus was due to price effects linked with a positive year-on-year change in the terms of trade, and around one-third was a result of developments in real terms. The very subdued growth in external demand was reflected in exports. Nominal annual growth of goods exports edged up in Q2 following a marked slowdown at the start of the year, but recorded a decrease of more than 1% in H1 as a whole. Goods imports fell even faster – by more than 3%. In addition to a decline in traditionally import-intensive exports, the nominal fall in imports was due to a continuing decrease in total domestic demand and a drop in energy input prices. The decline in nominal trade turnover was partly dampened by year-on-year depreciation of the koruna. Turning to the commodity structure, growth in the machinery and transport equipment surplus was the biggest contributor to the rise in the overall surplus (see Chart III.6.2). The year-on-year growth in the surplus observed in the previous quarter continued during 2013 Q3, exceeding CZK 2 billion for July–August.
In 2013 H1, the servicessurplus rose by almost CZK 7 billion year on year to CZK 32.9 billion (see Chart III.6.3). The surplus was due to travel and transport, which, however, recorded very slight year-on-year decreases in surplus (the fall in the travel surplus was larger, owing to lower credits from business travel). Other services recorded a slight deficit, which, however, moderated considerably in year-on-year terms owing to a sharp increase in credits due mainly to the evolution of the merchanting balance. At the same time, the narrowing of the other services deficit had the largest impact on the year-on-year change in the overall services surplus.
III. CURRENT ECONOMIC DEVELOPMENTS
Trade balanceCurrent transfers Balance of services
Income balance
Current account
I/09 I/12 I/13I/10 I/11
-400
-300
-200
-100
0
100
200
300
CURRENTACCOUNTTheannualmovingcurrentaccountdeficitdecreasedin2013H1,primarilyduetoanincreaseinthetradesurplus(annual moving totals in CZK billions)
Chart III.6.1
2009 2010 2011 2012 2013
Mineral fuels Chemicals
Manufactured goods Machinery
Manufactured articles
-100
-50
0
50
100
150
200
250
TRADEBALANCETheyear-on-yearchangeinthetradebalancewasaffectedmoststronglyin2013H1byanincreaseinthemachinerysurplus(accumulation since start of year in CZK billions; change of ownership principle)
Chart III.6.2
Transport Travel Other services Total
I/09 I/12 I/13I/10 I/11
-15
-10
-5
0
5
10
15
20
25
BALANCEOFSERVICESTravelandtransportcontributedtotheservicessurplusin2013H1(CZK billions)
Chart III.6.3
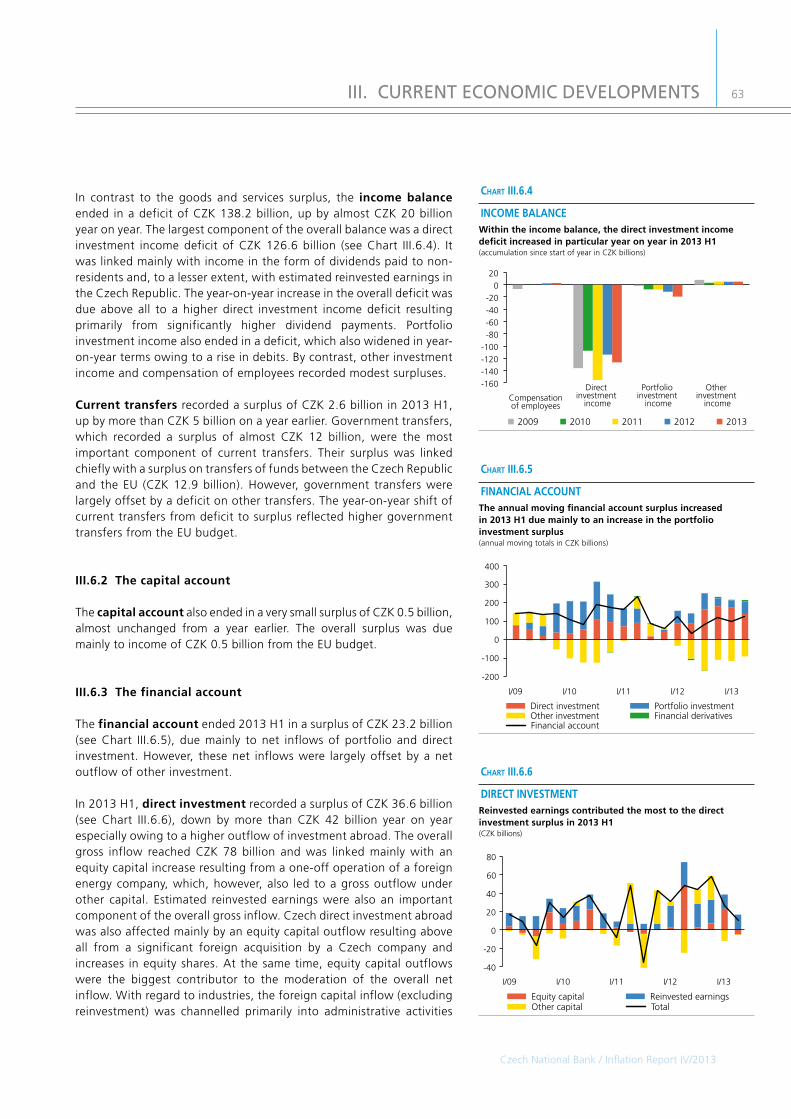
Czech National Bank / Inflation Report IV/2013
63
In contrast to the goods and services surplus, the income balanceended in a deficit of CZK 138.2 billion, up by almost CZK 20 billion year on year. The largest component of the overall balance was a direct investment income deficit of CZK 126.6 billion (see Chart III.6.4). It was linked mainly with income in the form of dividends paid to non-residents and, to a lesser extent, with estimated reinvested earnings in the Czech Republic. The year-on-year increase in the overall deficit was due above all to a higher direct investment income deficit resulting primarily from significantly higher dividend payments. Portfolio investment income also ended in a deficit, which also widened in year-on-year terms owing to a rise in debits. By contrast, other investment income and compensation of employees recorded modest surpluses.
Currenttransfers recorded a surplus of CZK 2.6 billion in 2013 H1, up by more than CZK 5 billion on a year earlier. Government transfers, which recorded a surplus of almost CZK 12 billion, were the most important component of current transfers. Their surplus was linked chiefly with a surplus on transfers of funds between the Czech Republic and the EU (CZK 12.9 billion). However, government transfers were largely offset by a deficit on other transfers. The year-on-year shift of current transfers from deficit to surplus reflected higher government transfers from the EU budget.
III.6.2Thecapitalaccount
The capitalaccount also ended in a very small surplus of CZK 0.5 billion, almost unchanged from a year earlier. The overall surplus was due mainly to income of CZK 0.5 billion from the EU budget.
III.6.3Thefinancialaccount
The financialaccountended 2013 H1 in a surplus of CZK 23.2 billion (see Chart III.6.5), due mainly to net inflows of portfolio and direct investment. However, these net inflows were largely offset by a net outflow of other investment.
In 2013 H1, directinvestment recorded a surplus of CZK 36.6 billion (see Chart III.6.6), down by more than CZK 42 billion year on year especially owing to a higher outflow of investment abroad. The overall gross inflow reached CZK 78 billion and was linked mainly with an equity capital increase resulting from a one-off operation of a foreign energy company, which, however, also led to a gross outflow under other capital. Estimated reinvested earnings were also an important component of the overall gross inflow. Czech direct investment abroad was also affected mainly by an equity capital outflow resulting above all from a significant foreign acquisition by a Czech company and increases in equity shares. At the same time, equity capital outflows were the biggest contributor to the moderation of the overall net inflow. With regard to industries, the foreign capital inflow (excluding reinvestment) was channelled primarily into administrative activities
III. CURRENT ECONOMIC DEVELOPMENTS
Direct investment Portfolio investmentFinancial derivativesOther investment
Financial account
I/09 I/12 I/13I/10 I/11
-200
-100
0
100
200
300
400
FINANCIALACCOUNTTheannualmovingfinancialaccountsurplusincreasedin2013H1duemainlytoanincreaseintheportfolioinvestmentsurplus(annual moving totals in CZK billions)
Chart III.6.5
Equity capital Reinvested earningsOther capital Total
I/09 I/12 I/13I/10 I/11
-40
-20
0
20
40
60
80
DIRECTINVESTMENTReinvestedearningscontributedthemosttothedirectinvestmentsurplusin2013H1(CZK billions)
Chart III.6.6
-160
-140
-120
-100
-80
-60
-40
-20
0
20
2009 2010 2011 2012 2013
Compensation of employees
Direct investment
income
Portfolio investment
income
Other investment
income
INCOMEBALANCEWithintheincomebalance,thedirectinvestmentincomedeficitincreasedinparticularyearonyearin2013H1(accumulation since start of year in CZK billions)
Chart III.6.4

Czech National Bank / Inflation Report IV/2013
64
and business services. Capital outflows abroad went mainly into financial and insurance activities.
Portfolio investment also recorded a net inflow (of CZK 66.4 billion; see Chart III.6.7). The largest operations were bond issues by domestic – mostly non-financial – corporations on foreign markets. Holdings of Czech shares by non-residents edged down amid growing interest in domestic debt securities. Overall, the inflow of portfolio investment reached almost CZK 62 billion. By contrast, sales dominated trading in foreign securities by domestic investors. They were related to a decrease in bond holdings, which was, however, largely offset by share purchases. The fall in interest of residents in foreign bonds was also the biggest contributor to the year-on-year rise in the overall net inflow of more than CZK 26 billion.
Settlement of financial derivatives recorded a net inflow of CZK 1.5 billion. The balance rose by more than CZK 2 billion year on year amid a shift from slight deficit to surplus.
By contrast, other investment saw a high net outflow totalling CZK 81.2 billion. The overall deficit was due mainly to a net outflow of CZK 50.4 billion in the corporate sector, linked with repayment of trade credits and financial loans received from abroad together with growth in loans to, and deposits with, non-residents. In addition, a net capital outflow of almost CZK 26 billion was recorded by the monetary financial institutions sector, owing mainly to growth in long-term loans and deposits abroad. Other investment in the government sector also ended in a small deficit associated chiefly with the repayment of a foreign loan from the EIB. The year-on-year decrease in the overall net outflow was due above all to a change in the short-term position of monetary financial institutions.
The CNB’s international reserves totalled CZK 867.9 billion at the end of 2013 Q3, representing a modest quarter-on-quarter increase of more than CZK 2 billion due mainly to valuation changes. In dollar terms, the reserves rose by USD 1.9 billion to USD 45.5 billion in the same period (see Chart III.6.8). The CNB’s international reserves covered almost 43% of all external debt liabilities of domestic entities at the end of 2013 Q2.
III. CURRENT ECONOMIC DEVELOPMENTS
The CNB's international reserves
I/09 I/10 I/11 I/12 I/13
0
5
10
15
20
25
30
35
40
45
CNBINTERNATIONALRESERVESTheCNB’sinternationalreservesincreasedin2013Q3comparedtothepreviousquarterindollarterms(USD billions, end of quarter)
Chart III.6.8
Czech equity securities and participations held by non-residentsForeign debt securities held by residentsForeign equity securities and participations held by residents
Czech debt securities held by non-residents
Net inflow of portfolio investment
I/09 I/12 I/13I/10 I/11
-80
-60
-40
-20
0
20
40
60
80
100
PORTFOLIOINVESTMENTPortfolioinvestmentrecordedanetinflowin2013H1,owingmainlytoissuanceofbondsabroad(CZK billions)
Chart III.6.7

Czech National Bank / Inflation Report IV/2013
65
III.7THEEXTERNALENVIRONMENT
The annual economic decline in the euro area moderated slightly in 2013 Q2 thanks to improvements in all components of domestic demand. The euro area economy expanded compared to the previous quarter, and modest quarterly growth can also be expected during 2013 H2. The US economy developed more favourably, picking up pace in both year-on-year and quarter-on-quarter terms. However, uncertainty persists regarding longer-term consolidation of US public finances. Among other things, this pushes back expectations of the previously announced tapering of the Fed’s stimulation measures. Continued very subdued price pressures on both sides of the Atlantic are also acting in the direction of easier monetary policy. The euro appreciated against the dollar in the period under review, but it is expected to weaken in the future. The price of oil declined in September and is expected to follow a slightly falling trend in the period ahead.
III.7.1Theeuroarea
The euroareaeconomy returned to quarterly growth (of 0.3%) in 2013 Q2 following six quarters of decline. This change was aided by all components of domestic demand. The year-on-year developments also improved (see Chart III.7.1), as the contraction in GDP moderated compared to the previous quarter (from -1% to -0.5%). This change, too, was due to favourable developments in all domestic demand components.
In the second half of this year, the modest quarter-on-quarter economic growth can be expected to continue and the year-on-year decline can be expected to moderate further, turning positive in 2013 Q4. This outlook is supported by slight improvements in most of the leading indicators under review recently. These indicators are pointing to growth in GDP, albeit at a subdued pace. The slower month-on-month growth and sharper year-on-year decline in industrial production in July and August compared to Q2 also suggest that the pace of the economic recovery will not increase in H2. By contrast, retail turnover improved slightly and the unemployment rate fell by 0.1 percentage point to 12%.
For 2013 as a whole, the October CF lowered its estimate of the year-on-year contraction in GDP by 0.3 percentage point to -0.3% (see Chart III.7.2) and increased its outlook for economic growth next year to 0.9%. The ECB also changed its outlook in a similar way last month.
Annual HICPinflation in the euro area decreased by 0.2 percentage point to 1.1%, mainly because of a sharper decline in energy prices and slower food price growth (see Chart III.7.3). Core inflation also went down (to 1%), and a shift to increasing inflation pressures cannot be expected in the foreseeable future given the decrease in industrial
III. CURRENT ECONOMIC DEVELOPMENTS
Change in inventoriesGross fixed capital formation
Net exportsGovernment consumption
Household consumption GDP (annual percentage changes)
I/09 I/13I/10 I/11 I/12
-6
-4
-2
0
2
4
GDPINTHEEUROAREAAnimprovementinallcomponentsofdomesticdemandfosteredaslowdownintheannualcontractioninGDPin2013Q2(annual percentage changes; contributions in percentage points; seasonally adjusted; source: Datastream)
Chart III.7.1
-0.8
-0.6
-0.4
-0.2
0.0
1.2
1.4
1.6
CF
10/1
3
IMF
10/1
3
OEC
D 5
/13
ECB
9/13
CF
10/1
3
IMF
10/1
3
OEC
D 5
/13
ECB
9/13
GDP
Inflation
EUROAREAGDPANDINFLATIONOUTLOOKSFOR2013EuroareaGDPisexpectedtodecreaseby0.3%–0.4%in2013,whileinflationshouldbearound1.5%(annual percentage changes; source: CF, IMF, OECD, ECB)
Chart III.7.2
Note: Horizontal axis shows most recent forecast data in format “Source month/year of publication”. Midpoint of range for ECB.

Czech National Bank / Inflation Report IV/2013
66
producer prices (of 0.8% in August) and the weak/negative economic growth in many euro area countries. The October CF predicts inflation at 1.5% in 2013 as a whole (see Chart III.7.2) and a modest decline to 1.4% next year.
In October, the ECB left its key interest rate unchanged at 0.5%, the level to which it was reduced in May 2013. The ECB expects a weak economic recovery in the euro area in the second half of this year, predicting that inflation pressures will not rise significantly and inflation expectations will remain in line with its definition of price stability. The monetary and credit aggregates support these expectations: in August M3 rose by 2.3% year on year and loans to the private sector fell by 2%. The ECB repeated that “the Governing Council expects the key ECB interest rates to remain at present or lower levels for an extended period of time”.
QuarterlygrowthoftheGermaneconomy accelerated significantly in 2013 Q2 (to 0.7% from zero in Q1) on the back of stronger growth in all domestic demand components. The improvement was particularly visible in fixed investment, where a decline of 2% changed to an increase of the same size. The contribution of net exports increased as well. Year-on-year GDP developments also improved from a decrease of 0.3% in 2013 Q1 to growth of 0.5% in Q2 as a result of stronger domestic demand growth outweighing a slight negative contribution of net exports (see Chart III.7.4).
Inthesecondhalfofthisyear, the October CF expects continued quarterly growth just below the level recorded in Q2, accompanied by a gradual increase in annual growth. Developments in industry and trade in the first two months of Q3 indicate that the quarterly growth will not be more pronounced. Average growth in industrial production was lower in this period than in Q2, and growth in retail turnover was slightly higher. Some leading indicators (the PMI in industry, consumer confidence) also declined in September following several months of growth. Compared to July, the October CF increased its expectations of economic growth for 2013 as a whole and for 2014 by 0.1 percentage point to 0.5% and 1.7% respectively. Similar developments are also forecasted by the German government, the European Commission and the IMF.
CPIinflation in Germany decreased by 0.1 percentage point to 1.4% in September (see Chart III.7.5), mainly as a result of falling energy prices and slower food price growth. Industrial producer prices also switched from growth to decline (-0.4%) in August. The October CF expects consumer prices to rise roughly at the current pace for the rest of this year and inflation to reach 1.6% in 2013 as a whole, increasing to 1.9% next year.
The quarterly growth rate of the Slovak economy edged up to 0.3% in 2013 Q2 thanks to higher contributions of net exports and household consumption. Annual economic growth was flat at 0.8%. The October CF expects GDP growth of 0.9% in 2013 as a whole and
III. CURRENT ECONOMIC DEVELOPMENTS
Change in inventories
Gross fixed capital formationNet exportsGovernment consumption
Household consumption GDP (annual percentage changes)
I/09 I/13I/10 I/11 I/12
-8
-6
-4
-2
0
2
4
6
GDPINGERMANYGDPincreasedyearonyearin2013Q2onthebackofamodestrecoveryinalldomesticdemandcomponents(annual percentage changes; contributions in percentage points; seasonally adjusted; source: Datastream)
Chart III.7.4
CPICPI excluding energy and food prices
PPI (right-hand scale)
I/11 I/12 I/13I/09 I/10
-1
0
1
2
3
-8
0
8
16
24
INFLATIONANDPRODUCERPRICESINGERMANYInflationwentdownin2013Q3,mainlyduetopricesofenergyandfood.Industrialproducerpricesdeclined(annual percentage changes; source: Datastream)
Chart III.7.5
CPICPI excluding energy and food prices
PPI (right-hand scale)
I/11 I/12 I/13I/09 I/10
-3
-2
-1
0
1
2
3
4
5
-9
-6
-3
0
3
6
9
12
15
INFLATIONANDPRODUCERPRICESINTHEEUROAREAInflationwentdownin2013Q3,whileproducerpricesfell(annual percentage changes; source: Datastream)
Chart III.7.3

Czech National Bank / Inflation Report IV/2013
67
2.2% next year. Unemployment fell both month on month and year on year in August (by 0.1 percentage point to 14%). In September, Slovak inflation edged down to 1%, mainly because of slower growth in energy prices and import prices. Producer price inflation, which has recorded a year-on-year decline over the last four months, is also indicating weak inflation pressures. The October CF expects average inflation to reach 1.7% in 2013 as a whole and rise to 1.9% next year.
III.7.2TheUnitedStates
Annual economicgrowthintheUSA rose from 1.3% in 2013 Q1 to 1.6% in 2013 Q2 (see Chart III.7.6). At the same time, quarterly GDP growth increased from 0.3% to 0.6%. The stronger growth was chiefly due to private consumption, which rose by 1.9% year on year, and to investment, which went up by 4.7% year on year. By contrast, a decline in government expenditure of 2.0% made a negative contribution. The global economic contraction was reflected in relatively subdued growth rates of real exports (2.0%) and imports (1.2%). Overall, net exports made a contribution of 0.1 percentage point to GDP growth. In addition, the US external imbalance decreased further in 2013 Q2, with the annual cumulative current account deficit falling to 2.5% of GDP.
Following three months of slowdown, industrialproductiongrowthincreased to 2.7% year on year in August. Positive developments in industry are also suggested by the PMI leading indicator, which started rising at a relatively significant pace in June, reaching 56.2 in September. Nominal retail sales were up by 4.7% year on year in August, representing a slowdown compared to previous months. The University of Michigan consumer sentiment index does not indicate any major improvement either, as in October it fell back to its early-2013 level after peaking in July. By contrast, the unemployment rate developed favourably, decreasing further to 7.2% in September.
The GDPgrowthoutlooksfor2013 range between 1.6% and 2.2% (see Chart III.7.7). GDP growth will thus probably be lower than in 2012, owing chiefly to across-the-board budget cuts made at the start of March 2013.63 The annual cumulative government budget deficit fell to 4.2% of GDP in 2013 Q2. Although technical default by the USA was averted in mid-October, there is still no agreement across the political spectrum on how to stabilise public finances in the long term. This uncertainty is adversely affecting investor and consumer decisions and hindering the economic recovery.
63 Automatic budget cuts (known as the sequester) were launched in the USA on 1 March 2013. The federal budget cuts are evenly distributed between defence spending and other expenditure. However, large government programmes (Social Security, Medicaid) are exempt.
III. CURRENT ECONOMIC DEVELOPMENTS
1.0
1.2
1.4
1.6
1.8
2.0
2.2
2.4
0.8
1.0
1.2
1.4
1.6
1.8
CF
10/1
3
IMF
10/1
3
OEC
D 5
/13
Fed
9/13
CF
10/1
3
IMF
10/1
3
OEC
D 5
/13
Fed
9/13
GDP Inflation
USGDPANDINFLATIONOUTLOOKSFOR2013GDPgrowthwillprobablyreach1.6%–2.2%,whileinflationshouldbebelowthe2%level(annual percentage changes; source: CF, IMF, OECD, Fed)
Chart III.7.7
Note: Horizontal axis shows most recent forecast data in format “Source month/year of publication”. Midpoint of range for Fed.
Change in inventoriesGross fixed capital formation
Net exportsGovernment consumption
Household consumption GDP (annual percentage changes)
I/09 I/13I/10 I/11 I/12
-8
-6
-4
-2
0
2
4
GDPINTHEUSAPrivateconsumptionandinvestmentwerethebiggestcontributorstoGDPgrowthin2013Q2(annual percentage changes; contributions in percentage points; seasonally adjusted; source: Datastream)
Chart III.7.6

Czech National Bank / Inflation Report IV/2013
68
Annual consumer price inflation declined to 1.5% in August. Headline inflation has thus been relatively subdued since 2012 Q2, in line with inflation excluding energy and food prices (see Chart III.7.8). The inflation outlooks for 2013 do not exceed 1.6% (see Chart III.7.7).
The fiscal crisis in October, reflected among other things in a shortage of regular macroeconomic data owing to the closure of some federal agencies, will probably contribute to the postponement of the previously announced tapering of stimulative Fed measures in the form of a bond purchase programme (totalling USD 85 billion a month). A postponement of the gradual exit from quantitative easing is also suggested by worse-than-expected labour market data (a lower number of new jobs) and by the nomination of the current Vice Chair of the Federal Reserve Janet Yellen to chair this institution.Annual M2 growth slowed slightly to 6.4% in September.
III.7.3 Theexchangerateoftheeuroagainstthedollarandothermajorcurrencies
The exchange rateof theeuroagainstmajorworld currencies continued to be influenced in 2013 Q3 by monetary policy decisions in advanced economies (see Chart III.7.9). The exchange rate movements moderated compared to the previous quarter. Uncertainty regarding a reduction of bond purchases by the Fed favoured the euro, which appreciated against the dollar in July and August. The signs of a recovery in the euro area also appear favourable, while ECB monetary policy remains accommodative. Further appreciation of the euro against the dollar in September was prompted by the Fed’s decision to postpone the tapering of the monetary stimulus and by rising political uncertainty in the USA linked with the search for a consensus on the 2014 budget. At the end of September the euro was trading at USD 1.35, representing a year-on-year strengthening of the euro of more than 5%. In Q3 the euro also appreciated against the Japanese yen but weakened against the British pound. Japan’s economic reforms are now beginning to translate into a modest recovery, and inflation has turned positive, so no further extension of the monetary stimulus is likely. Although the recovery in the United Kingdom has strengthened further in recent months, the Bank of England has undertaken to maintain its current accommodative monetary policy stance until unemployment falls below 7%.
In the first half of October 2013, the euro strengthened slightly further against major currencies. This was mainly due to continuing depreciation of the dollar as the US Congress failed to find a consensus on the 2014 budget. The political crisis led to a partial government shutdown. Above all, however, it opened the issue of how the necessary reforms will be tackled in the future, as the October agreement merely postponed any definitive solution to next year.
TheOctoberCFexpects the euro to depreciate against the dollar (to USD 1.27) over the next two years. The euro should also continue to weaken
III. CURRENT ECONOMIC DEVELOPMENTS
euro appreciation
GBPUSD JPY
50
60
70
80
90
100
110
120
130
1/09 1/14 1/151/10 1/11 1/12 1/13
EUROEXCHANGERATEAGAINSTMAJORCURRENCIESTheeuroappreciatedagainstthedollarandtheyenin2013Q3(January 2009 = 100; source: Datastream, outlook from CF)
Chart III.7.9
CPICPI excluding energy and food prices
PPI (right-hand scale)
I/11 I/12 I/13I/09 I/10
-2
-1
0
1
2
3
4
-8
-4
0
4
8
12
16
INFLATIONANDPRODUCERPRICESINTHEUSAInflationhasbeenatrelativelylowlevelssince2012Q2(annual percentage changes; source: Datastream)
Chart III.7.8
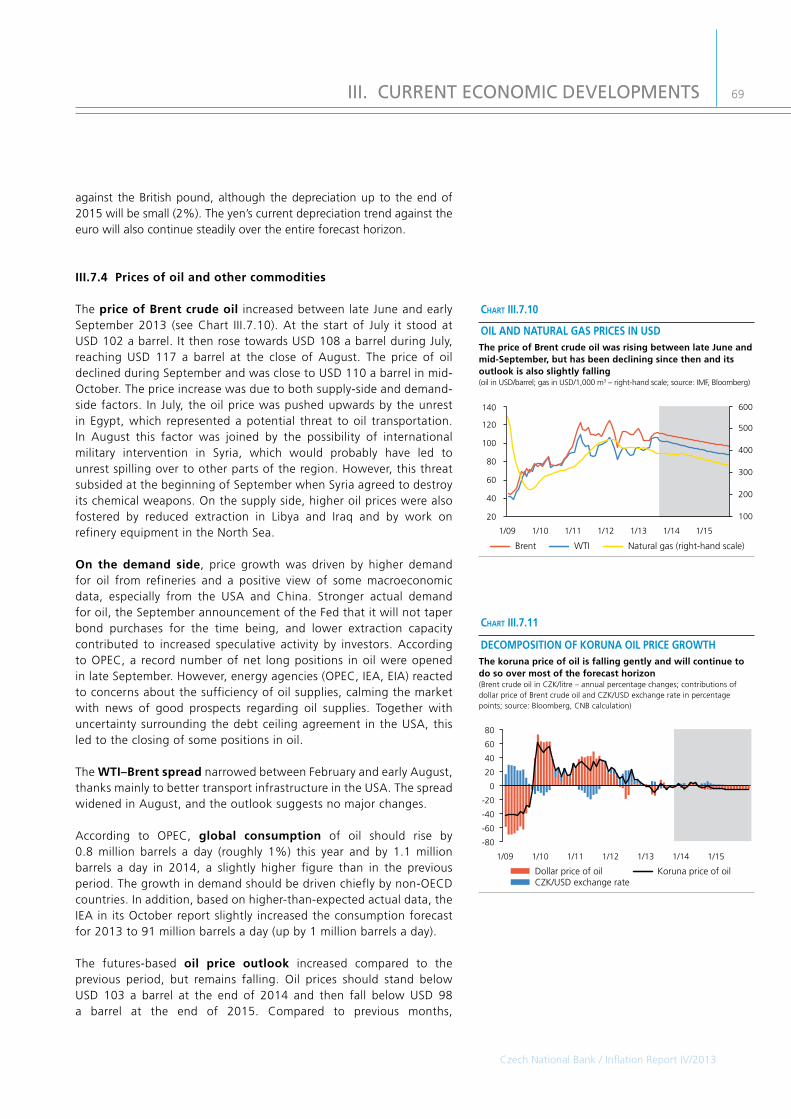
Czech National Bank / Inflation Report IV/2013
69
against the British pound, although the depreciation up to the end of 2015 will be small (2%). The yen’s current depreciation trend against the euro will also continue steadily over the entire forecast horizon.
III.7.4Pricesofoilandothercommodities
The priceofBrentcrudeoil increased between late June and early September 2013 (see Chart III.7.10). At the start of July it stood at USD 102 a barrel. It then rose towards USD 108 a barrel during July, reaching USD 117 a barrel at the close of August. The price of oil declined during September and was close to USD 110 a barrel in mid-October. The price increase was due to both supply-side and demand-side factors. In July, the oil price was pushed upwards by the unrest in Egypt, which represented a potential threat to oil transportation. In August this factor was joined by the possibility of international military intervention in Syria, which would probably have led to unrest spilling over to other parts of the region. However, this threat subsided at the beginning of September when Syria agreed to destroy its chemical weapons. On the supply side, higher oil prices were also fostered by reduced extraction in Libya and Iraq and by work on refinery equipment in the North Sea.
On the demand side, price growth was driven by higher demand for oil from refineries and a positive view of some macroeconomic data, especially from the USA and China. Stronger actual demand for oil, the September announcement of the Fed that it will not taper bond purchases for the time being, and lower extraction capacity contributed to increased speculative activity by investors. According to OPEC, a record number of net long positions in oil were opened in late September. However, energy agencies (OPEC, IEA, EIA) reacted to concerns about the sufficiency of oil supplies, calming the market with news of good prospects regarding oil supplies. Together with uncertainty surrounding the debt ceiling agreement in the USA, this led to the closing of some positions in oil.
The WTI–Brentspread narrowed between February and early August, thanks mainly to better transport infrastructure in the USA. The spread widened in August, and the outlook suggests no major changes.
According to OPEC, global consumption of oil should rise by 0.8 million barrels a day (roughly 1%) this year and by 1.1 million barrels a day in 2014, a slightly higher figure than in the previous period. The growth in demand should be driven chiefly by non-OECD countries. In addition, based on higher-than-expected actual data, the IEA in its October report slightly increased the consumption forecast for 2013 to 91 million barrels a day (up by 1 million barrels a day).
The futures-based oil price outlook increased compared to the previous period, but remains falling. Oil prices should stand below USD 103 a barrel at the end of 2014 and then fall below USD 98 a barrel at the end of 2015. Compared to previous months,
III. CURRENT ECONOMIC DEVELOPMENTS
-80
-60
-40
-20
0
20
40
60
80
Koruna price of oil
1/12 1/131/09 1/14 1/151/10 1/11
Dollar price of oilCZK/USD exchange rate
DECOMPOSITIONOFKORUNAOILPRICEGROWTHThekorunapriceofoilisfallinggentlyandwillcontinuetodosoovermostoftheforecasthorizon(Brent crude oil in CZK/litre – annual percentage changes; contributions of dollar price of Brent crude oil and CZK/USD exchange rate in percentage points; source: Bloomberg, CNB calculation)
Chart III.7.11
20
40
60
80
100
120
140
Natural gas (right-hand scale)Brent WTI
1/12 1/131/09 1/14 1/151/10 1/11
100
200
300
400
500
600
OILANDNATURALGASPRICESINUSDThepriceofBrentcrudeoilwasrisingbetweenlateJuneandmid-September,buthasbeendecliningsincethenanditsoutlookisalsoslightlyfalling(oil in USD/barrel; gas in USD/1,000 m3 – right-hand scale; source: IMF, Bloomberg)
Chart III.7.10

Czech National Bank / Inflation Report IV/2013
70
the October CF also has a higher but still falling outlook, expecting the price of Brent crude oil to be just over USD 108 a barrel at the end of 2014. The EIA also expects the Brent price to continue falling, averaging about USD 102 a barrel in 2014.
The overall energy commodity price index rose only marginally in the previous quarter and its outlook is slightly decreasing. By contrast, the non-energy commodity price index edged down in the same period, owing to food commodity prices. Their outlook and the outlook for the overall non-energy commodity price index are flat. Prices of industrial metals were unchanged overall in 2013 Q3, influenced on the one hand by positive data from advanced economies and on the other hand by the possibility of slower quantitative easing in the USA and slower growth in emerging economies. The outlook for industrial metal prices is slightly rising.
BOX 4The impact of the growth in unconventional gas extraction on global prices of energy commodities
The rapid rise in shale gas extraction in North America in recent years has not only considerably changed the situation on the natural gas market, but also affected the prices of other energy commodities, in particular coal. Surpluses of cheap energy coal are being exported from the USA to Europe, and US shale gas is thereby reducing prices of electricity and heat in Europe, including the Czech Republic (see section II.2). The higher coal consumption is also reducing demand for natural gas, forcing suppliers of pipeline gas in Europe to take current natural gas prices on local exchanges into account in their long-term contracts in addition to the price of oil.
There are a number of unanswered questions surrounding the future of shale gas extraction, for example whether the current increase in extraction in the USA is only temporary or is sustainable in the long term. Another question is whether the new technology (which was a precondition for economically viable extraction in the USA) can be applied in other parts of the world and whether it will also result in lower gas prices there. Sceptics regard the current boom in the USA as temporary, because shale gas was initially extracted from areas with the highest rock saturation (“sweet spots”) and is now gradually moving to less favourable conditions with lower yields. This is leading to higher costs and less economical production. Maintaining or increasing production in the USA therefore hinges on prices rising from their current low levels. The current EIA forecast reflects the rapid growth in natural gas prices in the USA this year and has also revised the price growth outlook for 2014 upwards. Growth in gas extraction in the USA should meanwhile slow (see Table 1).
III. CURRENT ECONOMIC DEVELOPMENTS
Industrial metalsTotal non-energy commodities
Energy commoditiesFood commodities
50
100
150
200
250
300
1/101/09 1/14 1/151/11 1/12 1/13
COMMODITY PRICESPrices of energy commodities went up slightly in 2013 Q3 owing to rising prices of oil, while non-energy commodities stagnated(January 2007 = 100; source: Bloomberg)
Chart III.7.12
Note: The structure of the non-energy commodity indices corresponds to the composition of the Economist‘s commodity indices; the energy commodity index consists of Brent crude oil (0.4), coal (0.4) and natural gas (0.2).
2011 2012 2013 2014
Natural gas price USD/MBtu 4.0 2.8 3.7 4.0
in USA (Henry Hub) y-o-y in % -31.3 35.0 7.9
Gas production in USA
bcf/d 62.7 65.8 66.4 66.8
y-o-y in % 4.8 1.0 0.6
Note: MBtu = million British thermal units, bcf = billion cubic feet
table 1 (box)
EIA FORECAST FOR NATURAL GAS PRICES AND EXTRACTION VOLUMES IN THE USA The rapid growth in natural gas extraction in the USA should gradually slow and the gas price growth this year should almost offset the plunge in 2012. Prices should continue rising next year(prices in US dollars per MBtu; production in bcf per day; source: EIA)
Conventional Shale gas Coalbed methane
USA 3–7 3–7 3–7
Europe 5–9 5–10 5–9
China 4–8 4–8 3–8
Russia 0–2, 3–7* - 3–5
Qatar 0–2 - -
* The lower range for Russia represents production from the traditional producing regions of Western Siberia and the Volga-Urals; the higher range is for projects in new onshore regions such as Eastern Siberia and offshore and Arctic developments.
Note: MBtu = million British thermal units
table 2 (box)
APPROXIMATE INVESTMENT AND OPERATING COSTS OF NATURAL GAS EXTRACTION IN VARIOUS REGIONS Extraction costs are lowest in the USA and highest in Europe(year-2010 dollars per MBtu; source: IEA)

Czech National Bank / Inflation Report IV/2013
71
The extractioncosts for conventional and unconventional gas are converging as conventional extraction gradually moves from easily accessible but exhausted mainland reservoirs to tougher locations (onshore and offshore). The costs differ significantly across various regions of the world (see Table 2). For the USA, the IEA estimates the break-even costs for unconventional extraction at USD 5–7 per MBtu; if the reservoir also contains a liquid component, the costs may be only USD 3 per MBtu. In Europe, both conventional and unconventional extraction is more expensive owing to a more complex geology. Potential arbitrage between the two markets is complicated by the cost of LNG liquefaction and transport. Gas prices are therefore higher in Europe than in the USA (see Chart 1).
An IEA study of 2012 (Golden Rules for a Golden Age of Gas) also indicates that the pricedifferences across regions will persist. It simulates two possible future scenarios for unconventional gas extraction. The optimal scenario (the “Golden Rules Case”) assumes that the conditions are in place for a global expansion of supply from all important reservoirs. By contrast, the adverse scenario assumes that the environmental and other obstacles facing this type of extraction in many parts of the world will not be overcome. A gas price forecast was modelled for various regions on the basis of these scenarios (see Table 3). Although current gas prices are significantly outside the forecast band (especially in Europe and Japan), it can be inferred from the table that not even the optimal conditions for unconventional extraction will prevent future growth in natural gas prices. This growth is naturally more pronounced for sub-optimal extraction, but even in the optimal case it is not realistic to expect natural gas prices in Europe to fall to the US level.
III. CURRENT ECONOMIC DEVELOPMENTS
Russian pipeline gas in Germany (IMF)Indonesian LNG in Japan (IMF)
Gas price at US Henry Hub terminal (NYMEX futures)Spot price at US Henry Hub terminal (IMF)
Market gas price at NBP in UK (ICE futures)
I/09 I/12 I/13I/10 I/11
0
5
10
15
20
NATURALGASPRICESINDIFFERENTREGIONSNaturalgaspricesdiffermarkedlyacrossregions;inEurope,pipelinegasprices(RussiangasinGermany)areconvergingtostockmarketpricesattheICE(US dollars per MBtu; source: Bloomberg)
Chart 1 (box)
History Optimalextraction Sub-optimalextraction
2010 2020 2035 2020 2035
USA 4.4 5.4 7.1 6.7 10.0
Europe 7.5 10.5 10.8 11.6 13.1
Japan 11.0 12.4 12.6 14.3 15.2
Note: MBtu = million British thermal units
table 3 (box)
IEASCENARIOSFORNATURALGASPRICESBothscenariosassumefuturepricegrowth,moresoforsub-optimalextraction.Pricedifferencesbetweenmajorregionsremain(year-2010 dollars per MBtu; source: IEA)

72
Czech National Bank / Inflation Report IV/2013
CHARTS IN THE TEXT
Chart I.1 Fulfilment of the inflation target 6Chart I.2 Headline inflation forecast 6Chart I.3 Monetary-policy relevant Inflation forecast 6Chart I.4 Interest rate forecast 7Chart I.5 Exchange rate forecast 7Chart I.6 GDP growth forecast 7Chart I.7 3M PRIBOR – comparison of the baseline and alternative scenario 8Chart I.8 Headline inflation – comparison of the baseline and alternative scenario 8
Chart II.1.1 Effective GDP in the euro area 11Chart II.1.2 Effective PPI in the euro area 11Chart II.1.3 Effective CPI in the euro area 11Chart II.1.4 3M EURIBOR 12Chart II.1.5 Euro-dollar exchange rate 12Chart II.1.6 Price of Brent crude oil 12Chart II.2.1 Headline inflation and monetary-policy relevant Inflation 13Chart II.2.2 Administered prices and fuel prices 13Chart II.2.3 Net Inflation and adjusted inflation excluding fuels 14Chart II.2.4 Food prices and agricultural producer prices 14Chart II.2.5 Fuel prices and oil prices 14Chart II.2.6 Interest rate forecast 15Chart II.2.7 Exchange rate forecast 15Chart II.2.8 Costs in the consumer sector 15Chart II.2.9 Costs in the intermediate goods sector 16Chart II.2.10 Gap in profit mark-ups in the consumer sector 16Chart II.2.11 Average nominal wage 16Chart II.2.12 GDP growth forecast 17Chart II.2.13 Annual GDP growth structure 17Chart II.2.14 Number of employees (full-time equivalent) 17Chart II.2.15 Labour market forecast 18Chart II.2.16 Real household and government consumption 18Chart II.2.17 Nominal disposable income 18Chart II.2.18 Household saving rate 19Chart II.2.19 Gross capital formation 19Chart II.2.20 Real exports and imports 19Chart II.3.1 Change in the headline inflation forecast 23Chart II.3.2 Change in the net inflation forecast 23Chart II.3.3 Change in the interest rate path 24Chart II.3.4 Decomposition of changes in the interest rate forecast 24Chart II.3.5 Change in the exchange rate forecast 25Chart II.3.6 Change in the GDP forecast 26Chart II.4.1 Alternative scenario – 3M PRIBOR 27Chart II.4.2 Alternative scenario – headline inflation 27Chart II.4.3 Alternative scenario – real GDP 28Chart II.5.1 Perceived and expected inflation 29Chart II.5.2 FRA rates versus the CNB forecast 30
Chart III.1.1 Forecast versus actual inflation 31Chart III.1.2 Inflation 33Chart III.1.3 Inflation components 33Chart III.1.4 Structure of inflation 34Chart III.1.5 Food prices 34
73
Czech National Bank / Inflation Report IV/2013
CHARTS IN THE TEXT
Chart III.1.6 Adjusted inflation excluding fuels 34Chart III.2.1 Import prices and producer prices 36Chart III.2.2 Import prices 36Chart III.2.3 Mineral fuels 36Chart III.2.4 Industrial producer prices 37Chart III.2.5 Producer prices by main industrial groupings 37Chart III.2.6 Prices of metals and refined petroleum products 38Chart III.2.7 Agricultural producer prices 38Chart III.2.8 Other price categories 39Chart III.3.1 Gross domestic product 40Chart III.3.2 Structure of annual GDP growth 40Chart III.3.3 Household consumption expenditure 40Chart III.3.4 Disposable income 41Chart III.3.5 Structure of household consumption 41Chart III.3.6 Confidence indicators 41Chart III.3.7 Investment by sector 42Chart III.3.8 Fixed capital formation 42Chart III.3.9 Investment In dwellings 43Chart III.3.10 Net exports 44Chart III.3.11 Exports and imports 44Chart III.3.12 Contributions of branches to GVA growth 45Chart III.3.13 Industrial production 45Chart III.3.14 Barriers to growth in industry 45Chart III.3.15 New orders in industry 46Chart III.3.16 Economic sentiment 46Chart III.3.17 Potential output 46Chart III.3.18 Output gap 47Chart III.3.19 Contributions to potential output growth 47Chart III.4.1 Labour market indicators 48Chart III.4.2 Number of employees (full-time equivalent) 48Chart III.4.3 Employment breakdown by branches 49Chart III.4.4 Unemployment rate 49Chart III.4.5 Beveridge curve 49Chart III.4.6 Average wage 50Chart III.4.7 Whole-economy productivity 50Chart III.4.8 Unit labour costs 51Chart III.5.1 Monetary aggregates 52Chart III.5.2 Main components of M2 52Chart III.5.3 Deposit structure of M2 52Chart III.5.4 Loans to non-financial corporations 53Chart III.5.5 Loans to non-financial corporations broken down by ownership 54Chart III.5.6 Loans to households 54Chart III.5.7 Structure of number of new mortgages 54Chart III.5.8 Household debt 55Chart III.5.9 CNB key rates 55Chart III.5.10 Market interest rates 55Chart III.5.11 Interest rate differentials 56Chart III.5.12 Government bond yield curve 56Chart III.5.13 Interest rates on loans to corporations 57Chart III.5.14 Interest rates on loans to households 57Chart III.5.15 Client and market interest rate spreads 57Chart III.5.16 Interest rates on deposits 58

74
Czech National Bank / Inflation Report IV/2013
CHARTS IN THE TEXT
Chart III.5.17 Ex ante real rates 58Chart III.5.18 CZK/EUR and CZK/USD exchange rates 58Chart III.5.19 Key financial indicators 59Chart III.5.20 Financial liabilities of non-financial corporations 60Chart III.5.21 Structure of household financial assets 60Chart III.5.22 Transaction and asking prices of apartments 61Chart III.5.23 Apartment price sustainability indicators 61Chart III.6.1 Current account 62Chart III.6.2 Trade balance 62Chart III.6.3 Balance of services 62Chart III.6.4 Income balance 63Chart III.6.5 Financial account 63Chart III.6.6 Direct investment 63Chart III.6.7 Portfolio investment 64Chart III.6.8 CNB international reserves 64Chart III.7.1 GDP in the euro area 65Chart III.7.2 Euro area GDP and inflation outlooks for 2013 65Chart III.7.3 Inflation and producer prices in the euro area 66Chart III.7.4 GDP in Germany 66Chart III.7.5 Inflation and producer prices in Germany 66Chart III.7.6 GDP in the USA 67Chart III.7.7 US GDP and inflation outlooks for 2013 67Chart III.7.8 Inflation and producer prices in the USA 68Chart III.7.9 Euro exchange rate against major currencies 68Chart III.7.10 Oil and natural gas prices in USD 69Chart III.7.11 Decomposition of koruna oil price growth 69Chart III.7.12 Commodity prices 70

75
Czech National Bank / Inflation Report IV/2013
TABLES IN THE TEXT
Table II.2.1 Forecast of administrative effects 13Table II.2.2 Forecasts of selected variables 20Table II.2.3 Balance of payments forecast 20Table II.2.4 Fiscal forecast 21Table II.5.1 Expected indicators of FMIE and corporations 29Table II.5.2 CF expected indicators 29
Table III.1.1 Fulfilment of the inflation forecast 31Table III.1.2 Fulfilment of the external assumptions 32Table III.1.3 Fulfilment of the forecast for key variables 32Table III.2.1 Structure of import price inflation 37Table III.4.1 Wages, productivity, unit labour costs 50Table III.5.1 Changes in banks’ credit conditions 53Table III.5.2 Performance indicators of corporations 59

76
Czech National Bank / Inflation Report IV/2013
ABBREVIATIONS
APRC annual percentage rate of charge
CF Consensus Forecasts
CNB Czech National Bank
CPI consumer price index
CZK Czech koruna
CZSO Czech Statistical Office
COSMC Czech Office for Surveying, Mapping and Cadastre
ECB European Central Bank
EDP Excessive Deficit Procedure
EIA Energy Information Administration
EIB European Investment Bank
ESA 95 European System of National Accounts
ESCB European System of Central Banks
EU European Union
EUR euro
EURIBOR Euro Interbank Offered Rate
FDI foreign direct investment
Fed US central bank
FMIE Financial Market Inflation Expectations
FRA forward rate agreement
GBP pound sterling
GDP gross domestic product
GVA gross value added
HICP Harmonised Index of Consumer Prices
HP filter Hodrick-Prescott filter
ICE Intercontinental Exchange
IEA International Energy Agency
ILO International Labour Organization
IMF International Monetary Fund
IRI Institute for Regional Information
IRS interest rate swap
JPY Japanese yen
LFS Labour Force Survey
LIBOR London Interbank Offered Rate
LNG liquefied natural gas
LTROs long-term refinancing operations
M1, M2, M3 monetary aggregates
MLSA Ministry of Labour and Social Affairs
OECD Organisation for Economic Co-operation and Development
OPEC Organization of the Petroleum Exporting Countries
PMI Purchasing Managers Index
pp percentage points
PPI producer price index
PRIBOR Prague Interbank Offered Rate
(1W, 1M, 1Y) (one-week, one-month, one-year)
repo rate repurchase agreement rate
USD US dollar
VAT value added tax
WTI West Texas Intermediate

77
Czech National Bank / Inflation Report IV/2013
BOXES AND ANNEXES CONTAINED IN INFLATION REPORTS
Forecastsforgeneralgovernmentdebtanddebtservice,andsensitivityanalyses (Box) I/2011
Price-settingbehaviourintheCzechRepublic(microdataevidence)inrelationtothepricingmechanismintheg3forecastingmodel (Box) II/2011
TherelationshipbetweentheBrentcrudeoilpriceandthedollarexchangerate (Box) II/2011
TheimpactsofchangestoVATratesonthebudgetandinflationandtheircomponentsin2012and2013 (Box) III/2011
Labourmarketdevelopmentsduringtheeconomicrecessionandthesubsequentrecovery (Box) III/2011
ThedebtsituationinItaly (Box) III/2011
PublicationoftheGraphofRiskstotheInflationProjection(GRIP) (Annex) III/2011
Pensionsystemreform (Box) IV/2011
ThecreditratingoftheCzechRepublic (Box) IV/2011
Germany–theCzechRepublic’smaintradingpartner (Box) IV/2011
Thepass-throughofVATtofoodpricesattheendof2011 (Box) I/2012
Extraordinaryrevisionofthequarterlynationalaccounts (Box) I/2012
AnanalysisoftheimpactsoffiscalmeasuresintheCzechRepublicin2001–2011 (Box) I/2012
Revisionoftheconsumerbasket (Box) II/2012
Factorsaffectingretailfuelprices (Box) II/2012
TheBankLendingSurvey (Box) III/2012
TheCZK/USDexchangerateatatimeofuncertainty (Box) III/2012
Easymonetarypolicyandcommodityprices (Box) III/2012
Thehouseholdsavingrate (Box) IV/2012
Consumptionandmoneysavingsbyhouseholdincomegroup (Box) IV/2012
TheshareofreinvestedearningsintotalFDIincome (Box) IV/2012
Revisionofthequarterlynationalaccounts (Box) I/2013
Consumption,savingsanddebtburdenofhouseholdincomegroupsin2012 (Box) III/2013
TheannouncedreductionofquantitativeeasingintheUSAanditseffectonyieldcurves (Box) III/2013
Usingtheexchangerateasaninstrumenttoeasethemonetaryconditions (Box) IV/2013
Newsteady-statesettingsintheg3model (Box) IV/2013
Comparisonofcorporateinvestmentandemploymentfromtheperspectiveofownershipandreinvestment (Box) IV/2013
Theimpactofthegrowthinunconventionalgasextractiononglobalpricesofenergycommodities (Box) IV/2013

78
Czech National Bank / Inflation Report IV/2013
This glossary explains some terms frequently used in the Inflation Report. A more detailed glossary can be found on the CNB website (www.cnb.cz/en/general/glossary/index.html).
Adjustedinflationexcludingfuels: The increase in prices of non-food items of the consumer basket excluding items with administered prices, indirect tax changes and fuels.
Administered prices: A sub-category of the consumer basket consisting of items with price ceilings (set at either central or local level), prices regulated on a cost-plus basis (items whose prices may only reflect economically justified costs and a reasonable profit) and administratively fixed fees. The selection of these items is based on the Price Bulletin of the Czech Ministry of Finance.
Balanceofpayments: Records economic transactions with other countries (i.e. between residents and non-residents) over a particular period. The basic structure of the balance of payments includes the current account, the capital and financial accounts and the change in CNB international reserves.
Bid-to-coverratio:The ratio of total demand to demand coverage in primary auctions of medium-term and long-term government bonds.
ConsensusForecasts: A regular monthly publication issued by Consensus Economics bringing together the forecasts of hundreds of prominent economists and analytical teams regarding future world developments. The CNB uses these predictions in its macroeconomic forecast when forming assumptions regarding the future development of the external environment.
Coveredbond: A bond collateralised (backed) by long-term assets, usually mortgage loans or public sector loans. The issuers are mostly banks and the issuance of covered bonds is subject to strict legislative rules. Compared to standard bonds, this type of bond has lower credit risk thanks to higher coverage (known as dual recourse), which gives the covered bond holder a preferential claim on the issuer’s receivables underlying the mortgage loans or public sector loans and likewise a claim on the issuer. If the issuer defaults, the holder therefore has a preferential right to the assets backing the covered bond.
Currentaccount: Records exports and imports of goods and services, income from capital, investment and labour and unrequited transfers.
Cyclicalcomponentofthegeneralgovernmentbalance: Expresses the effect of the business cycle on the general government fiscal balance.
Discountrate:A monetary policy rate which as a rule represents the floor for short-term money market interest rates. The CNB applies it to the excess liquidity which banks deposit with the CNB overnight under the deposit facility.
Disinflation:A decline in inflation.
Effective euro area indicators: Proxy for the effect of economic activity (effective GDP) and inflation (effective producer prices and consumer prices) in the euro area on the Czech economy. The weights used in the calculation are the shares of the individual euro area economies in the foreign trade turnover of the Czech Republic.
Effectiveexchangerate:Shows the appreciation (index > 100) or depreciation (index < 100) of the national currency against a basket of selected currencies for a certain time period relative to a base period. The weights applied in the basket are the shares of major trading partners in foreign trade turnover.
Escapeclause:Excuses the central bank from its obligation to hit the inflation target. In the flexible inflation targeting regime, it is applied in the event of large shock changes in exogenous factors (particularly supply-side shocks, e.g. indirect tax changes) that are completely or largely outside the purview of central bank monetary policy.
GLOSSARY

79
Czech National Bank / Inflation Report IV/2013
Euroarea:The territory of all Member States of the European Union that have adopted the euro as a single currency pursuant to the Treaty Establishing the European Community.
Financial account: Records transactions connected with the creation, liquidation and change in ownership of the financial assets and liabilities of the government, the banking and corporate sectors and other entities vis-à-vis the rest of the world. It consist of direct investment, portfolio investment, other investment and financial derivatives transactions.
Fiscalstance:The annual change in the general government structural balance (in percentage points). A positive figure indicates fiscal restriction and a negative figure indicates fiscal expansion.
Foodprices: In CNB documents, the term food prices refers to the consolidated category of prices of food and non-alcoholic beverages and prices of alcoholic beverages and tobacco.
General government balance: Revenues minus expenditures of the general government sector. A negative government balance is called a general government deficit and a positive government balance is called a general government surplus.
Generalgovernmentprimarybalance:The general government balance net of interest payments (i.e. debt service).
General government structural balance: The cyclically adjusted general government balance adjusted for extraordinary one-off operations. It captures the structural configuration of fiscal policy.
Goodsandservicesbalance:The sum of the trade balance and the services balance.
GrossDomesticProduct(GDP):The key indicator of economic development. It represents the sum of the value added by all economic sectors. In terms of use it consists of expenditure on final consumption (consumption of households, the government and non-profit institutions), gross capital formation (fixed investment and changes in inventories) and foreign trade (net exports of goods and services).
Inflation:Commonly, inflation is considered to be recurring growth of most prices in the economy. It means a decrease in the real value (i.e. purchasing power) of a given currency relative to the goods and services which consumers buy – if there is inflation in the economy, consumers need ever more currency units of the given country to buy the same basket of goods and services. In practice, inflation is measured by the increment of the consumer price index.
Inflation pressures: Proxied in the CNB’s modelling system by the real marginal cost gap in the consumer goods sector. Total inflation pressures are divided into domestic inflation pressures (in the intermediate goods sector) and imported inflation pressures (in the import price sector).
Inflationrate:The increase in the average (basic) consumer price index for the last 12 months relative to the average for the previous 12 months.
Inflationtarget:The level of consumer price inflation that the CNB endeavours to achieve, set publicly and well in advance.
Lombardrate:A monetary policy interest rate which provides a ceiling for short-term interest rates on the money market. The CNB applies it to the liquidity which it provides to banks overnight under the lending facility.
GLOSSARY

80
Czech National Bank / Inflation Report IV/2013
Monetaryaggregates:Represent the amount of money in the economy covered in the monetary survey. According to the national definition, they are calculated from the monetary liabilities of resident monetary financial institutions to other resident sectors in the Czech Republic (households, non-financial corporations and financial institutions excluding the general government). Monetary aggregates differ according to the degree of liquidity of the individual components. The narrow monetary aggregate M1 comprises currency in circulation and overnight deposits. The broad monetary aggregate M2 comprises M1 plus total deposits with agreed maturity and redeemable at notice and repurchase agreements. The broad monetary aggregate M3 (harmonised with EU standards) comprises currency in circulation, overnight deposits, deposits with agreed maturity of up to two years, deposits redeemable at notice of up to three months, repurchase agreements, money market fund shares/units and issued debt securities with maturity of up to two years.
Monetaryconditions:Represent the combined effect of interest rates (the interest rate component of the monetary conditions) and the exchange rate (the exchange rate component) on the economy. These are the key variables through which monetary policy can affect economic activity and, through it, inflation. Interest rates and the exchange rate do not necessarily affect the economy in the same direction.
Monetary policy horizon: The time horizon which monetary policy-makers focus on when making decisions and which takes into account the monetary policy transmission lag. This horizon is about 12–18 months ahead.
Monetarypolicyinterestrates:Short-term interest rates associated with monetary policy-making. They comprise the two-week repo rate, the discount rate and the Lombard rate.
Monetary-policy relevant inflation: Inflation to which monetary policy reacts. It is defined as headline inflation adjusted for the first-round effects of changes to indirect taxes.
Moneymarket:The part of the financial markets which is used to obtain short-term loans and where debt instruments maturing in less than one year are traded. T-bills are typical securities traded on this market. Within this market the CNB carries out its repo operations.
Netinflation:Consumer price inflation net of administered prices and adjusted for the first-round effects of changes to indirect taxes. Net inflation consists of food price inflation, fuel price inflation and adjusted inflation excluding fuels. Until the end of 2001, the CNB’s inflation targets were set in terms of net inflation. Since 2002, the CNB has targeted headline inflation, using net inflation for analytical purposes only.
Nominalcostsintheconsumptionsector: These comprise output prices in the intermediate goods sector and import sector, as final consumption goods are produced using inputs from these sectors. They also include “export-specific technology”, which approximates the productivity differential between the tradables sector and the non-tradables sector and its price effect, known as an analogy to the Balassa-Samuelson effect.
Nominalcostsintheintermediategoodssector:Co-determined by prices of production factors, i.e. labour costs and the price of capital. In addition to these components, they are determined by “labour-augmenting technology”. This technology can be understood as a concept similar to total factor productivity, e.g. in the Cobb-Douglas production function.
Nominal unit labour costs: The labour costs needed to produce a unit of output. Nominal unit labour costs are calculated as the ratio of the nominal volume of wages and salaries to GDP at constant prices.
Price-to-disposableincomeratio:The ratio of the price of an apartment to the sum of disposable income over the last four quarters. Higher values of this indicator usually mean that apartments are overpriced. The index is calculated from property transaction prices; the latest data are estimated from asking prices.
GLOSSARY

81
Czech National Bank / Inflation Report IV/2013
81
Czech National Bank / Inflation Report IV/2013
Price-to-rentratio:Indicator of sustainability of apartment prices, calculated as the ratio of the price of the apartment to the annual rent. The price-to-rent ratio is the inverse of the rent return. Higher values of this indicator usually mean that apartments are overpriced. This indicator is calculated from asking rents and asking prices of apartments according to the Institute for Regional Information.
Price-to-wageratio:The ratio of the price of an apartment to the sum of the annual wage over the last four quarters. Higher values of this indicator usually mean that apartments are overpriced. The index is calculated from property transaction prices; the latest data are estimated from asking prices.
Producers’margins:The inverse of producers’ real marginal costs in the relevant sector. Growth in producers’ nominal costs without corresponding growth in the price of production causes a decline in the profit margin, i.e. an increase in real marginal costs. If prices in the sector were perfectly flexible, the price at any given moment would comprise a constant margin over marginal nominal costs. In the consumer sector, a gap in profit mark-ups represents a deviation from the long-term margin level.
Propertyaskingprices:Property sale asking prices in estate agencies. Asking prices should be higher than transaction prices. Property asking prices in the Czech Republic are published, for example, by the CZSO and the Institute for Regional Information (IRI).
Propertytransactionprices: Prices based, on the one hand, on Ministry of Finance statistics from property transfer tax returns and published by the CZSO. These prices are the closest to actual market prices in terms of methodology, but are published with a time delay. The second, alternative source of data on transaction prices is CZSO data from a survey in estate agencies, for which the time lag is considerably shorter.
Reporate:The CNB’s key monetary policy rate, paid on commercial banks’ excess liquidity as withdrawn by the CNB in two-week repo tenders.
Technological growth: The situation where the volume of production rises without an increase in the production factors of labour or capital. Growth in technology thus causes the real volume of production to rise given a constant price of production, or the output price to fall relative to input prices given a constant real volume of production.
Unemployment rate: The ratio of the number of unemployed persons to the total labour force. We distinguish between the general unemployment rate, as determined by the CZSO according to International Labour Organisation methodology, and the share of unemployed persons, as determined by the Ministry of Labour and Social Affairs.
GLOSSARY

82
KEYMACROECONOMICINDICATORSyears
2005 2006 2007 2008 2009 2010 2011 2012 2013 2014 2015DEMANDANDSUPPLYGross domestic productGDP CZK bn, constant p. of 2005, seas. adjusted 3,113.5 3,338.4 3,529.4 3,632.1 3,473.9 3,554.0 3,619.0 3,585.0 3,552.1 3,606.9 3,714.6GDP %, y-o-y, real terms, seas. adjusted 6.8 7.2 5.7 2.9 -4.4 2.3 1.8 -0.9 -0.9 1.5 3.0
Household consumption %, y-o-y, real terms, seas. adjusted 3.0 4.4 4.1 2.9 0.3 0.9 0.5 -2.1 0.4 1.4 1.9Government consumption %, y-o-y, real terms, seas. adjusted 1.6 -0.6 0.4 1.2 4.0 0.2 -2.7 -1.9 1.0 0.5 0.8Gross capital formation %, y-o-y, real terms, seas. adjusted 4.5 10.6 15.5 1.5 -20.0 5.1 0.9 -4.8 -9.7 0.0 3.4Exports of goods and,services %, y-o-y, real terms, seas. adjusted 11.9 14.3 11.2 3.5 -10.5 15.0 9.6 4.7 0.5 7.0 8.0Imports of goods and,services %, y-o-y, real terms, seas. adjusted 6.1 11.2 12.8 2.3 -11.7 14.9 7.0 2.5 -0.8 6.6 7.3Net exports CZK bn, constant p. of 2005, seas. adjusted 84.8 156.3 139.3 174.7 185.3 213.3 297.2 370.1 406.4 445.5 500.8
Coincidence indicatorsIndustrial production %, y-o-y, real terms 3.9 8.3 10.6 -1.8 -13.6 8.6 5.9 -0.8 - - -Construction output %, y-o-y, real terms 5.2 6.0 7.1 0.0 -0.9 -7.4 -3.6 -7.6 - - -Receipts in retail sales %, y-o-y, real terms 8.1 10.8 10.0 2.7 -4.7 1.5 1.7 -1.1 - - -
PRICESMain price indicatorsInflation rate %, end-of-period 1.9 2.5 2.8 6.3 1.0 1.5 1.9 3.3 - - -Consumer Price Index %, y-o-y, average 1.9 2.5 2.8 6.4 1.1 1.5 1.9 3.3 1.4 0.6 2.0
Regulated prices (18.70%)* %, y-o-y, average 5.7 9.3 4.8 15.6 8.4 2.6 4.7 8.6 2.3 -0.9 2.6Net inflation (81.30%)* %, y-o-y, average 0.7 0.4 1.7 2.4 -0.9 0.0 1.3 1.0 0.5 0.7 1.7
Food prices (including alcoholic beverages and,tobacco) (24.58%)* %, y-o-y, average 0.0 -0.2 3.8 3.0 -0.9 0.9 3.9 2.9 3.1 1.7 2.0Adjusted inflation excluding fuels (53.32%)* %, y-o-y, average 0.7 0.6 0.7 2.0 0.0 -1.2 -0.7 -0.3 -0.6 0.4 1.6Fuel prices (3.39%)* %, y-o-y, average 7.8 3.7 -0.3 4.3 -11.1 11.8 9.9 6.0 -2.2 -1.1 -0.5
Monetary-policy inflation (excluding tax changes) %, y-o-y, average 1.8 2.3 2.2 4.4 0.9 0.4 1.9 2.1 0.6 0.4 1.8GDP deflator %, y-o-y, seas. adjusted -0.3 0.5 3.3 1.9 2.3 -1.6 -0.9 1.6 1.7 0.7 1.8
Partial price indicatorsProducer prices %, y-o-y, average 3.1 1.5 4.1 4.5 -3.1 1.2 5.6 2.1 0.7 -0.6 1.4Agricultural prices %, y-o-y, average -10.0 1.3 16.4 10.8 -24.3 7.7 22.7 3.6 5.1 -4.2 1.6Construction work prices %, y-o-y, average 3.0 2.9 3.9 4.5 1.2 -0.2 -0.5 -0.7 - - -Brent crude oil %, y-o-y, average 45.0 18.4 11.4 35.4 -36.5 28.4 38.2 0.7 -2.5 -3.0 -5.8
LABOURMARKETAverage monthly wage %, y-o-y, nominal terms 5.0 6.6 7.2 7.8 3.3 2.2 2.5 2.7 0.4 2.2 2.8Average monthly wage %, y-o-y, real terms 3.0 4.0 4.3 1.4 2.3 0.7 0.6 -0.6 -1.0 1.6 0.8Number of employees %, y-o-y 2.0 1.1 1.8 1.6 -2.2 -2.2 0.0 -0.1 2.2 0.7 0.4Unit labour costs %, y-o-y 0.6 0.2 2.4 4.3 2.6 -1.7 0.4 2.9 0.6 1.2 1.4Unit labour costs in industry %, y-o-y -7.2 -7.2 2.4 -3.3 5.4 -5.7 0.4 4.4 - - -Aggregate labour productivity %, y-o-y 4.6 5.6 3.5 0.8 -2.8 3.5 1.9 -1.4 -2.2 1.3 2.8ILO general unemployment rate %, average, age 15–64 8.0 7.2 5.4 4.4 6.7 7.4 6.8 7.0 7.1 7.6 7.6Share of unemployed %, average 6.6 6.1 4.9 4.1 6.2 7.0 6.7 6.8 7.7 8.0 7.7
PUBLICFINANCEPublic finance deficit (ESA95) CZK bn, current p. -101.1 -79.2 -26.7 -85.0 -217.4 -177.1 -121.9 -169.4 -102.6 -99.9 -107.9Public finance deficit / GDP** %, nominal terms -3.2 -2.4 -0.7 -2.2 -5.8 -4.7 -3.2 -4.4 -2.6 -2.5 -2.6Public debt (ESA95) CZK bn, current p. 885.4 948.1 1,023.4 1,104.3 1,299.3 1,454.4 1,583.3 1,775.4 1,814.8 1,913.8 2,022.8Public debt / GDP** %, nominal terms 28.4 28.3 27.9 28.7 34.6 38.4 41.4 46.2 46.9 48.4 48.7EXTERNALRELATIONSCurrent account
Trade balance CZK bn, current p. 48.6 59.3 46.9 25.7 87.3 53.8 90.3 145.8 200.3 240.0 270.0Trade balance / GDP %, nominal terms 1.6 1.8 1.3 0.7 2.3 1.4 2.4 3.8 5.2 6.1 6.5Balance of services CZK bn, current p. 37.9 49.0 59.2 73.9 73.9 75.3 58.4 49.8 64.9 70.0 75.0Current account CZK bn, current p. -30.9 -67.1 -156.9 -81.3 -89.3 -146.6 -104.0 -94.0 -45.4 -10.0 5.0Current account / GDP %, nominal terms -1.0 -2.0 -4.3 -2.1 -2.4 -3.9 -2.7 -2.4 -1.2 -0.3 0.1
Foreign direct investmentDirect investment CZK bn, current p. 279.6 90.3 179.1 36.3 37.7 95.0 46.8 181.1 50.0 65.0 75.0
Exchange ratesCZK/USD average 24.0 22.6 20.3 17.1 19.1 19.1 17.7 19.6 19.5 19.9 20.0CZK/EUR average 29.8 28.3 27.8 25.0 26.5 25.3 24.6 25.1 25.8 25.7 25.4CZK/EUR %, y-o-y, real (CPI euro area), avg. -6.3 -5.1 -2.2 -12.5 5.4 -4.6 -2.0 1.5 2.8 1.0 -0.9CZK/EUR %, y-o-y, real (PPI euro area), avg. -5.6 -1.4 -3.8 -8.8 4.3 -3.2 -2.7 2.6 1.7 1.9 -0.2
Foreign trade pricesPrices of exports of goods %, y-o-y, average -1.5 -1.2 1.3 -4.6 0.2 -1.0 1.7 2.9 0.5 0.2 0.8Prices of imports of goods %, y-o-y, average -0.5 0.3 -1.0 -3.3 -3.5 2.0 4.3 4.2 -0.7 -0.1 0.1
MONEYANDINTERESTRATESM2 %, y-o-y, average 6.0 9.5 11.6 9.5 5.7 4.3 3.6 5.6 4.4 3.9 3.62W repo rate %, end-of-period, CNB forec. = avg. 2.00 2.50 3.50 2.25 1.00 0.75 0.75 0.05 -0.14 -0.42 0.643M PRIBOR %, average 2.0 2.3 3.1 4.0 2.2 1.3 1.2 1.0 0.3 0.0 1.0
KEY MACROECONOMIC INDICATORS
* in brackets are constant weights in actual consumer basket** CNB calculation– data are not available / forecasted / releaseddata in bold = CNB forecast

83
Czech National Bank / Inflation Report IV/2013
83KEY MACROECONOMIC INDICATORS
2011 2012 2013 2014 2015QI QII QIII QIV QI QII QIII QIV QI QII QIII QIV QI QII QIII QIV QI QII QIII QIV
903.5 905.5 905.8 904.3 901.0 897.6 894.7 891.7 879.9 885.6 887.3 899.4 890.0 897.4 907.1 912.5 918.8 925.2 931.8 938.93.0 2.1 1.5 0.8 -0.3 -0.9 -1.2 -1.4 -2.3 -1.3 -0.8 0.9 1.1 1.3 2.2 1.5 3.2 3.1 2.7 2.90.4 0.3 1.0 0.5 -1.4 -1.9 -2.1 -3.1 -1.2 0.0 1.3 1.5 0.9 1.4 1.5 1.7 1.8 1.9 2.0 2.0
-0.9 -2.5 -4.1 -3.2 -2.8 -2.5 -1.5 -0.9 1.4 1.8 0.6 0.3 -1.5 -0.2 1.7 1.9 1.3 0.8 0.4 0.88.3 2.3 -3.9 -2.2 -5.5 -2.2 -11.1 -0.1 -7.2 -14.0 -9.4 -8.0 -5.6 1.9 4.6 -0.8 7.6 4.6 1.3 0.5
16.5 11.3 7.0 4.3 6.9 4.4 4.6 2.9 -3.7 0.6 0.8 4.2 7.2 6.5 6.9 7.4 7.5 7.7 8.1 8.715.9 8.9 2.6 1.9 3.8 3.0 0.5 2.6 -3.4 -1.6 0.1 1.7 4.6 6.8 7.5 7.6 7.6 7.2 7.1 7.466.8 76.7 70.8 83.0 92.2 89.2 101.7 87.1 86.9 104.6 107.3 107.6 110.6 110.0 111.0 114.0 117.9 122.3 127.4 133.2
10.8 8.2 2.3 2.6 2.6 -0.8 -0.9 -4.1 -5.4 -2.4 - - - - - - - - - -5.7 -5.3 -9.1 -0.9 -10.0 -6.0 -6.2 -9.0 -12.7 -13.9 - - - - - - - - - -5.2 1.1 0.3 0.7 0.9 -2.2 -1.1 -1.7 -3.0 0.3 - - - - - - - - - -
1.7 1.9 1.8 1.9 2.4 2.7 3.2 3.3 2.8 2.3 1.8 - - - - - - - - -1.7 1.8 1.7 2.4 3.7 3.4 3.3 2.8 1.8 1.5 1.2 1.1 0.0 0.3 0.9 1.2 2.0 2.0 1.9 1.94.4 4.0 4.5 5.9 9.7 9.4 8.2 7.1 3.5 2.7 1.6 1.6 -1.8 -1.1 -0.3 -0.4 2.6 2.6 2.6 2.71.0 1.2 1.2 1.7 1.3 1.0 0.9 0.6 0.5 0.5 0.4 0.2 0.3 0.4 0.9 1.3 1.6 1.7 1.7 1.7
3.2 4.1 3.6 4.5 3.5 2.5 2.8 2.7 3.0 3.8 3.3 2.4 1.9 1.2 1.8 1.8 1.8 1.9 2.0 2.1
-0.8 -0.8 -0.7 -0.4 -0.3 -0.2 -0.4 -0.5 -0.4 -0.6 -0.6 -0.6 -0.4 0.1 0.7 1.2 1.5 1.7 1.7 1.710.8 9.1 9.5 10.2 8.0 5.8 6.4 3.8 -1.5 -3.7 -1.5 -2.1 -1.4 -0.6 -2.6 0.4 0.5 -0.2 -0.5 -1.8
1.6 1.7 1.7 2.4 2.5 2.2 2.0 1.5 0.9 0.8 0.4 0.3 -0.1 0.1 0.7 1.0 1.8 1.8 1.9 1.9-1.9 -1.7 -0.9 0.8 2.2 1.9 1.4 1.0 1.8 1.5 2.0 1.3 0.3 0.7 0.6 1.2 1.4 1.7 2.0 2.1
5.4 6.0 5.6 5.2 3.6 1.8 1.6 1.6 1.2 0.5 0.7 0.5 -1.3 -0.4 -0.3 -0.2 1.3 1.3 1.4 1.532.4 32.3 19.2 7.1 -1.2 -2.9 5.6 12.7 14.5 9.3 1.4 -4.8 -9.4 -7.2 -1.3 1.2 0.7 1.2 1.9 2.6-0.4 -0.5 -0.5 -0.5 -0.7 -0.6 -0.6 -0.8 -1.0 -1.3 -1.4 - - - - - - - - -36.1 47.6 45.9 25.1 12.7 -7.2 -2.2 1.0 -4.6 -4.3 0.3 0.0 -3.9 3.0 -4.4 -6.1 -5.9 -5.9 -5.8 -5.7
2.8 2.6 2.1 2.4 3.3 2.2 1.7 3.5 -0.4 1.2 1.2 -0.5 2.9 1.7 2.0 2.4 2.6 2.7 2.9 3.01.1 0.8 0.3 0.0 -0.4 -1.2 -1.5 0.7 -2.2 -0.3 -0.1 -1.5 2.9 1.4 1.1 1.1 0.6 0.7 0.9 1.1
-0.2 0.4 0.1 -0.5 -0.6 -0.6 0.3 0.6 2.0 2.4 2.1 2.5 1.3 0.8 0.5 0.2 0.2 0.2 0.4 0.7-0.5 1.0 -0.1 1.0 2.7 2.9 2.4 3.5 2.1 1.5 1.0 -2.0 1.3 0.7 0.5 2.1 0.8 1.2 1.8 1.8-1.1 0.7 -0.2 2.4 2.2 4.4 6.0 5.1 3.4 2.0 - - - - - - - - - -3.0 2.0 1.6 0.9 0.1 -1.7 -2.0 -1.8 -4.0 -2.6 -2.0 -0.4 0.4 1.1 2.2 1.5 3.2 3.0 2.5 2.67.3 6.8 6.6 6.5 7.2 6.8 7.0 7.2 7.5 6.8 7.0 7.1 7.7 7.4 7.6 7.7 8.1 7.5 7.6 7.57.4 6.5 6.4 6.4 7.1 6.5 6.6 7.0 8.0 7.5 7.5 7.9 8.8 7.9 7.6 7.7 8.5 7.5 7.3 7.5
- - - - - - - - - - - - - - - - - - - -- - - - - - - - - - - - - - - - - - - -- - - - - - - - - - - - - - - - - - - -- - - - - - - - - - - - - - - - - - - -
33.3 27.3 6.5 23.2 51.8 34.1 34.2 25.6 53.9 57.4 43.0 46.0 66.0 66.0 54.0 54.0 72.0 72.0 63.0 63.03.8 2.8 0.7 2.3 5.7 3.5 3.5 2.6 6.0 5.9 4.4 4.5 7.3 6.7 5.4 5.1 7.6 6.9 6.0 5.7
13.3 18.6 16.1 10.4 14.7 11.4 13.9 9.9 15.7 17.2 19.0 13.0 18.0 19.0 19.0 14.0 19.0 20.0 21.0 15.032.9 -89.7 -29.9 -17.3 17.0 -26.1 -48.6 -36.3 13.7 -5.1 -36.0 -18.0 26.0 4.0 -37.0 -3.0 31.0 -2.0 -31.0 7.0
3.7 -9.3 -3.1 -1.7 1.9 -2.7 -5.0 -3.6 1.5 -0.5 -3.7 -1.8 2.9 0.4 -3.7 -0.3 3.3 -0.2 -2.9 0.6
-8.4 48.1 -35.2 42.3 30.7 48.1 44.0 58.3 26.0 10.5 - - - - - - - - - -
17.8 16.9 17.3 18.8 19.1 19.7 20.0 19.4 19.4 19.8 19.5 19.3 19.7 19.9 20.0 20.0 20.0 20.0 20.0 20.124.4 24.3 24.4 25.3 25.1 25.3 25.1 25.2 25.6 25.8 25.9 25.8 25.8 25.8 25.7 25.6 25.5 25.4 25.4 25.5-5.3 -4.3 -1.0 2.6 2.0 2.9 2.1 -0.7 2.1 2.5 3.5 3.0 2.8 1.4 0.2 -0.4 -1.5 -1.3 -0.7 -0.2-5.4 -5.0 -2.0 1.6 2.7 4.2 3.2 0.1 1.8 1.8 2.0 1.3 2.6 1.9 1.6 1.4 -0.6 -0.5 -0.1 0.4
0.8 -0.1 1.6 4.6 4.0 3.9 3.3 0.3 1.0 0.7 0.3 0.2 -0.1 -0.4 0.4 0.7 0.4 0.5 0.9 1.34.7 2.4 3.5 6.5 5.7 5.7 4.7 1.0 -0.3 -0.7 -0.9 -0.7 -0.5 -0.5 0.3 0.5 0.0 -0.1 0.1 0.5
3.4 2.6 3.7 4.8 6.0 5.8 5.7 5.0 4.2 4.1 4.9 4.4 4.1 4.3 3.4 3.8 4.4 3.9 3.2 2.80.75 0.75 0.75 0.75 0.75 0.50 0.50 0.05 0.05 0.05 0.05 -0.70 -0.86 -0.62 -0.27 0.07 0.40 0.57 0.70 0.89
1.2 1.2 1.2 1.2 1.2 1.2 1.0 0.6 0.5 0.5 0.5 -0.3 -0.5 -0.2 0.1 0.5 0.8 1.0 1.1 1.3

Issuedby:CZECH NATIONAL BANKNa Příkopě 28115 03 Praha 1CZECH REPUBLIC
Contact:COMMUNICATIONS DEPARTMENTTel.: +420 22441 3494Fax: +420 22441 2179
http://www.cnb.cz
Producedby: Jerome s.r.o.Design: Jerome s.r.o.
ISSN 1803-2419 (Print)ISSN 1804-2465 (Online)

Czech National Bank / Inflation Report IV/2013
ZÁKLADNÍ TEXT
tab. 1 (box)
85
Pramen:
GraF I.4