Embed Size (px)
Citation preview
BUDGET STATEMENTS
2017-18
for
Environment, Planning and Sustainable Development Directorate

ContentsENVIRONMENT, PLANNING AND SUSTAINABLE DEVELOPMENT DIRECTORATE......................1
Purpose................................................................................................................................ 1
2017-18 Priorities.................................................................................................................2
Estimated Employment Level...............................................................................................5
Strategic Objectives and Indicators......................................................................................6
Output Classes....................................................................................................................11
Accountability Indicators....................................................................................................17
Changes to Appropriation..................................................................................................24
Summary of 2017-18 Infrastructure Program....................................................................29
Financial Statements..........................................................................................................31
CITY RENEWAL AUTHORITY....................................................................................................52
Purpose.............................................................................................................................. 52
2017-18 Priorities...............................................................................................................53
Estimated Employment Level.............................................................................................53
Changes to Appropriation..................................................................................................54
Financial Statements..........................................................................................................55
SUBURBAN LAND AGENCY.....................................................................................................60
Purpose.............................................................................................................................. 60
2017-18 Priorities...............................................................................................................61
Estimated Employment Level.............................................................................................61
Financial Statements..........................................................................................................62
This page deliberately left blank
ENVIRONMENT, PLANNING AND SUSTAINABLE DEVELOPMENT DIRECTORATE
PurposeThe Environment, Planning and Sustainable Development Directorate (the Directorate) promotes sustainable living and resource use, strengthens the Territory’s response to climate change and provides an integrated planning and land use system that contributes to the sustainable development and future of the ACT.
The Directorate’s aim is to lead the Territory in developing and implementing targeted policies and programs that plan for urban growth and change; promote liveability, prosperity, productivity and sustainability; and address environment protection. Areas of focus include climate change mitigation and adaptation, nature conservation and enhancement, heritage, efficient and reliable water and energy services, building safety, quality urban design, and sustainable and integrated transport and spatial planning, policy and delivery.
The Directorate provides operational and strategic management of parks and reserves across the ACT including Tidbinbilla Nature Reserve, Namadgi National Park and Canberra Nature Park.
The Directorate delivers the ACT Government’s commitment to eradicating loose-fill asbestos insulation from Canberra homes under the Loose-fill Asbestos Insulation Eradication Scheme, managed by a Taskforce comprised of expertise from across the ACT Public Service.
The Directorate is responsible for land strategy, policy and planning, including preparation of the four-year Indicative Land Release Program. The program sets out the Government’s intended program for land release and seeks to facilitate housing diversity, provide affordable housing, stimulate economic activity by meeting the demand for land in the Territory and support a competitive land development and construction market.
The Directorate has a strong focus on urban renewal as a mechanism to drive economic activity, improving the liveability of our city, building on the character of our communities and delivering sustainable development. This focus is demonstrated in a variety of government-wide service delivery, such as the delivery of the Public Housing Renewal Program, Asset Recycling Initiative and Loose-fill Asbestos Insulation Eradication Scheme.
2017-18 Budget Statements 4 Environment, Planning and Sustainable Development Directorate
2017-18 PrioritiesPriorities to be pursued by Environment, Planning and Sustainable Development Directorate in 2017-18 include:
Planning
through the ACT Planning Strategy, deliver a range of strategic planning initiatives including:
- detailed variations to the Territory Plan as part of the land release program, with a focus on supporting housing affordability and accessible communities;
- finalising the master plan program which has identified where infill development could occur in and around town and group centres and along transport corridors and how this development and change can be facilitated; and
- participating in, and leading components of, regional planning in partnership with NSW government agencies.
supporting implementation of Building an Integrated Transport Network to shape the way the ACT grows and prospers by delivering outcomes relating to active travel, parking, light rail, bus network, road capacity, freight, reducing transport emissions and contributing to healthy communities;
promoting development of climate-wise and living infrastructure that encourages sustainable choices about the way Canberrans live, travel and where they work;
continuing to deliver city-wide urban land and transport plans and policies that underpin planning for the future urban growth, land supply, planning for major infrastructure for future urban areas and the character and structure of our city;
providing leadership in place making through current projects and policies with a focus on people, climate-wise design, living infrastructure and the public realm as cities become more compact;
continuing to reform the planning system and other regulations by working with industry to enhance the eDevelopment platform;
assessing development proposals, including lease variations in accordance with the Territory Plan;
supporting the ACT Heritage Council and the Government to recognise, register, conserve, promote and celebrate the ACT’s places and objects of historic, Aboriginal and natural heritage significance;
establish and administer a risk-based building auditing and inspection system for building certifiers approving, inspecting and certifying building work in the Territory;
conduct a review of the effectiveness of the Energy Efficiency Ratings Scheme;
2017-18 Budget Statements 5 Environment, Planning and Sustainable Development Directorate
carry out regulatory impact assessments of potential minimum energy efficiency standards and other options for improving the energy efficiency of rental properties in the Territory.
Climate Change and Sustainability
implementing the ACT’s integrated policy framework for managing the social, economic and environmental challenges faced by the Territory as they relate to energy production and use;
managing investments for the Territory to transition to 100 per cent renewable electricity by 2020 while preparing for the next stage of emissions reduction in buildings and the transport network towards net zero emissions by 2050 at the latest;
delivering the Government’s next generation battery storage program to reduce network infrastructure costs and support the transition to a high penetration renewable electricity grid;
administering the Renewable Energy Innovation Fund and programs to realise the Government’s vision for the ACT as an internationally recognised centre for renewable energy innovation and investment, diversifying the economy and creating new export industries;
administering and assisting industry to implement the Energy Efficiency (Cost of Living) Improvement Scheme with a focus on reducing energy costs for small business and low-income households;
providing policy leadership and practical support to directorates in working towards carbon neutrality in the Government’s operations and service delivery by 2020;
developing and implementing actions under an ACT Climate Change Adaptation Strategy and Implementation Plan that will support Canberra in increasing its resilience and reduce vulnerability to climate change impacts;
developing a Living Infrastructure Strategy that will help identify fit for purpose approaches to the urban forest renewal in the Territory, promote development of constructed waterways and the retention and use of stormwater in the urban setting to support trees;
initiating investigations into opportunities to reduce transport emissions across the Territory including through reducing the carbon intensity of the increased uptake of low emission vehicles;
2017-18 Budget Statements 6 Environment, Planning and Sustainable Development Directorate
helping achieve the Government’s climate change mitigation, waste reduction and renewable energy targets through Actsmart programs delivered to schools, businesses and households; and
continuing community engagement on climate change through workshops, public events and social media platforms to ensure Canberra’s performance is compared positively to other world leading cities.
Environment
improving the water quality in the ACT’s waterways through improved catchment management and governance arrangements and implementing the Commonwealth/ACT Healthy Waterways project;
implementing the Nature Conservation Strategy and Striking the Balance, ACT’s Water Strategy;
working with the ACT Natural Resource Management Council, community, governments, landholders, industry, the local Aboriginal community, and scientific and research organisations to improve our natural resources including through the Commonwealth Government’s National Landcare Program;
reducing the ACT’s vulnerability to bushfire by managing fuel loads to reduce the ACT’s vulnerability to wildfire and protect ecosystems and species;
actively managing the Lower Cotter Catchment area following the construction of the enlarged Cotter Dam to protect water quality;
continuing to monitor, research and implement plans and strategies to protect and conserve threatened species and ecological communities;
continuing to improve the status of threatened species by improving habitat condition, connectivity and reducing threats. These works include:
- the Golden Sun Moth habitat within Kinlyside Nature Reserve, and
- working with the Woodland and Wetlands Trust to extend a predator proof fence from Mulligans Flat into Goorooyarroo Nature Reserves.
continuing to provide on-ground support to volunteer groups in the ACT’s parks, reserves and rural lands; and
working across jurisdictional boundaries to achieve better outcomes for the environment and community of the ACT and region.
2017-18 Budget Statements 7 Environment, Planning and Sustainable Development Directorate
Land Policy and Renewal
develop the Government’s land release program;
continuing to develop the Government’s affordable housing and building policy;
continuing delivery of the ACT Government’s commitment to eradicating loose-fill asbestos insulation from Canberra homes under the Loose-fill Asbestos Insulation Eradication Scheme (Scheme) and engaging across jurisdictional boundaries, and nationally, to guide government, industry and community in the safe and effective practices developed under the Scheme;
working with the private sector to support the operation of competitive land development and construction market;
contributing to policy to guide the redevelopment of the Northbourne Avenue corridor in tandem with the delivery of the first stage of Canberra’s light rail network;
implementing redevelopment of the ACT Government owned land along Northbourne Avenue;
delivering the National Partnership Agreement on Asset Recycling;
maintaining a strong governance framework for land sales in the territory; and
overseeing the replacement of 1,288 outdated public housing units with properties that meet contemporary building and energy efficiency standards.
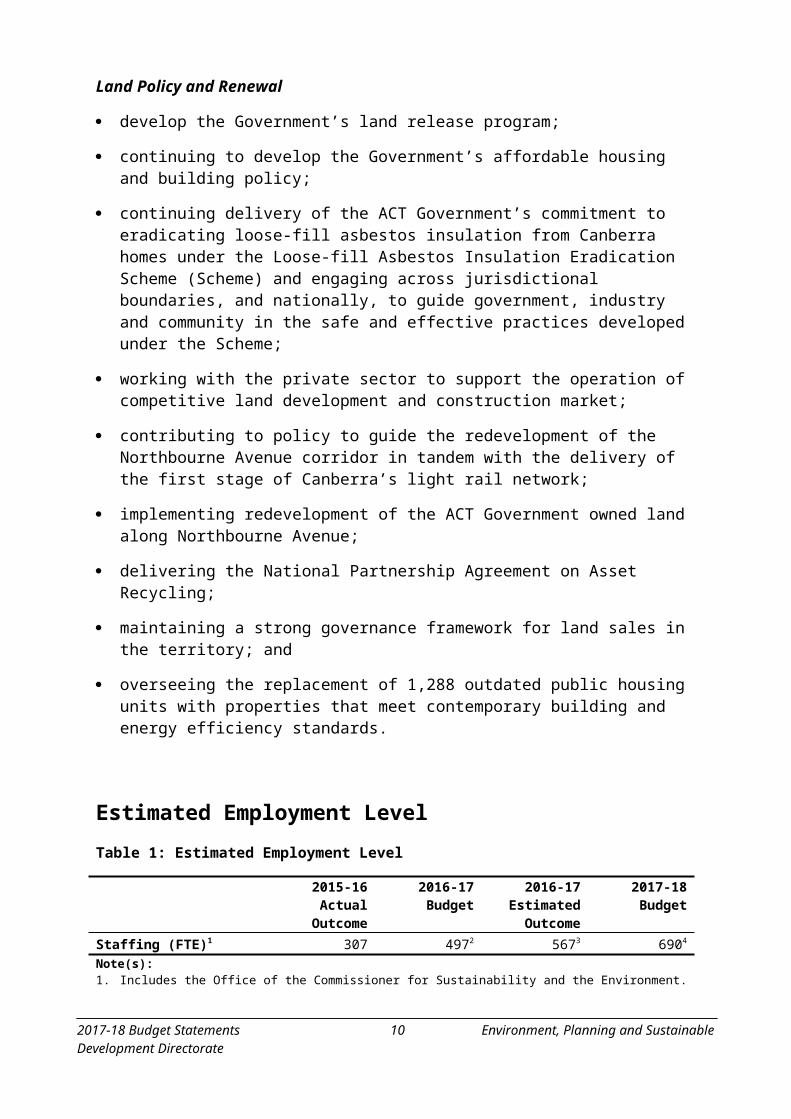
Estimated Employment Level
Table 1: Estimated Employment Level
2015-16Actual
Outcome
2016-17Budget
2016-17Estimated Outcome
2017-18Budget
Staffing (FTE)1 307 4972 5673 6904
Note(s):1. Includes the Office of the Commissioner for Sustainability and the Environment.2. The variation between the 2015-16 Actual Outcome and the 2016-17 Budget is due to the transfer of Parks and
Conservation from TCCS on 1 July 2016. 3. The variation between the 2016-17 Budget and the 2016-17 Estimated Outcome is mainly due to the transfer of
Asbestos Response Taskforce on 1 November 2016.4. The variation between the 2016-17 Estimated Outcome and the 2017-18 Budget is due to the transfer of land policy
and urban renewal functions on 1 July 2017.
2017-18 Budget Statements 8 Environment, Planning and Sustainable Development Directorate
Strategic Objectives and Indicators
Strategic Objective 1
Deliver a planning and leasehold system that delivers quality spatial outcomes and urban design, integrated transport and development outcomes that contribute to economic prosperity and a sustainable Canberra
This objective will be achieved through the implementation of the goals underpinning the ACT Planning Strategy, the Transport for Canberra and AP2 Climate Change Strategy policies.
The Directorate will:
prepare planning and land use management strategies that integrate with transport planning, shape the growth of the City, enhance the community’s lifestyle and balance environmental objectives;
support the development of a compact city and sustainable transport network through strategic planning;
manage urban infill strategies sensitively with a focus on integration around commercial centres and transport initiatives and having regard to evolving community attitudes. Initiatives include:
- completing the master plan program for centres to provide direction for future change and growth including sustainable design outcomes;
- urban renewal and City Plan implementation through the City and Gateway Urban Renewal Strategy;
- examining community facility planning to establish future policy positions;
- ensuring Territory Plan land uses reflect the broad structure of the ACT Planning Strategy including a review of the locations of medium and higher density residential zones and future urban areas; and
- reviewing the Territory Plan as necessary to reflect outcomes of strategic land use and transport plans and policies.
implementing the Building an Integrated Transport Network which includes:
- strategies for active travel, parking, low emission vehicles and freight;
- continued development of a city-wide light rail network master plan;
- monitoring and evaluating networks and public transport to inform new network planning; and
2017-18 Budget Statements 9 Environment, Planning and Sustainable Development Directorate
- identifying park and ride, bike and ride and active travel approaches to support achieving a higher modal split to public transport, cycling and walking.
develop and implement policies that improve the sustainability and resilience of the natural and built environment;
diligently administer a transparent and accountable leasehold and planning approvals system that underpins the Territory’s economy;
maintain and enhance a world-leading spatial mapping and property description system;
increase community and industry education to foster understanding of strategies and policies;
continue to work with surrounding local government areas and the NSW Government to develop and deliver regional planning strategies for the Canberra region; and
continue to participate in national forums to provide analysis and input to transport and infrastructure policy nationally and in the ACT.
Strategic Indicator 1: Develop, engage on and implement city-wide urban land and transport policies, strategies and plans that underpin planning for the future urban growth, land supply, and major infrastructure in a coordinated way across government.
Strategic Objective 2
Protect and enhance our natural environment, water resources and heritage values
The Government will continue to explore and support cost effective ways to encourage sustainable water use through demand management and water sensitive urban design and ensure land and water management and construction management are undertaken in such a way as to protect receiving waters - water courses, lakes and the downstream river systems - from pollutants.
The Directorate will continue to promote knowledge sharing and implementation of contemporary, best practice environmental standards.
The Directorate will:
increase community awareness and involvement in protecting and conserving the ACT’s natural resources;
administer a robust multi-agency governance model for water management in the ACT and region;
build knowledge and implement practices that protect and manage the ACT’s biodiversity;
enhance the policy framework to protect the quality of the ACT’s air, water and the environment;
2017-18 Budget Statements 10 Environment, Planning and Sustainable Development Directorate
implement the ACT’s environment strategies and plans – Nature Conservation Strategy 2013-2023, Water Strategy ‘Striking a Balance’ 2014–44 and Action Plans;
work with the Commonwealth and other states/territory to develop and implement national environmental and water reforms - including within the ACT’s portion of the Murray Darling Basin;
implement innovative water sensitive urban design systems;
continue to provide administrative support to the ACT Heritage Council to ensure the continued recognition, registration and conservation of the ACT’s heritage places and objects; and
continue to administer the annual funding and delivery for the ACT Heritage Grants Program, the Canberra and Region Heritage Festival and Capital Works projects as relate to the conservation of the ACT’s heritage places and objects.
Strategic Indicator 2.1: Work with the community on implementing the Murray Darling Basin Plan.
Strategic Indicator 2.2: Deliver the ACT Healthy Waterways project against timelines agreed with the Commonwealth.
Strategic Indicator 2.3: Develop and implement ACT wide sustainability policies including biodiversity conservation.
Strategic Objective 3
Deliver balanced and effective policies for safe buildings, effective environmental controls and optimal land use outcomes.
This objective will be achieved through continuous review and enhancement of the legislation and policy administered by the Directorate and associated regulations, together with the Territory Plan, to deliver an effective regulatory framework.
The Directorate will:
continually improve policies and supporting systems for consistent and timely decisions;
enhance regulatory frameworks to deliver high standard and safe building outcomes for the community and business;
work with industry and business to develop and implement policies and guidelines to protect the quality of water, air and liveability;
develop innovative legislation, systems and processes to streamline the way we provide high quality outcomes for the community;
develop and implement new electronic business systems for better decision making and timely services to the community; and
2017-18 Budget Statements 11 Environment, Planning and Sustainable Development Directorate

continue to implement the outcomes of the Minister’s Building Quality Forum, including through the review and amendment of the Building Act 2004.
Strategic Indicator 3.1: Continuous review of regulatory policies, systems and ensuring that environment protection, heritage, nature conservation and construction activities are properly coordinated and effective in application.
Strategic Objective 4
Leading the Community Towards Making Canberra a Net Zero Carbon Emitter
The Government’s vision for Canberra is to set the benchmark for world cities in zero emissions and sustainability. The Directorate works across government, the business sector and the broader community to achieve ambitious greenhouse gas emission reductions.
The Directorate will raise awareness of climate change through engaging with the community, building partnerships in mitigation and adaptation and developing effective offset options.
The Directorate will:
secure business and community understanding and endorsement on climate change action with support from the ACT’s Climate Change Council;
support the deployment of large scale renewable energy generation to meet the ACT’s 100 per cent renewable electricity and greenhouse gas reduction targets;
support and facilitate the growth of the renewable energy industry as part of a vibrant clean economy, built around Canberra’s existing competitive advantages and knowledge based economy;
support increased energy efficiency in homes, businesses, schools and other parts of the built environment;
contribute to the security and affordability of our energy supplies;
promote an understanding of climate science implications for the ACT within and beyond the ACT Government, and guide adaptation strategies to increase the Territory’s resilience in the face of the unavoidable impacts of climate change;
provide a guiding influence to other parts of government to deliver carbon neutral government operations; and
support the community to understand their own emissions and how to mitigate those emissions through participation in Actsmart programs for businesses, schools and households.
Strategic Indicator 4.1: Implement policies to achieve the ACT Government’s target of net zero carbon emissions in the ACT by 2050 at the latest and in government operations from 2020.
2017-18 Budget Statements 12 Environment, Planning and Sustainable Development Directorate
Strategic Indicator 4.2: Growth in renewable electricity generation.
Strategic Objective 5
Improve the livability of our cities and build on the character of our communities through strategic and sustainable release and renewal of land
Development of a land release program that contributes to the Government’s financial, social and environmental objectives, including:
enabling urban renewal and activating key gateways to the city and its commercial centres;
facilitating housing diversity and providing affordable housing choices;
meeting the demand for land in the Territory to stimulate economic activity in the residential, commercial/ mixed use, industrial and community sectors;
supporting the operation of a competitive land development and construction market;
achieving satisfactory returns from the sale of unleased Territory land; and
continue to engage across jurisdictional boundaries, and nationally, to guide government, industry and community in the safe and effective practices developed under the Loose-fill Asbestos Insulation Eradication Scheme.
Strategic Indicator 5.1: Delivery of the Government’s land release program.
Strategic Indicator 5.2: Assets recycled in line with the Commonwealth Government’s Asset Recycling Initiative (ARI).
2017-18 Budget Statements 13 Environment, Planning and Sustainable Development Directorate
Output Classes
Output Class 1: Planning
Table 2: Output Class 1: Planning
2016-17 2017-18Estimated Outcome Budget
$'000 $'000
Total Cost1 31,875 34,377Controlled Recurrent Payments 25,661 27,831
Note(s):1. Total cost includes depreciation and amortisation of $0.350 million in 2016-17 and $0.447 million in 2017-18. Total
cost is also supplemented by own source revenue of $2.889 million in 2016-17 and $2.511 million in 2017-18.
Output 1.1: Planning Delivery
Facilitate and manage growth and change within the ACT through development assessment and leasehold management, with the overarching objective of promoting and facilitating economically productive, sustainable, attractive, safe and well designed urban and rural environments in the ACT.
Table 3: Output 1.1: Planning Delivery
2016-17 2017-18Estimated Outcome Budget
$'000 $'000
Total Cost1 16,948 20,380Controlled Recurrent Payments 12,312 15,146
Note(s):1. Total cost is supplemented by own source revenue of $2.719 million in 2016-17 and $2.511 million in 2017-18.
Output 1.2: Planning Policy1
Provision of high quality professional services in strategic land planning, sustainable transport planning (including Building an Integrated Transport Network) and planning for land release that encourages high quality urban design.
Table 4: Output 1.2: Planning Policy
2016-17 2017-18Estimated Outcome Budget
$'000 $'000
Total Cost 12,840 11,878Controlled Recurrent Payments 11,449 10,717
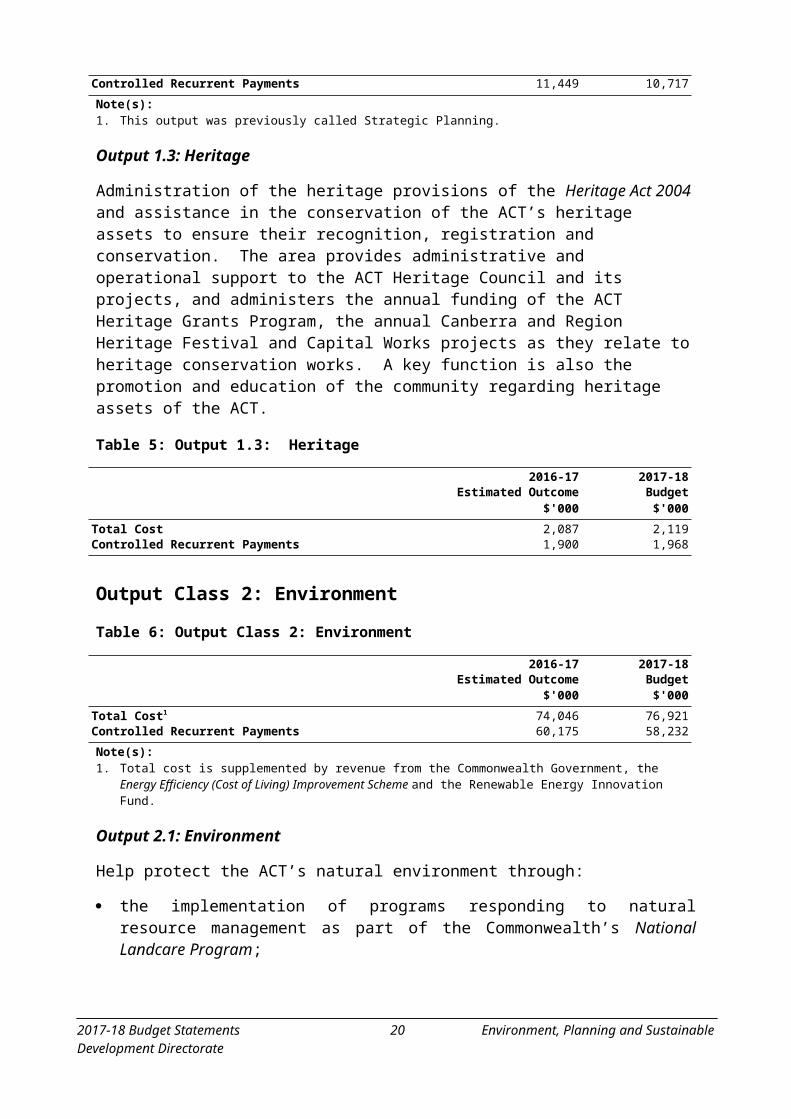
Note(s):1. This output was previously called Strategic Planning.
2017-18 Budget Statements 14 Environment, Planning and Sustainable Development Directorate
Output 1.3: Heritage
Administration of the heritage provisions of the Heritage Act 2004 and assistance in the conservation of the ACT’s heritage assets to ensure their recognition, registration and conservation. The area provides administrative and operational support to the ACT Heritage Council and its projects, and administers the annual funding of the ACT Heritage Grants Program, the annual Canberra and Region Heritage Festival and Capital Works projects as they relate to heritage conservation works. A key function is also the promotion and education of the community regarding heritage assets of the ACT.
Table 5: Output 1.3: Heritage
2016-17 2017-18Estimated Outcome Budget
$'000 $'000
Total Cost 2,087 2,119Controlled Recurrent Payments 1,900 1,968
Output Class 2: Environment
Table 6: Output Class 2: Environment
2016-17 2017-18Estimated Outcome Budget
$'000 $'000
Total Cost1 74,046 76,921Controlled Recurrent Payments 60,175 58,232
Note(s):1. Total cost is supplemented by revenue from the Commonwealth Government, the Energy Efficiency (Cost of Living)
Improvement Scheme and the Renewable Energy Innovation Fund.
Output 2.1: Environment
Help protect the ACT’s natural environment through:
the implementation of programs responding to natural resource management as part of the Commonwealth’s National Landcare Program;
manage, review and implementation of legislation/action plans to help protect land and species;
sustainable use of water, including through implementation of Striking the Balance, the ACT’s Water Strategy;
establish and support an ACT and region catchment management governance framework;
administer the annual funding of the ACT Environment Grants and Rural Grants Program;
2017-18 Budget Statements 15 Environment, Planning and Sustainable Development Directorate
regulatory activities to protect and enhance the natural and built environment; and
promotion and involvement of the community in caring for the ACT’s natural environment.
Table 7: Output 2.1: Environment
2016-17 2017-18Estimated Outcome Budget
$'000 $'000
Total Cost1,2 16,671 14,953Controlled Recurrent Payments 13,063 12,016
Note(s):1. Total cost is supplemented by revenue from the Commonwealth for environmental programs of $1.687 million in
2016-17 and $1.087 million in 2017-18. 2. The decrease in total cost from the 2016-17 Estimated Outcome to the 2017-18 Budget is due to the one off impact of
the rollover of $0.6 million for Implementing Water Reform in the Murray-Darling Basin and expenditure on the grant for the Mulligans Flat predator proof fence.
Output 2.2: Climate Change and Sustainability1
Develop policy, provide advice and deliver programs in relation to:
the ACT Climate Change Strategy and Action Plan – AP2 Climate Change Strategy;
investments in renewable electricity through a feed-in-tariff and delivery of local industry development strategies;
energy efficiency measures, including administration of the Actsmart and Outreach programs; and
administration of the ACT’s Carbon Neutral ACT and Energy Efficiency (Cost of Living) Improvement Scheme.
Table 8: Output 2.2: Climate Change and Sustainability
2016-17 2017-18Estimated Outcome Budget
$'000 $'000
Total Cost2 20,486 24,892Controlled Recurrent Payments 11,703 10,140
Note(s):1. This output was previously called Sustainability and Climate Change.2. Total cost is supplemented by revenue from the Energy Efficiency (Cost of Living) Improvement Scheme of
$3.624 million in 2016-17 and $4.547 million in 2017-18. Total cost is also supplemented by revenue from the Renewable Energy Innovation Fund of $3.100 million in 2016-17 and $9.108 million in 2017-18.
2017-18 Budget Statements 16 Environment, Planning and Sustainable Development Directorate
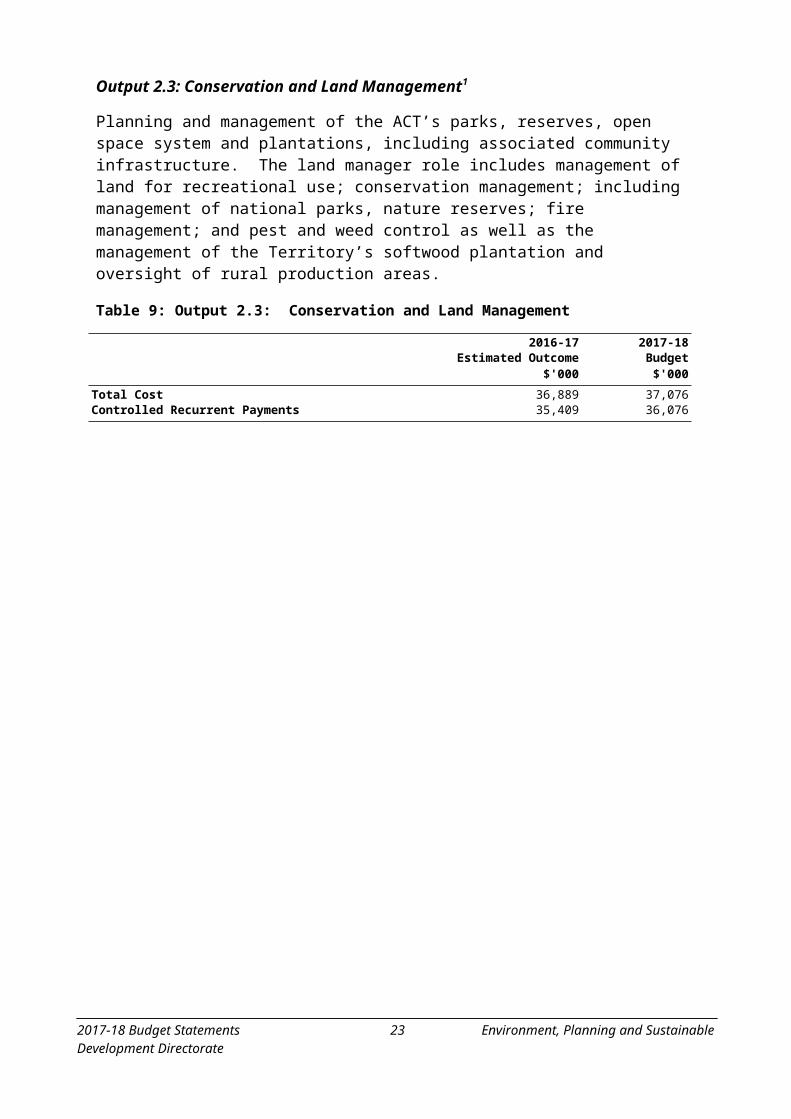
Output 2.3: Conservation and Land Management1
Planning and management of the ACT’s parks, reserves, open space system and plantations, including associated community infrastructure. The land manager role includes management of land for recreational use; conservation management; including management of national parks, nature reserves; fire management; and pest and weed control as well as the management of the Territory’s softwood plantation and oversight of rural production areas.
Table 9: Output 2.3: Conservation and Land Management
2016-17 2017-18Estimated Outcome Budget
$'000 $'000
Total Cost 36,889 37,076Controlled Recurrent Payments 35,409 36,076
2017-18 Budget Statements 17 Environment, Planning and Sustainable Development Directorate
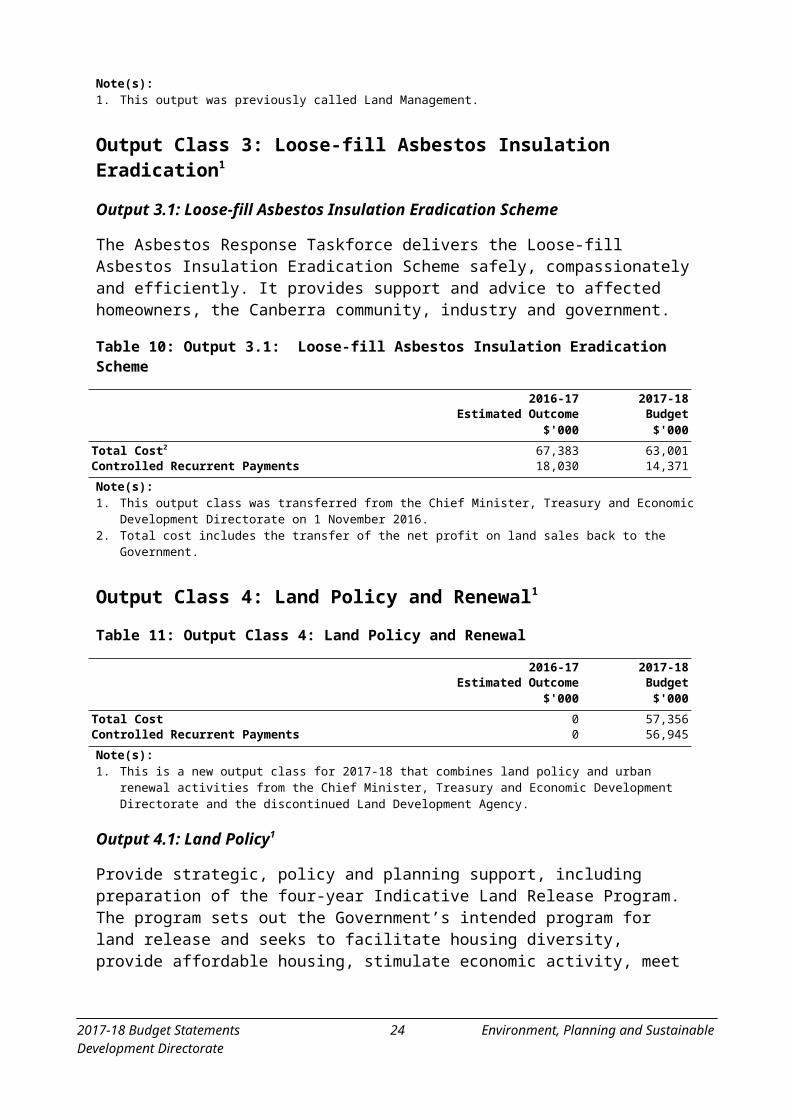
Note(s):1. This output was previously called Land Management.
Output Class 3: Loose-fill Asbestos Insulation Eradication1
Output 3.1: Loose-fill Asbestos Insulation Eradication Scheme
The Asbestos Response Taskforce delivers the Loose-fill Asbestos Insulation Eradication Scheme safely, compassionately and efficiently. It provides support and advice to affected homeowners, the Canberra community, industry and government.
Table 10: Output 3.1: Loose-fill Asbestos Insulation Eradication Scheme
2016-17 2017-18Estimated Outcome Budget
$'000 $'000
Total Cost2 67,383 63,001Controlled Recurrent Payments 18,030 14,371
Note(s):1. This output class was transferred from the Chief Minister, Treasury and Economic Development Directorate on
1 November 2016.2. Total cost includes the transfer of the net profit on land sales back to the Government.
Output Class 4: Land Policy and Renewal1
Table 11: Output Class 4: Land Policy and Renewal
2016-17 2017-18Estimated Outcome Budget
$'000 $'000
Total Cost 0 57,356Controlled Recurrent Payments 0 56,945
Note(s):1. This is a new output class for 2017-18 that combines land policy and urban renewal activities from the Chief Minister,
Treasury and Economic Development Directorate and the discontinued Land Development Agency.
Output 4.1: Land Policy1
Provide strategic, policy and planning support, including preparation of the four-year Indicative Land Release Program. The program sets out the Government’s intended program for land release and seeks to facilitate housing diversity, provide affordable housing, stimulate economic activity, meet the demand for land in the Territory and support a competitive land development and construction market.
2017-18 Budget Statements 18 Environment, Planning and Sustainable Development Directorate
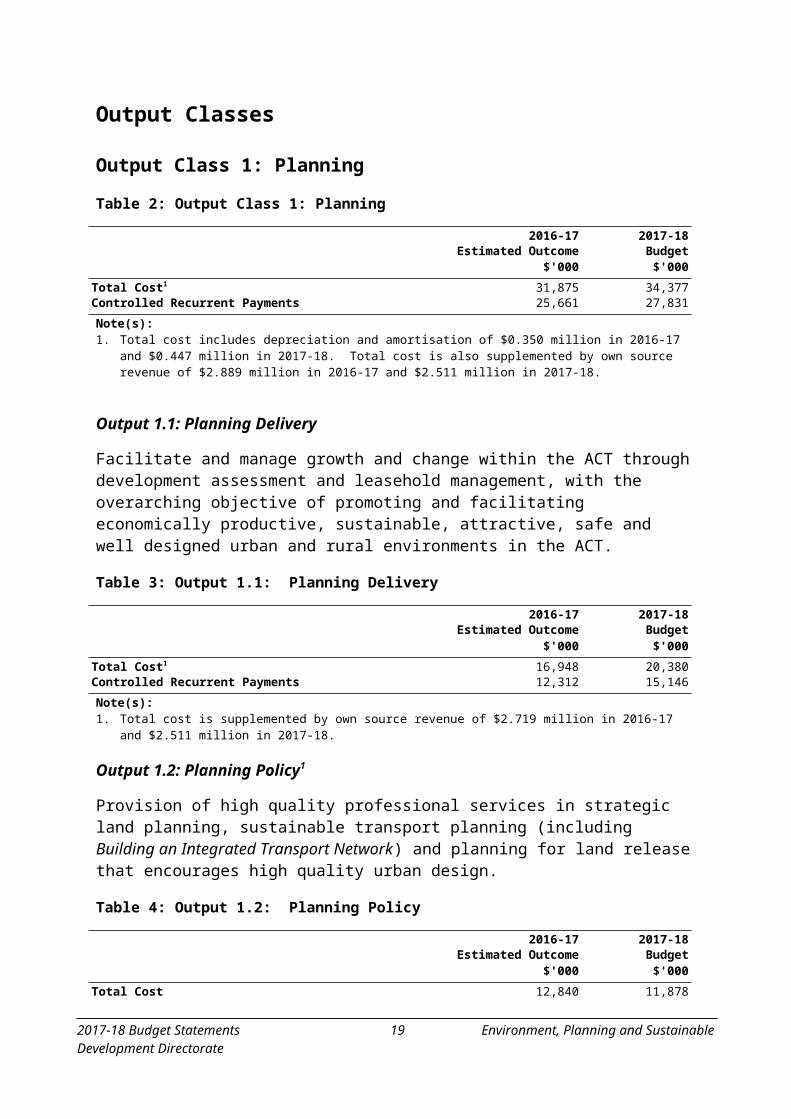
Table 12: Output 4.1: Land Policy
2016-17 2017-18Estimated Outcome Budget
$'000 $'000
Total Cost 0 14,613Controlled Recurrent Payments 0 14,488
Note(s):1. This is a new output for 2017-18 that transfers land policy functions from the Chief Minister, Treasury and Economic
Development Directorate and the discontinued Land Development Agency.
Output 4.2: Urban Renewal1
Urban renewal is a key priority of the ACT Government. Urban renewal will drive economic activity, improve the liveability of our city, build on the character of our communities and deliver sustainable development.
The urban renewal agenda is ambitious and spans directorates. The Coordinator-General, Urban Renewal works across directorates in order to deliver significant outcomes, including:
delivering the Asset Recycling Initiative;
activating the Capital Metro corridor;
delivering new (replacement) public housing; and
progressing City to the Lake.
These projects, along with the rest of the urban renewal agenda will transform our city in its second century.
Table 13: Output 4.2: Urban Renewal
2016-17 2017-18Estimated Outcome Budget
$'000 $'000
Total Cost 0 42,743Controlled Recurrent Payments 0 42,457
Note(s):1. This is a new output for 2017-18 that transfers urban renewal functions from the Chief Minister, Treasury and
Economic Development Directorate and the discontinued Land Development Agency.
2017-18 Budget Statements 19 Environment, Planning and Sustainable Development Directorate
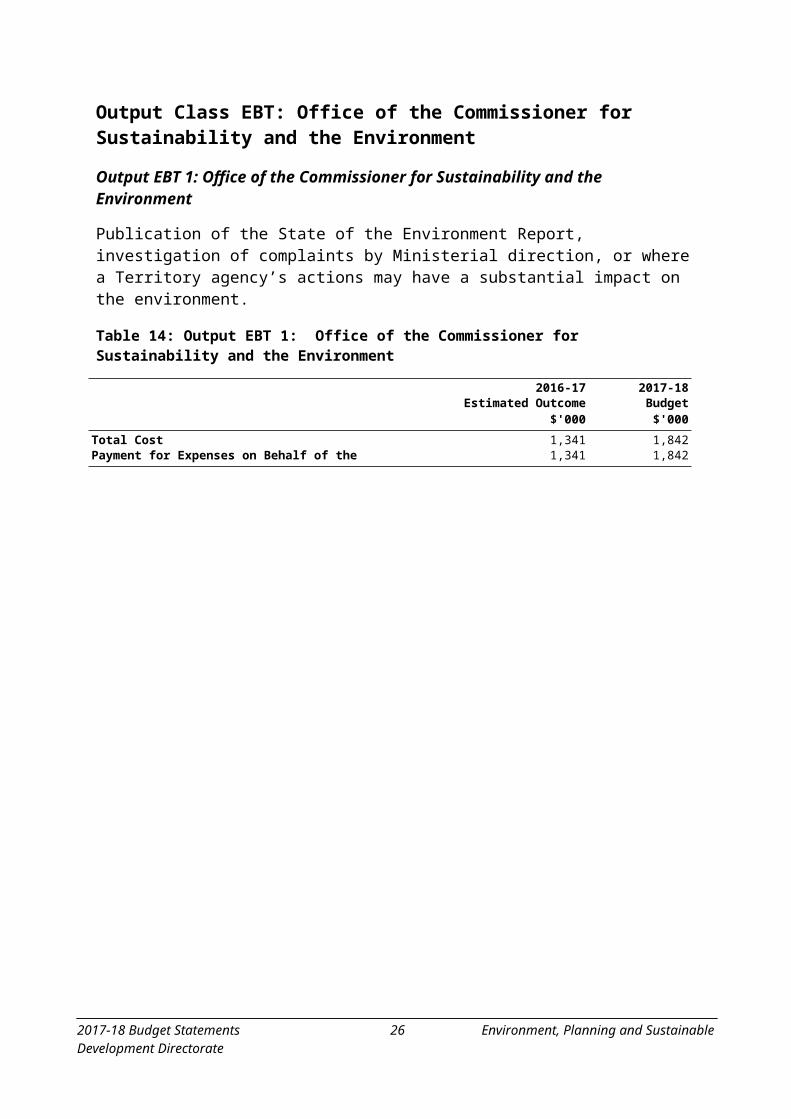
Output Class EBT: Office of the Commissioner for Sustainability and the Environment
Output EBT 1: Office of the Commissioner for Sustainability and the Environment
Publication of the State of the Environment Report, investigation of complaints by Ministerial direction, or where a Territory agency’s actions may have a substantial impact on the environment.
Table 14: Output EBT 1: Office of the Commissioner for Sustainability and the Environment
2016-17 2017-18Estimated Outcome Budget
$'000 $'000
Total Cost 1,341 1,842Payment for Expenses on Behalf of the Territory 1,341 1,842
2017-18 Budget Statements 20 Environment, Planning and Sustainable Development Directorate

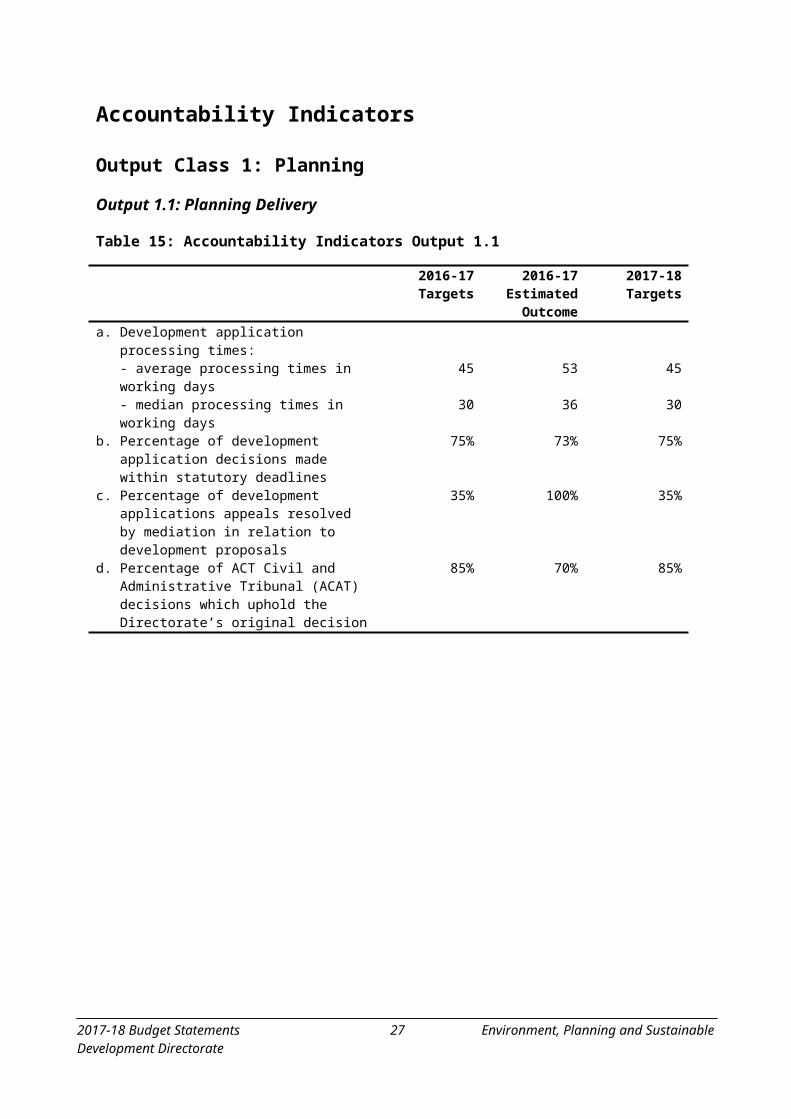
Accountability Indicators
Output Class 1: Planning
Output 1.1: Planning Delivery
Table 15: Accountability Indicators Output 1.1
2016-17Targets
2016-17Estimated Outcome
2017-18Targets
a. Development application processing times:- average processing times in working days 45 53 45- median processing times in working days 30 36 30
b. Percentage of development application decisions made within statutory deadlines
75% 73% 75%
c. Percentage of development applications appeals resolved by mediation in relation to development proposals
35% 100% 35%
d. Percentage of ACT Civil and Administrative Tribunal (ACAT) decisions which uphold the Directorate’s original decision
85% 70% 85%
2017-18 Budget Statements 21 Environment, Planning and Sustainable Development Directorate

Output 1.2: Planning Policy
Table 16: Accountability Indicators Output 1.2
2016-17Targets
2016-17Estimated Outcome
2017-18Targets
a. Provide the Minister with the Annual Report Card on Transport for Canberra1
Dec 2016 Not complete
n/a
b. Completion and publication of Master Plans2 3 2 n/ac. Number of Environment and Planning Forums
held during the year to assist in community consultations
6 6 6
d. Prepare policy advice to inform Executive consideration of the requirement to review the ACT Planning Strategy in 20173
n/a n/a 1
e. Report on the status of actions in the Minister for Planning and Land Management’s Statement of Planning Intent4
n/a n/a 4
f. Continue to engage community and stakeholders in the preparation of city-wide urban land and transport policies, strategies and plans5
n/a n/a 6
Notes:1. Indicator discontinued as the Annual Report Card will be replaced following a review of Transport for Canberra.2. Indicator discontinued.3. New indicator.4. New indicator.5. New indicator.
Output 1.3: Heritage
Table 17: Accountability Indicators Output 1.3
2016-17Targets
2016-17Estimated Outcome
2017-18Targets
a. Notification on the legislation register of Heritage Council decisions within five working days of the decision
100% 100% 100%
b. Development application advice issued within 15 working days of referral by the ACT Land and Planning Authority
90% 95% 95%
c. Decisions about heritage registrations by the ACT Heritage Council made within statutory timeframes1
100% 100% 100%
Notes:1. This indicator relates to the timeframe imposed on the ACT Heritage Council to make a decision on final registrations
under the Heritage Act 2004.
2017-18 Budget Statements 22 Environment, Planning and Sustainable Development Directorate
Output Class 2: Environment
Output 2.1: Environment
Table 18: Accountability Indicators Output 2.1
2016-17Targets
2016-17Estimated Outcome
2017-18Targets
a. Assess data and prepare a public report on the use and quality of the water resources of the ACT annually which is to be published on the Directorate’s website1
Jun 2017 Jun 2017 n/a
b. Submit twice yearly progress reports to the Commonwealth for the National Landcare Program
2 2 2
c. Prepare and submit National Environment Protection Measure jurisdictional reports to the National Environment Protection Council within agreed timeframe
Sep 2016 Nov 2016 Sep 2017
d. Submit Basin Priority Project milestone reports to the Commonwealth in accordance with the Commonwealth agreement2
3 1 n/a
e. Response from the Conservator of Flora and Fauna on development applications issued within statutory timeframes
90% 90% 90%
f. Prepare a public report on the implementation of the ACT Water Strategy3
n/a n/a Dec 2017
g. Submit ACT Healthy Waterways project milestone reports to the Commonwealth in accordance with the Commonwealth agreement4
n/a n/a 2
h. Implementation report on the 2015-17 Biodiversity Research and Monitoring Program finalised by December 20175
n/a n/a 100%
i. The conservator of Flora and Fauna to finalise Action Plans for matters listed under the Nature Conservation Act 2014, within six months following public consultation6
n/a n/a 100%
Notes:1. Indicator discontinued and replaced with indicator 2.1(f).2. Milestone reports were renegotiated with the Commonwealth during the year. This indicator has been discontinued
and replaced with indicator 2.1(g).3. New indicator which replaces indicator 2.1(a).4. New indicator which replaces indicator 2.1(d).5. New indicator6. New Indicator
2017-18 Budget Statements 23 Environment, Planning and Sustainable Development Directorate
Output 2.2: Climate Change and Sustainability
Table 19: Accountability Indicators Output 2.2
2016-17Targets
2016-17Estimated Outcome
2017-18Targets
a. Oversee the actions of the ACT Climate Change Strategy and Action Plan – AP2:- publish an annual inventory Dec 2016 Dec 2016 Dec 2017- publish an annual report on emissions targets
Dec 2016 Dec 2016 Dec 2017
b. Increase in the number of businesses or offices assisted to improve energy and water efficiency, reduce waste and increase recycling
10% 10% 10%
c. Estimated total electricity saved from Carbon Neutral Government Fund projects
10,000MWh 9,550MWh 10,000MWh
d. Number of households assisted by the Household Low Income Program
1,000 1,100 1,000
Output 2.3: Conservation and Land Management
Table 20: Accountability Indicators Output 2.3
2016-17Targets
2016-17Estimated Outcome
2017-18Targets
a. Customer satisfaction with the Management of protected areas (Tidbinbilla Nature Reserve, Namadgi National Park and Canberra Nature Park)
90% 96% 90%
b. Implement fuel management activities – grazing – as identified under the approved Bushfire Operational Plan (BOP)
100% 100% 100%
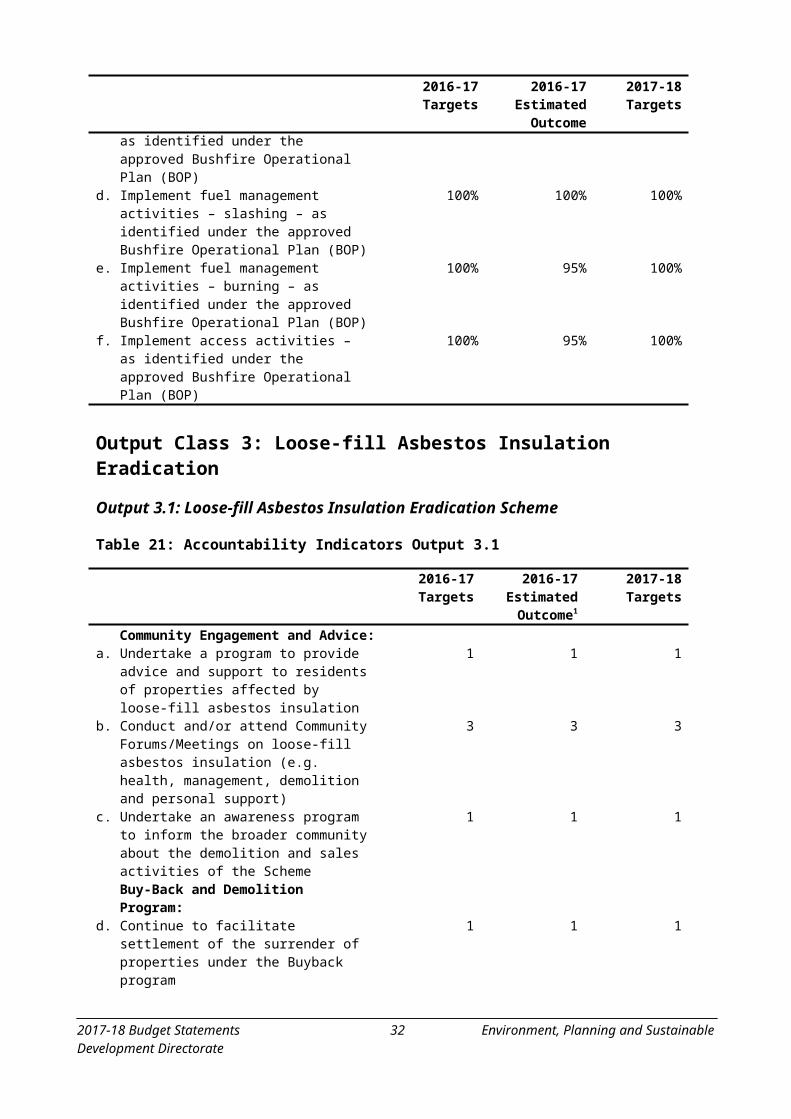
c. Implement fuel management activities – physical removal – as identified under the approved Bushfire Operational Plan (BOP)
100% 100% 100%
d. Implement fuel management activities – slashing – as identified under the approved Bushfire Operational Plan (BOP)
100% 100% 100%
e. Implement fuel management activities – burning – as identified under the approved Bushfire Operational Plan (BOP)
100% 95% 100%
f. Implement access activities – as identified under the approved Bushfire Operational Plan (BOP)
100% 95% 100%
2017-18 Budget Statements 24 Environment, Planning and Sustainable Development Directorate

Output Class 3: Loose-fill Asbestos Insulation Eradication
Output 3.1: Loose-fill Asbestos Insulation Eradication Scheme
Table 21: Accountability Indicators Output 3.1
2016-17Targets
2016-17Estimated Outcome1
2017-18Targets
Community Engagement and Advice:a. Undertake a program to provide advice and
support to residents of properties affected by loose-fill asbestos insulation
1 1 1
b. Conduct and/or attend Community Forums/Meetings on loose-fill asbestos insulation (e.g. health, management, demolition and personal support)
3 3 3
c. Undertake an awareness program to inform the broader community about the demolition and sales activities of the Scheme
1 1 1
Buy-Back and Demolition Program:d. Continue to facilitate settlement of the
surrender of properties under the Buyback program
1 1 1
e. Demolish affected dwellings 207 297 222f. Deregister affected properties post
demolition and soil validation200 372 178
Sales Program:g. Sale of remediated and deregistered blocks 254 312 395
Policy, Technical and Regulation:h. Support the conduct of a health study of
asbestos exposure in affected homes21 1 n/a
Notes:1. The Asbestos Response Taskforce was transferred on 1 November 2016, as a result the 2016-17 Estimate Outcome
relates to the period from 1 November 2016 to 30 June 2017. The Chief Minister, Treasury and Economic Development Directorate will report on the period between 1 July 2016 and 31 October 2016.
2. Indicator discontinued.
Output Class 4: Land Policy and Renewal
Output 4.1: Land Policy
Table 22: Accountability Indicators Output 4.1
2016-17Targets
2016-17Estimated Outcome
2017-18Targets
a. 4 year Indicative Land Release Program published1
n/a n/a 1
2017-18 Budget Statements 25 Environment, Planning and Sustainable Development Directorate
Notes:1. This Output was transferred from the Chief Minister, Treasury and Economic Development Directorate (CMTEDD)
from 1 July 2017. CMTEDD will report on the 2016-17 Estimated Outcome This accountability indicator covers publication of the 2017-18 to 2020-2021 Indicative Land Release Program.
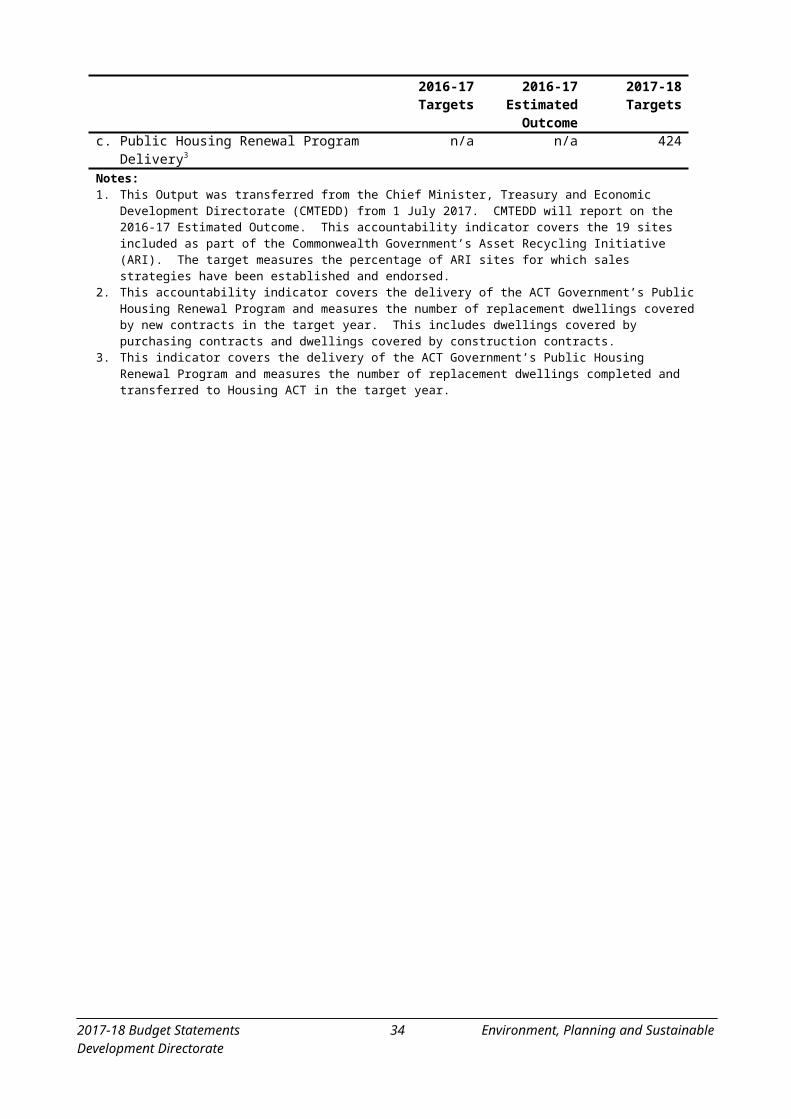
Output 4.2: Urban Renewal
Table 23: Accountability Indicators Output 4.2
2016-17Targets
2016-17Estimated Outcome
2017-18Targets
a. Asset Recycling Initiative1 n/a n/a 100%b. Public Housing Renewal Program Contracts2 n/a n/a 362c. Public Housing Renewal Program Delivery3 n/a n/a 424Notes:1. This Output was transferred from the Chief Minister, Treasury and Economic Development Directorate (CMTEDD)
from 1 July 2017. CMTEDD will report on the 2016-17 Estimated Outcome. This accountability indicator covers the 19 sites included as part of the Commonwealth Government’s Asset Recycling Initiative (ARI). The target measures the percentage of ARI sites for which sales strategies have been established and endorsed.
2. This accountability indicator covers the delivery of the ACT Government’s Public Housing Renewal Program and measures the number of replacement dwellings covered by new contracts in the target year. This includes dwellings covered by purchasing contracts and dwellings covered by construction contracts.
3. This indicator covers the delivery of the ACT Government’s Public Housing Renewal Program and measures the number of replacement dwellings completed and transferred to Housing ACT in the target year.
Output Class EBT: Office of the Commissioner for Sustainability and the Environment
Output EBT 1: Office of the Commissioner for Sustainability and the Environment
Table 24: Accountability Indicators Output EBT 1
2016-17Targets
2016-17Estimated Outcome
2017-18Targets
a. Report on the uptake of recommendations on the ACT State of the Environment and special reports as part of the annual report
Oct 2016 Dec 2016 Oct 2017
b. Undertake Ministerial initiated investigations in accordance with the Minister’s direction
100% 100% 100%
c. Undertake Commissioner initiated investigations in accordance with the Terms of Reference
100% 100% 100%
d. Undertake complaints generated investigations in accordance with the Terms of Reference
100% 100% 100%
e. Report on the complaints about the management of the environment by the Territory or a Territory agency as part of the annual report
Oct 2016 Dec 2016 Oct 2017
2017-18 Budget Statements 26 Environment, Planning and Sustainable Development Directorate
Changes to Appropriation
Table 25: Changes to appropriation – Controlled Recurrent Payments
2016-17 Estimated Outcome
$'000
2017-18 Budget
$'000
2018-19 Estimate
$'000
2019-20 Estimate
$'000
2020-21 Estimate
$'000
2016-17 Budget 84,733 81,090 87,086 89,152 88,825
FMA Section 16B Rollovers from 2015-16 Actsmart Programs 65 - - - -Canberra Urban and Regional Futures (125) - - - -Energy Efficiency Improvement Scheme 93 - - - -Implementation of Climate Change Strategy 40 - - - -Implementing Water Reform in the Murray-
Darling Basin600 - - - -
Intelledox 69 - - - -Kangaroo Population Management and Research 214 - - - -Light Rail Stage 2 635 - - - -Master Planning Program - Group Centres,
Transport Corridors and Rural Villages70 - - - -
National Pests Responses Contributions for Red Imported Fire Ants, European House Borer and Electric Ants
67 - - - -
Progressing Actions on Climate Change 100 - - - -Threatened Species Conservation 22 - - - -Transport and Parking - Better Options 65 - - - -
2017-18 Budget Policy AdjustmentsBetter services in your community - Achieving net
zero emissions by 2050 - Blueprint development- 322 254 269 -
Better services in your community - Community participation in zero net emmissions
- 150 150 150 100
Better services in your community - Implementation of ACT Climate Change Adaptation Strategy
- 758 577 593 -
Better services in your community - Improving sustainability through innovative financing
- 75 62 51 -
Better services in your community - Managing native wildlife
- 821 565 579 594
Better services in your community - More support for Actsmart
- 865 - - -
Better services in your community - Planning for Canberra’s future transport needs
- 750 - - -
Better services in your community - Protecting our native species and environment
- 670 670 - -
Better services in your community - Reviewing the ACT energy rating disclosure scheme
- 300 - - -
Better services in your community - Supporting endangered woodlands
- 162 - - -
Better services in your community - Supporting the national eradication of exotic pests and diseases
- 180 180 180 180
2017-18 Budget Statements 27 Environment, Planning and Sustainable Development Directorate
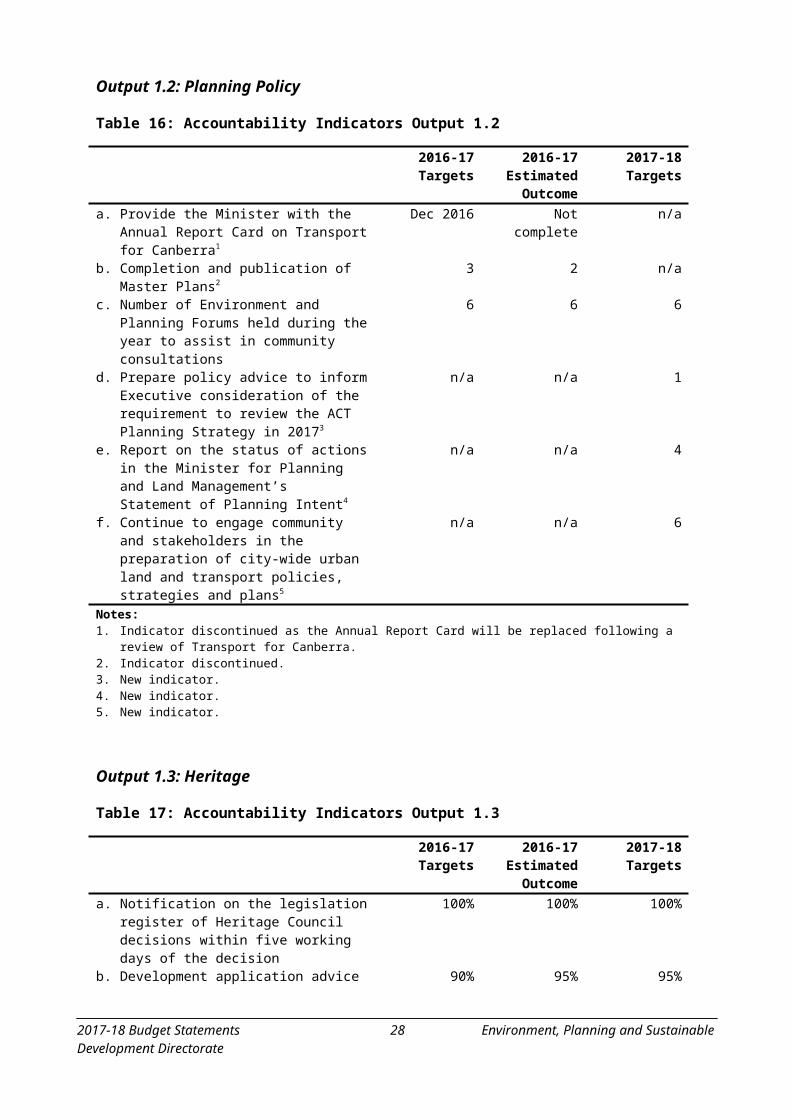
Table 25: Changes to appropriation – Controlled Recurrent Payments (continued)
2016-17 Estimated Outcome
$'000
2017-18 Budget
$'000
2018-19 Estimate
$'000
2019-20 Estimate
$'000
2020-21 Estimate
$'000
Better support when it matters - Public Housing Renewal - New and better properties
- 600 1,908 - -
Better support when it matters - Public Housing Renewal - Taskforce operations
- 2,250 1,895 619 -
Building a better city - Bindubi Street extension - Early planning
- 300 - - -
Building a better city - Building audits - 1,200 1,100 1,150 -Building a better city - Building certification
reform- 407 362 368 473
Building a better city - Building regulation reform - 610 692 675 681Building a better city - Land Development - 9,843 9,997 10,154 10,313Building a better city - Molonglo East-West
Arterial Road - Early planning- 200 100 - -
Building a better city - Strengthening oversight of land development
- 820 834 846 854
Building a better city - Swimming Pool Safety Education Campaign
200 - - - -
Building a better city - Transfer of staff to the Renewable Energy Innovation Fund
- (565) (730) (770) (775)
Building a better city - William Hovell Drive upgrade - Early planning
- 200 100 - -
Fairer revenue - Sustainable campground fees - (30) (31) (32) (32)More and better jobs - Canberra International
Airport - Guarding against the spread of pests and diseases
- 137 144 146 149
More and better jobs - Ensuring sustainable commercial development
- 425 25 100 25
More and better jobs - Ensuring Continuity of the Spatial Data Management System
- - (72) (75) (79)
More and better jobs - Sustainably managing our forests
- (500) (500) (500) (500)
Smarter government spending - Googong Foreshore access gate upgrade
- (76) (81) (85) (91)
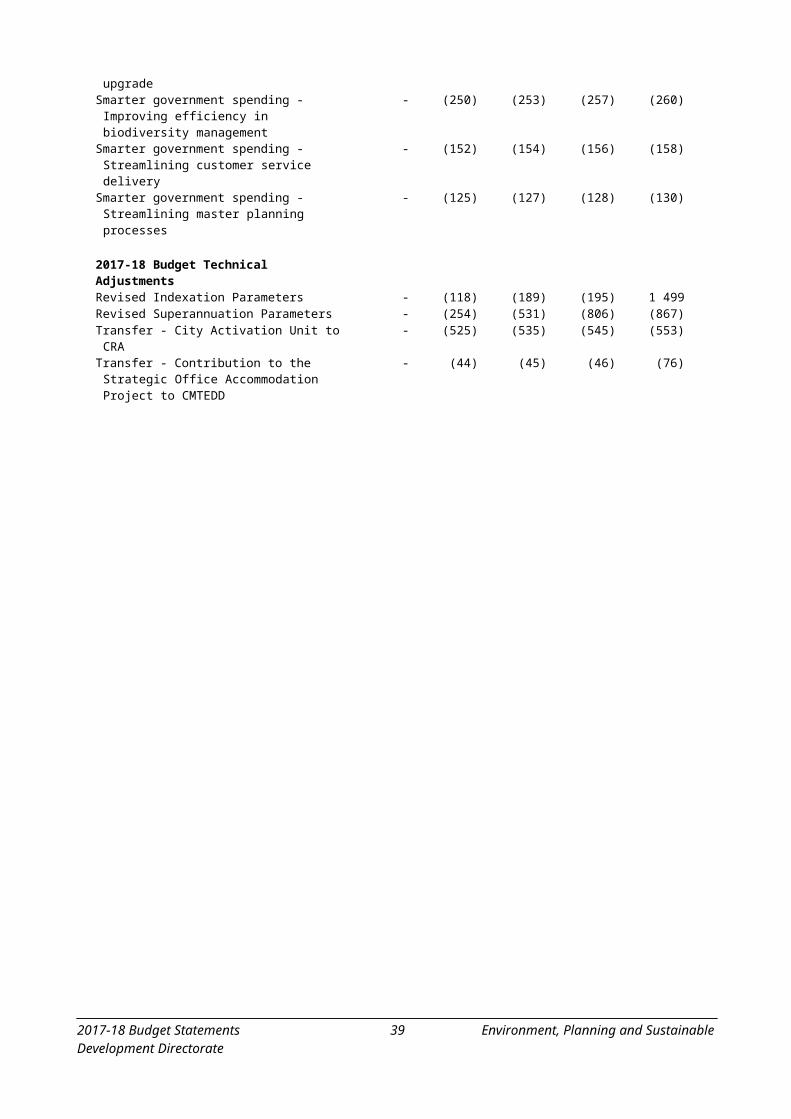
Smarter government spending - Improving efficiency in biodiversity management
- (250) (253) (257) (260)
Smarter government spending - Streamlining customer service delivery
- (152) (154) (156) (158)
Smarter government spending - Streamlining master planning processes
- (125) (127) (128) (130)
2017-18 Budget Technical AdjustmentsRevised Indexation Parameters - (118) (189) (195) 1 499Revised Superannuation Parameters - (254) (531) (806) (867)Transfer - City Activation Unit to CRA - (525) (535) (545) (553)Transfer - Contribution to the Strategic Office
Accommodation Project to CMTEDD- (44) (45) (46) (76)
2017-18 Budget Statements 28 Environment, Planning and Sustainable Development Directorate

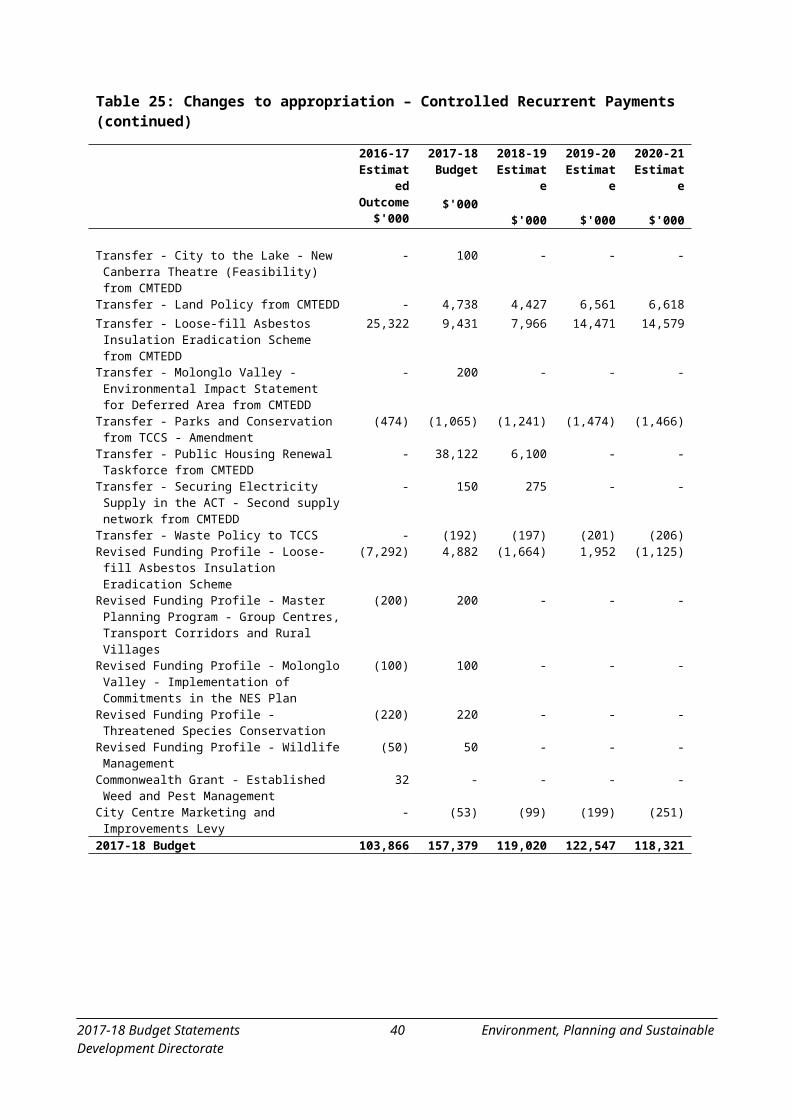
Table 25: Changes to appropriation – Controlled Recurrent Payments (continued)
2016-17 Estimated Outcome
$'000
2017-18 Budget
$'000
2018-19 Estimate
$'000
2019-20 Estimate
$'000
2020-21 Estimate
$'000
Transfer - City to the Lake - New Canberra Theatre (Feasibility) from CMTEDD
- 100 - - -
Transfer - Land Policy from CMTEDD - 4,738 4,427 6,561 6,618
Transfer - Loose-fill Asbestos Insulation Eradication Scheme from CMTEDD
25,322 9,431 7,966 14,471 14,579
Transfer - Molonglo Valley - Environmental Impact Statement for Deferred Area from CMTEDD
- 200 - - -
Transfer - Parks and Conservation from TCCS - Amendment
(474) (1,065) (1,241) (1,474) (1,466)
Transfer - Public Housing Renewal Taskforce from CMTEDD
- 38,122 6,100 - -
Transfer - Securing Electricity Supply in the ACT - Second supply network from CMTEDD
- 150 275 - -
Transfer - Waste Policy to TCCS - (192) (197) (201) (206)Revised Funding Profile - Loose-fill Asbestos
Insulation Eradication Scheme(7,292) 4,882 (1,664) 1,952 (1,125)
Revised Funding Profile - Master Planning Program - Group Centres, Transport Corridors and Rural Villages
(200) 200 - - -
Revised Funding Profile - Molonglo Valley - Implementation of Commitments in the NES Plan
(100) 100 - - -
Revised Funding Profile - Threatened Species Conservation
(220) 220 - - -
Revised Funding Profile - Wildlife Management (50) 50 - - -Commonwealth Grant - Established Weed and
Pest Management 32 - - - -
City Centre Marketing and Improvements Levy - (53) (99) (199) (251)2017-18 Budget 103,866 157,379 119,020 122,547 118,321
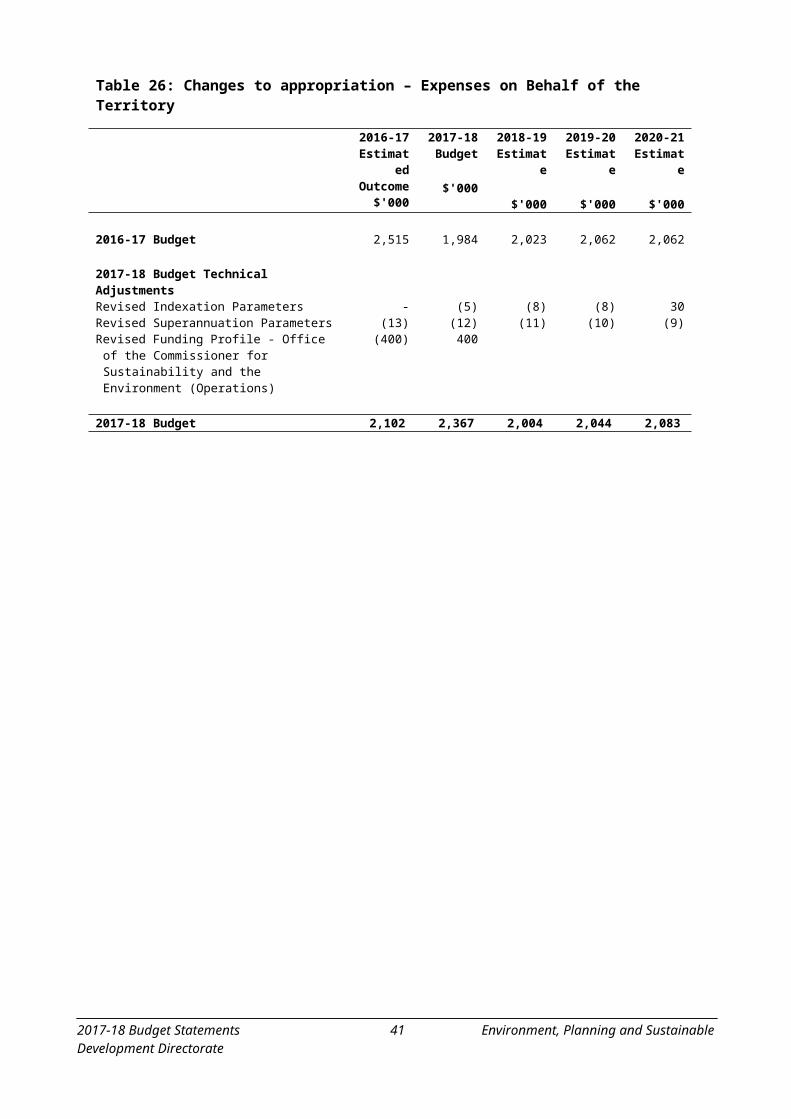
Table 26: Changes to appropriation – Expenses on Behalf of the Territory
2016-17 Estimated Outcome
$'000
2017-18 Budget
$'000
2018-19 Estimate
$'000
2019-20 Estimate
$'000
2020-21 Estimate
$'000
2016-17 Budget 2,515 1,984 2,023 2,062 2,062
2017-18 Budget Technical AdjustmentsRevised Indexation Parameters - (5) (8) (8) 30Revised Superannuation Parameters (13) (12) (11) (10) (9)Revised Funding Profile - Office of the
Commissioner for Sustainability and the Environment (Operations)
(400) 400
2017-18 Budget 2,102 2,367 2,004 2,044 2,083
2017-18 Budget Statements 29 Environment, Planning and Sustainable Development Directorate
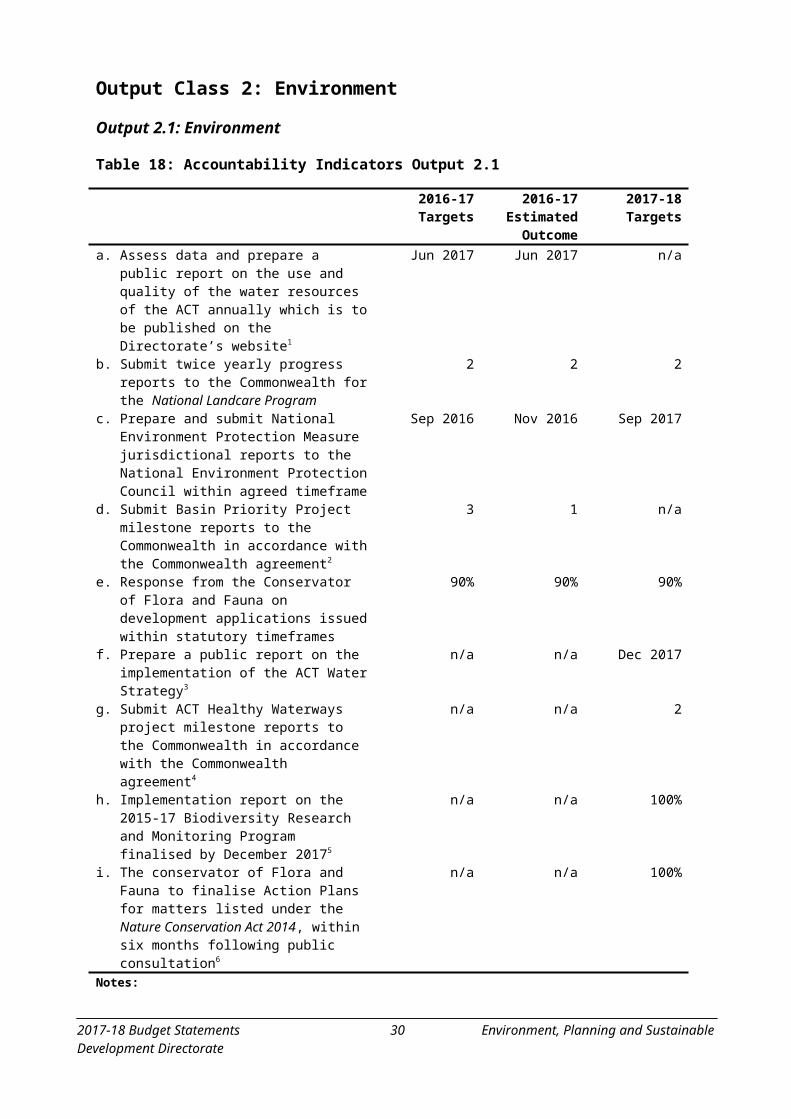
Table 27: Changes to appropriation – Capital Injections, Controlled
2016-17 Estimated Outcome
$'000
2017-18 Budget
$'000
2018-19 Estimate
$'000
2019-20 Estimate
$'000
2020-21 Estimate
$'000
2016-17 Budget 26,931 44,594 29,437 2,302 2,302
FMA Section 16B Rollovers from 2015-16 Capital Upgrades Program 80 - - - -Carbon Neutral Government 1,537 - - - -Enhancing the Protection of Endangered Species
and Habitat57 - - - -
Environmental Offsets - Gungahlin (EPIC) 14 - - - -Environmental Offsets - Lawson South 18 - - - -Molonglo Riverside Park - Stage 1 499 - - - -Molonglo Valley - Implementation of
Commitments in the NES Plan - Stage 2216 - - - -
Red Hill Nature Reserve Remediation (Finalisation of Design)
(3) - - - -
Strategic Bushfire Management Plan 79 - - - -
2017-18 Budget Policy AdjustmentsBetter services in your community - Improving our
capacity to fight bushfires- 1,267 1,489 430 -
Better services in your community - Jarramlee Nature Reserve - Protecting our nature reserves
- 112 200 - -
Better support when it matters - Public Housing Renewal - New and better properties
- 27,295 20,124 - -
Better support when it matters - Public Housing Renewal - Taskforce operations
- 1,122 1,314 - -
More and better jobs - Ensuring continuity of the Spatial Data Management System
- 869 232 - -
2017-18 Budget Technical AdjustmentsBetter Infrastructure Fund Indexation - - - - 18Transfer - Better Infrastructure Fund for Land
Release Infrastructure from CMTEDD- 295 302 310 318
Transfer - Better Public Housing - New Public Housing properties from CMTEDD
- 147,200 80,019 - -
Transfer - City to the Lake - New Civic Pool (feasibility) from CMTEDD
- 400 - - -
Transfer - Improving Our City - Woden bus interchange improvements from CMTEDD
- 150 - - -
Transfer - Loose-fill Asbestos Insulation Eradication Scheme from CMTEDD
55,194 50,472 29,691 8,833 741
Transfer - Upgrading infrastructure for land release from CMTEDD
- 117 - - -
Transfer - Urban Renewal Program - Better Public Housing - Allawah Court from CMTEDD
- 11,300 - - -
Transfer - Urban Renewal Program - Better Public Housing - Karuah from CMTEDD
- 5,000 - - -
Transfer - Urban Renewal Program - Better Public Housing - Red Hill housing precinct from CMTEDD
- 2,300 - - -
2017-18 Budget Statements 30 Environment, Planning and Sustainable Development Directorate
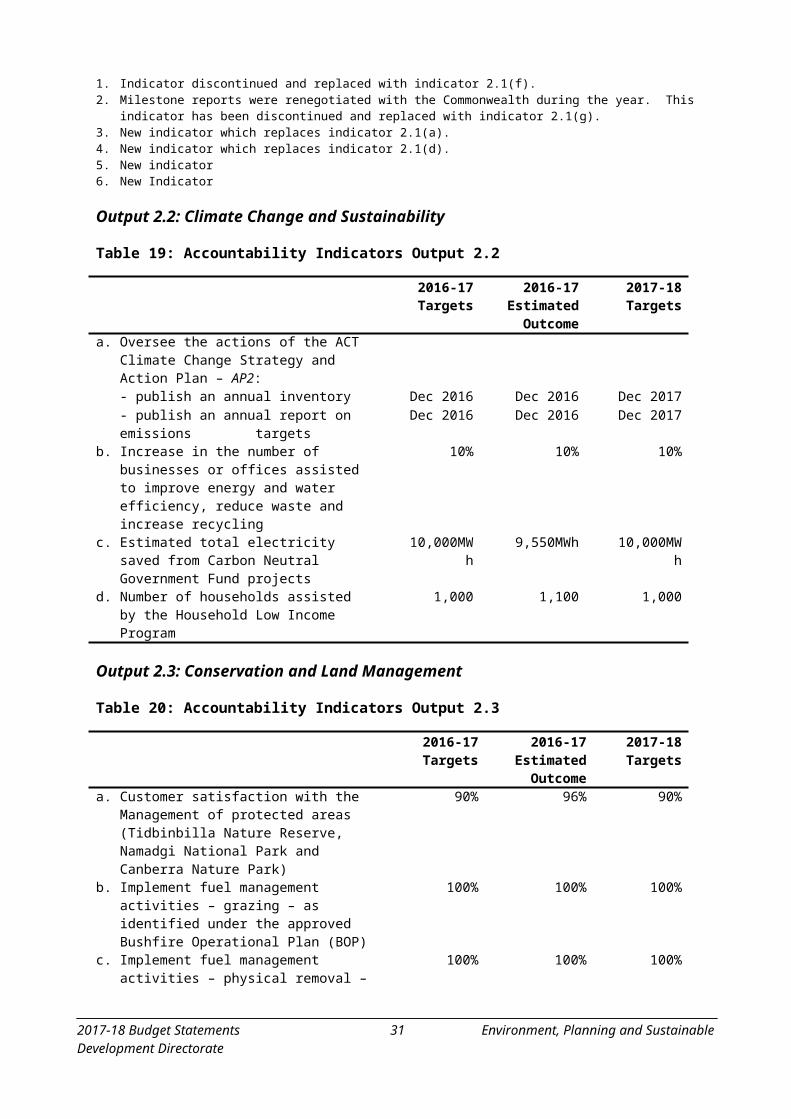
Table 27: Changes to appropriation – Capital Injections, Controlled (continued)
2016-17 Estimated Outcome
$'000
2017-18 Budget
$'000
2018-19 Estimate
$'000
2019-20 Estimate
$'000
2020-21 Estimate
$'000
Transfer - Urban Renewal Program - City to the Lake - West Basin infrastructure from CMTEDD
- 7,500 - - -
Transfer - Urban Renewal Program - Civic and Braddon public realm improvements from CMTEDD
- 1,050 - - -
Transfer - Urban Renewal Program - Playground Repairs to TCCS
(40) - - - -
Transfer - Woden Valley Stormwater Retardation Basins (Design) from CMTEDD
- 230 - - -
Revised Funding Profile - Better Infrastructure Fund
(99) 99 - - -
Revised Funding Profile - Caring for our Environment - Improving species and habitat protection
(182) 170 (317) 257 72
Revised Funding Profile - Digital Canberra - New digital radio communication system
(970) 970 - - -
Revised Funding Profile - Enhancement of eDevelopment Interface
(190) 190 - - -
Revised Funding Profile - Enhancing the Protection of Endangered Species
(1,263) 1,263 - - -
Revised Funding Profile - Enhancing the Protection of Endangered Species and Habitat
(1,141) 522 619 - -
Revised Funding Profile - Environmental Offsets - Lawson South
(293) 96 197 - -
Revised Funding Profile - Loose-fill Asbestos Insulation Eradication Scheme
8,690 16,215 (25,874) 2,537 20,910
Revised Funding Profile - Red Hill Nature Reserve Remediation (Finalisation and Design)
(111) 111 - - -
Revised Funding Profile: Support for Building Industry - eDevelopment Renovation Project
(1,881) 1,881 - - -
Commonwealth Grant - Sustainable Rural Water Use and Infrastructure Program
7,000 4,250 (11,250) - -
Savings - Environmental Offsets Gungahlin (156) - - - -
2017-18 Budget 93,986 327,040 126,183 14,669 24,361
2017-18 Budget Statements 31 Environment, Planning and Sustainable Development Directorate
Summary of 2017-18 Infrastructure Program
Table 28: 2017-18 Environment, Planning and Sustainable Development Directorate Infrastructure Program
Project 2017-18$'000
2018-19$'000
2019-20$'000
2020-21$'000
Four YearInvestment
$'000
PhysicalCompletion
Date
CAPITAL WORKS PROGRAM
Work In ProgressACT Healthy Waterways Project
(Commonwealth Funded)41,000 13,171 - - 54,171 Jun-19
Better Public Housing - New public housing properties
147,200 80,019 - - 227,219 Jun-19
Caring for our Environment - Establishing the Molonglo River Reserve Stage 3
440 258 - - 698 Jun-19
Caring for our Environment - Improving species and habitat protection
959 857 257 72 2,145 Jun-21
Caring for our Environment - Tharwa fish habitat improvement
200 - - - 200 Jun-18
Caring for our environment - Water Quality Improvement - Contributions to the ACT Healthy Waterways Project
1,300 1,300 - - 2,600 Jun-19
City to the Lake - New civic pool 400 - - - 400 Jun-18Digital Canberra - New digital radio
communication system1,130 - - - 1,130 Dec-17
Enhancement of eDevelopment Interface 190 - - - 190 Jun-18Enhancing the Protection of Endangered
Species and Habitat3,506 619 - - 4,125 Jun-19
Environmental Offsets - Lawson South 161 197 - - 358 Jun-19Improving Our City - Woden bus
interchange improvements150 - - - 150 Jun-18
Molonglo Valley - Environmental Impact Statement for Deferred Area (Feasibility)
200 - - - 200 Jun-18
Molonglo Valley - Implementation of Commitments in the NES Plan
100 - - - 100 Jun-18
Molonglo Valley - Implementation of Commitments in the NES Plan - Stage 2
902 - - - 902 Jun-18
Red Hill Nature Reserve Remediation (Finalisation and Design)
111 - - - 111 Jun-18
Securing Electricity Supply in the ACT - Second supply network
150 275 - - 425 Jun-19
Support for Building Industry - eDevelopment Renovation Project
1,881 - - - 1,881 Jun-18
Urban Renewal Program - Better Public Housing - Allawah Court
11,300 - - - 11,300 Mar-18
Urban Renewal Program - Better Public Housing - Karuah
5,000 - - - 5,000 Mar-18
Urban Renewal Program - Better Public Housing - Red Hill housing precinct
2,300 - - - 2,300 Mar-18
2017-18 Budget Statements 32 Environment, Planning and Sustainable Development Directorate

Table 28: 2017-18 Environment, Planning and Sustainable Development Directorate Infrastructure Program (continued)
Project 2017-18$'000
2018-19$'000
2019-20$'000
2020-21$'000
Four YearInvestment
$'000
PhysicalCompletion
Date
Work In ProgressUrban Renewal Program - City to the
Lake – West Basin infrastructure7,500 - - - 7,500 Jun-18
Urban Renewal Program - Civic and Braddon public realm improvements
1,050 - - - 1,050 Jun-18
Woden Valley Stormwater Retardation Basins (Design)
230 - - - 230 Dec-17
Total Work In Progress 227,360 96,696 257 72 324,385
New WorkBetter services in your community -
Improving our capacity to fight bushfires
1,267 1,489 430 - 3,186 Jun-20
Better services in your community - Jarramlee Nature Reserve - Protecting our nature reserves
112 200 - - 312 Jun-19
Better support when it matters - Public Housing Renewal - New and better properties
27,295 20,124 - - 47,419 Jun-19
Better support when it matters - Public Housing Renewal - Taskforce operations
1,122 1,314 - - 2,436 Jun-19
Building a better city - Bindubi Street extension - Early planning
300 - - - 300 Jun-18
Building a better city - Molonglo East-West Arterial Road - Early planning
200 100 - - 300 Jun-19
Building a better city - William Hovell Drive Upgrade - Early planning
200 100 - - 300 Jun-19
More and better jobs - Ensuring continuity of the Spatial Data Management System
869 232 - - 1,101 Jun-19
Total New Capital 31,365 23,559 430 - 55,354
Better Infrastructure FundHeritage Conservation 151 154 158 162 625 Jun-18Land Release Infrastructure 412 302 310 318 1,342 Jun-18Parks and Conservation 629 543 557 571 2,300 Jun-18Unallocated Better Infrastructure Fund 96 97 97 97 387 Jun-18
Total Better Infrastructure Fund 1,288 1,096 1,122 1,148 4,654
2017-18 Budget Statements 33 Environment, Planning and Sustainable Development Directorate
Financial Statements
Table 29: Environment, Planning and Sustainable Development Directorate: Operating Statement
2016-17 Budget
$'000
2016-17 Estimated Outcome
$'000
2017-18 Budget
$'000
Var%
2018-19 Estimate
$'000
2019-20 Estimate
$'000
2020-21 Estimate
$'000
Income
Revenue84,733 Controlled Recurrent
Payments103,866 157,379 52 119,020 122,547 118,321
0 Land Revenue 64,355 53,731 -17 21,143 918 027 Taxes, Fees and Fines 27 28 4 29 29 29
7,946 User Charges 7,538 9,177 22 24,274 6,282 5,61968 Interest 234 329 41 217 148 91
2,640 Resources Received Free of Charge
2,179 2,267 4 2,358 2,452 2,550
7,340 Other Revenue 15,471 21,147 37 1,154 1,119 1,611
102,754 Total Revenue 193,670 244,058 26 168,195 133,495 128,221
Gains0 Other Gains 29,711 2 -100 2 2 2
0 Total Gains 29,711 2 -100 2 2 2
102,754 Total Income 223,381 244,060 9 168,197 133,497 128,223
Expenses 45,491 Employee Expenses 50,196 64,119 28 60,502 60,239 59,399
7,413 Superannuation Expenses 7,980 9,175 15 9,076 8,961 8,79342,012 Supplies and Services 47,851 101,982 113 64,526 54,105 52,131
2,099 Depreciation and Amortisation
2,894 3,023 4 3,402 3,486 3,550
6,234 Grants and Purchased Services
1,806 4,395 143 3,649 3,691 3,660
86 Cost of Goods Sold 86 86 - 13,386 86 14,8081,655 Other Expenses 3,101 3,456 11 3,197 3,305 10,771
0 Transfer Expenses 59,390 45,419 -24 23,112 806 2,978
104,990 Total Expenses 173,304 231,655 34 180,850 134,679 156,090
-2,236 Operating Result 50,077 12,405 -75 -12,653 -1,182 -27,867
Other Comprehensive Income
Items that will not be Reclassified Subsequently to Profit or Loss123,112 Increase/(Decrease) in Asset
Revaluation Surplus123,112 0 -100 0 0 0
123,112 Total Other Comprehensive Income
123,112 0 -100 0 0 0
120,876 Total Comprehensive Income
173,189 12,405 -93 -12,653 -1,182 -27,867
2017-18 Budget Statements 34 Environment, Planning and Sustainable Development Directorate
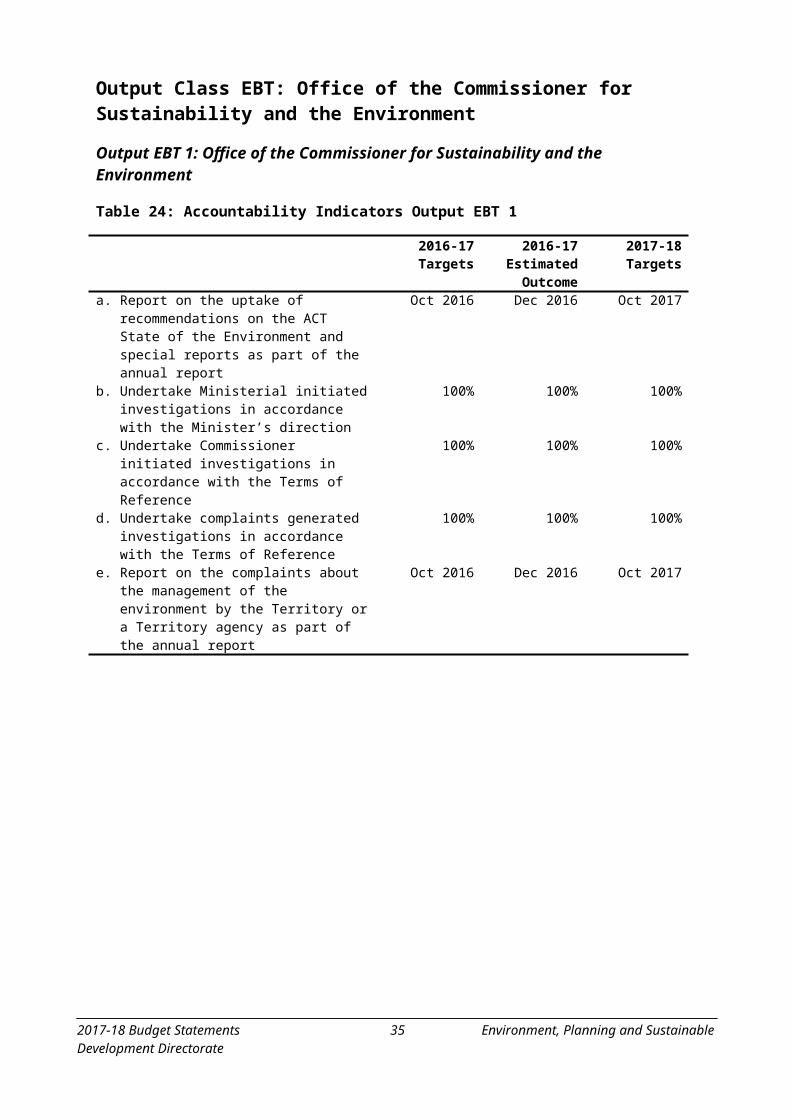
Table 30: Environment, Planning and Sustainable Development Directorate: Balance Sheet
Budgetat
30/6/17 $'000
2016-17 Estimated Outcome
$'000
Budgetat
30/6/18 $'000
Var%
Estimateat
30/6/19 $'000
Estimateat
30/6/20 $'000
Estimateat
30/6/21 $'000
Current Assets10,474 Cash and Cash Equivalents 21,422 39,845 86 35,899 33,631 30,099
4,163 Receivables 3,156 3,404 8 3,836 3,756 3,85751 Inventories 51 51 - 51 51 51
0 Assets Held for Sale 126,115 81,115 -36 7,759 21,204 1187 Other Assets 478 329 -31 180 43 43
14,875 Total Current Assets 151,222 124,744 -18 47,725 58,685 34,051
Non Current Assets8,777 Receivables 7,230 6,380 -12 5,367 4,703 4,207
275,993 Property, Plant and Equipment
417,261 291,243 -30 286,845 289,360 286,589
10,877 Intangible Assets 36,605 38,196 4 38,689 37,971 37,25318,377 Capital Works in Progress 26,129 147,769 466 114,698 109,790 110,91326,514 Other Assets 26,514 26,514 - 26,514 26,514 26,514
340,538 Total Non Current Assets 513,739 510,102 -1 472,113 468,338 465,476
355,413 TOTAL ASSETS 664,961 634,846 -5 519,838 527,023 499,527
Current Liabilities3,308 Payables 3,778 3,876 3 3,974 4,072 4,170
15,274 Employee Benefits 19,764 22,237 13 23,097 23,967 24,8730 Other Provisions 96,138 29,698 -69 46,521 33,526 0
1,743 Other Liabilities 861 847 -2 833 819 805
20,325 Total Current Liabilities 120,541 56,658 -53 74,425 62,384 29,848
Non Current Liabilities938 Employee Benefits 1,052 1,161 10 1,200 1,240 1,280
0 Other Provisions 11,646 15,654 34 158 9,309 0
938 Total Non Current Liabilities 12,698 16,815 32 1,358 10,549 1,280
21,263 TOTAL LIABILITIES 133,239 73,473 -45 75,783 72,933 31,128
334,150 NET ASSETS 531,722 561,373 6 444,055 454,090 468,399
REPRESENTED BY FUNDS EMPLOYED
204,737 Accumulated Funds 404,742 434,393 7 317,075 327,110 341,419129,413 Asset Revaluation Surplus 126,980 126,980 - 126,980 126,980 126,980
334,150 TOTAL FUNDS EMPLOYED 531,722 561,373 6 444,055 454,090 468,399
2017-18 Budget Statements 35 Environment, Planning and Sustainable Development Directorate
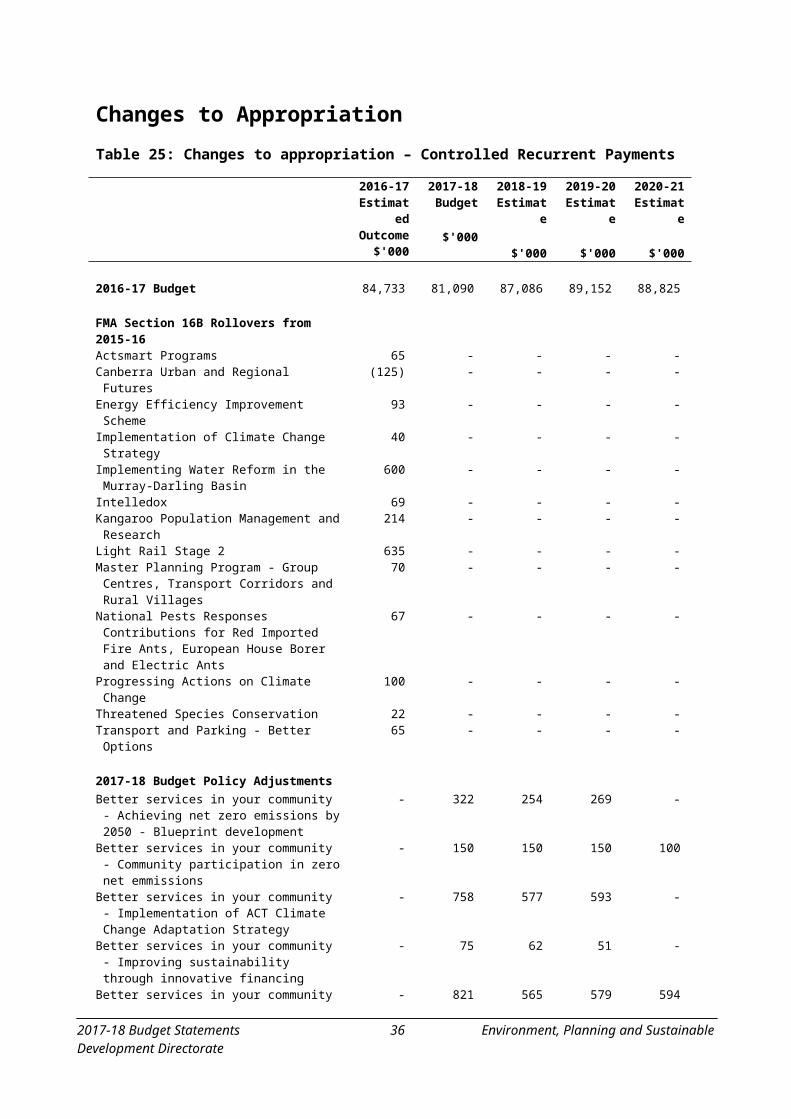
Table 31: Environment, Planning and Sustainable Development Directorate: Statement of Changes in Equity
Budgetat
30/6/17 $'000
2016-17 Estimated Outcome
$'000
Budgetat
30/6/18 $'000
Var%
Estimateat
30/6/19 $'000
Estimateat
30/6/20 $'000
Estimateat
30/6/21 $'000
Opening Equity16,805 Opening Accumulated Funds 9,320 404,742 # 434,393 317,075 327,110
6,301 Opening Asset Revaluation Reserve
3,868 126,980 # 126,980 126,980 126,980
23,106 Balance at the Start of the Reporting Period
13,188 531,722 # 561,373 444,055 454,090
Comprehensive Income-2,236 Operating Result - Including
Economic Flows50,077 12,405 -75 -12,653 -1,182 -27,867
123,112 Inc/Dec in Asset Revaluation Reserve Surpluses
123,112 0 -100 0 0 0
120,876 Total Comprehensive Income
173,189 12,405 -93 -12,653 -1,182 -27,867
Transactions Involving Owners Affecting Accumulated Funds26,931 Capital Injections 93,986 327,040 248 126,183 14,669 24,361
0 Capital Distributions to Government
-175,439 -194,659 -11 -92,149 -3,450 17,817
163,237 Inc/Dec in Net Assets due to Admin Restructure
426,798 -115,135 -127 -138,699 -2 -2
190,168 Total Transactions Involving Owners Affecting Accumulated Funds
345,345 17,246 -95 -104,665 11,217 42,176
Closing Equity204,737 Closing Accumulated Funds 404,742 434,393 7 317,075 327,110 341,419129,413 Closing Asset Revaluation
Reserve126,980 126,980 - 126,980 126,980 126,980
334,150 Balance at the end of the Reporting Period
531,722 561,373 6 444,055 454,090 468,399
2017-18 Budget Statements 36 Environment, Planning and Sustainable Development Directorate

Table 32: Environment, Planning and Sustainable Development Directorate: Cash Flow Statement
2016-17 Budget
$'000
2016-17 Estimated Outcome
$'000
2017-18 Budget
$'000
Var %
2018-19 Estimate
$'000
2019-20 Estimate
$'000
2020-21 Estimate
$'000
CASH FLOWS FROM OPERATING ACTIVITIESReceipts
82,461 Controlled Recurrent Payments
101,571 155,084 53 116,724 120,251 116,024
2,272 Payment for Community Service Obligations
2,295 2,295 - 2,296 2,296 2,297
27 Taxes, Fees and Fines 27 28 4 29 29 298,309 User Charges 7,901 9,539 24,636 6,644 5,981
68 Interest Received 234 329 41 217 148 914,568 Other 12,699 23,250 83 3,257 3,222 3,714
97,705 Operating Receipts 124,727 190,525 53 147,159 132,590 128,136
Payments44,935 Employee 49,644 63,185 27 59,564 59,288 58,658
7,417 Superannuation 7,984 9,178 15 9,080 8,965 8,85040,554 Supplies and Services 41,116 100,991 146 63,463 52,973 50,925
6,259 Grants and Purchased Services
1,831 4,420 141 3,674 3,716 3,685
0 Transfer of Territory Receipts to the ACT Government
59,390 45,419 -24 23,112 806 2,978
0 Related to Cost of Goods Sold 86 86 - 86 86 862,863 Other 9,962 4,561 -54 4,282 4,370 11,836
102,028 Operating Payments 170,013 227,840 34 163,261 130,204 137,018
-4,323 NET CASH INFLOW/(OUTFLOW) FROM OPERATING ACTIVITIES
-45,286 -37,315 18 -16,102 2,386 -8,882
CASH FLOWS FROM INVESTING ACTIVITIESReceipts
0 Proceeds from Sale of Property, Plant and Equipment
217,826 248,396 14 100,000 4,375 16,858
1,502 Repayment of Loan Principal 1,529 1,550 1 1,529 1,692 1,3431,502 Investing Receipts 219,355 249,946 14 101,529 6,067 18,201
Payments25,441 Purchase of Property, Plant
and Equipment27,075 258,863 856 120,876 1,809 1,220
0 Purchase of Land and Intangibles
53,754 66,806 24 1,611 19,211 3,492
1,490 Loans Provided (Loans Receivable)
2,410 920 -62 920 920 920
26,931 Investing Payments 83,239 326,589 292 123,407 21,940 5,632
-25,429 NET CASH INFLOW/(OUTFLOW) FROM INVESTING ACTIVITIES
136,116 -76,643 -156 -21,878 -15,873 12,569
2017-18 Budget Statements 37 Environment, Planning and Sustainable Development Directorate
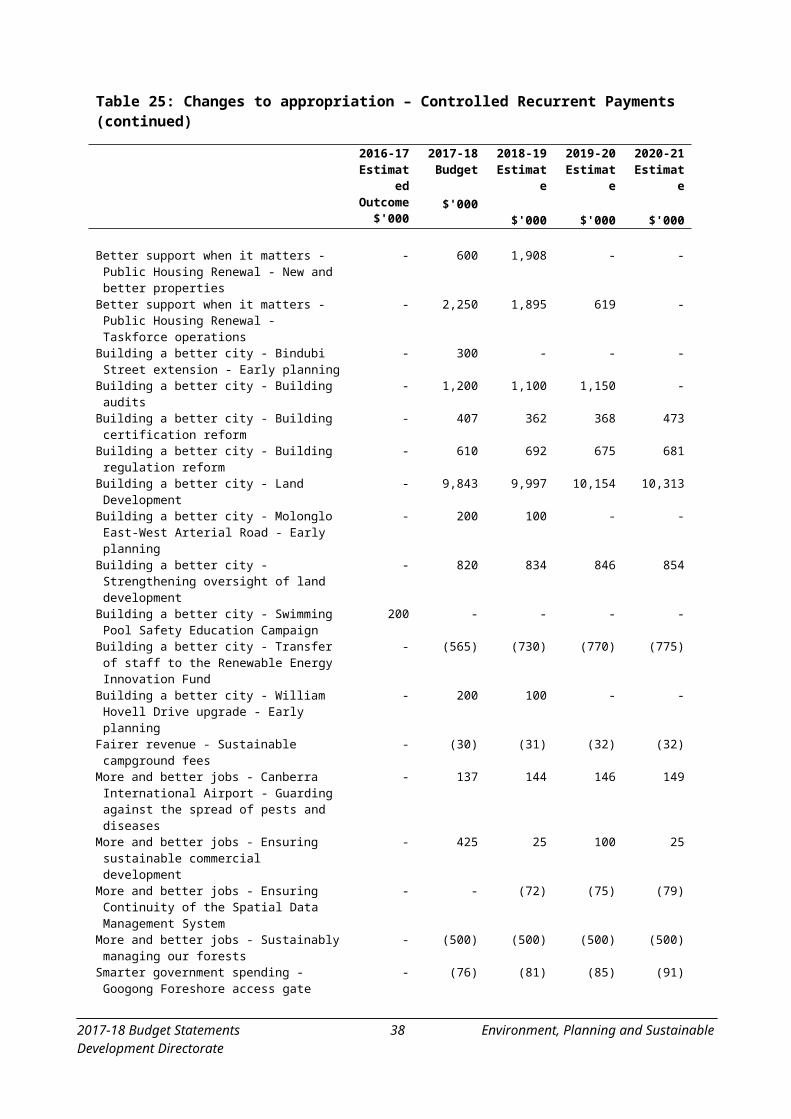
Table 32: Environment, Planning and Sustainable Development Directorate: Cash Flow Statement (continued)
2016-17 Budget
$'000
2016-17 Estimated Outcome
$'000
2017-18 Budget
$'000
Var %
2018-19 Estimate
$'000
2019-20 Estimate
$'000
2020-21 Estimate
$'000
CASH FLOWS FROM FINANCING ACTIVITIESReceipts
26,931 Capital Injections 93,986 327,040 248 126,183 14,669 24,361527 Proceeds from Borrowings 0 0 - 0 0 0
0 Receipts of Transferred Cash Balances
527 0 -100 0 0 0
27,458 Financing Receipts 94,513 327,040 246 126,183 14,669 24,361
Payments0 Distributions to Government 175,439 194,659 11 92,149 3,450 31,5800 Financing Payments 175,439 194,659 11 92,149 3,450 31,580
27,458 NET CASH INFLOW/(OUTFLOW) FROM FINANCING ACTIVITIES
-80,926 132,381 264 34,034 11,219 -7,219
-2,294 NET INCREASE / (DECREASE) IN CASH AND CASH EQUIVALENTS1
9,904 18,423 86 -3,946 -2,268 -3,532
12,768 CASH AT THE BEGINNING OF REPORTING PERIOD
11,518 21,422 86 39,845 35,899 33,631
10,474 CASH AT THE END OF REPORTING PERIOD
21,422 39,845 86 35,899 33,631 30,099
Notes:1. The decrease in cash and cash equivalents in 2018-19, 2019-20 and 2020-21 is mainly due to the outflows of funding
associated with the Renewable Energy Innovation Fund. The funding was primarily received in 2017-18, although expenditure will occur across the forward years.
2017-18 Budget Statements 38 Environment, Planning and Sustainable Development Directorate
Notes to the Controlled Budget Statements
Significant variations are as follows:
Operating Statement
controlled recurrent payments:
- the increase of $19.133 million (23 per cent) in the 2016-17 estimated outcome from the original budget is mainly due to the transfer of the Asbestos Response Taskforce from CMTEDD on 1 November 2016 ($18.030 million) and the FMA Section 16B rollovers from 2015-16 to 2016-17 ($2.040 million), partially offset by the revised funding profile adjustments ($0.695 million) and an amendment to the transfer of Parks and Conservation from TCCS ($0.474 million).
- the increase of $53.513 million (52 per cent) in the 2017-18 Budget from the 2016-17 estimated outcome is mainly due to the transfer of land policy and urban renewal functions from CMTEDD ($42.785 million), new budget initiatives ($20.347 million), partially offset by ceasing initiatives ($5.683 million), the decrease in funding for the Asbestos Response Taskforce ($3.717 million), the net impact of rollovers between financial years($1.345 million) and the amendment to the transfer of Parks and Conservation from TCCS ($1.065 million).
land revenue:
- the increase of $64.355 million in the 2016-17 estimated outcome from the original budget is due to the sale of remediated land under the Loose-fill Asbestos Insulation Eradication Scheme following the transfer of the Asbestos Response Taskforce from CMTEDD on 1 November 2016.
- the decrease of $10.624 million in the 2017-18 Budget from the 2016-17 estimated outcome is due to the decrease in the sale of remediated land under the Loose-fill Asbestos Insulation Eradication Scheme.
user charges:
- the increase of $1.639 million in the 2017-18 Budget is mainly due to an increase in funding available under the Energy Efficiency (Cost of Living) Improvement Scheme.
other revenue:
- the increase of $8.131 million in the 2016-17 estimated outcome from the original budget is mainly due to an increase in the revenue received under the Renewable Energy Innovation Fund.
- the increase of $5.676 million in the 2017-18 Budget is mainly due to an increase in the amount to be received under the Renewable Energy Innovation Fund.
2017-18 Budget Statements 39 Environment, Planning and Sustainable Development Directorate
other gains:
- the increase of $29.711 million in the 2016-17 estimated outcome from the original budget is due to the collection of additional Large Scale Generation Certificates surrendered by large scale users of electricity under the Renewable Energy Target Scheme.
- the decrease of $29.709 million in the 2017-18 Budget is due to the gains not being budgeted in the Directorate in the forward years.
employee expenses:
- the increase of $4.705 million in the 2016-17 estimated outcome from the original budget is mainly due to the transfer of the Asbestos Response Taskforce from CMTEDD on 1 November 2016 ($3.420 million) and the increase in staff to complete significant projects.
- the increase of $13.923 million in the 2017-18 Budget from the 2016-17 estimated outcome is due to new budget initiatives including support for the new City Renewal Authority (CRA) and Suburban Land Agency (SLA) ($9.184 million), the full year impact of the transfer of the Asbestos Response Taskforce from CMTEDD ($2.953 million) and the transfer of land policy and urban renewal functions from CMTEDD ($1.402 million).
superannuation expenses:
- the increase of $1.195 million in the 2017-18 Budget from the 2016-17 estimated outcome is due to new budget initiatives including support for the new City Renewal Authority (CRA) and Suburban Land Agency (SLA) ($1.037 million).
supplies and services:
- the increase of $5.839 million in the 2016-17 estimated outcome from the original budget is mainly due to the transfer of the Asbestos Response Taskforce from CMTEDD on 1 November 2016 ($2.742 million) and the movement between grants and consultants to better reflect the expenditure profile of the Renewable Energy Innovation Fund ($2.527 million).
- the increase of $54.131 million in the 2017-18 Budget from the 2016-17 estimated outcome is due to the transfer of land policy and urban renewal functions from CMTEDD ($39.214 million), new budget initiatives including support for the new City Renewal Authority (CRA) and Suburban Land Agency (SLA) ($10.308 million) and the increase in expenditure under the Renewable Energy Innovation Fund ($5.659 million).
grants and purchased services:
- the decrease of $4.428 million in the 2016-17 estimated outcome from the original budget is mainly due to the movement between grants and consultants/salaries to better reflect the expenditure profile of the Renewable Energy Innovation Fund ($4.098 million).
2017-18 Budget Statements 40 Environment, Planning and Sustainable Development Directorate
- the increase of $2.589 million in the 2017-18 Budget from the 2016-17 estimated outcome is mainly due to the increase in expenditure under the Renewable Energy Innovation Fund.
transfer expenses:
- the increase of $59.390 million in the 2016-17 estimated outcome from the original budget is due to the transfer of the Asbestos Response Taskforce from CMTEDD on 1 November 2016.
- the decrease of $13.971 million in the 2017-18 Budget from the 2016-17 estimated outcome is due to the decrease in sales under the Asbestos Response Taskforce program being paid back to Government.
Balance Sheet
cash and equivalents:
- the increase of $10.948 million in the 2016-17 estimated outcome from the original budget is mainly due to the cash received from the Renewable Energy Innovation Fund and the additional money available under the Carbon Neutral Government loan.
- the increase of $18.423 million in the 2017-18 Budget from the 2016-17 estimated outcome is mainly due to the cash received from the Renewable Energy Innovation Fund and the additional money available under the Carbon Neutral Government loan.
current and non-current receivables:
- the decrease of $2.554 million in the 2016-17 estimated outcome from the original budget is mainly due to the repayment of the Carbon Neutral Government loans.
assets held for sale:
- the increase of $126.115 million in the 2016-17 estimated outcome from the original budget is due to the land held for sale with the Asbestos Response Taskforce.
- the decrease of $45 million in the 2017-18 Budget from the 2016-17 estimated outcome is due to a lower number of blocks held following sale of land under the Asbestos Response Taskforce.
property, plant and equipment:
- the increase of $141.268 million in the 2016-17 estimated outcome from the original budget is mainly due to the land purchased under the Asbestos Eradication Scheme.
- the decrease of $126.018 million in the 2017-18 Budget from the 2016-17 estimated outcome is mainly due to the movement of land from property to assets held for sale and the sale of land during the year.
2017-18 Budget Statements 41 Environment, Planning and Sustainable Development Directorate

intangible assets:
- the increase of $25.728 million in the 2016-17 estimated outcome from the original budget is due to the additional Large Scale Generation Certificates received as part of the Renewable Energy Target Scheme.
current and non-current capital works in progress:
- the increase of $7.752 million in the 2016-17 estimated outcome from the original budget is mainly due to the capital works associated with Parks and Conservation projects. These projects include Enhancing the Protection of Endangered Species and Environmental Offsets.
- the increase of $121.640 million in the 2017-18 Budget from the 2016-17 estimated outcome is mainly due to new initiatives, including the Public Housing Renewal projects ($76.549 million) and the capital works associated with current projects for environment and ACT Healthy Waterways.
current and non current employee benefits:
- the increase of $4.604 million in the 2016-17 estimated outcome is mainly due to the impact of the transfer of Asbestos Response Taskforce staff from CMTEDD on 1 November 2016 and the flow-on effects of the 2015-16 financial results.
- the increase of $2.582 million in the 2017-18 Budget from the 2016-17 estimated outcome is mainly due to the increase in staff associated with the transfer of land policy and urban renewal functions from CMTEDD/LDA.
other provisions:
- the increase of $107.784 million in the 2016-17 estimated outcome from the original budget relates to the value of the provisions associated with the Loose-fill Asbestos Insulation Eradication Scheme following the transfer of the Asbestos Response Taskforce from CMTEDD on 1 November 2016.
- the decrease of $62.432 million in the 2017-18 Budget from the 2016-17 estimated outcome is mainly due to a decrease in the value of the provisions associated with the Loose-fill Asbestos Insulation Eradication Scheme as property remediation is completed.
Statement of Changes in Equity
capital injections:
- the increase of $67.055 million in the 2016-17 estimated outcome from the original budget is mainly due to the transfer of the Asbestos Response Taskforce from CMTEDD on 1 November 2016 ($63.884 million), the increase in funds received from the Commonwealth for the ACT Healthy Waterways project ($7 million) and the FMA Section 16B rollovers from 2015-16 to 2016-17 ($2.497 million), partially offset by the rollover of funds from 2016-17 to 2017-18 ($6.130 million).
2017-18 Budget Statements 42 Environment, Planning and Sustainable Development Directorate
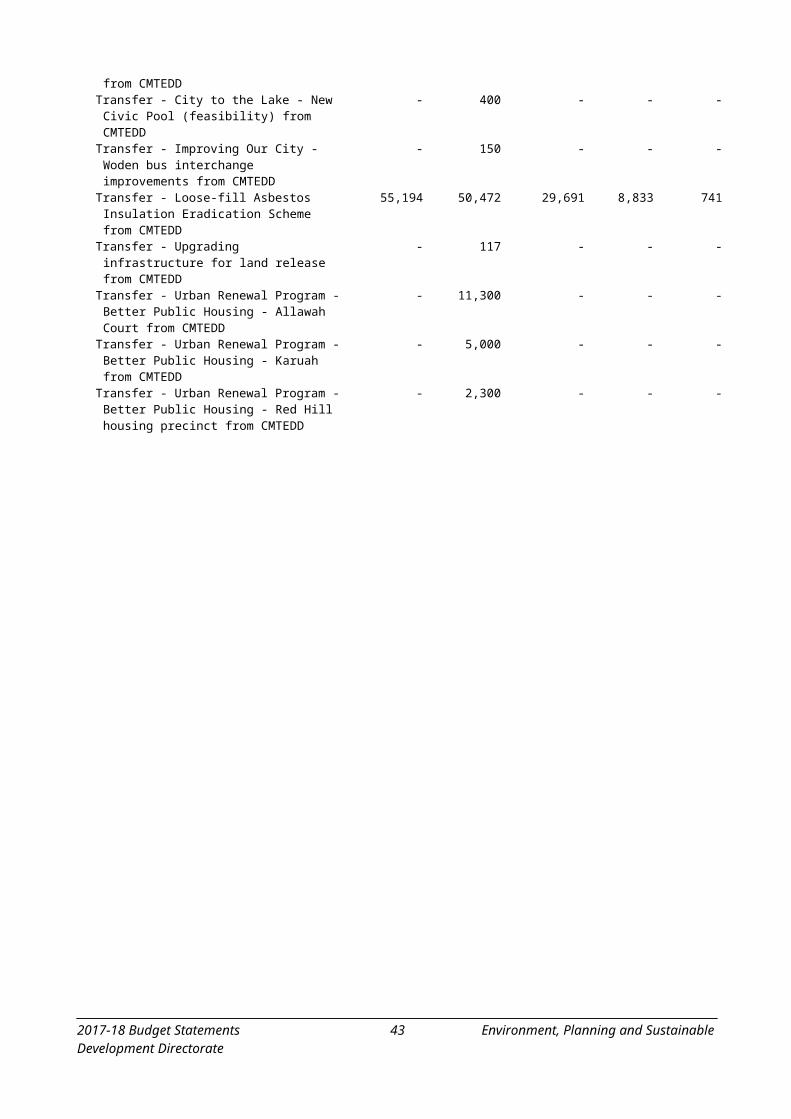
- the increase of $233.054 million in the 2017-18 Budget from the 2016-17 estimated outcome is mainly due to the transfer of transfer of land policy and urban renewal functions from CMTEDD ($175.542 million), new budget initiatives ($30.665 million), the increase in funds received from the Commonwealth for the ACT Healthy Waterways project ($20.500 million) and the rollover of funds from 2016-17 to 2017-18 ($5.302 million).
Cash Flow Statement
Variations in the Statement are explained in the notes above.
2017-18 Budget Statements 43 Environment, Planning and Sustainable Development Directorate
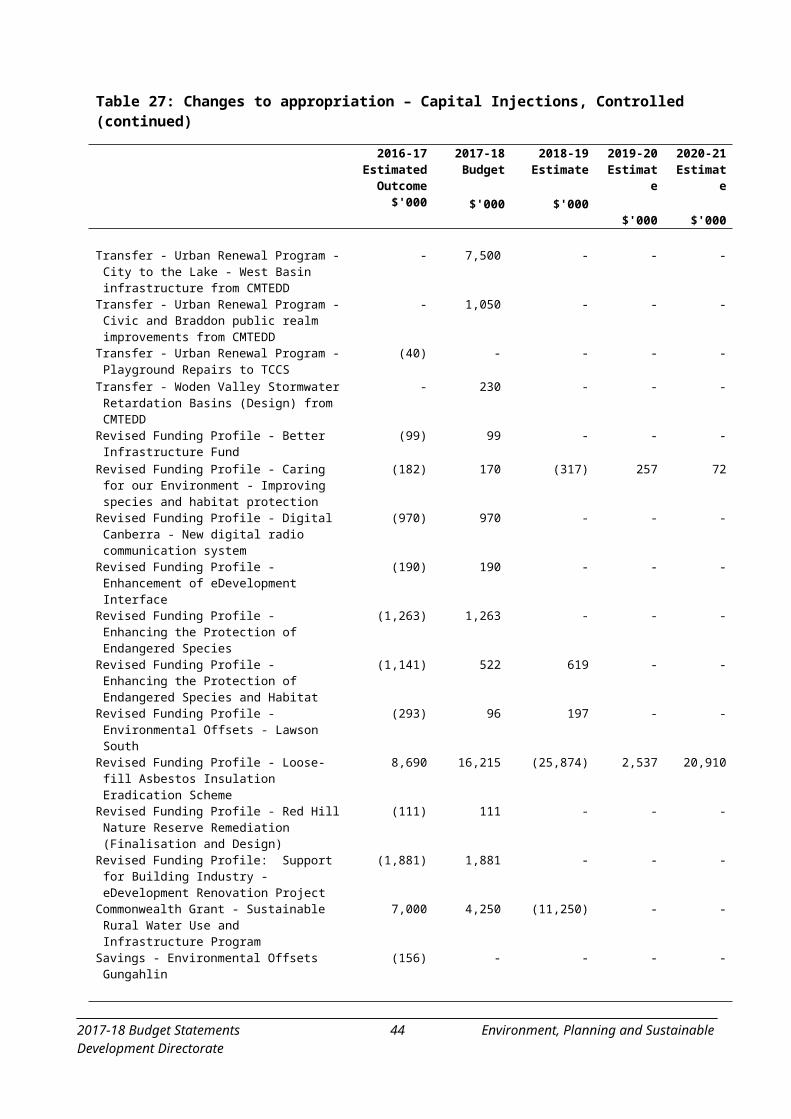
Financial Statements
Table 33: Environment, Planning and Sustainable Development Directorate: Statement of Income and Expenses on behalf of the Territory
2016-17 Budget
$'000
2016-17 Estimated Outcome
$'000
2017-18 Budget
$'000
Var%
2018-19 Estimate
$'000
2019-20 Estimate
$'000
2020-21 Estimate
$'000
Revenue2,515 Payment for Expenses on
Behalf of the Territory2,102 2,367 13 2,004 2,044 2,083
23,206 Taxes, Fees and Fines 28,707 31,091 8 32,130 33,318 34,0174,103 Land Revenue 48,332 20,638 -57 39,672 45,654 56,624
185 Interest 1,732 796 -54 1,907 2,494 1,969
30,009 Total Revenue 80,873 54,892 -32 75,713 83,510 94,693
Gains0 Other Gains 2,154 0 -100 0 0 0
0 Total Gains 2,154 0 -100 0 0 0
30,009 Total Income 83,027 54,892 -34 75,713 83,510 94,693
Expenses 817 Employee Expenses 866 829 -4 843 853 863114 Superannuation Expenses 107 105 -2 108 111 114823 Supplies and Services 363 908 150 514 527 539761 Grants and Purchased
Services761 525 -31 539 553 567
0 Other Expenses 3,624 4,547 25 1,450 1,400 90027,494 Transfer Expenses 75,147 47,978 -36 72,259 80,066 91,710
30,009 Total Expenses 80,868 54,892 -32 75,713 83,510 94,693
0 Operating Result 2,159 0 100 0 0 0
Other Comprehensive Income
Items that will not be Reclassified Subsequently to Profit or Loss0 Increase/(Decrease) in Asset
Revaluation Surplus-11,701 0 100 0 0 0
0 Total Other Comprehensive Income
-11,701 0 100 0 0 0
0 Total Comprehensive Income
-9,542 0 100 0 0 0
2017-18 Budget Statements 44 Environment, Planning and Sustainable Development Directorate
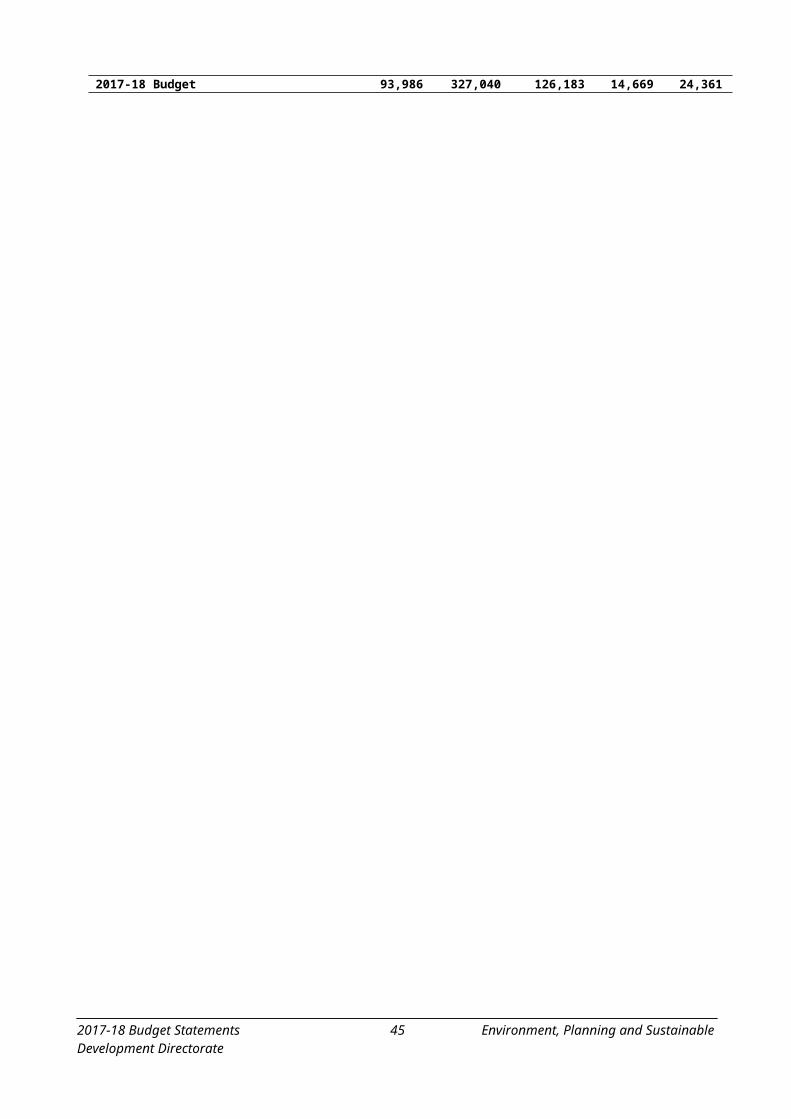
Table 34: Environment, Planning and Sustainable Development Directorate: Statement of Assets and Liabilities on behalf of the Territory
Budgetat
30/6/17 $'000
2016-17 Estimated Outcome
$'000
Budgetat
30/6/18 $'000
Var%
Estimateat
30/6/19 $'000
Estimateat
30/6/20 $'000
Estimateat
30/6/21 $'000
Current Assets1,475 Cash and Cash Equivalents 3,620 3,587 -1 3,554 3,521 3,488
934 Receivables 67,544 93,599 39 99,138 104,907 110,6760 Inventories 133 133 - 133 133 133
2,409 Total Current Assets 71,297 97,319 36 102,825 108,561 114,297
Non Current Assets2,252 Receivables 1,297 1,403 8 1,509 1,615 1,721
82,310 Property, Plant and Equipment
90,232 90,232 - 90,232 90,232 90,232
84,562 Total Non Current Assets 91,529 91,635 .. 91,741 91,847 91,953
86,971 TOTAL ASSETS 162,826 188,954 16 194,566 200,408 206,250
Current Liabilities464 Payables 69,500 95,507 37 100,998 106,719 112,440294 Employee Benefits 99 104 5 109 114 119922 Other Liabilities 1,034 1,039 .. 1,044 1,049 1,054
1,680 Total Current Liabilities 70,633 96,650 37 102,151 107,882 113,613
Non Current Liabilities222 Payables 111 222 100 333 444 555
7 Employee Benefits 14 14 - 14 14 142,425 Other Liabilities 1,189 1,189 - 1,189 1,189 1,189
2,654 Total Non Current Liabilities 1,314 1,425 8 1,536 1,647 1,758
4,334 TOTAL LIABILITIES 71,947 98,075 36 103,687 109,529 115,371
82,637 NET ASSETS 90,879 90,879 - 90,879 90,879 90,879
REPRESENTED BY FUNDS EMPLOYED
31,869 Accumulated Funds 34,210 34,210 - 34,210 34,210 34,21050,768 Asset Revaluation Surplus 56,669 56,669 - 56,669 56,669 56,669
82,637 TOTAL FUNDS EMPLOYED 90,879 90,879 - 90,879 90,879 90,879
2017-18 Budget Statements 45 Environment, Planning and Sustainable Development Directorate
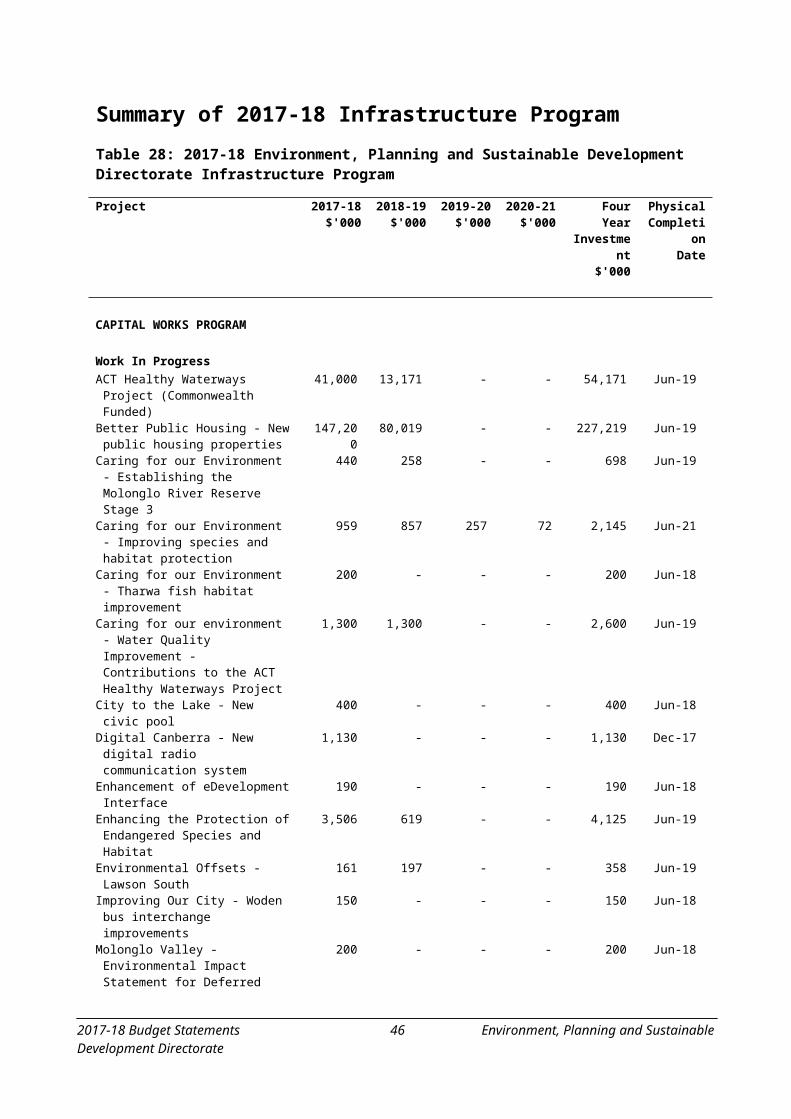
Table 35: Environment, Planning and Sustainable Development Directorate: Statement of Changes in Equity on behalf of the Territory
Budgetat
30/6/17 $'000
2016-17 Estimated Outcome
$'000
Budgetat
30/6/18 $'000
Var%
Estimateat
30/6/19 $'000
Estimateat
30/6/20 $'000
Estimateat
30/6/21 $'000
Opening Equity31,869 Opening Accumulated Funds 32,051 34,210 7 34,210 34,210 34,21050,768 Opening Asset Revaluation
Reserve68,370 56,669 -17 56,669 56,669 56,669
82,637 Balance at the Start of the Reporting Period
100,421 90,879 -10 90,879 90,879 90,879
Comprehensive Income0 Operating Result - Including
Economic Flows2,159 0 -100 0 0 0
0 Inc/Dec in Asset Revaluation Reserve Surpluses
-11,701 0 100 0 0 0
0 Total Comprehensive Income
-9,542 0 100 0 0 0
Closing Equity31,869 Closing Accumulated Funds 34,210 34,210 - 34,210 34,210 34,21050,768 Closing Asset Revaluation
Reserve56,669 56,669 - 56,669 56,669 56,669
82,637 Balance at the end of the Reporting Period
90,879 90,879 - 90,879 90,879 90,879
2017-18 Budget Statements 46 Environment, Planning and Sustainable Development Directorate

Table 36: Environment, Planning and Sustainable Development Directorate: Cash Flow Statement on behalf of the Territory
2016-17 Budget
$'000
2016-17 Estimated Outcome
$'000
2017-18 Budget
$'000
Var %
2018-19 Estimate
$'000
2019-20 Estimate
$'000
2020-21 Estimate
$'000
CASH FLOWS FROM OPERATING ACTIVITIESReceipts
2,515 Payment for Expenses on Behalf of the Territory
2,102 2,367 13 2,004 2,044 2,083
23,206 Taxes, Fees and Fines 28,707 31,091 8 32,130 33,318 34,017185 Interest Received 1,732 796 -54 1,907 2,494 1,969
0 Land Sales 43,632 15,806 -64 34,705 40,548 51,3754,275 Other 4,872 5,004 3 5,139 5,278 5,421
30,181 Operating Receipts 81,045 55,064 -32 75,885 83,682 94,865
Payments817 Employee 871 829 -5 843 853 863114 Superannuation 107 105 -2 108 111 114
1,023 Supplies and Services 563 1,108 97 714 727 739761 Grants and Purchased
Services761 525 -31 539 553 567
27,494 Transfer of Territory Receipts to the ACT Government
75,147 47,978 -36 72,259 80,066 91,710
5 Other 3,629 4,552 25 1,455 1,405 90530,214 Operating Payments 81,078 55,097 -32 75,918 83,715 94,898
-33 NET CASH INFLOW/(OUTFLOW) FROM OPERATING ACTIVITIES
-33 -33 - -33 -33 -33
-33 NET INCREASE / (DECREASE) IN CASH AND CASH EQUIVALENTS
-33 -33 - -33 -33 -33
1,508 CASH AT THE BEGINNING OF REPORTING PERIOD
3,653 3,620 -1 3,587 3,554 3,521
1,475 CASH AT THE END OF REPORTING PERIOD
3,620 3,587 -1 3,554 3,521 3,488
2017-18 Budget Statements 47 Environment, Planning and Sustainable Development Directorate
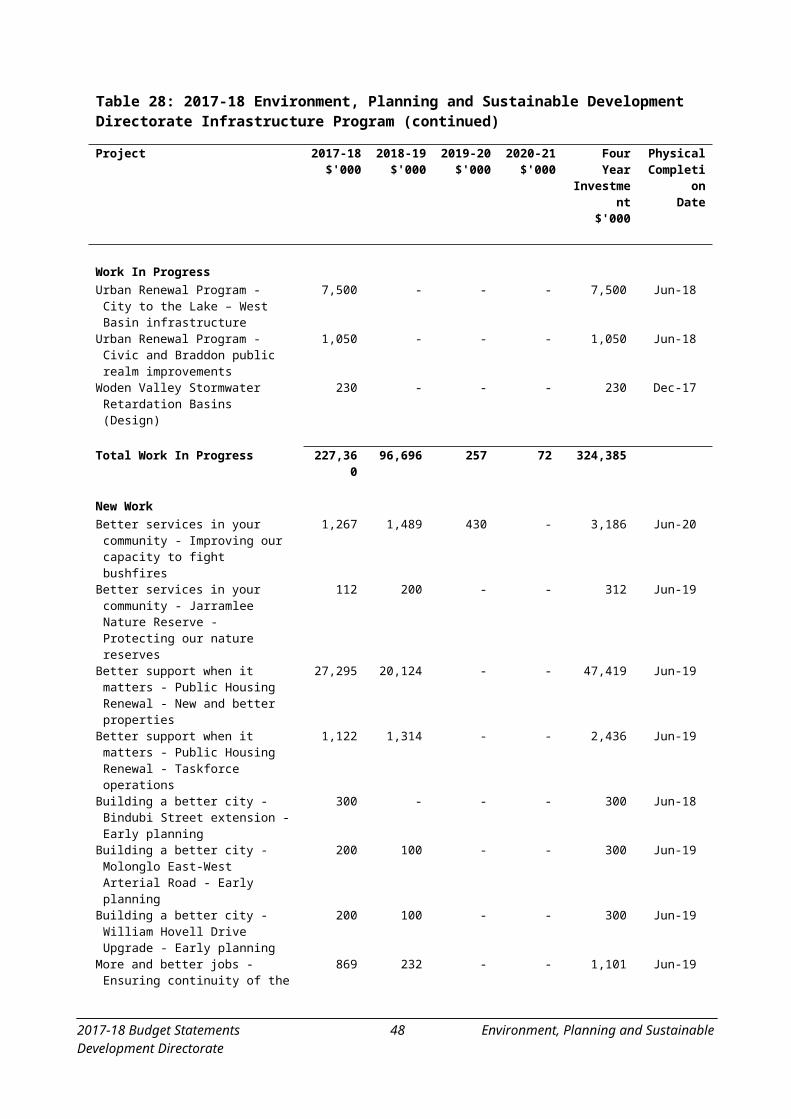
Notes to the Territorial Budget Statements
Significant variations are as follows:
Statement of Income and Expenses on behalf of the Territory
payment for Expenses on Behalf of the Territory:
- the decrease of $0.413 million (20 per cent) in the 2016-17 estimated outcome from the original budget is mainly due to the rollover of funds from 2016-17 into 2017-18.
taxes, fees and fines:
- the increase of $5.501 million in the 2016-17 estimated outcome from the original budget is mainly due to a change in the accounting treatment for revenue transferred to Controlled under the Energy Efficiency (Cost of Living) Improvement Scheme ($3.624 million). Previously the transfer to Controlled was net off against the revenue from electricity suppliers. It is now shown as an expense item. The estimate for Lease Variation Charge is also higher following an increase in building activity ($2.162 million).
- the increase of $2.384 million in the 2017-18 Budget from the 2016-17 estimated outcome is mainly due to an increase in the estimate for Lease Variation Charge.
land revenue:
- the increase of $44.229 million in the 2016-17 estimated outcome from the original budget is mainly due to the transfer of land revenue from the land release program from TCCS on 1 July 2016.
- the decrease of $27.694 million in the 2017-18 Budget from the 2016-17 estimated outcome is mainly due to timings in the land release program.
interest revenue:
- the increase of $1.547 million in the 2016-17 estimated outcome from the original budget is mainly due to the interest received for variations in land sales from the discontinued LDA. This was transferred to the Directorate from TCCS on 1 July 2016.
other gains:
- the increase of $2.154 million in the 2016-17 estimated outcome from the original budget is due to transfer of land assets from TCCS on 1 July 2016.
- the decrease of $2.154 million in the 2017-18 Budget is due to the once off transfer of land in 2016-17.
2017-18 Budget Statements 48 Environment, Planning and Sustainable Development Directorate

other expenses:
- the increase of $3.624 million in the 2016-17 estimated outcome from the original budget is mainly due to the change in accounting treatment for the transfer of revenue to Controlled under the Energy Efficiency (Cost of Living) Improvement Scheme. Previously the transfer to Controlled was net off against the revenue from electricity suppliers. It is now shown as an expense item.
transfer expenses: variations in these expenses reflect the variations in revenues described above.
Statement of Assets and Liabilities on behalf of the Territory
cash and equivalents:
- the increase of $2.145 million in the 2016-17 estimated outcome from the original budget is mainly due to the flow-on effects of the 2015-16 financial results.
current and non-current receivables:
- the increase of $65.655 million in the 2016-17 estimated outcome from the original budget is mainly due to the transfer of receivables from TCCS for land revenue outstanding.
- the increase of $26.161 million in the 2017-18 Budget from the 2016-17 estimated outcome is mainly due to the timings in the land release program.
property, plant and equipment:
- the increase of $7.922 million in the 2016-17 estimated outcome from the original budget is mainly due to the revaluation of land as a result of a change in the 10-year Government bond rate ($5.901 million) and the transfer of land from TCCS ($2.021 million).
current and non-current payables:
- the increase of $68.925 million in the 2016-17 estimated outcome from the original budget is mainly due to the transfer of payables from TCCS for the payment back to Government for land revenue.
- the increase of $26.118 million in the 2017-18 Budget from the 2016-17 estimated outcome is mainly due to the timings in the land release program.
other liabilities:
- the decrease of $1.124 million in the 2016-17 estimated outcome from the original budget predominately relates to the flow-on effects of the 2015-16 financial results.
Statement of Changes in Equity and Cash Flow Statement
Variations in the Statement are explained in the notes above.
2017-18 Budget Statements 49 Environment, Planning and Sustainable Development Directorate
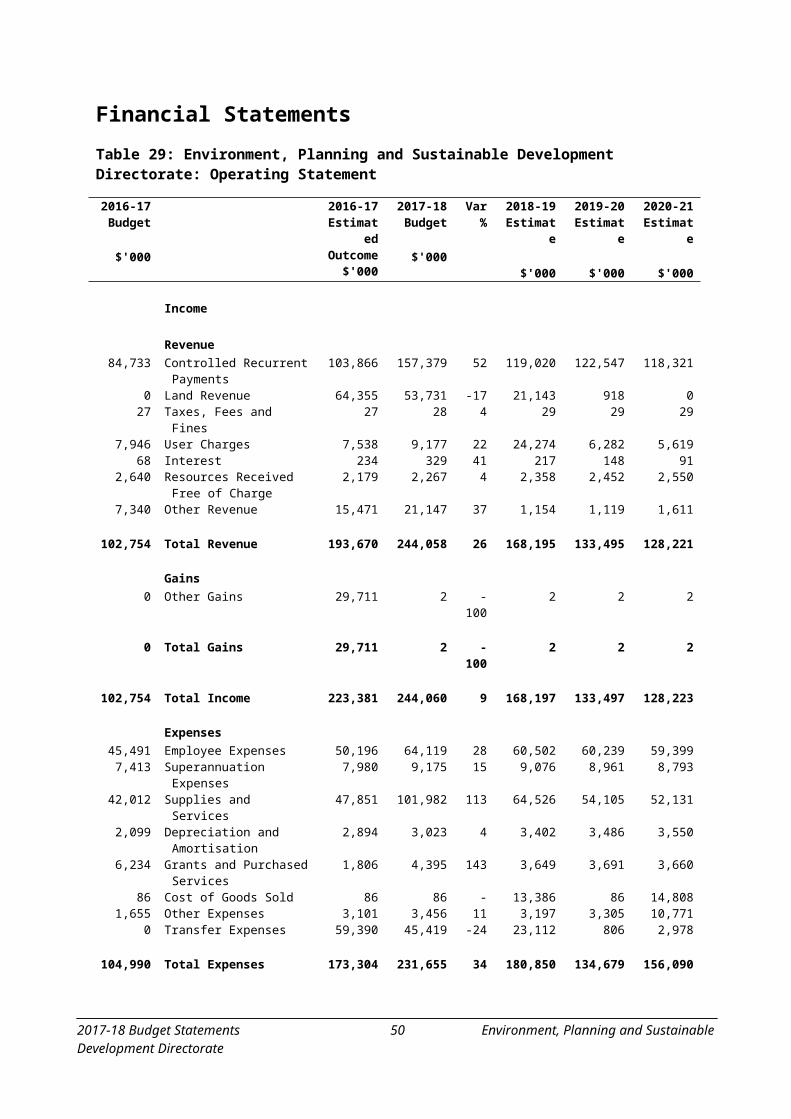
Table 37: Output Class 1: Planning Operating Statement
2016-17 Budget
$'000
2016-17 Estimated Outcome
$'000
2017-18 Budget
$'000
Var%
2018-19 Estimate
$'000
2019-20 Estimate
$'000
2020-21 Estimate
$'000
Revenue25,047 Controlled Recurrent
Payments25,661 27,831 8 26,061 26,783 26,033
1,366 User Charges 2,204 2,501 13 2,441 2,468 2,5191,082 Resources Received Free of
Charge1,082 1,270 17 1,317 1,369 1,424
0 Other Revenue 685 10 -99 10 10 10
27,495 Total Revenue 29,632 31,612 7 29,829 30,630 29,986
Expenses 16,057 Employee Expenses 16,060 17,681 10 18,031 18,010 17,387
2,617 Superannuation Expenses 2,617 2,732 4 2,755 2,706 2,5999,305 Supplies and Services 12,629 13,467 7 11,772 12,631 12,583
988 Depreciation and Amortisation
350 447 28 806 926 926
170 Grants and Purchased Services
170 0 -100 0 0 0
3 Other Expenses 49 50 2 52 53 54
29,140 Total Ordinary Expenses 31,875 34,377 8 33,416 34,326 33,549
-1,645 Operating Result -2,243 -2,765 -23 -3,587 -3,696 -3,563
2017-18 Budget Statements 50 Environment, Planning and Sustainable Development Directorate
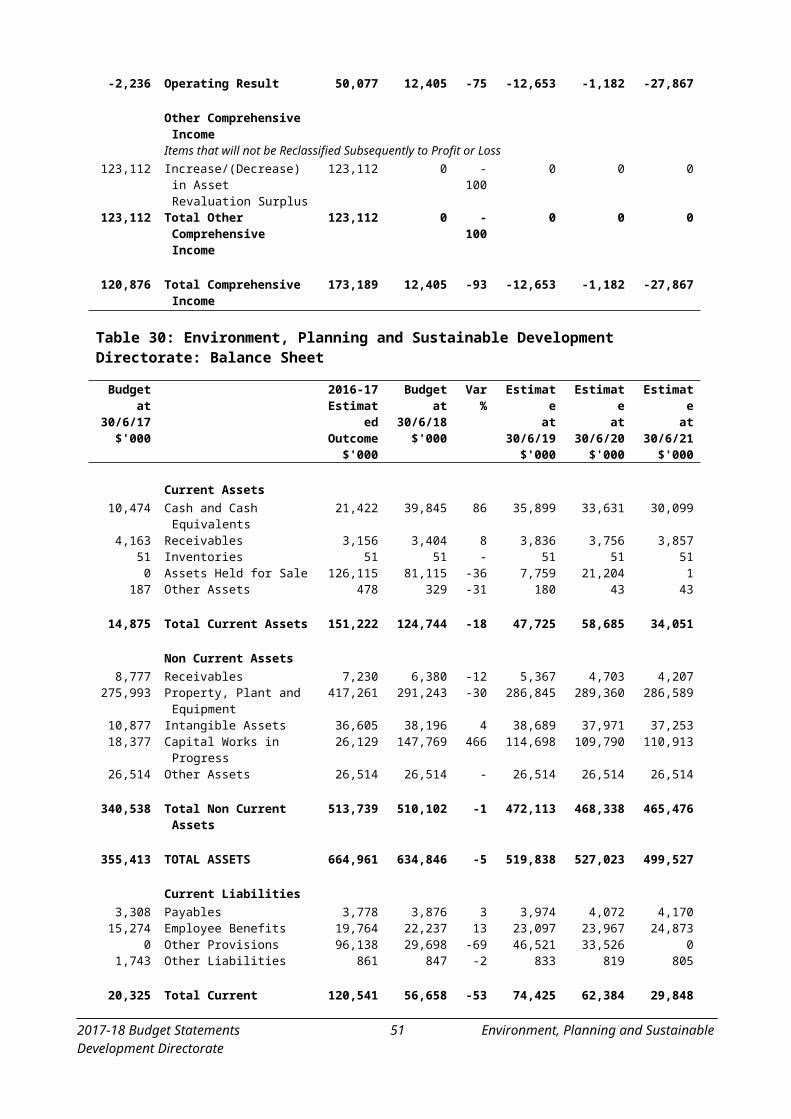
Table 38: Output Class 2: Environment Operating Statement
2016-17 Budget
$'000
2016-17 Estimated Outcome
$'000
2017-18 Budget
$'000
Var%
2018-19 Estimate
$'000
2019-20 Estimate
$'000
2020-21 Estimate
$'000
Revenue59,686 Controlled Recurrent
Payments60,175 58,232 -3 61,636 61,917 61,766
27 Taxes, Fees and Fines 27 28 4 29 29 296,580 User Charges 5,334 6,676 25 3,833 3,814 3,100
68 Interest 234 329 41 217 148 911,558 Resources Received Free of
Charge1,097 997 -9 1,041 1,083 1,126
7,340 Other Revenue 14,786 21,137 43 1,144 1,109 1,601
75,259 Total Revenue 81,653 87,399 7 67,900 68,100 67,713
Gains0 Other Gains 29,709 0 -100 0 0 0
0 Total Gains 29,709 0 -100 0 0 0
75,259 Total Income 111,362 87,399 -22 67,900 68,100 67,713
Expenses 29,434 Employee Expenses 30,716 31,556 3 31,064 31,562 31,489
4,796 Superannuation Expenses 4,767 4,734 -1 4,627 4,612 4,52632,707 Supplies and Services 32,480 34,350 6 35,314 33,681 31,620
1,111 Depreciation and Amortisation
2,544 2,540 - 2,560 2,550 2,614
6,064 Grants and Purchased Services
1,636 1,963 20 1,203 1,230 1,195
86 Cost of Goods Sold 86 86 - 86 86 861,652 Other Expenses 1,817 1,692 -7 1,811 1,858 1,863
75,850 Total Ordinary Expenses 74,046 76,921 4 76,665 75,579 73,393
-591 Operating Result 37,316 10,478 -72 -8,765 -7,479 -5,680
2017-18 Budget Statements 51 Environment, Planning and Sustainable Development Directorate

Table 39: Output Class 3: Loose-fill Asbestos Insulation Eradication Operating Statement
2016-17 Budget
$'000
2016-17 Estimated Outcome
$'000
2017-18 Budget
$'000
Var%
2018-19 Estimate
$'000
2019-20 Estimate
$'000
2020-21 Estimate
$'000
Revenue0 Controlled Recurrent
Payments18,030 14,371 -20 6,321 16,411 13,541
0 Land Revenue 64,355 53,731 -17 21,143 918 0
0 Total Revenue 82,385 68,102 -17 27,464 17,329 13,541
Gains0 Other Gains 2 2 - 2 2 2
0 Total Gains 2 2 - 2 2 2
0 Total Income 82,387 68,104 -17 27,466 17,331 13,543
Expenses 0 Employee Expenses 3,420 6,373 86 2,864 2,714 2,7140 Superannuation Expenses 596 633 6 608 577 6760 Supplies and Services 2,742 8,865 223 4,131 1,444 1,7580 Depreciation and
Amortisation0 36 # 36 10 10
0 Cost of Goods Sold 0 0 - 0 0 14,7220 Other Expenses 1,235 1,675 36 1,295 1,355 8,8660 Transfer Expenses 59,390 45,419 -24 18,412 806 2,978
0 Total Ordinary Expenses 67,383 63,001 -7 27,346 6,906 31,724
0 Operating Result 15,004 5,103 -66 120 10,425 -18,181
2017-18 Budget Statements 52 Environment, Planning and Sustainable Development Directorate
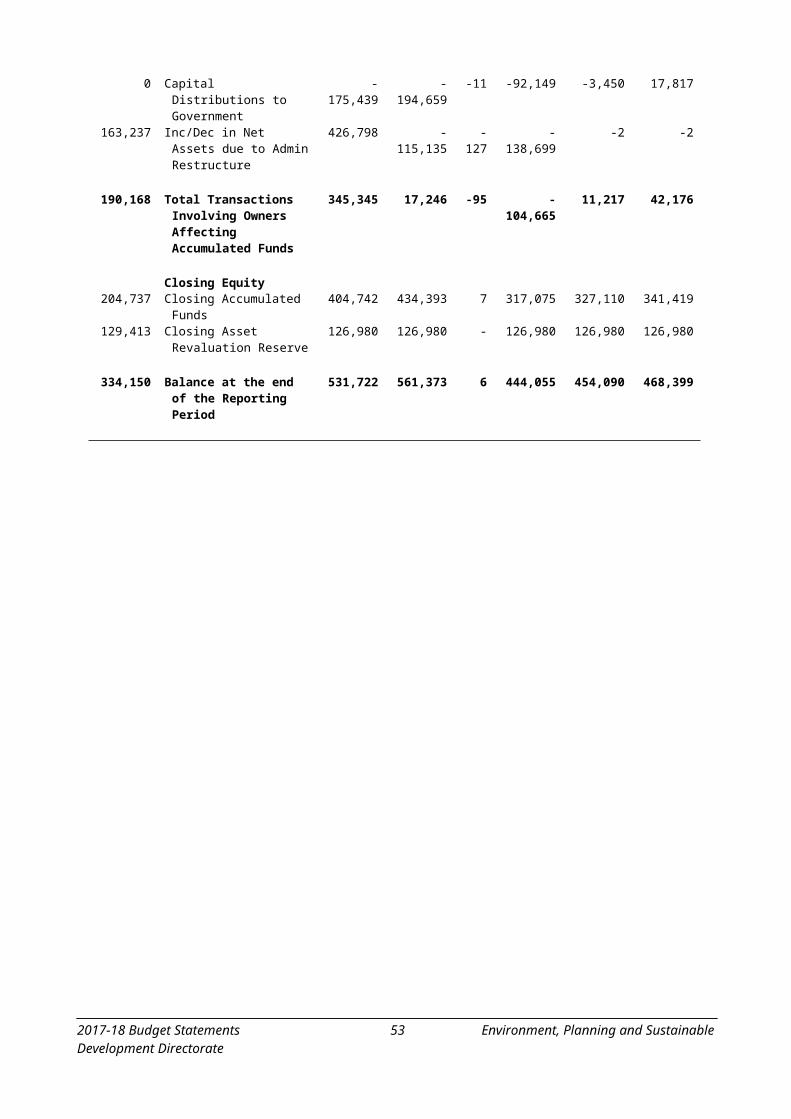
Table 40: Output Class 4: Land Policy and Renewal Operating Statement
2016-17 Budget
$'000
2016-17 Estimated Outcome
$'000
2017-18 Budget
$'000
Var%
2018-19 Estimate
$'000
2019-20 Estimate
$'000
2020-21 Estimate
$'000
Revenue0 Controlled Recurrent
Payments0 56,945 # 25,002 17,436 16,981
0 User Charges 0 0 - 18,000 0 0
0 Total Revenue 0 56,945 # 43,002 17,436 16,981
0 Total Income 0 56,945 # 43,002 17,436 16,981
Expenses 0 Employee Expenses 0 8,509 # 8,543 7,953 7,8090 Superannuation Expenses 0 1,076 # 1,086 1,066 9920 Supplies and Services 0 45,300 # 13,309 6,349 6,1700 Grants and Purchased
Services0 2,432 # 2,446 2,461 2,465
0 Cost of Goods Sold 0 0 - 13,300 0 00 Other Expenses 0 39 # 39 39 -120 Transfer Expenses 0 0 - 4,700 0 0
0 Total Ordinary Expenses 0 57,356 # 43,423 17,868 17,424
0 Operating Result 0 -411 # -421 -432 -443
2017-18 Budget Statements 53 Environment, Planning and Sustainable Development Directorate
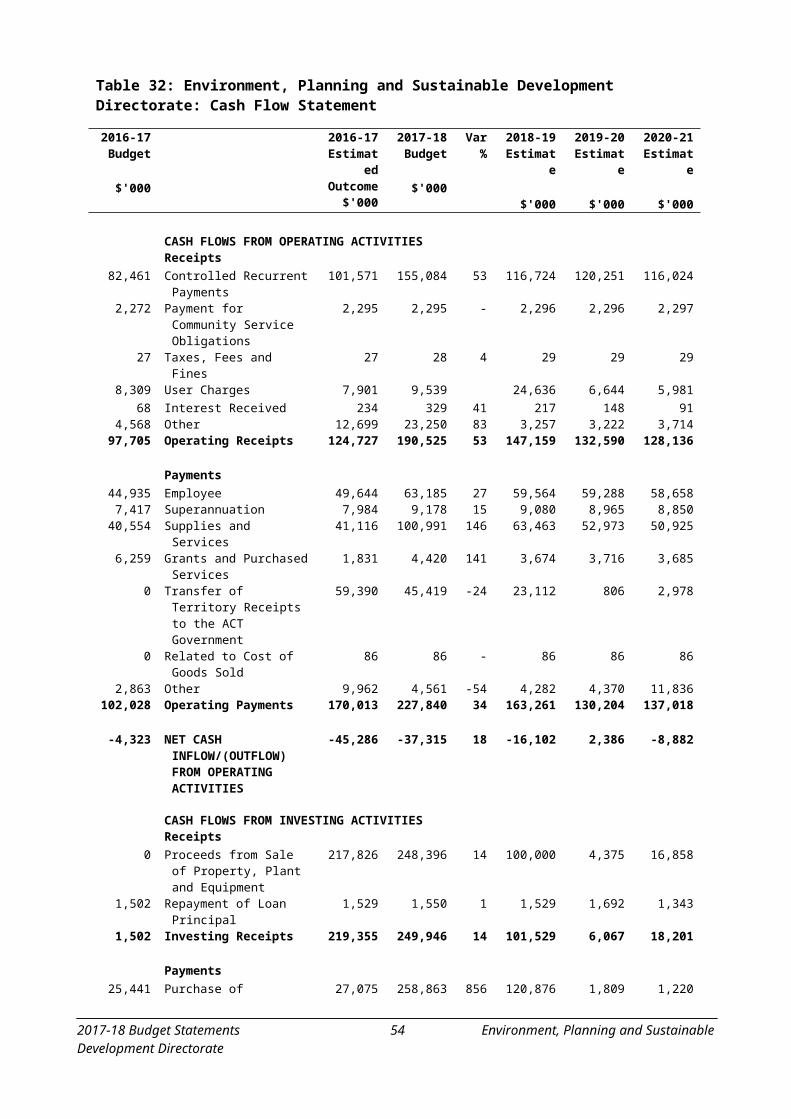
CITY RENEWAL AUTHORITY
This document is not intended to be a Statement of Intent. The Statement of Intent, including Strategies, Key Performance Indicators and Priorities, will be developed by the City Renewal Authority (CRA) Board in accordance with the Financial Management Act 1996 (FMA) and the City Renewal Authority and Suburban Land Agency Act 2017. The Authority will commence 1 July 2017 and the appointed Board will provide the Statement of Intent, once developed, to the Treasurer for tabling in the Legislative Assembly as soon as practicable in accordance with section 62 of the FMA.
PurposeThe City Renewal Authority (CRA) is a Territory Authority established under the City Renewal Authority and Suburban Land Agency Act 2017. The CRA is responsible for delivering the Government’s urban renewal agenda within the boundaries of any declared urban renewal precinct(s).
The objects of the CRA are to encourage and promote:
a vibrant city through the delivery of design led, people focussed urban renewal, including by creating opportunities:
- to include the community and relevant entities in the design and delivery of urban renewal;
- to grow and diversify the Territory’s economy; and
- for private sector investment in urban renewal.
social and environmental sustainability through:
- planning and delivery of urban renewal;
- improved urban infrastructure; and
- responsiveness to demographic change in the ACT.
The CRA must operate commercially in accordance with sound risk management practices.
In relation to an urban renewal precinct, the functions of the CRA are to:
2017-18 Budget Statements 52 City Renewal Authority
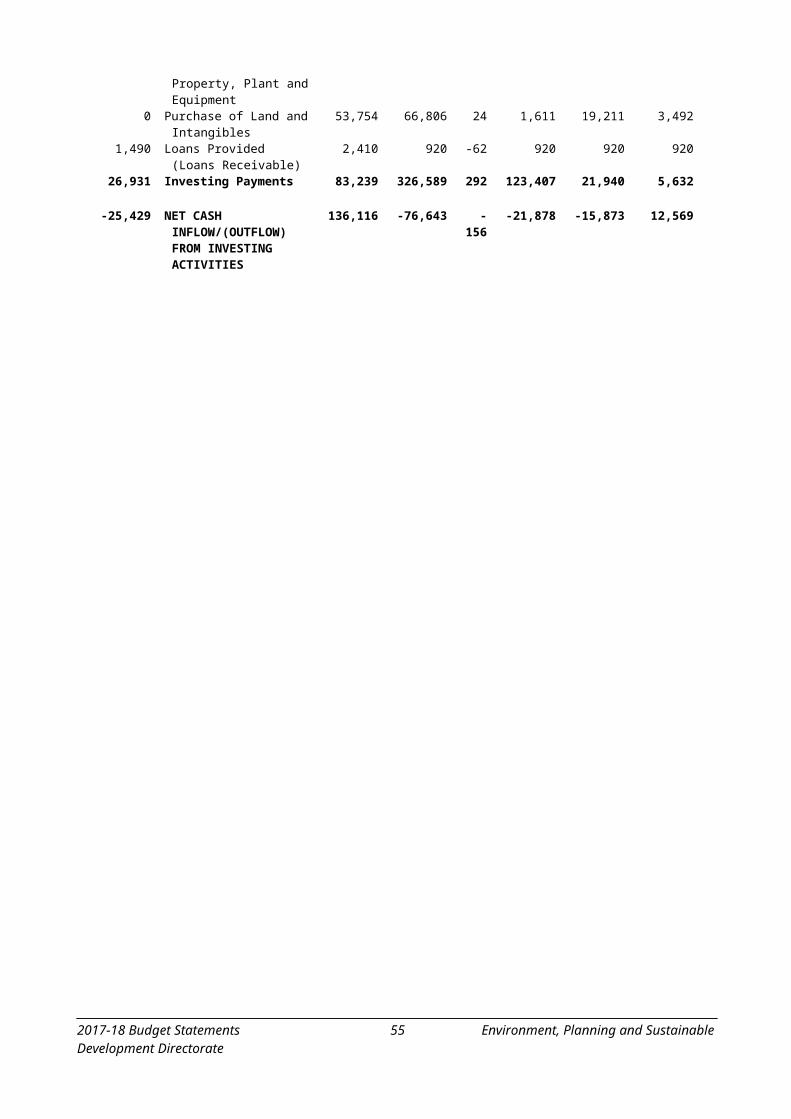
carry out urban renewal;
buy and sell leases of land on behalf of the Territory;
make arrangements for the public service or another entity to carry out development or works;
support public and private sector investment and participation in urban renewal, including by supporting development that is attractive to potential investors and participants;
manage orderly urban renewal, including holding, managing and selling land and other property;
support cooperation between the authority, the community, and relevant entities (for example, industry groups);
support high quality design, planning and delivery of sustainable urban renewal;
meet housing targets;
support statutory greenhouse gas emissions targets and deliver environmentally sustainable development; and
follow and support whole of government strategies.
2017-18 PrioritiesThe priorities for the CRA will be set out in the Statement of Intent to be issued by the CRA Board in accordance with the Financial Management Act 1996 and the City Renewal Authority and Suburban Land Agency Act 2017.
Estimated Employment Level
Table 1: Estimated Employment Level
2015-16Actual
Outcome
2016-17Budget
2016-17Estimated Outcome
2017-18Budget
Staffing (FTE) 0 0 0 20
2017-18 Budget Statements 53 City Renewal Authority
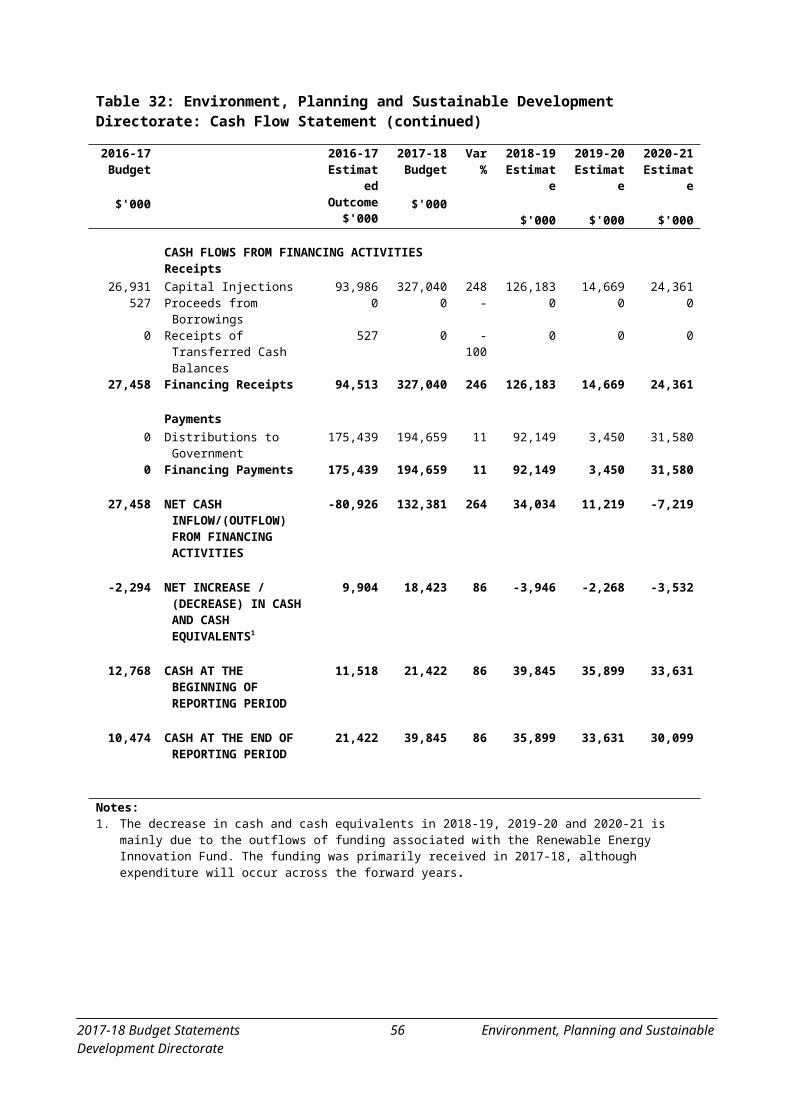
Changes to Appropriation
Table 2: Changes to appropriation – Controlled Recurrent Payments
2016-17 Estimated Outcome
$'000
2017-18 Budget
$'000
2018-19 Estimate
$'000
2019-20 Estimate
$'000
2020-21 Estimate
$'000
2016-17 Budget - - - - -
2017-18 Budget Policy AdjustmentsBuilding a better city – City Renewal Authority –
Initial works package- 400 - - -
2017-18 Budget Technical AdjustmentsTransfer – Functions from the LDA - 3,739 3,799 3,861 -Transfer – City Activation Unit from EPSDD - 525 535 545 553Transfer - Urban Renewal for Civic - Creating a
vibrant city centre from EPSDD- 94 - - -
2017-18 Budget - 4,758 4,334 4,406 553
Table 3: Changes to appropriation – Capital Injections
2016-17 Estimated Outcome
$'000
2017-18 Budget
$'000
2018-19 Estimate
$'000
2019-20 Estimate
$'000
2020-21 Estimate
$'000
2016-17 Budget - - - - -
2017-18 Budget Policy AdjustmentsBuilding a better city – City Renewal Authority – Initial works package
- 2,000 - - -
Building a better city – City Renewal Authority – City to the lake
- 7,500 15,000 14,888 -
2017-18 Budget - 9,500 15,000 14,888 -
2017-18 Budget Statements 54 City Renewal Authority
Financial Statements
Table 4: City Renewal Authority: Operating Statement
2016-17 Budget
$'000
2016-17 Estimated Outcome
$'000
2017-18 Budget
$'000
Var%
2018-19 Estimate
$'000
2019-20 Estimate
$'000
2020-21 Estimate
$'000
Income
Revenue0 Controlled Recurrent
Payments0 4,758 # 4,334 4,406 553
0 Land Revenue 0 432 # 5,643 8,190 60,1900 Resources Received Free of
Charge0 1,764 # 1,792 1,821 1,850
0 Total Revenue 0 6,954 # 11,769 14,417 62,593
Expenses 0 Employee Expenses 0 3,038 # 3,111 3,183 3,2570 Superannuation Expenses 0 389 # 401 413 4220 Supplies and Services 0 3,133 # 2,689 2,736 2,7360 Depreciation and
Amortisation0 0 - 9 9 569
0 Grants and Purchased Services
0 182 # 186 191 196
0 Cost of Goods Sold 0 250 # 3,386 4,729 33,1750 Borrowing Costs 0 0 - 0 0 8120 Other Expenses 0 0 - 0 0 636
0 Total Expenses 0 6,992 # 9,782 11,261 41,803
0 Operating Result from Ordinary Activities
0 -38 # 1,987 3,156 20,790
0 Income Tax Equivalent 0 -11 # 596 947 6,237
0 Operating Result 0 -27 # 1,391 2,209 14,553
0 Total Comprehensive Income
0 -27 # 1,391 2,209 14,553
2017-18 Budget Statements 55 City Renewal Authority
Table 5: City Renewal Authority: Balance Sheet
Budgetat
30/6/17 $'000
2016-17 Estimated Outcome
$'000
Budgetat
30/6/18 $'000
Var%
Estimateat
30/6/19 $'000
Estimateat
30/6/20 $'000
Estimateat
30/6/21 $'000
Current Assets0 Cash and Cash Equivalents 0 7,834 # 7,519 6 2340 Inventories 0 11,715 # 13,487 23,275 20,5230 Capital Works in Progress 0 9,500 # 22,500 37,388 0
0 Total Current Assets 0 29,049 # 43,506 602,669 20,757
Non Current Assets0 Inventories 0 5,966 # 5,966 5,966 5,9660 Property, Plant and
Equipment0 0 - 1,991 1,982 38,801
0 Total Non Current Assets 0 5,966 # 7,957 7,948 44,767
0 TOTAL ASSETS 0 35,015 # 51,463 68,617 65,524
Current Liabilities0 Employee Benefits 0 603 # 603 603 6030 Other Liabilities 0 188 # 1,636 3,902 809
0 Total Current Liabilities 0 791 # 2,239 4,505 1,412
Non Current Liabilities0 Employee Benefits 0 26 # 26 26 26
0 Total Non Current Liabilities 0 26 # 26 26 26
0 TOTAL LIABILITIES 0 817 # 2,265 4,531 1,438
0 NET ASSETS 0 34,198 # 49,198 64,086 64,086
REPRESENTED BY FUNDS EMPLOYED
0 Accumulated Funds 0 34,198 # 49,198 64,086 64,086
0 TOTAL FUNDS EMPLOYED 0 34,198 # 49,198 64,086 64,086
2017-18 Budget Statements 56 City Renewal Authority
Table 6: City Renewal Authority: Statement of Changes in Equity
Budgetat
30/6/17 $'000
2016-17 Estimated Outcome
$'000
Budgetat
30/6/18 $'000
Var%
Estimateat
30/6/19 $'000
Estimateat
30/6/20 $'000
Estimateat
30/6/21 $'000
Opening Equity
0 Opening Accumulated Funds 0 0 - 34,198 49,198 64,086
0 Balance at the Start of the Reporting Period
0 0 - 34,198 49,198 64,086
Comprehensive Income0 Operating Result - Including
Economic Flows0 -27 # 1,391 2,209 14,553
0 Total Comprehensive Income
0 -27 # 1,391 2,209 14,553
Transactions Involving Owners Affecting Accumulated Funds0 Capital Injections 0 9,500 # 15,000 14,888 00 Inc/Dec in Net Assets due to
Admin Restructure0 24,698 # 0 0 0
0 Dividend Approved 0 27 # -1,391 -2,209 -14,553
0 Total Transactions Involving Owners Affecting Accumulated Funds
0 34,225 # 13,609 12,679 -14,553
Closing Equity0 Closing Accumulated Funds 0 34,198 # 49,198 64,086 64,086
0 Balance at the end of the Reporting Period
0 34,198 # 49,198 64,086 64,086
2017-18 Budget Statements 57 City Renewal Authority
Table 7: City Renewal Authority: Cash Flow Statement
2016-17 Budget
$'000
2016-17 Estimated Outcome
$'000
2017-18 Budget
$'000
Var %
2018-19 Estimate
$'000
2019-20 Estimate
$'000
2020-21 Estimate
$'000
CASH FLOWS FROM OPERATING ACTIVITIESReceipts
0 Controlled Recurrent Payments
0 4,758 # 4,334 4,406 553
0 Land Sales 0 432 # 5,643 8,190 60,1900 Operating Receipts 0 5,190 # 9,977 12,596 60,743
Payments0 Employee 0 3,038 # 3,111 3,183 3,2570 Superannuation 0 389 # 401 413 4220 Supplies and Services 0 1,369 # 897 915 8860 Grants and Purchased
Services0 182 # 186 191 196
0 Borrowing Costs 0 0 - 0 0 8120 Income Tax Equivalent
Payments0 -11 # 596 943 6,231
0 Related to Cost of Goods Sold 0 1,479 # 5,158 14,518 30,4220 Other 0 0 - 0 0 6360 Operating Payments 0 6,446 # 10,349 20,163 42,862
0 NET CASH INFLOW/(OUTFLOW) FROM OPERATING ACTIVITIES
0 -1,256 # -372 -7,567 17,881
CASH FLOWS FROM INVESTING ACTIVITIESReceipts
Payments0 Purchase of Property, Plant
and Equipment0 9,500 # 15,000 14,888 0
0 Investing Payments 0 9,500 # 15,000 14,888 0
0 NET CASH INFLOW/(OUTFLOW) FROM INVESTING ACTIVITIES
0 -9,500 # -15,000 -14,888 0
2017-18 Budget Statements 58 City Renewal Authority

Table 7: City Renewal Authority: Cash Flow Statement (continued)
2016-17 Budget
$'000
2016-17 Estimated Outcome
$'000
2017-18 Budget
$'000
Var %
2018-19 Estimate
$'000
2019-20 Estimate
$'000
2020-21 Estimate
$'000
CASH FLOWS FROM FINANCING ACTIVITIESReceipts
0 Capital Injections 0 9,500 # 15,000 14,888 00 Receipts of Transferred Cash
Balances0 9,034 # 0 0 0
0 Financing Receipts 0 18,534 # 15,000 14,888 0
Payments0 Payment of Dividend 0 -56 # -57 -57 17,6470 Financing Payments 0 -56 # -57 -57 17,647
0 NET CASH INFLOW/(OUTFLOW) FROM FINANCING ACTIVITIES
0 18,590 # 15,057 14,945 -17,647
0 NET INCREASE / (DECREASE) IN CASH AND CASH EQUIVALENTS
0 7,834 # -315 -7,510 234
0 CASH AT THE BEGINNING OF REPORTING PERIOD
0 0 - 7,834 7,519 6
0 CASH AT THE END OF REPORTING PERIOD
0 7,834 # 7,519 6 234
2017-18 Budget Statements 59 City Renewal Authority
Notes to the Controlled Budget Statements
Explanatory notes to the Controlled Budget Statements explain variations between the 2016-17 estimated outcome to the 2016-17 and 2017-18 budgets. However, as the City Renewal Authority and Suburban Land Agency Act 2017 established the CRA effective 1 July 2017, notes are not provided due to the absence of 2016-17 budget and estimated outcome.
2017-18 Budget Statements 60 City Renewal Authority
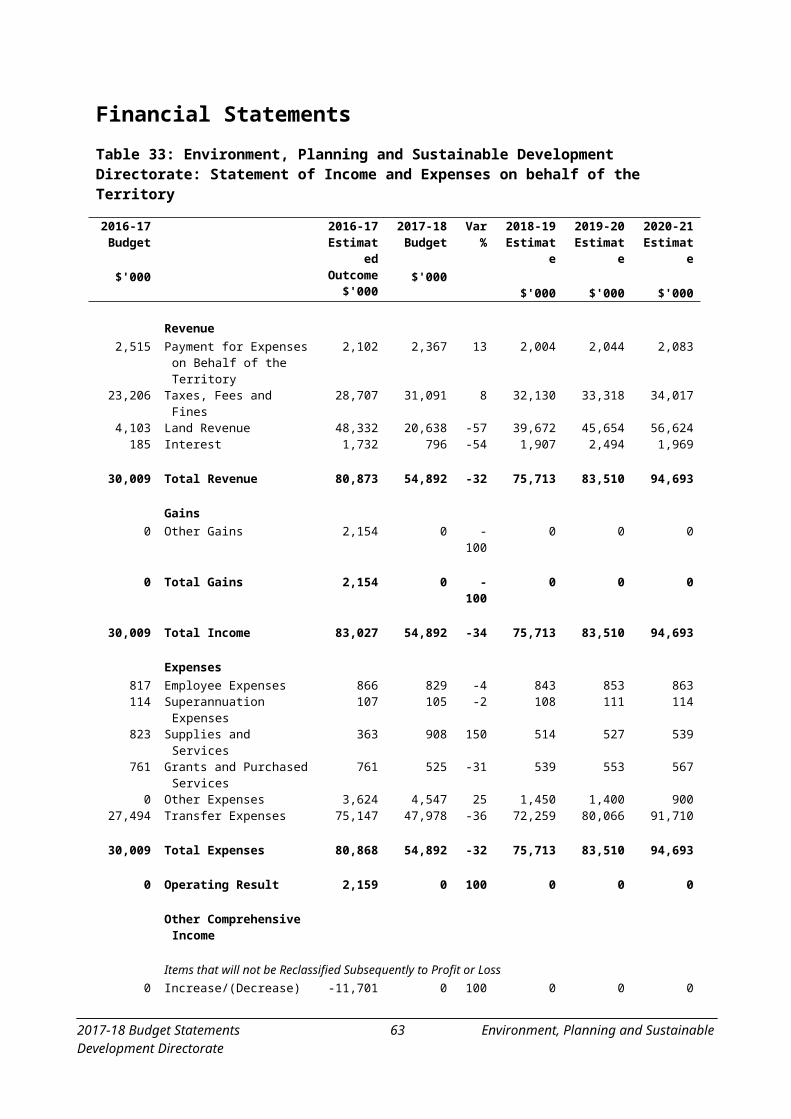
SUBURBAN LAND AGENCY
This document is not intended to be a Statement of Intent. The Statement of Intent, including Strategies, Key Performance Indicators and Priorities, will be developed by the Suburban Land Agency (SLA) Board in accordance with the Financial Management Act 1996 (FMA) and the City Renewal Authority and Suburban Land Agency Act 2017. The Authority will commence 1 July 2017 and the appointed Board will provide the Statement of Intent, once developed, to the Treasurer for tabling in the Legislative Assembly as soon as practicable in accordance with section 62 of the FMA.
PurposeThe Suburban Land Agency (SLA) is a Territory Authority established under the City Renewal Authority and Suburban Land Agency Act 2017.
The SLA is responsible for delivering the ACT Government’s suburban development program, including urban renewal in established town centres and suburbs.
The objects of the SLA are to encourage and promote inclusive communities through the delivery of people-focussed neighbourhoods. Importantly, this includes the delivery of suburban development which supports:
affordable housing;
a safe and healthy population;
social inclusion;
housing choice; and
environmental sustainability.
The SLA is responsible for encouraging and promoting urban renewal outside declared urban renewal precincts, growth and diversification of the Territory’s economy and social and environment sustainability. In exercising its functions, the SLA must also operate effectively, in a way that delivers value for money, in accordance with sound risk management practices.
The functions of the SLA are to:
buy and sell leases of land on behalf of the Territory;
ensure a mixture of public and private housing in new suburbs;
increase the supply of affordable and community housing;
meet housing targets;
carry out development of land in a manner that is environmentally sustainable; and
2017-18 Budget Statements 60 Suburban Land Agency
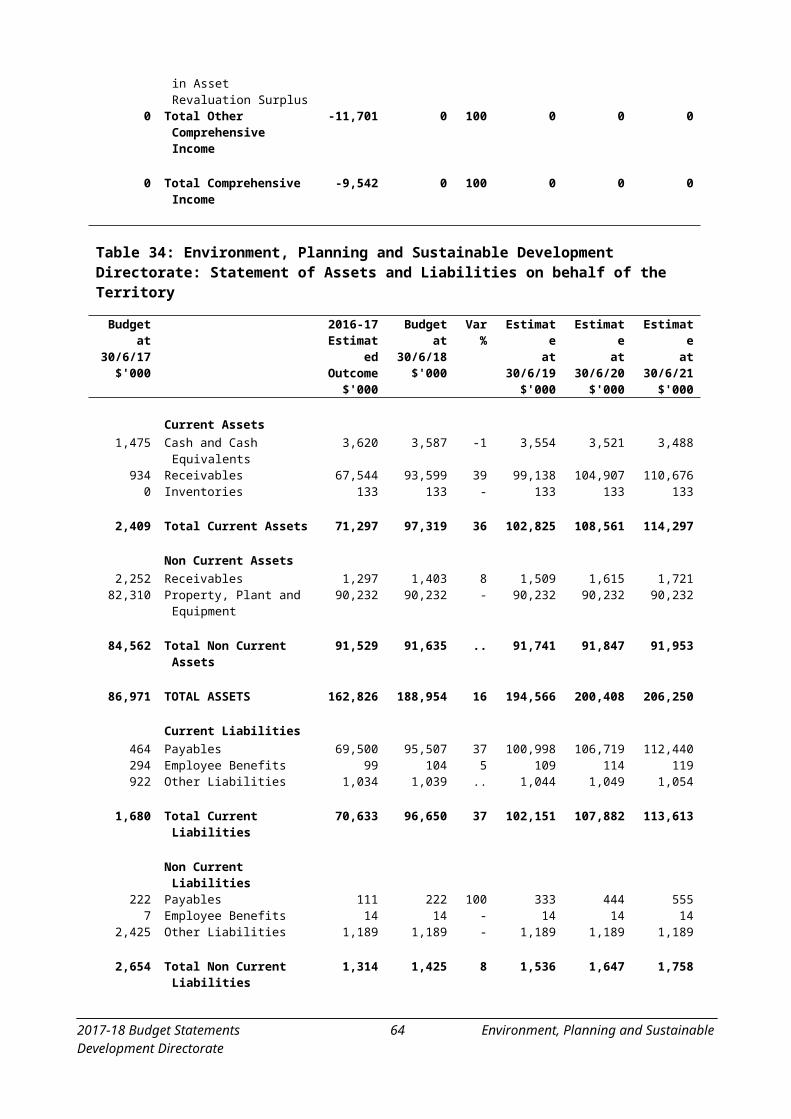
follow and support whole-of-government strategies.
Each of these functions must be exercised in a way that supports statutory greenhouse gas emissions targets and delivers environmentally sustainable development.
The SLA must work with any entity that has an interest in land that the agency intends to buy, sell, improve or develop to encourage cohesive suburban development.
2017-18 PrioritiesThe priorities for the SLA will be set out in the Statement of Intent to be issued by the SLA Board in accordance with the Financial Management Act 1996 and the City Renewal Authority and Suburban Land Agency Act 2017.
Estimated Employment Level
Table 1: Estimated Employment Level
2015-16Actual
Outcome
2016-17Budget
2016-17Estimated Outcome
2017-18Budget
Staffing (FTE) 0 0 0 77
2017-18 Budget Statements 61 Suburban Land Agency
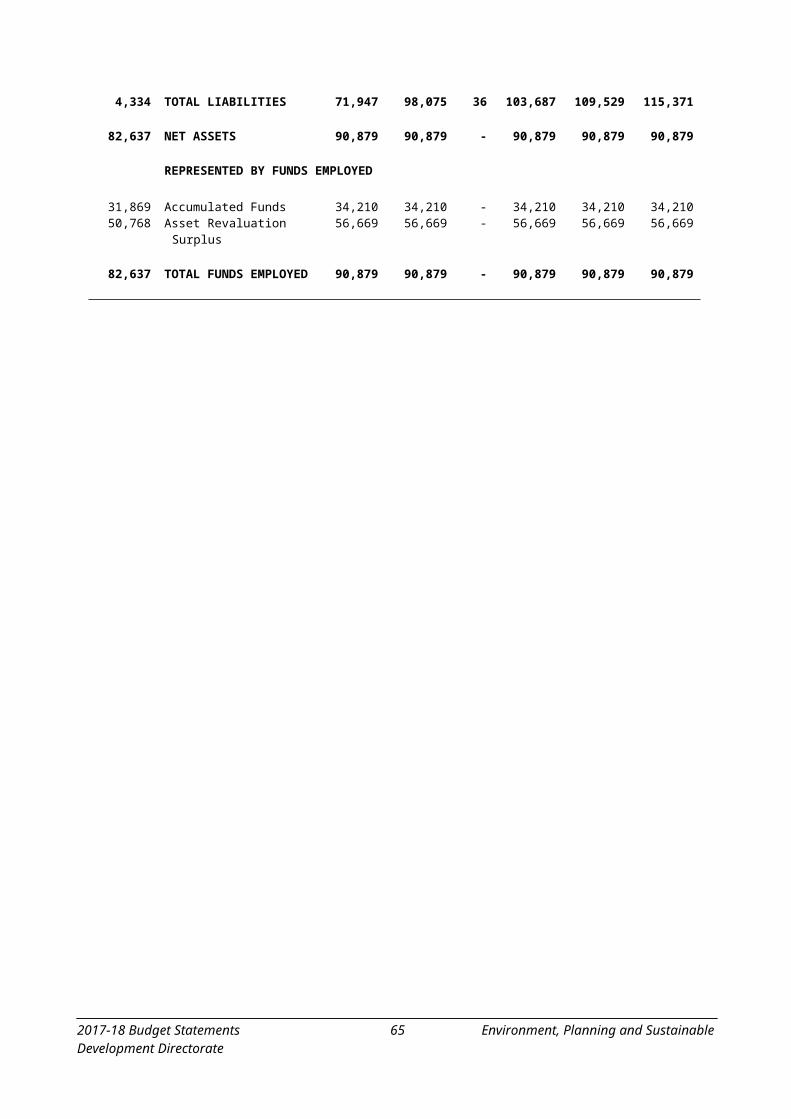
Financial Statements
Table 2: Suburban Land Agency: Operating Statement
2016-17 Budget
$'000
2016-17 Estimated Outcome
$'000
2017-18 Budget
$'000
Var%
2018-19 Estimate
$'000
2019-20 Estimate
$'000
2020-21 Estimate
$'000
Income
Revenue0 Land Revenue 0 575,832 # 574,533 520,786 517,4840 User Charges 0 392 # 402 412 4220 Interest 0 6,413 # 6,141 4,749 4,2170 Resources Received Free of
Charge0 9,120 # 8,626 8,765 8,906
0 Other Revenue 0 484 # 486 488 491
0 Total Revenue 0 592,241 # 590,188 535,200 531,520
Expenses 0 Employee Expenses 0 12,040 # 12,341 12,650 12,9660 Superannuation Expenses 0 1,534 # 1,572 1,611 1,6510 Supplies and Services 0 37,586 # 38,149 32,751 33,2460 Grants and Purchased
Services0 974 # 999 1,023 1,049
0 Cost of Goods Sold 0 156,513 # 163,467 259,622 281,9470 Borrowing Costs 0 611 # 1,722 2,309 9720 Other Expenses 0 40,657 # 138,343 1,808 761
0 Total Expenses 0 249,915 # 356,593 311,774 332,592
0 Share of Operating Profit from Joint Venture Accounted for using the Equity Method
0 4,222 # 19,723 12,919 12,772
0 Operating Result from Ordinary Activities
0 346,548 # 253,318 236,345 211,700
0 Income Tax Equivalent 0 103,964 # 75,995 70,904 63,510
0 Operating Result 0 242,584 # 177,323 165,441 148,190
0 Total Comprehensive Income
0 242,584 # 177,323 165,441 148,190
2017-18 Budget Statements 62 Suburban Land Agency
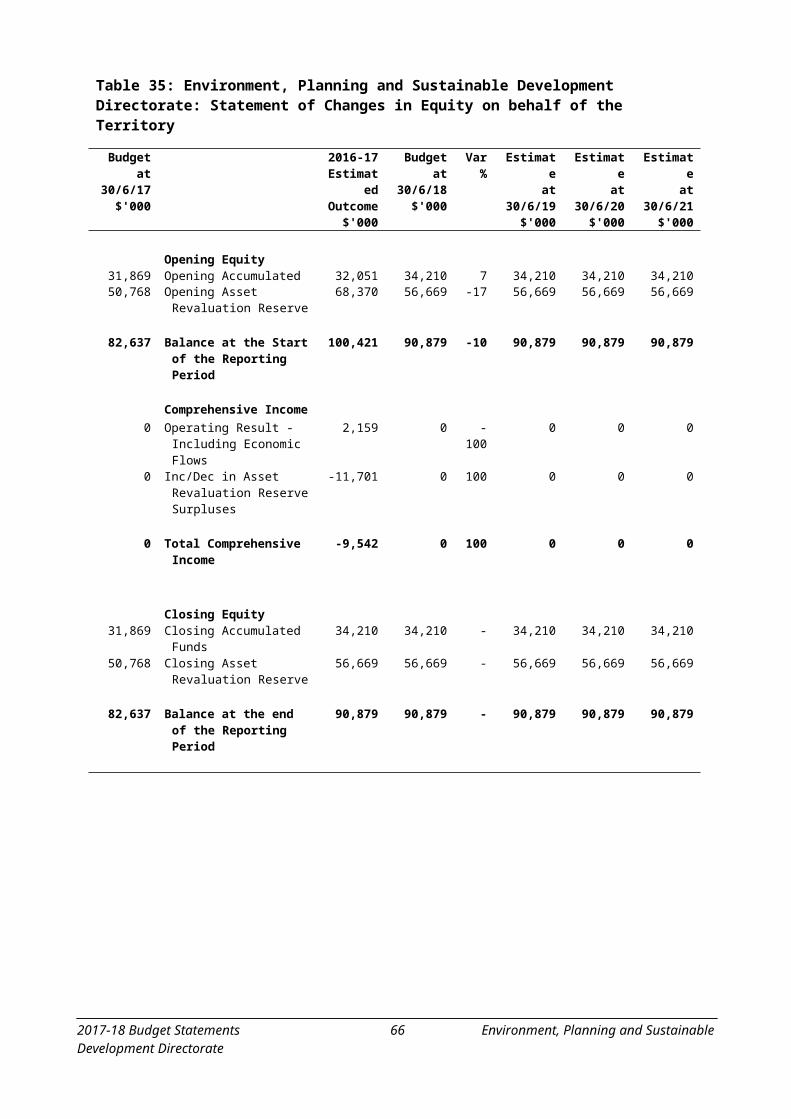
Table 3: Suburban Land Agency: Balance Sheet
Budgetat
30/6/17 $'000
2016-17 Estimated Outcome
$'000
Budgetat
30/6/18 $'000
Var%
Estimateat
30/6/19 $'000
Estimateat
30/6/20 $'000
Estimateat
30/6/21 $'000
Current Assets0 Cash and Cash Equivalents 0 199,859 # 133,952 63,526 87,8500 Receivables 0 10,879 # 10,879 10,879 10,8790 Inventories 0 267,536 # 389,579 413,228 285,983
0 Total Current Assets 0 478,274 # 534,410 487,633 384,712
Non Current Assets0 Receivables 0 19,685 # 19,685 19,685 19,6850 Investment - Joint Venture 0 47,193 # 42,005 39,861 51,1530 Inventories 0 46,844 # 46,844 46,844 46,8440 Property, Plant and
Equipment0 49,625 # 49,625 49,625 49,625
0 Intangible Assets 0 602 # 602 602 602
0 Total Non Current Assets 0 163,949 # 158,761 156,617 167,909
0 TOTAL ASSETS 0 642,223 # 693,171 644,250 552,621
Current Liabilities0 Payables 0 41,350 # 178,345 26,474 26,4740 Employee Benefits 0 2,523 # 2,523 2,523 2,5230 Other Provisions 0 83,561 # 83,561 83,561 83,5610 Income Tax Payable 0 31,027 # 22,587 21,273 19,0550 Other Liabilities 0 287,518 # 209,911 314,175 224,764
0 Total Current Liabilities 0 445,979 # 496,927 448,006 356,377
Non Current Liabilities0 Employee Benefits 0 115 # 115 115 1150 Other Provisions 0 69,004 # 69,004 69,004 69,0040 Deferred Tax Liability 0 27,717 # 27,717 27,717 27,717
0 Total Non Current Liabilities 0 96,836 # 96,836 96,836 96,836
0 TOTAL LIABILITIES 0 542,815 # 593,763 544,842 453,213
0 NET ASSETS 0 99,408 # 99,408 99,408 99,408
REPRESENTED BY FUNDS EMPLOYED
0 Accumulated Funds 0 102,770 # 102,770 102,770 102,7700 Asset Revaluation Surplus -3,362 # -3,362 -3,362 -3,362
0 TOTAL FUNDS EMPLOYED 0 99,408 # 99,408 99,408 99,408
2017-18 Budget Statements 63 Suburban Land Agency
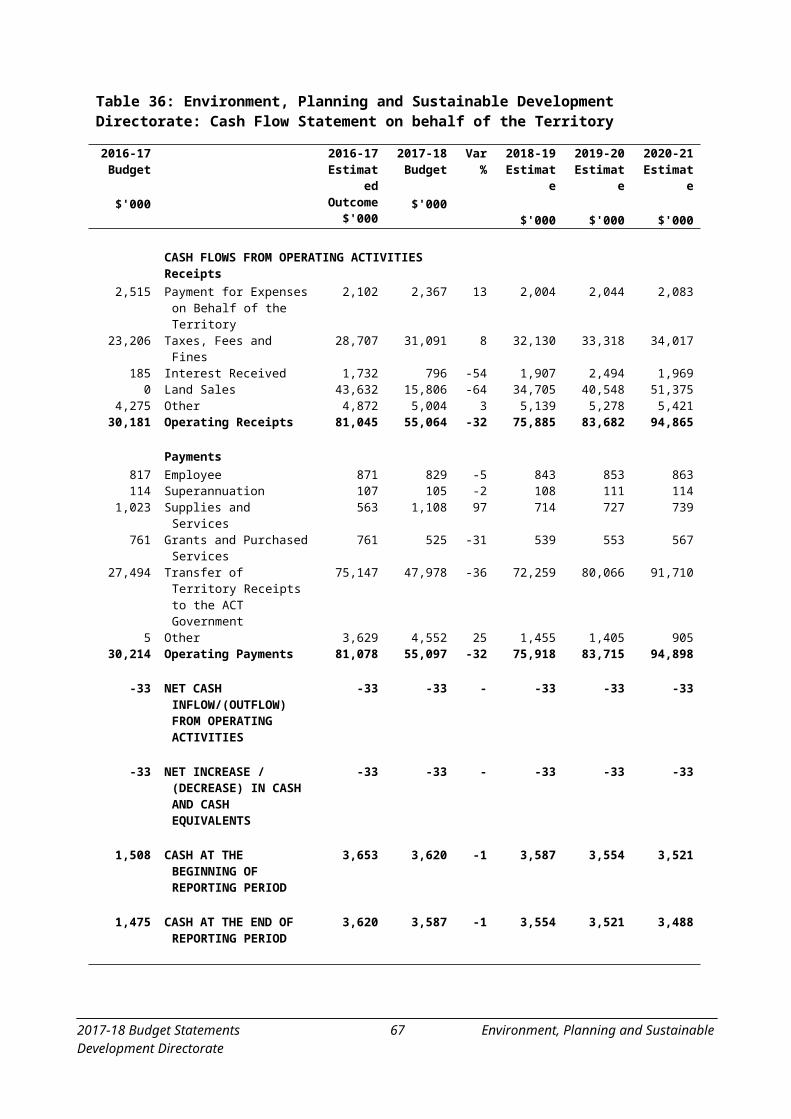
Table 4: Suburban Land Agency: Statement of Changes in Equity
Budgetat
30/6/17 $'000
2016-17 Estimated Outcome
$'000
Budgetat
30/6/18 $'000
Var%
Estimateat
30/6/19 $'000
Estimateat
30/6/20 $'000
Estimateat
30/6/21 $'000
Opening Equity
0 Opening Accumulated Funds 0 0 - 99,408 99,408 99,408
0 Balance at the Start of the Reporting Period
0 0 - 99,408 99,408 99,408
Comprehensive Income0 Operating Result - Including
Economic Flows0 242,584 # 177,323 165,441 148,190
0 Total Comprehensive Income
0 242,584 # 177,323 165,441 148,190
Transactions Involving Owners Affecting Accumulated Funds0 Capital Distributions to
Government0 -39,549 # -136,995 0 0
0 Inc/Dec in Net Assets due to Admin Restructure
0 138,957 # 136,995 0 0
0 Dividend Approved 0 -242,584 # -177,323 -165,441 -148,190
0 Total Transactions Involving Owners Affecting Accumulated Funds
0 -143,176 # -177,323 -165,441 -148,190
Closing Equity0 Closing Accumulated Funds 0 102,770 # 102,770 102,770 102,7700 Closing Asset Revaluation
reserve0 -3,362 # -3,362 -3,362 -3,362
0 Balance at the end of the Reporting Period
0 99,408 # 99,408 99,408 99,408
2017-18 Budget Statements 64 Suburban Land Agency
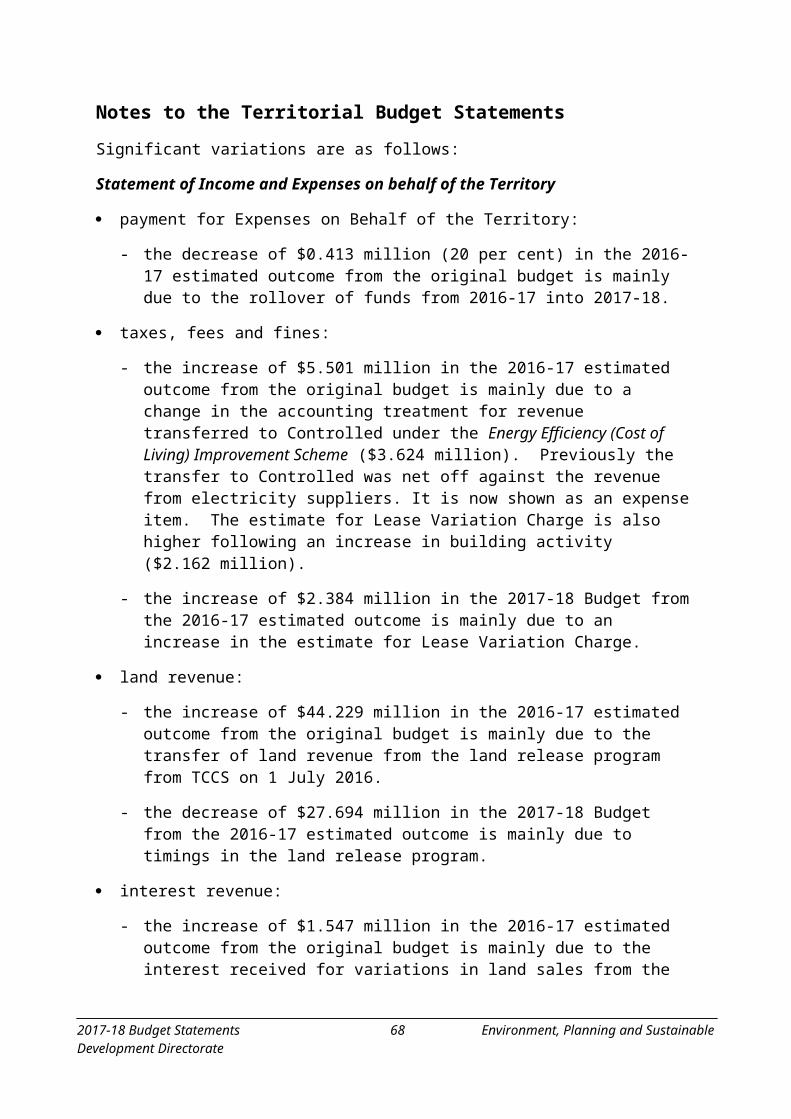
Table 5: Suburban Land Agency: Cash Flow Statement
2016-17 Budget
$'000
2016-17 Estimated Outcome
$'000
2017-18 Budget
$'000
Var %
2018-19 Estimate
$'000
2019-20 Estimate
$'000
2020-21 Estimate
$'000
CASH FLOWS FROM OPERATING ACTIVITIESReceipts
0 User Charges 0 431 # 442 453 4640 Interest Received 0 4,315 # 4,210 4,210 4,2100 Land Sales 0 585,949 # 557,914 512,493 517,4840 Other 0 39,423 # 52,356 31,569 24,5090 Operating Receipts 0 630,118 # 614,922 548,725 546,667
Payments0 Employee 0 12,040 # 12,341 12,650 12,9660 Superannuation 0 1,534 # 1,572 1,611 1,6510 Supplies and Services 0 29,096 # 29,522 23,986 24,3390 Grants and Purchased
Services0 974 # 999 1,023 1,049
0 Borrowing Costs 0 611 # 1,722 2,309 9720 Income Tax Equivalent
Payments0 103,647 # 84,435 72,218 65,728
0 Related to Cost of Goods Sold 0 187,450 # 281,710 283,271 154,7020 Other 0 39,456 # 53,259 32,633 24,8220 Operating Payments 0 374,808 # 465,560 429,701 286,229
0 NET CASH INFLOW/(OUTFLOW) FROM OPERATING ACTIVITIES
0 255,310 # 149,362 119,024 260,438
CASH FLOWS FROM INVESTING ACTIVITIESReceipts
0 Proceeds from Sale/Maturity of Investments
0 12,868 # 34,447 15,602 1,487
0 Investing Receipts 0 12,868 # 34,447 15,602 1,487
Payments0 Purchase of Land and
Intangibles0 20,000 # 0 0 0
0 Purchase of Investments 0 34,212 # 7,605 0 00 Investing Payments 0 54,212 # 7,605 0 0
0 NET CASH INFLOW/(OUTFLOW) FROM INVESTING ACTIVITIES
0 -41,344 # 26,842 15,602 1,487
2017-18 Budget Statements 65 Suburban Land Agency

Table 5: Suburban Land Agency: Cash Flow Statement (continued)
2016-17 Budget
$'000
2016-17 Estimated Outcome
$'000
2017-18 Budget
$'000
Var %
2018-19 Estimate
$'000
2019-20 Estimate
$'000
2020-21 Estimate
$'000
CASH FLOWS FROM FINANCING ACTIVITIESReceipts
0 Receipts of Transferred Cash Balances
0 203,210 # 0 0 0
0 Financing Receipts 0 203,210 # 0 0 0
Payments0 Distributions to Government 0 66,252 # 0 152,168 00 Payment of Dividend 0 151,065 # 242,111 52,884 237,6010 Financing Payments 0 217,317 # 242,111 205,052 237,601
0 NET CASH INFLOW/(OUTFLOW) FROM FINANCING ACTIVITIES
0 -14,107 # -242,111 -205,052 -237,601
0 NET INCREASE / (DECREASE) IN CASH AND CASH EQUIVALENTS
0 199,859 # -65,907 -70,426 24,324
0 CASH AT THE BEGINNING OF REPORTING PERIOD
0 0 - 199,859 133,952 63,526
0 CASH AT THE END OF REPORTING PERIOD
0 199,859 # 133,952 63,526 87,850
2017-18 Budget Statements 66 Suburban Land Agency
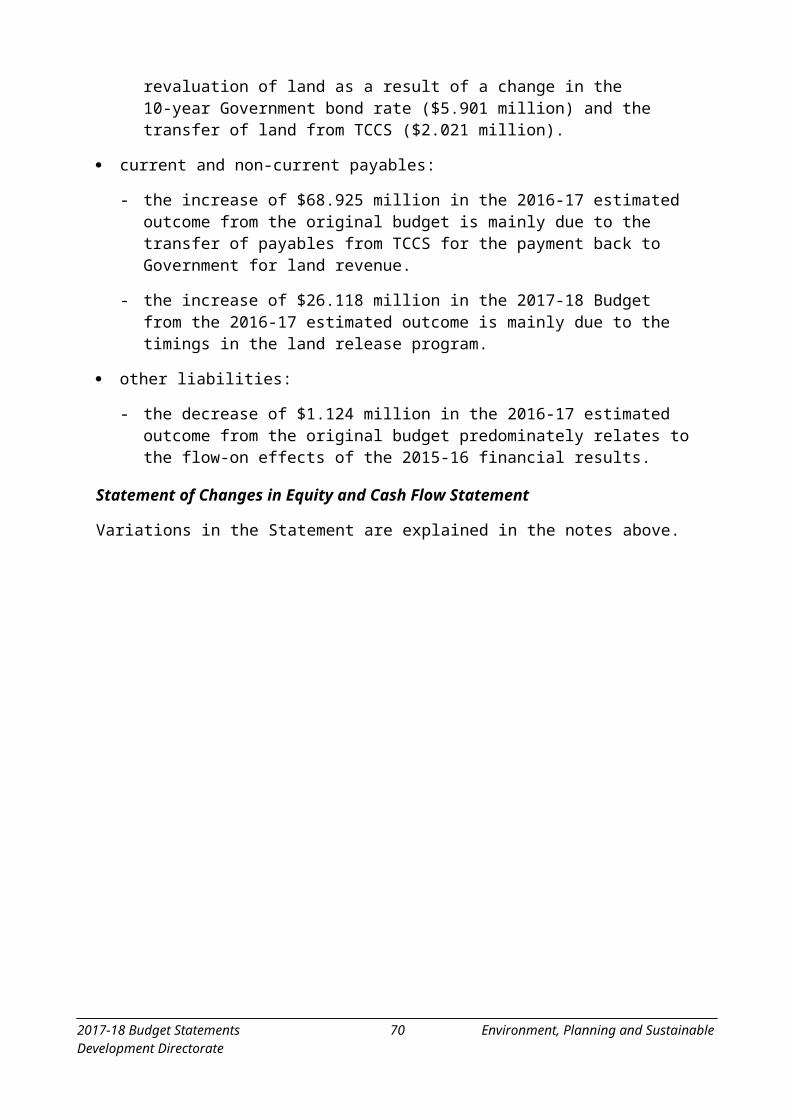
Notes to the Controlled Budget Statements
Explanatory notes to the Controlled Budget Statements explain variations between the 2016-17 estimated outcome to the 2016-17 and 2017-18 budgets. However, as the City Renewal Authority and Suburban Land Agency Act 2017 established the SLA effective 1 July 2017, notes are not provided due to the absence of 2016-17 budget and estimated outcome.
2017-18 Budget Statements 67 Suburban Land Agency