Embed Size (px)
DESCRIPTION
2013-14 Attainment. Peter Gorrie, QIO September 2014. Title. From CEC Assessment Framework, 2012. Trends Standards of Attainment over time. P4-P7 Maths Progress (10/11 to 13/14). - PowerPoint PPT Presentation
Citation preview

2013-14 Attainment Peter Gorrie, QIO
September 2014
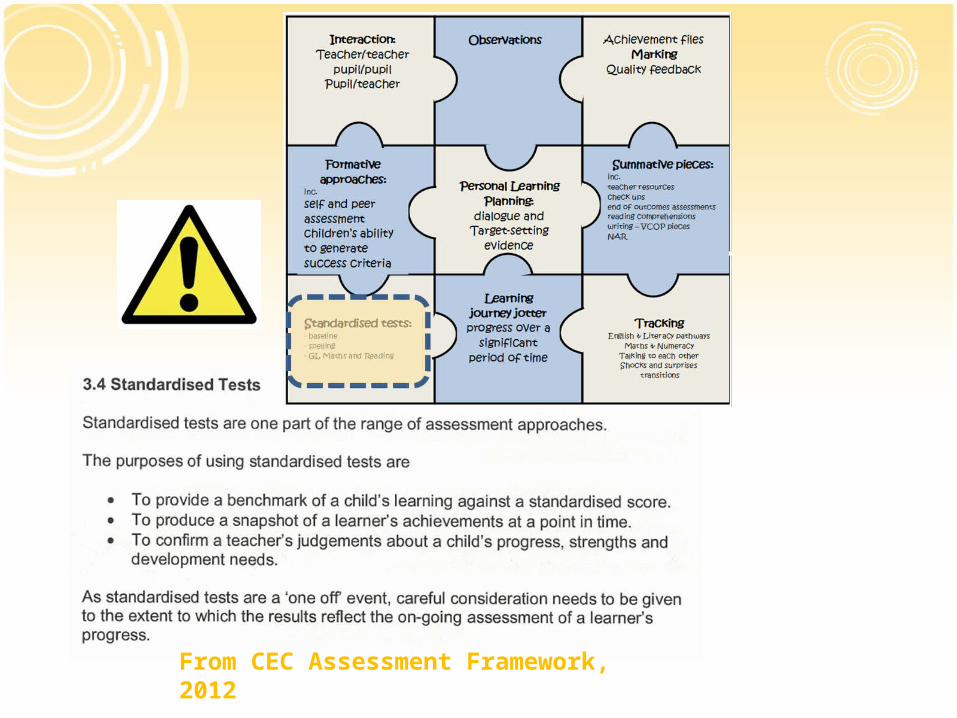
Title
From CEC Assessment Framework, 2012
Trends
Standards of Attainment over time
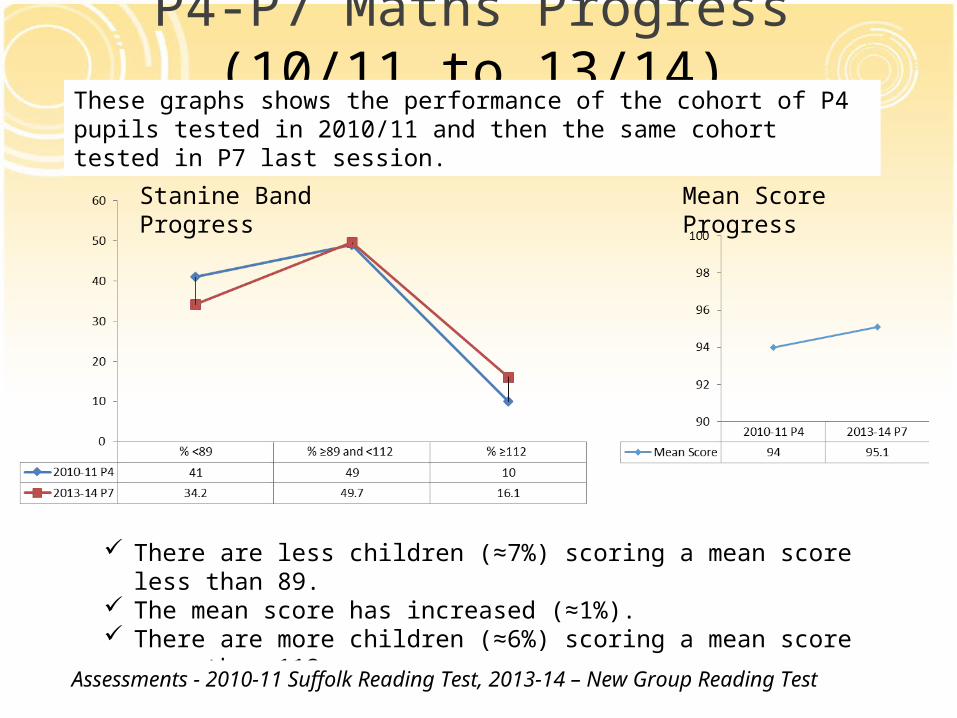
P4-P7 Maths Progress (10/11 to 13/14)
There are less children (≈7%) scoring a mean score less than 89. The mean score has increased (≈1%). There are more children (≈6%) scoring a mean score more than 112.
Stanine Band Progress Mean Score Progress
These graphs shows the performance of the cohort of P4 pupils tested in 2010/11 and then the same cohort tested in P7 last session.
Assessments - 2010-11 Suffolk Reading Test, 2013-14 – New Group Reading Test
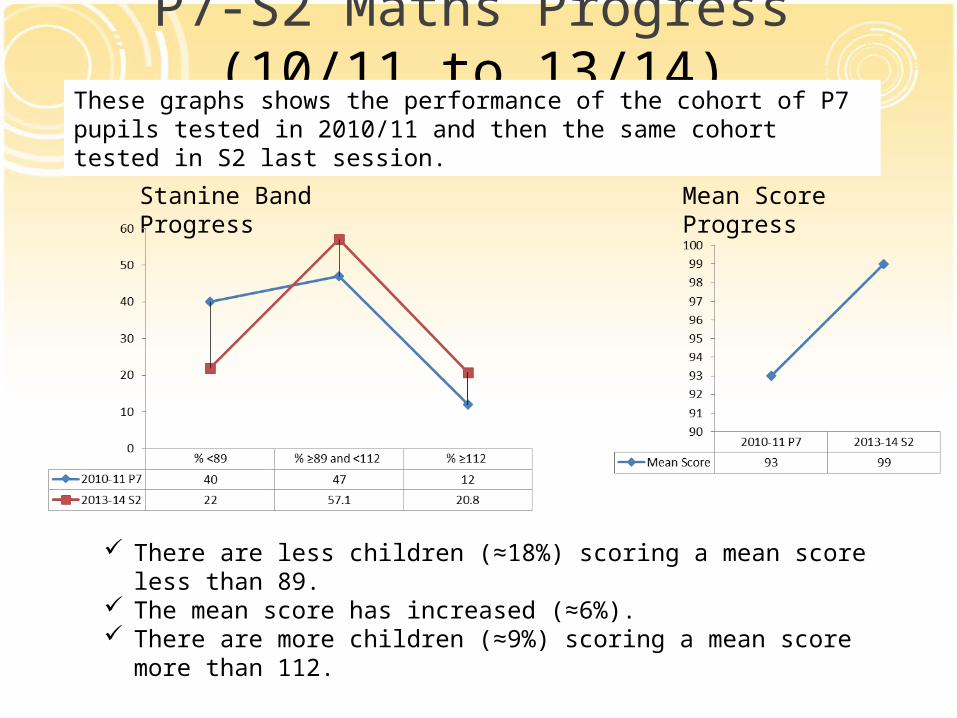
P7-S2 Maths Progress (10/11 to 13/14)
There are less children (≈18%) scoring a mean score less than 89. The mean score has increased (≈6%). There are more children (≈9%) scoring a mean score more than 112.
Stanine Band Progress Mean Score Progress
These graphs shows the performance of the cohort of P7 pupils tested in 2010/11 and then the same cohort tested in S2 last session.
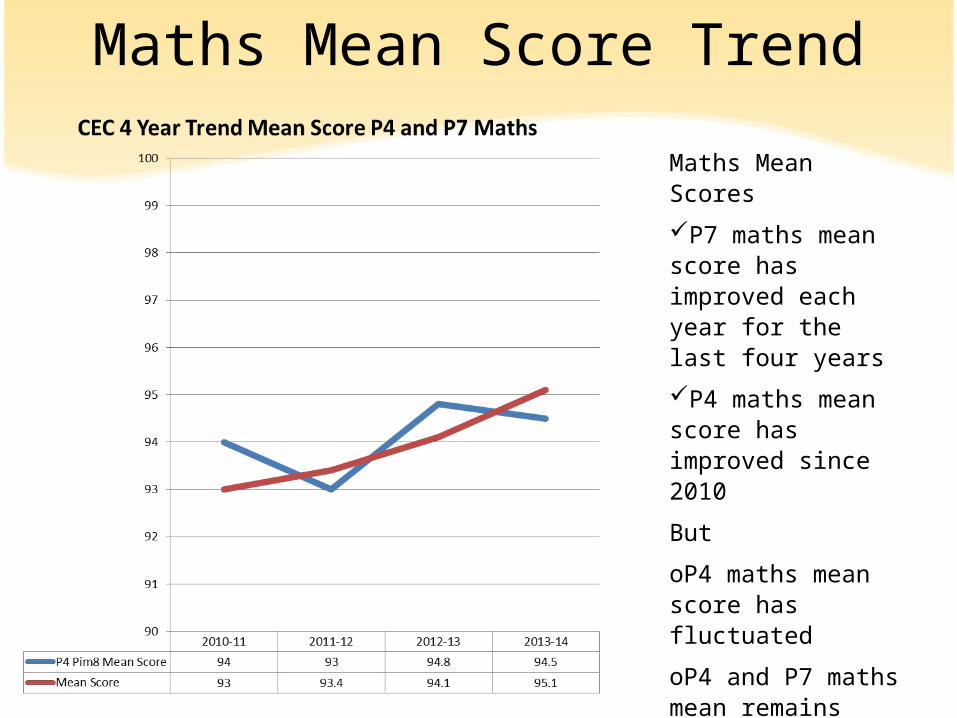
Maths Mean Scores
P7 maths mean score has improved each year for the last four years
P4 maths mean score has improved since 2010
But
oP4 maths mean score has fluctuated
oP4 and P7 maths mean remains below UK mean of 100.
Maths Mean Score Trend
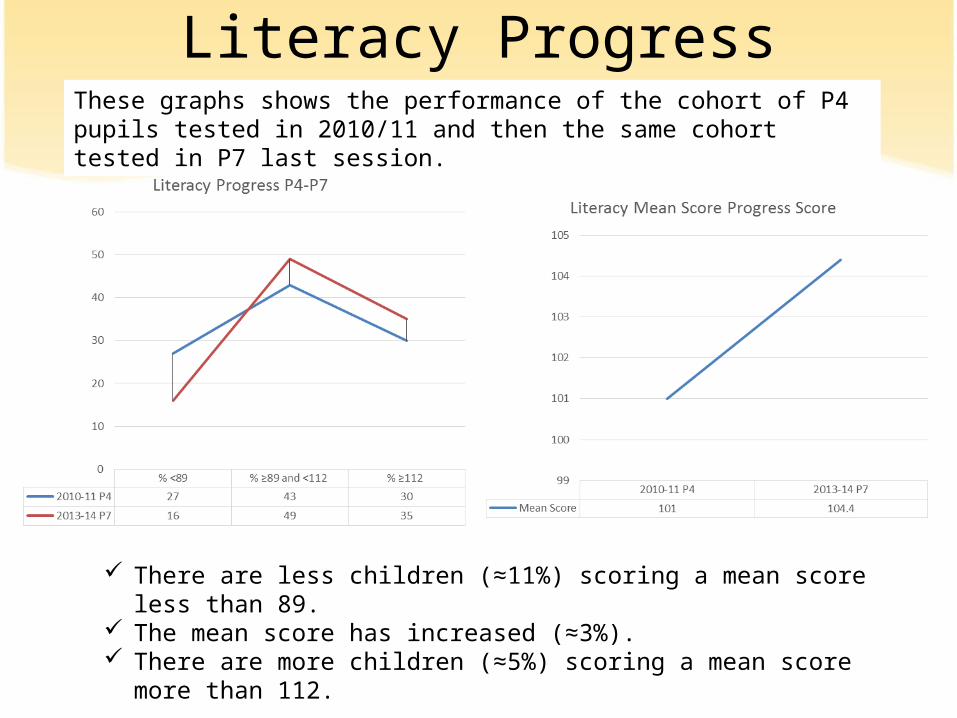
Literacy Progress
There are less children (≈11%) scoring a mean score less than 89. The mean score has increased (≈3%). There are more children (≈5%) scoring a mean score more than 112.
These graphs shows the performance of the cohort of P4 pupils tested in 2010/11 and then the same cohort tested in P7 last session.
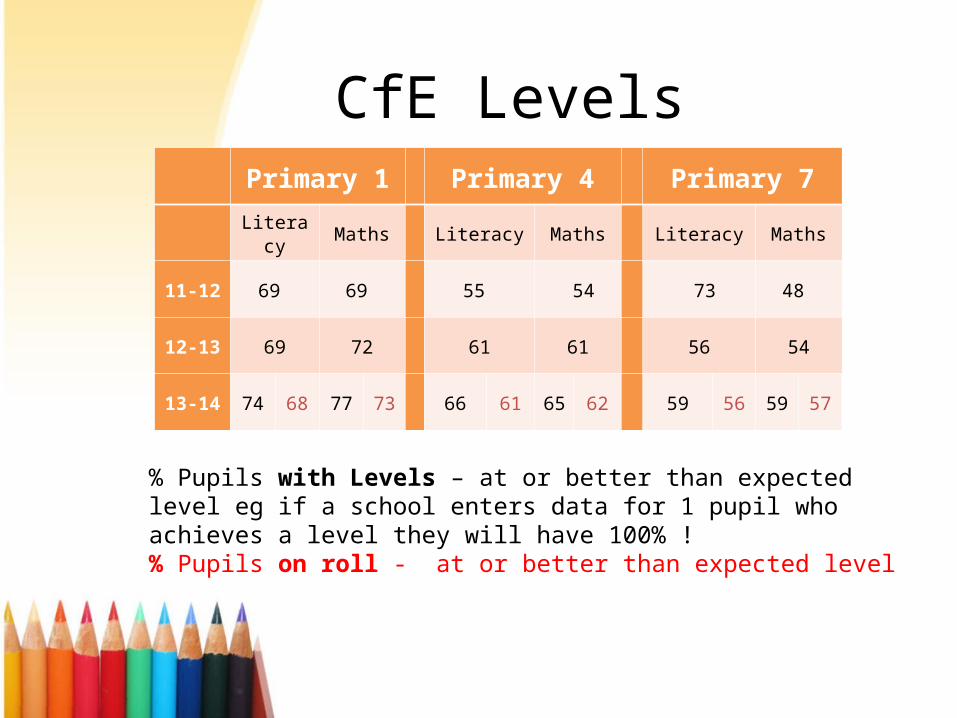
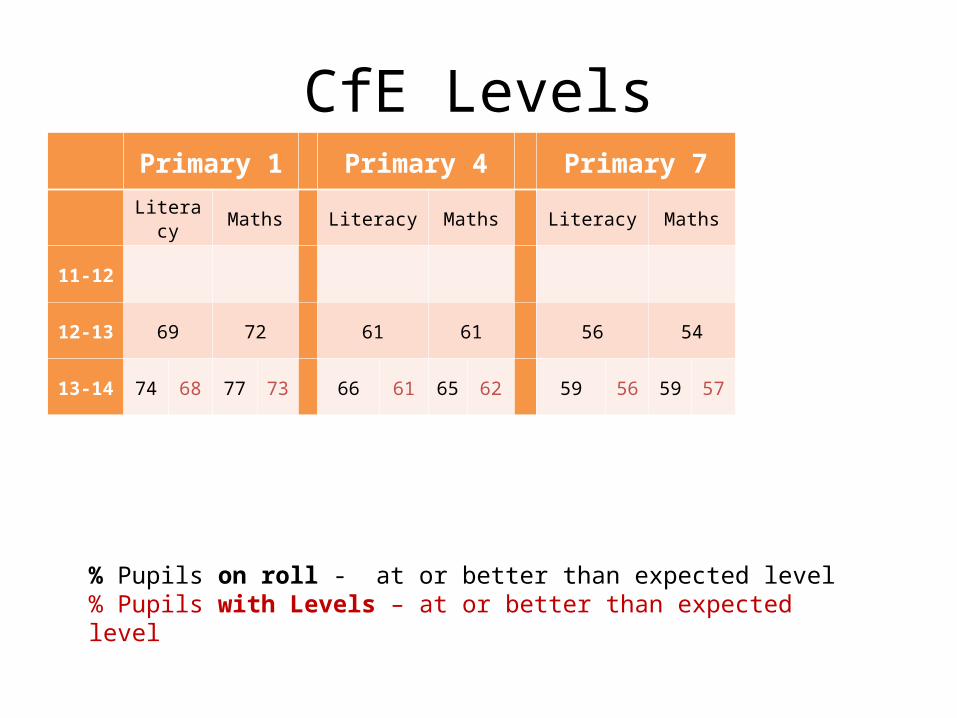
CfE LevelsPrimary 1 Primary 4 Primary 7
Literacy Maths Literacy Maths Literacy Maths
11-12 69 69 55 54 73 48
12-13 69 72 61 61 56 54
13-14 74 68 77 73 66 61 65 62 59 56 59 57
% Pupils with Levels – at or better than expected level eg if a school enters data for 1 pupil who achieves a level they will have 100% !% Pupils on roll - at or better than expected level

PERFORMANCE IN PRIMARY ONE
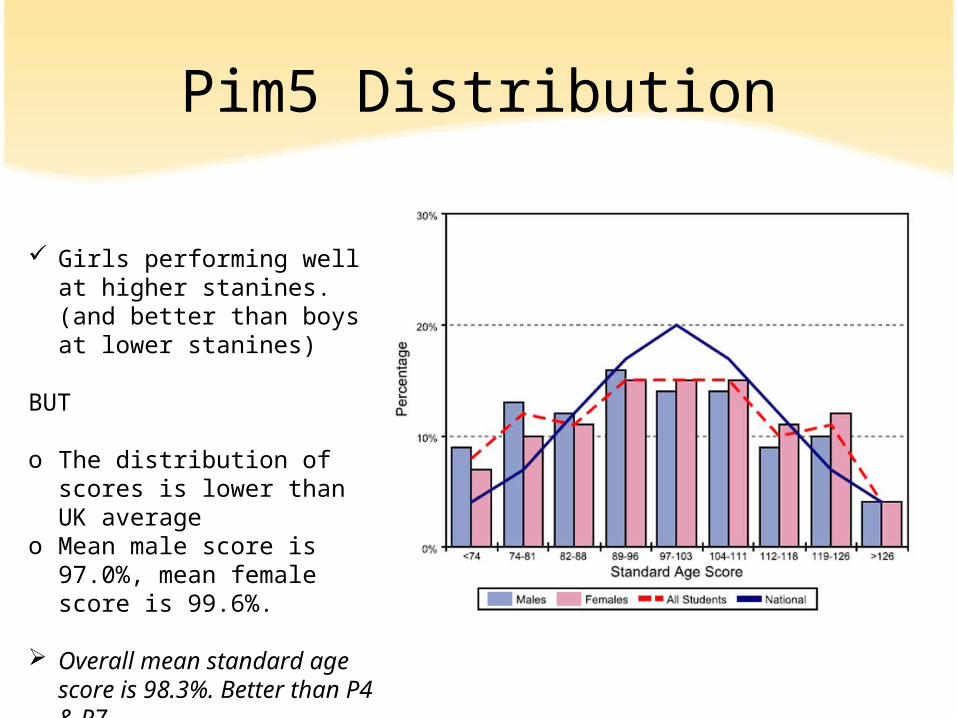
Pim5 Distribution
Girls performing well at higher stanines. (and better than boys at lower stanines)
BUT
o The distribution of scores is lower than UK average
o Mean male score is 97.0%, mean female score is 99.6%.
Overall mean standard age score is 98.3%. Better than P4 & P7.
P1 Pim5 2013-14
Content
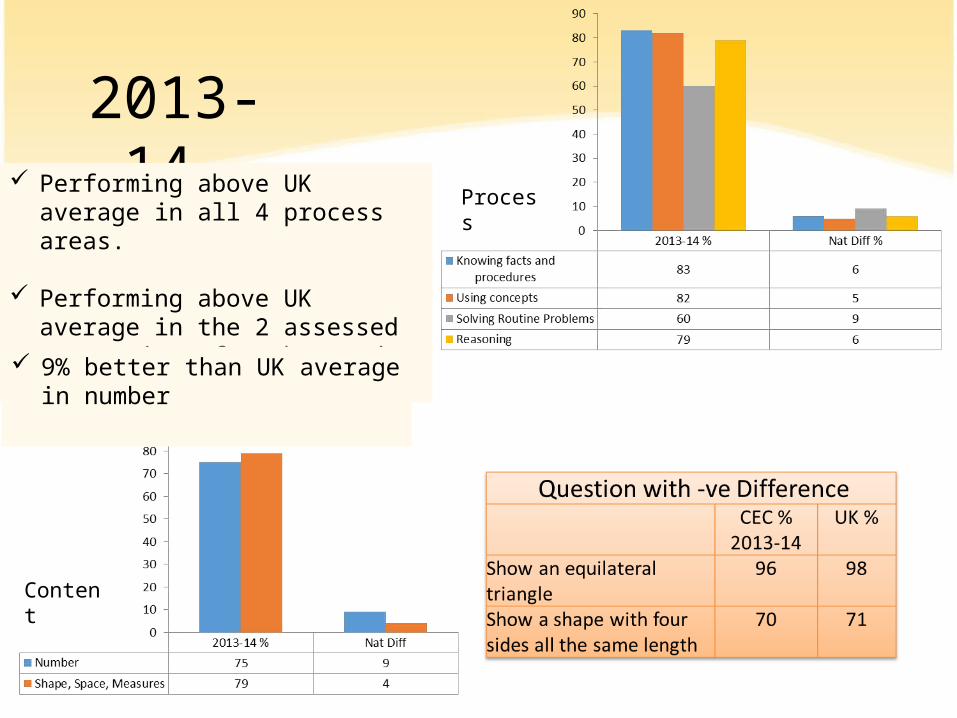
Process Performing above UK average in all
4 process areas.
Performing above UK average in the 2 assessed categories of number and shape.
9% better than UK average in number
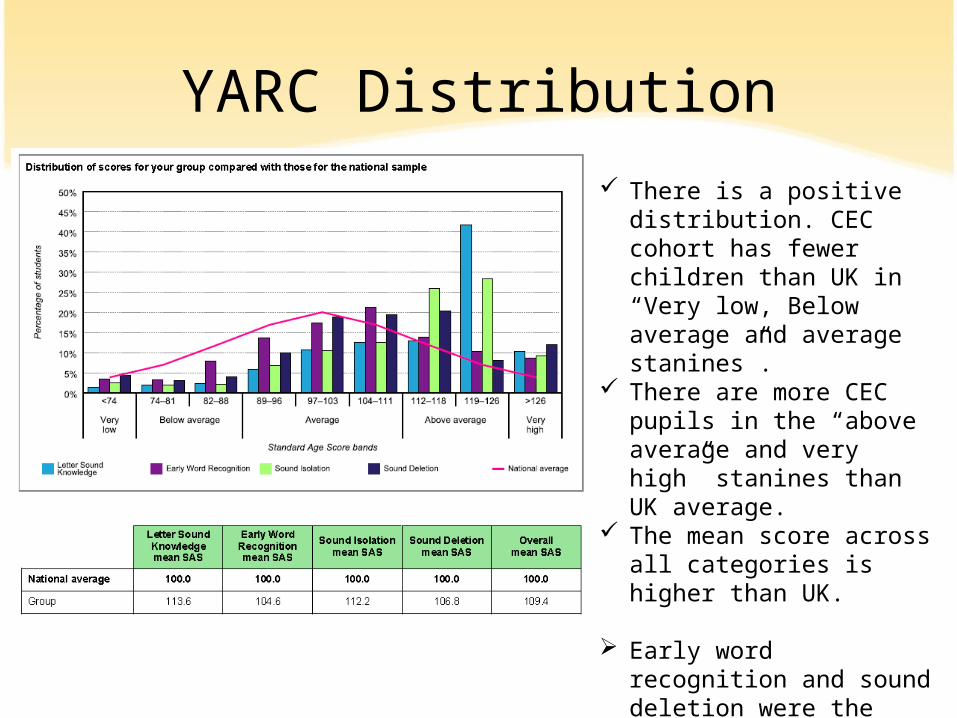
YARC Distribution There is a positive
distribution. CEC cohort has fewer children than UK in “Very low, Below average and average stanines”.
There are more CEC pupils in the “above average and very high” stanines than UK average.
The mean score across all categories is higher than UK.
Early word recognition and sound deletion were the aspects which performed least well.
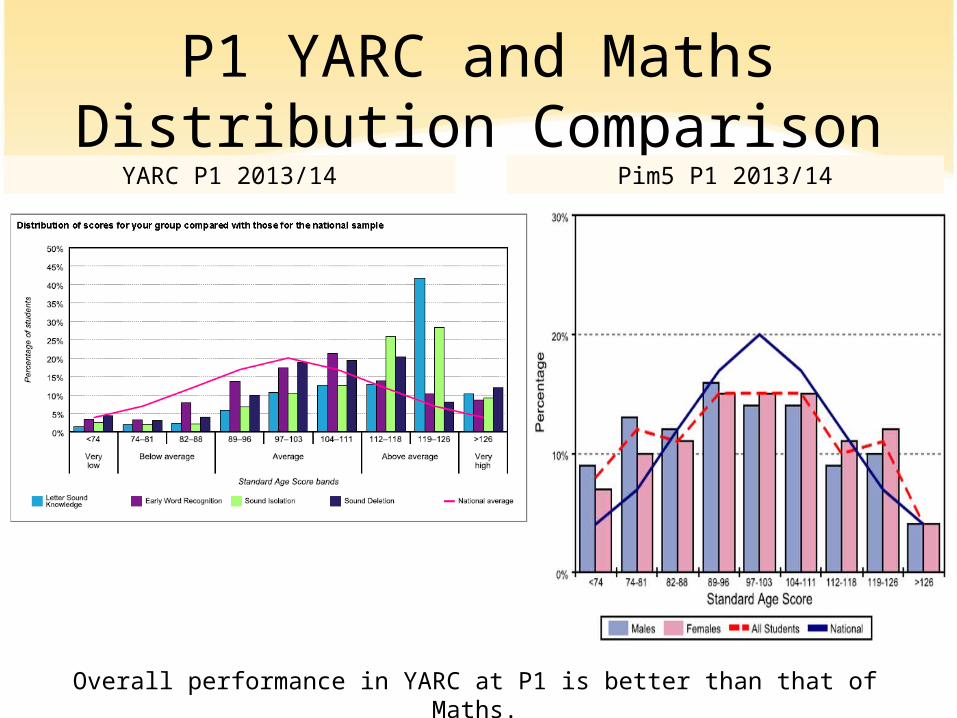
P1 YARC and Maths Distribution Comparison
YARC P1 2013/14 Pim5 P1 2013/14
Overall performance in YARC at P1 is better than that of Maths.

PERFORMANCE IN PRIMARY 4
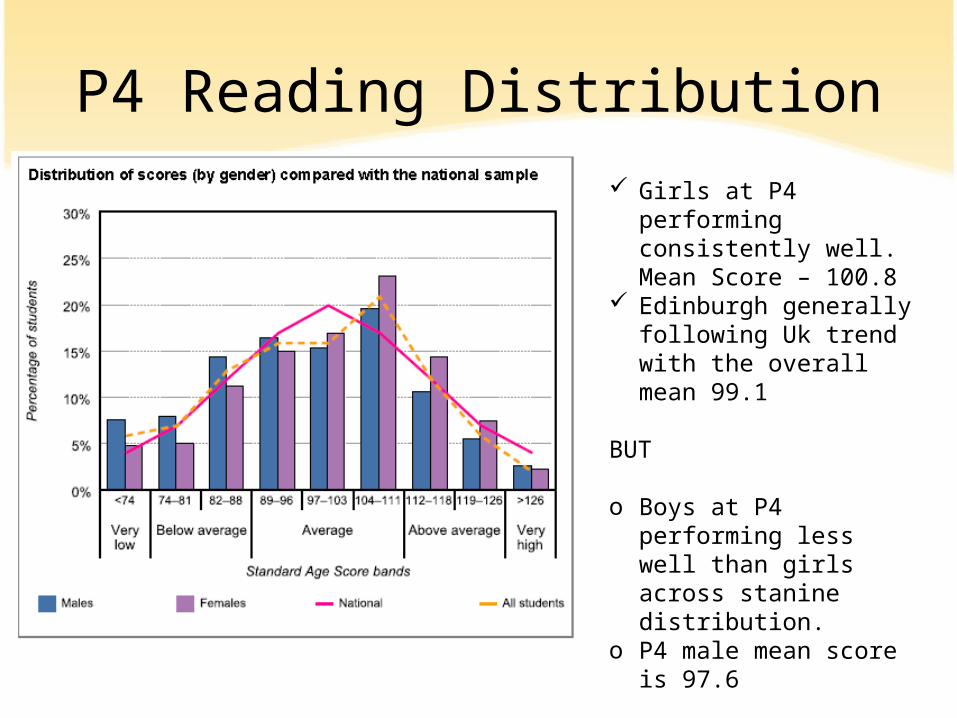
P4 Reading Distribution Girls at P4 performing
consistently well. Mean Score – 100.8
Edinburgh generally following Uk trend with the overall mean 99.1
BUT
o Boys at P4 performing less well than girls across stanine distribution.
o P4 male mean score is 97.6
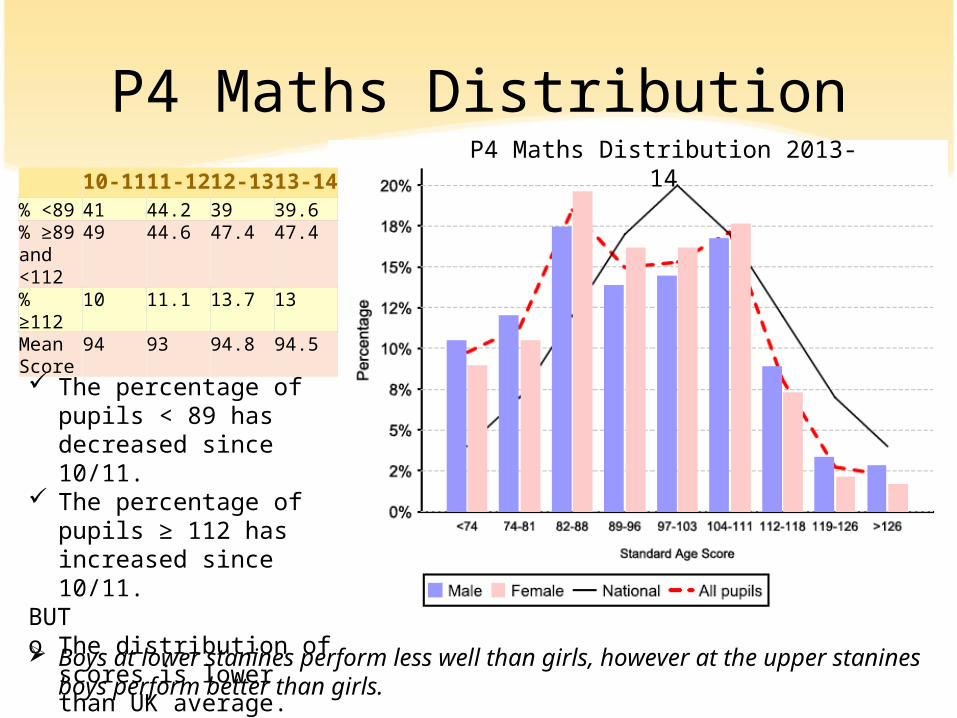
P4 Maths Distribution10-11 11-12 12-13 13-14
% <89 41 44.2 39 39.6% ≥89 and <112
49 44.6 47.4 47.4
% ≥112 10 11.1 13.7 13Mean Score
94 93 94.8 94.5
P4 Maths Distribution 2013-14
The percentage of pupils < 89 has decreased since 10/11.
The percentage of pupils ≥ 112 has increased since 10/11.
BUTo The distribution of scores
is lower than UK average.
Boys at lower stanines perform less well than girls, however at the upper stanines boys perform better than girls.
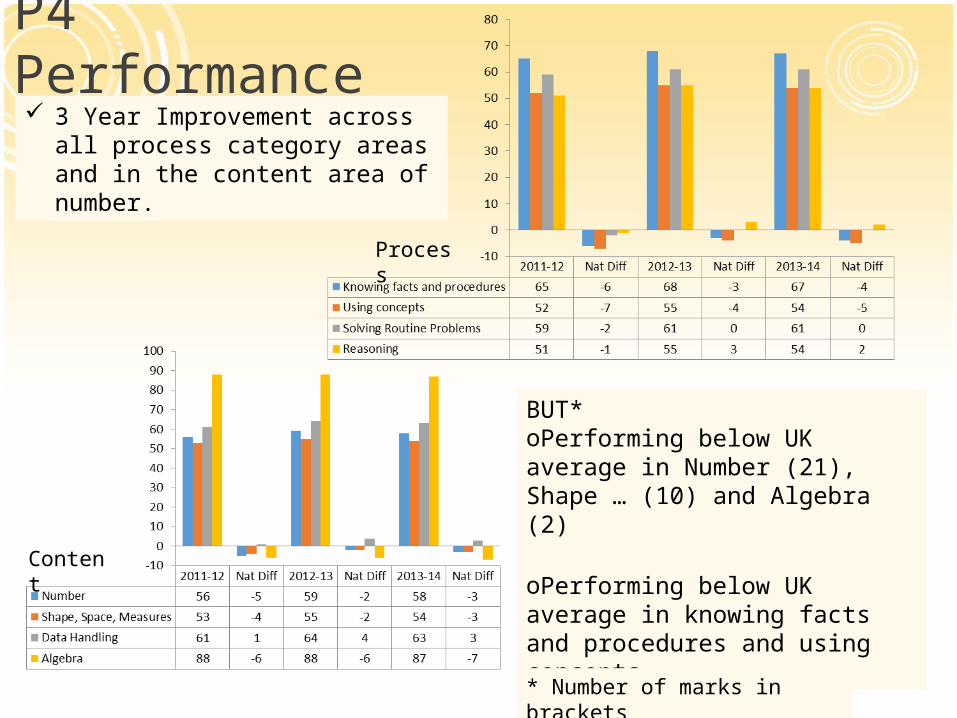
P4 Performance
Content
Process
3 Year Improvement across all process category areas and in the content area of number.
BUT*oPerforming below UK average in Number (21), Shape … (10) and Algebra (2)
oPerforming below UK average in knowing facts and procedures and using concepts
* Number of marks in brackets
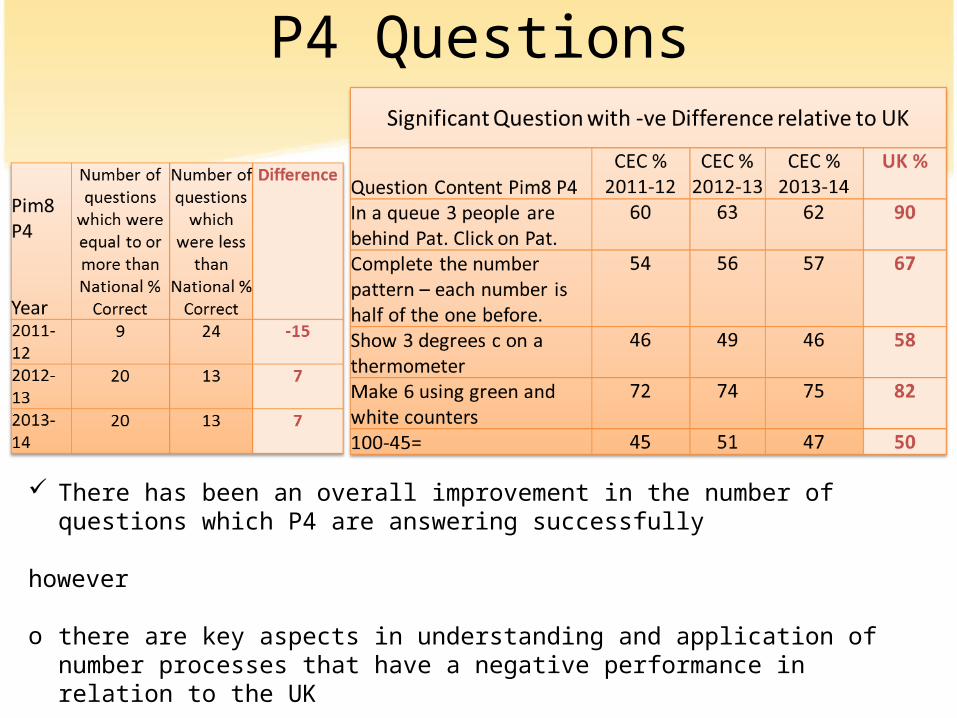
P4 Questions
There has been an overall improvement in the number of questions which P4 are answering successfully
however
o there are key aspects in understanding and application of number processes that have a negative performance in relation to the UK
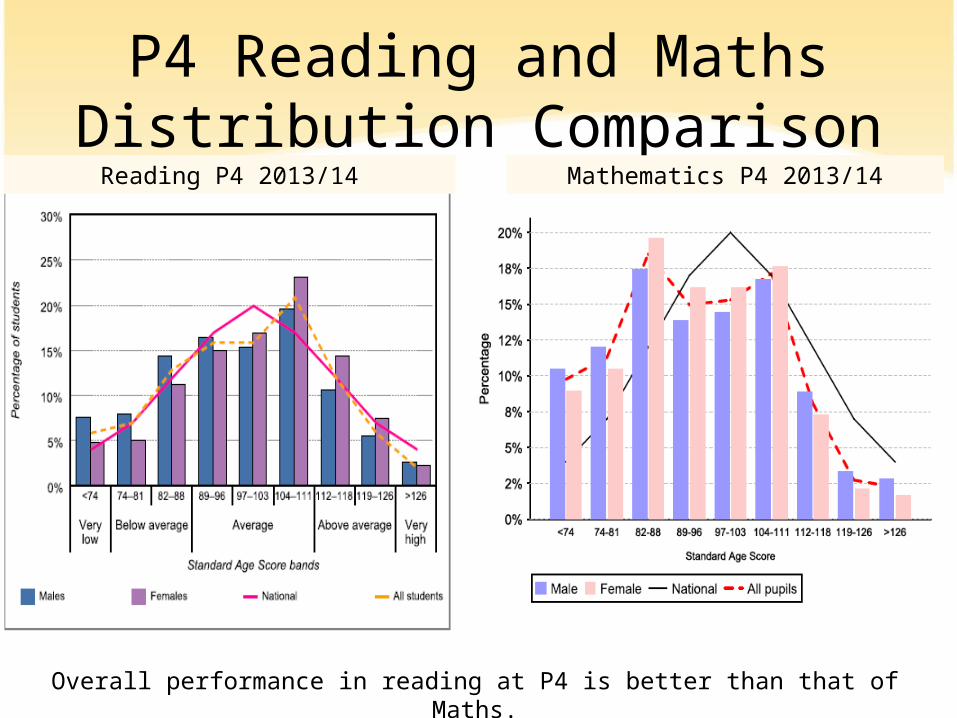
P4 Reading and Maths Distribution Comparison
Reading P4 2013/14 Mathematics P4 2013/14
Overall performance in reading at P4 is better than that of Maths.

PERFORMANCE IN PRIMARY 7
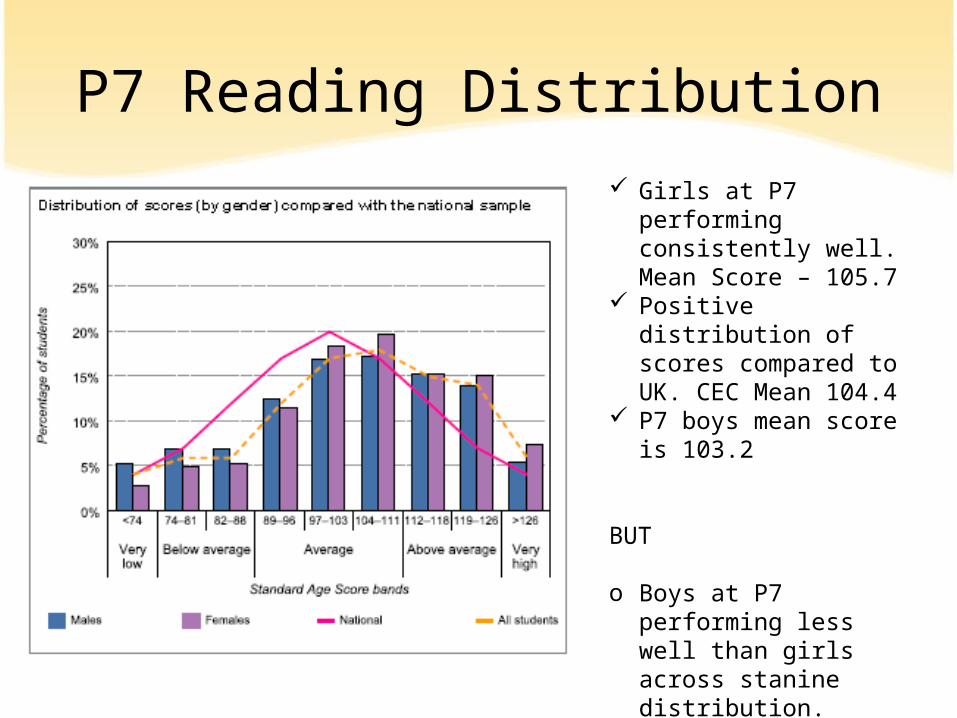
P7 Reading Distribution Girls at P7 performing
consistently well. Mean Score – 105.7
Positive distribution of scores compared to UK. CEC Mean 104.4
P7 boys mean score is 103.2
BUT
o Boys at P7 performing less well than girls across stanine distribution.
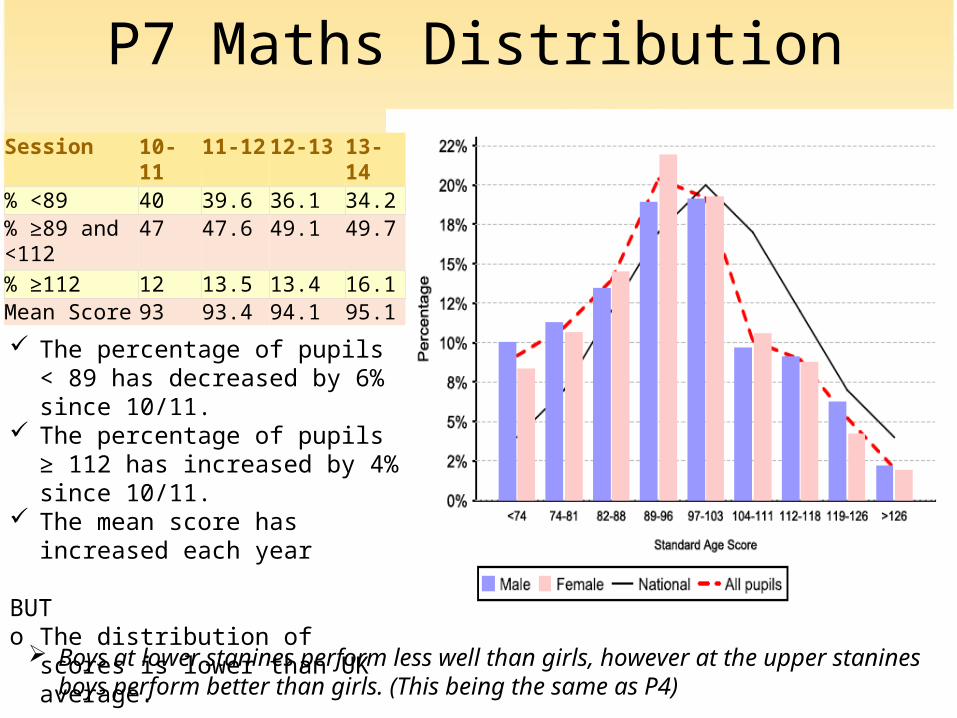
P7 Maths Distribution
Session 10-11
11-12
12-13 13-14
% <89 40 39.6 36.1 34.2% ≥89 and <112
47 47.6 49.1 49.7
% ≥112 12 13.5 13.4 16.1Mean Score 93 93.4 94.1 95.1
The percentage of pupils < 89 has decreased by 6% since 10/11.
The percentage of pupils ≥ 112 has increased by 4% since 10/11.
The mean score has increased each year
BUTo The distribution of scores is lower
than UK average.
Boys at lower stanines perform less well than girls, however at the upper stanines boys perform better than girls. (This being the same as P4)
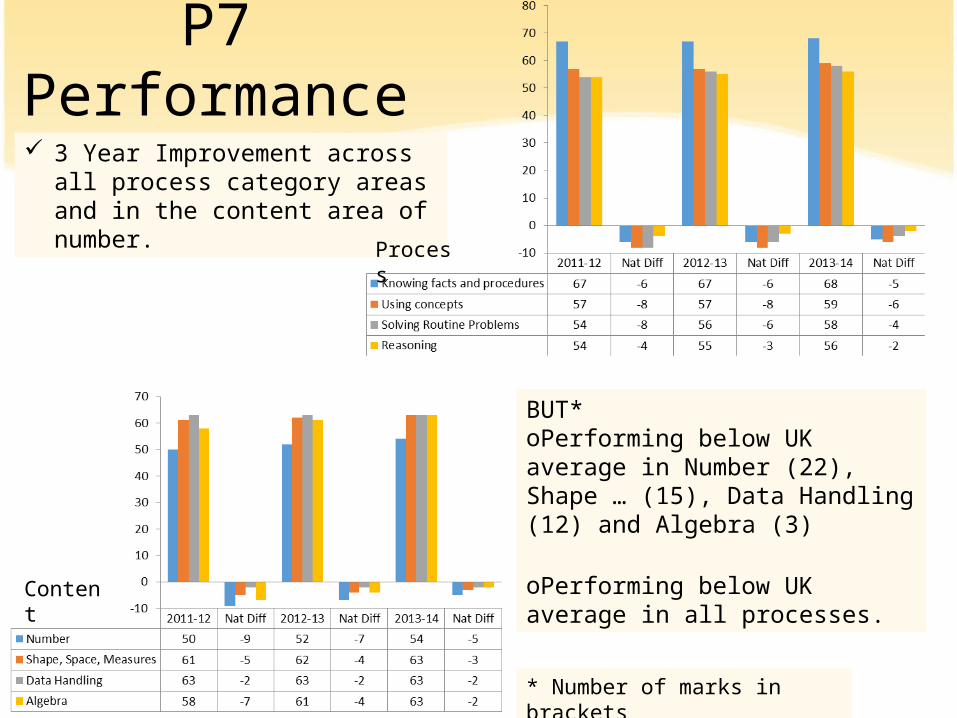
P7 Performance 3 Year Improvement across all
process category areas and in the content area of number.
Content
Process
BUT*oPerforming below UK average in Number (22), Shape … (15), Data Handling (12) and Algebra (3)
oPerforming below UK average in all processes.
* Number of marks in brackets
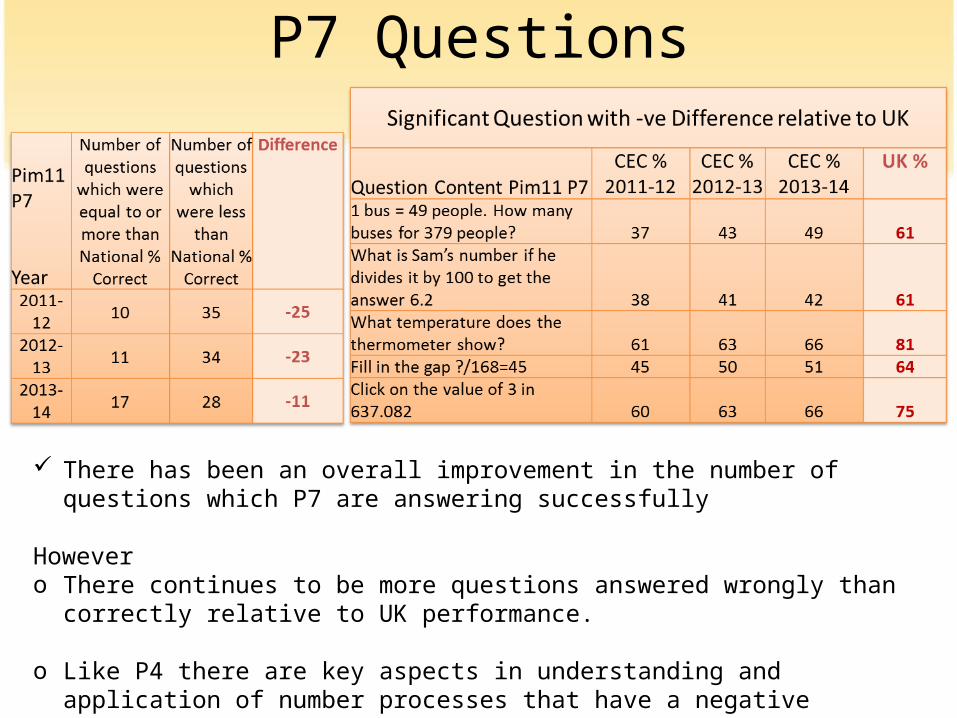
P7 Questions
There has been an overall improvement in the number of questions which P7 are answering successfully
Howevero There continues to be more questions answered wrongly than correctly relative to
UK performance.
o Like P4 there are key aspects in understanding and application of number processes that have a negative performance in relation to the UK
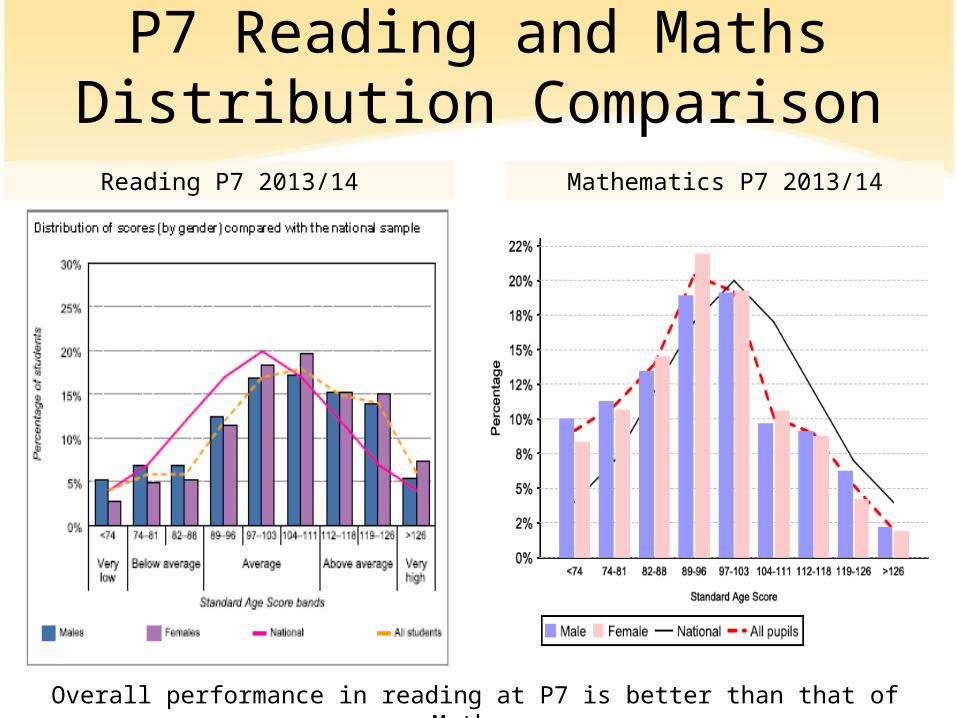
P7 Reading and Maths Distribution Comparison
Reading P7 2013/14 Mathematics P7 2013/14
Overall performance in reading at P7 is better than that of Maths.


Mathematics PiM11
What are the features of effective learning and teaching in mathematics?•planned active learning which provides opportunities to observe, explore, investigate, experiment, play, discuss and reflect •modelling and scaffolding the development of mathematical thinking skills •learning collaboratively and independently •opportunities for discussion, communication and explanation of thinking •developing mental agility •using relevant contexts and experiences, familiar to young people •making links across the curriculum to show how mathematical concepts are applied in a wide range •of contexts, such as those provided by science and social studies •using technology in appropriate and effective ways •building on the principles of Assessment is for Learning, ensuring that young people understand the purpose and relevance of what they are learning •developing problem-solving capabilities and critical thinking skills•CfE Principles and Practice Mathematics, Page 2
CfE LevelsPrimary 1 Primary 4 Primary 7
Literacy Maths Literacy Maths Literacy Maths
11-12
12-13 69 72 61 61 56 54
13-14 74 68 77 73 66 61 65 62 59 56 59 57
% Pupils on roll - at or better than expected level% Pupils with Levels – at or better than expected level