Embed Size (px)
Citation preview

www.swirepacific.com
Swire Pacific Limited2009 Interim Report
Stock Codes: ‘A’ Shares 00019 ‘B’ Shares 00087
SWIRE Interim Cover_ENG_210mm(w)x 285mm(h) KC YM

ContentS
1 Financial Highlights
2 Chairman’s Statement
4 Review of Operations
19 Financial Review
20 Financing
25 Report on Review of Condensed Interim Financial Information
26 Interim Financial Information
31 Notes to the Interim Financial Information
51 Supplementary Information
55 Financial Calendar and Information for Investors
Financial Highlights
Six months ended 30th June
Year ended 31st December
Note2009
HK$M 2008
HK$M 2008
HK$M
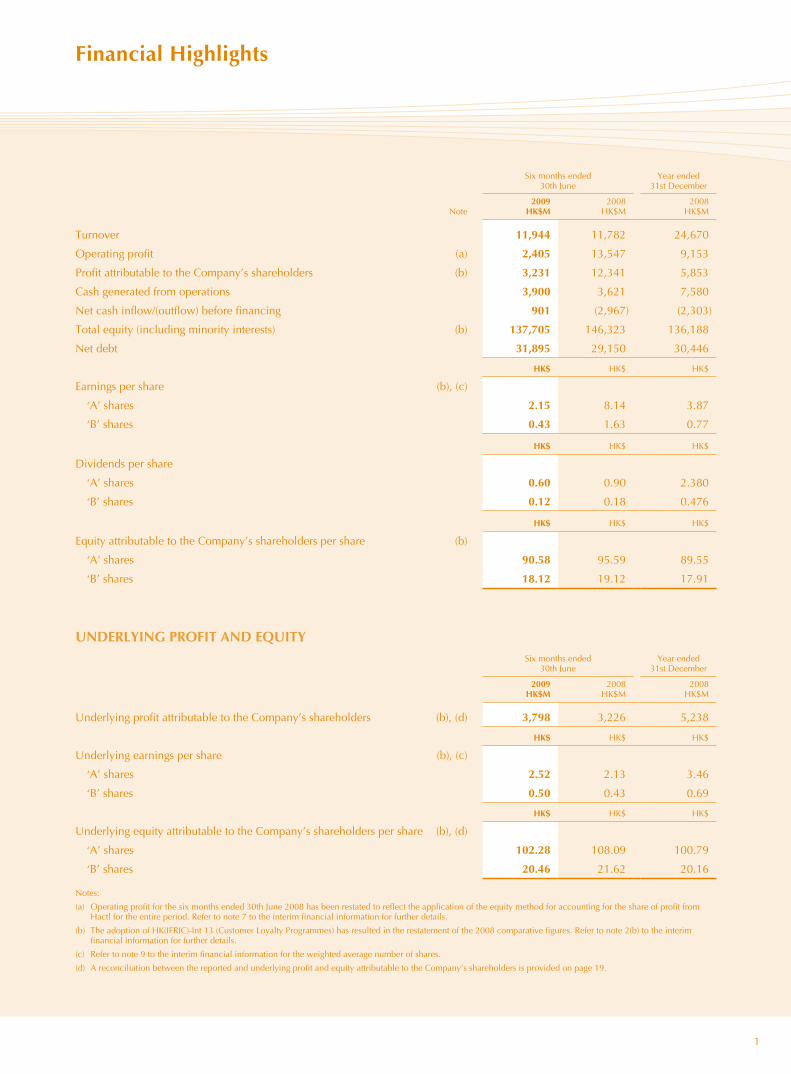
Turnover 11,944 11,782 24,670
Operating profit (a) 2,405 13,547 9,153
Profit attributable to the Company’s shareholders (b) 3,231 12,341 5,853
Cash generated from operations 3,900 3,621 7,580
Net cash inflow/(outflow) before financing 901 (2,967) (2,303)
Total equity (including minority interests) (b) 137,705 146,323 136,188
Net debt 31,895 29,150 30,446
HK$ HK$ HK$
Earnings per share (b), (c)
‘A’ shares 2.15 8.14 3.87
‘B’ shares 0.43 1.63 0.77
HK$ HK$ HK$
Dividends per share
‘A’ shares 0.60 0.90 2.380
‘B’ shares 0.12 0.18 0.476
HK$ HK$ HK$
Equity attributable to the Company’s shareholders per share (b)
‘A’ shares 90.58 95.59 89.55
‘B’ shares 18.12 19.12 17.91
Underlying proFit and eqUitySix months ended
30th JuneYear ended
31st December
2009 HK$M
2008 HK$M
2008 HK$M
Underlying profit attributable to the Company’s shareholders (b), (d) 3,798 3,226 5,238
HK$ HK$ HK$
Underlying earnings per share (b), (c)
‘A’ shares 2.52 2.13 3.46
‘B’ shares 0.50 0.43 0.69
HK$ HK$ HK$
Underlying equity attributable to the Company’s shareholders per share (b), (d)
‘A’ shares 102.28 108.09 100.79
‘B’ shares 20.46 21.62 20.16
Notes:
(a) Operating profit for the six months ended 30th June 2008 has been restated to reflect the application of the equity method for accounting for the share of profit from Hactl for the entire period. Refer to note 7 to the interim financial information for further details.
(b) The adoption of HK(IFRIC)-Int 13 (Customer Loyalty Programmes) has resulted in the restatement of the 2008 comparative figures. Refer to note 2(b) to the interim financial information for further details.
(c) Refer to note 9 to the interim financial information for the weighted average number of shares.
(d) A reconciliation between the reported and underlying profit and equity attributable to the Company’s shareholders is provided on page 19.
1
Chairman’s Statement
2 Swire pacific limited Interim Report 2009
ConSolidated reSUltS
The profit attributable to shareholders for the first half of
2009 was HK$3,231 million, compared with HK$12,341
million in the same period in 2008. Underlying profit
attributable to shareholders, which primarily adjusts for
changes in property valuations and the associated deferred
tax, increased by HK$572 million to HK$3,798 million.
The results reflect mixed performance across the Group’s
five divisions in challenging economic conditions.
The Directors have today declared interim dividends of
HK¢60 (2008: HK¢90) per ‘A’ share and HK¢12 (2008:
HK¢18) per ‘B’ share payable on 5th October 2009 to
shareholders registered at the close of business on 22nd
September 2009. The share registers will be closed from
17th to 22nd September 2009, both dates inclusive.
HalF-year operating reSUltS
Underlying profit in the Property Division fell by HK$66
million to HK$1,849 million, mainly due to losses from
the division’s hotel interests and lower profits from the
trading portfolio. Gross rental income rose by 10% to
HK$3,596 million as rental reversions in the Group’s
office portfolio in Hong Kong generally remained positive
and the developments at One Island East and The Village
South at Sanlitun, Beijing, which opened in 2008, made
contributions for the full half-year.
The Aviation Division faced an extremely difficult trading
environment, with all of the division’s interests suffering
from the effect of global recession. Cathay Pacific and
Dragonair saw a substantial reduction in demand for
premium travel. In April the airlines announced a number
of measures in response to the deteriorating business
conditions, including a reduction in passenger and cargo
capacity and the introduction of an unpaid leave scheme
for staff of both airlines. There were gains on fuel hedging
contracts in the first half of 2009, with unrealised mark-to-
market gains of HK$2.1 billion, compared to losses of
HK$7.6 billion for the whole of 2008. These gains reflect
increases in the forward prices for fuel during the periods
in which the relevant fuel hedging contracts will mature.
They helped the Cathay Pacific group to record an
attributable profit of HK$812 million, compared to a
loss of HK$760 million in the first half of 2008. The
HAECO group recorded a lower profit during the period
as airlines cut capacity and expenditure in response to
falling demand.
The Beverages Division recorded an increase in
attributable profit of 89% to HK$371 million, primarily
reflecting strong sales growth in the inland provinces of
Mainland China. Hong Kong and Taiwan also saw
positive volume growth, while margins in all markets
improved due to lower raw material costs.
The Marine Services Division recorded a 6% increase in
attributable profit to HK$929 million. Vessel charter rates
and utilisation for Swire Pacific Offshore, which had been
at record high levels, were adversely affected by the effect
on offshore oil exploration activity of lower oil prices and
by the large number of newly built vessels entering the
offshore supply market. However, the effect of this was
lessened by the fact that many contracts had been fixed
in 2008 and by a reduction in operating costs.
Attributable profit in the Trading & Industrial Division
fell by 45% to HK$129 million as the division’s interests
were adversely affected by the difficult economic
conditions. There was no contribution from the Group’s
interest in Swire SITA, as it was sold in 2008. Receipts of
the proceeds of this sale were outstanding at 30th June
2009; note 2(c) on page 37 provides further information
on this matter.
FinanCe
Net debt at 30th June 2009 was HK$31,895 million, an
increase of HK$1,449 million since 31st December 2008.
The increase reflected investments in property projects
and new vessels. HK$4,059 million of financing was
arranged during the period. Gearing rose in the period
by 0.8 percentage points to 23.2%. Cash and undrawn
committed facilities totalled HK$13,229 million at 30th
June 2009, compared with HK$10,595 million at 31st
December 2008.

Chairman’s Statement
3
proSpeCtS
Rental conditions in the Hong Kong office and retail
markets are expected to be similar in the second half of
2009 to those in the first-half. In Mainland China, the
trading environment for the retail and hotel development
at The Village at Sanlitun, Beijing, is expected to
remain challenging. Work is progressing at our other
developments in Beijing, Shanghai and Guangzhou.
The global aviation industry, having been adversely
affected by very high fuel prices in the first half of 2008,
has since then had to confront one of the most severe
demand downturns in living memory. There are cautious
signs that the fall in demand has bottomed but there is, as
yet, no clear indication when a sustained recovery in
business will begin. The Cathay Pacific group has taken
appropriate measures to get through the current very
difficult conditions and will take further measures as
necessary should the cost and demand picture not
improve. However, Cathay Pacific will ensure that
quality and brand are not compromised and that the
service proposition to the customer remains intact and
strong. Business activity for the HAECO group in the
second half of 2009 is expected to be substantially weaker
than in the first-half as airlines continue to reduce services
and expenditure.
Trading conditions for the Beverages Division are
expected to be more difficult in the second-half, in
particular in the US market. This may be offset to some
extent by Mainland China, where continued growth is
expected. However, the recent increase in commodity
prices, if sustained, will lead to higher input costs and
reduced margins, which are also expected to be
affected by persistent pricing pressure in a competitive
retail environment.
Utilisation and charter rates for Swire Pacific Offshore are
expected to be under further pressure in the second-half,
as oil companies continue to cut costs and exploration
budgets. A significant number of additional new vessels
are due to be delivered into the offshore market and this
will keep pressure on rates.
The Trading & Industrial Division expects conditions to
remain challenging in all markets in the second-half.
Despite the uncertain economic conditions, the Group is
confident in its longer-term prospects. By continuing to
invest in its core businesses, while at the same time
maintaining the strength of its balance sheet, the Group
is laying the foundations for future growth.
Christopher pratt
Chairman
Hong Kong, 6th August 2009

review of operations
4 Swire pacific limited Interim Report 2009
property diviSion
Six months ended30th June
Year ended31st December
2009HK$M
2008HK$M
2008HK$M
Turnover
Gross rental income derived from
Offices 1,979 1,701 3,632
Retail 1,482 1,412 2,910
Residential 135 144 291
Other revenue* 42 34 74
Property investment 3,638 3,291 6,907
Property trading 148 477 889
Hotels 60 78 156
Total turnover 3,846 3,846 7,952
Operating profit derived from
Property investment 2,754 2,426 5,012
Valuation (losses)/gains on investment properties (1,183) 9,926 184
Property trading 84 160 198
Hotels (322) (22) (86)
Total operating profit 1,333 12,490 5,308
Share of post-tax profits from jointly controlled and associated companies 840 232 183
attributable profit 1,278 10,948 4,293
* Other revenue is mainly estate management fees.
Additional information is provided below to reconcile reported and underlying profit attributable to the Company’s
shareholders. These reconciling items principally adjust for the impact of HKAS 40 and HKAS-Int 21 on investment
properties and deferred taxation respectively.
Six months ended 30th June
Year ended 31st December
Note2009
HK$M2008
HK$M2008
HK$M
reported attributable profit 1,278 10,948 4,293
Adjustments re investment properties:
Revaluation of investment properties (a) 53 (10,145) (241)
Deferred tax on revaluation movements (b) 454 1,879 320
Deferred tax written back on change in tax rate – (947) (947)
Depreciation of investment properties occupied by the Group (c) 2 6 13
Minority interests’ share of revaluation movements less deferred tax (66) 174 237
Impairment of hotel held as part of a mixed-use development less deferred tax (d) 128 – –
Underlying attributable profit 1,849 1,915 3,675
Notes:
(a) This represents the Group’s net revaluation movements plus the Group’s share of net revaluation movements of jointly controlled and associated companies.
(b) This represents deferred tax on the Group’s net revaluation movements plus the Group’s share of deferred tax on the net revaluation movements of jointly controlled and associated companies.
(c) Prior to the implementation of HKAS 40, no depreciation was charged on investment properties occupied by the Group.
(d) Under HKAS 40, hotel properties are stated in the accounts at cost less accumulated depreciation and any provision for impairment losses, rather than at fair value. If HKAS 40 did not apply, those wholly-owned or jointly controlled hotel properties held for the long-term as part of a mixed-use property development would be accounted for as investment properties. Accordingly, any increase or write-down in their value would be recorded in the revaluation reserve rather than the consolidated income statement.

Review of Operations – Property Division
5
property investment portfolio – gross Floor area (‘000 square feet)
at 30th June 2009At 31st
December 2008
location offices retail Hotels residential total Total
Completed
Pacific Place 2,186 711 335 443 3,675 3,675
TaiKoo Place 5,992* – – – 5,992 5,992
Cityplaza 1,633 1,105 – – 2,738 2,738
Festival Walk 229 980 – – 1,209 1,209
Others 183 603 47 35 868 1,056
– Hong Kong 10,223 3,399 382 478 14,482 14,670
– Mainland China – 1,378 169 – 1,547 1,027
– United States – – 259 – 259 259
– United Kingdom – – 184 – 184 184
total completed 10,223 4,777 994 478 16,472 16,140
Under and pending development
– Hong Kong 590 – 362 68 1,020 876
– Mainland China 2,941 2,310 1,145 – 6,396 6,920
total 13,754 7,087 2,501 546 23,888 23,936
Gross floor area represents 100% of space owned by Group companies and the Group’s attributable share of space held through jointly controlled and associated companies.
* This includes 1.8 million square feet of techno-centres.
• Attributable profit from the Property Division for the
first half of 2009 was HK$1,278 million compared to
HK$10,948 million in the same period in 2008. These
figures include net property valuation losses of HK$53
million and gains of HK$10,145 million respectively
(before deferred tax). The attributable profit in the first
half of 2008 included a deferred tax credit of HK$947
million resulting from the reduction in the Hong Kong
profits tax rate from 17.5% to 16.5% in June 2008.
• Gross rental income rose by 10% to HK$3,596 million
during the period. A trading profit of HK$84 million was
recognised, principally on closings of units at the Island
Lodge and Asia residential developments in Hong Kong
and Miami respectively.
Hong Kong investment properties
• In the office portfolio, gross rental income for the half-
year increased by 16% over the same period in 2008,
to HK$1,979 million. Demand in the office market
weakened somewhat, reflecting global economic
conditions. However, office rental reversions remained
generally positive. Office vacancy levels at 30th June
2009 were 2%.
• In the retail portfolio, gross rental income for the half-
year increased by 1% over the same period in 2008, to
HK$1,357 million. Occupancy levels in the Group’s
malls were close to 100%, but retail sales were 8%
lower than in the same period in 2008.
• The Pacific Place design improvement project is
progressing well and in accordance with the programme.
Demolition work is scheduled to commence shortly at
the Tai Sang Commercial Building, which is to be
replaced by a 144,180 square foot Grade A office
building expected to be completed in 2012.
• Conditions in the office and retail rental markets are
expected to be similar in the second half of 2009 to
those in the first-half.

Review of Operations – Property Division
6 Swire pacific limited Interim Report 2009
Mainland China investment properties
• Gross rental income from the retail development at The Village South at Sanlitun, Beijing, and the retail podium of the Beaumonde residential development in Guangzhou was HK$125 million for the half-year. The Village South is 90% leased with 78% of the shops now open. Leasing at Beaumonde is in progress.
• Given the difficult economic conditions, the retail environment is expected to remain challenging for the remainder of 2009.
• The Village North at Sanlitun retail development, which comprises 519,000 square feet of gross space, is expected to open progressively in the second half of 2009. It is currently 43% leased in difficult market conditions.
• Construction of the superstructure at TaiKoo Hui, the 3.7 million square foot mixed-use development in central Guangzhou, is progressing well, with a phased opening expected to commence in late 2010.
• Site clearance and resettlement works continue at the Dazhongli Project in the Jing An district of Shanghai. The expected opening of the 3.5 million square foot mixed-use development has been deferred by a year to 2014, in part because of the need to accommodate the construction of a metro station adjacent to the site.
• Site excavation works continue at the 1.9 million square foot mixed-use development at Jiang Tai in the Chaoyang district of Beijing. A phased opening is expected in 2011.
valuation of investment properties
• As a result of the adoption of the revised HKAS 40 during the period, the portfolio of properties accounted for as investment properties has been expanded to include investment properties being developed, principally TaiKoo Hui, Dazhongli and Jiang Tai. (The valuations of properties under development at Dazhongli and Jiang Tai are reflected in the Group’s investment in jointly controlled companies.) Previously, only completed investment properties and existing investment properties undergoing redevelopment were accounted for as investment properties. In total,
HK$4,336 million of investment properties being developed (including The Village North, which was completed during the period) were transferred to the investment properties category at 1st January 2009 from property, plant and equipment and leasehold land and land use rights.
• The portfolio of investment properties was valued at 30th June 2009 (97% by value having been valued by DTZ Debenham Tie Leung) on the basis of open market value. The amount of this valuation (before associated deferred tax) was HK$138,777 million compared to HK$134,539 million at 31st December 2008.
• The valuation at 30th June 2009 reflects current market conditions and takes into account a slight reduction in rental levels for office and retail properties in Hong Kong since the 31st December 2008 valuation.
investment properties
Financial information reviewed by auditors
valuation HK$M
At 1st January 2009 134,539
Translation differences (7)
Transferred from property, plant and equipment and leasehold land on adoption of revised HKAS 40 4,336
Additions 1,117
Other net transfers to property, plant and equipment and leasehold land (30)
Net fair value losses (1,178)
At 30th June 2009 138,777
Add: Initial leasing costs 68
At 30th June 2009 (including initial leasing costs) 138,845
At 1st January 2009 (including initial leasing costs) 134,625
Hotels
Hong Kong
• The JW Marriott, Conrad Hong Kong and Island Shangri-La hotels at Pacific Place and Novotel Citygate in Tung Chung, in each of which Swire Properties has a 20% interest, experienced pressure on occupancy levels and room rates as a result of weak business and leisure demand.

Review of Operations – Property Division
7
• Work at the two Swire Hotels in Hong Kong is progressing on schedule. The Upper House, a 117-room luxury hotel at Pacific Place, is expected to open in October 2009, while EAST, a 345-room hotel at Cityplaza, is due to open in early 2010.
Mainland China
• The Opposite House, a 99-room luxury hotel at The Village at Sanlitun, Beijing, continued to experience pressure on occupancy in the half-year, reflecting weak demand.
USA
• The 329-room Mandarin Oriental Hotel in Miami, in which Swire Properties has a 75% interest, continued to be adversely affected by prevailing economic conditions in the USA.
UK
• Swire Properties owns four small hotels in provincial UK cities. Occupancy levels in the hotels in Bristol and Brighton held up amid weak economic conditions. The hotels in Exeter and Cheltenham are closed for refurbishment, with work at the latter underway. A major renovation for the Bristol hotel is currently being considered.
profile of Capital Commitments for investment properties and Hotels
expenditure Forecast period of expenditure Commitments
(HK$M)Six months ended
30th June 2009Six months ending
31st December 2009 2010 20112012 &beyond
at 30th June2009
property project
Hong Kong projects 693 791 802 719 133 2,445
Mainland China projects 1,618 2,886 3,452 1,503 922 8,763
UK hotels 29 53 302 164 50 569
USA hotels 5 – – – – –
Total 2,345 3,730 4,556 2,386 1,105 11,777
property trading portfolio
Hong Kong
• 149 of the 184 units have been sold at Island Lodge in North Point, with recent sale prices reflecting the return of favourable market sentiment. Swire Properties is entitled to reimbursement of costs and a share of the net proceeds under an agreement with China Motor Bus, which owns the property.
• The development plan for 2A-2E Seymour Road, in which Swire Properties has a controlling interest, has been finalised. This 206,300 square foot residential development is expected to be completed in 2012.
• Redevelopment options are being explored at Sai Wan Terrace, a residential development in Quarry Bay in which Swire Properties has a controlling interest.
USA
• Sales of 71 of the 123 units have been closed at the Asia residential development in Miami since completion of construction in March 2008. The real estate market in South Florida continues to suffer from difficult economic conditions and tight credit availability. The Group has provided vendor financing in a small number of transactions.
Martin Cubbon

Review of Operations – Aviation Division
8 Swire pacific limited Interim Report 2009
aviation diviSion
Six months ended30th June
Year ended31st December
2009HK$M
2008HK$M
2008HK$M
Share of post-tax profits from associated companies
Cathay Pacific group* 277 (370) (3,607)
Hong Kong Aircraft Engineering group 191 261 505
Hong Kong Air Cargo Terminals** 77 124 274
545 15 (2,828)
attributable profit/(loss) 520 (29) (2,922)
* Figures for the comparative periods have been restated following the adoption of HK(IFRIC)-Int 13 (Customer Loyalty Programmes). Refer to note 2(b) to the interim financial information for further details.
The share of profit attributable to Cathay Pacific’s holding in Hong Kong Aircraft Engineering group has been included in the attributable figures for that company.
** Figures for the six months ended 30th June 2008 have been restated to reflect the application of equity accounting for the whole period. Refer to note 7 to the interim financial information for further details.
Cathay pacific and dragonair Six months ended
30th June
2009 2008 Change
Key operating Highlights
Available tonne kilometres (“ATK”) Million 11,035 12,081 -8.7%
Passengers carried ‘000 11,938 12,463 -4.2%
Passenger load factor % 78.5 80.0 -1.5%pt
Passenger yield HK cents 49.7 61.9# -19.7%
Cargo and mail carried ‘000 tonnes 701 828 -15.3%
Cargo and mail load factor % 66.2 66.4 -0.2%pt
Cargo and mail yield HK$ 1.66 2.47# -32.8%
Cost per ATK HK$ 2.57 3.46# -25.7%
Cost per ATK without fuel HK$ 1.98 1.89# +4.8%
Aircraft utilisation Hours per day 11.1 11.4 -2.6%
On-time performance % 88.3 79.4 +8.9%pt
# Restated figures.
Review of Operations – Aviation Division
9
• The Aviation Division reported an attributable profit of
HK$520 million in the first half of 2009, compared to a
loss of HK$29 million in the same period in 2008.
Cathay pacific group
• The Cathay Pacific group reported a profit of HK$812
million for the first half of 2009. This compares to a loss
of HK$760 million in the first half of 2008. Turnover for
the period fell by 27.1% to HK$30,921 million.
• The global recession in the first half of 2009 saw
extremely challenging business conditions for commercial
aviation. The downturn in Cathay Pacific’s key markets
has been deep and sustained and has sharply reduced
passenger and cargo revenues.
• Fuel prices were on average significantly lower than
in the first half of 2008, but were still higher than in
previous years. Both spot and forward prices rose rapidly
in the second quarter, with May recording the largest
monthly rise in ten years. Unrealised mark-to-market
gains on fuel hedging contracts of HK$2.1 billion were
recorded in the period compared to losses of HK$7.6
billion for the whole of 2008. These gains reflected
increases in the forward prices for fuel during the periods
in which the relevant fuel hedging contracts will mature.
• A number of measures were introduced to mitigate
the impact of the revenue shortfall, including reducing
passenger and freight capacity at Cathay Pacific and
Dragonair, an unpaid leave scheme for staff of both
airlines and cutting operating costs and capital
expenditure.
passenger Services
Cathay Pacific and Dragonair
• Cathay Pacific and Dragonair carried a total of 11.9
million passengers in the first half of 2009, down 4.2%
on the same period last year. Revenue from passenger
services fell by 22.9% to HK$21,809 million and yield
dropped by 19.7% to HK¢49.7, reflecting weak demand
from premium travellers, competitive pressure on
economy class fares and the strong US dollar.
• Capacity reductions were introduced on selected routes
from May, in line with the lower level of demand and
with a view to containing costs. Overall capacity was
reduced by 8% at Cathay Pacific and 13% at Dragonair.
On Dragonair’s network, a number of services have
been suspended.
• Cross-straits traffic carried on Taiwan and Mainland
China flights has been significantly affected since direct
cross-straits charters started in July 2008. The impact
was partially offset by an increase in Mainland China
tourists travelling to Taiwan via Hong Kong.
Cargo Services
Cathay Pacific and Dragonair
• Cargo demand in the first half of 2009 was very weak,
reflecting global economic conditions. Cathay Pacific
and Dragonair tonnage fell by 15.3% to 700,693
tonnes. The cargo load factor fell by 0.2 percentage
points to 66.2% while yield fell by 32.8% to HK$1.66,
reflecting intense competition.
• Capacity was reduced by 14.1% compared to the same
period last year, in line with the fall in demand. Most
routes were affected, the exceptions being India and the
Middle East. The weekly frequency of the freighter fleet
was reduced to 84 compared to 124 during the peak
weeks in 2008. Notwithstanding these adjustments, the
freighter network remains intact.
AHK Air Hong Kong (“AHK”)
• AHK, a 60% owned subsidiary of Cathay Pacific,
operates express cargo services for DHL Express (the
remaining 40% shareholder) to 11 Asian cities with a
fleet of eight Airbus A300-600F freighters and three
wet-leased aircraft.
• Despite decreases in load factor and yield of 3.5
percentage points and 15.5% respectively, AHK
achieved a higher profit in the first half of 2009 than
in the same period in 2008.

Review of Operations – Aviation Division
10 Swire pacific limited Interim Report 2009
Fleet Size
Cathay Pacific and Dragonair
• During the first half of 2009, the two airlines took
delivery of seven new aircraft, including two Boeing
777-300ER passenger aircraft and the sixth and final
Boeing 747-400ERF freighter. Nineteen Boeing 777-
300ER aircraft remain on firm order, but the group has
been working to defer a number of deliveries.
• Five Boeing 747-200F “Classic” freighters were retired
during the first half of 2009. The last “Classic” freighter
was retired in July. Five Boeing 747-400BCF freighters
were taken out of service and one was wet-leased to
AHK. Two of Dragonair’s Airbus A330-300 aircraft
whose leases expired were returned in June.
• Cathay Pacific has a total of ten Boeing 747-8F
advanced freighters on order, the first of which will
arrive in March 2010.
outlook
Cathay Pacific and Dragonair
• The global aviation industry, having been adversely
affected by very high fuel prices in the first half of 2008,
has since then had to confront one of the most severe
demand downturns in living memory. There are
cautious signs that the fall in demand has bottomed
but there is, as yet, no indication when a sustained
recovery in business will begin. The Cathay Pacific
group has taken appropriate measures to get through the
current very difficult conditions and will take further
measures as necessary should the cost and demand
picture not improve. However, the company will ensure
that quality and brand are not compromised and that
the service proposition to the customer remains intact
and strong.
• Despite today’s difficult economic conditions, Cathay
Pacific remains confident in its future. Cathay Pacific
has a capable, committed workforce and management
team and a superb international network centred on
Asia’s premier aviation hub. Cathay Pacific will be in a
strong position when the business rebound comes.
air China
• Air China, in which Cathay Pacific holds an 18.1%
interest, is Mainland China’s national flag carrier and a
leading provider of passenger, cargo and other airline
related services.
• Cathay Pacific’s share of Air China’s profit is based
on accounts drawn up three months in arrears and
consequently the 2009 interim results include Air
China’s results for the six months ended 31st March
2009, excluding Cathay Pacific’s share of Air China’s
fuel hedging losses at 31st December 2008, which were
included in Cathay Pacific’s 2008 annual results.
• The group shared a loss from Air China’s results.
Hong Kong aircraft engineering Company (“HaeCo”)
• The HAECO group provides a range of aviation
maintenance and repair services primarily in Hong
Kong through HAECO and in Xiamen through
its subsidiary company Taikoo (Xiamen) Aircraft
Engineering Company Limited (“TAECO”). In addition,
Hong Kong Aero Engine Services Limited (“HAESL”),
a jointly controlled company, operates an aircraft
engine overhaul business in Hong Kong.
• The HAECO group recorded a profit of HK$430 million
in the first half of 2009, a decrease of 27% from the
comparative period in 2008. The result reflects
increasingly difficult trading conditions for HAECO’s
businesses as airlines cut capacity and expenditure in
response to falling demand.
• Demand for heavy and line maintenance work fell both
in Hong Kong and Xiamen.
• HAESL’s engine overhaul business returned satisfactory
results due to a favourable work mix.

Review of Operations – Aviation Division
11
Outlook
• Business activity in the second half of 2009 is expected
to be substantially weaker than in the first-half as
airlines continue to reduce services and expenditure.
The HAECO group has significant unsold capacity for
the first time in several years. Despite its considerable
competitive advantages, the timing of any sustained
recovery in the HAECO group’s business will depend
upon a recovery in global aviation generally.
Developments
• Despite the downturn in demand, the HAECO group
has continued to invest in both Hong Kong and
Mainland China to expand its facilities and the range
of its services.
• HAECO’s third hangar in Hong Kong is scheduled to
open in September 2009.
• Taikoo Spirit AeroSystems (Jinjiang) Composite
Company Limited is expected to open its specialist
advanced composite repair facility in the fourth quarter
of 2009.
• TAECO’s sixth hangar in Xiamen is expected to open in
mid-2010.
• Taikoo Engine Services (Xiamen) Company Limited is
upgrading its facility in Xiamen, with the first engine
induction expected in the second quarter of 2010.
• Taikoo Sichuan Aircraft Engineering Services Company
Limited is constructing its first hangar in Chengdu,
which is due to open in mid-2010.
• HAESL’s extension is expected to be completed in
the first quarter of 2011.
other operations
Cathay Pacific Catering Services group (“CPCS”)
• CPCS, a wholly-owned subsidiary of Cathay Pacific,
operates six inflight catering facilities in Asia and North
America. Despite effective cost controls, CPCS
reported a reduced profit for the first half of 2009, with
lower meal volumes and yield. Airline customers’ cost
saving initiatives adversely affected the company’s
profit margin.
Hong Kong Airport Services (“HAS”)
• HAS, a wholly-owned subsidiary of Cathay Pacific,
provides ramp and passenger handling and related
services at Hong Kong International Airport.
• The business environment was extremely difficult in
the first half of 2009, with a fall in business volume
coupled with rising costs. Despite a number of cost
saving initiatives being put in place to mitigate the
impact of the economic downturn, including an
unpaid leave scheme for the management team, profit
for the first half of 2009 was lower than in the first half
of 2008.
Hong Kong Air Cargo Terminals (“Hactl”)
• Hactl registered a decline in cargo throughput during
the first half of 2009 of 21.5%, reflecting adverse
economic conditions. This resulted in a significant
reduction in the profit of Hactl attributable to the Swire
Pacific Group.
tony tyler
John r Slosar
Review of Operations – Beverages Division
12 Swire pacific limited Interim Report 2009
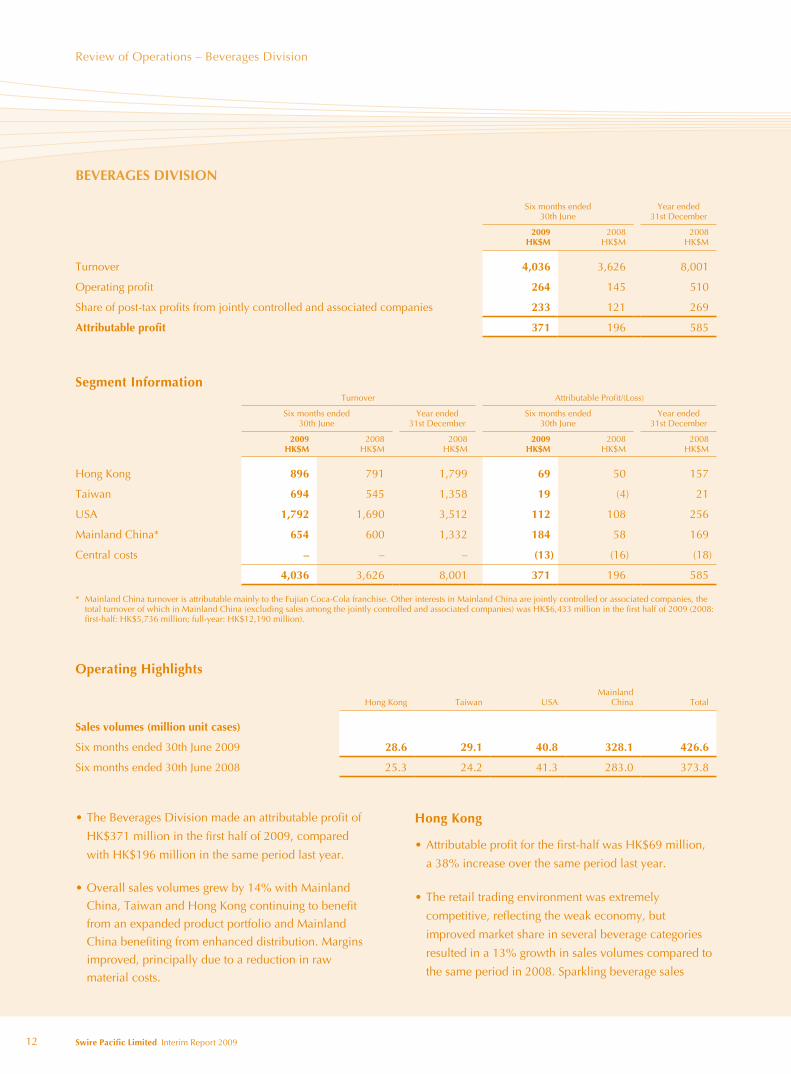
• The Beverages Division made an attributable profit of
HK$371 million in the first half of 2009, compared
with HK$196 million in the same period last year.
• Overall sales volumes grew by 14% with Mainland
China, Taiwan and Hong Kong continuing to benefit
from an expanded product portfolio and Mainland
China benefiting from enhanced distribution. Margins
improved, principally due to a reduction in raw
material costs.
BeverageS diviSion
Six months ended 30th June
Year ended 31st December
2009HK$M
2008HK$M
2008HK$M
Turnover 4,036 3,626 8,001
Operating profit 264 145 510
Share of post-tax profits from jointly controlled and associated companies 233 121 269
attributable profit 371 196 585
Segment informationTurnover Attributable Profit/(Loss)
Six months ended 30th June
Year ended 31st December
Six months ended 30th June
Year ended 31st December
2009HK$M
2008HK$M
2008HK$M
2009HK$M
2008HK$M
2008HK$M
Hong Kong 896 791 1,799 69 50 157
Taiwan 694 545 1,358 19 (4) 21
USA 1,792 1,690 3,512 112 108 256
Mainland China* 654 600 1,332 184 58 169
Central costs – – – (13) (16) (18)
4,036 3,626 8,001 371 196 585
* Mainland China turnover is attributable mainly to the Fujian Coca-Cola franchise. Other interests in Mainland China are jointly controlled or associated companies, the total turnover of which in Mainland China (excluding sales among the jointly controlled and associated companies) was HK$6,433 million in the first half of 2009 (2008: first-half: HK$5,736 million; full-year: HK$12,190 million).
operating Highlights
Hong Kong Taiwan USAMainland
China Total
Sales volumes (million unit cases)
Six months ended 30th June 2009 28.6 29.1 40.8 328.1 426.6
Six months ended 30th June 2008 25.3 24.2 41.3 283.0 373.8
Hong Kong
• Attributable profit for the first-half was HK$69 million,
a 38% increase over the same period last year.
• The retail trading environment was extremely
competitive, reflecting the weak economy, but
improved market share in several beverage categories
resulted in a 13% growth in sales volumes compared to
the same period in 2008. Sparkling beverage sales

Review of Operations – Beverages Division
13
Mainland China
• Attributable profit for the first-half totalled HK$184
million, a 217% increase over the same period last year.
• Sales volumes grew by 16%. Sales growth was
particularly strong in the inland provinces of Anhui and
Henan. Zhejiang, Fujian and Guangdong reported
lower rates of sales growth as those provinces were
more directly affected than the inland provinces by
the global recession and a fall in the migrant worker
population. Sparkling beverage sales volumes grew
by 12%, aided by the expanded distribution of Coke
Zero. Still beverage sales volumes grew by 25%,
with Minute Maid flavour extensions helping to
maintain growth.
• Margins improved, reflecting a fall in raw material costs
and improvement in cost control.
outlook
• Trading conditions in all markets are expected to remain challenging, with prospects for the US market looking particularly difficult. In Mainland China growth is expected to continue, but at a higher rate in the inland provinces (as their economies benefit from government stimulus spending) than in the coastal provinces. The Hong Kong and Taiwan beverage markets are expected to remain very competitive. However, it is hoped that promotional activities planned for the peak summer season will sustain the improved first-half sales performance.
• The recent increase in commodity prices, if sustained, will lead to higher input costs and reduced margins, which are also expected to be affected by persistent pricing pressure in a competitive retail environment.
geoff Cundle
volumes grew by 6%. Still beverage sales volumes
increased by 21%, reflecting the successful relaunch
of Minute Maid juice drinks in October 2008 and the
consolidation of Bonaqua’s market leadership in
packaged waters. Margins improved as a result of
reduced raw material costs.
taiwan
• Attributable profit for the first-half was HK$19 million
compared to a marginal loss for the same period
last year.
• Sales volumes grew by 20% in a declining beverages
market, with the Taiwan economy being particularly
badly affected by the global recession. Minute Maid
continued to perform strongly. There was also
encouraging growth in sales of sparkling beverages,
reflecting packaging innovations and successful
promotions over the important Chinese New Year
festive period.
• Margins benefited from a reduction in variable costs,
reflecting operational efficiencies derived from the
restructuring undertaken in 2008.
USa
• Attributable profit for the first-half totalled HK$112
million, a 4% increase from the same period last year.
• The weak US economy continued to have an
adverse impact on sales of higher margin immediate
consumption products. Sales of premium priced energy
drinks weakened, as did Dasani packaged water sales,
with consumers switching to private label brands.
The weak water sales contributed to a 3% decline in
still beverage sales volumes. Sparkling sales volumes
fell by 1%.
• Margins improved, primarily due to a fall in fuel and
packaging costs.

Review of Operations – Marine Services Division
14 Swire pacific limited Interim Report 2009
Marine ServiCeS diviSion
Six months ended 30th June
Year ended 31st December
2009HK$M
2008HK$M
2008HK$M
Swire Pacific Offshore group
Turnover 2,063 1,849 4,007
Operating profit 892 853 1,750
Attributable profit* 888 834 1,691
* Including post-tax profits from the jointly controlled companies shown below.
Share of post-tax profits from jointly controlled companies
Swire Pacific Offshore group 3 – –
HUD group 41 44 76
44 44 76
attributable profit 929 878 1,767
At 30th June At 31st December
2009 2008 2008
Fleet size (number of vessels)
Swire Pacific Offshore group 69 65 69
HUD group 18 21 19
Total 87 86 88
profile of Capital Commitments – Swire pacific offshore group
expenditure Forecast period of expenditure Commitments
(HK$M)Six months ended
30th June 2009Six months ending
31st December 2009 2010 2011at 30th June
2009
Vessels 195 963 1,481 641 3,085
Other equipment 7 47 14 – 61
Total 202 1,010 1,495 641 3,146
• The Marine Services Division, through the Swire Pacific
Offshore group ("SPO"), operates a fleet of specialist
vessels supporting the offshore oil industry. The division
also has jointly controlled interests, through the HUD
group, in ship repair and harbour towage services in
Hong Kong. The attributable profit of HK$929 million
for the first half of 2009 was 6% higher than that of the
same period in 2008.
Swire pacific offshore group
• SPO reported an attributable profit of HK$888 million
for the first half of 2009, an increase of 6% over the
comparable period in 2008. There were no capital gains
on disposal of vessels during the period (2008 first-half:
capital gains of HK$35 million).

Review of Operations – Marine Services Division
15
• At 30th June 2009, 17 vessels and two accommodation
barges were on order, with a total capital expenditure
commitment of HK$3,146 million (31st December 2008:
HK$3,244 million). One V-class AHTS vessel is expected
to be delivered in the second half of 2009.
Hongkong United dockyards (“HUd”) group
• Attributable profit from the HUD group for the first half
of 2009 was HK$41 million, compared to HK$44
million for the same period in 2008. The results for the
first half of 2009 include a HK$5 million profit on sale
of a tug.
• The salvage and towage division recorded a 13%
reduction in tug movements for the first half of 2009
compared to the same period in 2008, reflecting the
weakness of the container-shipping industry.
• The ship repair division’s business remained reasonably
stable for much of the period, reflecting the time lag
between the slowdown in the wider economy and its
impact on the ship repair industry.
• Looking ahead, depressed global trading conditions are
continuing to affect the container-shipping industry
adversely. Fewer harbour tug movements are expected
in the second half of 2009 than in the corresponding
period of 2008. Tighter project scope management and
tougher pricing negotiations for repairs are expected
from ship owners.
J B rae-Smith
davy Ho
• A combination of lower oil prices, the global economic
recession and a substantial increase in the delivery of
newly built tonnage into the market adversely affected
fleet utilisation.
• Overall fleet utilisation in the first half of 2009 was 91%
compared with 94% in the first half of 2008. The
average charter rates were in line with those achieved
in 2008 as many of the contracts were fixed in the
second half of 2008, before the emergence of significant
downward pressure on rates.
• Despite an increase in overall fleet size, the operating
costs per vessel day in the first half of 2009 fell slightly
compared with those in the first half of 2008 as a result
of the impact of the stronger US dollar on non-US dollar
vessel operating expenses.
• At 30th June 2009, SPO operated a fleet of 69 vessels,
the same number as on 31st December 2008. During
the first half of 2009, SPO took delivery of one V-class
8,810 brake horse power anchor handling tug supply
(“AHTS”) vessel and returned one B-class vessel to
the owner.
• Total capital expenditure on new vessels and equipment
during the first half of 2009 was HK$202 million,
compared to HK$644 million in the first half of 2008.
• The second half of 2009 is expected to be challenging.
Despite the oil price recovering to a level above US$60
per barrel, the offshore oil exploration market remains
weak as oil companies continue to cut costs and defer
investment. New vessel deliveries are also expected to
have an adverse effect. Projects are being delayed and
customers in all major markets have asked for discounts
or rate reductions both on bids submitted and on
existing contracts. Although 60% of the second-half
fleet capacity was pre-booked at 30th June 2009, the
day rates are 5% to 30% lower than rates actually
achieved in the first half of 2009.

Review of Operations – Trading & Industrial Division
16 Swire pacific limited Interim Report 2009
trading & indUStrial diviSion
Six months ended 30th June
Year ended 31st December
2009HK$M
2008HK$M
2008HK$M
Turnover
Swire Resources group 903 882 1,776
Taikoo Motors group 977 1,388 2,534
Taikoo Sugar 169 194 445
Other subsidiary companies 5 47 58
2,054 2,511 4,813
Operating profits/(losses)
Swire Resources group 32 33 49
Taikoo Motors group 6 19 10
Taikoo Sugar 5 6 13
Other subsidiary companies and central costs (16) (16) (34)
Valuation gain on investment property – 14 14
27 56 52
Attributable profits/(losses)
Swire Resources group* 34 82 87
Taikoo Motors group 5 8 4
Taikoo Sugar 4 5 11
Other subsidiary companies and central costs (13) (15) (31)
Valuation gain on investment property – 12 23
30 92 94
* Including post-tax profits from the jointly controlled and associated companies within the Swire Resources group shown below.
Share of post-tax profits from jointly controlled and associated companies
Swire Resources group 9 57 50
CROWN Beverage Cans group 37 42 81
Akzo Nobel Swire Paints 62 60 132
Swire SITA group – 40 72
108 199 335
Profit on sale of interest in Swire SITA group – – 1,721
attributable profit 129 234 2,100
Review of Operations – Trading & Industrial Division
17
• The Trading & Industrial Division reported an
attributable profit of HK$129 million in the first half
of 2009, a 45% reduction from the same period in
2008. Excluding the impact of businesses now closed
or sold, the comparative fall in profit is 28%.
Swire resources group
• The Swire Resources group distributes and retails sports
and casual footwear and apparel brands in Hong Kong
and Mainland China.
• Attributable profit for the first half of 2009 was HK$34
million, a 59% decrease from the same period in 2008.
The decrease primarily reflected a lower contribution
from the group’s PUMA associate, where both turnover
and margins declined sharply.
• In Hong Kong turnover was slightly behind that in
the first half of 2008, despite higher sales, driven by
increased sales promotions, from the multibrand
store chains.
• Turnover in Mainland China grew by 17% as strong
growth of the Columbia brand was partly offset by
lower turnover attributable to other brands following the
transfer to third party retailers or closure of loss-making
retail outlets. The group managed 68 retail outlets in
Mainland China at the end of the period.
• Overall margins in Mainland China improved as a result
of increased local purchasing.
• The trading environment in the second half of the year
is expected to become increasingly difficult with
margins coming under pressure as a result of price
discounting.
taikoo Motors group
• The Taikoo Motors group imports and distributes
vehicles under exclusive franchise agreements
in Taiwan.
• In a challenging market, turnover for the first half of
2009 fell by 30% to HK$977 million and attributable
profit fell by 38% to HK$5 million.
• Taikoo Motors sold 2,950 cars, 16% fewer than in the
same period in 2008, in part due to the expiry of the
Audi franchise agreement in February. The car market
in Taiwan as a whole fell by 4% in the period.
• Volvo commercial vehicles unit sales fell by 63%
compared to the same period last year, in line with a
fall in the sector overall of 56%.
• Harley-Davidson performed ahead of expectations,
selling 156 motorcycles in the first half of 2009.
• New model launches in the second half of 2009,
including the Mark VI Volkswagen Golf, should
improve comparative performance, although overall
market conditions will remain difficult.
taikoo Sugar
• Taikoo Sugar supplies premium sugar products to
the Hong Kong and Mainland China markets and
wholesale purchasing services to industrial users.
• Taikoo Sugar reported an attributable profit of HK$4
million in the first half of 2009, compared with HK$5
million in the same period in 2008.
• In March, the company moved to larger packaging
facilities in Guangzhou, more than doubling its
production capacity to 2,300 metric tonnes per annum.
• Rising sugar costs are expected to put pressure on
margins in the second-half.

Review of Operations – Trading & Industrial Division
18 Swire pacific limited Interim Report 2009
CroWn Beverage Cans group
• CROWN Beverage Cans group consists of
joint ventures with Crown Holdings Inc., which
manufacture aluminium beverage cans in Mainland
China and Vietnam.
• The group contributed an attributable profit of HK$37
million for the first half of 2009, compared to HK$42
million in the same period in 2008.
• The fall in contribution is attributable to a 9% reduction
in sales volumes in Mainland China, reflecting an
overall weakening in market demand.
• Market conditions are expected to remain difficult
for the remainder of the year.
akzo nobel Swire paints
• These joint ventures with Akzo Nobel manufacture and
distribute decorative paints, primarily under the Dulux
brand, in Mainland China and Hong Kong.
• Attributable profit for the first half of 2009 was HK$62
million, compared to HK$60 million in the same period
in 2008.
• Mainland China sales volumes fell marginally
compared to the same period in 2008. Sales volumes
were very weak in the first quarter of 2009, reflecting
adverse conditions in the property market and retailer
de-stocking. However, this was mitigated by a strong
upturn at the end of the second quarter. Turnover was
adversely affected by changes in the sales mix, but
the effect of this on profits was more than offset by
lower direct costs and reduced advertising and
promotion activity.
• The Hong Kong business performed broadly in line
with the same period of 2008.
• The remainder of 2009 will be challenging for the
joint ventures.
Swire Sita group
• As more fully described in note 2(c) to the interim
financial information on page 37, in October 2008 the
division transferred full operational control of its 50%
interest in Swire SITA to Suez Environnement, its joint
venture partner. No share of attributable profit has been
recognised since October 2008.
J B rae-Smith
Financial review
19
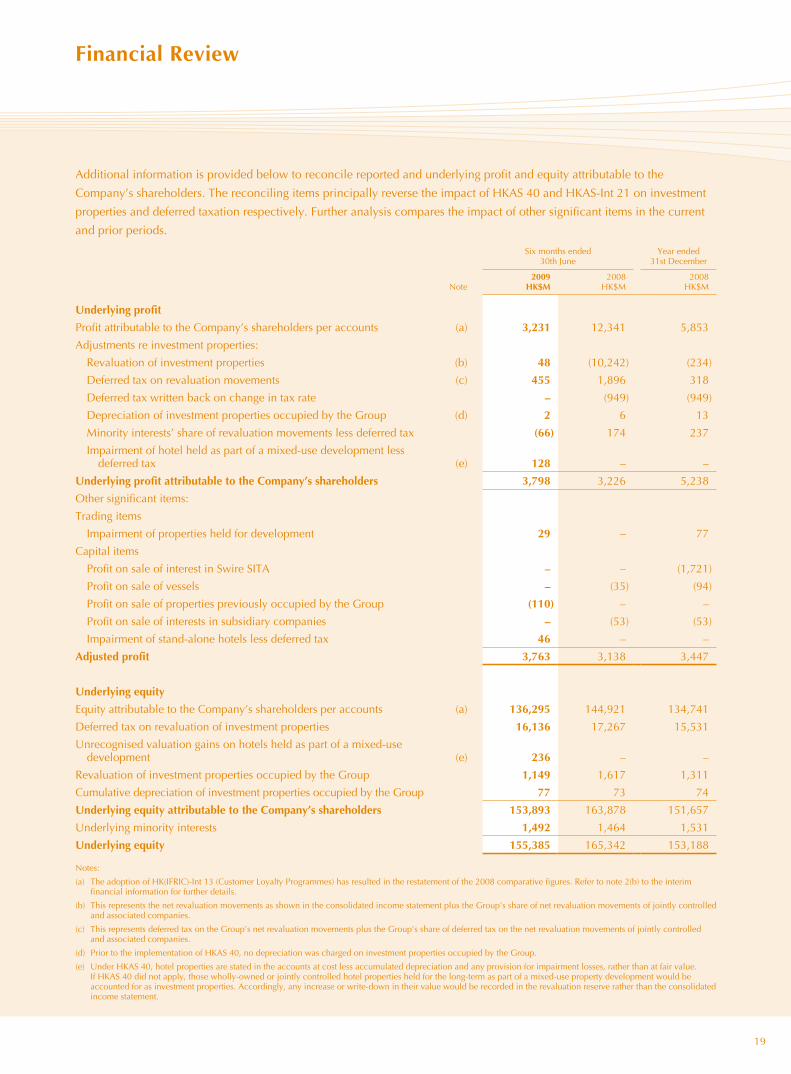
Additional information is provided below to reconcile reported and underlying profit and equity attributable to the
Company’s shareholders. The reconciling items principally reverse the impact of HKAS 40 and HKAS-Int 21 on investment
properties and deferred taxation respectively. Further analysis compares the impact of other significant items in the current
and prior periods.
Six months ended 30th June
Year ended 31st December
Note2009
HK$M2008
HK$M2008
HK$M
Underlying profit
Profit attributable to the Company’s shareholders per accounts (a) 3,231 12,341 5,853
Adjustments re investment properties:
Revaluation of investment properties (b) 48 (10,242) (234)
Deferred tax on revaluation movements (c) 455 1,896 318
Deferred tax written back on change in tax rate – (949) (949)
Depreciation of investment properties occupied by the Group (d) 2 6 13
Minority interests’ share of revaluation movements less deferred tax (66) 174 237
Impairment of hotel held as part of a mixed-use development less deferred tax (e) 128 – –
Underlying profit attributable to the Company’s shareholders 3,798 3,226 5,238
Other significant items:
Trading items
Impairment of properties held for development 29 – 77
Capital items
Profit on sale of interest in Swire SITA – – (1,721)
Profit on sale of vessels – (35) (94)
Profit on sale of properties previously occupied by the Group (110) – –
Profit on sale of interests in subsidiary companies – (53) (53)
Impairment of stand-alone hotels less deferred tax 46 – –
adjusted profit 3,763 3,138 3,447
Underlying equity
Equity attributable to the Company’s shareholders per accounts (a) 136,295 144,921 134,741
Deferred tax on revaluation of investment properties 16,136 17,267 15,531
Unrecognised valuation gains on hotels held as part of a mixed-use development (e) 236 – –
Revaluation of investment properties occupied by the Group 1,149 1,617 1,311
Cumulative depreciation of investment properties occupied by the Group 77 73 74
Underlying equity attributable to the Company’s shareholders 153,893 163,878 151,657
Underlying minority interests 1,492 1,464 1,531
Underlying equity 155,385 165,342 153,188
Notes:
(a) The adoption of HK(IFRIC)-Int 13 (Customer Loyalty Programmes) has resulted in the restatement of the 2008 comparative figures. Refer to note 2(b) to the interim financial information for further details.
(b) This represents the net revaluation movements as shown in the consolidated income statement plus the Group’s share of net revaluation movements of jointly controlled and associated companies.
(c) This represents deferred tax on the Group’s net revaluation movements plus the Group’s share of deferred tax on the net revaluation movements of jointly controlled and associated companies.
(d) Prior to the implementation of HKAS 40, no depreciation was charged on investment properties occupied by the Group.
(e) Under HKAS 40, hotel properties are stated in the accounts at cost less accumulated depreciation and any provision for impairment losses, rather than at fair value. If HKAS 40 did not apply, those wholly-owned or jointly controlled hotel properties held for the long-term as part of a mixed-use property development would be accounted for as investment properties. Accordingly, any increase or write-down in their value would be recorded in the revaluation reserve rather than the consolidated income statement.

Financing
20 Swire pacific limited Interim Report 2009
Cash used in investing activities included capital expenditure for, and investments in, the property projects in Mainland
China, as well as stage payments for offshore support vessels under construction.
Changes in Financing
Financial information reviewed by auditorsanalysis of Changes in Financing during the period/year
Six months ended30th June 2009
Year ended31st December 2008
HK$M HK$M
Loans, bonds and perpetual capital securities
At 1st January 35,272 27,038
Loans drawn and refinancing 3,841 12,161
Repayment of loans and bonds (4,709) (3,914)
Other non-cash movements 6 (13)
At 30th June/31st December 34,410 35,272
Overdrafts 5 –
34,415 35,272
Summary of Cash Flows
Six months ended 30th June
Year ended 31st December
2009HK$M
2008HK$M
2008HK$M
net cash used by businesses and investments
Cash generated from operations 3,900 3,621 7,580
Dividends received 537 1,404 1,812
Tax paid (154) (189) (468)
Net interest paid (716) (589) (1,212)
Cash used in investing activities (2,666) (7,214) (10,015)
901 (2,967) (2,303)
Cash paid to shareholders and net funding by external debt
Dividends paid (2,259) (3,576) (4,980)
(Decrease)/increase in borrowings (868) 7,204 8,247
Capital contribution from minority interests – – 10
Repurchase of the Company’s shares – (17) (649)
Net security deposits uplifted 85 85 170
(3,042) 3,696 2,798
(Decrease)/increase in cash and cash equivalents (2,141) 729 495

Financing
21
During the first half of 2009, the Group raised HK$4,059 million. This included:
• the issue of three series of four-year medium-term notes totalling HK$500 million
• a two-year bilateral term loan facility of RMB300 million
• a five-year bilateral term loan facility of RMB2,000 million
• a two-year bilateral revolving credit facility of US$38 million
• a four-year bilateral term loan facility of HK$500 million
Two additional five-year bilateral term loan facilities totalling HK$1,000 million were signed in July 2009.
Sources of Finance
At 30th June 2009, committed loan facilities and debt securities amounted to HK$44,093 million, of which HK$11,215
million remained undrawn. In addition, the Group had undrawn uncommitted facilities totalling HK$3,351 million.
Financial information reviewed by auditorsSources of funds at 30th June 2009 comprised:
AvailableHK$M
DrawnHK$M
Undrawnexpiring
withinone year
HK$M
Undrawnexpiring
afterone year
HK$M
Committed facilities
Loans and bonds
Fixed / floating rate bonds 13,447 13,447 – –
Bank loans, overdrafts and other loans 28,321 17,106 1,355 9,860
Perpetual capital securities 2,325 2,325 – –
total committed facilities 44,093 32,878 1,355 9,860
Uncommitted facilities
Bank loans, overdrafts and other loans 4,966 1,615 3,268 83
total 49,059 34,493 4,623 9,943
Note: The figures above are stated before unamortised loan fees of HK$78 million.
The Group had bank balances and short-term deposits of HK$2,014 million at 30th June 2009, excluding security deposits,
compared to HK$4,239 million at 31st December 2008.

Financing
22 Swire pacific limited Interim Report 2009
Maturity profile and refinancing
The maturity profile of the Group’s available committed facilities is set out below:
* The perpetual capital securities have no fixed maturity date. In the above graph their maturity has been presented as their first call date, 13th May 2017.
Financial information reviewed by auditorsgross Borrowings Maturity profile
30th June 2009 31st December 2008
HK$M HK$M
Within 1 year 4,913 14% 3,751 11%
1 – 2 years 4,314 13% 1,967 6%
2 – 5 years 13,070 38% 17,438 49%
After 5 years 12,118 35% 12,116 34%
total 34,415 100% 35,272 100%
Currency profile
An analysis of the carrying amounts of gross borrowings by currency (after cross-currency swaps) is shown below:
30th June 2009 31st December 2008
HK$M HK$M
Currency
Hong Kong dollar 29,050 84% 29,633 84%
United States dollar 1,290 4% 1,385 4%
Renminbi 3,786 11% 3,631 10%
New Taiwan dollar 224 1% 600 2%
Others 65 – 23 –
total 34,415 100% 35,272 100%
11,000
10,000
9,000
8,000
7,000
6,000
5,000
4,000
3,000
2,000
1,000
0Second-
half2009
2010 2011
Loans Bonds Perpetual capital securities*
2012 2013 2014 2015 2016 2017 2018
(HK$M)
Total Available Committed Facilities by Maturity (at 30th June 2009)

Financing
23
Finance Charges
At 30th June 2009, 58% of the Group’s gross borrowings were on a fixed rate basis and 42% were on a floating rate basis
(31st December 2008: 57% and 43% respectively).
Financial information reviewed by auditorsInterest charged and earned was as follows:
Six months ended30th June
Year ended31st December
2009HK$M
2008HK$M
2008HK$M
interest charges
Bank loans and overdrafts (201) (347) (679)
Other loans and bonds (475) (352) (850)
Fair value gains/(losses) on derivative instruments:
– Interest rate swaps: cash flow hedges, transferred from other comprehensive income (9) 25 32
– Interest rate swaps: fair value hedges 7 – 27
– Interest rate swaps: not qualifying as hedges 2 (14) (5)
Adjustments to financial liabilities – fair value hedges (1) – (26)
Amortised loan fees – loans at amortised cost (11) (9) (18)
Deferred into properties under development for sale 2 7 10
Finance charges capitalised 154 276 424
(532) (414) (1,085)
interest income
Short-term deposits and bank balances 21 47 83
Other loans 20 26 90
41 73 173
net finance charges (491) (341) (912)
gearing ratios and interest Cover30th June 31st December
Note2009 2008
(Restated)2008
(Restated)
Gearing ratio 1
– Per accounts 23.2% 19.9% 22.4%
– Underlying 20.5% 17.6% 19.9%
Interest cover – times 2
– Per accounts 4.9 39.7 10.0
– Underlying 7.7 10.4 9.9
Cash interest cover – times 3
– Per accounts 3.7 21.7 6.8
– Underlying 5.8 5.7 6.7
Notes:
1. Gearing represents the ratio of net debt to total equity (including minority interests).
2. Interest cover is calculated by dividing operating profit by net finance charges.
3. Cash interest cover is calculated by dividing operating profit by the total of net finance charges and capitalised interest.

Financing
24 Swire pacific limited Interim Report 2009
debt in Jointly Controlled and associated Companies
In accordance with Hong Kong Financial Reporting Standards, the net debt of Swire Pacific reported in the consolidated
statement of financial position does not include the net debt of its jointly controlled and associated companies. These
companies had the following net debt positions at 30th June 2009 and 31st December 2008. If the attributable portion of
the net debt in jointly controlled and associated companies were to be added to the Group’s net debt, gearing would rise to
33% and underlying gearing would rise to 29%.
Total net debt/(cash)Portion of net debt/(cash) attributable to the Group
Debt guaranteed by Swire Pacific or its subsidiaries
30th June 2009
HK$M
31st December 2008
HK$M
30th June 2009
HK$M
31st December 2008
HK$M
30th June 2009
HK$M
31st December 2008
HK$M
Property Division 4,281 4,406 1,216 1,241 488 491
Aviation Division
Cathay Pacific group 30,668 25,198 12,258 10,074 – –
HAECO group 273 (216) 122 (96) – –
Hactl 2,025 2,172 405 434 – –
Other Aviation Division companies 12 14 6 7 – –
Beverages Division 984 908 260 294 – –
Marine Services Division (237) 705 (119) 352 – 500
Trading & Industrial Division (1,958) (1,624) (744) (608) – –
36,048 31,563 13,404 11,698 488 991

report on review of Condensed interim Financial informationto the Board of directors of Swire pacific limited(incorporated in Hong Kong with limited liability)
25
introdUCtion
We have reviewed the condensed interim financial information set out on pages 26 to 50, which comprises the consolidated
statement of financial position of Swire Pacific Limited (the “Company”) and its subsidiaries (together, the “Group”) as at
30th June 2009 and the related consolidated income statement and consolidated statements of comprehensive income,
changes in equity and cash flows for the six-month period then ended, and a summary of significant accounting policies and
other explanatory notes. The Rules Governing the Listing of Securities on the Main Board of The Stock Exchange of Hong
Kong Limited require the preparation of a report on interim financial information to be in compliance with the relevant
provisions thereof and Hong Kong Accounting Standard 34 “Interim Financial Reporting” issued by the Hong Kong Institute
of Certified Public Accountants. The Directors of the Company are responsible for the preparation and presentation of this
interim financial information in accordance with Hong Kong Accounting Standard 34 “Interim Financial Reporting”. Our
responsibility is to express a conclusion on this condensed interim financial information based on our review and to report
our conclusion solely to you, as a body, in accordance with our agreed terms of engagement and for no other purpose. We
do not assume responsibility towards or accept liability to any other person for the contents of this report.
SCope oF revieW
We conducted our review in accordance with Hong Kong Standard on Review Engagements 2410, “Review of Interim
Financial Information Performed by the Independent Auditor of the Entity” issued by the Hong Kong Institute of Certified
Public Accountants. A review of interim financial information consists of making inquiries, primarily of persons responsible
for financial and accounting matters, and applying analytical and other review procedures. A review is substantially less in
scope than an audit conducted in accordance with Hong Kong Standards on Auditing and consequently does not enable us
to obtain assurance that we would become aware of all significant matters that might be identified in an audit. Accordingly,
we do not express an audit opinion.
ConClUSion
Based on our review, nothing has come to our attention that causes us to believe that the condensed interim financial
information is not prepared, in all material respects, in accordance with Hong Kong Accounting Standard 34 “Interim
Financial Reporting”.
pricewaterhouseCoopers
Certified Public Accountants
Hong Kong, 6th August 2009

Consolidated income Statementfor the six months ended 30th June 2009 – unaudited
26 Swire pacific limited Interim Report 2009
Six months ended 30th June
Year ended 31st December
Note
2009HK$M
2008HK$M
(Restated)
2008HK$M
(Restated)
Turnover 3 11,944 11,782 24,670
Cost of sales (5,734) (5,910) (12,627)
Gross profit 6,210 5,872 12,043
Distribution costs (1,447) (1,459) (3,016)
Administrative expenses (950) (835) (1,677)
Other operating expenses (176) (163) (373)
Profit on sale of interests in jointly controlled companies – – 1,721
Other net gains 4 181 109 278
Change in fair value of investment properties (1,178) 10,023 177
Impairment losses on hotel properties (235) – –
Operating profit 2,405 13,547 9,153
Finance charges (532) (414) (1,085)
Finance income 41 73 173
Net finance charges 6 (491) (341) (912)
Share of profits less losses of jointly controlled companies 1,154 380 638
Share of profits less losses of associated companies 7 616 228 (2,606)
Profit before taxation 3,684 13,814 6,273
Taxation 8 (459) (1,233) (47)
Profit for the period 3,225 12,581 6,226
Profit attributable to:
The Company’s shareholders 3,231 12,341 5,853
Minority interests (6) 240 373
3,225 12,581 6,226
Dividends
Interim – proposed/paid 903 1,364 1,364
Final – paid – – 2,227
903 1,364 3,591
HK$ HK$ HK$
Earnings per share for profit attributable to the Company’s shareholders (basic and diluted) 9
‘A’ shares 2.15 8.14 3.87
‘B’ shares 0.43 1.63 0.77
2009 2008
interim HK¢
Interim HK¢
Final HK¢
Total HK¢
Dividends per share
‘A’ shares 60.0 90.0 148.0 238.0
‘B’ shares 12.0 18.0 29.6 47.6

Consolidated Statement of Comprehensive incomefor the six months ended 30th June 2009 – unaudited
27
Six months ended 30th June
Year ended 31st December
2009 HK$M
2008 HK$M
(Restated)
2008 HK$M
(Restated)
profit for the period 3,225 12,581 6,226
other comprehensive income
Cash flow hedges
– recognised during the period 267 391 (113)
– deferred tax (52) (60) 22
– transferred to net finance charges 9 (25) (32)
– transferred to operating profit – exchange differences – – 29
– transferred to initial cost of non-financial assets 37 – (74)
Net fair value gains/(losses) on available-for-sale assets recognised during the period 123 (3) (130)
Share of other comprehensive income of jointly controlled and associated companies 106 479 (349)
Translation differences on foreign operations 61 470 174
other comprehensive income/(loss) for the period, net of tax 551 1,252 (473)
total comprehensive income for the period 3,776 13,833 5,753
Total comprehensive income attributable to:
The Company’s shareholders 3,781 13,545 5,360
Minority interests (5) 288 393
3,776 13,833 5,753
Note: Other than cash flow hedges as highlighted above, items shown within other comprehensive income have no tax effect.

Consolidated Statement of Financial positionat 30th June 2009 – unaudited
28 Swire pacific limited Interim Report 2009
Note
30th June2009
HK$M
31st December 2008
HK$M(Restated)
aSSetS and liaBilitieSnon-current assets Property, plant and equipment 10 13,480 17,010 Investment properties 10 138,845 134,625 Leasehold land and land use rights 10 2,142 2,586 Intangible assets 11 863 867 Properties held for development 444 471 Jointly controlled companies 10,316 8,505 Associated companies 18,988 18,442 Available-for-sale assets 12 423 300 Long-term receivables 10 8 Long-term security deposits 296 380 Derivative financial instruments 13 289 103 Deferred tax assets 16 410 295 Retirement benefit assets 164 197
186,670 183,789 Current assets Properties for sale 2,011 1,842 Stocks and work in progress 1,376 1,733 Trade and other receivables 14 3,971 3,767 Available-for-sale assets 12 1,888 1,888 Derivative financial instruments 13 7 3 Cash and cash equivalents 2,010 4,146 Short-term deposits 173 262
11,436 13,641 Current liabilities Trade and other payables 15 7,366 7,717 Provisions 6 8 Taxation payable 537 345 Derivative financial instruments 13 36 36 Bank overdrafts and short-term loans 2,145 2,083 Long-term loans and bonds due within one year 2,768 1,668
12,858 11,857 net current (liabilities)/assets (1,422) 1,784 total assets less current liabilities 185,248 185,573 non-current liabilities Perpetual capital securities 2,325 2,325 Long-term loans and bonds 27,177 29,196 Derivative financial instruments 13 136 274 Deferred tax liabilities 16 17,660 17,382 Retirement benefit liabilities 245 208
47,543 49,385 net aSSetS 137,705 136,188 eqUity Share capital 17 903 903 Reserves 18 135,392 133,838 equity attributable to the Company’s shareholders 136,295 134,741 Minority interests 19 1,410 1,447 total eqUity 137,705 136,188

Consolidated Statement of Cash Flowsfor the six months ended 30th June 2009 – unaudited
29
Six months ended 30th June
Year ended 31st December
2009 HK$M
2008HK$M
2008 HK$M
operating activities Cash generated from operations 3,900 3,621 7,580 Interest paid (758) (662) (1,389) Interest received 42 73 177 Profits tax paid (154) (189) (468)
3,030 2,843 5,900 Dividends received from jointly controlled and associated companies and available-for-sale assets 537 1,404 1,812 net cash from operating activities 3,567 4,247 7,712 investing activities Purchase of property, plant and equipment (983) (1,756) (3,686) Additions of investment properties (906) (2,714) (3,680) Proceeds from disposals of property, plant and equipment 27 50 140 Proceeds from disposals of interests in subsidiary companies – 6 239 Purchase of available-for-sale investments – – (65) Purchase of shares in existing subsidiary companies – (3) (27) Purchase of shares in existing jointly controlled companies (199) – – Loans to jointly controlled companies (599) (2,696) (2,988) Repayment of loan to jointly controlled company (3,500) – – Purchase of shares in associated companies (45) (486) (543) Loans to associated companies (13) – (3) Purchase of intangible assets (6) (4) (14) Sale of shares in jointly controlled companies – – 24 Repayment of loans by jointly controlled companies 3,472 280 535 Repayment of loans by associated companies – 130 130 Net decrease in deposits maturing after more than three months 89 23 – Initial leasing costs incurred (3) (44) (77) net cash used in investing activities (2,666) (7,214) (10,015)net cash inflow/(outflow) before financing 901 (2,967) (2,303)Financing activities Loans drawn and refinancing 3,841 10,464 12,161 Repayment of loans and bonds (4,709) (3,260) (3,914)
(868) 7,204 8,247 Capital contribution from minority interests – – 10 Repurchase of the Company’s shares – (17) (649) Security deposits uplifted 85 85 170 Dividends paid to the Company’s shareholders (2,227) (3,533) (4,896) Dividends paid to minority interests (32) (43) (84) net cash (used in)/generated from financing activities (3,042) 3,696 2,798 (decrease)/increase in cash and cash equivalents (2,141) 729 495 Cash and cash equivalents at 1st January 4,146 3,648 3,648 Currency adjustment – 139 3 Cash and cash equivalents at end of the period 2,005 4,516 4,146
represented by:Bank balances and short-term deposits maturing within three months 2,010 4,525 4,146 Bank overdrafts (5) (9) –
2,005 4,516 4,146

Consolidated Statement of Changes in equity
attributable to the Company’s shareholders
Note
SharecapitalHK$M
revenuereserveHK$M
otherreserves
HK$Mtotal
HK$M
Minority interests
HK$M
totalequityHK$M
at 1st January 2009
– as originally stated 903 133,079 1,405 135,387 1,447 136,834
– adjustment on adoption of HK(IFRIC)-Int 13 – (646) – (646) – (646)
– as restated 903 132,433 1,405 134,741 1,447 136,188
Profit for the period – 3,231 – 3,231 (6) 3,225
Other comprehensive income – – 550 550 1 551
total comprehensive income for the period – 3,231 550 3,781 (5) 3,776
Dividend paid 18,19 – (2,227) – (2,227) (32) (2,259)
at 30th June 2009 903 133,437 1,955 136,295 1,410 137,705
Attributable to the Company’s shareholders
SharecapitalHK$M
RevenuereserveHK$M
(Restated)
Otherreserves
HK$MTotal
HK$M
Minority interests
HK$M
TotalequityHK$M
at 1st January 2008
– as originally stated 910 132,873 1,734 135,517 1,161 136,678
– adjustment on adoption of HK(IFRIC)-Int 13 – (591) – (591) – (591)
– as restated 910 132,282 1,734 134,926 1,161 136,087
Profit for the period – 12,341 – 12,341 240 12,581
Other comprehensive income – – 1,204 1,204 48 1,252
total comprehensive income for the period – 12,341 1,204 13,545 288 13,833
Repurchase of the Company’s shares – premium paid on repurchases – (17) – (17) – (17)
Dividend paid – (3,533) – (3,533) (43) (3,576)
Change in composition of Group – – – – (4) (4)
at 30th June 2008 910 141,073 2,938 144,921 1,402 146,323
for the six months ended 30th June 2009 – unaudited
30 Swire pacific limited Interim Report 2009

attributable to the Company’s shareholders
Note
SharecapitalHK$M
revenuereserveHK$M
otherreserves
HK$Mtotal
HK$M
Minority interests
HK$M
totalequityHK$M
at 1st January 2009
– as originally stated 903 133,079 1,405 135,387 1,447 136,834
– adjustment on adoption of HK(IFRIC)-Int 13 – (646) – (646) – (646)
– as restated 903 132,433 1,405 134,741 1,447 136,188
Profit for the period – 3,231 – 3,231 (6) 3,225
Other comprehensive income – – 550 550 1 551
total comprehensive income for the period – 3,231 550 3,781 (5) 3,776
Dividend paid 18,19 – (2,227) – (2,227) (32) (2,259)
at 30th June 2009 903 133,437 1,955 136,295 1,410 137,705
Attributable to the Company’s shareholders
SharecapitalHK$M
RevenuereserveHK$M
(Restated)
Otherreserves
HK$MTotal
HK$M
Minority interests
HK$M
TotalequityHK$M
at 1st January 2008
– as originally stated 910 132,873 1,734 135,517 1,161 136,678
– adjustment on adoption of HK(IFRIC)-Int 13 – (591) – (591) – (591)
– as restated 910 132,282 1,734 134,926 1,161 136,087
Profit for the period – 12,341 – 12,341 240 12,581
Other comprehensive income – – 1,204 1,204 48 1,252
total comprehensive income for the period – 12,341 1,204 13,545 288 13,833
Repurchase of the Company’s shares – premium paid on repurchases – (17) – (17) – (17)
Dividend paid – (3,533) – (3,533) (43) (3,576)
Change in composition of Group – – – – (4) (4)
at 30th June 2008 910 141,073 2,938 144,921 1,402 146,323
notes to the interim Financial information
31
1. SegMent inForMation
(a) Analysis of Consolidated Income Statement
Six months ended30th June 2009
external turnover
HK$M
inter-segment turnover
HK$M
total turnover
HK$M
operating profit
HK$M
net finance chargesHK$M
Share of profits less
losses of jointly
controlled companies
HK$M
Share of profits less
losses of associated companies
HK$M
profit before
taxationHK$M
profit for the period
HK$M
profit attributable
to the Company’s
shareholdersHK$M
Property
Property investment 3,611 27 3,638 2,754 (566) 33 6 2,227 1,939 1,945
Property trading 148 – 148 84 (1) (34) – 49 4 4
Hotels 60 – 60 (322) (14) (5) 38 (303) (230) (230)
Change in fair value of investment properties – – – (1,183) – 820 (18) (381) (507) (441)
3,819 27 3,846 1,333 (581) 814 26 1,592 1,206 1,278
Aviation
Cathay Pacific group – – – – – – 277 277 277 277
HAECO group – – – – – – 191 191 191 191
Hactl – – – – – – 77 77 77 52
Others – – – – – – – – – –
– – – – – – 545 545 545 520
Beverages
Hong Kong 896 – 896 88 – – – 88 76 69
Taiwan 694 – 694 28 (2) 1 – 27 24 19
USA 1,792 – 1,792 156 – – – 156 112 112
Mainland China 654 – 654 5 (16) 194 38 221 210 184
Central costs – – – (13) – – – (13) (13) (13)
4,036 – 4,036 264 (18) 195 38 479 409 371
Marine Services
Swire Pacific Offshore group 2,063 – 2,063 892 1 3 – 896 891 888
HUD group – – – – – 41 – 41 41 41
2,063 – 2,063 892 1 44 – 937 932 929
Trading & Industrial
Swire Resources group 903 – 903 32 – 2 7 41 34 34
Taikoo Motors group 977 – 977 6 (1) – – 5 5 5
CROWN Beverage Cans group – – – – – 37 – 37 37 37
Akzo Nobel Swire Paints – – – – – 62 – 62 62 62
Other activities 141 33 174 (11) 3 – – (8) (9) (9)
2,021 33 2,054 27 2 101 7 137 129 129
Head Office
Net income/(expenses) 5 6 11 (116) 105 – – (11) – –
Change in fair value of investment properties – – – 5 – – – 5 4 4
5 6 11 (111) 105 – – (6) 4 4
Inter-segment elimination* – (66) (66) – – – – – – –
Total 11,944 – 11,944 2,405 (491) 1,154 616 3,684 3,225 3,231
* Sales between operating segments are accounted for at competitive market prices charged to unaffiliated customers for similar goods and services.

Notes to the Interim Financial Information
32 Swire pacific limited Interim Report 2009
1. SegMent inForMation (continued)
(a) Analysis of Consolidated Income Statement (continued)
Six months ended30th June 2008 (Restated)
External turnover
HK$M
Inter-segment turnover
HK$M
Total turnover
HK$M
Operating profit
HK$M
Net finance chargesHK$M
Share of profits less
losses of jointly
controlled companies
HK$M
Share of profits less
losses of associated companies
HK$M
Profit before
taxationHK$M
Profit for the period
HK$M
Profit attributable
to the Company’s
shareholdersHK$M
Property
Property investment 3,267 24 3,291 2,426 (459) (6) 7 1,968 1,758 1,749
Property trading 477 – 477 160 – (42) – 118 76 76
Hotels 78 – 78 (22) 1 27 76 82 84 84
Change in fair value of investment properties – – – 9,926 – 102 68 10,096 9,213 9,039
3,822 24 3,846 12,490 (458) 81 151 12,264 11,131 10,948
Aviation
Cathay Pacific group – – – – – – (370) (370) (370) (370)
HAECO group – – – – – – 261 261 261 261
Hactl – – – – – – 124 124 124 83
Others – – – – – (3) – (3) (3) (3)
– – – – – (3) 15 12 12 (29)
Beverages
Hong Kong 791 – 791 60 – – – 60 54 50
Taiwan 545 – 545 (4) (3) 1 – (6) (6) (4)
USA 1,690 – 1,690 137 1 – – 138 108 108
Mainland China 600 – 600 (32) (13) 113 7 75 69 58
Central costs – – – (16) – – – (16) (16) (16)
3,626 – 3,626 145 (15) 114 7 251 209 196
Marine Services
Swire Pacific Offshore group 1,849 – 1,849 853 3 – – 856 837 834
HUD group – – – – – 44 – 44 44 44
1,849 – 1,849 853 3 44 – 900 881 878
Trading & Industrial
Swire Resources group 882 – 882 33 – 2 55 90 82 82
Taikoo Motors group 1,388 – 1,388 19 – – – 19 8 8
CROWN Beverage Cans group – – – – – 42 – 42 42 42
Akzo Nobel Swire Paints – – – – – 60 – 60 60 60
Swire SITA group – – – – – 40 – 40 40 40
Other activities 208 33 241 (10) 1 – – (9) (10) (10)
Change in fair value of investment properties – – – 14 – – – 14 12 12
2,478 33 2,511 56 1 144 55 256 234 234
Head Office
Net income/(expenses) 7 5 12 (80) 128 – – 48 44 44
Change in fair value of investment properties – – – 83 – – – 83 70 70
7 5 12 3 128 – – 131 114 114
Inter-segment elimination – (62) (62) – – – – – – –
Total 11,782 – 11,782 13,547 (341) 380 228 13,814 12,581 12,341

Notes to the Interim Financial Information
33
1. SegMent inForMation (continued)
(a) Analysis of Consolidated Income Statement (continued)
Year ended31st December 2008 (Restated)
External turnover
HK$M
Inter-segment turnover
HK$M
Total turnover
HK$M
Operating profit
HK$M
Net finance chargesHK$M
Share of profits less
losses of jointly
controlled companies
HK$M
Share of profits less
losses of associated companies
HK$M
Profit before
taxationHK$M
Profit for the period
HK$M
Profit attributable
to the Company’s
shareholdersHK$M
Property
Property investment 6,858 49 6,907 5,012 (1,091) 28 16 3,965 3,482 3,485
Property trading 889 – 889 198 4 (48) – 154 104 104
Hotels 156 – 156 (86) (11) 13 140 56 73 73
Change in fair value of investment properties – – – 184 – 50 (16) 218 868 631
7,903 49 7,952 5,308 (1,098) 43 140 4,393 4,527 4,293 Aviation
Cathay Pacific group – – – – – – (3,607) (3,607) (3,607) (3,607)
HAECO group – – – – – – 505 505 505 505
Hactl – – – – – – 274 274 274 183
Others – – – – – (3) – (3) (3) (3)
– – – – – (3) (2,828) (2,831) (2,831) (2,922)Beverages
Hong Kong 1,799 – 1,799 183 (1) – – 182 173 157
Taiwan 1,358 – 1,358 31 (5) 1 – 27 26 21
USA 3,512 – 3,512 340 2 – – 342 256 256
Mainland China 1,332 – 1,332 (26) (28) 232 36 214 196 169
Central costs – – – (18) – – – (18) (18) (18)
8,001 – 8,001 510 (32) 233 36 747 633 585 Marine Services
Swire Pacific Offshore group 4,007 – 4,007 1,750 7 – – 1,757 1,691 1,691
HUD group – – – – – 76 – 76 76 76
4,007 – 4,007 1,750 7 76 – 1,833 1,767 1,767 Trading & Industrial
Swire Resources group 1,776 – 1,776 49 – 4 46 99 87 87
Taikoo Motors group 2,534 – 2,534 10 1 – – 11 4 4
CROWN Beverage Cans group – – – – – 81 – 81 81 81
Akzo Nobel Swire Paints – – – – – 132 – 132 132 132
Swire SITA group – – – – – 72 – 72 72 72
Other activities 436 67 503 (21) 3 – – (18) (20) (20)
Sale of interest in Swire SITA group – – – 1,721 – – – 1,721 1,721 1,721
Change in fair value of investment properties – – – 14 – – – 14 23 23
4,746 67 4,813 1,773 4 289 46 2,112 2,100 2,100 Head Office
Net income/(expenses) 13 149 162 (167) 207 – – 40 56 56
Change in fair value of investment properties – – – (21) – – – (21) (26) (26)
13 149 162 (188) 207 – – 19 30 30 Inter-segment elimination – (265) (265) – – – – – – – Total 24,670 – 24,670 9,153 (912) 638 (2,606) 6,273 6,226 5,853

Notes to the Interim Financial Information
34 Swire pacific limited Interim Report 2009
1. SegMent inForMation (continued)
(b) Analysis of total assets of the Group
at 30th June 2009
Segmentassets
HK$M
Jointlycontrolledcompanies
HK$M
associatedcompanies
HK$M
Bank depositsand
securitiesHK$M
totalassets
HK$M
Property
Property investment 142,283 7,199 385 820 150,687
Property trading 2,671 78 – 97 2,846
Hotels 3,936 464 461 62 4,923
148,890 7,741 846 979 158,456
Aviation
Cathay Pacific group – – 14,357 – 14,357
HAECO group – – 2,435 – 2,435
Hactl – – 632 – 632
Others – 22 – – 22
– 22 17,424 – 17,446
Beverages 4,819 1,302 492 259 6,872
Marine Services
Swire Pacific Offshore group 8,630 49 35 655 9,369
HUD group – 404 – – 404
8,630 453 35 655 9,773
Trading & Industrial
Swire Resources group 336 46 191 98 671
Taikoo Motors group 892 – – 205 1,097
CROWN Beverage Cans group – 387 – – 387
Akzo Nobel Swire Paints – 365 – – 365
Other activities 1,971 – – 3 1,974
3,199 798 191 306 4,494
Head Office 744 – – 321 1,065
166,282 10,316 18,988 2,520 198,106
The Swire Pacific Group is organised on a divisional basis: Property, Aviation, Beverages, Marine Services and Trading
& Industrial.
The Beverages Division is considered to be a single reportable segment as the nature of its operations in the different
geographical locations is similar. The analysis of consolidated income statement in note 1(a) presents the results of the
Beverages Division by geographical location in order to provide further information to the user of the Interim Report.
The reportable segments within each of the other four divisions are classified according to the nature of the business.
The Head Office is also considered to be a reportable segment as discrete financial information is available for the
Head Office activities.

Notes to the Interim Financial Information
35
1. SegMent inForMation (continued)
(b) Analysis of total assets of the Group (continued)
At 31st December 2008
Segmentassets
HK$M
Jointlycontrolledcompanies
HK$M
Associatedcompanies
HK$M
Bank depositsand
securitiesHK$M
Totalassets
HK$M
Property
Property investment 142,293 6,540 397 1,086 150,316
Property trading 2,669 37 – 161 2,867
Hotels 3,542 93 423 72 4,130
148,504 6,670 820 1,319 157,313
Aviation
Cathay Pacific group – – 13,948 – 13,948
HAECO group – – 2,414 – 2,414
Hactl – – 632 – 632
Others – 22 – – 22
– 22 16,994 – 17,016
Beverages 4,451 1,168 409 275 6,303
Marine Services
Swire Pacific Offshore group 8,459 49 35 692 9,235
HUD group – (97) – – (97)
8,459 (48) 35 692 9,138
Trading & Industrial
Swire Resources group 455 44 184 20 703
Taikoo Motors group 1,178 – – 301 1,479
CROWN Beverage Cans group – 345 – – 345
Akzo Nobel Swire Paints – 304 – – 304
Other activities 2,050 – – 4 2,054
3,683 693 184 325 4,885
Head Office 560 – – 2,215 2,775
165,657 8,505 18,442 4,826 197,430
2. BaSiS oF preparation
(a) The unaudited condensed interim financial information has been prepared in accordance with Hong Kong
Accounting Standard (“HKAS”) 34 “Interim Financial Reporting” issued by the Hong Kong Institute of
Certified Public Accountants and the disclosure requirements of the Listing Rules of The Stock Exchange of
Hong Kong Limited.
The accounting policies used in the preparation of the interim financial information are consistent with those
described in the 2008 annual accounts except as noted in 2(b) below.

Notes to the Interim Financial Information
36 Swire pacific limited Interim Report 2009
2. BaSiS oF preparation (continued)
(b) The Group has adopted the following relevant new and revised Hong Kong Financial Reporting Standards
(“HKFRS”), amendments and interpretations effective from 1st January 2009:
HKFRSs (Amendments) Improvements to HKFRSs*
HKAS 1 (Revised) Presentation of Financial Statements
HKAS 23 (Revised) Borrowing Costs
HKFRS 1 & HKAS 27 (Amendments) Cost of an Investment in a Subsidiary, Jointly Controlled Entity or Associate
HKFRS 7 (Revised) Financial Instruments Disclosures
HKFRS 8 Operating Segments
HK(IFRIC)-Int 13 Customer Loyalty Programmes
HK(IFRIC)-Int 15 Agreements for the Construction of Real Estate
HK(IFRIC)-Int 16 Hedges of a Net Investment in a Foreign Operation
* Except for the amendments to HKFRS 5 which will be applied from 1st January 2010.
The Improvements to HKFRSs include amendments to existing standards which consist of editorial changes only, as
well as amendments that result in accounting changes. The main impact on the Group of the Improvements to
HKFRSs is the amendment to HKAS 40 Investment Property/HKAS 16 Property, Plant and Equipment, which permits
investment property under development to be held at fair value rather than at cost. As a result of the amendment to
HKAS 40/HKAS 16, the Group has recognised a fair value gain (including the Group’s share of jointly controlled
companies’ fair value movements) of HK$2,905 million (net of deferred tax) in the consolidated income statement
for the period ended 30th June 2009 in respect of investment property previously accounted for as property, plant
and equipment.
The revised HKAS 1 has introduced a number of changes to the presentation of the interim financial information,
including a requirement for those fair value gains and losses previously presented in the consolidated statement of
changes in equity to be presented in a new consolidated statement of comprehensive income.
The revised HKAS 23 requires borrowing costs directly attributable to the acquisition, construction or production of
a qualifying asset to be capitalised as part of the cost of that asset. This has had no impact on the Group’s interim
financial information.
The adoption of HKFRS 8 has resulted in a number of changes to the presentation of segmental information in the
interim financial information, including disclosure of total assets by reportable segment.

Notes to the Interim Financial Information
37
2. BaSiS oF preparation (continued)
HK(IFRIC)-Int 13 clarifies that, where goods or services are sold together with a customer loyalty incentive, a
portion of the consideration received from the customer should be deferred until the customer loyalty incentive is
redeemed. The adoption of HK(IFRIC)-Int 13 has affected the share of profit from Cathay Pacific as the airline has
applied the new interpretation to its accounting for airline loyalty schemes. The adoption of HK(IFRIC)-Int 13 has
resulted in a reduction in the Group’s opening retained earnings at 1st January 2009 of HK$646 million and an
increase in the Group’s profit for the six months ended 30th June 2009 of HK$27 million. As the adoption of
HK(IFRIC)-Int 13 applies retrospectively, it has also resulted in an increase in the Group’s share of loss from Cathay
Pacific for the six months ended 30th June 2008 and year ended 31st December 2008 of HK$39 million and
HK$55 million respectively. The consolidated income statements and consolidated statements of financial position
for these periods have been restated accordingly.
The adoption of the other revisions, amendments and interpretations has had no effect on the Group’s interim
financial information.
(c) The preparation of financial information in conformity with HKFRS requires the use of certain critical accounting
estimates. It also requires management to exercise its judgement in the process of applying the Group’s accounting
policies. Those areas involving a higher degree of judgement or complexity, or areas where assumptions and estimates
are significant to the Group’s consolidated accounts include the following:
disposal of Swire Sita
On 22nd September 2008 Swire Industrial Limited (“Swire Industrial”), a wholly-owned subsidiary of the Company,
agreed to sell to Suez Environnement all of Swire Industrial’s shares in Swire SITA Waste Services Limited (“Swire
SITA”) for an aggregate cash consideration of HK$1,888 million. The sale resulted in a gain on disposal of
HK$1,721 million, which was included in the Company’s consolidated profits for 2008. In accordance with the
terms of the Swire SITA shareholders agreement, the purchase monies were placed in escrow (refer to note 12 to
the interim financial information). The release of the purchase monies to Swire Industrial from escrow is subject to
receipt of consent to the sale from the Government of Hong Kong SAR, which remained outstanding at 30th June
2009 and remains outstanding at the date of this report. If the consent of the Government of Hong Kong SAR is not
obtained by 21st April 2010, the Swire SITA shareholders agreement provides that the sale of Swire Industrial’s
shares in Swire SITA will not proceed. The Directors are of the opinion that the consent of the Government of Hong
Kong SAR to the sale to Suez Environnement will be forthcoming before 21st April 2010. Suez Environnement has
requested postponement of completion of the sale. On the basis of counsel’s opinion, Swire Industrial does not
consider that Suez Environnement has valid grounds for requesting a postponement and accordingly has not agreed
to the request. It is expected that the sale will be completed when the consent of the Government of Hong Kong
SAR is obtained.
Other areas where assumptions and estimates are significant to the Group’s consolidated accounts are detailed in the
2008 annual accounts.

Notes to the Interim Financial Information
38 Swire pacific limited Interim Report 2009
3. tUrnover
Turnover represents sales by the Company and its subsidiary companies to external customers and comprises revenue from:
Six months ended 30th June
Year ended 31st December
2009HK$M
2008HK$M
2008HK$M
Gross rental income from investment properties 3,571 3,239 6,791
Property trading 148 477 889
Hotels 60 78 156
Charter hire income 2,063 1,849 4,007
Rendering of services 46 39 83
Sales of goods 6,056 6,100 12,744
11,944 11,782 24,670
4. otHer net gainS
Other net gains include the following:
Six months ended 30th June
Year ended 31st December
2009HK$M
2008HK$M
2008HK$M
Profit on share dilution in subsidiary companies – 49 49
Profit on sale of a subsidiary company – 4 4
Net profit on sale of property, plant and equipment 108 30 85
Net foreign exchange (losses)/gains (13) (29) 24
Fair value losses on derivative instruments
– Cross-currency swaps: transferred from cash flow hedge reserve – – (29)

Notes to the Interim Financial Information
39
5. expenSeS By natUre
Expenses included in cost of sales, distribution costs, administrative and other operating expenses are analysed as follows:
Six months ended 30th June
Year ended 31st December
2009HK$M
2008HK$M
2008HK$M
Direct operating expenses of investment properties that
– Generated rental income 571 462 1,141
– Did not generate rental income 38 69 109
Cost of stocks sold 3,758 4,198 8,658
Write-down of stocks and work in progress 21 17 51
Write-down of properties held for development 29 – 77
Depreciation of property, plant and equipment (note 10) 425 366 764
Amortisation of
– Leasehold land and land use rights (note 10) 3 3 7
– Intangible assets (note 11) 8 7 14
– Initial leasing costs 13 14 26
Staff costs 1,881 1,763 3,523
Operating lease rentals
– Properties 263 139 292
– Other equipment 19 28 51
6. net FinanCe CHargeS
Refer to page 23 for details of the Group’s net finance charges.
7. SHare oF proFitS leSS loSSeS oF aSSoCiated CoMpanieS
In the 2008 Interim Report, the Group’s interest in Hactl was classified as a ‘held-for-sale investment’ on the basis that
the Group intended to dispose of its interest in Hactl within 12 months, following the decision by the Airport Authority
of Hong Kong (“AA”) on 18th March 2008 to award Cathay Pacific a franchise to construct and operate a new air cargo
terminal at Hong Kong International Airport. At the year-end, Cathay Pacific had applied to the AA to defer the
completion of the new air cargo terminal by two years to mid-2013. As a result, at 31st December 2008 management
no longer expected to dispose of the Group’s interest in Hactl during 2009. An agreement to defer completion was
signed by Cathay Pacific and the AA on 15th January 2009. At 31st December 2008, the Group’s interest in Hactl was
reclassified back to associated company and the equity method of accounting was applied for the entire twelve months
ended 31st December 2008. Accordingly, the consolidated income statement for the six months ended 30th June 2008
has been restated to reflect this treatment.

Notes to the Interim Financial Information
40 Swire pacific limited Interim Report 2009
8. taxation
Six months ended 30th June
Year ended 31st December
2009HK$M
2008HK$M
2008HK$M
Current taxation
Hong Kong profits tax (247) (200) (364)
Overseas taxation (96) (113) (170)
(Under)/over-provisions in prior years (2) – 4
Deferred taxation (note 16)
Changes in Hong Kong tax rate – 1,008 1,008
Changes in fair value of investment properties (85) (1,813) (207)
Origination and reversal of temporary differences (29) (115) (318)
(459) (1,233) (47)
Hong Kong profits tax is calculated at 16.5% (2008: 16.5%) on the estimated assessable profits for the period. Overseas
tax is calculated at tax rates applicable in jurisdictions in which the Group is assessable for tax.
The Group’s share of jointly controlled and associated companies’ tax charge for the six months ended 30th June 2009
of HK$456 million (30th June 2008: HK$125 million; year ended 31st December 2008: HK$187 million) and HK$163
million (30th June 2008: HK$90 million; year ended 31st December 2008: tax credit of HK$384 million) respectively
is included in the share of profits less losses of jointly controlled and associated companies shown in the consolidated
income statement.
9. earningS per SHare (BaSiC and dilUted)
Earnings per share are calculated by dividing the profit attributable to the Company’s shareholders for the period ended
30th June 2009 of HK$3,231 million (30th June 2008: HK$12,341 million; 31st December 2008: HK$5,853 million)
by the weighted average number of 905,578,500 ‘A’ shares and 2,995,220,000 ‘B’ shares in issue during the period
(30th June 2008: 915,564,500 ‘A’ shares and 3,002,870,886 ‘B’ shares; 31st December 2008: 913,214,691 ‘A’ shares
and 3,001,321,686 ‘B’ shares) in the proportion five to one.

Notes to the Interim Financial Information
41
10. property, plant and eqUipMent and leaSeHold land and land USe rigHtS
Property, plantand
equipmentHK$M
Leaseholdland andland use
rightsHK$M
TotalHK$M
Cost
At 1st January 2009 23,131 2,680 25,811
Translation differences 44 – 44
Transferred to investment properties on adoption of revised HKAS 40 (3,887) (488) (4,375)
Additions 979 – 979
Disposals (148) (9) (157)
Other net transfers from investment properties 10 19 29
Amortisation from leasehold land and land use rights capitalised 5 – 5
At 30th June 2009 20,134 2,202 22,336
accumulated depreciation/amortisation
At 1st January 2009 6,121 94 6,215
Translation differences 4 (1) 3
Transferred to investment properties on adoption of revised HKAS 40 – (39) (39)
Charge for the period 425 3 428
Provision for impairment losses 235 – 235
Amortised amount capitalised under property, plant and equipment – 5 5
Disposals (130) (2) (132)
Other transfers to investment properties (1) – (1)
At 30th June 2009 6,654 60 6,714
net book value
At 30th June 2009 13,480 2,142 15,622
At 1st January 2009 17,010 2,586 19,596
Property, plant and equipment and leasehold land and land use rights are reviewed for impairment wherever events or
changes in circumstances indicate that the carrying amount may not be recoverable. The Directors consider a number
of the hotels in Mainland China and the UK to be impaired at 30th June 2009 as a result of the current condition of
the hotel property market in these locations. The carrying amount of these hotels has been written down by HK$235
million to their recoverable amount, which is the fair value less costs to sell, calculated using the income capitalisation
approach.
Property, plant and equipment includes costs of HK$1,385 million, including advance payments and deposits under
contracts with third parties, in respect of assets under construction (31st December 2008: HK$6,968 million).
Refer to page 6 for details of the Group’s investment properties.

Notes to the Interim Financial Information
42 Swire pacific limited Interim Report 2009
11. intangiBle aSSetS
Goodwill HK$M
Computer software
HK$M Total
HK$M
Cost
At 1st January 2009 832 89 921
Translation differences (1) (1) (2)
Additions – 6 6
At 30th June 2009 831 94 925
accumulated amortisation
At 1st January 2009 – 54 54
Charge for the period – 8 8
At 30th June 2009 – 62 62
net book value
At 30th June 2009 831 32 863
At 1st January 2009 832 35 867
12. availaBle-For-Sale aSSetS
30th June2009
HK$M
31st December2008
HK$M
non-current assets
Shares listed in Hong Kong 191 127
Securities listed overseas 222 163
Unlisted investments 10 10
423 300
Current assets
Amount related to disposal of Swire SITA group (note 2(c)) 1,888 1,888

Notes to the Interim Financial Information
43
13. derivative FinanCial inStrUMentS
The Group uses derivative financial instruments solely for management of underlying risks. The Group has minimised
its exposure to market risk since gains and losses on derivatives offset the losses and gains on the assets, liabilities or
transactions being hedged. It is the policy of the Group not to enter into derivative transactions for speculative purposes.
30th June 2009
assets HK$M
liabilities HK$M
Cross-currency swaps – cash flow hedges 262 7
Interest rate swaps – cash flow hedges – 109
Interest rate swaps – fair value hedges 27 –
Forward foreign exchange contracts – cash flow hedges 7 56
Interest rate swaps – not qualifying as hedges – –
total 296 172
Less non-current portion:
Cross-currency swaps – cash flow hedges 262 7
Interest rate swaps – cash flow hedges – 104
Interest rate swaps – fair value hedges 27 –
Forward foreign exchange contracts – cash flow hedges – 25
289 136
Current portion 7 36
31st December 2008
Assets HK$M
Liabilities HK$M
Cross-currency swaps – cash flow hedges 74 103
Interest rate swaps – cash flow hedges – 147
Interest rate swaps – fair value hedges 26 –
Forward rate agreements – cash flow hedges – 2
Forward rate agreements – not qualifying as hedges – 5
Forward foreign exchange contracts – cash flow hedges 6 52
Interest rate swaps – not qualifying as hedges – 1
total 106 310
Less non-current portion:
Cross-currency swaps – cash flow hedges 74 103
Interest rate swaps – cash flow hedges – 142
Interest rate swaps – fair value hedges 26 –
Forward foreign exchange contracts – cash flow hedges 3 29
103 274
Current portion 3 36
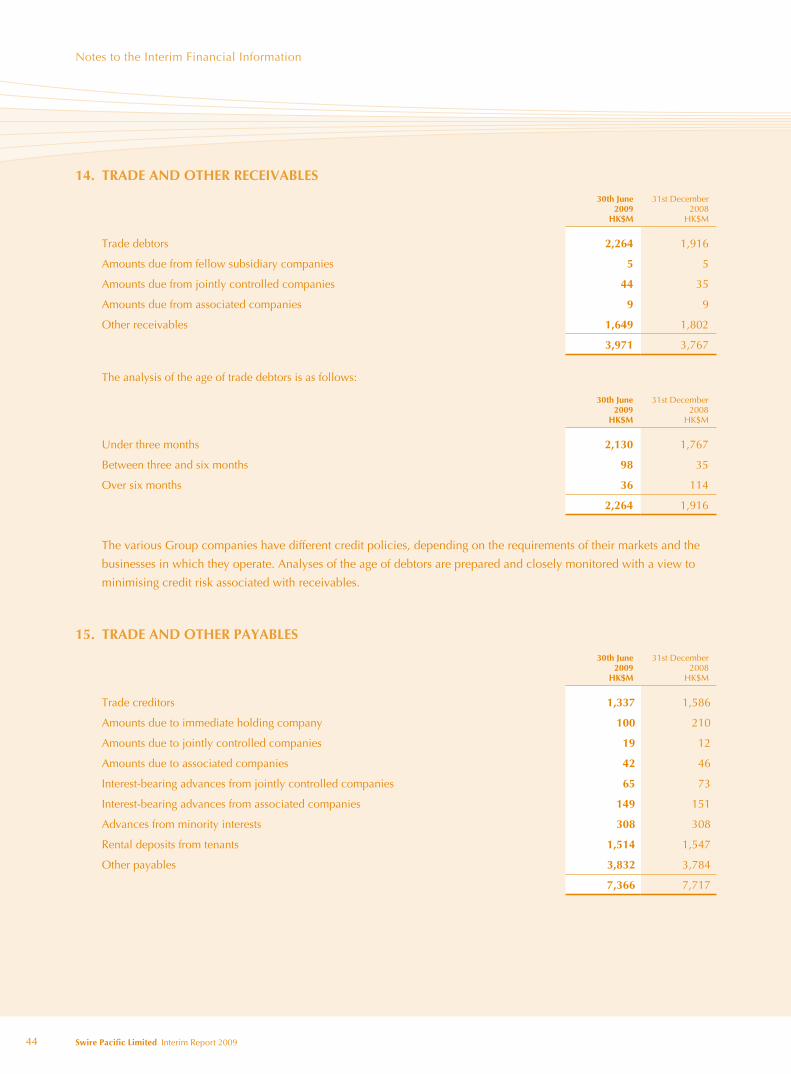
Notes to the Interim Financial Information
44 Swire pacific limited Interim Report 2009
14. trade and otHer reCeivaBleS
30th June2009
HK$M
31st December2008
HK$M
Trade debtors 2,264 1,916
Amounts due from fellow subsidiary companies 5 5
Amounts due from jointly controlled companies 44 35
Amounts due from associated companies 9 9
Other receivables 1,649 1,802
3,971 3,767
The analysis of the age of trade debtors is as follows:
30th June2009
HK$M
31st December2008
HK$M
Under three months 2,130 1,767
Between three and six months 98 35
Over six months 36 114
2,264 1,916
The various Group companies have different credit policies, depending on the requirements of their markets and the
businesses in which they operate. Analyses of the age of debtors are prepared and closely monitored with a view to
minimising credit risk associated with receivables.
15. trade and otHer payaBleS
30th June2009
HK$M
31st December2008
HK$M
Trade creditors 1,337 1,586
Amounts due to immediate holding company 100 210
Amounts due to jointly controlled companies 19 12
Amounts due to associated companies 42 46
Interest-bearing advances from jointly controlled companies 65 73
Interest-bearing advances from associated companies 149 151
Advances from minority interests 308 308
Rental deposits from tenants 1,514 1,547
Other payables 3,832 3,784
7,366 7,717

Notes to the Interim Financial Information
45
15. trade and otHer payaBleS (continued)
The analysis of the age of trade creditors is as follows:
30th June2009
HK$M
31st December2008
HK$M
Under three months 1,212 1,450
Between three and six months 100 102
Over six months 25 34
1,337 1,586
16. deFerred taxation
The movement on the net deferred tax liabilities account is as follows:
HK$M
At 1st January 2009 17,087
Translation differences (3)
Charged to income statement (note 8) 114
Charged to other comprehensive income 52
At 30th June 2009 17,250
Represented by:
Deferred tax assets (410)
Deferred tax liabilities 17,660
17,250

Notes to the Interim Financial Information
46 Swire pacific limited Interim Report 2009
17. SHare Capital
Company
‘A’ shares ofHK$0.60 each
‘B’ shares ofHK$0.12 each
‘A’ sharesHK$M
‘B’ sharesHK$M
TotalHK$M
authorised:
At 30th June 2009 and 31st December 2008 1,140,000,000 3,600,000,000 684 432 1,116
issued and fully paid:
At 30th June 2009 and 31st December 2008 905,578,500 2,995,220,000 543 360 903
18. reServeS
Revenue reserve* HK$M
Sharepremiumaccount
HK$M
Capitalredemption
reserveHK$M
Investmentrevaluation
reserveHK$M
Cash flowhedge
reserveHK$M
TranslationreserveHK$M
TotalHK$M
At 1st January 2009
as originally stated 133,079 342 49 406 (889) 1,497 134,484
adjustment on adoption of HK(IFRIC)-Int 13 (646) – – – – – (646)
as restated 132,433 342 49 406 (889) 1,497 133,838
profit for the period 3,231 – – – – – 3,231
other comprehensive income
Cash flow hedges
– recognised during the period – – – – 267 – 267
– deferred tax – – – – (52) – (52)
– transferred to net finance charges – – – – 9 – 9
– transferred to initial cost of non-financial assets – – – – 37 – 37
Net fair value gains on available- for-sale assets recognised during the period – – – 122 – – 122
Share of other comprehensive income of jointly controlled and associated companies – – – 4 85 16 105
Net translation differences on foreign operations – – – – – 62 62
total comprehensive income for the period 3,231 – – 126 346 78 3,781
2008 final dividend (2,227) – – – – – (2,227)
At 30th June 2009 133,437 342 49 532 (543) 1,575 135,392
* The revenue reserve includes HK$903 million representing the proposed interim dividend for the period (31st December 2008: HK$2,227 million representing the proposed final dividend for 2008).

Notes to the Interim Financial Information
47
19. Minority intereStS
HK$M HK$M
At 1st January 2009 1,447
Share of profits less losses for the period (6)
Share of fair value gains on available-for-sale assets 1
Share of other comprehensive income of jointly controlled companies 1
Share of translation differences on foreign operations (1)
Share of total comprehensive income for the period (5)
Dividends paid and payable (32)
At 30th June 2009 1,410
20. Capital CoMMitMentS
30th June2009
HK$M
31st December2008
HK$M
Outstanding capital commitments at the end of the period in respect of:
(a) Property, plant and equipment
Contracted for 3,427 7,691
Authorised by Directors but not contracted for 868 1,892
(b) Investment properties
Contracted for 4,217 1,217
Authorised by Directors but not contracted for 1,865 904
(c) The Group’s interests in jointly controlled companies
Contracted for 131 255
Authorised by Directors but not contracted for 4,476 5,133

Notes to the Interim Financial Information
48 Swire pacific limited Interim Report 2009
21. ContingenCieS
(a) Guarantees outstanding at the end of the period in respect of bank loans and other liabilities of jointly controlled
companies totalled HK$888 million (31st December 2008: HK$1,390 million).
(b) Contingent tax liabilities
Certain wholly-owned Group companies have been unable to finalise their liability to profits tax in respect of
the years 1997/98 to 2003/04 inclusive as a consequence of queries raised by the Hong Kong Inland Revenue
Department (“IRD”). These queries relate to the deductibility, in the assessment of profits tax, of interest on
borrowings of those companies during the periods under review.
A number of discussions have taken place between the companies and the IRD to understand the precise nature of
the IRD queries. However, at this stage there is insufficient information available to determine reliably the ultimate
outcome of the IRD’s review with an acceptable degree of certainty. Consequently no provision has been
recognised in these results for any amounts that may fall due in regard to these queries.
The IRD has issued Notices of Assessment totalling HK$440 million, the estimated contingent liability, in respect of
their queries for the years under review. The companies involved have objected to these assessments and the IRD
has agreed to unconditional holdover of the assessments.
In addition, the estimated interest which would (assuming the relevant Group companies are found liable to pay
the tax demanded) be payable in respect of the Notices of Assessment totalled HK$153 million at 30th June 2009.
(c) Cathay Pacific Airways
Cathay Pacific Airways is the subject of investigations and proceedings in respect of its air cargo operations by
the competition authorities of various jurisdictions, including the European Union, Canada, Australia, Switzerland,
Korea and New Zealand. Cathay Pacific Airways has been cooperating with the authorities in their investigations
and, where applicable, vigorously defending itself. The investigations and proceedings are focused on issues
relating to pricing and competition. Cathay Pacific Airways is represented by legal counsel in connection with
these matters.
On 24th December 2007, Cathay Pacific Airways received a Statement of Objections from the European
Commission with regard to its air cargo operations. Cathay Pacific Airways, with the assistance of legal counsel,
has responded.
On 15th December 2008, Cathay Pacific Airways received a Statement of Claim from the New Zealand Commerce
Commission with regard to its air cargo operations. Cathay Pacific Airways, with the assistance of legal counsel,
is evaluating the allegations and will respond.
On 17th July 2009, Cathay Pacific Airways received an Amended Statement of Claim from the Australian
Competition and Consumer Commission with regard to its air cargo operations. Cathay Pacific Airways, with
the assistance of legal counsel, is evaluating the allegations and will respond.

Notes to the Interim Financial Information
49
21. ContingenCieS (continued)
Cathay Pacific Airways has been named as a defendant in a number of civil class action complaints in the United
States, Canada and Australia alleging violations of applicable competition laws arising from its conduct relating to
its air cargo operations. In addition, civil class action claims have been filed in the United States alleging violations
of applicable competition laws arising from Cathay Pacific Airways’ conduct relating to certain of its passenger
operations. Cathay Pacific Airways is represented by legal counsel in the actions filed in the United States, Canada
and Australia and is defending those actions.
The investigations, proceedings and civil actions are ongoing and the outcomes are subject to uncertainties. Cathay
Pacific Airways is not in a position at the present time to make a sufficiently reliable estimate of the amount of
any potential liability. Accordingly no provision has been made in the accounts of Cathay Pacific Airways. The
information usually required by HKAS 37 “Provisions, Contingent Liabilities and Contingent Assets” is not disclosed
on the grounds that it can be expected to prejudice seriously the outcomes.
22. related party tranSaCtionS
There are agreements for services (“Agreements”), in respect of which John Swire & Sons (H.K.) Limited (“JSSHK”)
provides services to various companies in the Group and under which costs are reimbursed and fees payable. In return
for these services, JSSHK receives annual fees calculated (A) in the case of the Company, as 2.5% of the dividends
receivable from associated and jointly controlled companies of the Company, where there are no agreements for
services with such companies, and (B) in the case of its subsidiary and associated companies with such agreements, as
2.5% of their relevant consolidated profits before taxation and minority interests after certain adjustments. The current
Agreements commenced on 1st January 2008 and will last for three years until 31st December 2010. For the period
ended 30th June 2009, service fees payable amounted to HK$89 million (2008: HK$85 million). Expenses of HK$80
million (2008: HK$78 million) were reimbursed at cost; in addition, HK$110 million (2008: HK$86 million) in respect
of shared administrative services was reimbursed.
The above transactions are continuing connected transactions, in respect of which the Company has complied with the
disclosure requirements in accordance with Chapter 14A of the Listing Rules.
The Company’s wholly-owned subsidiary Redhill Properties Limited entered into a sale and purchase agreement with
Fine Bloom Limited on 26th June 2009 for the sale of the house located at 36A Island Road, Hong Kong to Fine Bloom
Limited for an aggregate cash consideration of HK$117.5 million. As Fine Bloom Limited was wholly-owned by K G
Kerr, a former Director of the Company, the transaction under the sale and purchase agreement constituted a
connected transaction for the Company, in respect of which an announcement dated 26th June 2009 was published.
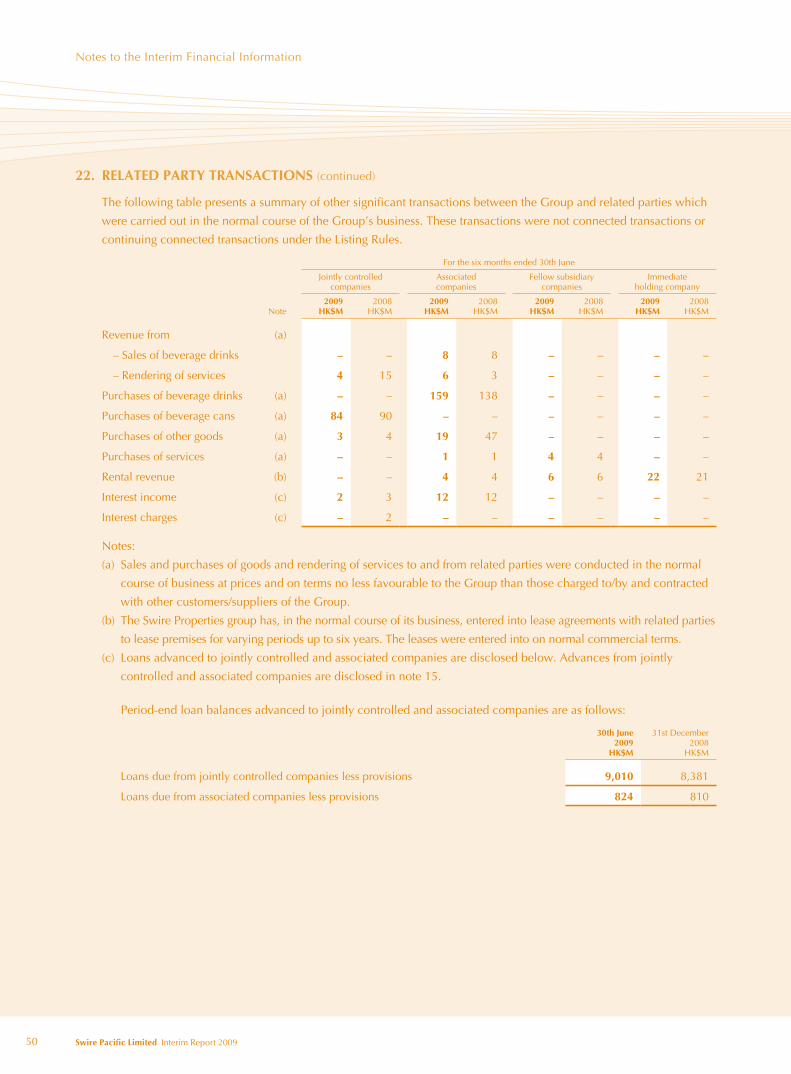
Notes to the Interim Financial Information
50 Swire pacific limited Interim Report 2009
22. related party tranSaCtionS (continued)
The following table presents a summary of other significant transactions between the Group and related parties which
were carried out in the normal course of the Group’s business. These transactions were not connected transactions or
continuing connected transactions under the Listing Rules.
For the six months ended 30th June
Jointly controlledcompanies
Associatedcompanies
Fellow subsidiarycompanies
Immediateholding company
Note2009
HK$M2008
HK$M2009
HK$M2008
HK$M2009
HK$M2008
HK$M2009
HK$M2008
HK$M
Revenue from (a)
– Sales of beverage drinks – – 8 8 – – – –
– Rendering of services 4 15 6 3 – – – –
Purchases of beverage drinks (a) – – 159 138 – – – –
Purchases of beverage cans (a) 84 90 – – – – – –
Purchases of other goods (a) 3 4 19 47 – – – –
Purchases of services (a) – – 1 1 4 4 – –
Rental revenue (b) – – 4 4 6 6 22 21
Interest income (c) 2 3 12 12 – – – –
Interest charges (c) – 2 – – – – – –
Notes:
(a) Sales and purchases of goods and rendering of services to and from related parties were conducted in the normal
course of business at prices and on terms no less favourable to the Group than those charged to/by and contracted
with other customers/suppliers of the Group.
(b) The Swire Properties group has, in the normal course of its business, entered into lease agreements with related parties
to lease premises for varying periods up to six years. The leases were entered into on normal commercial terms.
(c) Loans advanced to jointly controlled and associated companies are disclosed below. Advances from jointly
controlled and associated companies are disclosed in note 15.
Period-end loan balances advanced to jointly controlled and associated companies are as follows:
30th June2009
HK$M
31st December2008
HK$M
Loans due from jointly controlled companies less provisions 9,010 8,381
Loans due from associated companies less provisions 824 810

Supplementary information
51
Corporate governanCe
The Company has complied with all the code provisions and has met most of the recommended best practices set out in the
Code on Corporate Governance Practices (“the CG Code”) contained in Appendix 14 to the Rules Governing the Listing of
Securities (“the Listing Rules”) on The Stock Exchange of Hong Kong Limited (“the Stock Exchange”) throughout the
accounting period covered by the Interim Report.
The Company has adopted codes of conduct regarding securities transactions by Directors and by relevant employees
(as defined in the CG Code) on terms no less exacting than the required standard set out in the Model Code for Securities
Transactions by Directors of Listed Issuers (“the Model Code”) contained in Appendix 10 to the Listing Rules.
On specific enquiries made, all Directors have confirmed that, in respect of the accounting period covered by the Interim
Report, they have complied with the required standard set out in the Model Code and the Company’s code of conduct
regarding Directors’ securities transactions.
The 2009 interim results have been reviewed by the Audit Committee of the Company and by the external auditors.
SHare Capital
During the period under review, the Group did not purchase, sell or redeem any of its shares.
direCtorS’ partiCUlarS
Changes in the particulars of the Directors are set out as follows:
1. M Cubbon has been appointed Chief Executive Officer of Swire Properties Limited and has resigned as a Director of
Hong Kong Aircraft Engineering Company Limited and Cathay Pacific Airways Limited and as Chairman of Swire
Beverages Limited.
2. P A Kilgour has been appointed as a Director of Cathay Pacific Airways Limited.
3. M Leung has been appointed as an Executive Director, Vice Chairman and Chief Executive of Hang Seng Bank Limited,
a Non-Executive Director of The Hongkong and Shanghai Banking Corporation Limited, and an Independent
Non-Executive Director of Hutchison Whampoa Limited.
4. C D Pratt has been appointed Chairman of Swire Beverages Limited.

Supplementary Information
52 Swire pacific limited Interim Report 2009
direCtorS’ intereStS
At 30th June 2009, the register maintained under Section 352 of the Securities and Futures Ordinance (“SFO”) showed that
Directors held the following interests in the shares of Swire Pacific Limited and its associated corporations (within the
meaning of Part XV of the SFO), John Swire & Sons Limited, Cathay Pacific Airways Limited and Hong Kong Aircraft
Engineering Company Limited:
Capacity
Swire pacific limited
Beneficial interestTrust
interestTotal no. of shares
Percentage of issued
capital (%) NotePersonal Family
‘a’ shares
P N L Chen – 2,000 – 2,000 0.0002 –
P A Johansen 31,500 – – 31,500 0.0035 –
C D Pratt 21,000 – – 21,000 0.0023 –
M B Swire 58,791 – – 58,791 0.0065 –
M C C Sze 6,000 – – 6,000 0.0007 –
‘B’ shares
P N L Chen 65,000 10,142 – 75,142 0.0025 –
D Ho 100,000 – – 100,000 0.0033 –
P A Johansen 200,000 – – 200,000 0.0067 –
C Lee 750,000 – 21,605,000 22,355,000 0.7464 1
C D Pratt 50,000 – – 50,000 0.0017 –
M B Swire 2,241,483 – 3,832,554 6,074,037 0.2028 2
Capacity
John Swire & Sons limited
Beneficial interestTrust
interestTotal no. of shares
Percentage of issued
capital (%) NotePersonal Family
ordinary shares of £1
Baroness Dunn 8,000 – – 8,000 0.01 –
M B Swire 2,759,273 – 17,620,819 20,380,092 20.38 2
8% cum. preference shares of £1
Baroness Dunn 2,400 – – 2,400 0.01 –
M B Swire 837,101 – 5,175,441 6,012,542 20.04 2
Cathay pacific airways limited
Beneficial interestTotal no.of shares
Percentage of issued
capital (%)Personal Family
ordinary shares
P N L Chen 9,000 – 9,000 0.00023
A N Tyler 5,000 – 5,000 0.00013

Supplementary Information
53
direCtorS’ intereStS (continued)
Hong Kong aircraft engineering Company limited
Beneficial interestTotal no.of shares
Percentage of issued
capital (%)Personal Family
ordinary shares
T G Freshwater 10,000 1,200 11,200 0.0067
J R Slosar 10,000 – 10,000 0.0060
M C C Sze 12,800 – 12,800 0.0077
Notes:
1. All the Swire Pacific Limited ‘B’ shares held by C Lee under “Trust interest” are held by him as beneficiary of trusts.
2. M B Swire is a trustee of trusts which hold 6,297,483 ordinary shares and 1,757,039 preference shares in John Swire & Sons Limited and 2,931,822 ‘B’ shares of Swire Pacific Limited included under “Trust interest” and does not have any beneficial interest in those shares.
Other than as stated above, no Director or chief executive of the Company had any interest or short position, whether
beneficial or non-beneficial, in the shares or underlying shares and debentures of the Company or any of its associated
corporations (within the meaning of Part XV of the SFO).
SUBStantial SHareHolderS’ and otHerS’ intereStS
The register of substantial shareholders maintained under Section 336 of the SFO shows that as at 30th June 2009, the
Company had been notified of the following interests and short position in the Company’s shares:
‘A’ shares
Percentageof issued
capital (%) ‘B’ shares
Percentageof issued
capital (%) Note
long position
John Swire & Sons Limited 171,652,638 18.96 2,038,165,765 68.05 1, 8
Franklin Resources, Inc. 103,228,390 11.03 – – 2
J.P. Morgan Chase & Company 71,729,830 7.92 – – 3
Commonwealth Bank of Australia 64,100,000 7.07 – – 4
The Northern Trust Company (ALA) 54,506,860 6.02 – – 5
Aberdeen Asset Management plc – – 330,292,362 11.00 6
Short position
J.P. Morgan Chase & Company 554,650 0.06 – – 7
Notes:
1. John Swire & Sons Limited is deemed to be interested in a total of 171,652,638 ‘A’ shares and 2,038,165,765 ‘B’ shares of the Company as at 30th June 2009, comprising:
(a) 12,632,302 ‘A’ shares and 37,597,019 ‘B’ shares held directly by its wholly-owned subsidiary Taikoo Limited;
(b) 39,580,336 ‘A’ shares and 1,482,779,167 ‘B’ shares held directly by its wholly-owned subsidiary John Swire & Sons (H.K.) Limited; and
(c) the following shares held directly by wholly-owned subsidiaries of John Swire & Sons (H.K.) Limited: 114,272,500 ‘A’ shares and 95,272,500 ‘B’ shares held by Elham Limited, 2,055,000 ‘B’ shares held by Canterbury Holdings Limited, 5,167,500 ‘A’ shares and 321,240,444 ‘B’ shares held by Shrewsbury Holdings Limited and 99,221,635 ‘B’ shares held by Tai-Koo Limited.
2. This notification was filed under the repealed Securities (Disclosure of Interests) Ordinance and details of the capacities in which the shares are held were not given.
3. The shares held by J.P. Morgan Chase & Company are held in the following capacities:
Capacity No. of shares
Beneficial owner 1,177,523
Investment manager 13,489,610
Custodian Corporation/Lending agent 57,062,697

Supplementary Information
54 Swire pacific limited Interim Report 2009
SUBStantial SHareHolderS’ and otHerS’ intereStS (continued)
Notes: (continued)
4. The interest in these shares was attributable to wholly-owned controlled corporations of Commonwealth Bank of Australia.
5. This notification was filed as a notice under Section 5(4) of the Securities and Futures (Disclosure of Interests – Securities Borrowing and Lending) Rules. Details of the capacities in which the shares are held were not given.
6. Aberdeen Asset Management plc is interested in these shares in its capacity as investment manager. These include shares in which wholly-owned controlled corporations of Aberdeen Asset Management plc are interested.
7. This short position is held in the capacity as beneficial owner and includes holdings in the following categories of derivatives:
Category of derivatives No. of shares
Cash settled listed derivatives 53,650
Physically settled unlisted derivatives 200,000
8. At 30th June 2009, the Swire group owned interests in shares of the Company representing 38.50% of the issued capital and 56.65% of the voting rights.

Financial Calendar and information for investors
55
Financial Calendar 2009
Interim Report sent to shareholders 20th August
‘A’ and ‘B’ shares trade ex-dividend 15th September
Share registers closed 17th – 22nd September
Payment of 2009 interim dividends 5th October
Annual results announcement March 2010
Annual General Meeting May 2010
registered office
Swire Pacific Limited
35th Floor, Two Pacific Place
88 Queensway
Hong Kong
registrars
Computershare Hong Kong Investor Services Limited
Room 1806-1807
18th Floor, Hopewell Centre
183 Queen’s Road East
Hong Kong
Website: www.computershare.com
depositary
The Bank of New York Mellon
BNY Mellon Shareowner Services
P.O. Box 358516
Pittsburgh, PA 15252-8516
USA
Website: www.bnymellon.com\shareowner
E-mail: [email protected]
Tel: Calls within USA – toll free: 1-888-BNY-ADRS
International callers: 1-201-680-6825
Stock Codes ‘a’ ‘B’
Hong Kong Stock Exchange 19 87
ADR SWRAY SWRBY
Except for voting rights, which are equal, the entitlements of
‘A’ and ‘B’ shareholders are in the proportion 5 to 1.
auditors
PricewaterhouseCoopers
investor relations
E-mail: [email protected]
public affairs
E-mail: [email protected]
Tel: (852) 2840-8098
Fax: (852) 2526-9365
Website: www.swirepacific.com
request for Feedback
In order that we may improve our reporting, we
would be grateful to receive your comments on our
public announcements and disclosures via e-mail to


DESIGN:
FORMAT LIMITED
www.format.com.hk
This Interim Report is printed on FSC certified paper, using vegetable oil-based inks.

www.swirepacific.com
Swire Pacific Limited2009 Interim Report
Stock Codes: A Shares 00019 B Shares 00087
SWIRE Interim Cover_ENG_210mm(w)x 285mm(h) KC YM