Embed Size (px)
Citation preview
Process Analysis for RWM –Incoming Records Management
ICAO Core Team
EDRMS Transformation

Outline
• Main Processes and Database
• Analysis Population
• Key Parameters
• Resource Utilization

The Processes –Incoming Records Operations
Maintenance Operations

The Database - REGIS
“Bring Forward” Registry File
Transfer of Enclosure
Registry File Transfer
Completion of Action on Registry
File
Incoming Statistics

Incoming Records Statistics
0
500
1000
1500
2000
2500
3000
3500
4000
1 2 3 4 5 6 7 8 9 10 11 12
2002
2003
2004
2005
2006
2007
2008
2009
2010
2011
File_ID Count
OF/F 2085
A2/45.21 1401
A2/45.24.2 1162
AN2/16 700
A2/45.24 459
TC2/3.107 (03/016)
415
EC2/16.11 413
A2/45.24.12 395
SA37/1 378
A2/45.24.1 333
TC2/3.38 (10/801)
298
LE3/41.2 263
A2/45.24.6 263
AN6/12 252
TC9/1.883 251
Files with most received records
Total Received Records Per Month for the analysis sample data

Records Register Updates
File_ID Count
AN2/16 247
SA37/1 217
EC2/16.11 161
TC2/3.38 (10/801)
158
AN6/12 151
A11/3.1.2 130
TC2/3.107 (03/016)
126
TC2/3.55 (10/801)
118
LM4/2 108
TC9/1.701.7 (01/801)
101
TC2/3.27 (05/801)
90
AN8/5 88
AS8/7 81
AN4/9.1.1 76
OF/F 71
2010 Files with most Updates

Records’ Enclosure Updates
0.00
50.00
100.00
150.00
200.00
250.00
300.00
Records’ Enclosure Updates with 50% Control Limits
Average Daily Imperfections
Sample Mean
Lower Control Limit
Upper Control Limit
File_ID Count
OF/F (Pseudo File) 43
A2/45.24.6 38
TC2/3.27 (05/801) 36
TC2/3.32 (10/801) 22
TC2/3.47 (08/801) 18
TC2/3.38 (10/801) 18
A10/15 18
AN6/12 14
AN21/6 14
AN2/16 12
A2/45.24.2 11
TC2/3.49 (07/801) 10
LM4/2 9
EC6/22 8
ENV3/3 8
AS8/16.30.CONF 7
2010 Files with most updates

Volume Open Date
File_ID Count
TC2/3.38 (10/801) 9
TC2/3.55 (10/801) 7
LE3/41.2 7
TC2/3.107 (03/016) 6
AN2/16 5
EC2/16.11 4
A2/45.24.2 4
SA37/1 3
TC2/3.165 (88/TF) 3
SWG5/1.4.1 3
TC2/3.102 (10/801) 3
A11/2.3.1 3
TC2/3.49 (07/801) 3
AN19/9.50.CONF 3
TC2/3.27 (05/801) 3
A2/45.24 3
0.00
20.00
40.00
60.00
80.00
100.00
120.00
140.00
Volumes Opened with 50% Control Limits
Average Daily Imperfections
Sample Mean
Lower Control Limit
Upper Control Limit
2010 - Files with most volumes opened

Volume Record Updates
100.00
120.00
140.00
160.00
180.00
200.00
220.00
240.00
260.00
280.00
300.00
Volume Record Updates with 50% Control Limits
Average Daily Imperfections
Sample Mean
Lower Control Limit
Upper Control Limit
File_ID Count
TC9/1.790.3 45
TC2/3.1 (GEN) 42
TC2/3.27 (05/801) 39
TC2/3.13 (93/018) 34
EC2/20.3.2.CONF 33
TC1/12.1 32
A1/39 30
EC7/8 29
TC9/1.800 26
TC1/51 26
TC2/3.111 (02/801) 25
TC2/3.107 (96/002) 24
TC1/46 24
TC2/3.47 (03/902) 23
TC2/3.19 (97/015) 23
A13/9 23
2010 - Files with most Updates
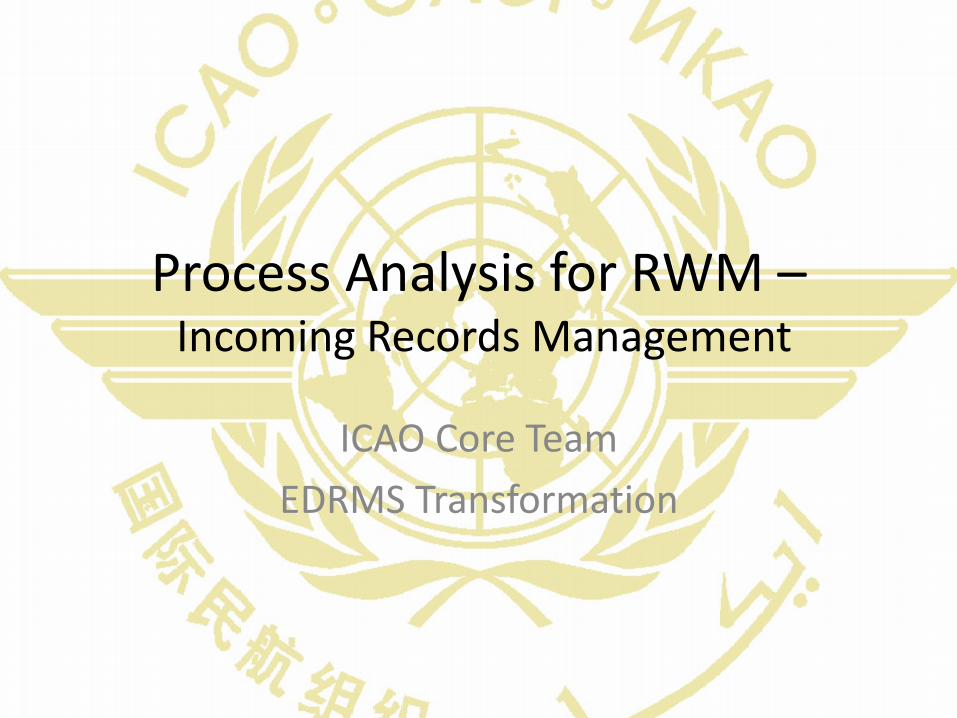
Bring Forward Updates
0.00
2.00
4.00
6.00
8.00
10.00
12.00
14.00
16.00
Bring Forward Updates with 50% Control Limits
Average Daily Imperfections
Sample Mean
Lower Control Limit
Upper Control LimitFile_ID Count
S2/3.1 1
E5/1.65 1
E5/1.64 1
E4/50 1
E4/43 1
E4/197 1
E4/172 1
E4/150 1
E4/127 1
E3/13.2 1
E2/51 1
E2/2.7 1
A14/2.3 1
2010 - Files with most updates
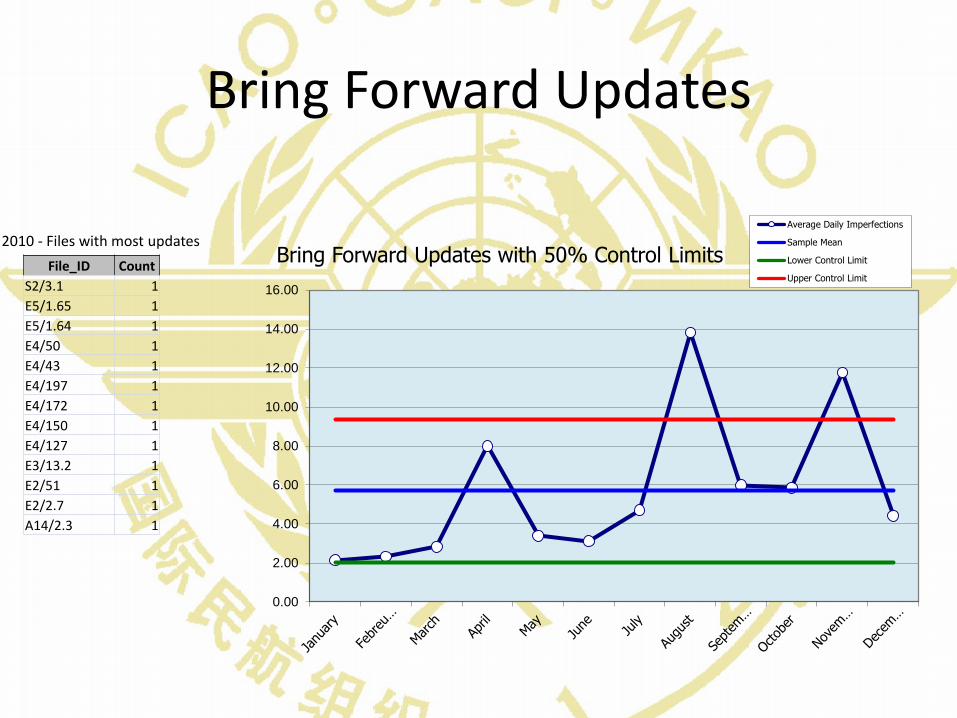
Percentage of Incoming Records
-0.10
0.10
0.30
0.50
0.70
0.90
1.10
1.30
1.50
1 2 3 4 5 6 7 8 9 10 11 12
Record Register Update
Enclosure Record Update
Volume Open
Volume Records Update
Forward Record Update

The Simulation
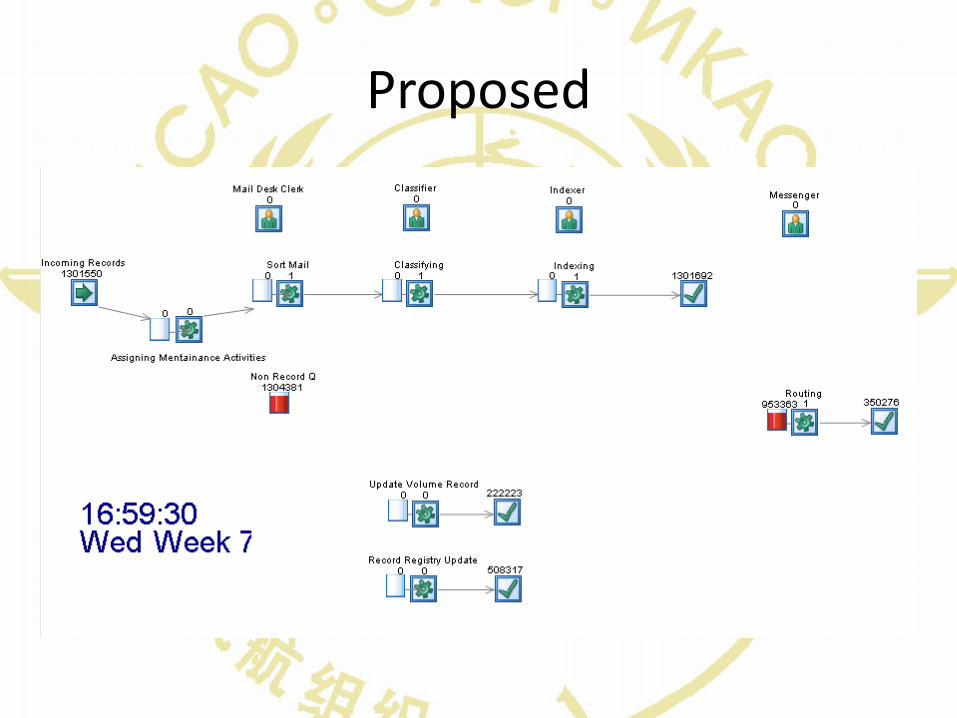
Proposed

Simulation Results
Conclusion and future direction
• Access to workflow level employees
• Trend Analysis
• Dollar savings
• Carbon Footprint


![ManagingChange2012 - 20120112 for Conference.ppt€¦ · Title: Microsoft PowerPoint - ManagingChange2012 - 20120112 for Conference.ppt [Compatibility Mode] Author: NHartgraves Created](https://img.pdfslide.us/doc/110x75/5e99c7bfb901035b42489989/managingchange2012-20120112-for-title-microsoft-powerpoint-managingchange2012.jpg)