Embed Size (px)
Citation preview

2012 SUMMARY OF CALIFORNIA LAND SALES
23rd Annual LA/OC Market Trends Seminar
Appraisal Institute – Southern California ChapterThursday, January 28, 2016 – 10:15 a.m.
Garden Grove, CA
Presenter:
Tom Reimers
President – CA Division
Land Advisors Organization
2015/2016 Land Market Update

135 121 85 79
$1.51
$1.40
$0.71
$1.05
$-
$0.20
$0.40
$0.60
$0.80
$1.00
$1.20
$1.40
$1.60
Q1-2015 Q2-2015 Q3-2015 Q4-2015
0
20
40
60
80
100
120
140
160
Bill
ion
s o
f $
in S
ales
Nu
mb
er o
f Tr
ansa
ctio
ns
# of Deals Total Consideration
2015 Headline NumbersCALIFORNIA LAND SALES
Source: Land Advisors Organization research
420 Total Transactions (-27.6%)
$4.66B Total Sales (-8.5%)
$11.1M Avg. SP (+26.3%)
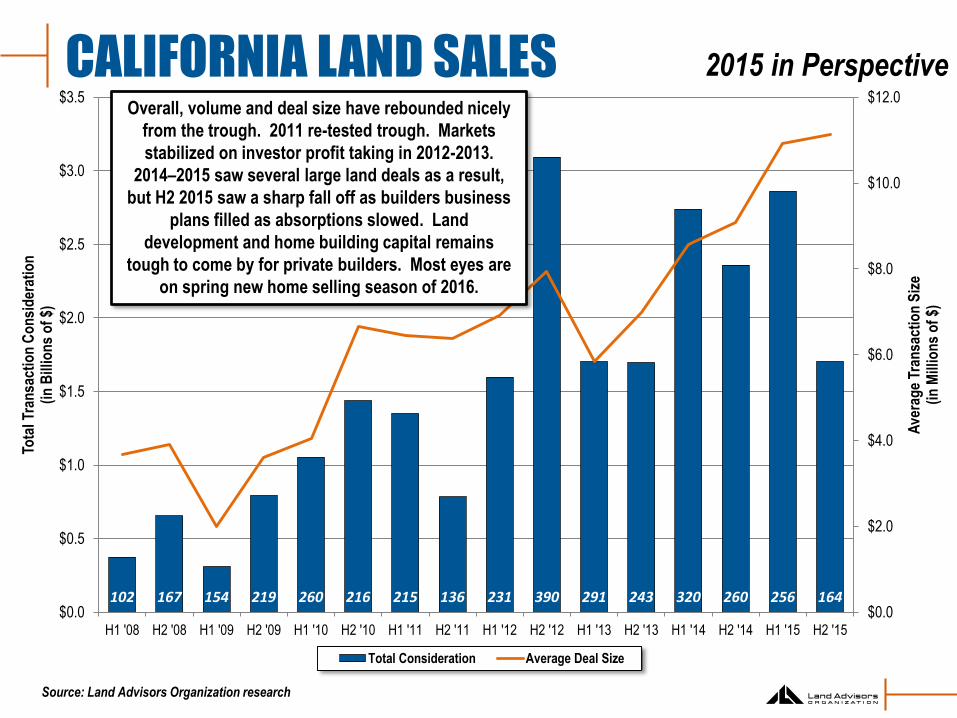
102 167 154 219 260 216 215 136 231 390 291 243 320 260 256 164$0.0
$2.0
$4.0
$6.0
$8.0
$10.0
$12.0
$0.0
$0.5
$1.0
$1.5
$2.0
$2.5
$3.0
$3.5
H1 '08 H2 '08 H1 '09 H2 '09 H1 '10 H2 '10 H1 '11 H2 '11 H1 '12 H2 '12 H1 '13 H2 '13 H1 '14 H2 '14 H1 '15 H2 '15
Ave
rag
e Tr
ansa
ctio
n S
ize
(in
Mill
ion
s o
f $)
Tota
l Tra
nsa
ctio
n C
on
sid
erat
ion
(in
Bill
ion
s o
f $)
Total Consideration Average Deal Size
Overall, volume and deal size have rebounded nicely
from the trough. 2011 re-tested trough. Markets
stabilized on investor profit taking in 2012-2013.
2014–2015 saw several large land deals as a result,
but H2 2015 saw a sharp fall off as builders business
plans filled as absorptions slowed. Land
development and home building capital remains
tough to come by for private builders. Most eyes are
on spring new home selling season of 2016.
CALIFORNIA LAND SALES
Source: Land Advisors Organization research
2015 in Perspective

S. CALIFORNIA LOT VALUES
Source: Land Advisors Organization research
2015 in Perspective
-60.0%
-40.0%
-20.0%
0.0%
20.0%
40.0%
60.0%
80.0%Q
1 2
00
4
Q2
20
04
Q3
20
04
Q4
20
04
Q1
20
05
Q2
20
05
Q3
20
05
Q4
20
05
Q1
20
06
Q2
20
06
Q3
20
06
Q4
20
06
Q1
20
07
Q2
20
07
Q3
20
07
Q4
20
07
Q1
20
08
Q2
20
08
Q3
20
08
Q4
20
08
Q1
20
09
Q2
20
09
Q3
20
09
Q4
20
09
Q1
20
10
Q2
20
10
Q3
20
10
Q4
20
10
Q1
20
11
Q2
20
11
Q3
20
11
Q4
20
11
Q1
20
12
Q2
20
12
Q3
20
12
Q4
20
12
Q1
20
13
Q2
20
13
Q3
20
13
Q4
20
13
Q1
20
14
Q2
20
14
Q3
20
14
Q4
20
14
Q1
20
15
Q2
20
15
Q3
20
15
Q4
20
15
Fin
ish
ed L
ot
Val
ue
YO
Y C
han
ge
W. Riv. Co San Bern. High Des.
San Bern. Basin Coachella Valley
L.A. Co. - Ant. Valley L.A. Co. - Santa Clarita
Ventura Co. San Diego

Avg. Value Peak-> Trough-> Current as Year-Over-Year Lot Value Change
AREA Q4 '15 Peak Trough Trough Current % of Peak Q4 ‘14 Q1 ‘15 Q2 ‘15 Q3 ‘15 Q4 ’15
NORTHERN CENTRAL VALLEY
(14 Markets)$132,917 $236,250 $55,000 (76.8%) 113.4% 47.6% 13.3% 12.3% 10.8% 16.4% 14.7%
BAY AREA
(15 Markets)$486,563 -- $185,000 -- 188.4% -- 12.6% 11.7% 13.1% 20.8% 16.7%
LOWER CENTRAL VALLEY
(10 Markets)$71,000 $115,000 $44,850 (58.6%) 56.9% 67.0% 11.6% 0.0% 0.0% 0.0% 0.0%
VENTURA CO.
(8 Markets)$235,625 $544,000 $189,000 (64.4%) 36.9% 48.5% 4.5% 6.0% 6.4% 4.8% 4.8%
LOS ANGELES – ANTELOPE VALLEY
(4 Markets)$77,500 $165,000 $45,000 (72.7%) 71.5% 46.7% (6.2%) (4.9%) 1.4% 1.4% 1.4%
LOS ANGELES – SANTA CLARITA
(4 Markets)$243,750 $313,750 $130,000 (57.7%) 73.8% 72.9% 0.6% (1.7%) 2.4% 4.1% 4.5%
SAN BERNARDINO – HIGH DESERT
(4 Markets)$72,250 $128,750 $41,250 (68.0%) 75.6% 56.1% 0.0% 4.6% 7.6% 2.9% 10.2%
SAN BERNARDINO – BASIN
(11 Markets)$208,182 $282,727 $111,932 (60.5%) 82.1% 71.6% (6.0%) (5.3%) (3.5%) (1.8%) 6.7%
RIVERSIDE – WESTERN
(17 Markets)$140,250 $206,553 $72,395 (65.2%) 92.2% 66.3% (6.1%) (6.2%) (4.1%) (3.1%) 3.3%
RIVERSIDE – COACHELLA
(12 Markets)$168,000 $217,917 $81,708 (64.7%) 105.9% 71.9% 0.0% (1.8%) (2.0%) (2.9%) (4.6%)
SAN DIEGO
(9 Markets)$422,778 -- -- -- -- -- 3.2% 5.8% 6.9% 8.4% 9.1%
CALIFORNIA STATEWIDE
(107 Markets)$223,655 $257,930 $104,746 (63.4%) 89.8% 64.1% 3.2% 3.8% 4.9% 6.3% 7.0%
CALIFORNIA FINISHED LOT VALUE METRICS
Source: Land Advisors Organization research
Selected Regions – 2003 through 2015

0%
10%
20%
30%
40%
50%
60%
Lender Public Builder BK Estate Developer Investor Institution/Govt.
Private Builder
2010 2011 2012 2013 2014 2015
By Seller ProfileCALIFORNIA LAND SALES
Source: Land Advisors Organization research

0%
10%
20%
30%
40%
50%
60%
Public Builder Institution/Govt.
Investor Private Builder Developer
2010 2011 2012 2013 2014 2015
By Buyer ProfileCALIFORNIA LAND SALES
Source: Land Advisors Organization research

By RegionCALIFORNIA LAND SALES
Source: Land Advisors Organization research
0%
10%
20%
30%
40%
50%
60%
70%
Southern California Central California Northern California
2010 2011 2012 2013 2014 2015

By Site ConditionCALIFORNIA LAND SALES
Source: Land Advisors Organization research
0%
10%
20%
30%
40%
50%
60%
70%
80%
Unimproved Partially Improved Finished
2010 2011 2012 2013 2014 2015

By Transaction SizeCALIFORNIA LAND SALES
Source: Land Advisors Organization research
0%
10%
20%
30%
40%
50%
60%
70%
$0 - $3,000,000 $3,000,001 - $5,000,000 $5,000,001 - $10,000,000 +$10,000,001
2010 2011 2012 2013 2014 2015

CALIFORNIA BUILDING PERMITS
Source: Census & Land Advisors Organization research
Region
2015 Current Current % Current %
Annualized
@ 12/1/ 2015 % of Total Peak of Peak Trough of Trough
Bay Area 18,002 20.1% 35,855 50.2% 5,161 348.8%
Central Coast 2,258 2.5% 7,481 30.2% 814 277.4%
Central Valley 7,101 7.9% 39,897 17.8% 4,119 172.4%
Northern California 2,464 2.8% 6,866 35.9% 457 539.2%
Sacramento Region 6,286 7.0% 23,236 27.1% 2,055 305.9%
Southern California 53,255 59.6% 117,541 45.3% 16,441 323.9%
Totals/Averages 89,366 100.0% 230,876 38.7% 29,047 307.7%

PERMIT SCENARIOS THRU 2020
POPULATION GROWTH OF 1,500,000
487,013 New Households
220,234 Units Built 2009-2015
266,779 Remainder 2016-2020
53,355
Average Permits Needed Per Year(2013 = 35,563)
(2014 = 44,277)
(2015 = 53,084)
POPULATION GROWTH OF 2,000,000
649,351 New Households
220,234 Units Built 2009-2015
429,117 Remainder 2016-2020
85,823
Average Permits Needed Per Year(2013 = 35,563)
(2014 = 44,277)
(2015 = 53,084)
POPULATION GROWTH OF 2,500,000
811,688 New Households
220,234 Units Built 2009-2015
591,454 Remainder 2016-2020
118,290
Average Permits Needed Per Year(2013 = 35,563)
(2014 = 44,277)
(2015 = 53,084)
Southern California – Single-Family & Multi-Family Combined
Source: SCAG, SANDAG, Land Advisors Organization research

26,0
50
29,2
19
36,6
66
38,9
79 4
4,5
93
43,5
63
47,2
91
53,9
92
62,1
57
69,8
55
69,6
87
51,9
27
28,8
22
12,7
36
10,2
74
11,5
65
9,7
20
11,6
31
15,0
87
18,0
09
18,9
38
0
10,000
20,000
30,000
40,000
50,000
60,000
70,000
80,000
19
95
19
96
19
97
19
98
19
99
20
00
20
01
20
02
20
03
20
04
20
05
20
06
20
07
20
08
20
09
20
10
20
11
20
12
20
13
20
14
20
15P
Recession
S. CALIFORNIA SINGLE-FAMILY PERMITSRecession
Southern California includes Los Angeles, Orange, San Bernardino, Riverside, and San Diego counties
Source: U.S. Census, Land Advisors Organization research, through November 2015
1995-1999
175,507(35,101/year)
2010-2015p
84,667(14,111/year)
2000-2009
450,304(45,030/year)

5,8
96
6,5
99
10,2
37
10,8
50
17,1
56
20,7
60
20,2
95
18,5
70
24,9
44
29,3
83
22,3
96
25,9
18
22,8
49
15,4
06
5,4
79 7
,623
13,8
73
17,4
31
20,4
76
25,9
82
34,1
45
0
5,000
10,000
15,000
20,000
25,000
30,000
35,000
40,000
19
95
19
96
19
97
19
98
19
99
20
00
20
01
20
02
20
03
20
04
20
05
20
06
20
07
20
08
20
09
20
10
20
11
20
12
20
13
20
14
20
15P
Recession Recession
S. CALIFORNIA MULTI-FAMILY PERMITS
1995-1999
50,738(10,147/year)
2000-2009
206,000(20,600/year)
2010-2015p
118,265(19,711/year)
Southern California includes Los Angeles, Orange, San Bernardino, Riverside, and San Diego counties
Source: U.S. Census, Land Advisors Organization research, through November 2015

31,9
46
35,8
18
46,9
03
49,8
29
61,7
49
64,3
23
67,5
86
72,5
62
87,1
01
99,2
38
92,0
83
77,8
45
51,6
71
28,1
42
15,7
53
19,1
88
23,5
93
29,0
62 35,5
63 4
3,9
91
53,0
84
0
20,000
40,000
60,000
80,000
100,000
120,0001
99
5
19
96
19
97
19
98
19
99
20
00
20
01
20
02
20
03
20
04
20
05
20
06
20
07
20
08
20
09
20
10
20
11
20
12
20
13
20
14
20
15P
Recession Recession
S. CALIFORNIA TOTAL BUILDING PERMITS
1995-1999
226,245(45,249/year)
2000-2009
656,304(65,630/year)
2010-2015p
202,933(33,822/year)
Southern California includes Los Angeles, Orange, San Bernardino, Riverside, and San Diego counties
Source: U.S. Census, Land Advisors Organization research, through November 2015 but annualized

2012 SUMMARY OF CALIFORNIA LAND SALES
Thank you for the opportunity to present today!
Presenter:
Tom Reimers
President – CA Division
Land Advisors Organization
2015/2016 Land Market Update