Embed Size (px)
Citation preview

2012 Recreational Activity Study for Becker County, Minnesota
Results of a June 2012 Survey of Becker County Residents
Center for Social Research at North Dakota State University
September 2012


2012 Recreational Activity Study for Becker County, Minnesota 3
This report, entitled 2012 Recreational Activity Study for Becker County, Minnesota, presents the results of a June 2012 generalizable survey of residents in Becker County, Minnesota. The study was conducted by the Center for Social Research at North Dakota State University on behalf of Becker County. Additional funding for the project was provided by PartnerSHIP 4 Health of Becker, Clay, Otter Tail, and Wilkin counties. We wish to thank the following individuals for their contributions to the study: Becker County Recreational Advisory Committee Board Members Ray Vlasak Dennis Hopman Hank Ludtke Del Bergseth Lonnie Neuner Katherine Warren Karen Mulari Larry Knutson, County Commissioner Gerry Schram, County Commissioner Becker County Economic Development Authority Guy Fischer, Coordinator Becker County Natural Resource Management Martin Wiley, Director of Parks and Recreation Tamarac National Wildlife Refuge Neil Powers, Manager City of Detroit Lakes, Department of Public Works Brad Green, Director PartnerSHIP 4 Health Gina Nolte, Director Karen Nitzkorski, Community Organizer Patrick Hollister, Active Living Planner Cover photos (wildflowers, wilderness trail, and Tamarac National Wildlife Refuge) courtesy of PartnerSHIP 4 Health
PREFACE

2012 Recreational Activity Study for Becker County, Minnesota 4
PREFACE ........................................................................................................................................................................ 3 TABLE OF CONTENTS ..................................................................................................................................................... 4 EXECUTIVE SUMMARY ............................................................................................................................................... 5-6 Introduction ............................................................................................................................................................ 5 Study Design and Methodology ............................................................................................................................. 5 Summary of Survey Results .................................................................................................................................... 5 SURVEY RESULTS ...................................................................................................................................................... 7-23 Recreational Opportunities and Experiences ......................................................................................................... 7
Figure 1. Importance of warm weather activities to Becker County .......................................................... 7 Figure 2. Importance of cold weather activities to Becker County ............................................................ 8 Figure 3. Importance of motorized activities to Becker County ................................................................. 8 Figure 4. Whether respondents participated in warm weather activities within the past two years ........ 9 Figure 5. Whether respondents participated in cold weather activities within the past two years ........ 10 Figure 6. Whether respondents participated in motorized activities within the past two years ............. 10
Figure 7. Among respondents who participated in MOTORIZED recreational activities in Becker County within the past two years, locations of recreational activities .......................... 11 Figure 8. Respondents’ reasons for participating in recreational activities ............................................. 11 Figure 9. Number of times, by season, respondents or members of their household engaged in recreational activities in Becker County .................................................................. 12 Table 1. Number of times, during last two years, respondents and members of their household visited recreational locations in Becker County ....................................................... 13 Figure 10. Level of importance of factors that contribute to respondents’ recreational experience ........ 14 Figure 11. Number of miles respondents are willing to travel to engage in recreational activities in
Becker County ............................................................................................................................ 15 Figure 12. Respondents’ level of satisfaction with areas and amenities in Becker County recreational areas ...................................................................................................................... 15 Figure 13. Among respondents who were not satisfied with areas and amenities within Becker County, reasons for dissatisfaction ................................................................................ 16
Figure 14. Whether Becker County should expand its park system ........................................................... 16 Figure 15. Whether respondents, or members of their household, experienced a conflict or interference while engaging in recreational activity on county-managed land within Becker County ............................................................................................................................ 17 Walkable Communities ........................................................................................................................................ 17
Figure 16. Respondents’ perceptions of the walkability of their community ............................................ 17 Figure 17. Destinations respondents would walk or bicycle to if they were within 15 minutes of home or place of work ............................................................................................................... 18 Figure 18. Respondents’ level of agreement with various non-motorized transportation statements ..... 20
Demographic Information .................................................................................................................................... 21
Figure 19. Respondents’ age ...................................................................................................................... 21 Figure 20. Respondents’ race/ethnicity ...................................................................................................... 21 Figure 21. Respondents’ annual household income before taxes ............................................................. 22
Figure 22. Whether respondents are the parent/primary caregiver of a child or children 18 years of age or younger ...................................................................................................................... 22
Figure 23. Respondents’ gender ................................................................................................................. 23
Additional Comments ........................................................................................................................................... 23 APPENDICES ........................................................................................................................................................... 24-43 Appendix Tables ............................................................................................................................................ 24 Survey Cover Letter ....................................................................................................................................... 39 Survey Instrument ......................................................................................................................................... 40
TABLE OF CONTENTS

2012 Recreational Activity Study for Becker County, Minnesota 5
Introduction The purpose of this generalizable survey was to explore the attitudes, behaviors, and perceptions of Becker County, Minnesota residents regarding active living, recreation, and motorized vehicle usage within the county. These data will assist county leaders in recreational planning while protecting natural resources and long-term sustainability of county-managed land. Study Design and Methodology A generalizable survey was conducted of Becker County residents in June 2012. The survey instrument, developed in collaboration with the Becker County Recreational Advisory Committee (RAC) and PartnerSHIP 4 Health, was four pages in length and contained 19 questions (see Appendices). The survey instrument was designed as a scannable mail survey that was sent to approximately 1,100 randomly selected households in Becker County. The sampling frame, provided by the county auditor, was a list of taxpayers in Becker County. Additional mailings were sent specifically to taxpayers whose address was the city of White Earth in an attempt to increase the response rate of Native Americans. Approval from the Institutional Review Board (IRB) at North Dakota State University was obtained to ensure proper protocol was used and the rights of human subjects maintained. A total of 254 respondents completed and returned the survey for a response rate of 24 percent. This is a generalizable sample with a confidence level of 95 percent and an error rate of plus or minus 6 percent. The survey consisted of questions that focused on residents’ usage of sidewalks and trails, usage of motorized vehicles, how often and where residents engage in recreational activity, recreational opportunities that would encourage active living, and demographic information. Many of the survey questions asked respondents to rate the questions or issues by using a one to five scale (e.g., agreement, satisfaction, importance). The means, which represent an average of the responses, are reported graphically in the body of the report. Means allow us to determine a single measurement of where people stand on an issue and allow us to compare more easily across issues. They also help give a sense of relative agreement, satisfaction, etc., that assists us in priority setting. In cases where responses stand out, the actual frequency is mentioned in the narrative. The distributions of responses are presented in tabular form in the Appendices. Summary of Survey Results Recreational Opportunities and Experiences Using a 1 to 5 scale, with 1 being “not at all important” and 5 being “very important,” respondents were asked to rate the level of importance of various warm weather, cold weather, and motorized recreational activities and experiences to Becker County. Respondents were also asked to indicate whether they or members of their family had participated in the activities within the past two years. The vast majority of respondents indicated they have participated in at least one of the 25 recreational activities listed in the past two years (96.5 percent); half participated in 13 or more (50.0 percent).
Respondents indicated that fishing, walking, swimming, ice fishing/spearing, and touring/sightseeing are the most important recreational activities to Becker County (means range from 4.46 to 4.03). At least 71 percent of respondents said they, or members of their family, participated in these activities within the past two years.
Respondents indicated that touring/sightseeing and water sports are the most important motorized activities (means=4.03 and 3.99, respectively). Approximately 80 percent of respondents said they or members of their family participated in these activities within the past two years.
Among respondents who have participated in motorized activities, half said the locations where
they participated are lakes, followed by 44 percent who said private land and 35 percent who said trails. Three percent said they had participated in motorized activities in wetland areas.
EXECUTIVE SUMMARY

2012 Recreational Activity Study for Becker County, Minnesota 6
At least 63 percent of respondents said they participate in recreational activities for fun, to spend time with family and friends, for relaxation, and for physical activity.
The majority of respondents engage in recreational activities at least five times per season; one in five respondents are actively engaged (i.e., at least 20 activities per season).
The most important factors that contribute to respondents’ recreational experiences are natural
resource protection, scenery and aesthetics, and the environmental impact (means range from 4.13 to 4.02).
The majority of respondents said they are willing to travel at least 20 miles within Becker County
to participate in recreational activities (65 percent); 18 percent said they would travel 60 or more miles.
Becker County areas and amenities that respondents are most satisfied with are parks, picnic
areas, and boat launches (means range from 3.66 to 3.62). Respondents are least satisfied with restrooms (mean=2.96).
When asked for their reasons for dissatisfaction with Becker County areas and amenities, respondents said grooming and repairs are needed (49 percent) and cleaning is needed (43 percent).
When asked whether Becker County should expand its park system, 59 percent said yes.
o Reasons for expanding include: more and safer trails with which to walk, bike, run and rollerblade; expanding would draw more people; and there would be more options or places to visit.
o Reasons for not expanding include: the county needs to keep up or maintain what they have, the county has enough, and the county shouldn’t spend money.
The vast majority of respondents have not experienced a conflict or interference while engaging in recreational activities in Becker County (86 percent).
o Among those who have experienced a conflict, conflicts mentioned include: ATVs in prohibited areas and interference with fishing by jet skis and water skiers.
Walkable Communities
Respondents said their community is walkable (mean=3.76).
Respondents are more likely to walk or bicycle to parks; neighborhood retail and restaurants; trails; the community recreation center; and the post office, public library, or city government office if those destinations were within 15 minutes of their home or place of work.
Respondents have fairly high levels of agreement that increasing non-motorized transportation
(i.e., bicycling and walking) is important for improving public health and the environment, as well as saving money (means range from 3.92 to 3.77).
Respondents also have moderately high levels of agreement that Becker County, and cities and
towns in Becker County, should commit to accommodating non-motorized transportation to the extent feasible on new and reconstructed county and municipal roads (mean=3.67).
Respondents are neutral with respect to cities and towns in Becker County needing more bike
racks and sidewalks (mean=3.24 and mean=3.13, respectively). Demographics
Half of respondents are 45 to 64 years of age; 35 percent are 65 or older. The vast majority of respondents are white (96 percent). The majority of respondents have an annual household income of less than $70,000 before
taxes. One-fourth of respondents have children 18 years of age or younger. Nearly equal proportions of males and females completed the survey.

2012 Recreational Activity Study for Becker County, Minnesota 7
Recreational Opportunities and Experiences Using a 1 to 5 scale, with 1 being “not at all important” and 5 being “very important,” respondents were asked to rate the level of importance of various activities to Becker County categorized by warm weather activities, cold weather activities, and motorized activities. Overall, respondents reported warm weather activities are important to Becker County (Figure 1, Appendix Table 1).
On average, respondents indicated that fishing and walking are very important to Becker County (mean=4.46 and 4.43, respectively); at least 66 percent said they are very important.
Still considered moderately high in importance are the activities of swimming (mean=4.13), hunting and shooting (mean=3.91), camping (mean=3.88), bicycling (mean=3.84), and hiking, backpacking, and picnicking (mean=3.77).
On average, geocaching was considered the least important to Becker County (mean=2.02), followed by skateboarding (mean=2.10), rollerblading (mean=2.30), and horseback riding (mean=2.33). It is important to note that geocaching is a relatively new sport with which not all respondents may be familiar.
Figure 1. Importance of warm weather activities to Becker County
2.02
2.10
2.30
2.33
3.21
3.37
3.46
3.58
3.77
3.84
3.88
3.91
4.13
4.43
4.46
1 2 3 4 5
Geocaching (N=209)
Skateboarding (N=235)
Rollerblading (N=237)
Horseback riding (N=233)
Harvesting/gathering (N=234)
Canoeing, kayaking, tubing (N=237)
Golf/tennis (N=236)
Bird and wildlife watching/nature photography (N=237)
Hiking/backpacking/picnicking (N=235)
Bicycling (N=237)
Camping (N=240)
Hunting/shooting (N=239)
Swimming (N=238)
Walking (N=239)
Fishing (N=238)
Mean (1=not at all important, 5=very important)
SURVEY RESULTS
2012 Recreational Activity Study for Becker County, Minnesota 8
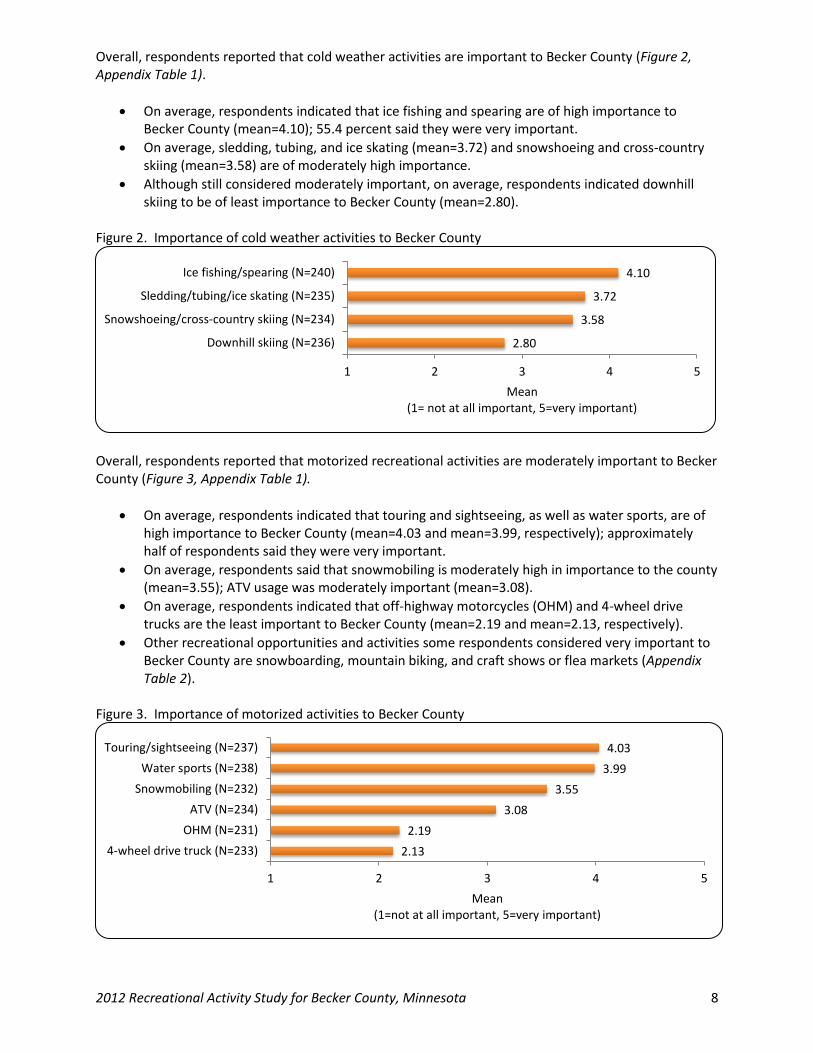
Overall, respondents reported that cold weather activities are important to Becker County (Figure 2, Appendix Table 1).
On average, respondents indicated that ice fishing and spearing are of high importance to Becker County (mean=4.10); 55.4 percent said they were very important.
On average, sledding, tubing, and ice skating (mean=3.72) and snowshoeing and cross-country skiing (mean=3.58) are of moderately high importance.
Although still considered moderately important, on average, respondents indicated downhill skiing to be of least importance to Becker County (mean=2.80).
Figure 2. Importance of cold weather activities to Becker County
Overall, respondents reported that motorized recreational activities are moderately important to Becker County (Figure 3, Appendix Table 1).
On average, respondents indicated that touring and sightseeing, as well as water sports, are of high importance to Becker County (mean=4.03 and mean=3.99, respectively); approximately half of respondents said they were very important.
On average, respondents said that snowmobiling is moderately high in importance to the county (mean=3.55); ATV usage was moderately important (mean=3.08).
On average, respondents indicated that off-highway motorcycles (OHM) and 4-wheel drive trucks are the least important to Becker County (mean=2.19 and mean=2.13, respectively).
Other recreational opportunities and activities some respondents considered very important to Becker County are snowboarding, mountain biking, and craft shows or flea markets (Appendix Table 2).
Figure 3. Importance of motorized activities to Becker County
2.80
3.58
3.72
4.10
1 2 3 4 5
Downhill skiing (N=236)
Snowshoeing/cross-country skiing (N=234)
Sledding/tubing/ice skating (N=235)
Ice fishing/spearing (N=240)
Mean (1= not at all important, 5=very important)
2.13
2.19
3.08
3.55
3.99
4.03
1 2 3 4 5
4-wheel drive truck (N=233)
OHM (N=231)
ATV (N=234)
Snowmobiling (N=232)
Water sports (N=238)
Touring/sightseeing (N=237)
Mean (1=not at all important, 5=very important)

2012 Recreational Activity Study for Becker County, Minnesota 9
Respondents were asked to indicate whether or not they or family members had participated in a variety of warm weather, cold weather, and motorized activities in the past two years. The vast majority of respondents indicated they have participated in at least one of the 25 recreational activities listed (96.5 percent); half participated in 13 or more (50.0 percent). Overall, respondents reported a wide range of participation in warm weather activities within the past two years) (Figure 4, Appendix Table 3). The vast majority of respondents have participated in at least one of the 15 warm weather activities listed (94.5 percent); two-thirds participated in seven or more (67.7 percent).
Within the past two years, the top three activities in which respondents participated are walking, fishing, and swimming (89.7 percent, 81.6 percent, and 80.1 percent, respectively).
Two in three respondents participated in hiking, backpacking, and picnicking (69.0 percent), bicycling (67.4 percent), and in hunting and shooting (67.1 percent).
Less than one in five respondents participated in rollerblading (17.4 percent) and horseback riding (15.8 percent); less than one in 10 participated in skateboarding (7.5 percent) or geocaching (9.0 percent).
Figure 4. Whether respondents participated in warm weather activities within the past two years
7.5
9.0
15.8
17.4
50.8
54.9
55.7
59.0
60.7
67.1
67.4
69.0
80.1
81.6
89.7
0 10 20 30 40 50 60 70 80 90 100
Skateboarding (N=241)
Geocaching (N=221)
Horseback riding (N=240)
Rollerblading (N=241)
Harvesting/gathering (N=240)
Camping (N=244)
Canoeing, kayaking, tubing (N=244)
Golf/tennis (N=244)
Bird and wildlife watching/nature photography(N=242)
Hunting/shooting (N=240)
Bicycling (N=239)
Hiking/backpacking/picnicking (N=242)
Swimming (N=246)
Fishing (N=245)
Walking (N=243)
Percent of Respondents
Yes
No

2012 Recreational Activity Study for Becker County, Minnesota 10
Overall, respondents indicated a wide range of participation in cold weather activities within the last two years (Figure 5, Appendix Table 3). The large majority of respondents have participated in at least one of the four cold weather activities listed (82.7 percent); nearly one in five participated in all of these activities (18.5 percent).
Three in four respondents participated in ice fishing or spearing (71.0 percent); three in five participated in sledding, tubing, or ice skating (62.3 percent).
Nearly half of respondents participated in snowshoeing or cross-country skiing (47.5 percent); more than one-fourth participated in downhill skiing (28.8 percent).
Figure 5. Whether respondents participated in cold weather activities within the past two years
Overall, respondents indicated a wide range of participation in motorized activities within the past two years) (Figure 6, Appendix Table 3). The vast majority of respondents have participated in at least one of the six motorized activities listed (90.2 percent); half have participated in three or more (49.1 percent).
The most popular motorized activities respondents participated in are touring or sightseeing and water sports (82.3 percent and 78.8 percent, respectively).
Two in five respondents indicated participation in snowmobiling and ATVs (45.2 percent and 42.7 percent, respectively).
One in 10 respondents indicated they have participated in off-highway motorcycling (9.6 percent).
Figure 6. Whether respondents participated in motorized activities within the past two years
28.8
47.5
62.3
71.0
0 10 20 30 40 50 60 70 80 90 100
Downhill skiing (N=240)
Snowshoeing/cross-country skiing (N=238)
Sledding/tubing/ice skating (N=236)
Ice fishing/spearing (N=241)
Percent of respondents
Yes
No
9.6
15.5
42.7
45.2
78.8
82.3
0 10 20 30 40 50 60 70 80 90 100
OHM (N=240)
4-wheel drive truck (N=239)
ATV (N=241)
Snowmobiling (N=241)
Water sports (N=240)
Touring/sightseeing (N=237)
Percent of respondents
Yes
No

2012 Recreational Activity Study for Becker County, Minnesota 11
Respondents who indicated participation in motorized activities were asked to select where in Becker County their participation took place (Figure 7, Appendix Table 4).
The most common responses to where respondents had participated in motorized recreational activities in Becker County are lakes (51.5 percent), private land (44.1 percent), trails (34.9 percent), and roads (33.2 percent).
Three percent of respondents said they participated in motorized recreational activities in wetland areas (3.1 percent).
Figure 7. Among respondents who participated in MOTORIZED recreational activities in Becker County within the past two years, locations of recreational activities
N=229 *Percentages do not equal 100.0 due to multiple responses.
Respondents were asked to give their primary reasons for participation in recreational activities (Figure 8, Appendix Table 5).
The top three reasons respondents gave for their participation in recreational activities are fun, spending time with family or friends, and relaxation (74.8 percent, 69.3 percent, and 68.9 percent, respectively).
More than half of respondents said getting close to nature is a reason for their participation (54.7 percent).
Figure 8. Respondents’ reasons for participating in recreational activities
N=254 *Percentages do not equal 100.0 due to multiple responses.
16.6 0.9
3.1 11.8
22.3 26.6
29.3 33.2
34.9 44.1
51.5
0 10 20 30 40 50 60 70 80 90 100
Did not participateOther
WetlandsRivers
Forests
DitchesPublic land
RoadsTrails
Private landLakes
Percent of respondents*
4.3
12.2
34.6
54.7
63.4
68.9
69.3
74.8
0 10 20 30 40 50 60 70 80 90 100
Other
Improve skills
Solitude
Getting close to nature
Physical activity
Relaxation
Spending time with family/friends
Fun
Percent of respondents*
2012 Recreational Activity Study for Becker County, Minnesota 12
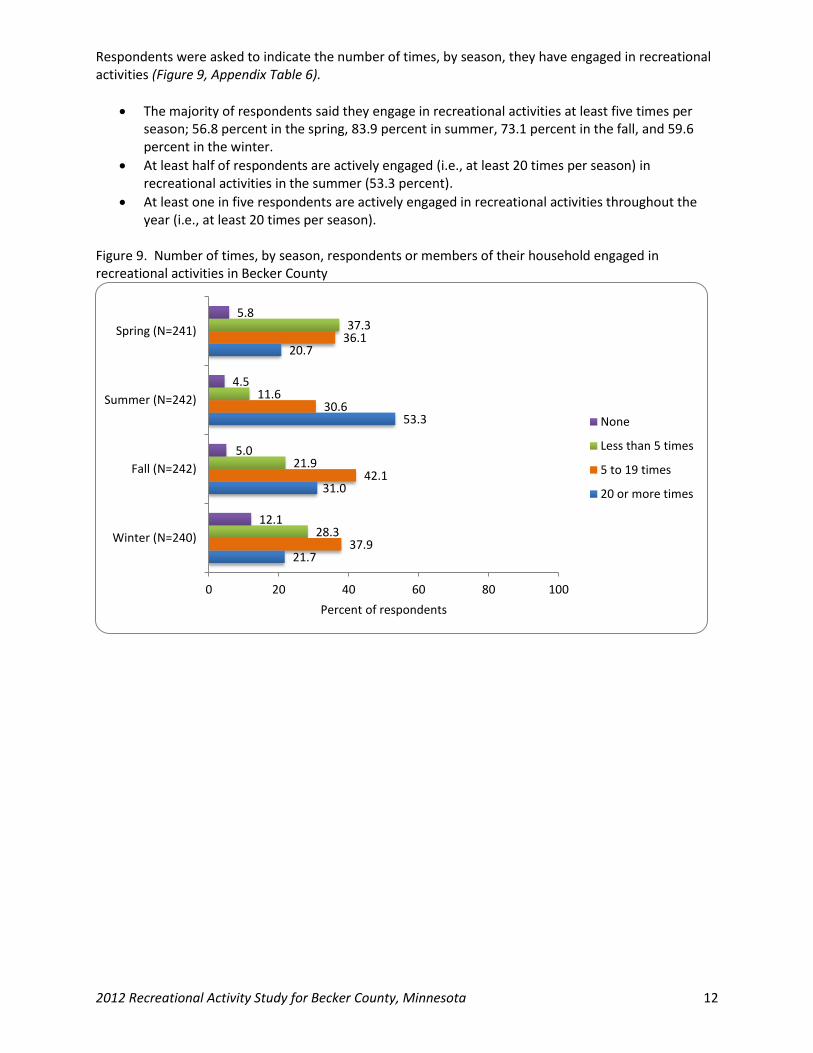
Respondents were asked to indicate the number of times, by season, they have engaged in recreational activities (Figure 9, Appendix Table 6).
The majority of respondents said they engage in recreational activities at least five times per season; 56.8 percent in the spring, 83.9 percent in summer, 73.1 percent in the fall, and 59.6 percent in the winter.
At least half of respondents are actively engaged (i.e., at least 20 times per season) in recreational activities in the summer (53.3 percent).
At least one in five respondents are actively engaged in recreational activities throughout the year (i.e., at least 20 times per season).
Figure 9. Number of times, by season, respondents or members of their household engaged in recreational activities in Becker County
21.7
31.0
53.3
20.7
37.9
42.1
30.6
36.1
28.3
21.9
11.6
37.3
12.1
5.0
4.5
5.8
0 20 40 60 80 100
Winter (N=240)
Fall (N=242)
Summer (N=242)
Spring (N=241)
Percent of respondents
None
Less than 5 times
5 to 19 times
20 or more times

2012 Recreational Activity Study for Becker County, Minnesota 13
Respondents were asked to indicate how many times in the past two years they have visited specific recreational locations in Becker County (Table 1).
The large majority of respondents indicated they have visited lakes and lake accesses at least once in the last two years (90.2 percent). Nearly half have visited these locations at least 20 times (46.1 percent).
At least two-thirds of respondents had visited local parks, recreation areas, and preserves (79.9 percent), national wildlife refuges (76.2 percent), Itasca State Park (71.9 percent), and state and county forests (69.1 percent) at least once in the past two years.
Rivers were utilized at least once in the past two years by 64.7 percent of respondents and 47.6 percent have visited wildlife management areas at least once.
The Greenwater Scientific and Natural Area has been utilized at least once by 17.3 percent of respondents; 64.3 percent have not visited this area at all and 18.5 percent are not familiar with this location.
Table 1. Number of times, during last two years, respondents and members of their household visited recreational locations in Becker County
Recreational locations
Percent of respondents by number of visits
20 or more 5 to 19
Less than 5 None
Not familiar
with location Total
Lakes/Lake accesses (N=243) 46.1 27.2 16.9 9.5 0.4 100.1
State and county forests (i.e., Smokey Hills, Two Inlets, White Earth) (N=243) 11.1 18.5 39.5 28.4 2.5 100.0
Local parks, recreation areas, preserves (Dunton Locks, Sucker Creek, etc.) (N=239) 7.9 31.8 40.2 16.7 3.3 99.9
National wildlife refuges (i.e., Tamarac, Hamden Slough) (N=244) 7.4 26.2 42.6 22.5 1.2 99.9
Wildlife management areas (Callaway, Hubbel Pond, White Earth, etc.) (N=242) 5.8 11.2 30.6 47.9 4.5 100.0
Rivers (N=241) 4.1 16.6 44.0 34.0 1.2 99.9
Itasca State Park (N=242) 3.7 14.5 53.7 27.3 0.8 100.0
Greenwater Scientific and Natural Area (N=238) 1.3 5.5 10.5 64.3 18.5 100.1

2012 Recreational Activity Study for Becker County, Minnesota 14
Using a 1 to 5 scale, with 1 being “not at all important” and 5 being “very important,” respondents were asked to rate the importance of several factors that contribute to their recreational experience (Figure 10, Appendix Tables 7 and 8). Overall, the level of importance was moderately high for factors that contribute to respondents’ recreational experiences.
On average, respondents indicated that natural resource protection, scenery and aesthetics, and environmental impact are the most important factors contributing to their recreational experience (mean=4.13, mean=4.10, and mean=4.02, respectively); at least 44 percent of respondents said they are very important.
Respondents indicated “communal gatherings” as the least important (mean= 3.01).
Respondents were asked about other factors that contribute to their recreational experiences. Clean facilities, swimming beaches, and maps and brochures are some factors that respondents mentioned.
Figure 10. Level of importance of factors that contribute to respondents’ recreational experience
3.75
3.01
3.45
3.45
3.56
3.56
3.57
3.61
3.75
3.76
3.83
4.02
4.10
4.13
1 2 3 4 5
Other (N=28)
Communal gatherings (N=228)
New recreational opportunities (N=228)
Connectivity to other amenities (N=232)
Solitude (N=227)
Proximity to existing recreational trails/parks (N=230)
Biological diversity (N=223)
County management of recreational resources (N=229)
Enforcement (N=230)
Recreational activities for local economy (N=229)
Preservation areas ( N=232)
Environmental impact (N=234)
Scenery/aesthetics (N=230)
Natural resource protection (N=231)
Mean (1=not at all important, 5=very important)
2012 Recreational Activity Study for Becker County, Minnesota 15
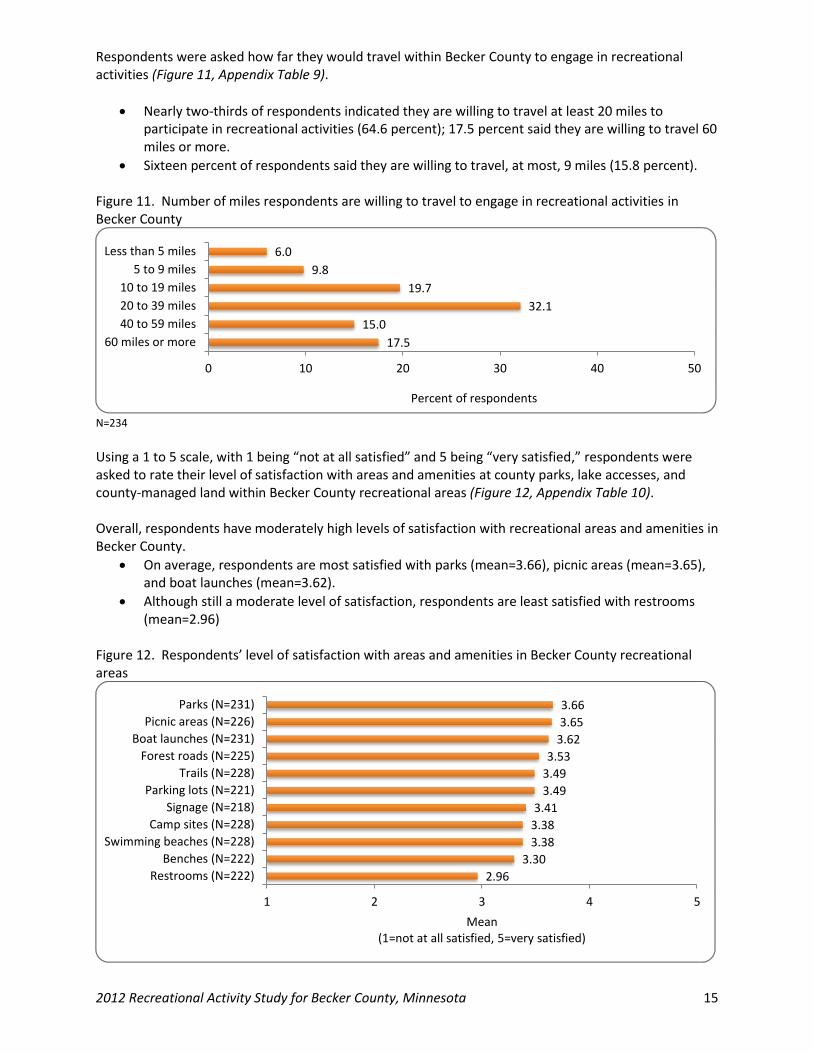
Respondents were asked how far they would travel within Becker County to engage in recreational activities (Figure 11, Appendix Table 9).
Nearly two-thirds of respondents indicated they are willing to travel at least 20 miles to participate in recreational activities (64.6 percent); 17.5 percent said they are willing to travel 60 miles or more.
Sixteen percent of respondents said they are willing to travel, at most, 9 miles (15.8 percent).
Figure 11. Number of miles respondents are willing to travel to engage in recreational activities in Becker County
N=234
Using a 1 to 5 scale, with 1 being “not at all satisfied” and 5 being “very satisfied,” respondents were asked to rate their level of satisfaction with areas and amenities at county parks, lake accesses, and county-managed land within Becker County recreational areas (Figure 12, Appendix Table 10). Overall, respondents have moderately high levels of satisfaction with recreational areas and amenities in Becker County.
On average, respondents are most satisfied with parks (mean=3.66), picnic areas (mean=3.65), and boat launches (mean=3.62).
Although still a moderate level of satisfaction, respondents are least satisfied with restrooms (mean=2.96)
Figure 12. Respondents’ level of satisfaction with areas and amenities in Becker County recreational areas
17.5
15.0
32.1
19.7
9.8
6.0
0 10 20 30 40 50
60 miles or more
40 to 59 miles
20 to 39 miles
10 to 19 miles
5 to 9 miles
Less than 5 miles
Percent of respondents
2.96
3.30
3.38
3.38
3.41
3.49
3.49
3.53
3.62
3.65
3.66
1 2 3 4 5
Restrooms (N=222)
Benches (N=222)
Swimming beaches (N=228)
Camp sites (N=228)
Signage (N=218)
Parking lots (N=221)
Trails (N=228)
Forest roads (N=225)
Boat launches (N=231)
Picnic areas (N=226)
Parks (N=231)
Mean (1=not at all satisfied, 5=very satisfied)

2012 Recreational Activity Study for Becker County, Minnesota 16
Respondents who were not satisfied with one or more of the areas and amenities at county parks, lake accesses, or county-managed tax-forfeited land within Becker County (i.e., a “1” or “2” response on a previous question) were asked to give reasons for their dissatisfaction (Figure 13, Appendix Table 11).
The top two reasons respondents gave for their dissatisfaction are that recreational areas and amenities need grooming and repairs (49.1 percent) and cleaning (42.7 percent).
One in five respondents gave other reasons for their dissatisfaction (20.9 percent). Some respondents said more and better signage is needed as well as more restrooms.
Figure 13. Among respondents who were not satisfied with areas and amenities within Becker County, reasons for dissatisfaction
N=110 *Percentages do not equal 100.0 due to multiple responses.
Respondents were asked whether Becker County should expand its park system (Figure 14, Appendix Tables 12 – 14).
The majority of respondents indicated that Becker County should expand (58.6 percent).
When asked to explain their response, the top five reasons respondents gave are: o More and safer biking, walking, running, and rollerblading trails o Expanding would draw more people o There would be more options or places to visit o The parks would get more use by expanding o Expanding would get people outdoors
The top three reasons respondents gave for not expanding are: o The county needs to keep up or maintain what they have o The county has enough o The county shouldn’t spend the money
Figure 14. Whether Becker County should expand its park system
N=186
20.9
2.7
7.3
13.6
42.7
49.1
0 10 20 30 40 50
Other
Inconvenient hours
Noisy
Crowded
Needed cleaning
Needed grooming/repairs
Percent of respondents*
41.4
58.6
0 10 20 30 40 50 60 70 80 90 100
No
Yes
Percent of respondents

2012 Recreational Activity Study for Becker County, Minnesota 17
Respondents were asked whether they or a member of their household have experienced a conflict or interference while engaging in a recreational activity on county‐managed land, and, if so, what the conflict was and the location where the conflict occurred (Figure 15, Appendix Tables 15 – 17).
The vast majority of respondents have not experienced a conflict or interference (86.4 percent).
Among those who have experienced a conflict, the top types of conflict respondents described are:
o ATVs in prohibited areas, tearing up land, excess noise, and leaving trash o Jet skis and water skiing interfere with fishing
Among those who experienced a conflict, the top three locations of the conflict are: o Dunton Locks o Two Inlets o Boat landings
Figure 15. Whether respondents, or members of their household, experienced a conflict or interference while engaging in recreational activities on county‐managed land within Becker County
N=235
Walkable Communities Walkability is a measure of how friendly an area is to walking. Walkability has many health, environmental, and economic benefits. Factors influencing walkability include the presence or absence and quality of footpaths, sidewalks, or other pedestrian right‐of‐way, traffic and road conditions, land use patterns, building accessibility, and safety, among others. Using a 1 to 5 scale, with 1 being “not at all walkable” and 5 being “very walkable,” respondents were asked to rate the walkability of their community (Figure 16, Appendix Table 18).
On average, respondents indicated that their community is walkable (mean=3.76); 30.9 percent of respondents said their community is very walkable.
Figure 16. Respondents’ perceptions of the walkability of their community
N=217 Mean=3.76
86.4
13.6
0 10 20 30 40 50 60 70 80 90 100
No
Yes
Percent of respondents
6.0
30.9
25.8
24.9
9.2
3.2
0 10 20 30 40 50 60 70 80 90 100
Not Applicable
5=Very walkable
4
3
2
1= Not at all walkable
Percent of respondents

2012 Recreational Activity Study for Becker County, Minnesota 18
Respondents were asked to indicate if they would walk or bicycle to various destinations if they were within 15 minutes of their home or place of work. In general, respondents are more likely to walk than bicycle (Figure 17, Appendix Table 19).
At least half of respondents indicated they would walk to parks (61.0 percent); neighborhood retail and restaurants (59.4 percent); trails (58.7 percent); community recreation centers (54.3 percent); or the post office, public library, and a city government office (50.0 percent).
At least one in three respondents indicated they would bicycle to trails (39.8 percent), parks (38.6 percent), and a community recreation center (34.6 percent).
Two in five respondents indicated they would not walk or bicycle to their school or their children’s school (44.1 percent), their place of worship (43.3 percent), or their medical facility (40.2 percent).
Figure 17. Destinations respondents would walk or bicycle to if they were within 15 minutes of home or place of work
N=254 *Percentages do not equal 100.0 due to multiple responses.
8.3
44.1
37.4
43.3
40.2
29.5
26.0
18.5
24.8
18.5
3.1
17.7
27.2
16.5
19.7
30.3
34.6
39.8
29.5
38.6
3.5
38.6
40.2
40.9
42.1
50.0
54.3
58.7
59.4
61.0
0 10 20 30 40 50 60 70
Other
Your school or your children's school
Your work place/volunteer site
Your place of worship
Medical facility
Post office/public library/city gov. office
Community recreation center
Trails
Neighborhood retail and restaurants
Parks
Percent of respondents*
Walk Bicycle I would not do either

2012 Recreational Activity Study for Becker County, Minnesota 19
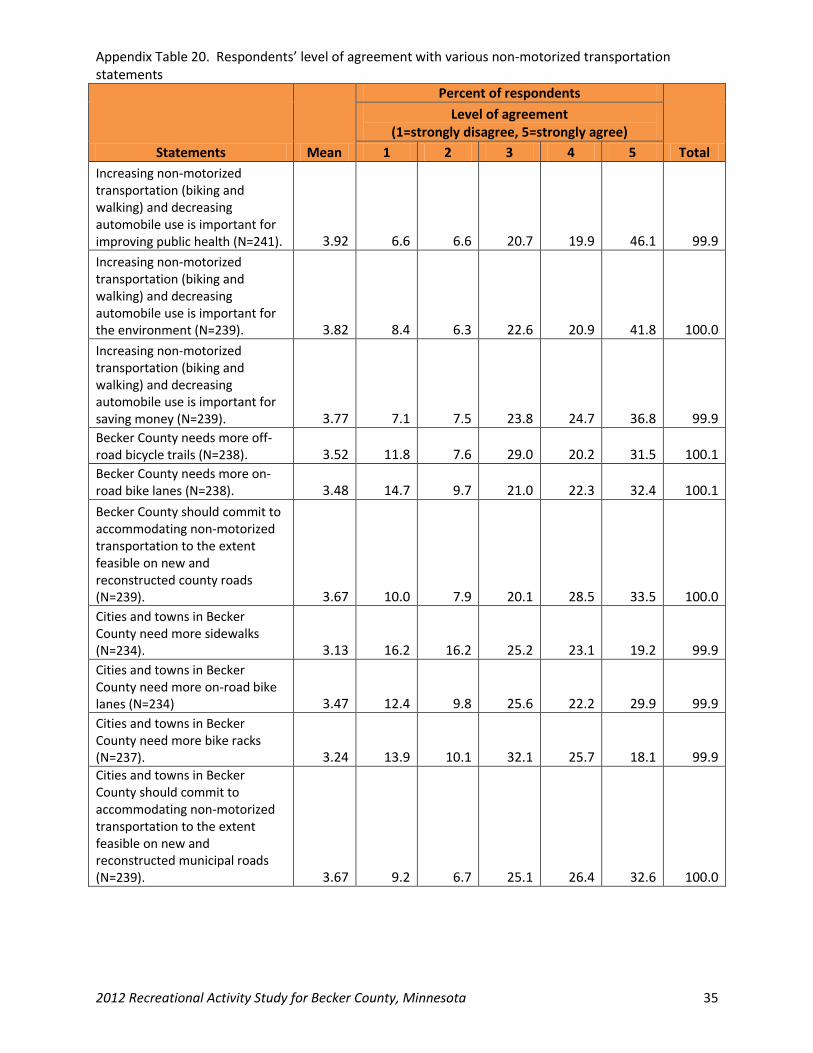
On a 1 to 5 scale, 1 being “strongly disagree” and 5 being “strongly agree,” respondents were asked to rate their level of agreement with various statements with respect to non-motorized transportation (Figure 18, Appendix Table 20). Overall, respondents had a moderately high level of agreement regarding the various statements about non-motorized transportation.
On average, respondents agree the most that increasing non-motorized transportation and decreasing automobile use are important for improving public health, the environment, and saving money (mean=3.92, mean=3.82, and mean=3.77 respectively).
On average, respondents have a moderately high level of agreement that Becker County should commit to accommodating non-motorized transportation on new and reconstructed county roads (mean=3.67), and that cities and towns in Becker County should commit to accommodating non-motorized transportation on new and reconstructed municipal roads (mean=3.67).
Although still a moderate level of agreement, respondents agree the least that cities and towns in Becker County need more bike racks (mean=3.24) and sidewalks (mean=3.13).

2012 Recreational Activity Study for Becker County, Minnesota 20
Figure 18. Respondents’ level of agreement with various non-motorized transportation statements
3.13
3.24
3.47
3.48
3.52
3.67
3.67
3.77
3.82
3.92
1 2 3 4 5
Cities and towns in Becker County need more sidewalks(N=234).
Cities and towns in Becker County need more bike racks(N=237).
Cities and towns in Becker County need more on-road bikelanes (N=234).
Becker County needs more on-road bike lanes (N=238).
Becker County needs more off-road bicycle trails (N=238).
Cities and towns in Becker County should commit toaccommodating non-motorized transportation to the extentfeasible on new and reconstructed municipal roads (N=239).
Becker County should commit to accommodating non-motorized transportation to the extent feasible on new and
reconstructed county roads (N=239).
Increasing non-motorized transportation (biking andwalking) and decreasing automobile use is important for
saving money (N=239).
Increasing non-motorized transportation (biking andwalking) and decreasing automobile use is important for the
environment (N=239).
Increasing non-motorized transportation (biking andwalking) and decreasing automobile use is important for
improving public health (N=241).
Mean (1=strongly disagree, 5=strongly agree)

2012 Recreational Activity Study for Becker County, Minnesota 21
Demographic Information
Half of respondents indicated they are 45 to 64 years of age (50.6 percent); 34.5 percent of respondents are 65 years or older (Figure 19, Appendix Table 21).
Figure 19. Respondents’ age
N=249
The vast majority of respondents are white (95.7 percent) (Figure 20, Appendix Table 22). Figure 20. Respondents’ race/ethnicity
N=254 *Percentages do not equal 100.0 due to multiple responses.
11.2
23.3
50.6
14.1
0.8
0.0
0 10 20 30 40 50 60 70 80 90 100
75 years or older
65 to 74
45 to 64
30 to 44
18 to 29
Younger than 18 years old
Percent of respondents
3.1
0.8
0
0
2.4
0
95.7
0 10 20 30 40 50 60 70 80 90 100
Did not respond
Other
Hispanic
Asian/Pacific Islander
Native American/Alaska Native
Black/African American
White
Percent of respondents*
2012 Recreational Activity Study for Becker County, Minnesota 22
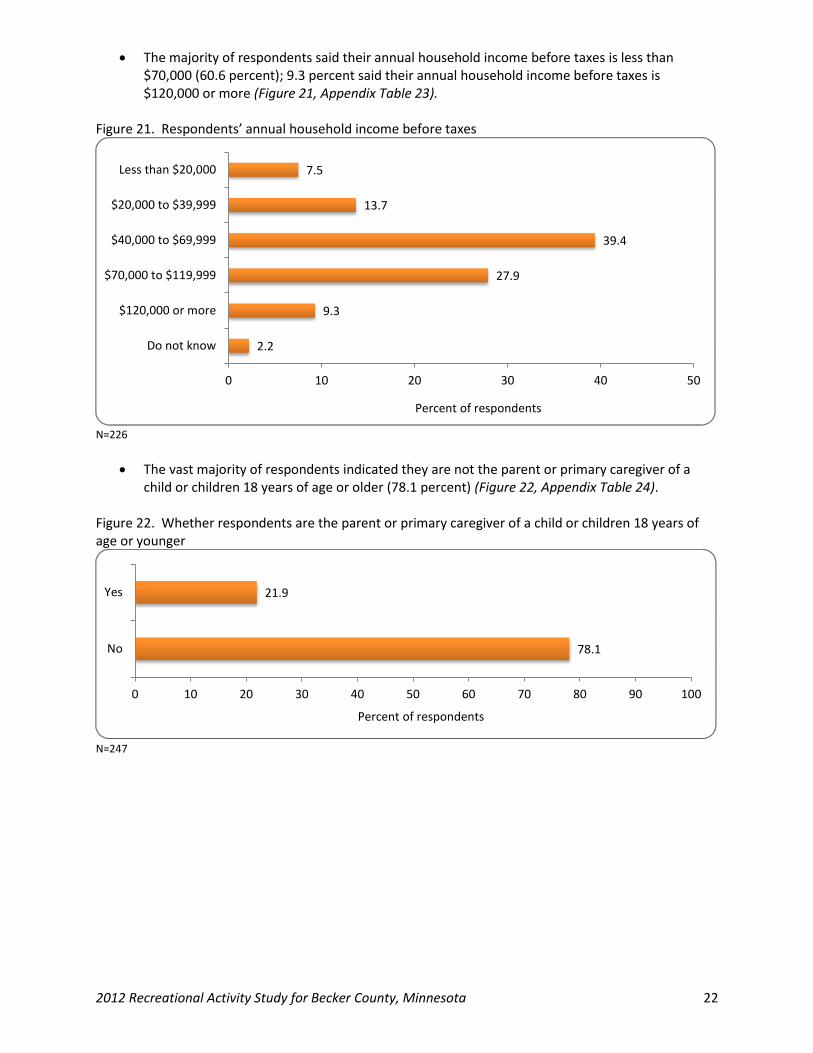
The majority of respondents said their annual household income before taxes is less than $70,000 (60.6 percent); 9.3 percent said their annual household income before taxes is $120,000 or more (Figure 21, Appendix Table 23).
Figure 21. Respondents’ annual household income before taxes
N=226
The vast majority of respondents indicated they are not the parent or primary caregiver of a child or children 18 years of age or older (78.1 percent) (Figure 22, Appendix Table 24).
Figure 22. Whether respondents are the parent or primary caregiver of a child or children 18 years of age or younger
N=247
2.2
9.3
27.9
39.4
13.7
7.5
0 10 20 30 40 50
Do not know
$120,000 or more
$70,000 to $119,999
$40,000 to $69,999
$20,000 to $39,999
Less than $20,000
Percent of respondents
78.1
21.9
0 10 20 30 40 50 60 70 80 90 100
No
Yes
Percent of respondents

2012 Recreational Activity Study for Becker County, Minnesota 23
The gender distribution among respondents is nearly evenly split; 53.1 percent are male (Figure 23, Appendix Table 25).
Figure 23. Respondents’ gender
N=245
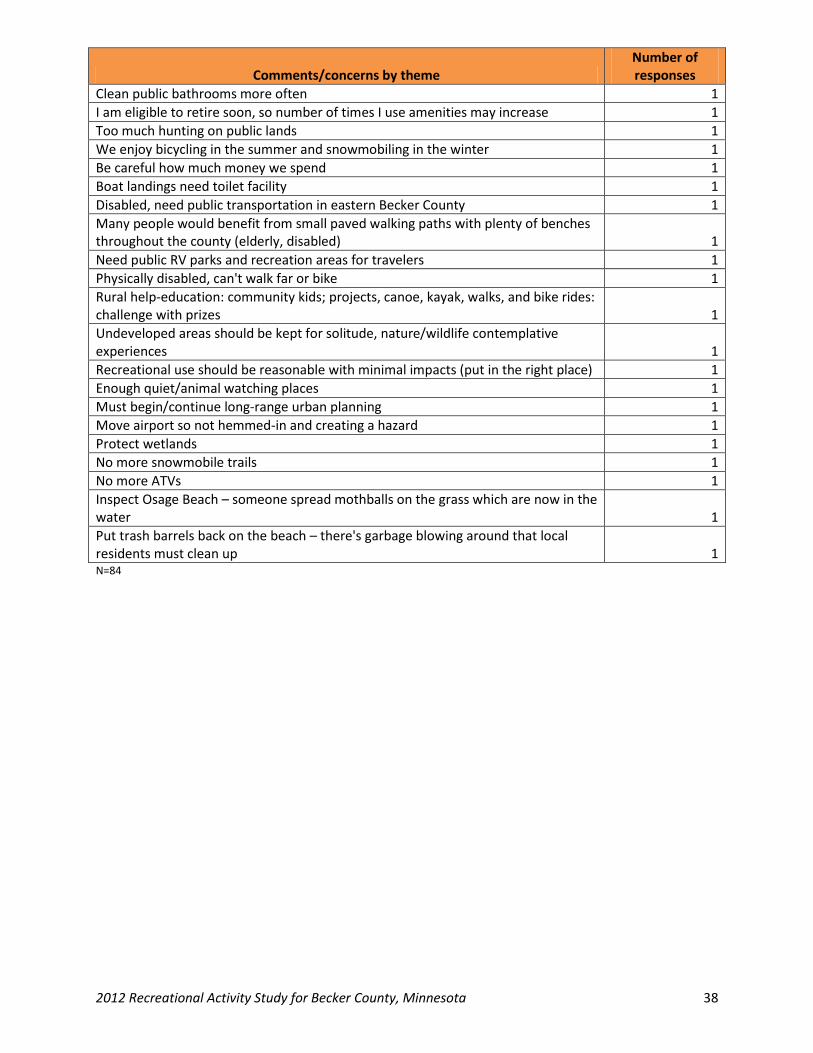
Additional Comments Respondents were given the opportunity to provide comments or concerns relating to recreational activities in Becker County (Appendix Table 26).
The most common theme that emerged in respondent comments is the desire for more and safer trails, specifically for biking, hiking, and walking.
Another common theme that emerged is the need for specific trails, policy, and regulation for motorized vehicles, such as ATVs and OHVs.
Slightly less common themes are improving and maintaining existing facilities and the need for more services and activities for senior citizens, handicapped persons, and children.
46.9
53.1
0 10 20 30 40 50 60 70 80 90 100
Female
Male
Percent of respondents

2012 Recreational Activity Study for Becker County, Minnesota 24
Appendix Table 1. Importance of activities to Becker County
Recreational Activities Mean
Percent of respondents
Total
Level of importance (1=not at all important, 5=very important)
1 2 3 4 5
Warm weather activities
Canoeing, kayaking, tubing (N=237) 3.37 12.2 11.4 30.0 19.8 26.6 100.0
Swimming (N=238) 4.13 5.0 3.8 17.2 20.6 53.4 100.0
Bicycling (N=237) 3.84 8.0 5.9 23.2 19.8 43.0 99.9
Walking (N=239) 4.43 3.8 1.3 9.6 19.2 66.1 100.0
Horseback riding (N=233) 2.33 36.9 18.9 27.5 7.3 9.4 100.0
Fishing (N=238) 4.46 3.4 4.6 6.3 14.3 71.4 100.0
Hunting/shooting (N=239) 3.91 12.6 6.3 13.4 13.0 54.8 100.1
Harvesting/gathering (berries, mushrooms, etc.) (N=234) 3.21 14.5 14.5 27.4 22.2 21.4 100.0
Bird and wildlife watching/nature photography (N=237) 3.58 11.8 11.0 19.8 21.9 35.4 99.9
Geocaching (N=209) 2.02 45.9 19.6 24.9 5.3 4.3 100.0
Hiking/backpacking/picnicking (N=235) 3.77 7.2 6.4 24.7 25.1 36.6 100.0
Camping (N=240) 3.88 8.8 5.8 17.1 25.8 42.5 100.0
Rollerblading (N=237) 2.30 40.9 16.9 21.5 13.1 7.6 100.0
Skateboarding (N=235) 2.10 48.5 15.3 19.1 11.5 5.5 99.9
Golf/tennis (N=236) 3.46 18.6 3.8 22.5 23.3 31.8 100.0
Cold weather activities
Downhill skiing (N=236) 2.80 26.7 14.4 26.3 17.8 14.8 100.0
Ice fishing/spearing (N=240) 4.10 6.3 7.1 12.9 18.3 55.4 100.0
Sledding/tubing/ice skating (N=235) 3.72 8.9 7.2 24.3 21.7 37.9 100.0
Snowshoeing/cross-country skiing (N=234) 3.58 12.0 10.7 20.5 20.9 35.9 100.0
Motorized activities
Water sports (boating/jet skiing) (N=238) 3.99 10.1 6.7 9.7 21.0 52.5 100.0
ATV (all-terrain vehicles) (N=234) 3.08 26.1 10.7 19.7 16.7 26.9 100.1
OHM (off-highway motorcycles) (N=231) 2.19 44.6 16.9 22.1 7.8 8.7 100.1
4-wheel drive (off-road) truck (N=233) 2.13 47.2 18.5 17.6 7.3 9.4 100.0
Snowmobiling (N=232) 3.55 17.2 8.2 13.4 24.6 36.6 100.0
Touring/sightseeing (N=237) 4.03 6.3 4.2 18.1 22.8 48.5 99.9
APPENDICES

2012 Recreational Activity Study for Becker County, Minnesota 25
Appendix Table 2. Other recreational activities
Responses Number of responses
Snowboarding 2
Craft shows/flea market 2
Mountain biking 2
Camping with tent and RV 1
Car racing 1
Trapping 1
Year-round indoor swimming 1
Motorcycle 1
Sailing 1
Other 6 N=18
Appendix Table 3. Whether respondents participated in the various recreational activities within the past two years
Recreational Activities
Percent of respondents
Yes No Total
Warm weather activities
Canoeing, kayaking, tubing (N=244) 55.7 44.3 100.0
Swimming (N=246) 80.1 19.9 100.0
Bicycling (N=239) 67.4 32.6 100.0
Walking (N=243) 89.7 10.3 100.0
Horseback riding (N=240) 15.8 84.2 100.0
Fishing (N=245) 81.6 18.4 100.0
Hunting/shooting (N=240) 67.1 32.9 100.0
Harvesting/gathering (berries, mushrooms, etc.) (N=240) 50.8 49.2 100.0
Bird and wildlife watching/nature photography (N=242) 60.7 39.3 100.0
Geocaching (N=221) 9.0 91.0 100.0
Hiking/backpacking/picnicking (N=242) 69.0 31.0 100.0
Camping (N=244) 54.9 45.1 100.0
Rollerblading (N=241) 17.4 82.6 100.0
Skateboarding (N=241) 7.5 92.5 100.0
Golf/tennis (N=244) 59.0 41.0 100.0
Cold weather activities
Downhill skiing (N=240) 28.8 71.3 100.1
Ice fishing/spearing (N=241) 71.0 29.0 100.0
Sledding/tubing/ice skating (N=236) 62.3 37.7 100.0
Snowshoeing/cross-country skiing (N=238) 47.5 52.5 100.0
Motorized activities
Water sports (boating/jet skiing) (N=240) 78.8 21.3 100.1
ATV (all-terrain vehicles) (N=241) 42.7 57.3 100.0
OHM (off-highway motorcycles) (N=240) 9.6 90.4 100.0
4-wheel drive (off-road) truck (N=239) 15.5 84.5 100.0
Snowmobiling (N=241) 45.2 54.8 100.0
Touring/sightseeing (N=237) 82.3 17.7 100.0

2012 Recreational Activity Study for Becker County, Minnesota 26
Appendix Table 4. Among respondents who participated in MOTORIZED recreational activities in Becker County within the past two years, locations of recreational activities
Locations Percent of
Respondents*
Private land 44.1
Lakes 51.5
Public land 29.3
Rivers 11.8
Trails 34.9
Wetlands 3.1
Roads 33.2
Forests 22.3
Ditches 26.6
Did not participate 16.6
Other: 0.9
Boating
County highways N=229 *Percentages do not equal 100.0 due to multiple responses.
Appendix Table 5. Respondents’ reasons for participating in recreational activities
Reasons Percent of
Respondents
Improve skills 12.2
Physical activity 63.4
Relaxation 68.9
Solitude 34.6
Spending time with family/friends 69.3
Getting close to nature 54.7
Fun 74.8
Other: 4.3
Hunt and fish for food (4)
Excitement (1)
Personal enjoyment (1)
Socialize (1)
Exercise (1)
Competition (1)
Escape noise and commotion (1)
Lunch destination (1)
Teach next generation (1)
Farming (1) N=254 *Percentages do not equal 100.0 due to multiple responses.

2012 Recreational Activity Study for Becker County, Minnesota 27
Appendix Table 6. Number of times, by season, respondents or members of their household engaged in recreational activities in Becker County
Season
Number of times
None Less
than 5 5 to 19 20 or more Total
Spring (March-May) (N=241) 5.8 37.3 36.1 20.7 99.9
Summer (June-August) (N=242) 4.5 11.6 30.6 53.3 100.0
Fall (September-November (N=242) 5.0 21.9 42.1 31.0 100.0
Winter (December-February) (N=240) 12.1 28.3 37.9 21.7 100.0
Appendix Table 7. Level of importance of factors that contribute to respondents’ recreational experience
Factors Mean
Percent of respondents
Total
Level of importance (1=not at all important, 5=very important)
1 2 3 4 5
a. Connectivity to other amenities (restaurants, bathrooms, etc.) (N=232) 3.45 11.6 7.8 29.7 25.9 25.0 100.0
b. Environmental impact (N=234) 4.02 5.6 4.3 19.2 24.8 46.2 100.1
c. Natural resource protection (N=231) 4.13 3.9 3.9 16.9 25.5 49.8 100.0
d. Recreational activities for local economy (N=229) 3.76 7.0 5.2 23.6 32.8 31.4 100.0
e. Proximity to existing recreational trails/parks (N=230) 3.56 7.8 9.1 27.0 31.7 24.3 99.9
f. New recreational opportunities (N=228) 3.45 10.5 11.0 23.2 33.3 21.9 99.9
g. Recreation management (N=229) 3.61 7.9 7.0 26.2 34.5 24.5 100.1
h. Scenery/aesthetics (N=230) 4.10 4.8 3.0 14.3 33.5 44.3 99.9
i. Preservation areas (N=232) 3.83 6.9 6.9 18.5 31.9 35.8 100.0
j. Biological diversity (N=223) 3.57 8.1 9.4 26.5 30.0 26.0 100.0
k. Solitude (N=227) 3.56 8.4 8.8 27.8 29.1 26.0 100.1
l. Communal gatherings (N=228) 3.01 14.0 16.2 36.0 21.9 11.8 99.9
m. Enforcement (N=230) 3.75 5.2 8.3 25.7 28.3 32.6 100.1
n. Other (N=28) 3.75 21.4 0.0 10.7 17.9 50.0 100.0

2012 Recreational Activity Study for Becker County, Minnesota 28
Appendix Table 8. Other factors that contribute to respondents’ recreational experiences
Responses Number of responses
Would like to see ATV trails 1
Viewing birds and wild animals 1
Clean facilities 1
Over enforcement drives people away 1
Swimming beaches 1
Stop giving permits for ski courses on lakes 1
Non-motorized recreations 1
Absolute access to all tax forfeited land 1
Getting away from ATV, snowmobile, jet ski commotion/damage 1
Keep true to nature, no motorized vehicles more than 15 mph 1
Maps and brochures (info) 1
Proximity to Cities 1
Reigning in OHVs and developing and enforcing a restrictive policy 1
Nothing needed at this time 1 N=14
Appendix Table 9. Number of miles respondents are willing to travel to engage in recreational activities in Becker County
Number of miles Percent of
Respondents
Less than 5 miles 6.0
5 to 9 miles 9.8
10 to 19 miles 19.7
20 to 39 miles 32.1
40 to 59 miles 15.0
60 miles or more 17.5 N=234
Appendix Table 10. Respondents’ level of satisfaction with areas and amenities in Becker County recreational areas
Areas and amenities Mean
Percent of respondents
Total
Level of satisfaction (1=not at all satisfied, 5=very satisfied)
1 2 3 4 5 Not
applicable
Areas
Parks (N=231) 3.66 2.6 4.8 31.2 29.9 19.0 12.6 100.1
Trails (N=228) 3.49 3.9 8.3 26.8 25.4 14.9 20.6 99.9
Forest roads (N=225) 3.53 3.1 8.9 21.8 21.3 14.7 30.2 100.0
Boat launches (N=231) 3.62 4.3 8.2 20.3 31.6 18.6 16.9 99.9
Camp sites (N=228) 3.38 5.3 7.0 21.5 21.5 10.5 34.2 100.0
Picnic areas (N=226) 3.65 2.7 4.4 28.8 28.8 16.8 18.6 100.1
Swimming beaches (N=228) 3.38 5.3 12.3 28.1 21.9 16.2 16.2 100.0
Amenities
Restrooms (N=222) 2.96 6.3 19.8 40.5 13.1 8.1 12.2 100.0
Benches (N=222) 3.30 2.7 14.0 35.1 23.4 10.8 14.0 100.0
Parking lots (N=221) 3.49 2.3 8.1 35.3 29.0 13.6 11.8 100.1
Signage (N=218) 3.41 2.8 10.6 33.0 30.3 10.6 12.8 100.1

2012 Recreational Activity Study for Becker County, Minnesota 29
Appendix Table 11. Among respondents who were not satisfied with areas and amenities within Becker County, reasons for dissatisfaction
Reasons Percent of
respondents*
Crowded 13.6
Needed cleaning 42.7
Noisy 7.3
Needed grooming/repairs 49.1
Inconvenient hours 2.7
Other: 20.9
Not enough (7)
Need more/better signage (5)
Update/need more restrooms (4)
Need an OHM/ATV trails/policy (3)
Poorly managed tax-forfeited land without access to all tax payers (2)
Unsafe bike trails (2)
Weeds (2)
Boat launches unprepared, hard to use (1)
No maps, hard to find (1)
Not user-friendly (1)
Poor quality access (1)
Too many motors on lake access (1)
More camping (1)
Room for improvement in general (1) N=110 *Percentages do not equal 100.0 due to multiple responses.
Appendix Table 12. Whether Becker County should expand its park system
Responses Percent of
respondents
Yes 58.6
No 41.4
Total 100.0 N=186

2012 Recreational Activity Study for Becker County, Minnesota 30
Appendix Table 13. Responses in favor of expanding parks system
Responses in favor of expansion Number of responses
More/safer bike/walk/running/rollerblading trails (closer to home) 7
Draw people 5
More options/places to visit 5
More use 4
Gets people outdoors (including kids) 4
People love parks 3
More nice family parks 3
Accommodate tourists and residents 3
More quiet places for solitude/nature 3
Recreation/more people looking for recreation and nature areas every year 2
Economic development 2
Preservation for future 2
Quality of life 2
Better lake accesses (too shallow) 2
Need more campsites/tent camp sites for families 2
Park system used by all ages 1
Increase in population needs 1
So don’t have to travel to enjoy a lake 1
Bigger parks for picnics 1
More ATV trails 1
Thin out crowds 1
Increase tax base 1
Large Fargo-Moorhead customer base going to Park Rapids 1
Get resource for locals 1
More job opportunities 1
More areas of interest for community business 1
No motorized activities 1
Chance to see more of the county 1
Depends on the land 1
More swimming beaches 1
Should have some county run campgrounds 1
Could use more areas 1
Transportation for senior citizens 1
Participate in Detroit Mountain renovation as county/regional park 1
We have the land 1
Some parks overcrowded 1
Parks good for many purposes and people 1
Do it as long as land has purposeful use 1
More smaller places throughout the county 1
More signed ATV only trails 1
Let people know what is available 1
Put forfeit land to use 1
There will be an increase in population 1
Expand in rural areas, not Detroit Lakes 1
Not sure 3 NOTE: 109 respondents indicated that Becker County should expand its park system.

2012 Recreational Activity Study for Becker County, Minnesota 31
Appendix Table 14. Responses opposing expanding parks system
Responses opposing expansion Number of responses
Keep up/maintain/improve what we already have 22
We have enough 13
Shouldn’t spend the money 13
Sell forfeited land 1
Depends on the land 1
Respondent does not use the parks 1
Too many people will wreck the area 1
Don’t open Detroit Mountain 1
Beyond Detroit Lakes we don’t exist 1
Stay near home 1
Cut what is not being used 1
Ski hill in Detroit Lakes would be nice 1
Laws must be enforced 1
Develop Detroit Lakes Mountain 1
Public should have access to forfeited land 1
Only if need is great enough 1
Parks aren’t overcrowded 1
No more taxes 1
Fund more important things 1
It seems fine 1
No qualified, capable staff managing parks 1
No funding 1
More important essential services to fund 1
Unsure 2 NOTE: 77 people indicated that Becker County should not expand its park system.
Appendix Table 15. Whether respondents, or members of their household, experienced a conflict or interference while engaging in a recreational activity on county-managed land within Becker County
Responses Percent of
respondents
Yes 13.6
No 86.4
Total 100.0 N=235

2012 Recreational Activity Study for Becker County, Minnesota 32
Appendix Table 16. Among respondents who experienced a conflict or interference within Becker County, the type of conflict
Responses Number of responses
ATVs in prohibited areas, tearing up land, excess noise/leaving trash 10
Jet skis/water skiing, interfere with fishing 3
Tribal land/tribes 2
Crowded camp areas, lake launches, public accesses 2
Low water level 2
Float planes 1
Rowdy, unsupervised teenagers 1
Dogs off leashes 1
Campground official appointed by Department of Natural Resources 1
Litter on lake access 1
Tracks on ski trails 1
Having to change deer hunting plans due to too many people 1
Warning ticket for jet ski but Department of Natural Resources officer was not helpful in explaining what was needed 1
Other hunters being careless 1
Not being able to use all of river 1
Other 1 NOTE: 32 respondents indicated they had experienced a conflict.
Appendix Table 17. Among respondents who experienced a conflict or interference within Becker County, the location
Responses Number of responses
Dunton Locks 5
Two Inlets 3
Boat landings 3
White Earth Lake 2
Detroit Lake 2
Big Detroit 1
Snowmobile trails east of Many Point 1
Many Point Lake Area 1
Eagle Lake park/beach 1
Becker County Lake 1
Grantin Aid Trails 1
Tulaby Lake boat access 1
Smokey Hills 1
Hungryman campground 1
Toad Lake 1
Straight Lake 1
Mountainview 1
Tax forfeited hunting land 1
White Earth Reservation 1
Big Floyd Lake 1
Several lakes 1
County forest land east of Ice Cracking Lodge in wetland and off trail/road 1
Lake Sally 1
Snow ski and cross-country ski trails 1

2012 Recreational Activity Study for Becker County, Minnesota 33
Responses Number of responses
Lake Melissa 1
Public access 1
Hubbel Pond 1
Ottertail River 1
County tax forfeit lands 1
Sandy Hills 1
Bad Medicine area 1
Highway 113 area 1
Snowmobile trail 1
Road ditches 1
No conflicts, just had to relocate, can happen anywhere 1 NOTE: 32 respondents indicated they had experienced a conflict.
Appendix Table 18. Respondents’ perceptions of the walkability of their community
Responses Percent of
respondents
1=Not at all walkable 3.2
2 9.2
3 24.9
4 25.8
5=Very walkable 30.9
Not applicable 6.0
Total 100.0 N=217 Mean=3.76

2012 Recreational Activity Study for Becker County, Minnesota 34
Appendix Table 19. Destinations respondents would walk or bicycle to if they were within 15 minutes of home or place of work
Destinations
Percentage of respondents
Walk Bicycle I would not
do either
Community recreation center 54.3 34.6 26.0
Neighborhood retail and restaurants 59.4 29.5 24.8
Post office/public library/city government office 50.0 30.3 29.5
Medical facility 42.1 19.7 40.2
Your work place/volunteer site 40.2 27.2 37.4
Your school or your children’s school 38.6 17.7 44.1
Your place of worship 40.9 16.5 43.3
Parks 61.0 38.6 18.5
Trails 58.7 39.8 18.5
Other: 3.5 3.1 8.3
Everywhere (2)
Nature trails (2)
Wildlife view areas (2)
Neighborhood (2)
Not applicable (2)
Need on-road bicycle/walk paths (1)
Would rather drive (1)
No longer walk (1)
Dunton Locks (1)
Drive to sites then walk around them (1)
Motorists mostly don’t acknowledge rights of pedestrians (1)
Lives 25 miles from town (1) N=254 *Percentages do not equal 100.0 due to multiple responses.
2012 Recreational Activity Study for Becker County, Minnesota 35
Appendix Table 20. Respondents’ level of agreement with various non-motorized transportation statements
Statements Mean
Percent of respondents
Total
Level of agreement (1=strongly disagree, 5=strongly agree)
1 2 3 4 5
Increasing non-motorized transportation (biking and walking) and decreasing automobile use is important for improving public health (N=241). 3.92 6.6 6.6 20.7 19.9 46.1 99.9
Increasing non-motorized transportation (biking and walking) and decreasing automobile use is important for the environment (N=239). 3.82 8.4 6.3 22.6 20.9 41.8 100.0
Increasing non-motorized transportation (biking and walking) and decreasing automobile use is important for saving money (N=239). 3.77 7.1 7.5 23.8 24.7 36.8 99.9
Becker County needs more off-road bicycle trails (N=238). 3.52 11.8 7.6 29.0 20.2 31.5 100.1
Becker County needs more on-road bike lanes (N=238). 3.48 14.7 9.7 21.0 22.3 32.4 100.1
Becker County should commit to accommodating non-motorized transportation to the extent feasible on new and reconstructed county roads (N=239). 3.67 10.0 7.9 20.1 28.5 33.5 100.0
Cities and towns in Becker County need more sidewalks (N=234). 3.13 16.2 16.2 25.2 23.1 19.2 99.9
Cities and towns in Becker County need more on-road bike lanes (N=234) 3.47 12.4 9.8 25.6 22.2 29.9 99.9
Cities and towns in Becker County need more bike racks (N=237). 3.24 13.9 10.1 32.1 25.7 18.1 99.9 Cities and towns in Becker County should commit to accommodating non-motorized transportation to the extent feasible on new and reconstructed municipal roads (N=239). 3.67 9.2 6.7 25.1 26.4 32.6 100.0

2012 Recreational Activity Study for Becker County, Minnesota 36
Appendix Table 21. Respondents’ age
Age Percent of
respondents
Younger than 18 years old 0.0
18 to 29 0.8
30 to 44 14.1
45 to 64 50.6
65 to 74 23.3
75 years or older 11.2
Total 100.0 N=249
Appendix Table 22. Respondents’ race/ethnicity
Race/ethnicity Percent of
respondents*
White 95.7
Black/African American 0.0
Native American/Alaska Native 2.4
Asian/Pacific Islander 0.0
Hispanic 0.0
Other 0.8
Did not respond 3.1 N=254 *Percentages do not equal 100.0 due to multiple responses.
Appendix Table 23. Respondents’ annual household income before taxes
Income Percent of
respondents
Less than $20,000 7.5
$20,000 to $39,999 13.7
$40,000 to $69,999 39.4
$70,000 to $119,999 27.9
$120,000 or more 9.3
Do not know 2.2
Total 100.0 N=226
Appendix Table 24. Whether respondents are the parent or primary caregiver of a child or children 18 years of age or younger
Responses Percent of
respondents
Yes 21.9
No 78.1
Total 100.0 N=247

2012 Recreational Activity Study for Becker County, Minnesota 37
Appendix Table 25. Respondents’ gender
Responses Percent of
respondents
Male 53.1
Female 46.9
Total 100.0 N=245
Appendix Table 26. Respondents’ comments or concerns regarding recreational activities in Becker County
Comments/concerns by theme Number of responses
More and safer biking, dirt biking, hiking, and walking trails 10
Specific trails/policy and regulation for motorized vehicles like ATVs, OHVs 8
Areas need improvement, maintain and improve existing facilities 4
More services/activities for senior citizens, handicapped persons, and kids 4
More and better bike lanes in town 2
Ability to use golf carts on roads 2
Better boat launches and deeper, better boat ramps 2
The county should assist with Detroit Mountain project, Detroit Mountain recreational area is vital 2
Becker County is doing just fine 2
Good organized programs for kids 1
Need more places for kids to go without needing structure, supervision 1
Sell excess property to raise tax base and use funds to make recreational locations/opportunities first class 1
More access on Detroit Lake 1
More trails for easier access 1
More dog policies 1
Get all septic tanks checked and up to code 1
Keep large boats off of small lakes 1
Connect cities 1
Sell tax forfeited land 1
Turn tennis courts into pickleball courts 1
Want to be able to camp on a lake where you can actually catch fish and take short walks 1
Can't afford seasonal campsites 1
Fine people for jumping off the long-bridge 1
Increase and maintain camping opportunities 1
Greenwater lake access should be fixed 1
No Detroit Mountain 1
Not concerned with recreational opportunities 1
No more slalom water skiing course permits given 1
Public access to all tax forfeited land 1
Keep enough tax forfeited land to leave us land for future public recreation 1
More non-motorized recreational venues 1
Detroit Lakes is a great place to live 1
Stoplights need longer walk signal times 1
Too much traffic and noise 1
Hunting is more difficult due to ATVs being used 1
Clean up duck droppings at Detroit Lakes lakefront 1
2012 Recreational Activity Study for Becker County, Minnesota 38
Comments/concerns by theme Number of responses
Clean public bathrooms more often 1
I am eligible to retire soon, so number of times I use amenities may increase 1
Too much hunting on public lands 1
We enjoy bicycling in the summer and snowmobiling in the winter 1
Be careful how much money we spend 1
Boat landings need toilet facility 1
Disabled, need public transportation in eastern Becker County 1
Many people would benefit from small paved walking paths with plenty of benches throughout the county (elderly, disabled) 1
Need public RV parks and recreation areas for travelers 1
Physically disabled, can't walk far or bike 1
Rural help-education: community kids; projects, canoe, kayak, walks, and bike rides: challenge with prizes 1
Undeveloped areas should be kept for solitude, nature/wildlife contemplative experiences 1
Recreational use should be reasonable with minimal impacts (put in the right place) 1
Enough quiet/animal watching places 1
Must begin/continue long-range urban planning 1
Move airport so not hemmed-in and creating a hazard 1
Protect wetlands 1
No more snowmobile trails 1
No more ATVs 1
Inspect Osage Beach – someone spread mothballs on the grass which are now in the water 1
Put trash barrels back on the beach – there's garbage blowing around that local residents must clean up 1 N=84

BECKER COUNTY
County Administration 915 Lake Avenue, Detroit Lakes, MN 56501 218-846-7201 www.co.becker.mn.us
June 11, 2012 Dear Resident: You are invited to take part in a short survey being given by the Becker County Recreational Advisory Committee (RAC). The goal of this survey is to gather opinions from residents, either full or part time, about recreational activities in Becker County. We want to learn where you and members of your household recreate. We also want to know if you are satisfied with current recreational activities and opportunities to walk and bike in Becker County. Becker County and its Board of Directors is committed to improving outdoor recreational opportunities for residents. The County also cares for and protects county-administered land. PartnerSHIP 4 Health is also sponsoring the survey. PartnerSHIP 4 Health is the Minnesota Statewide Health Improvement Program (SHIP) of Becker, Clay, Otter Tail, and Wilkin counties. It brings communities together to encourage and support healthy lifestyles and to prevent chronic diseases among residents. Becker County RAC has contracted with the Center for Social Research at North Dakota State University (NDSU) to conduct this research study. Your name was randomly chosen from a list of residents in Becker County. The survey is voluntary. You can skip any question you do not want to answer. You will not be identified and your answers are anonymous. The survey will take you about 15 minutes to complete. We have provided a postage-paid return envelope. Please return your survey to us by Friday, June 29, 2012. The results of this survey will be made available to the public this fall. If you have any questions about the purpose of this project, contact Guy Fischer, Economic Development Authority Coordinator for Becker County, at 218-846-7316. If you have questions about the research study, contact Kay Schwarzwalter, Research Assistant at the Center for Social Research, at 701-231-1058. If you have questions about your rights as a human research participant or to report a problem with this study, contact NDSU’s Human Research Protection Program at 701-231-8908. Thank you for your participation. Sincerely,
Larry Knutson, Chair Becker County Board 915 Lake Avenue Detroit Lakes, MN 56501
Gina Nolte, Director PartnerSHIP 4 Health Clay County Public Health 715 11th Street North, Suite 303 Moorhead, MN 56560 www.partnerSHIP4Health.org
NDSU
Center for Social Research NDSU Dept. 8000 PO BOX 6050 Fargo, ND 58108-6050 701-231-1058

Becker County Recreational Advisory Committee (RAC) SurveyBecker County owns and manages more than 75,000 acres of tax-forfeited land and uses it for a variety of purposes for the public. The County also provides many recreational opportunities, including options for motorized vehicles. Becker County RAC is interested in gaining an understanding of the recreational needs, attitudes, opinions, and behaviors of people living in BeckerCounty. As a resident of Becker County, either full or part time, please take a few moments to complete this important survey.
Recreational Opportunities and ExperiencesQ1. Using a 1 to 5 scale, with 1 being "not at all important" and 5 being "very important," please tell us how important each of the following activities are to the county and whether or not you or your family members have participated in them within the past two years.
(specify)
Q2. If you participated in MOTORIZED recreational activities in Becker County within the past two years, where? (Choose all that apply).
Q3. What are the primary reasons you participate in recreational activities? (Choose all that apply).
Canoeing, kayaking, tubingSwimmingBicyclingWalkingHorseback ridingFishingHunting/shootingHarvesting/gathering (berries, mushrooms, etc.)Bird and wildlife watching/nature photographyGeocachingHiking/backpacking/picnickingCampingRollerbladingSkateboardingGolf/tennis
Downhill skiingIce fishing/spearingSledding/tubing/ice skatingSnowshoeing/cross-country skiing
Water sports (boating/jet skiing)ATV (all-terrain vehicles)OHM (off-highway motorcycles)4-wheel-drive (off-road) truckSnowmobilingTouring/sightseeing
A. Warm weather activities Yes No
Private land Public land Trails Roads DitchesLakes Rivers Wetlands Forests
Improve skillsPhysical activity
RelaxationSolitude
Spending time with family/friendsGetting close to nature Other (specify)
• Use a pencil or blue or black pen.• Fill bubbles completely.• Do not mark answers with �s or �s.
Correct Mark:
Incorrect Marks:
Not at allimportant
Veryimportant
Recreational Activities (1=Not at all important; 5=Very important) Have youparticipated?
1 2 3 4 5 Y Na.b.c.d.e.f.g.h.i.j.k.l.m.n.o.
a.b.c.d.
a.b.c.d.e.f.
B. Cold weather activities
C. Motorized activities
D. Other
1 2 3 4 5 Y N
1 2 3 4 5 Y N
1 2 3 4 5 Y N
1 2 3 4 5 Y N
1 2 3 4 5 Y N
1 2 3 4 5 Y N
1 2 3 4 5 Y N
1 2 3 4 5 Y N
1 2 3 4 5 Y N
1 2 3 4 5 Y N
1 2 3 4 5 Y N
1 2 3 4 5 Y N
1 2 3 4 5 Y N
1 2 3 4 5 Y N
1 2 3 4 5 Y N
1 2 3 4 5 Y N
1 2 3 4 5 Y N
1 2 3 4 5 Y N
1 2 3 4 5 Y N
1 2 3 4 5 Y N
1 2 3 4 5 Y N
1 2 3 4 5 Y N
1 2 3 4 5 Y N
Did not participateOther (specify)
Fun
1 2 3 4 5 Y N
1 2 3 4 5 Y N

Q5. How often, during each season, do you or members of your household engage in recreational activities in Becker County?
Q6. Becker County is responsible for reviewing and making improvements to county parks, lake accesses, and county-managed tax-forfeited land. Using a 1 to 5 scale, with 1 being "not at all satisfied" and 5 being "very satisfied," how satisfied have you been with the following areas and amenities in Becker County recreational areas?
Q7. If you were not satisfied with the areas and amenities at county parks, lake accesses, or county-managed tax-forfeited land within Becker County, why not? (Choose all that apply).
Q8. Should Becker County expand its park system?Q8a. Why or why not?
Q9. During the last two years, how often did you or members of your household visit each of the following recreational locations in Becker County?
None
Q4. How many miles are you willing to travel in order to engage in recreational activities in Becker County?
Spring (March-May)Summer (June-August)Fall (September-November)Winter (December-February)
Season
Amenities
Less than 5 miles5 to 9 miles
10 to 19 miles20 to 39 miles
40 to 59 miles60 miles or more
Number of times
None1 2 3 4
Less than 5 5 to 19 20 or more
1 2 3 4
1 2 3 4
1 2 3 4
Not at allsatisfied
Verysatisfied
ParksTrailsForest roadsBoat launchesCamp sitesPicnic areasSwimming beaches
RestroomsBenchesParking lotsSignage
a.b.c.d.e.f.g.
h.i.j.k.
5 N/A1 2 3 4
Notapplicable
5 N/A1 2 3 4
5 N/A1 2 3 4
5 N/A1 2 3 4
5 N/A1 2 3 4
5 N/A1 2 3 4
5 N/A1 2 3 4
5 N/A1 2 3 4
5 N/A1 2 3 4
5 N/A1 2 3 4
5 N/A1 2 3 4
CrowdedNeeded cleaning
NoisyNeeded grooming/repairs Other (specify)
Yes No
LocationsLocal parks, recreation areas, preserves (Dunton Locks, Sucker Creek, etc.)National wildlife refuges (i.e., Tamarac, Hamden Slough)Wildlife management areas (Callaway, Hubbel Pond, White Earth, etc.)State and county forests (i.e., Smokey Hills, Two Inlets, White Earth)Itasca State ParkGreenwater Scientific and Natural Area Lakes/Lake accessesRivers
a.b.c.d.e.f.g.h.
Lessthan 5
1 2 3 4 5
5 to19
20 ormore
Notfamiliar
withlocation
Number of times
1 2 3 4 5
1 2 3 4 5
1 2 3 4 5
1 2 3 4 5
1 2 3 4 5
1 2 3 4 5
1 2 3 4 5
Areas
Inconvenient hours

Walkable Communities
Q10. Becker County strives to create high-quality recreational experiences by ensuring the long-term sustainability of county-administered lands, by protecting natural resources, and by balancing recreational activities among all users. Using a 1 to 5 scale, with 1 being "not at all important" and 5 being "very important," how important are each of the following factors in contributing to your recreational experience?
Connectivity to other amenities (restaurants, bathrooms, etc.)Environmental impactNatural resource protectionRecreational activities for local economyProximity to existing recreational trails/parksNew recreational opportunitiesCounty management of recreational resourcesScenery/aestheticsPreservation areasBiological diversitySolitudeCommunal gatheringsParks and Recreation ordinance enforcementOther (specify)
Factors Not at allimportant
Veryimportant
1 2 3 4 5a.b.c.d.e.f.g.h.i.j.k.l.m.n.
1 2 3 4 5
1 2 3 4 5
1 2 3 4 5
1 2 3 4 5
1 2 3 4 5
1 2 3 4 5
1 2 3 4 5
1 2 3 4 5
1 2 3 4 5
1 2 3 4 5
1 2 3 4 5
1 2 3 4 5
1 2 3 4 5
Q11. Have you or members of your household ever experienced a conflict or interference while engaging in a recreational activity that diminishes the quality of your recreational experience on Becker county-managed land?
11a. If yes, what was the conflict or interference?
11b. Where did the conflict or interference occur?
Walkability is a measure of how friendly an area is to walking. Walkability has many health, environmental, and economic benefits. Factors influencing walkability include the presence or absence and quality of footpaths, sidewalks, or other pedestrian right-of-ways, traffic and road conditions, land use patterns, building accessibility, and safety, among others.
Q12. Using a 1 to 5 scale, with 1 being "not at all walkable" and 5 being "very walkable," please tell us how walkable your community is.
Not at all walkable
Verywalkable
Q13. Please tell us which of the following destinations you would walk or bicycle to if they were within 15 minutes of your home or place of work. (Choose all that apply for each mode).
Walk BicycleI would not
do either
Notapplicable
YesNo
1 2 3 4 5
Community recreation centerNeighborhood retail and restaurantsPost office/public library/city government officeMedical facilityYour work place/volunteer siteYour school or your children’s schoolYour place of worshipParksTrailsOther (specify)
Destinationsa.b.c.d.e.f.g.h.i.j.
1 2 3
1 2 3
1 2 3
1 2 3
1 2 3
1 2 3
1 2 3
1 2 3
1 2 3
1 2 3
N/A

Q14. Using a 1 to 5 scale, with 1 being "strongly disagree" and 5 being "strongly agree," please tell us your level of agreement with each of the following statements:
Q15. What is your age?
Stronglydisagree
Stronglyagree
Increasing non-motorized transportation (biking and walking) and decreasing automobile use is important for improving PUBLIC HEALTH.
Increasing non-motorized transportation (biking and walking) and decreasingautomobile use is important for the ENVIRONMENT.
Increasing non-motorized transportation (biking and walking) and decreasingautomobile use is important for SAVING MONEY.
Becker County needs more off-road bicycle trails.
Becker County needs more on-road bicycle lanes.
Becker County should commit to accommodating non-motorized transportationto the extent feasible on new and reconstructed county roads.
Cities and towns in Becker County need more sidewalks.
Cities and towns in Becker County need more on-road bicycle lanes.
Cities and towns in Becker County need more bicycle racks.
Cities and towns in Becker County should commit to accommodatingnon-motorized transportation to the extent feasible on new andreconstructed municipal roads.
a.
b.
c.
d.
e.
f.
g.
h.
i.
j.
51 2 3 4
Younger than 18 years old18 to 29
Q18. Are you the parent or primary caregiver of a child or children 18 years of age or younger?
Q19. What is your gender?
Please provide any comments or concerns you may have about recreational activities in Becker County.
51 2 3 4
51 2 3 4
51 2 3 4
51 2 3 4
51 2 3 4
51 2 3 4
51 2 3 4
51 2 3 4
51 2 3 4
Demographics - Please tell us about yourself.
30 to 4445 to 6465 to 7475 years or older
Q16. What best describes your race and ethnicity? (Choose all that apply).
WhiteBlack/African AmericanNative American/Alaska NativeAsian/Pacific IslanderHispanicOther (specify)
Q17. What is your approximate annual household income before taxes?
Less than $20,000$20,000 to $39,999$40,000 to $69,999$70,000 to $119,999$120,000 or moreDo not know
Yes NoMale Female
Thank you!