Embed Size (px)
Citation preview

2012 Quota Practices StudyExecutive Summary and Key FindingsExecutive Summary and Key Findings
Sponsored by Better Sales Compensation and WorldatWork
Ted Briggs, [email protected], 310-245-4686Clinton Gott, [email protected], 310-968-3408
Jim Stoeckmann, [email protected], 480-304-6876

Table of Contents
• About the Study, Participating Companies, and Sponsors (pages 3-7)• Executive Summary (9-12)• Full Report
– More on Participating Companies (14-17)– Quota Process Owners (18-19)– Software Tools and Data Utilized in Process (20-26)– Quota Setting Process (27-36)– Quota Communication (37-41)– Quota Adjustments (42-48)– Perceptions and Results (49-58)– Priorities, Challenges and Additional Feedback – Open Comments (59-63)
2

About the Study
Better Sales Comp Consultants (BSC) and WorldatWork are pleased to sponsor the 2012 Quota Practices Study.
The survey includes responses from 83 people across a range of key quota‐related topics. This report includes two main sections:
1 E ti S i l d fi di lt th t th f d1. Executive Summary: includes findings or results that the sponsors found particularly interesting or relevant.
2. Full Report: provides details on every question – particularly useful if you want to drilldown to specific areas of interest.
For some questions, we report total population findings. For others and where of interest, we split out between “high performance” and “average/low” performance.
After reviewing the results, we are available to discuss any observations or findings. We think there are a number of findings that you’ll want to factor in as you consider your quota‐setting process. Thank you to those who participated in this study!
3

Participating Companies
• AAA Arizona• ACI WorldwideAd t S ft
• Intel Corporation• Juniper NetworksK ft F d
The 83 responses came from the following list of companies:
• Cornerstone Software• Cyberonics, Inc.Di i D t
• Spansion• Spectrum BrandsSt l S it• Advent Software
• Alactel‐Lucent• Allergan• Allstate• AMD
• Kraft Foods• Kronos Incorporated• Longview Fibre Paper and Packaging
• LSI Corporation
• Dimension Data• Dr. Pepper Snapple Group• EMC• Equifax• Experian
• Stanley Security Solutions
• Success Factors• Syngenta• Technology Learning
• Analog Devices• Applied Materials• Atmel• Autodesk, Inc.• Avery Dennison
p• McAfee, Inc.• Mercuri Int• MRA• Nationwide Insurance• NCR
p• First West Credit Union• Frito Lay• Galderma Labs• Garden View• Ger Eck LLC
gy gGroup
• Tellabs Operations Inc.• Teranet• Tiffany & Co.• TransUnion• Avery Dennison
• AWCC• BD Biosciences –Discovery Labware
• BCBS – Minnesota
• NCR• Novell, Inc.• Nuance• Oakwood• PCTEL, Inc
• Ger‐Eck, LLC• Great‐West Life & Annuity• GreenStone Farm Credit Services
• Hewlett Packard
• TransUnion• U.S. Bank• Unisys Corporation• Valmont Industries, Inc• Verigy
• BMC Software• Broadcom• Canada Post Corporation• Ceridian Canada Ltd.• Citrix Systems
• Pfizer Animal Health• Rockwell Automation• SanDisk Corporation• Sanofi Pasteur• Schwan Foods
• Hilton Worldwide• Hospira Worldwide, Inc.• i365• IBMIngersoll Rand
• Wells Fargo• Xerox• Zebra Technologies Corporation
4
Citrix Systems• Commscope
Schwan Foods• Slaud Total Eps
Ingersoll Rand• Insight

Participating Companies
Role Count Percent
The survey was completed by various functions within each company:
Sales Operations Management 27 33%Sales Compensation Manager 21 25%Human Resources Management 9 11%Sales Compensation Analyst 7 8%Sales Finance 6 7%Sales Management 5 6%Finance ‐ Corporate 2 2%All Compensation Management 1 1%All Compensation Management 1 1%Benchmarking Analyst 1 1%Corporate Compensation 1 1%Director 1 1%Director Compensation 1 1%Director Compensation 1 1%Regional Director 1 1%
The survey included a high prevalence of perspectives from sales operations andThe survey included a high prevalence of perspectives from sales operations and
5
The survey included a high prevalence of perspectives from sales operations and sales compensation management, as one would expect.
The survey included a high prevalence of perspectives from sales operations and sales compensation management, as one would expect.
About Better Sales Comp Consultants
• We are a boutique consulting firm focused on creating better sales• We are a boutique consulting firm focused on creating better sales compensation programs and better sales effectiveness for our clients
• We offer a premier consulting experience – using only senior resources in a high touch and flexible model means better solutions and value for the moneyg y
BSC Consulting Team• Ted Briggs, Clinton Gott, Datta Davé, Per Torgersen, and Larry Novicich
feature over 75 years of sales effectiveness and compensation experience and held leadership roles at AGI, Sibson, Watson Wyatt, Deloitte, and Synygy
• Members of our team have over a dozen years of work experience togetherO d l i f d i l l d li ll b ti d t hi• Our model is focused on senior level delivery, collaboration, and partnership with our clients
For more information, contact Ted Briggs ([email protected])For more information, contact Ted Briggs ([email protected])
6
For more information, contact Ted Briggs ([email protected]) and Clinton Gott ([email protected]) or visit www.bettersalescomp.com.
For more information, contact Ted Briggs ([email protected]) and Clinton Gott ([email protected]) or visit www.bettersalescomp.com.

About WorldatWork
WorldatWork (www.worldatwork.org) is a not-for-profit organization providing education, conferences and research focused on global human resources issues, including compensation, sales compensation and integrated total rewards to attract, motivate and retain a talented workforcemotivate and retain a talented workforce.
WorldatWork is the leader in sales compensation education and knowledge sharing on a worldwide basis. We bring together the science and art of sales compensation design, to help companies ensure that their sales compensation programs remain current and to e p co pa es e su e t at t e sa es co pe sat o p og a s e a cu e t a deffective.
Founded in 1955, WorldatWork has nearly 30,000 members in more than 100 countries. Its affiliate organization, WorldatWork Society of Certified Professionals®, is the
f f C f S C f (CSC )certifying body for the prestigious Certified Sales Compensation Professional (CSCP)™ and other professional designations. WorldatWork has offices in Scottsdale, Ariz., and Washington, D.C.
F i f ti t t Ji St k t ji t k @ ld t kF i f ti t t Ji St k t ji t k @ ld t k
7
For more information, contact Jim Stoeckmann at [email protected] or visit www.worldatwork.org/salescompensation
For more information, contact Jim Stoeckmann at [email protected] or visit www.worldatwork.org/salescompensation

Table of Contents
• About the Study, Participating Companies, and Sponsors (pages 3-7)• Executive Summary (9-12)• Full Report
– More on Participating Companies (14-17)– Quota Process Owners (18-19)– Software Tools and Data Utilized in Process (20-26)– Quota Setting Process (27-36)– Quota Communication (37-41)– Quota Adjustments (42-48)– Perceptions and Results (49-58)– Priorities, Challenges and Additional Feedback – Open Comments (59-63)
8

Executive Summary (1/4)
1. Results during these challenging economic times appear to be more positive– 46% reported performing “better than industry”– Only 33% provided the same positive answer in our 2010 sales operations survey
2. Majority of salespeople are performing at or above goal – although companies generally target more to be at higher achievement levels than actually occurs
– While 56% have at least half of reps above goal, only 39% have at least “60% or reps above p g y pgoal”
– Meanwhile, for those with targeted attainment results, 55% desire to have at least “60% of reps above goal”
– Counter to best practice, 23% of those with targets desire fewer than “50% of reps above goal”
3. Overall, there are favorable perceptions of the quota-setting process and overall quota accuracy
– More than twice as many respondents (59%) felt their quota-setting process was at least somewhat effective versus ineffective (24%)
– 68% of respondents felt their quotas were “very accurate”, “accurate” or “somewhat accurate”
4. However, most quota-setting processes still appear to lack sophistication– “Last year plus” remains the most prevalent quota-setting approach (84% of respondents)– Only 29% use external third party data (e.g., D&B, Hoovers, IDC) when considering quotas
9

Executive Summary (2/4)
5. And companies are using the “same old” tools while looking for a better solution– Excel-based (73%), BI/Analytics tools (23%) and internally developed applications (21%) were
still the predominant tools used in the quota-setting process – Only 6% were using quota-setting applications in their SPM solution– 70% of companies plan to make upgrades to the quota tools being used today, primarily
focused on SPM or BI solutions
6. There does appear though to be effective clarity in quota process ownership –and the ownership typically falls within a role connected to the sales organization
– 77% of companies categorized process ownership as “at least somewhat effective”– 71% identified ownership as being found in the sales organization (sales, sales planning,
sales operations, sales finance)– Over half of respondents said “frequent collaborative sessions” were the best means by which
to reach consensus while some (16%) said there was “no good way to reach consensus”
7 R i d th d f i t d t li ti i th7. Responses were mixed on the degree of consistency and centralization in the quota-setting process
– 39% centralized process/decentralized decisions 35% centralized process/centralized decisions, and 26% decentralized process/decentralized decisions,
– While almost half of the respondents claim to have consistent quota process across the organization, many allow for variations by BU, geography, or channel
10

Executive Summary (3/4)
8. Quota process timing results were not surprising– 81% of companies start the quota-setting process at least two months before the start of the
fiscal year start– And about 50% required between 2 and 3 months to complete the process
9. And of key importance, overall quota-setting practices align to conventional best practice viewpoints
– Minimal quota over-allocation• Less than half (43%) over-allocate to salespeople; only 31% over-allocate between 1st and 2nd line
managers• When over-allocating, very few do so at greater than 10%
Greater reliance on individual opportunity vs role based goals– Greater reliance on individual opportunity vs. role-based goals• Nearly three times as many companies base quotas on potential individual opportunity in
accounts/territories as compared to role-specific expectations– Continued prevalence of annual measurement periods
• While some have recently questioned the correct quota timeframe to use, 81% still set quotas on an y q q , qannual basis
– There is at least some inclusion of bottom up growth planning• Only 17% of respondents use an entirely top down quota-setting approach• 60% of companies factor in bottom up planning with at least a 25% weighting factor when setting
quotasquotas
11
Executive Summary (4/4)
10. In terms of communication, companies expressed strong results in quota rollout timing and were willing to share plan information before quotas are ready
– About half of companies communicate quota in the first four weeks of the fiscal year– 33% of companies communicate quotas after the first month– The most typical response (63% of respondents) cited one-on-one meetings as the most
prevalent approach for the communication of quotas– About 86% of companies at least sometimes rollout compensation plan information before
having quotas ready to communicate
11. Meanwhile, quota adjustments are still avoided, used sparingly when needed, and have been surprisingly unaffected by the current economy
– Over 80% of companies never or “rarely” make quota adjustments– Over 60% of companies adjust fewer than 10% of quotas per year, while 10% adjust 50% of
more of the direct sales rep quotas– 62% claim that the current economy is having no impact on quota adjustments while 23% claim
they are having to review quotas more oftenthey are having to review quotas more often– Top drivers of quota adjustments are changes to disruptive changes to market (55%), coverage
model (54%), and errors in quota setting (43%)
Pl th i i f h d t il th d th t iPl th i i f h d t il th d th t i
12
Please see the remaining pages for much more detail on these and other topicsPlease see the remaining pages for much more detail on these and other topics

Table of Contents
• About the Study, Participating Companies, and Sponsors (pages 3-7)• Executive Summary (9-12)• Full Report
– More on Participating Companies (14-17)– Quota Process Owners (18-19)– Software Tools and Data Utilized in Process (20-26)– Quota Setting Process (27-36)– Quota Communication (37-41)– Quota Adjustments (42-48)– Perceptions and Results (49-58)– Priorities, Challenges and Additional Feedback – Open Comments (59-63)
13

More on Participating CompaniesPrimary Business of Company
10%
14%
Financial Services and Insurance
Software
8%
10%
Healthcare
Manufacturing
5%
5%
8%
N t k/T l E i t/S l ti
Consumer Products
Semi‐Conductor
40%
5%
0% 5% 10% 15% 20% 25% 30% 35% 40% 45%
Other
Network/Telecom Equipment/Solutions
• Other (three or less per response) responses from 33 companies: Agriculture, Assisted Living, Automation / Engineering Solutions for manufacturing Industries, Business Services, Business Services Outsourcing, Business Systems, Combination HW, SW, Services, Professional Services, Communications / Logistics, Communications/Telecomm/Data Services, consulting and training, Credit Reporting/Data Analytics, Document Products & Solutions, Education/business services, Food/Beverage or Fast-Moving Consumer Goods, Hardware, High Technology, Hospitality, HW/SW/Services, Medical Device, Membership with insurance, travel, auto repair and towing, Retail Trade, Semiconductor Equipment/Software/Services, Services, Vaccines, Wholesale Trade, Workforce Management SSolutions
14
Total number of responses in study = 83Total number of responses in study = 83

More on Participating CompaniesPublic/Private and Geographic Presence72% of companies participating are publicly traded (or a subsidiary of a publicly traded company), 25% are privately held with two participants being government affiliated or non‐profit. COMPANY TYPE
25%
6%
1% 1%Publicly traded company
Privately held company
Subsidiary of publicly
66%
traded companyGovernment Affiliated
Non‐profit
Although most participating companies are headquartered in North America 60%
4%
26 to 50% of revenues are international
Although most participating companies are headquartered in North America, 60% reported that at least 25% of revenues come through international channels.
REVENUE (DOMESTIC VS INTERNATIONAL)
36%
18%
11%
11%26 to 50% of revenues are international
51 to 75% of revenues are international
Domestic only
11 to 25% of revenues are international
Headquarter Location CountNorth America 73Europe, Middle East, Africa 8Asia Pacific 1
20%
18%</= 10% of revenues are international
>75 of revenues are international
15
South America 1

More on Participating CompaniesSales Compensation Participation and Budget
18%
20%
251‐500
1001‐2500
The number of employees participating in sales compensation programs varies…# OF EMPLOYEES PARTICIPATING IN SALES COMP PROGRAMS
7%
14%
16%
16%
10 000
501‐1000
101‐250
<100
4%
5%
7%
0% 5% 10% 15% 20% 25%
5001‐10,000
2501‐5000
>10,000
…as does the amount companies planned sales compensation spend (salary and
10% $10,000,001‐$50,000,000
…as does the amount companies planned sales compensation spend (salary and incentive budget) in the current fiscal year.
SALES COMP BUDGET FOR CURRENT FISCAL YEAR
36%
16%
11% </=$10,000,000
$50,000,001‐$100,000,000
$100,000,001‐$250,000,000
27% >$250,000,000
16Note: Two respondents did not specify their sales compensation budget.

More on Participating CompaniesSales Performance of CompaniesParticipating companies were asked to self‐report their company’s past year sales results compared to their industry peers and competitors. 46% (38 companies) stated they performed at a higher level, 45% (37 companies) stated they performed at median or
f d 9% (7 i ) t t d th f d l th th iaverage performance and 9% (7 companies) stated they performed lower than their industry peers and competitors.
PAST YEAR SALES PERFORMANCE OF PARTICIPATING COMPANIES
%
9%Higher performance
46%
45%
Median or average performance
Lower performanceLower performance
Where appropriate, we segment and report responses by higher performance versus Where appropriate, we segment and report responses by higher performance versus
17
average/lower performance companies.average/lower performance companies.Note: One participant did not respond.

Quota Process OwnersEffectiveness of Clarity around Ownership/RolesJust over 77% of respondents reported that effectiveness of clarity around ownership and participatory roles was at least somewhat effective.
EFFECTIVENESS AROUND OWNERSHIP AND PARTICIPATORY ROLES
36%
5%
Effective
Very effective
10%
36%
Neither ineffective or effective
Somewhat effective
6%
6%
Ineffective
Somewhat ineffective
1%
0% 5% 10% 15% 20% 25% 30% 35% 40%
Very ineffective
The following slide highlights where ownership is held and the process throughThe following slide highlights where ownership is held and the process through
18
The following slide highlights where ownership is held and the process through which consensus is reached.
The following slide highlights where ownership is held and the process through which consensus is reached.

Quota Process OwnersOwnership of the ProcessMost respondents stated there is a dedicated owner of the annual sales planning process. Nearly 71% of respondents stated owners report to sales, sales planning, sales ops or sales finance. QUOTA PROCESS OWNERSHIP
12%
14%
34%
R i S l
Reporting to Finance
No, but there is a sales planning team
Reporting to Sales Operations
Responses to ‘Other’: Decentralized approach , Shared ownership (Sales, Fin, HR & C ) R i l
10%
7%
11%
12%
Other
Reporting to another functional area
Reporting to Sales Finance
Reporting to Sales HR & Comp), Regional Director, Reporting to HR, Triangulation between finance, and sales & marketing, Typically belonged to the sectors, Sales Ops and/or Sales
Response PercentFrequent collaborative sessions 53%W d t h d f hi 16%
0% 5% 10% 15% 20% 25% 30% 35% 40%
and/or Sales
Consensus is typically reached by frequent collaborative sessions:
%%We do not have a good way of reaching consensus 16%Infrequent collaborative sessions 12%Total involvement by all functions throughout the process 12%Each division does their own plans 1%Other 1%Quality Assurance Team 1%
16% indicated there was “no good way to
reach ”!
16% indicated there was “no good way to
reach ”!
yRegional Director collaborates with Board of Directors 1%Sales Management top down allocation 1%Senior leadership consensus 1%
19
consensus”!consensus”!

Software Tools Utilized in ProcessTypes of Tools UtilizedOf interest, most companies still do not utilize externally developed solutions and still rely largely on Excel‐based or homegrown solutions.
SOFTWARE TOOLS UTILIZED FOR QUOTA SETTINGQ
15%21%23%
73%
Module within another internal applicationInternally developed planning application
Business Intelligence/Analytics toolExcel or similar tool
1%2%6%
14%15%
Wide variety of tools used in the orgWorkflow management solution
SPM/EIM solutionAccess or similar application
Module within another internal application
1%1%1%1%
Hotel specific software for account managementUnsure
Salesforce.comSalient application
y g
The following slide segments practices based on effectiveness of tools utilizedThe following slide segments practices based on effectiveness of tools utilized
1%1%
0% 10% 20% 30% 40% 50% 60% 70% 80%
Consultanting firm software solutionDiver
20
The following slide segments practices based on effectiveness of tools utilized.The following slide segments practices based on effectiveness of tools utilized.
Note: Two participants did not provide a response and several companies provided multiple responses.

Software Tools Utilized in ProcessEffectiveness of Tools UtilizedCompanies that characterize their tools as being at least somewhat effective then to use home grown solutions (Excel or Access). Those citing “Other” do tend to use cite 3rdparty solutions.
EFFECTIVENESS OF TOOLS UTILIZED COMPARED TO TOOLS UTILIZED
ResponseExcel or
similar toolAccess or
similar app
Internally developed
planning appSPM/EIM solution
Business Intelligence/ Analytics tool
Workflow management
solution
Module within another
internal app OtherVery ineffective 1 0 0 0 0 0 0 0Ineffective 5 1 0 0 1 0 0 0Somewhat ineffective 4 1 2 0 0 0 0 0Neither ineffective or effective 5 1 4 1 3 2 2 0Somewhat effective 20 4 4 2 6 0 5 3Effective 21 3 6 2 8 0 5 3Very effective 3 1 1 0 1 0 0 1
33%
33%
Business Intelligence/Analytics tool
SPM/EIM solution
70% of companies plan to make changes or upgrades to the tools they currently use.PLANNED CHANGES/UPGRADES TO TOOLS
16%
17%
21%
24%
Internally developed planning application
Workflow management solution
Excel or similar tool
Other
7%
10%
0% 5% 10% 15% 20% 25% 30% 35%
Access or similar application
Module within another internal application
21

Software Tools Utilized in ProcessVariance Across Geo/BU/ChannelNearly 50% of companies tend to utilize tools consistently, with the remainder citing some variance across business unit, geography and channel.
UTILIZATION OF TOOLS WITHIN THE COMPANY (DIFFERENCES BY GEO/BU/CHANNEL)
49%30%
9%
No, do not vary Business Unit
33%Geography Channel
22Note: Four participants did not provide a response to this question.

Data Utilized in ProcessFactors Utilized to Set QuotasThere is a wide range of factors utilized when setting quotas, although last year plus is still the most cited input.
FACTORS UTILIZED TO SET QUOTAS
63%
84%
Qualitative based on management experience
Last year plus
46%
53%
Field feedback
Account planning sessions
17%
27%
Other
Algorithm
0% 10% 20% 30% 40% 50% 60% 70% 80% 90%• Responses to ‘Other’: Channel investments, Growth rate inputs from Finance on key customers/channels, Historical activity results
expectations, ROI Minimum, Industry/Local Knowledge of Investment in New Projects, Input from Marketing, Must match to budget, National averages, Revenue target, Unsure, Quotas that meet strategic goals, Salesforce.com (CRM) pipeline data, Seasonality,State and government vaccines policies, and Varies by BU
Th f ll i lid t th f t b d hi h fTh f ll i lid t th f t b d hi h f
23
The following slide segments these factors based on higher performance versus average/lower performance companies.
The following slide segments these factors based on higher performance versus average/lower performance companies.
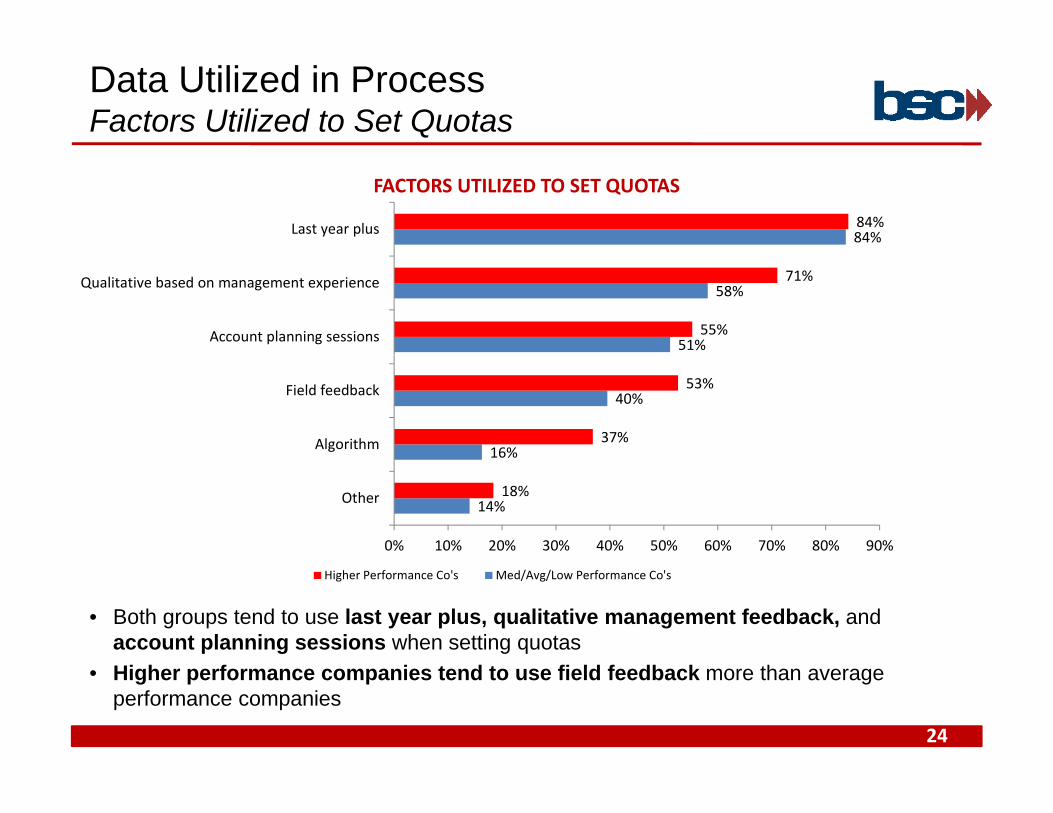
Data Utilized in ProcessFactors Utilized to Set Quotas
84%84%Last year plus
FACTORS UTILIZED TO SET QUOTAS
51%
58%
55%
71%
Account planning sessions
Qualitative based on management experience
16%
40%
37%
53%
Algorithm
Field feedback
14%18%
0% 10% 20% 30% 40% 50% 60% 70% 80% 90%
Other
Higher Performance Co's Med/Avg/Low Performance Co's
• Both groups tend to use last year plus, qualitative management feedback, andaccount planning sessions when setting quotas
• Higher performance companies tend to use field feedback more than average performance companies
24

Data Utilized in ProcessData Utilized (Channel and 3rd Party)Channel Data. Only three companies mentioned a different data set is utilized for overlay/channel quota setting. Two of those are in the high performing population.
3rd Party Data. We were surprised to find that only 29% stated they used a 3rd party (e.g.,
6IDC
D&B, IDC, Gartner, etc.) when setting quotas.UTILIZATION OF 3rd PARTY DATA
4
6
D&B
GartnerResponses to ‘Other’: Equifax,Fenalco, Cerulli, Project Monitor/Project Today, CRN, OneSource, Puget Sound Business Journal IMS Wolters
10
0 2 4 6 8 10 12
Other
Of th i th t t t d th 3rd t d t id d dditi l d t il
Business Journal, IMS, WoltersKluwer, Hospitality Specific, and Numerous 3rd Party Forecasts
Of the companies that stated they use 3rd party data, some provided additional details stating they factor 3rd party data elements into goal setting as follows:• Product Trends: new technology releases, life and health insurance, potential model at product level• Geo Distribution of Business/Growth Rates: figure out buying centers
M k t P t ti l h l id tif i d t th t ti l l t t IT d f t lif
25
• Market Potential: help identify industry growth expectations, calculate systems IT spend for accounts, life planning, internal potential model, potential at product level
• Other: customer structure

Data Utilized in ProcessAccuracy of Data79% of respondents cited data as being at least somewhat reliable/accurate to very reliable/accurate.
ACCURACY AND RELIABILITY OF DATA
28%
4%
Reliable/accurate
Very reliable/accurate
15%
47%
Neither unreliable/inaccurate or reliable/accurate
Somewhat reliable/accurate
0%
3%
4%
Very unreliable/accurate
Unreliable/inaccurate
Somewhat unreliable/inaccurate
0%
0% 5% 10% 15% 20% 25% 30% 35% 40% 45% 50%
Very unreliable/accurate
Surprisingly only 4% of companies stated that their data is very reliable/accurateSurprisingly only 4% of companies stated that their data is very reliable/accurate
26
Surprisingly, only 4% of companies stated that their data is very reliable/accurate.Surprisingly, only 4% of companies stated that their data is very reliable/accurate.
Note: Eight participants did not respond to this question.

Quota Setting ProcessApproach for Most Populated Direct Sales Role
66%Individual Opportunity (territory/account) based
66% of companies stated that for their most populated direct sales role, quotas are set based only on individual opportunity versus 27% just on the role alone.
QUOTA SETTING METHODOLOGY
1%
1%
1%
27%
66%
Individual and customer and/or team
Mix of both above
Utilize both
Role based
Individual Opportunity (territory/account) based
1%
1%
1%
0% 10% 20% 30% 40% 50% 60% 70%
Combination
Combination of individual and role based
first territory then ROI minimum
Discrete measurement periods for this role tend to be annual or quarterly
8%12%
30%81%
Semi‐annuallyMonthlyQuarterlyAnnually
Discrete measurement periods for this role tend to be annual or quarterly.DISCRETE MEASUREMENT PERIOD
1%1%1%1%2%
8%
D ilMulti‐year
Quarterly bonusesSome KPIs measured Quarterly, Semi‐Anually, etc.
TrimesterWeekly
Semi annually
1%1%
0% 10% 20% 30% 40% 50% 60% 70% 80% 90%
Annual with quarterly seasonalityDaily
27

Quota Setting ProcessCentralization vs. DecentralizationHigher performance companies tend to utilize a centralized or corporate led process when setting quotas.
LEVEL OF CENTRALIZATION VERSUS DECENTRALIZATION – BY SEGMENT
14%
21%
18%
26%
Corporate led process with geographic region decisionmaking
Centralized process led by corporate staff (e.g, global salesoperations team, global finance team)
21%
12%
14%
18%
13%
Corporate led process with business unit decision making
Centralized process led by corporate staff with business unitrepresentation
making
21%
9%
13%
11%
C t li d d i b b i it ith
Decentralized process led by business units
Decentralized process led by geographic regions
2%0%
0% 5% 10% 15% 20% 25% 30%
Centralized process driven by business units withopportunity for Sales to adjust locally
Higher Performance Co's Med/Avg/Low Performance Co's
28

Quota Setting ProcessApproach towards Centralization vs. DecentralizationThere has been little change to the balance of centralization vs. decentralization across the survey population.
CHANGES IN APPROACH OVER THE PAST THREE YEARS
9%
70%
18%
71%
Yes, it is more formal
No, we use the same approach
14%
5%
3%
8%
Yes, it is more centralized
Yes, it is less centralized
0% 10% 20% 30% 40% 50% 60% 70% 80%
Higher Performance Co's Med/Avg/Low Performance Co's
Companies tend to favor a balanced approach, with a skew toward centralization.1% 1% 1% Balance between centralization and decentralization
M t li ti th d t li ti
45%8%
7%More centralization than decentralization
More decentralization than centralization
Complete centralization
Complete decentralization
Global process, BU ownership to execute within common process
29
36%Global process, BU ownership to execute within common process
Process & Broader expectations Should be Centralized and #s finalized;how they arrive at it is decentralised
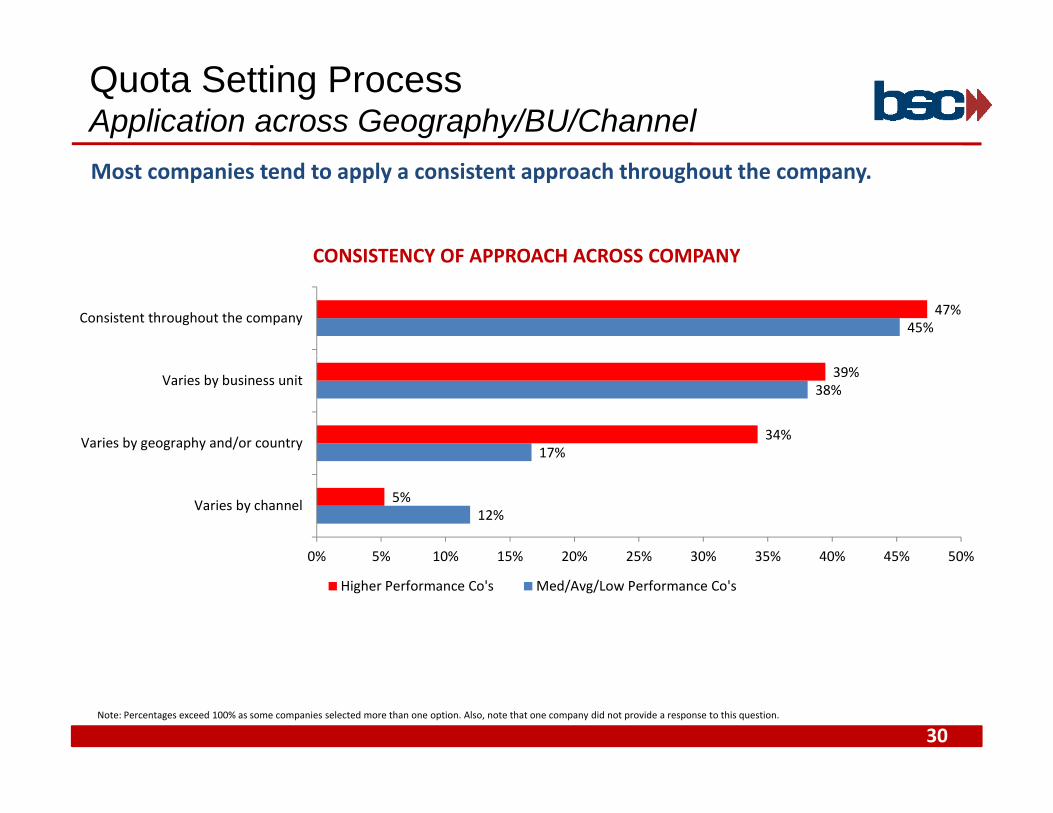
Quota Setting ProcessApplication across Geography/BU/ChannelMost companies tend to apply a consistent approach throughout the company.
CONSISTENCY OF APPROACH ACROSS COMPANYCONSISTENCY OF APPROACH ACROSS COMPANY
45%47%Consistent throughout the company
17%
38%
34%
39%
Varies by geography and/or country
Varies by business unit
12%5%
0% 5% 10% 15% 20% 25% 30% 35% 40% 45% 50%
Varies by channel
0% 5% 10% 15% 20% 25% 30% 35% 40% 45% 50%
Higher Performance Co's Med/Avg/Low Performance Co's
30Note: Percentages exceed 100% as some companies selected more than one option. Also, note that one company did not provide a response to this question.

Quota Setting ProcessTop Down vs. Bottom Up83% of companies factor in some level of bottom up quota‐setting.
TOP DOWN VERSUS BOTTOM UP
27%
17%
90% top down/10% bottom up
100% top down/0% bottom up
7%
43%
50% top down/50% bottom up
75% top down/25% bottom up
1%
5%
10% top down/90% bottom up
25% top down/75% bottom up
p / p
0%
1%
0% 5% 10% 15% 20% 25% 30% 35% 40% 45%
0% top down/100% bottom up
10% top down/90% bottom up
31
0% 5% 10% 15% 20% 25% 30% 35% 40% 45%
Note: One company did not respond to this question.

Quota Setting ProcessInception of Quota Setting ProcessMost companies (81%) begin the quota setting process at least two months prior to the beginning of the fiscal year.
INCEPTION OF QUOTA SETTING PROCESSINCEPTION OF QUOTA SETTING PROCESS
14%
5%
5 months prior to fiscal year start
>6 months prior to fiscal year start
%
13%
14%
3 h i fi l
4 months prior to fiscal year start
5 months prior to fiscal year start
23%
25%
2 months prior to fiscal year start
3 months prior to fiscal year start
8%
11%
After fiscal year start
<1 month prior to fiscal year start
32
0% 5% 10% 15% 20% 25% 30%

Quota Setting ProcessDuration of Quota Setting Process50% of companies spend two to three months (from start to finish) on their quota setting process.
DURATION OF QUOTA SETTING PROCESS
h
21%
14%
15%
1%
3 months
4 months
5 months
6+ months
1%
8%
11%
29%
<2 weeks
2 to 4 weeks
1 months
2 months
Respondents were divided as to whether there is sufficient time in the process, with the majority of companies stating the duration was ‘just right’.
0% 5% 10% 15% 20% 25% 30% 35%Note: Three participants did not respond to this question.
53%29%
18%Just right
Not enough
33
29% Too much
Note: Five participants did not respond to this question.

Quota Setting ProcessOver-allocation of QuotaThe majority of the population (57%) do not over‐allocate quota from direct report to 1stLine Manager. Fewer still over‐allocate from 1st to 2nd line managers.
OVER‐ALLOCATION (DIRECT REPORT TO 1st LINE MANAGER)
• For those that do over-• For those that do over-19%
15%
57%
Yes (5% to 10%)
Yes (0% to 5%)
No
allocate from 1st line manager to direct report, very few do so at greater than 10%
allocate from 1st line manager to direct report, very few do so at greater than 10%
4%
5%
0% 10% 20% 30% 40% 50% 60%
Other
Yes (10% to 15%)
OVER‐ALLOCATION (1st LINE MANAGER TO 2nd LINE MANAGER) • The population showed less over-allocation from 1st line to 2nd line management – and at
• The population showed less over-allocation from 1st line to 2nd line management – and at 21%
69%
Yes (0% to 5%)
No
glower percentages
glower percentages
2%
5%
21%
h
Yes (10% to 15%)
Yes (5% to 10%)
Yes (0% to 5%)
34
2%
0% 10% 20% 30% 40% 50% 60% 70% 80%
Other
Note: Two participants did not respond to these questions.

Quota Setting ProcessEffectiveness of Quota Setting Process59% of companies felt their quota‐setting process was at least somewhat effective while 24% felt their process was somewhat ineffective or worse.
EFFECTIVENESS OF QUOTA SETTING PROCESS
2%Very effective
16%
38%
19%
Neither ineffective or effective
Somewhat effective
Effective
2%
2%
20%
Very ineffective
Ineffective
Somewhat ineffective
0% 5% 10% 15% 20% 25% 30% 35% 40% 45%
35Note: Two participants did not provide a response to this question.

Quota Setting ProcessMeasuring Effectiveness of Quota Setting ProcessBoth performance group segments focus most on the number of people reaching or exceeding goals and on compensation spend versus budget. Both groups also focus on assessment of quota corrections and adjustments. Eleven companies stated they do not
th ff ti f th i t ttimeasure the effectiveness of their quota setting process.MEASURING EFFECTIVENESS OF QUOTA SETTING PROCESS
73%71%Number of people reaching or exceeding goal
46%
73%
29%
63%
By assessing prevalence of quota corrections/adjustments during the year
Compare compensation spend versus budget and results
10%
32%
18%
18%We do not measure the effectiveness
By assessing prevalence of quota corrections/adjustments during the year
2%18%
0% 10% 20% 30% 40% 50% 60% 70% 80%
Other
Higher Performance Co's Med/Avg/Low Performance Co'sNote: Two participants did not provide a response to this question.
36
• Responses to ‘Other’: 'Nearness' by rep to 100% attainment, achievement distribution curves, assessing market share, driven by national result, fairness and equity, looking at goal versus growth, how quota size compares to industry peers.
p p p p q

Quota CommunicationTiming and Effectiveness of Communication
5%>1 month before fiscal year start
46% of companies communicate new quotas within the first four weeks of the fiscal year, while 33% communicate later…
23%
35%
11%
16%
5 ‐ 8 weeks after fiscal year start
2 ‐ 4 weeks after fiscal year start
<2 weeks after fiscal year start
<1 month before fiscal year start
• 74% of companies • 74% of companies
1%
9%
0% 5% 10% 15% 20% 25% 30% 35% 40%
>8 weeks after fiscal year start
9 ‐ 12 weeks after fiscal year start
… while 86% communicate new comp plan information (e.g.,
state their current communication process is somewhat effective, effective or very effective.
state their current communication process is somewhat effective, effective or very effective.
Note: Two companies did not provide a response to this question.
59%Yes
… while 86% communicate new comp plan information (e.g., measures, weightings, mechanics, etc.) before having quotas
very effective.
• 17% state their process is somewhat ineffective or
very effective.
• 17% state their process is somewhat ineffective or
7%
7%
27%
Yes infrequently
No
Yes, sometimes ineffectiveineffective
7%
0% 10% 20% 30% 40% 50% 60% 70%
Yes, infrequently
37

Quota CommunicationTiming and Effectiveness of CommunicationAverage/median/low performance companies seem to communicate quotas earlier than the higher performance companies. Higher performance companies may be waiting until quotas are as accurate as possible before communicating.
PERCENT OF QUOTAS COMMUNICATED BY FIRST MONTH OF FISCAL YEAR
14%26%0%
10%
12%
5%
11%
50%
25%
17%
10%
37%
21%75%
48%37%
0% 10% 20% 30% 40% 50% 60%
100%
Higher Performance Co's Med/Avg/Low Performance Co's
38Note: Two companie did not provide a response to this question.
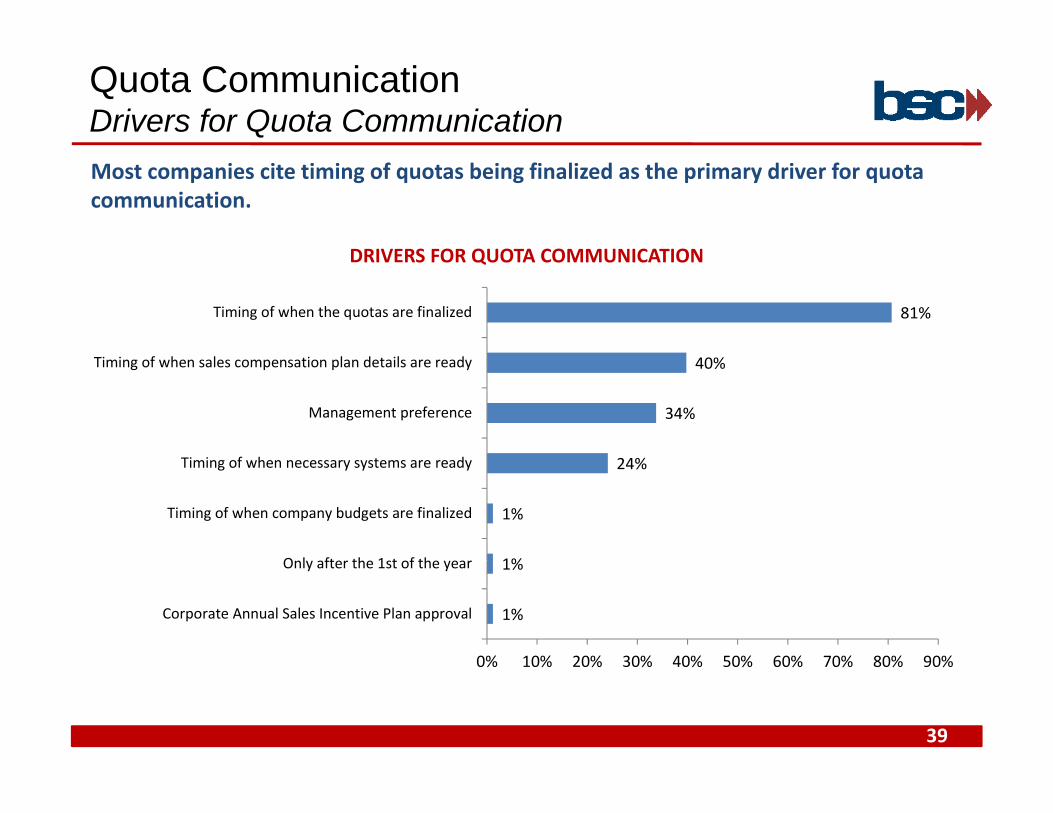
Quota CommunicationDrivers for Quota CommunicationMost companies cite timing of quotas being finalized as the primary driver for quota communication.
DRIVERS FOR QUOTA COMMUNICATIONDRIVERS FOR QUOTA COMMUNICATION
81%Timing of when the quotas are finalized
24%
34%
40%
Ti i f h d
Management preference
Timing of when sales compensation plan details are ready
1%
1%
24%
O l ft th 1 t f th
Timing of when company budgets are finalized
Timing of when necessary systems are ready
1%
1%
0% 10% 20% 30% 40% 50% 60% 70% 80% 90%
Corporate Annual Sales Incentive Plan approval
Only after the 1st of the year
39
0% 10% 20% 30% 40% 50% 60% 70% 80% 90%

Quota CommunicationMethod of CommunicationOne‐on‐one meetings followed by sales manager presentations and email are the most prevalent methods of communication. Most companies use several approaches.
HOW QUOTAS ARE COMMUNICATED
52%
63%
Sales manager presentation
One‐on‐one meetings
18%
20%
34%
Executive presentation
Sales Operations presentation
1%
8%
12%
Quota methodology comm. 1 wk prior to quotas rolled out
HR/Finance/Other functional area presentation
On line
1%
1%
0% 10% 20% 30% 40% 50% 60% 70%
Letters
Q gy p q
40

Quota CommunicationPlanned Changes to Communication67% of companies do not plan on making any changes to the communication process in the future. For those making changes, most focused on tools, training, and communication and engagement:
Topic Area (Prevalence) Noteworthy QuotesIncrease Tool Usage (41%)
“Via SPM tool” – most common response “Online process supported by Tool”
“ f ”Improve Training (18%)
“Additional training upfront” “Education on how quotas were determined” “Increase Q and A or hold additional training sessions. Managers are NOT
talking to their people”Communication and Engagement (18%)
“Accelerate communication of plan content and sales letter (quota) distribution.”
“Greater lead time; more proactive involvement of field.” “Simplify and more motivating.”
Other (23%)
“It's not on management's radar just yet but I do feel that we'll need to develop a more formal process over time.”
“Need to collect Bottom Up from the system directly and weigh that with management expectations.”
41
“Under development.”

Quota AdjustmentsEconomic Impact on AdjustmentsMore than 60% of respondents claimed that the state of the economy is not having any impact on quota adjustments. This varies from findings back in 2009 that indicated a higher incidence of changes due to poor economic conditions.
ECONOMIC IMPACT ON QUOTA ADJUSTMENTSECONOMIC IMPACT ON QUOTA ADJUSTMENTS
62%The economy is not having any impact on quota adjustments
8%
23%
We are not investing as much time in quotas, since it is so
We are having to review quotas frequently throughout the year
13%
8%
Other
unpredictable
• Responses to ‘Other’: For the FY we do not adjust quota only forecasts are changed, If the economy impacts attainment levels we do not adjust goals during the year, Infrequently throughout the year, More quota reviews, but would not categorize as frequent,Quotas are going up since our markets a growing, The quotas are impacted by state and national policies, so as policies change, we adjust the quotas accordingly For example if the state runs out of money early and cancels orders we may lower the quotas since
0% 10% 20% 30% 40% 50% 60% 70%
42Note: Five companies did not respond to this question.
adjust the quotas accordingly. For example, if the state runs out of money early and cancels orders we may lower the quotas since that's out of the control of our reps., they are tied to both organic growth and strategic growth initiatives, We adjust a few times per year, We are choosing to reduce quotas on a selective basis., We do not adjust quotas as a rule
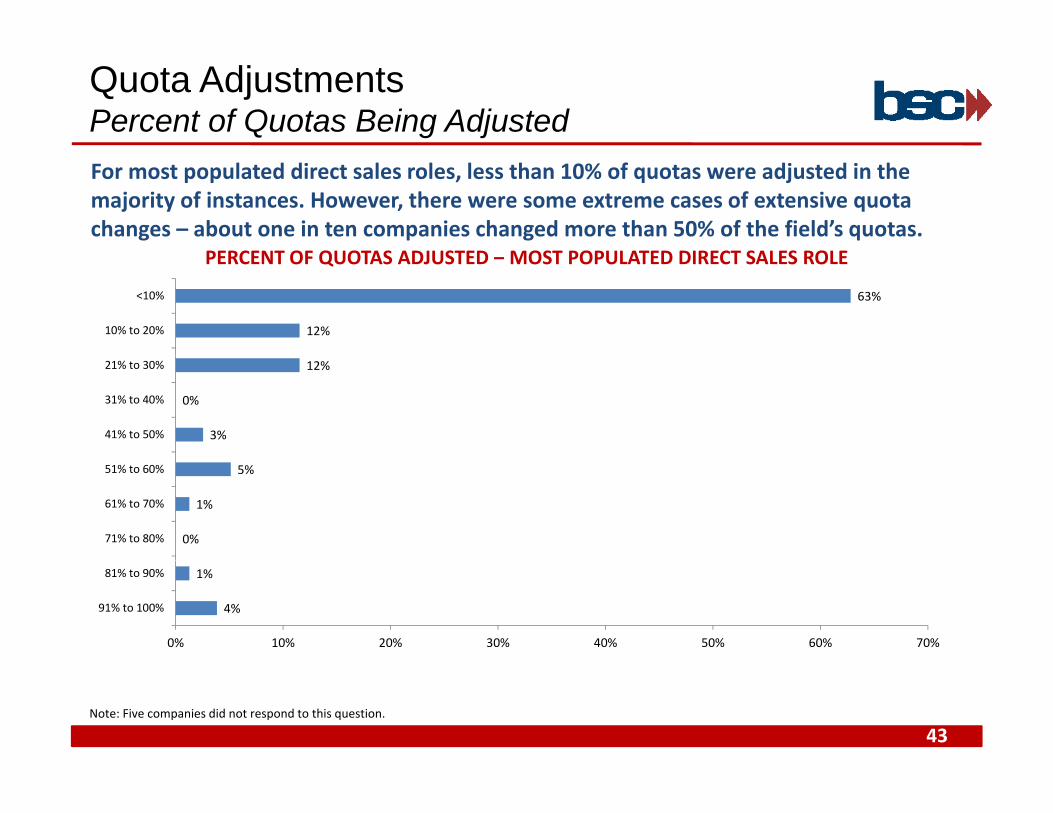
Quota AdjustmentsPercent of Quotas Being AdjustedFor most populated direct sales roles, less than 10% of quotas were adjusted in the majority of instances. However, there were some extreme cases of extensive quota changes – about one in ten companies changed more than 50% of the field’s quotas.
PERCENT OF QUOTAS ADJUSTED MOST POPULATED DIRECT SALES ROLEPERCENT OF QUOTAS ADJUSTED – MOST POPULATED DIRECT SALES ROLE
12%
63%
10% to 20%
<10%
3%
0%
12%
41% to 50%
31% to 40%
21% to 30%
0%
1%
5%
71% to 80%
61% to 70%
51% to 60%
4%
1%
0% 10% 20% 30% 40% 50% 60% 70%
91% to 100%
81% to 90%
43Note: Five companies did not respond to this question.

Quota AdjustmentsQuotas Adjustment Practices
83%82%
We rarely make quota adjustments
Companies, in general, rarely make quota adjustments…TYPICAL PRACTICES AROUND QUOTA ADJUSTMENTS
10%
11%
8%We never make quota adjustments
7%11%
0% 10% 20% 30% 40% 50% 60% 70% 80% 90%
We make quota adjustments frequently
Higher Performance Co's Med/Avg/Low Performance Co's
with limited impact stemming from the the current economic environment
Note: Three companies did not respond to this question.
QUOTA ADJUSTMENTS TODAY COMPARED TO NORMAL YEARS/ECONOMIC PERIODS…with limited impact stemming from the the current economic environment.
79%66%
bout the same
5%
16%
13%
21%
Less frequently
ore frequently
44
0% 10% 20% 30% 40% 50% 60% 70% 80% 90%
Higher Performance Co's Med/Avg/Low Performance Co'sNote: One company did not respond to this question.

Quota AdjustmentsDrivers of Quota AdjustmentsDisruptive changes to the market and changes to coverage model are the top two reasons for quota adjustments, with errors in quota setting and poor forecasting cited as being other top drivers.
DRIVERS OF QUOTA ADJUSTMENTS
55%Disruptive changes to the market
43%
54%
P f i
Errors in quota setting
Changes to coverage model
21%
14%
20%
Other
Late submissions
Poor forecasting
• Responses to ‘Other’: Attrition, Business strategy changes, changes that occur at the account level impacting individual quotas, Client M&A, Customer forecast, data unknown when setting goals that is out of the Sales Team's control (i.e., Sale of a Business Unit) economy extenuating circumstances Foreign Exchange Large account opportunity unforeseen at the beginning of the year
21%
0% 10% 20% 30% 40% 50% 60%
Other
Unit), economy, extenuating circumstances, Foreign Exchange, Large account opportunity unforeseen at the beginning of the year, Natural Disasters, None, Organizational changes, Product exits, Re-organizations, State policy changes, supply limitations, Top line quota was aspirational
45Note: Three companies did not respond to this question.

Quota AdjustmentsTypical Quota Adjustment ProcessThe most typical quota adjustments derive from an escalation request from the field. Other changes are from regular quota review processes or triggered based on Ts and Cs.
TYPICAL QUOTA ADJUSTMENT PROCESSTYPICAL QUOTA ADJUSTMENT PROCESS
17%
23%
45%
Triggering based on Ts & Cs
Regular review of quotas
Escalation process from SR to sales mgmt to sales exec
1%
1%
1%
3%
Top line performance is extremely high or low
Would need SVP approval
Year‐end escalation process
Other
1%
1%
1%
1%
1%
Escalation from BU not Sales Manager
Loosely defined, thus adjustmtns not addressed
Not adjusted
Rare exceptions, escalated to Sales Ops
Sales Ops to Sr Leadership
1%
1%
1%
0% 10% 20% 30% 40% 50%
A combination of one‐off escalation from sales dir. to our team & reg review of quotas…
Depends on the circumstances
Escalation from BU not Sales Manager
46Note: Five companies did not respond to this question.

Quota AdjustmentsCommunication of Quota Adjustment ProcessThe process for quota adjustments is most typically communicated through either the terms and conditions of the sales compensation plan or through the roll‐out process. Interestingly, 27% of companies said it is not communicated in any way.
34%In the terms and conditions of the sales
compensation plan
COMMUNICATION OF QUOTA ADJUSTMENT PROCESS
27%
33%
It is not communicated in any way
Through the quota roll‐out process
8%
27%
Via Direct Line Managers
It is not communicated in any way
11%
0% 5% 10% 15% 20% 25% 30% 35% 40%
Other
47Note: Four companies did not respond to this question.
• Responses to ‘Other’ include: Email notification with financials, Not a formal process, One-off requests postponed until YE, Only adjusted and communicated for those impacted, and Routine meetings
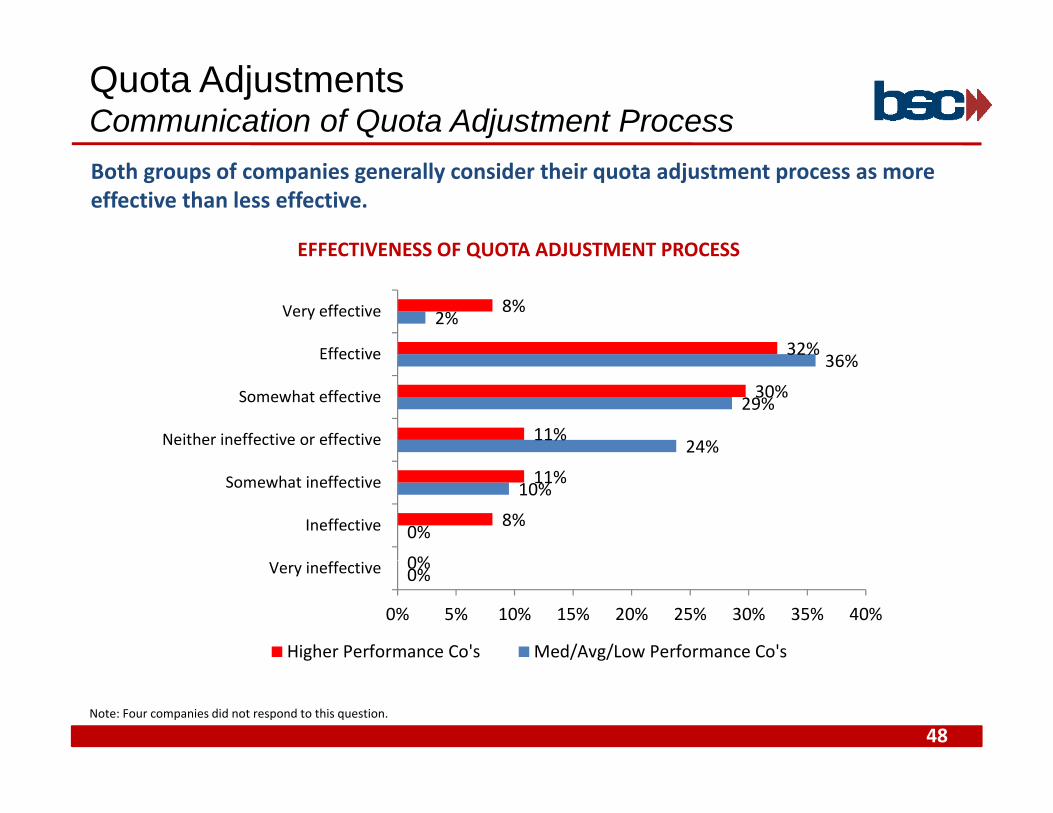
Quota AdjustmentsCommunication of Quota Adjustment ProcessBoth groups of companies generally consider their quota adjustment process as more effective than less effective.
EFFECTIVENESS OF QUOTA ADJUSTMENT PROCESSEFFECTIVENESS OF QUOTA ADJUSTMENT PROCESS
36%
2%
32%
8%
Effective
Very effective
24%
29%
36%
11%
30%
Neither ineffective or effective
Somewhat effective
Effective
0%
10%
0%
8%
11%
Ineffective
Somewhat ineffective
0%0%
0% 5% 10% 15% 20% 25% 30% 35% 40%
Very ineffective
Higher Performance Co's Med/Avg/Low Performance Co's
48Note: Four companies did not respond to this question.

Perceptions and ResultsSales Force and Management PerceptionsIn general, sales managers have more favorable perceptions towards the quota setting process. This likely stems from their greater involvement and visibility with the process.
QUOTA SETTING PROCESS PERCEPTIONS: SALES FORCE VERSUS MANAGEMENTQUOTA SETTING PROCESS PERCEPTIONS: SALES FORCE VERSUS MANAGEMENT
11%
0%
28%
0%
Effective
Very effective
15%
35%
11%
10%
44%
8%
Neither ineffective or effective
Somewhat effective
Effective
10%
26%
1%
4%
12%
Ineffective
Somewhat ineffective
4%1%
0% 10% 20% 30% 40% 50%
Very ineffective
Sales Managers Sales Force
49Note: Two companies did not respond to this question.

Perceptions and ResultsSales Force Perceptions – Open AnswersTopic Area (Prevalence) Noteworthy Quotes
Quotas are Too High (24%) “It's abusive and de-motivating. The quota targets are too high, unrealistic to reach” “Too aggressive on growth, can't make my quota” “Quotas are always a stretch and often seem out of reach at the start of a year.”Q y y “Main complaint is the size of the quotas, not the process for setting them.” “Quotas are set too high based upon projected growth.” “We will never be able to hit these numbers. I don't know where the business going to
come from so how can the Executives?” “They all say quotas are stretch marked, and aggressive.”
Little Bottom Up or True Opportunity Consideration (22%)
“Always too high. Not enough bottom up” “The quota is not consistent with the opportunity” “New quotas do not take into account previous customer spending and potential” “It is too top-down. They understand the detailed math behind how the quotas were set
(why does that expectation even exist?!).” “Too much growth expected each year. Bluebird wins getting growth applied in
subsequent year is unfair.” “The process allows them to have local input as to changes within their geography. p p g g g p y
However, it is perceived as unfair that they must tie to a top down plan (without taking into account geo factors). We allocate plan top down.”
“Feel quotas are dictated primarily from above with little consideration to local factors” “The numbers coming from Corporate have to be handed out and the corporation is more
focused on shareholders than the number coming from the in country business head on
50
g ythe actual opportunity.”
“Does not take into account individual territory risks or account erosion factor”

Perceptions and ResultsSales Force Perceptions – Open Answers (cont)Topic Area (Prevalence) Noteworthy Quotes
Little Rep Involvement (12%)
“They do not think they are involved enough with the quota setting process” “General sales force does not get involved in the quota setting process“ “Market is varied with opportunities based on case load and territory. While local pp y
expectations might be set, no centralized methodology exists. This being the case, little feedback is received.”
“Don't feel that they have enough of a "voice" in the process”
Timing (10%) “Want quota communicated earlier (at least one month before year begins)”“Q t t di t ib t d i ti l f hi ” “Quotas are not distributed in a timely fashion.”
“Time consuming & manual”
Poor Transparency or Understanding (10%)
“Lack of understanding of the end-to-end process” “Don't understand how growth rates are derived. Feel that sales management/operations
is trying to "hide" things/not transparent enough.”is trying to hide things/not transparent enough. “Not enough transparency into the underlying data used to set goals” “Confusion around matrix with other business units (varying revenue recognition issues)”
Positive Areas Identified (8%)
“Has improved over the past couple of years due to more manager education on the process and their responsibility to discuss with team members.”
“Input is valued. Bottom-up flows right into top-down seamlessly.” “Easy to understand and fair” “Most appreciate the level of communication and roll out process.”
51

Perceptions and ResultsSales Force Perceptions – Open Answers (cont)Topic Area (Prevalence) Noteworthy Quotes
Little Quota Relief (6%) “Do we ever lower quotas??” “Company increases my quota when there is an error or overachievement. However, if
there is an error or underachievement, quotas are never decreased.” “No room for adjustments from prior year's big orders”
Other (8%) “They don't like, Market segmentation quotas by industries, and Team quotas.” “There are always a few Reps every year that feel the quota setting process is unfair.” “Product house and corporate have more influence and are misinformed (we cannot sell a
d t th t i t d )”product that is not ready)” “Not enough information and data is incorrect”
52

Perceptions and ResultsSales Mgmt Perceptions – Open Answers Topic Area (Prevalence) Noteworthy Quotes
Timing and Complexity of Process (28%)
“If proper amount of time is spent with the bottoms-up, the tops-down should be relatively smooth and easy.”
“Too manual, too complex, too long” “The process is too labor intensive and relies on native knowledge” “The process takes too long and rollout is always late in terms of current quarter quota.” “Frustrated with manual process; too time consuming “ “Not enough analytics due to manual processes.”
Positive Areas Identified (15%)
“Right mix of inputs, reflect corporate priorities.” “Not perfect but generally right.” “They see overall process as fair, but there will always be outliers to be improved upon.” “Right mix of inputs, reflect corporate priorities.” “We are getting better at providing equitable quotas across the entire sales group, goal
setting is improving”
Quotas are Too High (12%) “The quota targets are too high, unrealistic to reach but we're locked in because of what our CFO has told Wall St. analysts therefore we should consider paying 100% for reaching 90% of quota.”
“Some sales managers also believe that quotas are too high” “They think that the quotas are higher than ever to reach a great compensation.”
Data Elements (7%) “Forecasting tool needs to be improved, poor data quality of information supplied by sales reps”“Targets are aggressive and not enriched enough with industry data (external) ”
53
“Targets are aggressive and not enriched enough with industry data (external).” “Give us more data.”

Perceptions and ResultsSales Mgmt Perceptions – Open Answers (cont)Topic Area (Prevalence) Noteworthy Quotes
Areas for Improvement (7%)
“Number / % of sales reps meeting plan need to be improved.” “We need more specific goals applied nationally, with adjustments for specific anomalies.” “It needs to be reviewed more often. It should be refined to better suit each territory and y
Salesperson. Senior Management should clarify expectations.”
Quota Communication (7%) “Letters too late” “No feedback requested and none received” “They feel they don't need to explain growth rates-"they are what they are"-what corporate
itt d t "th St t“ hil th ’ id ti t l l f t th i hcommitted to "the Street“…while there’s some consideration to local factors, they weigh those against corporate expectations which typically win against reps’ "wishes“.”
Input and Visibility into Process (7%)
“They enjoy having input, that the top down plan is not just allocated blindly. It's worth the time and effort to "get it right".”
“They are not allowed enough authority to customize or hand-tune role-based quotas.” “Limited input on the Top Line number, before the numbers are finalized there are
significant additions that no one really understands”
Quota Adjustments (5%) “Quotas should never be adjusted unless the coverage model changes.” “Too many adjustments raises questions about the quota-setting process.”
S ifi Ch ll /O h “M k d i h li i i l i h i di id l ib l lSpecific Challenges/Other (12%)
“Managers are tasked with limiting overlay assignments at the individual contributor level. Year-over-year, this is met with resistance.”
“In this construction economy, most of what we get bottoms up and combine with top down expectations its a crap-shoot”
“BU matrix structure provides added complexity (negotiations and issues around revenue iti th d ) ”
54
recognition methods).” “Corporate numbers are moving targets so hard to nail down more granular quotas in the
month prior or after fiscal year close.”

Perceptions and ResultsPerceptions Across Geographies and BUs53% of those responding said that perceptions do not vary across geographies and business units. For those that stated perceptions do vary, the following was cited:Topic Area (Prevalence) Noteworthy Quotes
G /R i S ifi (47%) “E i diff t f th US”Geo/Region Specific (47%) “Europe is different from the US” “Farther from HQ, more decentralized and less connected” “Growth markets vs. stable markets or Russia and Brazil vs. US and Western Europe” “More rigor applied to process in some geographies than others” “Non US must wait for US to complete” Non-US must wait for US to complete “One geography, in particular, complains about size of quotas and lack of manager
autonomy in setting them.” “Our division is large and matrixes to multiple BUs; might appear more convoluted than
BUs that only goal their own revenue, but our process is incredibly complex” “Without a national quota policy, regions and local ops set expectations that can vary
based on case assignment or management approach.”
BU Specific (16%) “Based on their Understanding and Complexity of BUs" “B2C division changes more often” “Core business has to carry quota burden independent of opportunity” Core business has to carry quota burden independent of opportunity
Customer Specific (11%) “Based on mix of customers” “They differ by target vertical”
Other (26%) “Finance and Field Sales rarely agree on the number”“Some of our channels goal at client level other at territory level”
55
“Some of our channels goal at client level, other at territory level” “There are independent advisors with exclusive access to some industries”

Perceptions and ResultsQuota Attainment56% of companies had at least half of their sales force exceed quotas.
PERCENT OF SALES FORCE REACHING OR EXCEEDING QUOTA IN MOST RECENT FISCAL YEAR
19%20%
25%
17%
14%
12%
15%
6% 6%
9%8%
5%5%
10%
3%
0%<10% 10% to 20% 20% to 30% 30% to 40% 40% to 50% 50% to 60% 60% to 70% 70% to 80% 80% to 90% 90% to 100%
56Note: Six companies did not provide a response

Perceptions and ResultsExpected Quota AttainmentOf the companies that target a certain percentage of salespeople to be above quota, 55% want at least 60% of the sales force to be above goal. A goal of 60%+ of reps exceeding goals is considered a best practice.
35%
30%
35%
40% PERCENT OF SALES FORCE TARGETED TO REACH QUOTA
35% of the 64% (55%) with a targeted number target at least
19%20%
25%
30% targeted number target at least 60% of the sales force above goal
5%4%
5%
13%
8%
4% 4%5%
10%
15%
0%1%
4% 4% 4%
0%
5%
No Target Set <10% 10% to 20% 20% to 30% 30% to 40% 40% to 50% 50% to 60% 60% to 70% 70% to 80% 80% to 90% 90% to 100%
• “If we had a consistent quota program, the expectation would be that 30-50% would exceed an relatively aggressive quota program.”y gg q p g
• “We allocated the top down plan.”
57Note: Three companies did not provide a response.

Perceptions and ResultsQuota Setting Accuracy68% of companies state they were at least somewhat accurate in setting quotas this year.
ACCURACY IN SETTING QUOTA THIS YEAR
21%
4%
Accurate
Very accurate
21%
43%
21%
Neutral
Somewhat accurate
Accurate
4%
6%
Inaccurate
Somewhat inaccurate
2%
0% 5% 10% 15% 20% 25% 30% 35% 40% 45% 50%
Very inaccurate
58Note: Four companies (of those responding to the previous question: % of sales force targeted to reach quota) did not provide a response to this question.
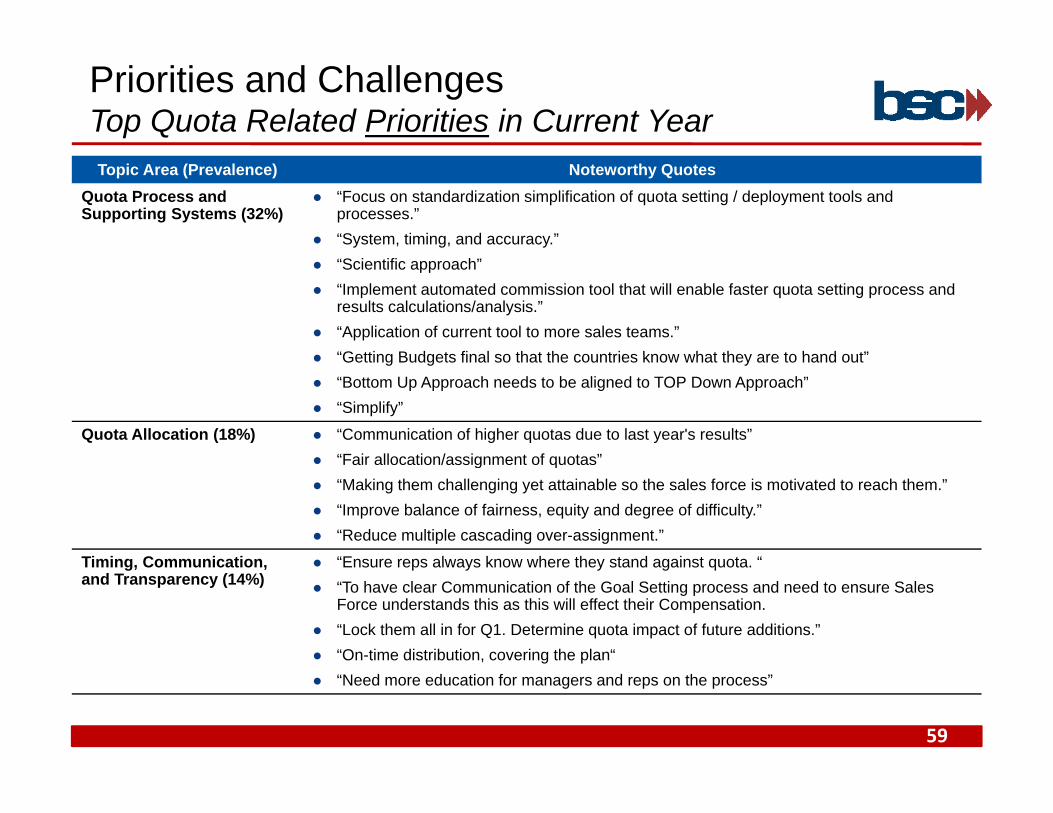
Priorities and ChallengesTop Quota Related Priorities in Current YearTopic Area (Prevalence) Noteworthy Quotes
Quota Process and Supporting Systems (32%)
“Focus on standardization simplification of quota setting / deployment tools and processes.”
“System, timing, and accuracy.” “Scientific approach” “Implement automated commission tool that will enable faster quota setting process and
results calculations/analysis.” “Application of current tool to more sales teams.” “Getting Budgets final so that the countries know what they are to hand out” Getting Budgets final so that the countries know what they are to hand out “Bottom Up Approach needs to be aligned to TOP Down Approach” “Simplify”
Quota Allocation (18%) “Communication of higher quotas due to last year's results” “Fair allocation/assignment of quotas” Fair allocation/assignment of quotas “Making them challenging yet attainable so the sales force is motivated to reach them.” “Improve balance of fairness, equity and degree of difficulty.” “Reduce multiple cascading over-assignment.”
Timing Communication “Ensure reps always know where they stand against quota “Timing, Communication, and Transparency (14%)
Ensure reps always know where they stand against quota. “To have clear Communication of the Goal Setting process and need to ensure Sales
Force understands this as this will effect their Compensation. “Lock them all in for Q1. Determine quota impact of future additions.” “On-time distribution, covering the plan“
59
g p “Need more education for managers and reps on the process”
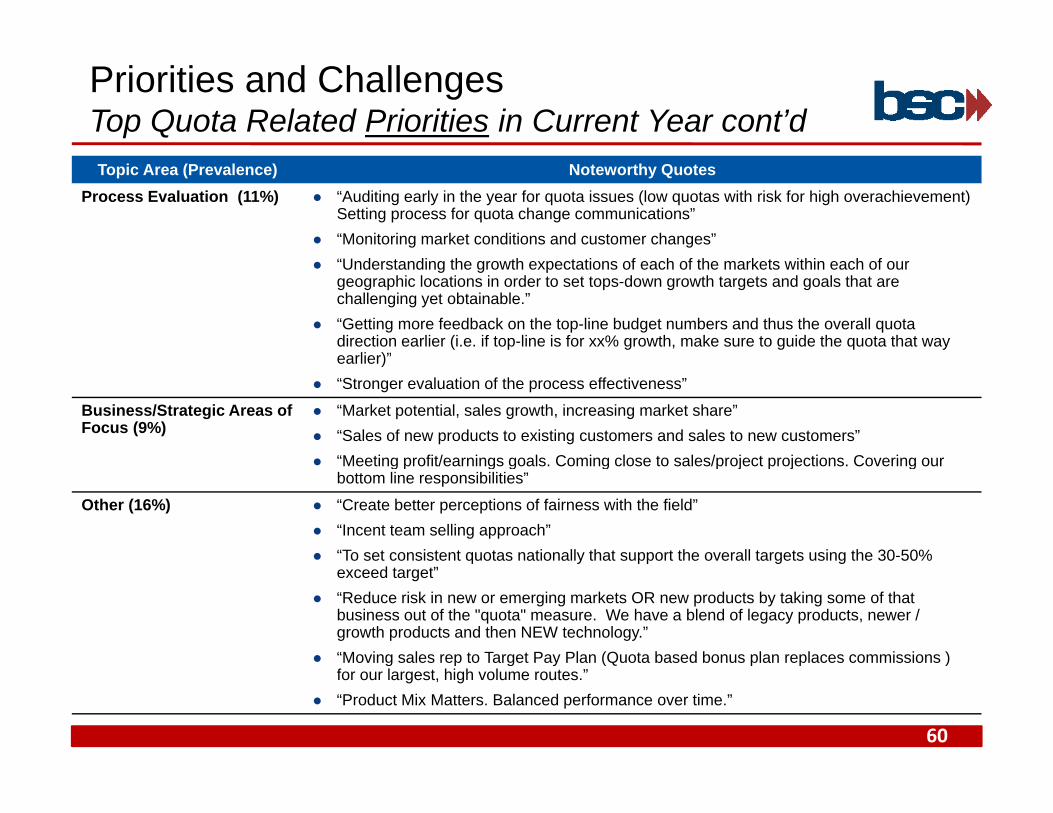
Priorities and ChallengesTop Quota Related Priorities in Current Year cont’dTopic Area (Prevalence) Noteworthy Quotes
Process Evaluation (11%) “Auditing early in the year for quota issues (low quotas with risk for high overachievement) Setting process for quota change communications”
“Monitoring market conditions and customer changes” “Understanding the growth expectations of each of the markets within each of our
geographic locations in order to set tops-down growth targets and goals that are challenging yet obtainable.”
“Getting more feedback on the top-line budget numbers and thus the overall quota direction earlier (i.e. if top-line is for xx% growth, make sure to guide the quota that way earlier)”earlier)”
“Stronger evaluation of the process effectiveness”
Business/Strategic Areas of Focus (9%)
“Market potential, sales growth, increasing market share” “Sales of new products to existing customers and sales to new customers”
“Meeting profit/earnings goals Coming close to sales/project projections Covering our “Meeting profit/earnings goals. Coming close to sales/project projections. Covering our bottom line responsibilities”
Other (16%) “Create better perceptions of fairness with the field” “Incent team selling approach” “To set consistent quotas nationally that support the overall targets using the 30-50%To set consistent quotas nationally that support the overall targets using the 30 50%
exceed target” “Reduce risk in new or emerging markets OR new products by taking some of that
business out of the "quota" measure. We have a blend of legacy products, newer / growth products and then NEW technology.”
“Moving sales rep to Target Pay Plan (Quota based bonus plan replaces commissions )
60
g p g y (Q p p )for our largest, high volume routes.”
“Product Mix Matters. Balanced performance over time.”

Priorities and ChallengesTop Quota Related Challenges in Current YearTopic Area (Prevalence) Noteworthy Quotes
Quota Process and Supporting Systems (24%)
“Decentralization; relying upon first-line managers” “Getting all the right people involved at the right time; avoid late ideas from left field” “How to establish top-down/bottoms-up process”p p p “Stop doing it in Excel as it takes too long and is subject to error” “Getting corporate and field on the same page” “It is not Timely set by all the Geography Managers. Lot of Follow up is required. BU
goals Matching with Geography is also a big Challenge”
Market Dynamics (19%) “Market Activity - will there be enough to carry us through” “We appear to be tied to the revenue forecasts that our CFO gives to the Wall St. Analysts
but these targets are becoming increasingly difficult to reach. What's worse is that when they are achieved, the commission payout isn't as lucrative as one would expect them to be. And then the targets get set higher....we'll need to address this dynamic this year or risk losing salespeople ”risk losing salespeople.”
“Organizational change has reduced the number of people available to do the work” “Shortage of product supply impacts reps ability to achieve quota.” “Managing through late-in-the-game org structure changes”
Quota Allocation (12%) “Setting the quotas so that they're attainable ”Quota Allocation (12%) “Setting the quotas so that they're attainable.” “Balancing the need for real productivity improvements (in line with industry norms) with
employee morale due to quotas that are perceived as being too high.” “Reducing the percentage of Sales Team with relatively low annual quotas. Sounds
simple, but at first we looked to the Sales Managers to help with this and just this year decided we needed to take some centralized measures to control ”
61
decided we needed to take some centralized measures to control. “Unassigned quota due to attrition”

Priorities and ChallengesTop Quota Related Challenges in Current YearPriorities and ChallengesTop Quota Related Challenges in Current Year cont’dTopic Area (Prevalence) Noteworthy Quotes
Quotas are Too High (10%) “To reach the goals with 500 salesperson less.” “Unrealistic growth rates. Lack of "Visibility“” “They have a sales goal linked to the overall company goal and difficult to lower this goal y g p y g g
by participant. Expectations remain constant.”
Communication (7%) “Communication of higher quotas and the perception that management believes the sales force was paid too much last year”
“Late budget setting process and thus late communication of quotas”“H t i t di t tti ” “How to improve transparency surrounding quota setting process.”
Data (7%) “Lack of reliable data” “Timing of historical data accuracy of market share data”
Adjustments (7%) “Managing quota changes.”“T h di t ti f t dj t t lti f t tti “Too much distraction from quota adjustments, resulting from poor-quota setting process last year (in terms of cross-functional validation of assumptions).”
Other (14%) “No significant challenges at present.” “New sales lead time may not be factored into the quotas” “To position the sales team as the best advisors in health ” To position the sales team as the best advisors in health. “To include a group of 100 medical doctors in the sales team.” “Erosion of business to the extent that new and incremental sales will not offset losses in
many cases” “Cyclical nature of big wins in the previous year and the expectation that the customer will
d th l i th t D b k th t f th l ? Wh t i th
62
do the same plus more in the current year. Do you back them out of the plan? What is the best approach so as not to de-motivate the rep while not over rewarding them? Bottom line still has to be met.”
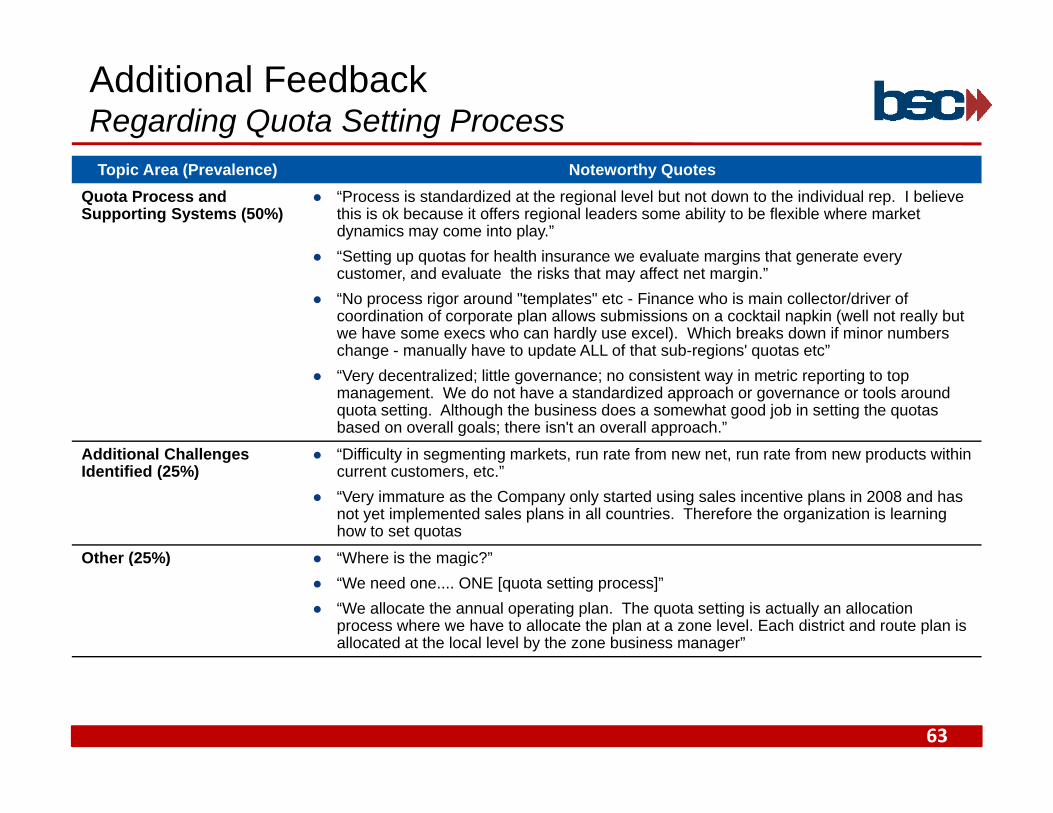
Additional FeedbackRegarding Quota Setting ProcessTopic Area (Prevalence) Noteworthy Quotes
Quota Process and Supporting Systems (50%)
“Process is standardized at the regional level but not down to the individual rep. I believe this is ok because it offers regional leaders some ability to be flexible where market dynamics may come into play.”“S tti t f h lth i l t i th t t “Setting up quotas for health insurance we evaluate margins that generate every customer, and evaluate the risks that may affect net margin.”
“No process rigor around "templates" etc - Finance who is main collector/driver of coordination of corporate plan allows submissions on a cocktail napkin (well not really but we have some execs who can hardly use excel). Which breaks down if minor numbers change - manually have to update ALL of that sub-regions' quotas etc”change manually have to update ALL of that sub regions quotas etc
“Very decentralized; little governance; no consistent way in metric reporting to top management. We do not have a standardized approach or governance or tools around quota setting. Although the business does a somewhat good job in setting the quotas based on overall goals; there isn't an overall approach.”
Additional Challenges “Difficulty in segmenting markets, run rate from new net, run rate from new products withinAdditional Challenges Identified (25%)
Difficulty in segmenting markets, run rate from new net, run rate from new products within current customers, etc.”
“Very immature as the Company only started using sales incentive plans in 2008 and has not yet implemented sales plans in all countries. Therefore the organization is learning how to set quotas
Other (25%) “Where is the magic?”Other (25%) Where is the magic? “We need one.... ONE [quota setting process]” “We allocate the annual operating plan. The quota setting is actually an allocation
process where we have to allocate the plan at a zone level. Each district and route plan is allocated at the local level by the zone business manager”
63