Embed Size (px)
DESCRIPTION
Included in this report are the University of Houston System mission statement, goals and principles. Established at the beginning of my administration in 2008, they constitute the strategic framework through which all decisions are made at the University of Houston, UH- Clear Lake, UH-Downtown and UH-Victoria. Also included are progress cards for the UH System and each of its universities. Reviewed annually by the Board of Regents, the progress cards demonstrate, through key performance indicators, the success we have had in fulfilling our mission and achieving our goals.
Citation preview

University of HoUston system2012 Performance
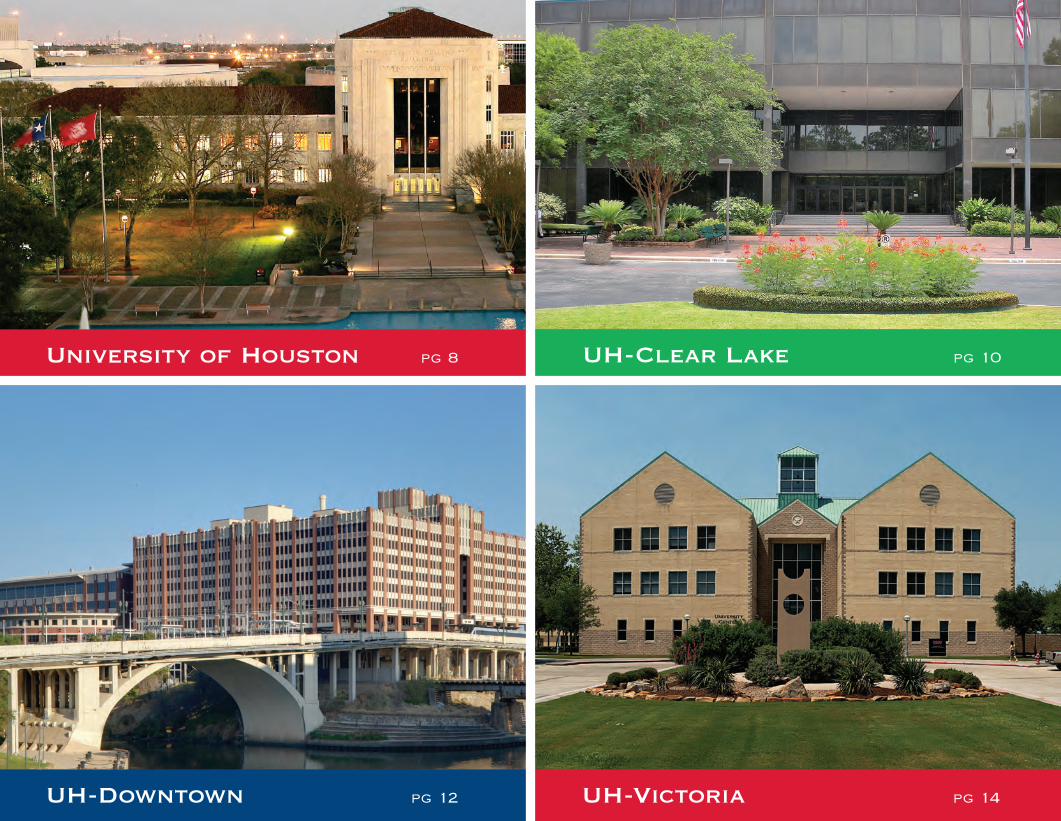
UH-victoria pg 14UH-Downtown pg 12
UH-clear Lake pg 10University of Houston pg 8
Higher education in the United States today is at a critical point in its history. Never before has the demand for our services been greater – the college-educated workforce and new knowledge that universities produce are essential to our ability to compete in the global economy. Nor have the resources needed to achieve this end been more scarce – higher education must be balanced against other compelling priorities (e.g., public education, health care) for increasingly limited government funding. Plus there is a limit to which we can raise tuition and fees to accomplish our goals without compromising student access to higher education.
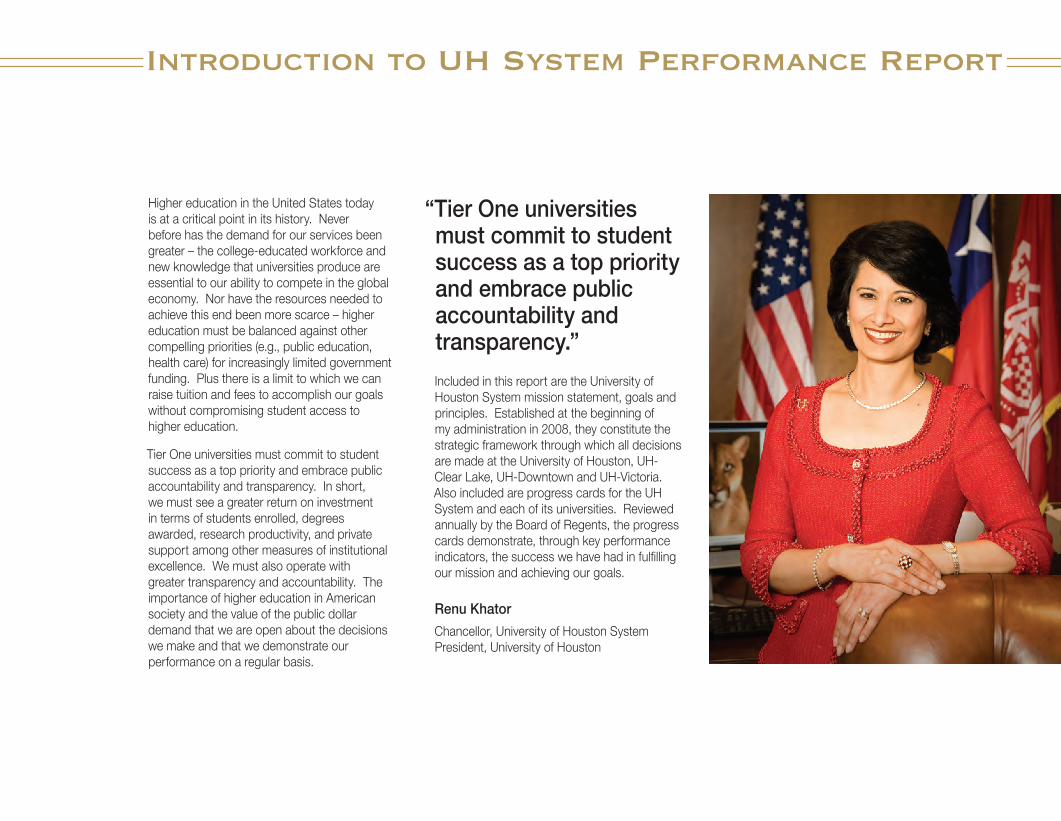
Tier One universities must commit to student success as a top priority and embrace public accountability and transparency. In short, we must see a greater return on investment in terms of students enrolled, degrees awarded, research productivity, and private support among other measures of institutional excellence. We must also operate with greater transparency and accountability. The importance of higher education in American society and the value of the public dollar demand that we are open about the decisions we make and that we demonstrate our performance on a regular basis.
Included in this report are the University of Houston System mission statement, goals and principles. Established at the beginning of my administration in 2008, they constitute the strategic framework through which all decisions are made at the University of Houston, UH-Clear Lake, UH-Downtown and UH-Victoria. Also included are progress cards for the UH System and each of its universities. Reviewed annually by the Board of Regents, the progress cards demonstrate, through key performance indicators, the success we have had in fulfilling our mission and achieving our goals.
Renu Khator
Chancellor, University of Houston System President, University of Houston
introduction to UH system Performance report
“Tier One universities must commit to student success as a top priority and embrace public accountability and transparency.”
4
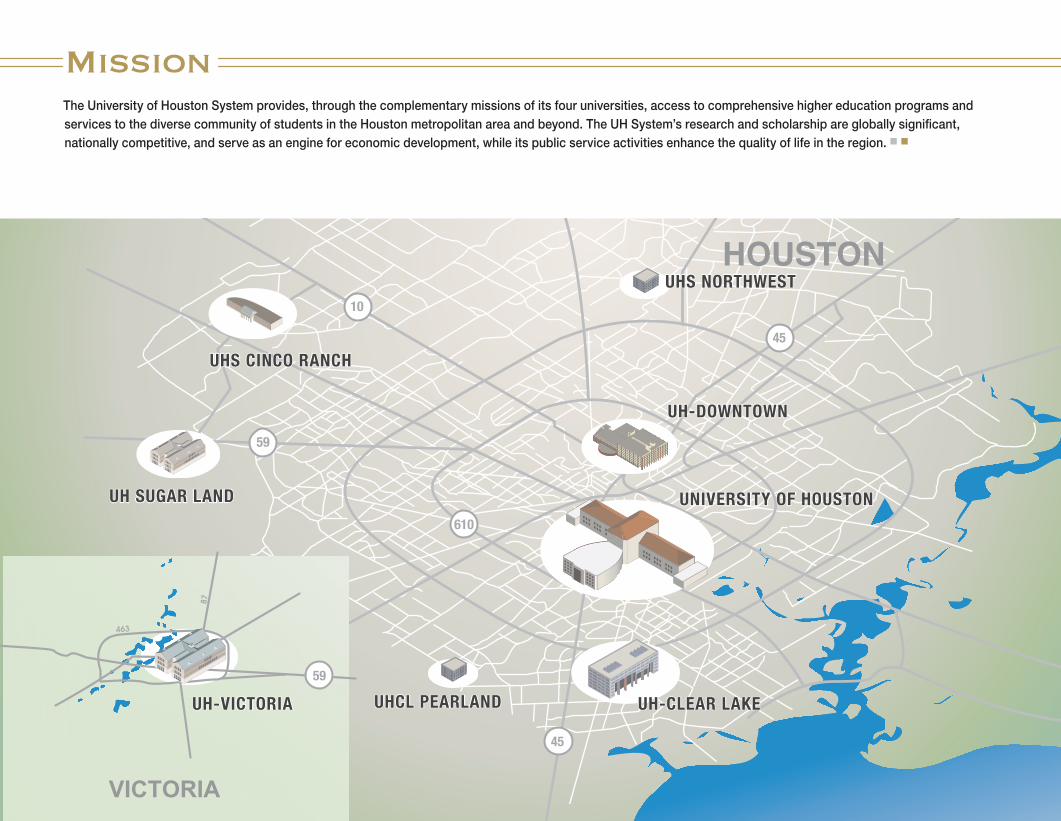
The University of Houston System provides, through the complementary missions of its four universities, access to comprehensive higher education programs and services to the diverse community of students in the Houston metropolitan area and beyond. The UH System’s research and scholarship are globally significant, nationally competitive, and serve as an engine for economic development, while its public service activities enhance the quality of life in the region.
mission
HOUSTON
87
VICTORIA
UH SUGAR LAND UNIVERSITY OF HOUSTON
UH-DOWNTOWN
UH-CLEAR LAKEUH-VICTORIA
UH SUGAR LAND UNIVERSITY OF HOUSTON
UH-DOWNTOWN
UH-CLEAR LAKEUH-VICTORIA
59
463
59
10
610
45
45
UHS CINCO RANCHUHS CINCO RANCH
UHS NORTHWESTUHS NORTHWEST
UHCL PEARLANDUHCL PEARLAND
5
Principles
1. The whole of the system should be greater than the sum of its parts.
2. The UH System should provide access to the people of Houston throughout the Houston metropolitan region, making that access as convenient as academically and financially possible.
3. The UH System’s institutions should be the primary providers of educational access in the Houston metropolitan region. However, they should seek partnerships with other institutions when it benefits students and when it is naturally advantageous.
4. The UH System should establish some distinctive mission differentiation among its institutions, while still enabling them to serve the needs of their region.
5. The UH System management structure should be as simple as possible and should ensure clarity of responsibility and accountability.
6. The UH System should be strategic about its enrollment growth and intentional about its tuition and other financial strategies.
7. The UH System should ensure a standard of excellence throughout its institutions, while recognizing differences in student populations and missions.
8. The UH System should have a clear nomenclature that will enhance international, national, state, and regional marketing and branding.
9. The UH System should maximize opportunities for both its faculty and students to benefit from being within a system.
GoalsNational Competitiveness
The City of Houston (and the Greater Houston Region) will be known for having one of the best and most diverse metropolitan systems of higher education in the nation.
Each university within the UH System will benchmark itself nationally for excellence within the context of its unique mission.
Student Success
The UH System will commit to providing access to the people of the Greater Houston Region and the state.
Each university within the UH System will make student success its top priority and will hold itself publicly accountable for achieving this goal.
The UH System will help students identify the UHS university that best serves their needs and academic goals, so that they are not lost to the UH System or to higher education. Furthermore, pathways will be developed for transfers between campuses and admissions to graduate programs.
Community Advancement
The UH System will be the engine of social and economic advancement of the metropolitan region and the state.
Each university within the UH System will engage with its community and will hold itself publicly accountable for contributing toward community advancement.
6
NatioNally Competitive ReseaRCh UNiveRsity
1.a. Total Research Expenditures: Total research funds from all sources expended during a fiscal year and reported to the National Science Foundation (NSF). (Data source: UHS Division of Research)
1.b. Federal Research Expenditures: Research funds from federal sources expended during a fiscal year and reported to the NSF. (Data source: UHS Division of Research)
1.c. Total Research Awards: Sponsored research awards received from external funding agencies. This includes new awards and additional funds received on existing awards. (Data source: UHS Division of Research)
stUdeNt aCCess aNd sUCCess
2.a. Total Enrollment: The total number of students enrolled during the fall semester at all levels, including full and part time enrollees. Data is reported to IPEDS. (Data source: UHS institutional research offices)
2.b. Total Degrees Awarded: The total number of degrees awarded at all levels, from July 1 to June 30, as reported to IPEDS. (Data source: UHS institutional research offices)
2.c. Percentage of Graduate/Professional Students: The percentage of degree-seeking and non degree-seeking students enrolled at the graduate level during the fall semester. Data is reported to IPEDS. (Data source: UHS institutional research offices)
2.d. Percentage of Residential Students: The percentage of students enrolled in the fall semester at all levels living in university-owned housing, including dorms and affiliated apartments. (Data source: UHS institutional research offices)
2.e. Number of Underserved Students Enrolled: The total number of African-American, Hispanic, and Native American students enrolled in the fall semester at all levels and reported to the Texas Higher Education Coordinating Board (THECB). (Data source: UHS institutional research offices)
2.f. Number of Degrees Awarded to Underserved Students: The number of degrees awarded to African-American, Hispanic, and Native American students at all levels during a fiscal year. Data is reported to the THECB. (Data source: UHS institutional research offices)
2.g. Number of Degrees Awarded in Critical Fields: The number of degrees awarded at all levels in computer science, engineering, math, and the physical sciences during a fiscal year. Data is reported to the THECB. (Data source: UHS institutional research offices)
CommUNity advaNCemeNt
3.a. Research Awards with Community Emphasis: The number of research awards with a Community Emphasis focus, the determination of which is made by the principal investigator when submitting the proposal for funding. (Data source: UHS Division of Research)
Competitive ResoURCes
4.a. Total Annual Giving: The amount of contributions to the system in the form of cash, securities, company products, and other property from alumni, non-alumni individuals, corporations, foundations, religious organizations, and other groups. Data is reported to the Council for Aid to Education on an annual basis. (Data source: UHS Division of Advancement)
4.b. Total Endowment: The amount of funds held by endowments and foundations as reported to the National Association of College and University Business Officers (NACUBO) in June of each year. (Data source: UHS Office of the Treasurer)
UNiveRsity of hoUstoN system peRfoRmaNCe measURe defiNitioNs
7
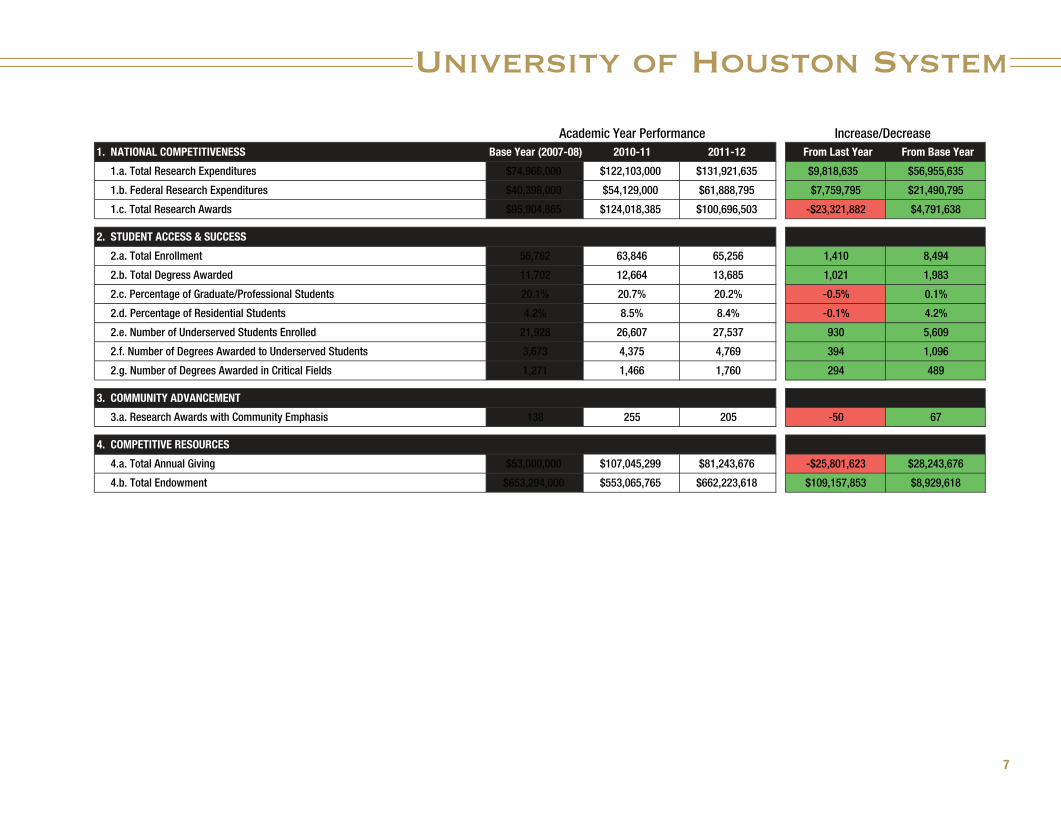
1. NATIONAL COMPETITIVENESS Base Year (2007-08) 2010-11 2011-12 From Last Year From Base Year
1.a. Total Research Expenditures $74,966,000 $122,103,000 $131,921,635 $9,818,635 $56,955,635
1.b. Federal Research Expenditures $40,398,000 $54,129,000 $61,888,795 $7,759,795 $21,490,795
1.c. Total Research Awards $95,904,865 $124,018,385 $100,696,503 -$23,321,882 $4,791,638
2. STUDENT ACCESS & SUCCESS
2.a. Total Enrollment 56,762 63,846 65,256 1,410 8,494
2.b. Total Degress Awarded 11,702 12,664 13,685 1,021 1,983
2.c. Percentage of Graduate/Professional Students 20.1% 20.7% 20.2% -0.5% 0.1%
2.d. Percentage of Residential Students 4.2% 8.5% 8.4% -0.1% 4.2%
2.e. Number of Underserved Students Enrolled 21,928 26,607 27,537 930 5,609
2.f. Number of Degrees Awarded to Underserved Students 3,673 4,375 4,769 394 1,096
2.g. Number of Degrees Awarded in Critical Fields 1,271 1,466 1,760 294 489
3. COMMUNITY ADVANCEMENT
3.a. Research Awards with Community Emphasis 138 255 205 -50 67
4. COMPETITIVE RESOURCES
4.a. Total Annual Giving $53,000,000 $107,045,299 $81,243,676 -$25,801,623 $28,243,676
4.b. Total Endowment $653,294,000 $553,065,765 $662,223,618 $109,157,853 $8,929,618
Increase/DecreaseAcademic Year Performance
University of Houston system
8
NatioNally Competitive ReseaRCh UNiveRsity
1.a. Total Research Expenditures: Total research funds from all sources expended during a fiscal year and reported to the National Science Foundation (NSF). (Data source: UH Division of Research)
1.b. Federal Research Expenditures: Research funds from federal sources expended during a fiscal year and reported to the NSF. (Data source: UH Division of Research)
1.c. Number of Graduate Programs Ranked in the Top 50: The number of UH graduate programs cited annually by U.S. News & World Report, College Rankings, with a rank of 50 or better. (Data source: U.S. News & World Report)
1.d. Number of Citations: The number of citations received by UH faculty in articles referenced in Web of Science. This is a rolling five-year total. Articles and citations appearing in the last five years are counted. (Data source: Web of Science)
1.e. Number of Doctorates Awarded: The number of doctoral degrees awarded annually. These include a Ph.D. or other doctoral degree that requires advanced work beyond a master’s. Special professional degrees are not included. Data is reported to IPEDS. (Data source: UH Institutional Research)
1.f. Number of Postdoctoral Appointees: The number of persons appointed by UH to provide support to a UH researcher for the purposes of research and/or scholarly development. Postdoctoral appointees hold a doctoral degree awarded within the past 5 - 7 years. The number of postdoctoral appointees is reported to the NSF. (Data source: UH Institutional Research)
Uh system stUdeNt sUCCess
2.A.a. Total Enrollment: The total number of students enrolled during the fall semester at all levels, including full and part time enrollees. Data is reported to IPEDS. (Data source: UH Institutional Research)
2.A.b. Transfer Retention Rate (First Year): The percentage of transfer students returning for enrollment for a second consecutive year. Transfer students are those who transfer to UH with at least 60 hours of completed coursework. (Data source: UH Institutional Research)
2.A.c. Transfer Graduation Rate (4 Year): The percentage of transfer students who graduate within four years. Transfer students are those who transfer to UH with at
least 60 hours of completed coursework. (Data source: UH Institutional Research)
2.A.d. Total Degrees Awarded: The total number of degrees awarded at all levels from July 1 to June 30 as reported to IPEDS. (Data source: UH Institutional Research)
2.A.e. Student Satisfaction Index: Percent of students who rate their entire educational experience as good or excellent. Data is collected from the National Survey of Student Engagement (NSSE). The NSSE question reads: “How would you evaluate your entire educational experience at this institution?”
Uh stUdeNt sUCCess
2.B.a. FTIC Retention Rate (First Year): The percentage of students classified as first-time, full-time, degree-seeking undergraduates who enter in the fall semester and who are enrolled in the following fall semester. Data is reported to IPEDS. (Data source: UH Institutional Research)
2.B.b. FTIC Graduation Rate (6 year): The percentage of students classified as first-time, full-time, degree-seeking undergraduates who graduate within 6 years. Data is reported to IPEDS. (Data source: UH Institutional Research)
2.B.c. Percentage of Graduate/Professional Students: The percentage of degree-seeking and non degree-seeking students enrolled at the graduate level during the fall semester. Date is reported to IPEDS. (Data source: UH Institutional Research)
2.B.d. Freshman Acceptance Rate: The percentage of students who are accepted as first-time, full-time, degree-seeking freshmen during the fall semester subsequent to their submission of a completed application. Data is reported to IPEDS. (Data source: UH Institutional Research)
2.B.e. Freshman Median SAT: The mid-point between the 25th and 75th percentiles of SAT scores (math plus reading) for first-time, full-time, degree-seeking freshmen at UH. Data is reported to IPEDS. (Data source: UH Institutional Research)
2.B.f. Course Completion Rate: Of the attempted semester credit hours (SCH), the percentage of SCH completed at the end of the fall semester as reported to the Texas Legislative Budget Board. (Data source: UH Institutional Research)
CommUNity advaNCemeNt
3.a. Percent of Baccalaureate Graduates Enrolled in Graduate Courses or Employed in Texas in One Year: The percentage of baccalaureate level graduates who enroll in graduate education or who are employed in Texas within one year of graduation. (Data source: THECB)
3.b. Research Awards with Community Emphasis: The number of research awards with a Community Emphasis focus, the determination of which is made by the principal investigator when submitting the proposal for funding. (Data source: UH Division of Research)
athletiC CompetitiveNess
4.a. University Athletics Overall Academic Progress Rate: A measure of the academic performance of student athletes devised and reported by the National Collegiate Athletics Association (NCAA). This standard measure is calculated and reported annually at the team, sport, gender, and university level for the purposes of determining the university’s eligibility to offer athletic scholarships. (Data source: NCAA)
4.b. Total Team Sports Wins: The total number of wins earned by the university’s athletic teams on an annual basis. (Data source: UH Athletics)
4.c. C-USA Championships (Individual/Team): The total number of Conference USA championships earned by the university’s athletic teams and individual student athletes. (Data source: UH Athletics)
4.d. NCAA Post Season Qualifiers (Individual/Team): The total number of the university’s athletic teams and individual student athletes that qualify for post season participation in a sport endorsed by the NCAA. (Data source: UH Athletics)
4.e. Average Attendance (Football/Men’s Basketball): The average attendance at men’s football and men’s basketball games calculated on an annual basis. (Data source: UH Athletics)
NatioNal aNd loCal ReCogNitioN
5.a. National and Local Media Placements (Total Viewers/Market Value): The total market value of UH news and feature stories in national and local publications and television broadcasts, as well as the number of readers and viewers of these stories. 2010-11 has been designated the base year for this measure since data from previous years are not available. (Data source: MeltwaterNews Analytics)
5.b. Web Site (Page Views/Visitors): The total number of times pages are viewed throughout the UH web site. Visitors reflect those new and returning individuals who access the site. 2010-11 has been designated the base year for this measure since data from previous years are not available. (Data source: Google Analytics)
5.c. Messages Supporting Tier One (Impressions/Cost per Impression): Messages supporting Tier One represent external marketing developed specifically for the Tier One initiative. Cost per impression represents impressions (aggregate audience, reported individually by each media entity) divided by actual expenditures on that media. (Data source: Google Analytics)
Competitive ResoURCes
6.a. Total State Appropriations Per Student: The amount of state funds appropriated to the university per full-time equivalent student, as reported by the THECB.
6.b. Total Expenditures Per FTE Student: The amount of funds expended by the university per full-time equivalent student, as reported by the THECB.
6.c. Endowment: The amount of funds held by endowments and foundations for the university as reported to the National Association of College and University Business Officers (NACUBO) in June of each year. (Data source: UH Office of Treasurer)
6.d. Total Annual Giving: The amount of contributions to the university in the form of cash, securities, company products, and other property from alumni, individuals, corporations, foundations, religious organizations, and other groups. Data is reported to the Council for Aid to Education on an annual basis. (Data source: UH Advancement)
6.e. Alumni Giving Rate: The percentage of alumni who contribute financially to the university during a fiscal year. Data is reported to U.S. News and World Report. This measure is a two-year average. (Data source: UH Advancement)
UNiveRsity of hoUstoN peRfoRmaNCe measURe defiNitioNs
9
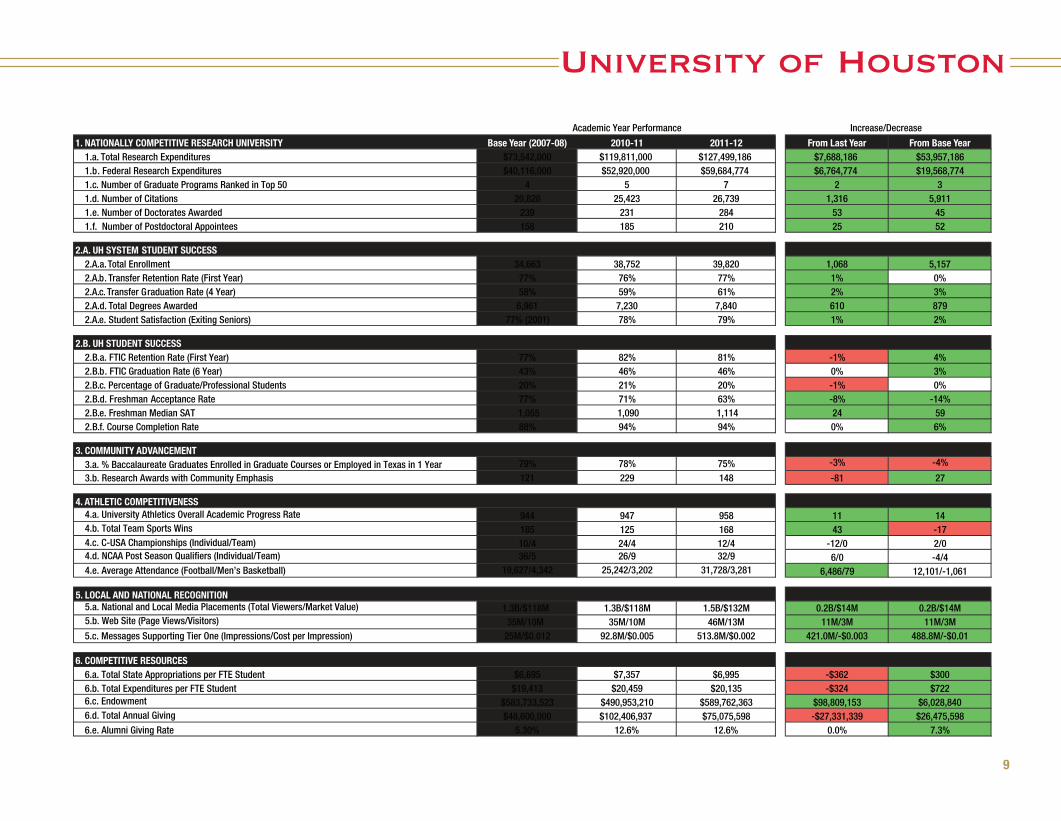
1. NATIONALLY COMPETITIVE RESEARCH UNIVERSITY Base Year (2007-08) 2010-11 2011-12 From Last Year From Base Year 1.a. Total Research Expenditures $73,542,000 $119,811,000 $127,499,186 $7,688,186 $53,957,186 1.b. Federal Research Expenditures $40,116,000 $52,920,000 $59,684,774 $6,764,774 $19,568,774 1.c. Number of Graduate Programs Ranked in Top 50 4 5 7 2 3 1.d. Number of Citations 20,828 25,423 26,739 1,316 5,911 1.e. Number of Doctorates Awarded 239 231 284 53 45 1.f. Number of Postdoctoral Appointees 158 185 210 25 52
2.A. UH SYSTEM STUDENT SUCCESS 2.A.a. Total Enrollment 34,663 38,752 39,820 1,068 5,157 2.A.b. Transfer Retention Rate (First Year) 77% 76% 77% 1% 0% 2.A.c. Transfer Graduation Rate (4 Year) 58% 59% 61% 2% 3% 2.A.d. Total Degrees Awarded 6,961 7,230 7,840 610 879 2.A.e. Student Satisfaction (Exiting Seniors) 77% (2001) 78% 79% 1% 2%
2.B. UH STUDENT SUCCESS 2.B.a. FTIC Retention Rate (First Year) 77% 82% 81% -1% 4% 2.B.b. FTIC Graduation Rate (6 Year) 43% 46% 46% 0% 3% 2.B.c. Percentage of Graduate/Professional Students 20% 21% 20% -1% 0% 2.B.d. Freshman Acceptance Rate 77% 71% 63% -8% -14% 2.B.e. Freshman Median SAT 1,055 1,090 1,114 24 59 2.B.f. Course Completion Rate 88% 94% 94% 0% 6%
3. COMMUNITY ADVANCEMENT 3.a. % Baccalaureate Graduates Enrolled in Graduate Courses or Employed in Texas in 1 Year 79% 78% 75% -3% -4%
3.b. Research Awards with Community Emphasis 121 229 148 -81 27
4. ATHLETIC COMPETITIVENESS 4.a. University Athletics Overall Academic Progress Rate 944 947 958 11 14 4.b. Total Team Sports Wins 185 125 168 43 -17 4.c. C-USA Championships (Individual/Team) 4.d. NCAA Post Season Qualifiers (Individual/Team)
10/4 24/4 12/4 -12/0 2/036/5 26/9 32/9 6/0 -4/4
4.e. Average Attendance (Football/Men’s Basketball) 19,627/4,342 25,242/3,202 31,728/3,281 6,486/79 12,101/-1,061
5. LOCAL AND NATIONAL RECOGNITION 5.a. National and Local Media Placements (Total Viewers/Market Value) 1.3B/$118M 1.3B/$118M 1.5B/$132M 0.2B/$14M 0.2B/$14M 5.b. Web Site (Page Views/Visitors) 35M/10M 35M/10M 46M/13M 11M/3M 11M/3M 5.c. Messages Supporting Tier One (Impressions/Cost per Impression) 25M/$0.012 92.8M/$0.005 513.8M/$0.002 421.0M/-$0.003 488.8M/-$0.01
6. COMPETITIVE RESOURCES 6.a. Total State Appropriations per FTE Student $6,695 $7,357 $6,995 -$362 $300 6.b. Total Expenditures per FTE Student $19,413 $20,459 $20,135 -$324 $722 6.c. Endowment $583,733,523 $490,953,210 $589,762,363 $98,809,153 $6,028,840 6.d. Total Annual Giving $48,600,000 $102,406,937 $75,075,598 -$27,331,339 $26,475,598 6.e. Alumni Giving Rate 5.30% 12.6% 12.6% 0.0% 7.3%
Increase/DecreaseAcademic Year Performance
University of Houston
10
NatioNally Competitive UNiveRsity
1.a. Total Research Expenditures: Total research funds from all sources expended during a fiscal year and reported to the National Science Foundation (NSF). (Data source: UHCL Office of Sponsored Programs)
1.b. Federal Research Expenditures: Research funds from federal sources expended during a fiscal year and reported to the NSF. (Data source: UHCL Office of Sponsored Programs)
1.c. Total Sponsored Program Expenditures: Total research and non-research funds from all sources expended during a fiscal year, including public service, curriculum development, and non-research training. (Data source: UHCL Office of Sponsored Programs)
1.d. Number of Specialized Accredited Programs: The official number of specialized and accredited programs at the university. Includes accreditations such as: Commission on Accreditation of Health Management Education (CAHME), Accreditation Board for Engineering and Technology (ABET), and National Council for Accreditation of Teacher Education (NCATE). Data is validated with each school every spring for accuracy and accreditation updates. (Data source: UHCL deans offices)
1.e. Master’s Degrees Awarded Compared to Peers: The number of master’s level degrees awarded annually compared to UHCL’s national peers. Data is reported to IPEDS. (Data source: UHCL Institutional Research)
Uh system stUdeNt sUCCess
2.A.a. Total Enrollment: The total number of students enrolled during the fall semester at all levels, including full and part time enrollees. Data is reported to IPEDS. (Data source: UHCL Institutional Research)
2.A.b. Transfer Retention Rate (First Year): The percentage of transfer students returning for enrollment for a second consecutive year. Transfer students are those who transfer to UHCL with at least 60 hours of completed coursework. (Data source: UHCL Institutional Research)
2.A.c. Transfer Graduation Rate (4 years): The percentage of transfer students who graduate within four years. Transfer students are those who transfer to
UHCL with at least 60 hours of completed coursework. (Data source: UHCL Institutional Research)
2.A.d. Total Degrees Awarded: The total number of degrees awarded at all levels from July 1 to June 30 as reported to IPEDS. (Data source: UHCL Institutional Research)
2.A.e. Student Satisfaction Index: Percentage of students who rate their entire educational experience as good or excellent. Data is collected from the National Survey of Student Engagement (NSSE). The NSSE question reads: “How would you evaluate your entire educational experience at this institution?”
UhCl stUdeNt sUCCess
2.B.a. Hispanic Transfer Retention Rate (First Year): The percentage of full-time, degree-seeking, undergraduate transfer Hispanic students who enter in the fall semester with at least 60 accepted semester credit hours and are still enrolled after one academic year. (Data source: UHCL Institutional Research)
2.B.b. Hispanic Transfer Graduation Rate (4 years): The percent of full-time, degree-seeking, undergraduate transfer Hispanic students who earn a baccalaureate degree within four academic years. (Data source: UHCL Institutional Research)
2.B.c. Degrees Awarded Compared to All 15 Texas Master’s Universities: The total number of degrees awarded at all levels annually. Data is reported to IPEDS and compared to other Texas master’s level peer institutions. (Data source: UHCL Institutional Research)
2.B.d. Bachelor’s Degrees Awarded Compared to Peers: The number of bachelor’s level degrees awarded annually compared to UHCL’s national peers. Data is reported to IPEDS. (Data source: UHCL Institutional Research)
2.B.e. Mean Student Rating on NSSE Item: “If You Could Start Over Again, Would You Go to the Same Institution You are Now Attending?”: The percent of positive student responses (probably yes/definitely yes) to the NSSE survey for question number 14.
2.B.f. Percent of Graduating Students Responding Yes to “Would You Recommend UHCL to Friends and Family?”: The percent of students responding Yes
versus No to the Graduating Student Survey question: Would you recommend UHCL to friends and family? Percent responses are disaggregated by undergraduate, graduate, and total. (Data source: Graduating Student Survey)
2.B.g. Certification Rate of Teacher Education Graduates: The certification rate of teacher education graduates as reported to the Legislative Budget Board. (Data source: UHCL Institutional Research)
2.B.h. Course Completion Rate: Of the attempted semester credit hours (SCH), the percentage of SCH completed at the end of the fall semester as reported to the Texas Legislative Budget Board. (Data source: UHCL Institutional Research)
CommUNity advaNCemeNt
3.a. Percent of Baccalaureate Graduates Enrolled in Graduate Courses or Employed in Texas in One Year: The percentage of baccalaureate level graduates who enroll in graduate education or who are employed in Texas within one year of graduation. (Data source: Texas Higher Education Coordinating Board)
3.b. Number of Courses with Community Engagement Activity: Community engagement activities have been defined as practicum courses and are based on fiscal year data. (Data source: UHCL Institutional Research)
3.c. Number of Community Partnerships: The number of partnerships maintained by the university with one or more community-based organizations, entities, or corporations for the purposes of instruction, research, or service. (Data source: UHCL Office of Planning & Assessment)
Competitive ResoURCes
4.a. Total State Appropriations Per FTE Student: The amount of state funds appropriated to the university per full-time equivalent student as reported by the THECB.
4.b. Total Expenditures Per FTE Student: The amount of funds expended by the university per full-time equivalent student as reported by the THECB.
4.c. Endowment: The amount of funds held by endowments and foundations for the university as reported to the National Association of College and
University Business Officers (NACUBO) in June of each year. (Data source: UHS Office of Treasurer)
4.d. Total Annual Giving: The amount of contributions to the university in the form of cash, securities, company products, and other property from alumni, non-alumni individuals, corporations, foundations, religious organizations, and other groups. Data is reported to the Council for Aid to Education on an annual basis. (Data source: UHS Advancement)
Note 1: UH-Clear Lake Comparison Group: Arizona State University at the West Campus, Fitchburg State College, Governors State University, Indiana University-South Bend, Texas A&M University-Corpus Christi, The University of West Florida, University of Baltimore, University of Colorado at Colorado Springs, University of Illinois at Springfield, and the University of Michigan-Dearborn.
Note 2: THECB Master’s University’s Peer Groups: Angelo State University, Midwestern State University, Sul Ross State University, Sul Ross State University Rio Grande College, Texas A&M University-Galveston, Texas A&M University-Texarkana, The University of Texas at Brownsville, The University of Texas at Tyler, The University of Texas of the Permian Basin, University of Houston-Downtown, University of Houston-Victoria, Texas A&M University-Central Texas, Texas A&M University-San Antonio, and University of North Texas at Dallas.
UNiveRsity of hoUstoN-CleaR lake peRfoRmaNCe measURe defiNitioNs & Notes
11
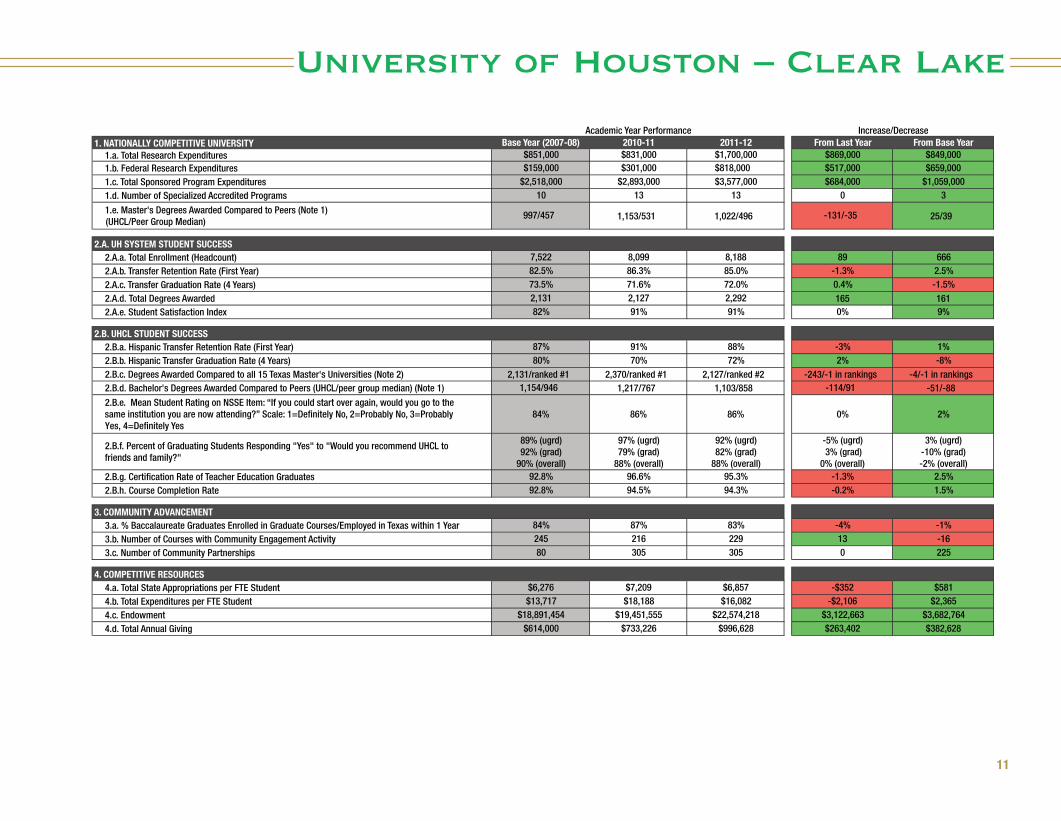
Base Year (2007-08) 2010-11 2011-12 From Last Year From Base Year1.a. Total Research Expenditures $851,000 $831,000 $1,700,000 $869,000 $849,0001.b. Federal Research Expenditures $159,000 $301,000 $818,000 $517,000 $659,0001.c. Total Sponsored Program Expenditures $2,518,000 $2,893,000 $3,577,000 $684,000 $1,059,0001.d. Number of Specialized Accredited Programs 10 13 13 0 3
1.e. Master's Degrees Awarded Compared to Peers (Note 1) (UHCL/Peer Group Median)
997/457 1,153/531 1,022/496 -131/-35 25/39
2.A.a. Total Enrollment (Headcount) 7,522 8,099 8,188 89 6662.A.b. Transfer Retention Rate (First Year) 82.5% 86.3% 85.0% -1.3% 2.5%2.A.c. Transfer Graduation Rate (4 Years) 73.5% 71.6% 72.0% 0.4% -1.5%2.A.d. Total Degrees Awarded 2,131 2,127 2,292 165 1612.A.e. Student Satisfaction Index 82% 91% 91% 0% 9%
2.B.a. Hispanic Transfer Retention Rate (First Year) 87% 91% 88% -3% 1%2.B.b. Hispanic Transfer Graduation Rate (4 Years) 80% 70% 72% 2% -8%2.B.c. Degrees Awarded Compared to all 15 Texas Master's Universities (Note 2) 2,131/ranked #1 2,370/ranked #1 2,127/ranked #2 -243/-1 in rankings -4/-1 in rankings2.B.d. Bachelor's Degrees Awarded Compared to Peers (UHCL/peer group median) (Note 1) 1,154/946 1,217/767 1,103/858 -114/91 -51/-88
2.B.e. Mean Student Rating on NSSE Item: “If you could start over again, would you go to thesame institution you are now attending?” Scale: 1=Definitely No, 2=Probably No, 3=Probably Yes, 4=Definitely Yes
84% 86% 86% 0% 2%
2.B.f. Percent of Graduating Students Responding "Yes" to "Would you recommend UHCL tofriends and family?"
89% (ugrd)92% (grad)
90% (overall)
97% (ugrd)79% (grad)
88% (overall)
92% (ugrd)82% (grad)
88% (overall)
-5% (ugrd) 3% (grad)
0% (overall)
3% (ugrd)-10% (grad)-2% (overall)
2.B.g. Certification Rate of Teacher Education Graduates 92.8% 96.6% 95.3% -1.3% 2.5%2.B.h. Course Completion Rate 92.8% 94.5% 94.3% -0.2% 1.5%
3.a. % Baccalaureate Graduates Enrolled in Graduate Courses/Employed in Texas within 1 Year 84% 87% 83% -4% -1%3.b. Number of Courses with Community Engagement Activity 245 216 229 13 -163.c. Number of Community Partnerships 80 305 305 0 225
4.a. Total State Appropriations per FTE Student $6,276 $7,209 $6,857 -$352 $5814.b. Total Expenditures per FTE Student $13,717 $18,188 $16,082 -$2,106 $2,3654.c. Endowment $18,891,454 $19,451,555 $22,574,218 $3,122,663 $3,682,7644.d. Total Annual Giving $614,000 $733,226 $996,628 $263,402 $382,628
Increase/Decrease
Note 2: THECB Master's University's Peer Group are: Angelo State University, Midwestern State University, Sul Ross State University, Sul Ross State University Rio Grande College, Texas A&M University-Galveston, Texas A&M University-Texarkana, The University of Texas at Brownsville, The University of Texas at Tyler, The University of Texas - Permian Basin, University of Houston-Downtown, University of Houston-Victoria, Texas A&M University-Central Texas, Texas A&M University-San Antonio, and University of North Texas at Dallas.
Note 1: UH-Clear Lake comparison group: Arizona State University at the West Campus, Fitchburg State College, Governors State University, Indiana University-South Bend, Texas A & M University-Corpus Christi, The University of West Florida, University of Baltimore, University of Colorado at Colorado Springs, University of Illinois at Springfield, and the University of Michigan-Dearborn.
1. NATIONALLY COMPETITIVE UNIVERSITY
2.A. UH SYSTEM STUDENT SUCCESS
2.B. UHCL STUDENT SUCCESS
3. COMMUNITY ADVANCEMENT
4. COMPETITIVE RESOURCES
Academic Year Performance
University of Houston – clear Lake
12
NatioNally Competitive UNiveRsity
1.a. Total Research Expenditures: Total research funds from all sources expended during a fiscal year and reported to the National Science Foundation (NSF). (Data source: UHD Sponsored Programs)
1.b. Federal Research Expenditures: Research funds from federal sources expended during a fiscal year and reported to the NSF. (Data source: UHD Sponsored Programs)
1.c. Set-Asides for Hispanic Serving Institutions (HSI): Limited grant set-aside funds established by federal law for HSIs to strengthen and develop institutional programs and research opportunities for students. (Data source: UHD Sponsored Programs)
Uh system stUdeNt sUCCess
2.A.a. Total Enrollment: The total number of students enrolled during the fall semester at all levels, including full and part time enrollees. Data is reported to IPEDS. (Data source: UHD Institutional Research)
2.A.b. Transfer Retention Rate (First Year): The percentage of transfer students returning for enrollment for a second consecutive year. Transfer students are those who transfer to UHD with at least 60 hours of completed coursework. (Data source: UHD Institutional Research)
2.A.c. Transfer Graduation Rate (4 years): The percentage of transfer students who graduate within four years. Transfer students are those who transfer to UHD with at least 60 hours of completed coursework. (Data source: UHD Institutional Research)
2.A.d. Total Degrees Awarded: The total number of degrees awarded at all levels from July 1 to June 30 as reported to IPEDS. (Data source: UHD Institutional Research)
2.A.e. Student Satisfaction Index: Percentage of students who rate their entire educational experience as good or excellent. Data is collected from the National Survey of Student Engagement
(NSSE). The NSSE question reads: “How would you evaluate your entire education experience at this institution?”
Uhd stUdeNt sUCCess
2.B.a. FTIC Retention Rate (1 yr): The percentage of students classified as first-time, full-time, degree- seeking undergraduates who enter in the fall semester and who are enrolled in the following fall semester. Data is reported to IPEDS. (Data source: UHD Institutional Research)
2.B.b. FTIC Graduation Rate (6 yr): The percentage of students classified as first-time, full-time, degree-seeking undergraduates who graduate within 6 years. Data is reported to IPEDS. (Data source: UHD Institutional Research)
2.B.c. FTIC Graduation and Persistence Rate (6 yr): The percentage of full-time, first time in college (FTIC) undergraduates who have graduated or are still enrolled at UHD or another Texas institution (public or private) after six academic years. (Data source: Texas Higher Education Coordinating Board)
2.B.d. Number of Degrees Awarded in Key Fields: The total number of degrees awarded in computer science, engineering, math, and the physical sciences by fiscal year. (Data source: Texas Higher Education Coordinating Board)
2.B.e. Number of Degrees Awarded to African-American Students: The total number of degrees (undergraduate and graduate) awarded to African-American students by fiscal year. (Data source: UHD Institutional Research)
2.B.f. Number of Degrees Awarded to Hispanic Students: The total number of degrees (undergraduate and graduate) awarded to Hispanic students by fiscal year. (Data source: UHD Institutional Research)
2.B.g. Pass Rate on Certification Exam– Education: The percent of the institution’s undergraduate teacher education program graduates attempting the state licensing examination who pass all parts either before
graduation or within the 12 months immediately following graduation. Data is reported to the LBB. (Data source: UHD Institutional Research)
2.B.h. Course Completion Rate: Of the attempted semester credit hours (SCH), the percentage of SCH completed at the end of the fall semester as reported to the Texas Legislative Budget Board. (Data source: UHD Institutional Research)
CommUNity advaNCemeNt
3.a. Percent of Baccalaureate Graduates Enrolled in Graduate Courses or Employed in Texas in One Year: The percentage of baccalaureate level graduates who enroll in graduate education or who are employed in Texas within one year of graduation. (Data source: Texas Higher Education Coordinating Board)
3.b. Number of Courses with Community Engagement Activities Offered Annually: Community engagement activities have been defined as practicum courses and are based on fiscal year data. (Data source: UHD Institutional Research)
3.c. Number of Dual Credit Students: Dual credit students are high school students who are earning high school and college credit for the course(s) they are enrolled in at UHD. (Data source: UHD Institutional Research)
aCCess
4.a. Percent of Students Receiving Pell Grant: The Pell Grant is a federal program providing need-based grants to low-income undergraduate and certain postbaccalaureate students to promote access to postsecondary education. (Data source: Texas Higher Education Coordinating Board)
4.b. Number of Community College Transfer Students Enrolled: The number of students enrolled in the fall semester who attempted 30 or more semester credit hours in a Texas public community college during the past six years. Data is reported to the LBB (Legislative Budget Board). (Data source: UHD Institutional Research)
4.c. Number of Minority Students Enrolled: The
number of Hispanic, African-American, and Native American students enrolled. Historically, these groups have been underrepresented in higher education. Data is reported to the LBB. (Data source: UHD Institutional Research)
4.d. Affordability-Ranking in State: This measure is where UHD ranks among all Texas public universities in the cost of tuition and fees for 15 undergraduate semester credit hours for a student paying resident tuition (1 is the least expensive, 34 is the most expensive). Data is reported by the THECB and put in rank order by UHD.
Competitive ResoURCes
5.a. Total State Appropriations Per FTE Student: The amount of state funds appropriated to the university per full-time equivalent (FTE) student as reported by the THECB.
5.b. Total Expenditures Per FTE Student: The total amount of funds expended by the university per full-time equivalent student as reported by the THECB.
5.c. Endowment: The amount of funds held by endowments and foundations for the university as reported to the National Association of College and University Business Officers (NACUBO) in June of each year. (Data source: UHS Office of Treasurer)
5.d. Total Annual Giving: The amount of contributions to the university in the form of cash, securities, company products, and other property from alumni, non-alumni individuals, corporations, foundations, religious organizations, and other groups. Data is reported to the Council for Aid to Education on an annual basis. (Data source: UHS Advancement)
UNiveRsity of hoUstoN-dowNtowN peRfoRmaNCe measURe defiNitioNs
13
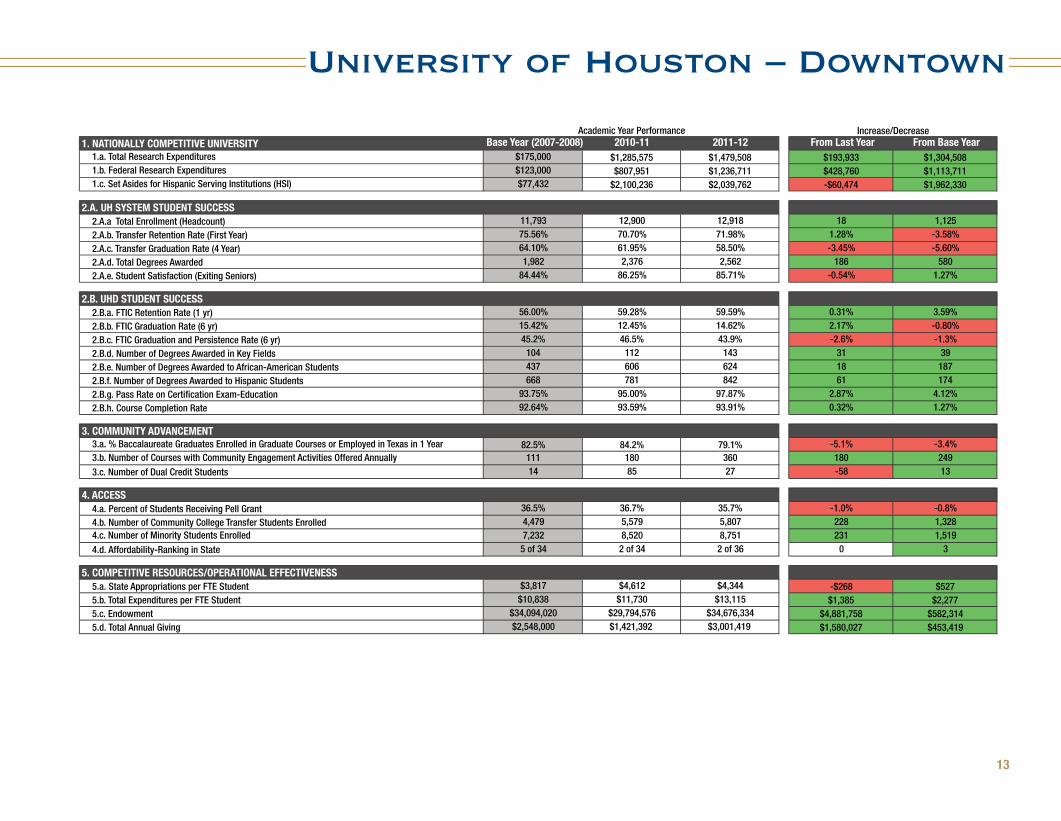
1. NATIONALLY COMPETITIVE UNIVERSITY Base Year (2007-2008) 2010-11 2011-12 From Last Year From Base Year1.a. Total Research Expenditures $175,000 $1,285,575 $1,479,508 $193,933 $1,304,5081.b. Federal Research Expenditures $123,000 $807,951 $1,236,711 $428,760 $1,113,7111.c. Set Asides for Hispanic Serving Institutions (HSI) $77,432 $2,100,236 $2,039,762 -$60,474 $1,962,330
2.A. UH SYSTEM STUDENT SUCCESS2.A.a Total Enrollment (Headcount) 11,793 12,900 12,918 18 1,125
2.A.b. Transfer Retention Rate (First Year) 75.56% 70.70% 71.98% 1.28% -3.58%
2.A.c. Transfer Graduation Rate (4 Year) 64.10% 61.95% 58.50% -3.45% -5.60%
2.A.d. Total Degrees Awarded 1,982 2,376 2,562 186 580
2.A.e. Student Satisfaction (Exiting Seniors) 84.44% 86.25% 85.71% -0.54% 1.27%
2.B. UHD STUDENT SUCCESS2.B.a. FTIC Retention Rate (1 yr) 56.00% 59.28% 59.59% 0.31% 3.59%
2.B.b. FTIC Graduation Rate (6 yr) 15.42% 12.45% 14.62% 2.17% -0.80%
2.B.c. FTIC Graduation and Persistence Rate (6 yr) 45.2% 46.5% 43.9% -2.6% -1.3%
2.B.d. Number of Degrees Awarded in Key Fields 104 112 143 31 39
2.B.e. Number of Degrees Awarded to African-American Students 437 606 624 18 187
2.B.f. Number of Degrees Awarded to Hispanic Students 668 781 842 61 174
2.B.g. Pass Rate on Certification Exam-Education 93.75% 95.00% 97.87% 2.87% 4.12%
2.B.h. Course Completion Rate 92.64% 93.59% 93.91% 0.32% 1.27%
3. COMMUNITY ADVANCEMENT3.a. % Baccalaureate Graduates Enrolled in Graduate Courses or Employed in Texas in 1 Year 82.5% 84.2% 79.1% -5.1% -3.4%3.b. Number of Courses with Community Engagement Activities Offered Annually 111 180 360 180 249
3.c. Number of Dual Credit Students 14 85 27 -58 13
4. ACCESS4.a. Percent of Students Receiving Pell Grant 36.5% 36.7% 35.7% -1.0% -0.8%
4.b. Number of Community College Transfer Students Enrolled 4,479 5,579 5,807 228 1,3284.c. Number of Minority Students Enrolled 7,232 8,520 8,751 231 1,519
4.d. Affordability-Ranking in State 5 of 34 2 of 34 2 of 36 0 3
5. COMPETITIVE RESOURCES/OPERATIONAL EFFECTIVENESS5.a. State Appropriations per FTE Student $3,817 $4,612 $4,344 -$268 $5275.b. Total Expenditures per FTE Student $10,838 $11,730 $13,115 $1,385 $2,2775.c. Endowment $34,094,020 $29,794,576 $34,676,334 $4,881,758 $582,3145.d. Total Annual Giving $2,548,000 $1,421,392 $3,001,419 $1,580,027 $453,419
Academic Year Performance Increase/Decrease
University of Houston – Downtown
14
NatioNally Competitive UNiveRsity
1.a. Percentage of Graduates in Critical Fields (Nursing/Education/STEM/ACC): Percentage of all UHV graduates that complete degrees in the fields of nursing, education, science, technology, engineering, and math (STEM), and accounting reported to the Texas Higher Education Coordinating Board (THECB). (Data source: UHV Institutional Research)
1.b. Ratio of Accredited to Potentially Accredited Programs: The number of UHV programs with national accreditation relative to the number of UHV programs with the potential for national accreditation. (Data source: UHV Institutional Research)
Uh system stUdeNt sUCCess
2.A.a. Total Enrollment: The total number of students enrolled during the fall semester at all levels, including full and part time enrollees. Data is reported to IPEDS. (Data source: UHV Institutional Research)
2.A.b. Transfer Retention Rate (First Year): The percentage of transfer students returning for enrollment for a second consecutive year. Transfer students are those who transfer to UHV with at least 60 hours of completed coursework. (Data source: UHV Institutional Research)
2.A.c. Transfer Graduation Rate (4 years): The percentage of transfer students who graduate within four years. Transfer students are those who transfer to UHV with at least 60 hours of completed coursework. (Data source: UHV Institutional Research)
2.A.d. Total Degrees Awarded: The total number of degrees awarded at all levels from July 1 to June 30 as reported to IPEDS. (Data source: UHV Institutional Research)
2.A.e. Student Satisfaction Index: Percentage of students who rate their entire educational experience as good or excellent. Data is collected from the National Survey of Student Engagement
(NSSE). The NSSE question reads: “How would you evaluate your entire educational experience at this institution?”
Uhv stUdeNt sUCCess
2.B.a. FTIC Retention Rate (First Year): The percentage of students classified as first-time, full-time, degree-seeking undergraduates who enter in the fall semester and who are enrolled in the following fall semester. Data is reported to IPEDS. (Data source: UHV Institutional Research)
2.B.b. Percentage of Graduate and Professional Students: The percentage of degree-seeking and non degree-seeking students enrolled at the graduate level during the fall semester. Data is reported to IPEDS. (Data source: UHV Institutional Research)
2.B.c. Pass Rate on Certification Exams-Education: The percentage of UHV students passing the exam for teacher certification. (Data source: UHV Institutional Research)
2.B.d. Pass Rate on Certification Exams-Nursing: The percentage of UHV students passing the exam for nursing certification. (Data source: UHV Institutional Research)
2.B.e. Underrepresented Group Graduation Rates: The percentage of full-time undergraduate transfer students (African-American, Hispanic, Native American) who graduate within four years. (Data source: UHV Institutional Research)
2.B.f. Course Completion Rate: Of the attempted semester credit hours (SCH), the percentage of SCH completed at the end of the fall semester as reported to the Texas Legislative Budget Board. (Data source: UHV Institutional Research)
CommUNity advaNCemeNt
3.a. Percent of Baccalaureate Graduates Enrolled in Graduate Courses or Employed in Texas in One Year: The percentage of baccalaureate level graduates who enroll in graduate education or who are employed in Texas within one year of
graduation. (Data source: Texas Higher Education Coordinating Board)
3.b. Number of Courses with Community Engagement Activities Offered Annually: Community engagement activities have been defined as practicum courses and are based on fiscal year data. (Data source: UHV Institutional Research)
3.c. Small Business Development Center Contributions (Capital Raised): Amount of capital raised through the Small Business Development Center for business and job creation, retention, and expansion, as reported to the Small Business Administration. (Data source: UHV Small Business Development Center)
aCCess aNd oUtReaCh
4.a. Enrollment of Underrepresented Students: Enrollment of African-American, Hispanic, and Native American students in the fall semester as reported to the THECB. (Data source: UHV Institutional Research)
4.b. First Generation College Student Graduates: Percentage of graduating baccalaureate students whose parents did not graduate from college. Parents are defined only as birth parents, adoptive parents, or legal guardians. Data is reported to the LBB. (Data source: UHV Institutional Research)
4.c. Online and Distance Education (Courses Offered/Students Enrolled): Online courses offered and enrollment for the fall semester as reported to the THECB. (Data source: UHV Institutional Research)
4.d. Affordability-Ranking in State: Tuition and fee ranking in the state as reported by the THECB Tuition and Fee Data Report. (Data source: UHV Institutional Research and THECB)
athletiC CompetitiveNess
5.a. Total Team Sports Wins: The total number of wins earned by the university’s athletic teams on an annual basis. (Data source: NAIA)
5.b. Season Attendance Baseball/Softball: The average attendance at men’s baseball and women’s softball games calculated on an annual basis. (Data source: UHV Athletics)
5.c. Post Season Qualifiers: The total number of the university’s athletic teams and individual student athletes that qualify for post season participation. (Data source: NAIA)
Competitive ResoURCes
6.a. Total State Appropriations Per FTE Student: The amount of state funds appropriated to the university per full-time equivalent student as reported by the THECB.
6.b. Total Expenditure Per FTE Student: The amount of funds expended by the university per full-time equivalent student as reported by the THECB.
6.c. Endowment: The amount of funds held by endowments and foundations for the university as reported to the National Association of College and University Business Officers (NACUBO) in June of each year. (Data source: UHS Office of Treasurer)
6.d. Total Annual Giving: The amount of contributions to the university in the form of cash, securities, company products, and other property from alumni, non-alumni individuals, corporations, foundations, religious organizations, and other groups. Data is reported to the Council for Aid to Education on an annual basis. (Data source: UHS Advancement)
UNiveRsity of hoUstoN-viCtoRia peRfoRmaNCe measURe defiNitioNs

15
1. NATIONALLY COMPETITIVE UNIVERSITY Base Year (2007-08) 2010-11 2011-12 From Last Year From Base Year54.3% 50.1% 48.6% -1.5% -5.7%
1/5 3/5 3/5 0 2
2.A. UH SYSTEM STUDENT SUCCESS2,784 4,095 4,330 235 1,54679.6% 80.0% 72.4% -7.6% -7.2%77.9% 73.9% 70.3% -3.6% -7.6%
620 891 991 100 371NA NA Fr: 91%, Sr:87% NA NA
2.B. UHV STUDENT SUCCESSNA NA 54.0% NA NA
50.2% 44.0% 40.8% -3.2% -9.4%89.3% 90.8% 90.0% -0.8% 0.7%
NA 77.7% 64.0% -13.7% NA65.2% 77.3% 61.5% -15.8% -3.7%91.8% 94.3% 92.9% -1.4% 1.1%
3. COMMUNITY ADVANCEMENT 89.0% 91.7% 85.7% -6.0% -3.3%
94 139 99 -40 5$8.6 million $6.6 million $12.7 million $6.1 million $4.1 million
4. ACCESS AND OUTREACH899 1,536 1,736 200 837
35.2% 60.0% 49.2% -10.8% 14.0%171/4,205 246/6,742 251/7,023 5/281 80/2,818
6 of 34 4 of 36 4 of 37 0 2
5. ATHLETICS COMPETITIVENESS (BASEBALL/SOFTBALL) 29/32 33/35 31/37 -2/2 2/5
12,000 12,000 14,200 2,200 2,2001 of 2 1 of 2 4 of 6 3 3
6. COMPETITIVE RESOURCESS $7,939 $8,431 $7,655 -$776 -$284
$16,444 $14,544 $13,875 -$669 -$2,569$16,575,003 $12,866,424 $15,210,702 $2,344,278 -$1,364,301
$682,000 $1,100,044 $596,588 -$503,456 -$85,412
Increase/DecreaseAcademic Year Performance
1.a. Percentage of Graduates in Critical Fields (Nursing/Education/STEM/ACC)1.b. Ratio of Accredited to Potentially Accredited Programs
2.A.a. Total Enrollment2.A.b. Transfer Retention Rate (one year)2.A.c. Transfer Graduation Rate (four year)2.A.d. Total Degrees Awarded2.A.e. Student Satisfaction (Freshmen, Exiting Seniors)
2.B.a. FTIC Retention Rate (First Year)2.B.b. Percentage of Graduate and Professional Students2.B.c. Pass Rate on Certification Exams-Education2.B.d. Pass Rate on Certification Exams-Nursing2.B.e. Underrepresented Group Graduation Rates 2.B.f. Course Completion Rates
3.a. % Baccalaureate Graduates Enrolled in Graduate Courses or Employed in Texas in 1 Year3.b. Number of Courses with Community Engagement Activities Offered Annually3.c. Small Business Development Center Contributions (Capital Raised)
4.a. Enrollment of Underrepresented Students4.b. First Generation College Student Graduation Rates4.c. Online and Distance Education (Courses Offered/Students Enrolled)4.d. Affordability-Ranking in State
5.a. Total Team Sports Wins 5.b. Total Season Attendance 5.c. Post-season Qualifiers
6.a. Total State Appropriations per FTE Student6.b. Total Expenditures per FTE Student6.c. Endowment6.d. Total Annual Giving
University of Houston – victoria
The University of Houston System universities are Affirmative Action / Equal Opportunity institutions.
www.uhsa.uh.edu
University of HoUston system Board of regents
Nelda Luce Blair, ChairMica Mosbacher, Vice Chair
Jarvis V. Hollingsworth, Secretary
MEMbErS
Spencer D. Armour, III Jacob M. Monty Nandita V. Berry Roger F. Welder Tilman J. Fertitta Welcome W. Wilson, Jr. Tamecia Glover Harris
CHanCellor, University of HoUston system and President, University of HoUston
Renu Khator
University of HoUston system Presidents
Renu Khator, President of University of HoustonWilliam A. Staples, President of UH-Clear LakeWilliam V. Flores, President of UH-Downtown
Philip D. Castille, President of UH-Victoria
University of HoUston system administration
John J. Antel, Senior Vice Chancellor for Academic Affairs and Provost Dona Hamilton Cornell, Vice Chancellor for Legal Affairs and General Counsel Carl P. Carlucci, Executive Vice Chancellor for Administration and Finance Eloise Dunn Stuhr, Vice Chancellor for Advancement Rathindra N. Bose, Vice Chancellor for Research and Technology Transfer J. Richard Walker, Vice Chancellor for Student Affairs Grover Campbell, Vice Chancellor for Governmental Relations
University of HoUston systemUniversity of HoUston • UH Clear lake • UH Downtown • UH viCtoria