Embed Size (px)
DESCRIPTION
2012-patent-litigation-study
Citation preview
1995–2011
2012 Patent Litigation StudyLitigation continues to rise amid growing awareness of patent value

.
PwC 1
Table of contents
Introduction 3
Summary of key observations 5Patent actions rise dramatically, set record high 6Median damages award declines 7NPE awards outpace practicing entities 7The largest historical awards have rarely been upheld 8Jury trials are favored 9Patentees still winning with juries, and increasingly with bench 9NPEs look to juries more often 10However, discrepancy in use of juries has shrunk 10Median jury awards substantially outpace the bench 10Reasonable royalties are the most prevalent damages 11Assessing success rate factors 12NPEs see declining overall success rates 12Trial success rates: diverging results 12Summary judgment impact on NPEs 13Consumer products technology leads in decisions 13Biotechnology and information technology cases on the rise 14Median damages largest in telecommunications industry 15NPE versus practicing entity damages vary widely by industry 16Success rates by industry 17Practicing entity versus NPE success rates by industry 18Telecommunications industry leads in jury use 19Most patent cases (70%) reach trial within three years 20Average time-to-trial: approximately 2.5 years 21Median damages rise with time-to-trial 22Virginia Eastern District, Wisconsin Western District speediest in time-to-trial 22Certain districts are more favorable to patent holders 23Federal district courts with most NPE cases 24Practicing entities and NPEs by the numbers 25NPEs see variety in median damages and success rates 26Individual NPEs experience lower success rates 26Vast majority of NPE litigation involves company and individual NPEs 27ANDA litigation trends upward 27New Jersey and Delaware are favored ANDA districts 28 Historical ANDA success rates have varied significantly 28Top ANDA litigants 29
Our methodology 30
Our authors 31
2 PwC 2012 Patent Litigation Study
Introduction
PwC 3 2012 Patent Litigation Study
Last year marked the most significant change to the US patent system in almost 60 years. President Obama signed the Leahy-Smith America Invents Act (AIA) into law on September 16, 2011, converting the patent system from a ‘first to invent’ to a ‘first inventor to file’ system. The new law also changed inter partes reexamination proceedings and instituted post-grant opposition, among other reforms.
Despite these resounding changes, the AIA does not address the calculation of damages in patent infringement matters. In last year’s 2011 Patent Litigation Study, we commented that the absence of reform guidance in this area suggested that Congress believed that the subject of patent damages is best left for the courts to address and regulate. We further posited that the elimination of the 25 percent rule of thumb, as well as rulings in a variety of other court decisions, demonstrated that the courts, rather than Congress, would continue to shape the future of patent law and play the primary role in how patent damages are determined.
The events of the first half of 2012 affirmed these beliefs. In particular, with the 25 percent rule of thumb removed from the practitioner’s royalty assessment toolkit, a complex mathematical proof for determining royalty apportionment, known as the Nash Bargaining Solution, has recently appeared in some patentees’ damages calculations, receiving mixed reviews
from the courts. In Oracle v. Google, the Court excluded expert testimony partly because, “the Nash Bargaining Solution would invite a miscarriage of justice by clothing a fifty-percent assumption in an impenetrable facade of mathematics.” The Court concluded that, “Instead, the normal Georgia-Pacific factors, which have been approved by the Court of Appeals for the Federal Circuit and which are more understandable to the average fact-finder, will guide our reasonable royalty analysis.”
Conversely, in Mformation Techs v. Research in Motion, the Court did not exclude expert testimony that referenced the Nash Bargaining Solution, noting that the expert used the technique only as a reasonableness check against a royalty rate determined through analysis of the Georgia-Pacific factors, the time-tested standard approach. To date, the Court of Appeals for the Federal Circuit has not had the opportunity to squarely address use of the Nash Bargaining Solution in determining reasonable royalty damages.
The broader lesson of these decisions, among others issued in recent years, is that the courts have been applying greater scrutiny to damages assessments in patent infringement matters; we expect this to continue. Patent litigation counsel and parties should monitor ongoing rulings that could affect damages opinions and methodologies.
New to this year’s study is an analysis of Abbreviated New Drug Application (ANDA) cases, which are increasingly prevalent in the dockets. The volume of such cases has increased substantially over the last five years, and the success rates experienced by the patent holders, or the brand drug manufacturers, have to date been higher than traditional patent actions.
2011 proved to be a historic year for strategic intellectual property acquisitions, particularly in the telecommunications sector, which saw two high-profile acquisitions of patent portfolios:
1) The ‘Rockstar Group’, a consortium of buyers including Apple, Microsoft, Research in Motion, and Sony, acquired the 6,000-patent portfolio of the defunct Nortel Networks for $4.5 billion in July 2011.
2) About a month later, Google acquired Motorola Mobility for $12.5 billion, reportedly for its extensive 17,000-patent portfolio to protect the Android operating system from patent lawsuits.
As the stakes for patent infringement litigation remain high, we expect such strategic patent acquisitions will continue to make headlines.
2012 Patent Litigation Study4 PwC
Summary of key observations
2012 Patent Litigation Study PwC 5
Recognizing these developments and business leaders’ continuing deep interest in intellectual property matters, PwC maintains a database of patent damages awards extending from 1980 through 2011. We collect information about patent holder success rates, time-to-trial statistics, and practicing versus nonpracticing entity (NPE) statistics from 1995 through 2011. This year’s study also includes data related to ANDA litigation.
Our analysis yields a number of observations that can help executives, legislators, and litigators assess their patent enforcement or defense strategies, as well as the impact of NPEs.
• Annual median damages awards (in 2011 dollars) ranged from $1.9 million to $16.1 million between 1995 and 2011. The median damages award from 2006 to 2011 was approximately $4.0 million.
• Damages awards for NPEs averaged almost double those for practicing entities over the last decade.
• The disparity between jury and bench awards continues to widen as the median jury award amounted to more than 20 times the median bench award between 2006 and 2011.
• Reasonable royalties remain the predominant measure of patent damages awards, representing more than 80% of awards over the last six years.
• NPEs have been successful 23% of the time overall versus 34% for practicing entities, due to the relative lack of success for NPEs at summary judgment. However, both have about a two-thirds success rate at trial.
• The median damages award in the telecommunications industry was significantly higher than that in other industries. Other industries with higher relative median damages awards include biotechnology/pharma, medical devices, and computer hardware/electronics.
• While the median time-to-trial has remained fairly constant, averaging 2.3 years since 1995, we see significant variations among jurisdictions.
• Certain federal district courts (particularly Virginia Eastern, Delaware, and Texas Eastern) continue to be more favorable to patent holders, with shorter time-to-trial durations, higher success rates, and larger median damages awards.
• The top five federal district courts (out of a total of 94) accounted for 38% of all identified decisions involving an NPE as the patent holder. The Eastern District of Texas accounted for 12% of NPE decisions.
• All NPEs are not created equal. While university/non-profit NPEs have the highest success rate among NPE litigants, their median damages award is considerably lower than the median award of company NPEs.
• While ANDA litigation continues to grow rapidly, success rates since 2006 have varied significantly, given the small number of cases that reach a dispositive court conclusion.
6 PwC 2012 Patent Litigation Study
Patent actions rise dramatically, set record high
Chart 1
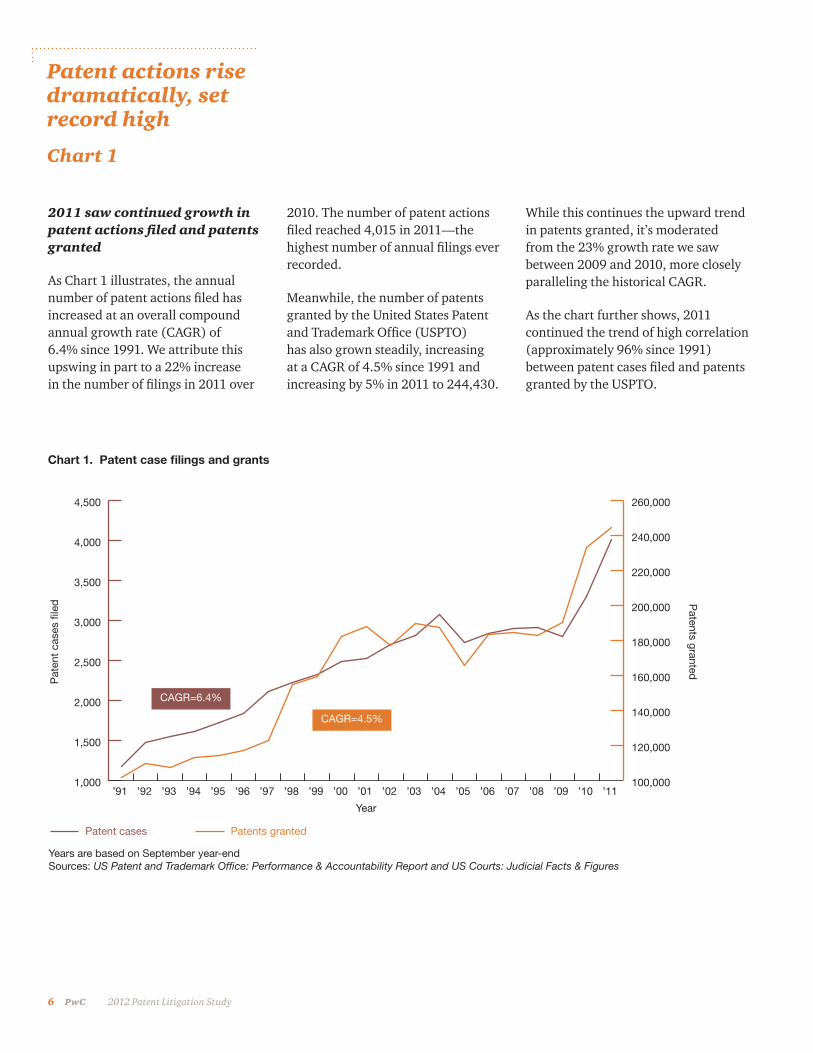
2011 saw continued growth in patent actions filed and patents granted
As Chart 1 illustrates, the annual number of patent actions filed has increased at an overall compound annual growth rate (CAGR) of 6.4% since 1991. We attribute this upswing in part to a 22% increase in the number of filings in 2011 over
1,000
1,500
2,000
2,500
3,000
3,500
4,000
4,500
100,000
120,000
140,000
160,000
180,000
200,000
220,000
240,000
260,000
Pat
ent
case
s fil
ed
Patents granted
’91 ’92 ’93 ’94 ’95 ’96 ’97 ’98 ’99 ’00 ’01 ’02 ’03 ’04 ’05 ’06 ’07 ’08 ’09 ’10 ’11
CAGR=6.4%
CAGR=4.5%
Patent cases Patents granted
Year
Years are based on September year-endSources: US Patent and Trademark Office: Performance & Accountability Report and US Courts: Judicial Facts & Figures
2010. The number of patent actions filed reached 4,015 in 2011—the highest number of annual filings ever recorded.
Meanwhile, the number of patents granted by the United States Patent and Trademark Office (USPTO) has also grown steadily, increasing at a CAGR of 4.5% since 1991 and increasing by 5% in 2011 to 244,430.
While this continues the upward trend in patents granted, it’s moderated from the 23% growth rate we saw between 2009 and 2010, more closely paralleling the historical CAGR.
As the chart further shows, 2011 continued the trend of high correlation (approximately 96% since 1991) between patent cases filed and patents granted by the USPTO.
Chart 1. Patent case filings and grants
PwC 7 2012 Patent Litigation Study
Median damages award declines
Chart 2a
NPE awards outpace practicing entities
Chart 2b
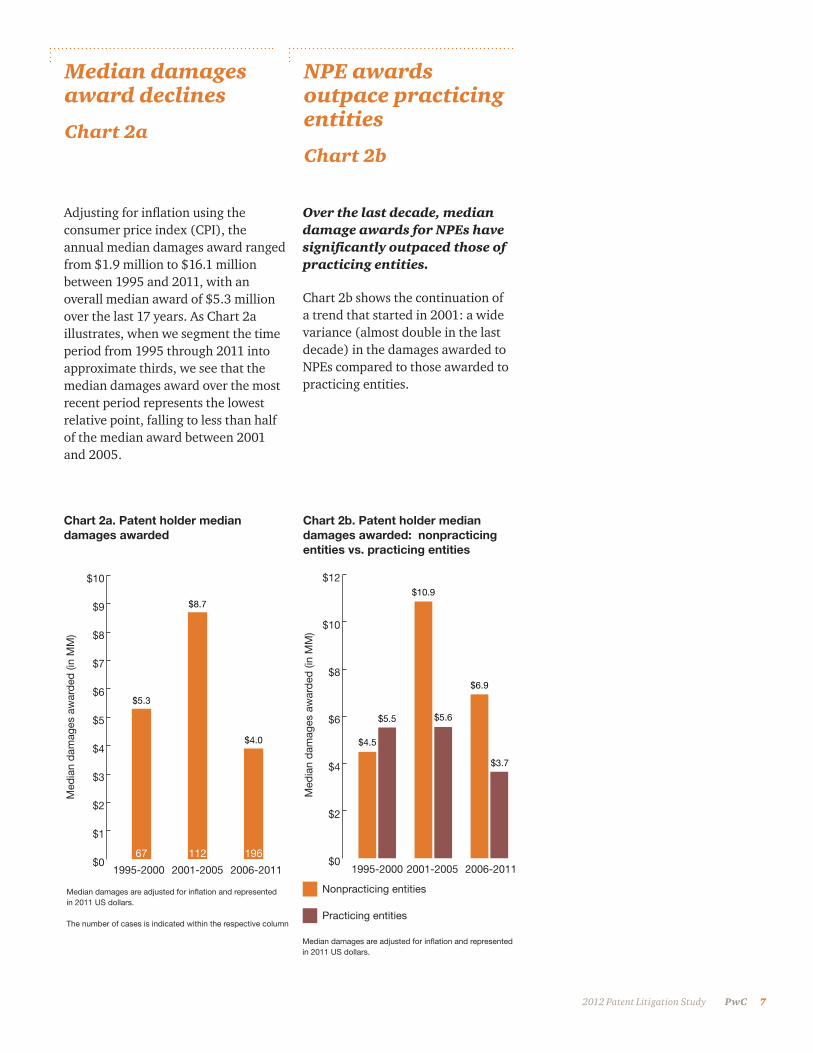
Adjusting for inflation using the consumer price index (CPI), the annual median damages award ranged from $1.9 million to $16.1 million between 1995 and 2011, with an overall median award of $5.3 million over the last 17 years. As Chart 2a illustrates, when we segment the time period from 1995 through 2011 into approximate thirds, we see that the median damages award over the most recent period represents the lowest relative point, falling to less than half of the median award between 2001 and 2005.
Chart 2a. Patent holder median damages awarded
$0
$1
$2
$3
$4
$5
$6
$7
$8
$9
$10
Med
ian
dam
ages
aw
ard
ed (i
n M
M)
Median damages are adjusted for inflation and represented in 2011 US dollars.
The number of cases is indicated within the respective column.
1995-2000 2001-2005 2006-2011
67 112 196
$4.0
$5.3
$8.7
196
Chart 2b. Patent holder median damages awarded: nonpracticing entities vs. practicing entities
$0
$2
$4
$6
$8
$10
$12
Med
ian
dam
ages
aw
ard
ed (i
n M
M)
Median damages are adjusted for inflation and represented in 2011 US dollars.
1995-2000 2001-2005 2006-2011
Nonpracticing entities
Practicing entities
$6.9
$3.7
$4.5
$5.5
$10.9
$5.6
Over the last decade, median damage awards for NPEs have significantly outpaced those of practicing entities.
Chart 2b shows the continuation of a trend that started in 2001: a wide variance (almost double in the last decade) in the damages awarded to NPEs compared to those awarded to practicing entities.
8 PwC 2012 Patent Litigation Study
The largest historical awards have rarely been upheld
Chart 2c
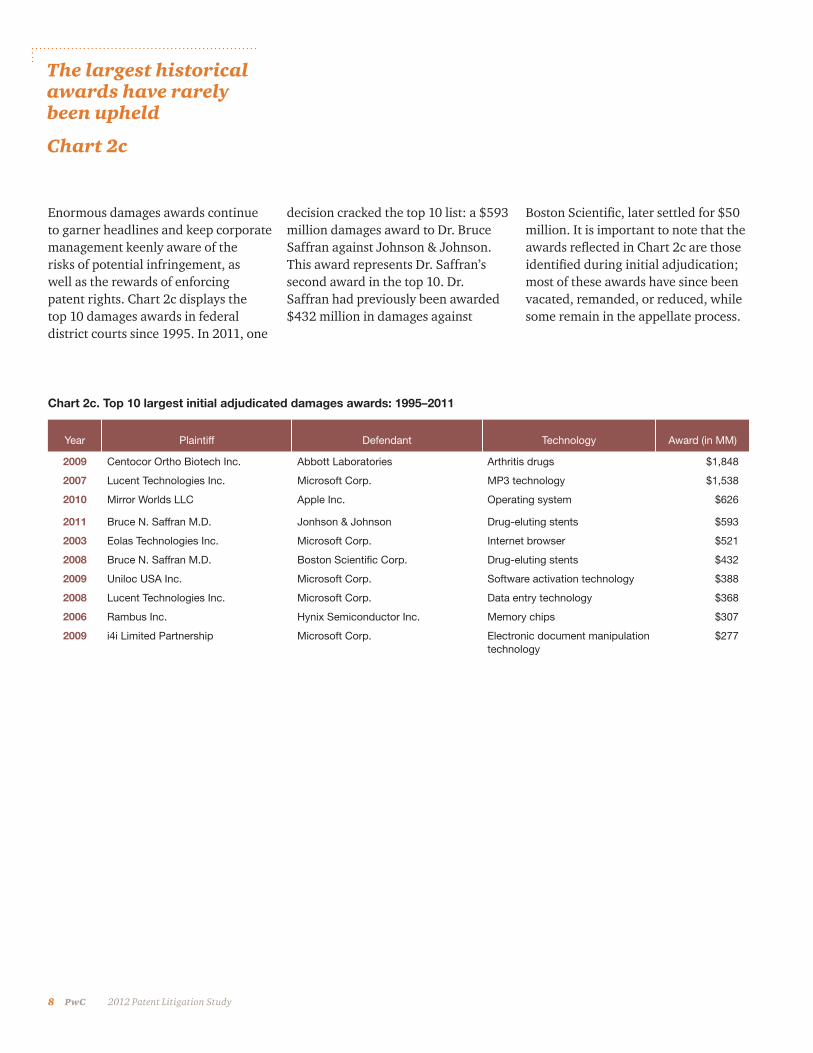
Enormous damages awards continue to garner headlines and keep corporate management keenly aware of the risks of potential infringement, as well as the rewards of enforcing patent rights. Chart 2c displays the top 10 damages awards in federal district courts since 1995. In 2011, one
decision cracked the top 10 list: a $593 million damages award to Dr. Bruce Saffran against Johnson & Johnson. This award represents Dr. Saffran’s second award in the top 10. Dr. Saffran had previously been awarded $432 million in damages against
Boston Scientific, later settled for $50 million. It is important to note that the awards reflected in Chart 2c are those identified during initial adjudication; most of these awards have since been vacated, remanded, or reduced, while some remain in the appellate process.
Year Plaintiff Defendant Technology Award (in MM)
2009 Centocor Ortho Biotech Inc. Abbott Laboratories Arthritis drugs $1,848
2007 Lucent Technologies Inc. Microsoft Corp. MP3 technology $1,538
2010 Mirror Worlds LLC Apple Inc. Operating system $626
2011 Bruce N. Saffran M.D. Jonhson & Johnson Drug-eluting stents $593
2003 Eolas Technologies Inc. Microsoft Corp. Internet browser $521
2008 Bruce N. Saffran M.D. Boston Scientific Corp. Drug-eluting stents $432
2009 Uniloc USA Inc. Microsoft Corp. Software activation technology $388
2008 Lucent Technologies Inc. Microsoft Corp. Data entry technology $368
2006 Rambus Inc. Hynix Semiconductor Inc. Memory chips $307
2009 i4i Limited Partnership Microsoft Corp. Electronic document manipulation technology
$277
Chart 2c. Top 10 largest initial adjudicated damages awards: 1995–2011
PwC 9 2012 Patent Litigation Study
Patentees still winning with juries, and increasingly with bench
Chart 3b
Jury trials are favored
Chart 3a
Juries have become the preferred trier of fact
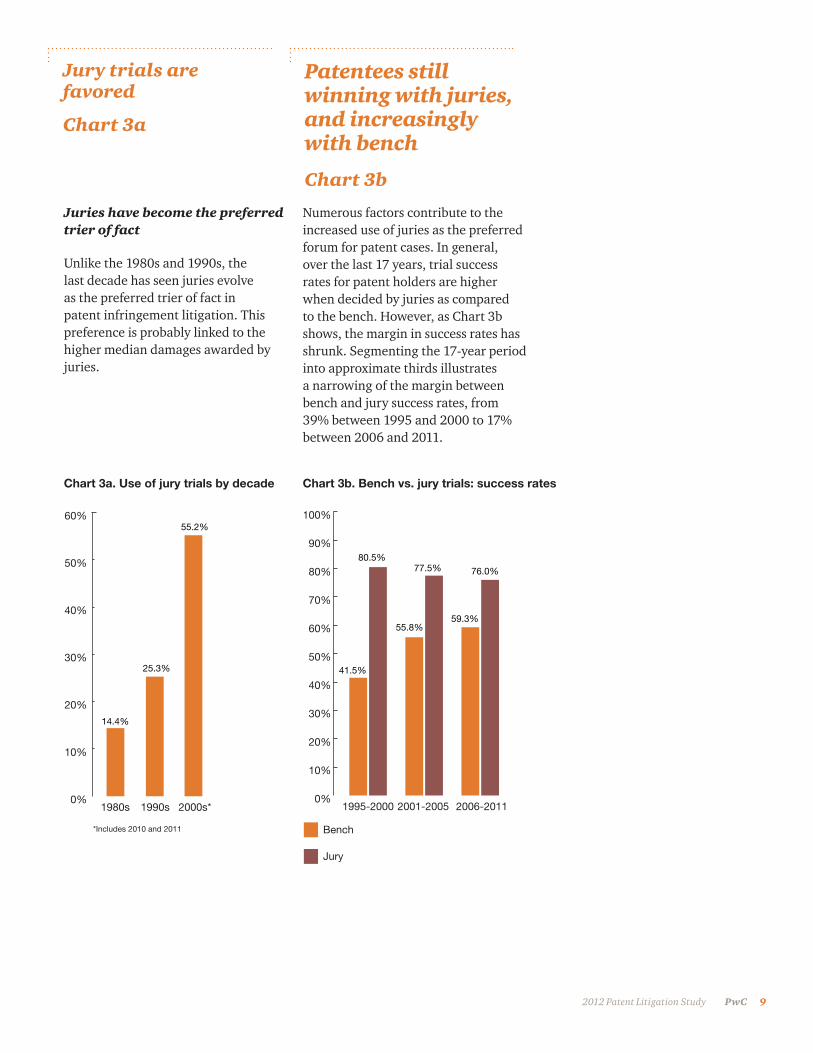
Unlike the 1980s and 1990s, the last decade has seen juries evolve as the preferred trier of fact in patent infringement litigation. This preference is probably linked to the higher median damages awarded by juries.
Numerous factors contribute to the increased use of juries as the preferred forum for patent cases. In general, over the last 17 years, trial success rates for patent holders are higher when decided by juries as compared to the bench. However, as Chart 3b shows, the margin in success rates has shrunk. Segmenting the 17-year period into approximate thirds illustrates a narrowing of the margin between bench and jury success rates, from 39% between 1995 and 2000 to 17% between 2006 and 2011.
Chart 3a. Use of jury trials by decade
0%
10%
20%
30%
40%
50%
60%
1980s 1990s 2000s*
*Includes 2010 and 2011
55.2%
14.4%
25.3%
Chart 3b. Bench vs. jury trials: success rates
0%
10%
20%
30%
40%
50%
60%
70%
80%
90%
100%
1995-2000 2001-2005 2006-2011
Bench
Jury
59.3%
76.0%
41.5%
80.5%
55.8%
77.5%
10 PwC 2012 Patent Litigation Study
Median jury awards substantially outpace the bench
Chart 3e
NPEs look to juries more often
Chart 3c
However, discrepancy in use of juries has shrunk
Chart 3d
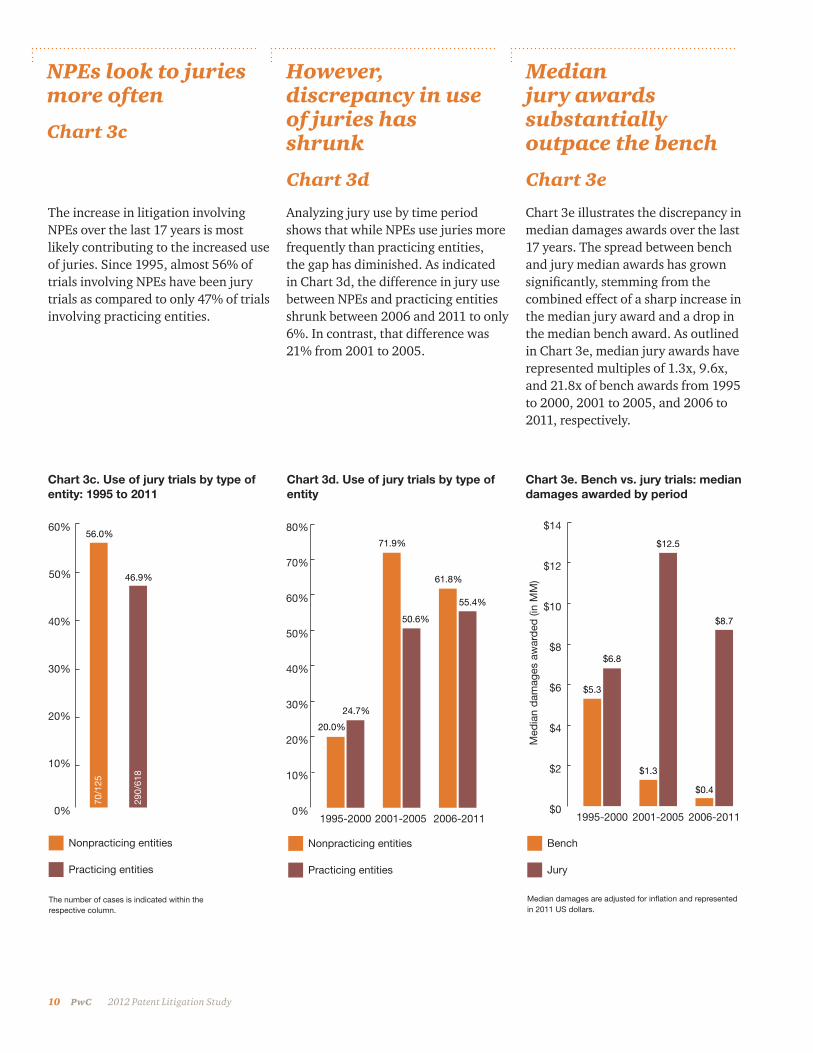
The increase in litigation involving NPEs over the last 17 years is most likely contributing to the increased use of juries. Since 1995, almost 56% of trials involving NPEs have been jury trials as compared to only 47% of trials involving practicing entities.
Chart 3c. Use of jury trials by type of entity: 1995 to 2011
Chart 3d. Use of jury trials by type of entity
Chart 3e. Bench vs. jury trials: median damages awarded by period
0%
10%
20%
30%
40%
50%
60%
The number of cases is indicated within the respective column.
70/1
25
290/
618
56.0%
46.9%
Nonpracticing entities
Practicing entities
0%
10%
20%
30%
40%
50%
60%
70%
80%
1995-2000 2001-2005 2006-2011
Nonpracticing entities
Practicing entities
61.8%
55.4%
20.0%
24.7%
50.6%
71.9%
Analyzing jury use by time period shows that while NPEs use juries more frequently than practicing entities, the gap has diminished. As indicated in Chart 3d, the difference in jury use between NPEs and practicing entities shrunk between 2006 and 2011 to only 6%. In contrast, that difference was 21% from 2001 to 2005.
Chart 3e illustrates the discrepancy in median damages awards over the last 17 years. The spread between bench and jury median awards has grown significantly, stemming from the combined effect of a sharp increase in the median jury award and a drop in the median bench award. As outlined in Chart 3e, median jury awards have represented multiples of 1.3x, 9.6x, and 21.8x of bench awards from 1995 to 2000, 2001 to 2005, and 2006 to 2011, respectively.
$0
$2
$4
$6
$8
$10
$12
$14M
edia
n d
amag
es a
war
ded
(in
MM
)
1995-2000 2001-2005 2006-2011
Bench
Jury
$0.4
$8.7
$5.3
$6.8
$12.5
$1.3
Median damages are adjusted for inflation and represented in 2011 US dollars.
PwC 11 2012 Patent Litigation Study
Reasonable royalties are the most prevalent damages
Chart 4
Reasonable royalties are the predominant measure of damages; price erosion is rare
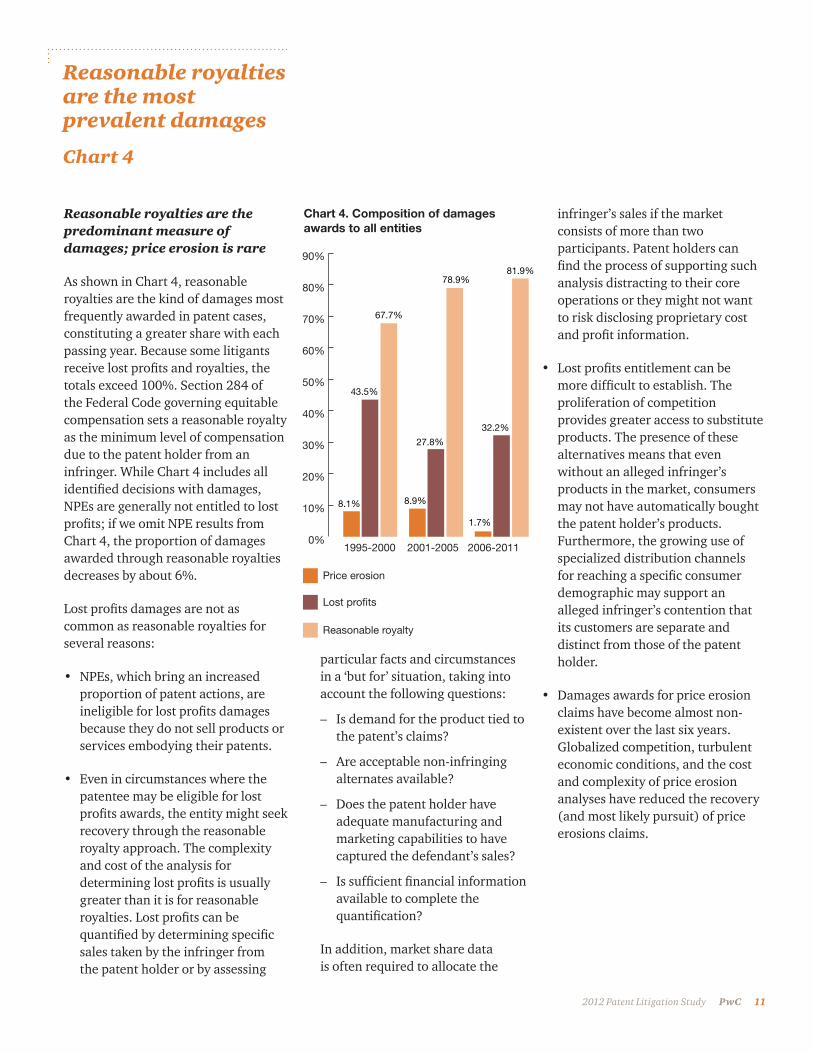
As shown in Chart 4, reasonable royalties are the kind of damages most frequently awarded in patent cases, constituting a greater share with each passing year. Because some litigants receive lost profits and royalties, the totals exceed 100%. Section 284 of the Federal Code governing equitable compensation sets a reasonable royalty as the minimum level of compensation due to the patent holder from an infringer. While Chart 4 includes all identified decisions with damages, NPEs are generally not entitled to lost profits; if we omit NPE results from Chart 4, the proportion of damages awarded through reasonable royalties decreases by about 6%.
Lost profits damages are not as common as reasonable royalties for several reasons:
• NPEs, which bring an increased proportion of patent actions, are ineligible for lost profits damages because they do not sell products or services embodying their patents.
• Even in circumstances where the patentee may be eligible for lost profits awards, the entity might seek recovery through the reasonable royalty approach. The complexity and cost of the analysis for determining lost profits is usually greater than it is for reasonable royalties. Lost profits can be quantified by determining specific sales taken by the infringer from the patent holder or by assessing
particular facts and circumstances in a ‘but for’ situation, taking into account the following questions:
– Is demand for the product tied to the patent’s claims?
– Are acceptable non-infringing alternates available?
– Does the patent holder have adequate manufacturing and marketing capabilities to have captured the defendant’s sales?
– Is sufficient financial information available to complete the quantification?
In addition, market share data is often required to allocate the
infringer’s sales if the market consists of more than two participants. Patent holders can find the process of supporting such analysis distracting to their core operations or they might not want to risk disclosing proprietary cost and profit information.
• Lost profits entitlement can be more difficult to establish. The proliferation of competition provides greater access to substitute products. The presence of these alternatives means that even without an alleged infringer’s products in the market, consumers may not have automatically bought the patent holder’s products. Furthermore, the growing use of specialized distribution channels for reaching a specific consumer demographic may support an alleged infringer’s contention that its customers are separate and distinct from those of the patent holder.
• Damages awards for price erosion claims have become almost non-existent over the last six years. Globalized competition, turbulent economic conditions, and the cost and complexity of price erosion analyses have reduced the recovery (and most likely pursuit) of price erosions claims.
Chart 4. Composition of damages awards to all entities
0%
10%
20%
30%
40%
50%
60%
70%
80%
90%
1995-2000 2001-2005 2006-2011
Price erosion
Lost profits
Reasonable royalty
27.8%
78.9%
8.1%
43.5%
8.9%
67.7%
81.9%
1.7%
32.2%
12 PwC 2012 Patent Litigation Study
Assessing success rate factors
Chart 5a
NPEs see declining overall success rates
Chart 5b
Chart 5a. Patent holder success rates: 1995 to 2011
Chart 5b. Patent holder overall success rates
Chart 5c. Patent holder success rates at trial: 1995 to 2011
0%
10%
20%
30%
40%
50%
60%
70%
Overall Summaryjudgment
Trial
Nonpracticing entities
Practicing entities
23.3%
33.8%
2.3%
9.8%
63.2% 64.6%
0%
5%
10%
15%
20%
25%
30%
35%
40%
13.4%
27.9%
29.8%31.3%
24.3%
37.9%
1995-2000 2001-2005 2006-2011
Nonpracticing entities
Practicing entities
0%
10%
20%
30%
40%
50%
60%
70%
80%
90%
The number of cases is indicated within the respective column.
23/5
5
178/
328
56/7
0
221/
290
Bench Jury
Nonpracticing entities
Practicing entities
41.8%
54.3%
80.0%76.2%
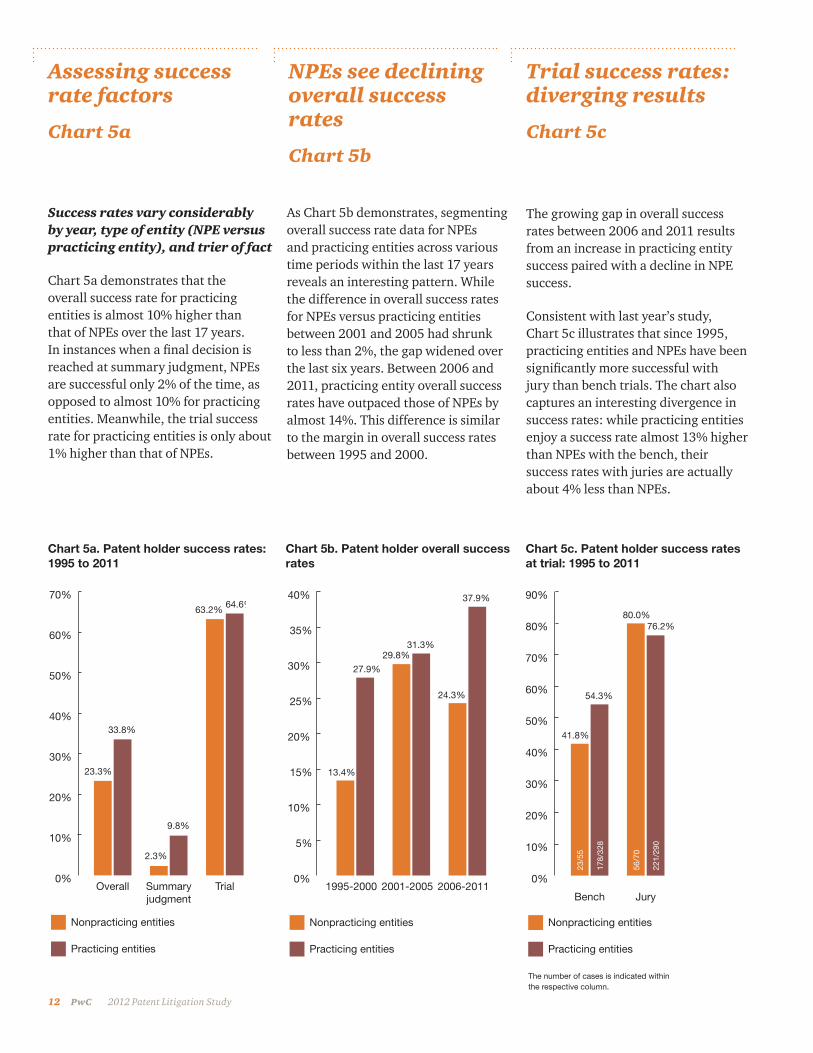
Success rates vary considerably by year, type of entity (NPE versus practicing entity), and trier of fact
Chart 5a demonstrates that the overall success rate for practicing entities is almost 10% higher than that of NPEs over the last 17 years. In instances when a final decision is reached at summary judgment, NPEs are successful only 2% of the time, as opposed to almost 10% for practicing entities. Meanwhile, the trial success rate for practicing entities is only about 1% higher than that of NPEs.
As Chart 5b demonstrates, segmenting overall success rate data for NPEs and practicing entities across various time periods within the last 17 years reveals an interesting pattern. While the difference in overall success rates for NPEs versus practicing entities between 2001 and 2005 had shrunk to less than 2%, the gap widened over the last six years. Between 2006 and 2011, practicing entity overall success rates have outpaced those of NPEs by almost 14%. This difference is similar to the margin in overall success rates between 1995 and 2000.
Trial success rates: diverging results
Chart 5c
The growing gap in overall success rates between 2006 and 2011 results from an increase in practicing entity success paired with a decline in NPE success.
Consistent with last year’s study, Chart 5c illustrates that since 1995, practicing entities and NPEs have been significantly more successful with jury than bench trials. The chart also captures an interesting divergence in success rates: while practicing entities enjoy a success rate almost 13% higher than NPEs with the bench, their success rates with juries are actually about 4% less than NPEs.
PwC 13 2012 Patent Litigation Study
Chart 5d. Percent of decisions at summary judgment
Chart 6a. Distribution of cases: top ten industries, 1995–2011
0%
10%
20%
30%
40%
50%
60%
70%
1995-2000 2001-2005 2006-2011
Nonpracticing entities
Practicing entities
61.0%
52.0%
61.7%
52.9%
58.4%
52.3%
0%
2%
4%
6%
8%
10%
12%
14%
16%
18%
20%
Con
sum
er p
rodu
cts
Bio
tech
nolo
gy/P
harm
a
Indu
stria
l/Con
stru
ctio
nM
edic
al d
evic
es
Com
pute
r har
dwar
e/El
ectro
nics
Bus
ines
s/C
onsu
mer
ser
vice
sSo
ftwar
e
Che
mic
als/
Synt
hetic
mat
eria
ls
Auto
mot
ive/
Tran
spor
tatio
nTe
leco
mm
unic
atio
ns
Per
cent
of c
ases
17.9%
12.7%
11.7%
9.5%9.0%
6.5%5.8%
5.0% 4.9%4.5%
Summary judgment impact on NPEs
Chart 5d
Consumer products technology leads in decisions
Chart 6a
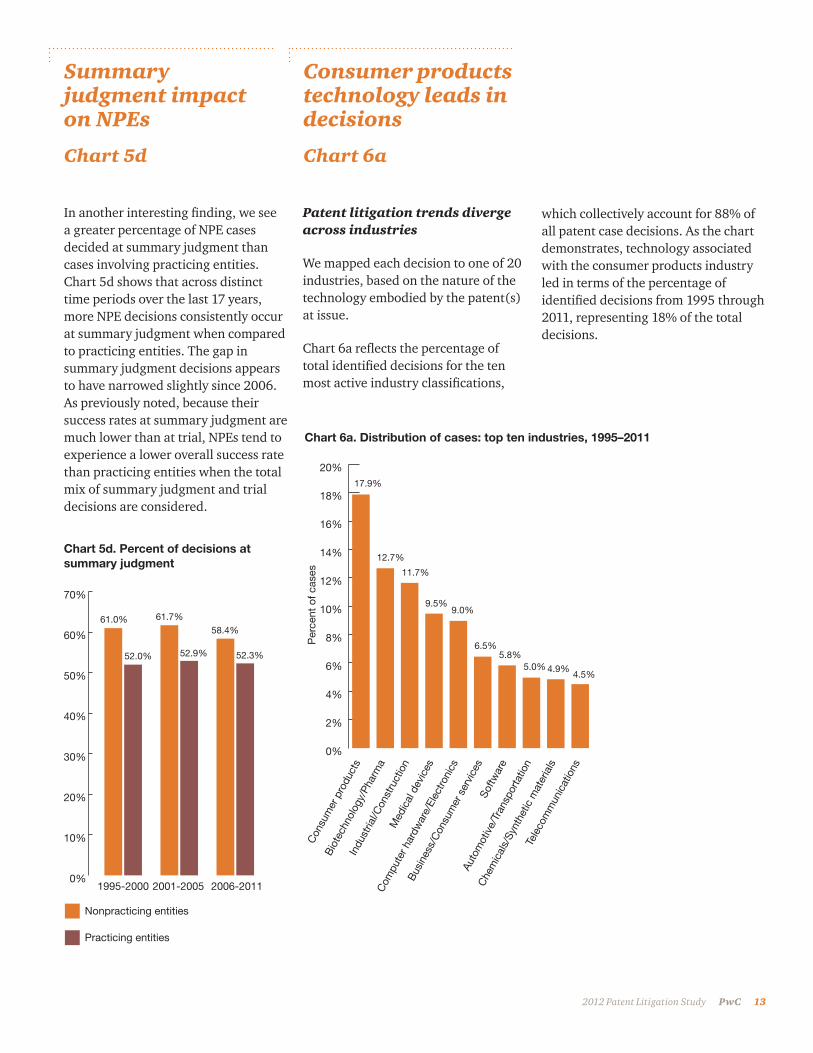
In another interesting finding, we see a greater percentage of NPE cases decided at summary judgment than cases involving practicing entities. Chart 5d shows that across distinct time periods over the last 17 years, more NPE decisions consistently occur at summary judgment when compared to practicing entities. The gap in summary judgment decisions appears to have narrowed slightly since 2006. As previously noted, because their success rates at summary judgment are much lower than at trial, NPEs tend to experience a lower overall success rate than practicing entities when the total mix of summary judgment and trial decisions are considered.
Patent litigation trends diverge across industries
We mapped each decision to one of 20 industries, based on the nature of the technology embodied by the patent(s) at issue.
Chart 6a reflects the percentage of total identified decisions for the ten most active industry classifications,
which collectively account for 88% of all patent case decisions. As the chart demonstrates, technology associated with the consumer products industry led in terms of the percentage of identified decisions from 1995 through 2011, representing 18% of the total decisions.
14 PwC 2012 Patent Litigation Study
Biotechnology and information technology (computer hardware, software, Internet) cases on the rise
Chart 6b
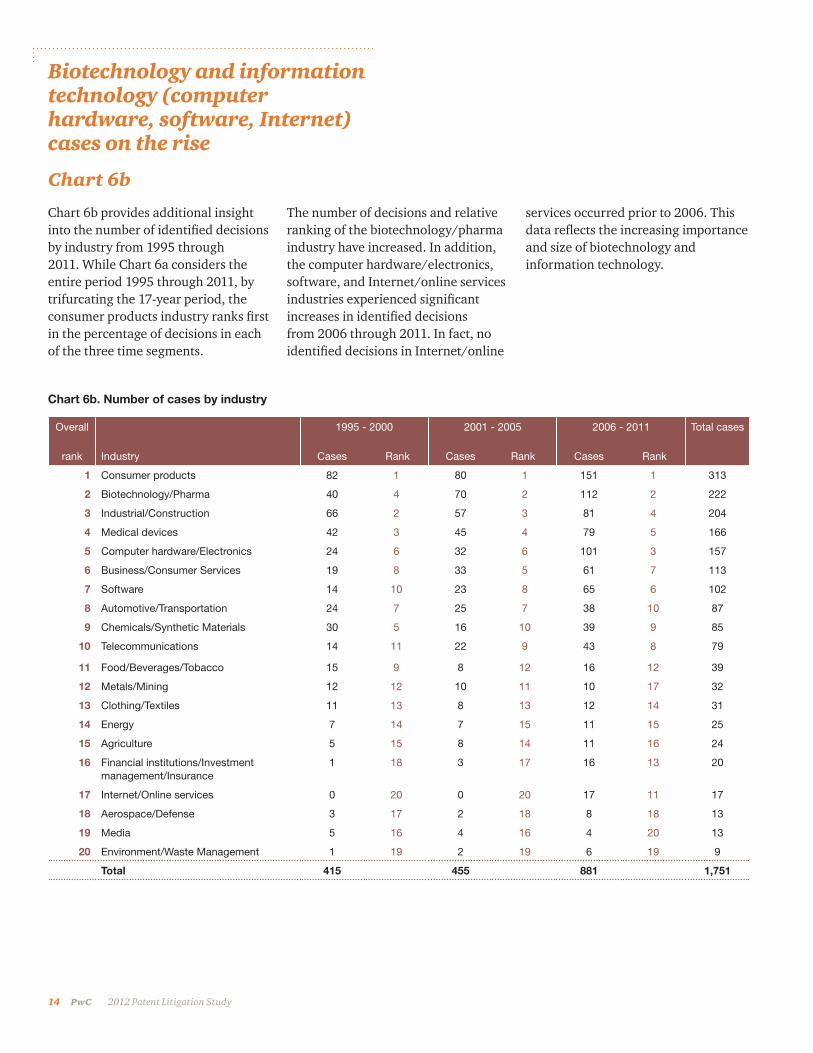
Chart 6b provides additional insight into the number of identified decisions by industry from 1995 through 2011. While Chart 6a considers the entire period 1995 through 2011, by trifurcating the 17-year period, the consumer products industry ranks first in the percentage of decisions in each of the three time segments.
The number of decisions and relative ranking of the biotechnology/pharma industry have increased. In addition, the computer hardware/electronics, software, and Internet/online services industries experienced significant increases in identified decisions from 2006 through 2011. In fact, no identified decisions in Internet/online
services occurred prior to 2006. This data reflects the increasing importance and size of biotechnology and information technology.
Overall
rank Industry
1995 - 2000
Cases Rank
2001 - 2005
Cases Rank
2006 - 2011
Cases Rank
Total cases
1 Consumer products 82 1 80 1 151 1 313
2 Biotechnology/Pharma 40 4 70 2 112 2 222
3 Industrial/Construction 66 2 57 3 81 4 204
4 Medical devices 42 3 45 4 79 5 166
5 Computer hardware/Electronics 24 6 32 6 101 3 157
6 Business/Consumer Services 19 8 33 5 61 7 113
7 Software 14 10 23 8 65 6 102
8 Automotive/Transportation 24 7 25 7 38 10 87
9 Chemicals/Synthetic Materials 30 5 16 10 39 9 85
10 Telecommunications 14 11 22 9 43 8 79
11 Food/Beverages/Tobacco 15 9 8 12 16 12 39
12 Metals/Mining 12 12 10 11 10 17 32
13 Clothing/Textiles 11 13 8 13 12 14 31
14 Energy 7 14 7 15 11 15 25
15 Agriculture 5 15 8 14 11 16 24
16 Financial institutions/Investment management/Insurance
1 18 3 17 16 13 20
17 Internet/Online services 0 20 0 20 17 11 17
18 Aerospace/Defense 3 17 2 18 8 18 13
19 Media 5 16 4 16 4 20 13
20 Environment/Waste Management 1 19 2 19 6 19 9
Total 415 455 881 1,751
Chart 6b. Number of cases by industry
PwC 15 2012 Patent Litigation Study
Median damages largest in tele- communications industry
Chart 6c
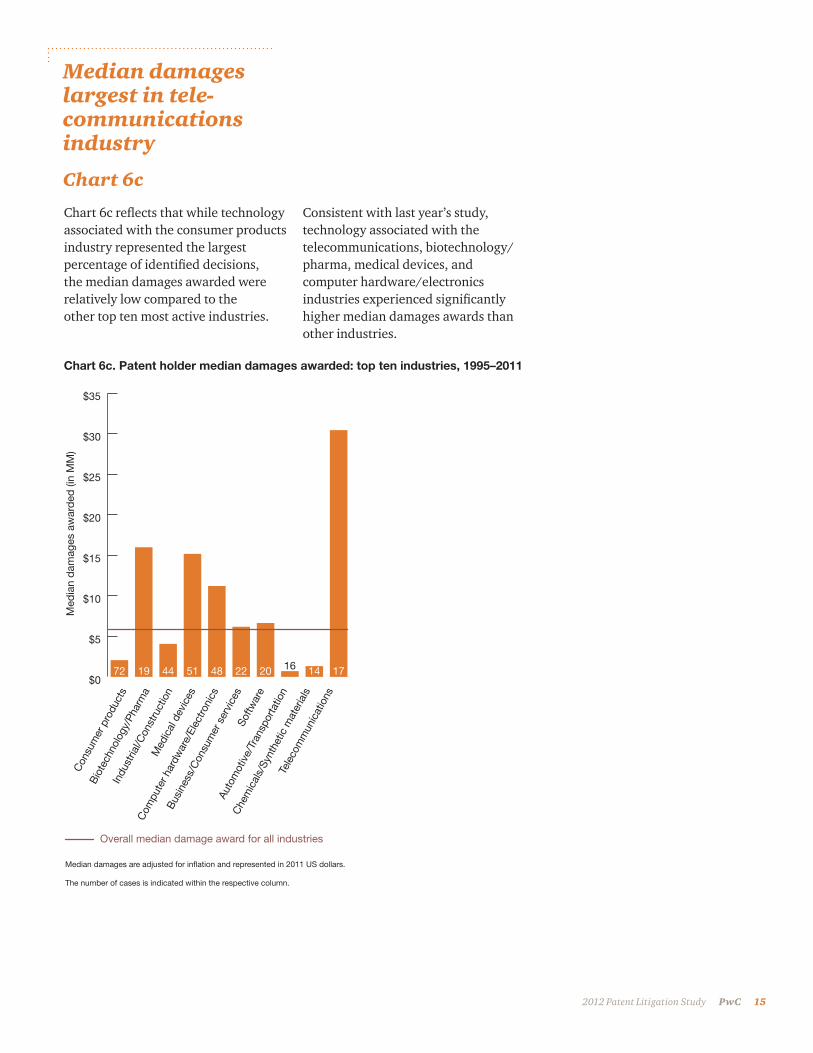
Chart 6c reflects that while technology associated with the consumer products industry represented the largest percentage of identified decisions, the median damages awarded were relatively low compared to the other top ten most active industries.
Chart 6c. Patent holder median damages awarded: top ten industries, 1995–2011
Consistent with last year’s study, technology associated with the telecommunications, biotechnology/pharma, medical devices, and computer hardware/electronics industries experienced significantly higher median damages awards than other industries.
$0
$5
$10
$15
$20
$25
$30
$35
Con
sum
er p
rodu
cts
Bio
tech
nolo
gy/P
harm
a
Indu
stria
l/Con
stru
ctio
nM
edic
al d
evic
es
Com
pute
r har
dwar
e/El
ectro
nics
Bus
ines
s/C
onsu
mer
ser
vice
sSo
ftwar
e
Che
mic
als/
Synt
hetic
mat
eria
ls
Auto
mot
ive/
Tran
spor
tatio
nTe
leco
mm
unic
atio
ns
Median damages are adjusted for inflation and represented in 2011 US dollars.
The number of cases is indicated within the respective column.
72 19 44 51 48 22 20 16 14 17
Med
ian
dam
ages
aw
ard
ed (i
n M
M)
Overall median damage award for all industries
16 PwC 2012 Patent Litigation Study
NPE versus practicing entity damages vary widely by industry
Chart 6d
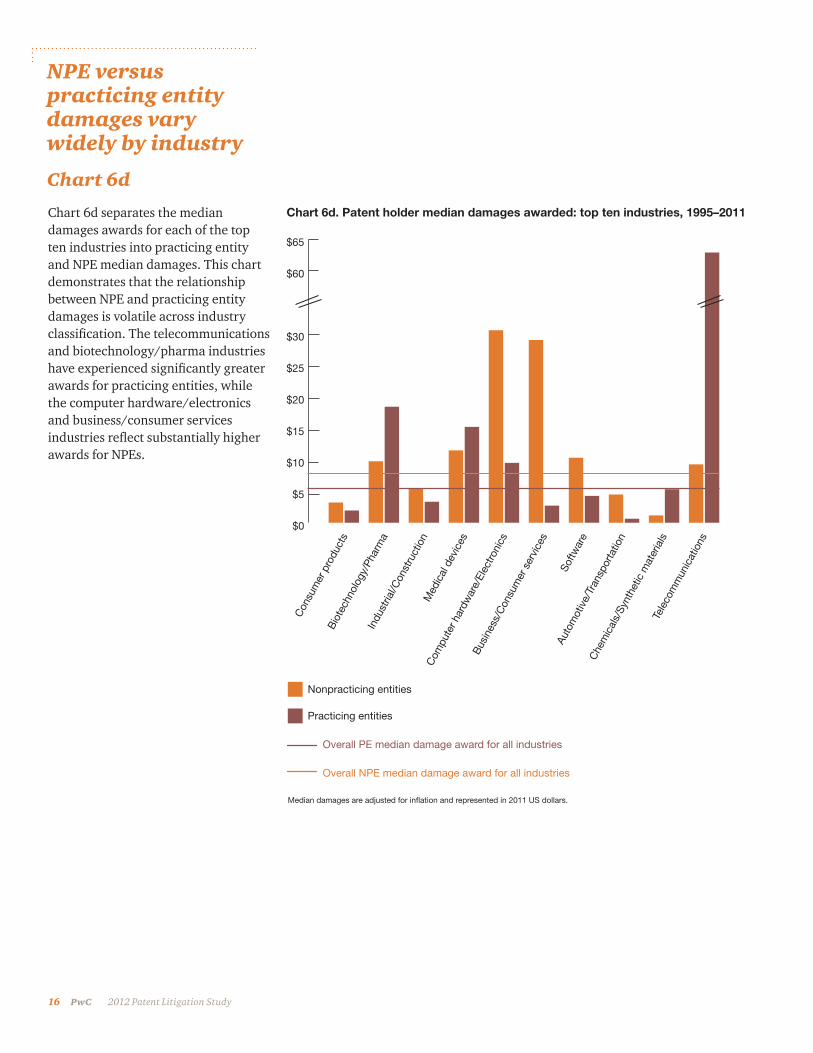
Chart 6d separates the median damages awards for each of the top ten industries into practicing entity and NPE median damages. This chart demonstrates that the relationship between NPE and practicing entity damages is volatile across industry classification. The telecommunications and biotechnology/pharma industries have experienced significantly greater awards for practicing entities, while the computer hardware/electronics and business/consumer services industries reflect substantially higher awards for NPEs.
Chart 6d. Patent holder median damages awarded: top ten industries, 1995–2011
$0
$5
$10
$15
$20
$25
$30
$60
$65
Con
sum
er p
rodu
cts
Bio
tech
nolo
gy/P
harm
aIn
dust
rial/C
onst
ruct
ion
Med
ical
dev
ices
Com
pute
r har
dwar
e/El
ectro
nics
Bus
ines
s/C
onsu
mer
ser
vice
s
Softw
are
Che
mic
als/
Synt
hetic
mat
eria
ls
Auto
mot
ive/
Tran
spor
tatio
n
Tele
com
mun
icat
ions
Nonpracticing entities
Practicing entities
Median damages are adjusted for inflation and represented in 2011 US dollars.
Overall NPE median damage award for all industries
Overall PE median damage award for all industries
PwC 17 2012 Patent Litigation Study
Success rates by industry
Chart 6e
Chart 6e. Patent holder success rate: top ten industries, 1995—2011
0%
5%
10%
15%
20%
25%
30%
35%
40%
Con
sum
er p
rodu
cts
Bio
tech
nolo
gy/P
harm
a
Indu
stria
l/Con
stru
ctio
nM
edic
al d
evic
es
Com
pute
r har
dwar
e/El
ectro
nics
Bus
ines
s/C
onsu
mer
ser
vice
sSo
ftwar
e
Che
mic
als/
Synt
hetic
mat
eria
ls
Auto
mot
ive/
Tran
spor
tatio
nTe
leco
mm
unic
atio
ns
Overall success rate for all industries
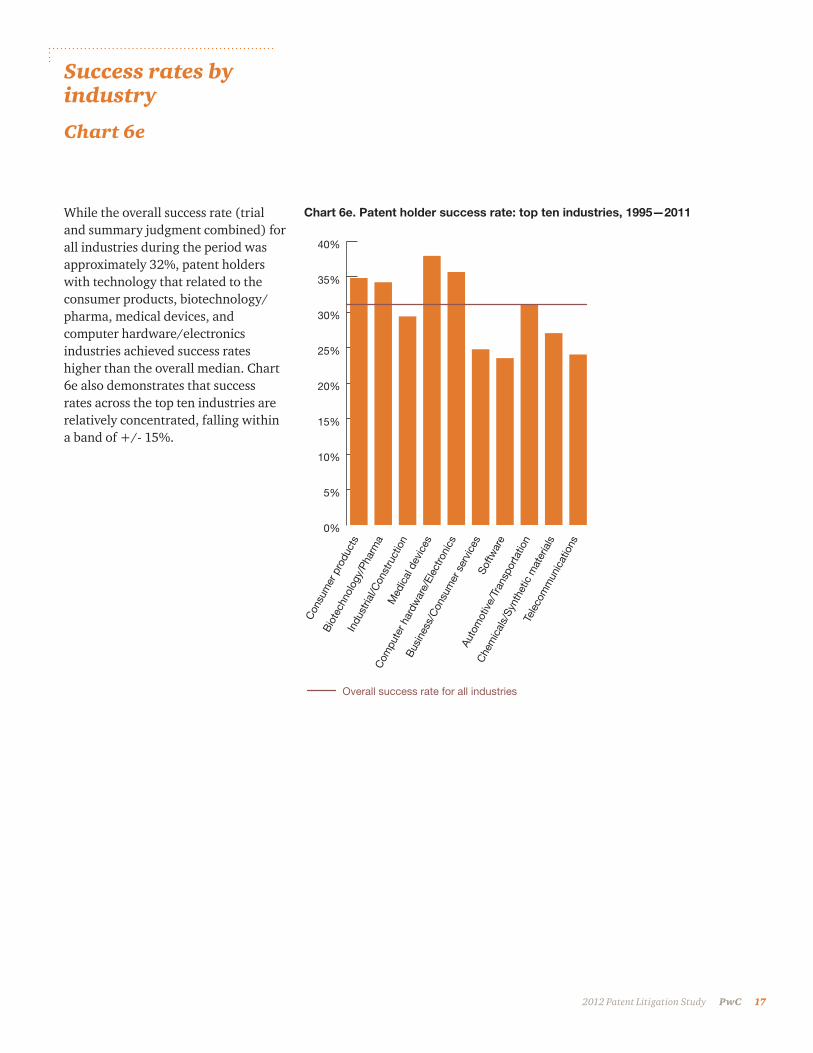
While the overall success rate (trial and summary judgment combined) for all industries during the period was approximately 32%, patent holders with technology that related to the consumer products, biotechnology/pharma, medical devices, and computer hardware/electronics industries achieved success rates higher than the overall median. Chart 6e also demonstrates that success rates across the top ten industries are relatively concentrated, falling within a band of +/- 15%.
18 PwC 2012 Patent Litigation Study
Practicing entity versus NPE success rates by industry
Chart 6f
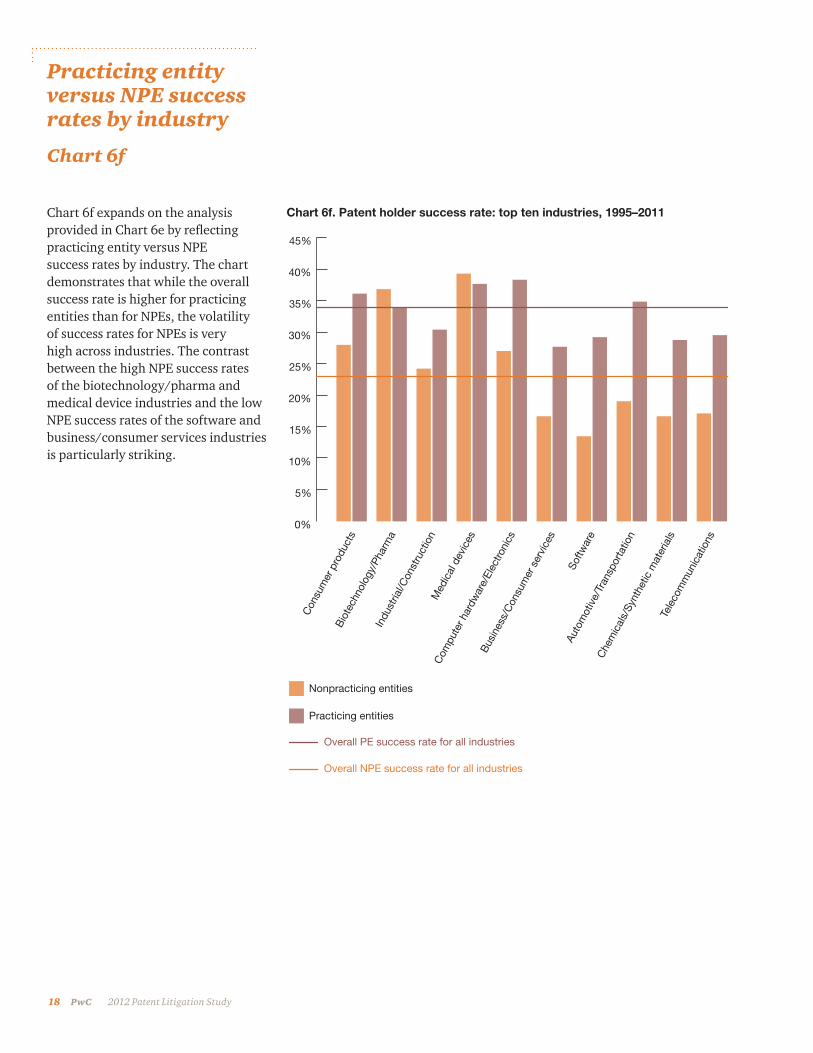
Chart 6f expands on the analysis provided in Chart 6e by reflecting practicing entity versus NPE success rates by industry. The chart demonstrates that while the overall success rate is higher for practicing entities than for NPEs, the volatility of success rates for NPEs is very high across industries. The contrast between the high NPE success rates of the biotechnology/pharma and medical device industries and the low NPE success rates of the software and business/consumer services industries is particularly striking.
0%
5%
10%
15%
20%
25%
30%
35%
40%
45%
Con
sum
er p
rodu
cts
Bio
tech
nolo
gy/P
harm
aIn
dust
rial/C
onst
ruct
ion
Med
ical
dev
ices
Com
pute
r har
dwar
e/El
ectro
nics
Bus
ines
s/C
onsu
mer
ser
vice
s
Softw
are
Che
mic
als/
Synt
hetic
mat
eria
ls
Auto
mot
ive/
Tran
spor
tatio
n
Tele
com
mun
icat
ions
Nonpracticing entities
Practicing entities
Overall NPE success rate for all industries
Overall PE success rate for all industries
Chart 6f. Patent holder success rate: top ten industries, 1995–2011
PwC 19 2012 Patent Litigation Study
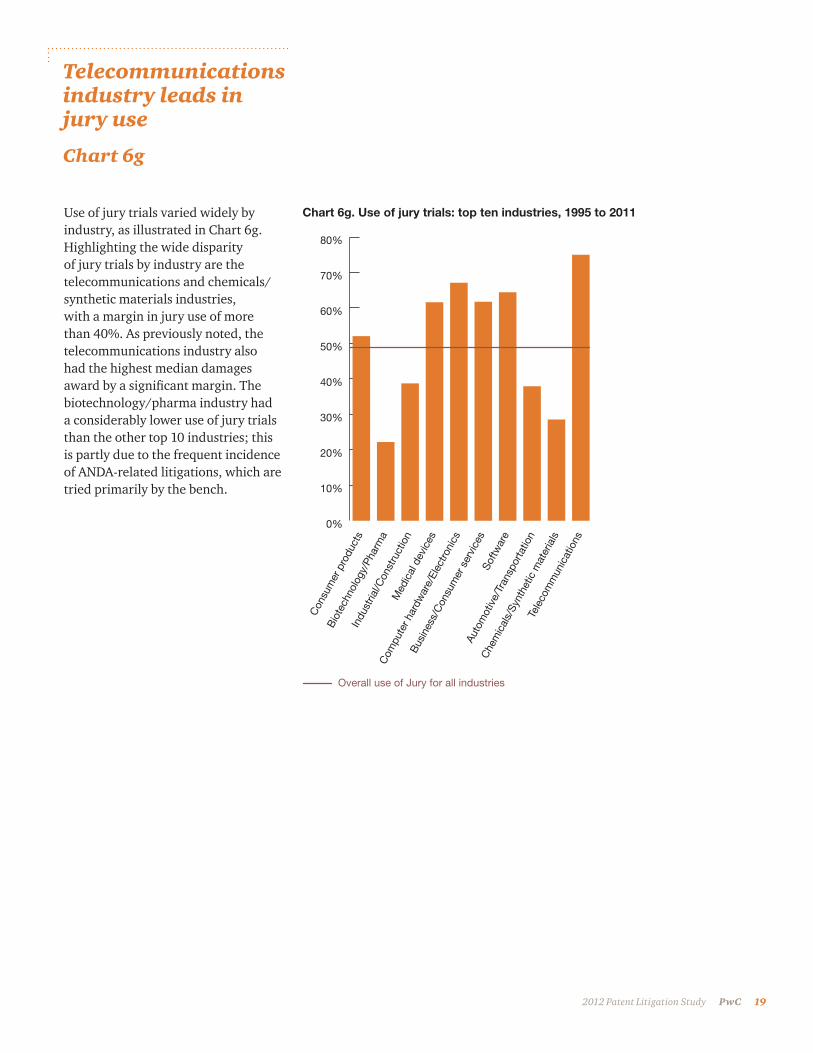
Telecommunications industry leads in jury use
Chart 6g
0%
10%
20%
30%
40%
50%
60%
70%
80%
Con
sum
er p
rodu
cts
Bio
tech
nolo
gy/P
harm
a
Indu
stria
l/Con
stru
ctio
nM
edic
al d
evic
es
Com
pute
r har
dwar
e/El
ectro
nics
Bus
ines
s/C
onsu
mer
ser
vice
sSo
ftwar
e
Che
mic
als/
Synt
hetic
mat
eria
ls
Auto
mot
ive/
Tran
spor
tatio
nTe
leco
mm
unic
atio
ns
Overall use of Jury for all industries
Chart 6g. Use of jury trials: top ten industries, 1995 to 2011Use of jury trials varied widely by industry, as illustrated in Chart 6g. Highlighting the wide disparity of jury trials by industry are the telecommunications and chemicals/synthetic materials industries, with a margin in jury use of more than 40%. As previously noted, the telecommunications industry also had the highest median damages award by a significant margin. The biotechnology/pharma industry had a considerably lower use of jury trials than the other top 10 industries; this is partly due to the frequent incidence of ANDA-related litigations, which are tried primarily by the bench.
20 PwC 2012 Patent Litigation Study
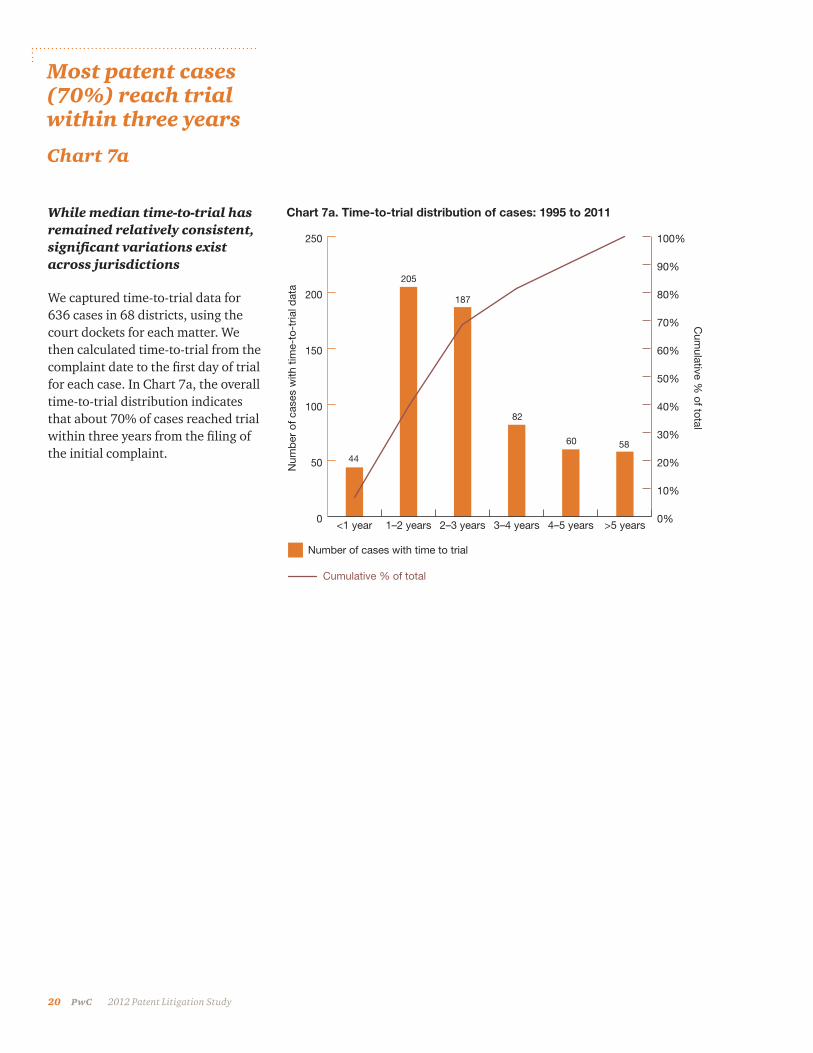
Most patent cases (70%) reach trial within three years
Chart 7a
While median time-to-trial has remained relatively consistent, significant variations exist across jurisdictions
We captured time-to-trial data for 636 cases in 68 districts, using the court dockets for each matter. We then calculated time-to-trial from the complaint date to the first day of trial for each case. In Chart 7a, the overall time-to-trial distribution indicates that about 70% of cases reached trial within three years from the filing of the initial complaint.
0
50
100
150
200
250
<1 year 1–2 years 2–3 years 3–4 years 4–5 years >5 years0%
10%
20%
30%
40%
50%
60%
70%
80%
90%
100%
Num
ber
of c
ases
with
tim
e-to
-tria
l dat
a
Cum
ulative % of total
Number of cases with time to trial
Cumulative % of total
205
187
44
82
60 58
Chart 7a. Time-to-trial distribution of cases: 1995 to 2011
PwC 21 2012 Patent Litigation Study
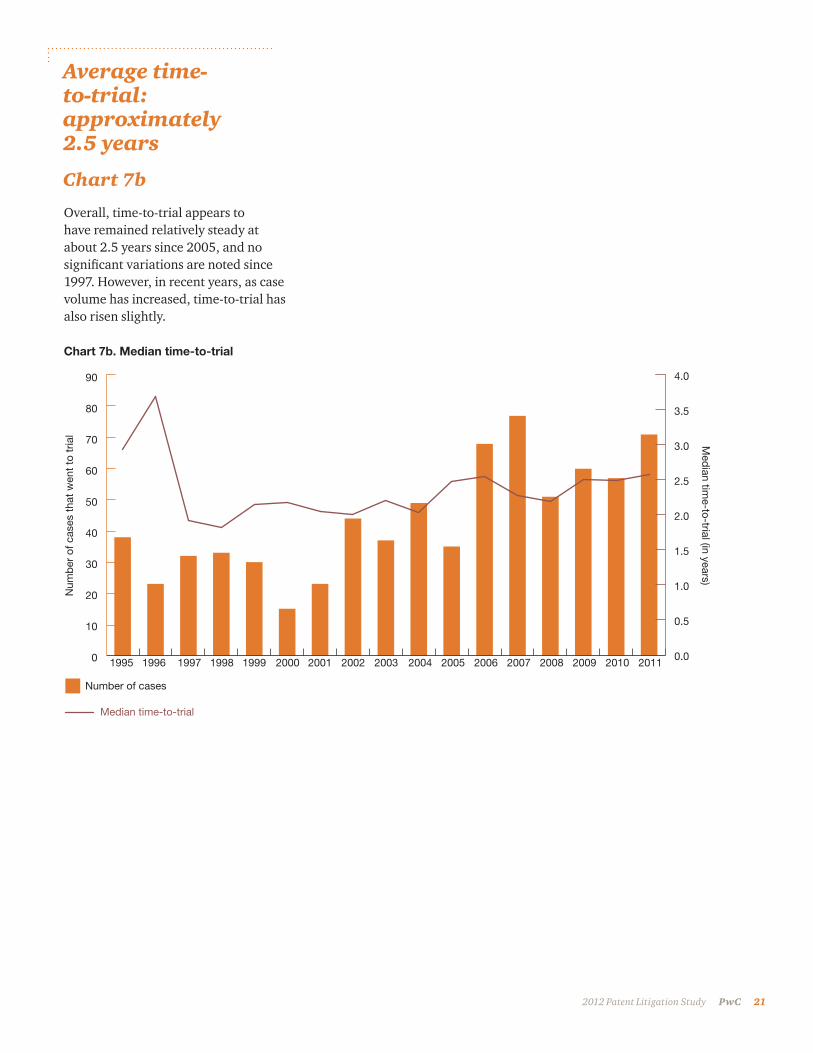
Average time-to-trial: approximately 2.5 years
Chart 7b
Overall, time-to-trial appears to have remained relatively steady at about 2.5 years since 2005, and no significant variations are noted since 1997. However, in recent years, as case volume has increased, time-to-trial has also risen slightly.
Number of cases
Median time-to-trial
0
10
20
30
40
50
60
70
80
90
1995 1996 1997 1998 1999 2000 2001 2002 2003 2004 2005 2006 2007 2008 2009 2010 20110.0
0.5
1.0
1.5
2.0
2.5
3.0
3.5
4.0
Num
ber
of c
ases
tha
t w
ent
to t
rial
Med
ian time-to-trial (in years)
Chart 7b. Median time-to-trial
22 PwC 2012 Patent Litigation Study
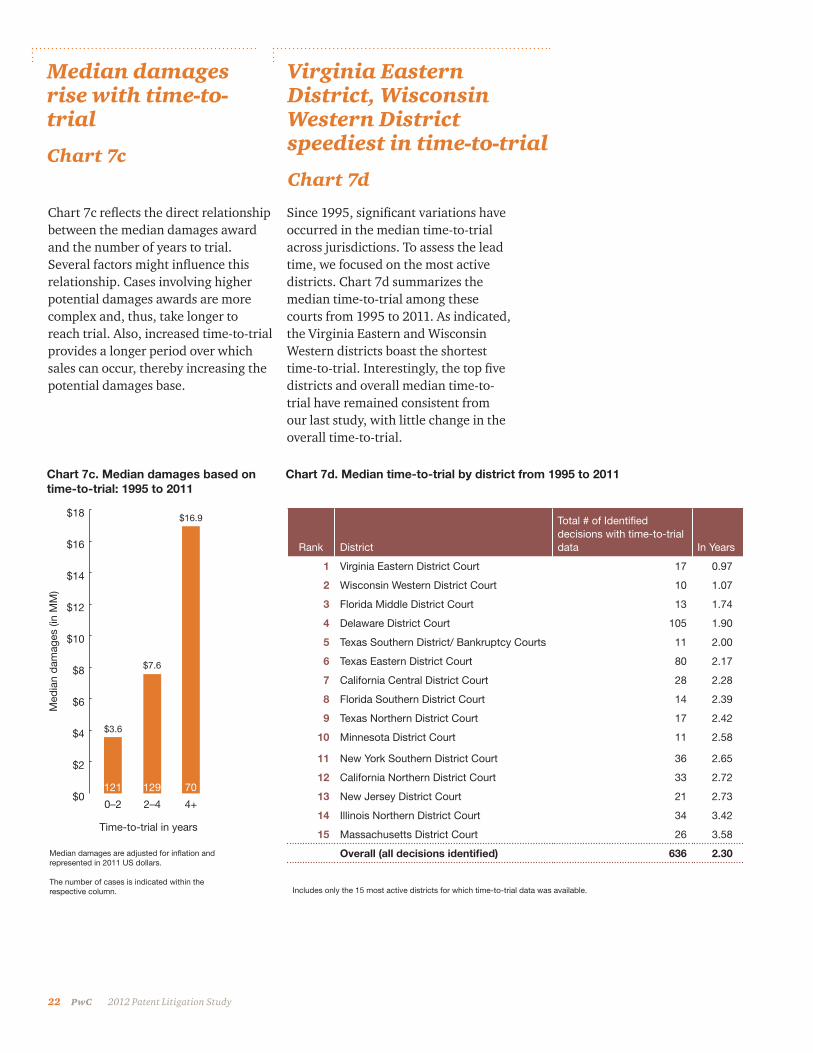
Median damages rise with time-to-trial
Chart 7c
Virginia Eastern District, Wisconsin Western District speediest in time-to-trial
Chart 7d
Chart 7c reflects the direct relationship between the median damages award and the number of years to trial. Several factors might influence this relationship. Cases involving higher potential damages awards are more complex and, thus, take longer to reach trial. Also, increased time-to-trial provides a longer period over which sales can occur, thereby increasing the potential damages base.
Rank District
Total # of Identified decisions with time-to-trial data In Years
1 Virginia Eastern District Court 17 0.97
2 Wisconsin Western District Court 10 1.07
3 Florida Middle District Court 13 1.74
4 Delaware District Court 105 1.90
5 Texas Southern District/ Bankruptcy Courts 11 2.00
6 Texas Eastern District Court 80 2.17
7 California Central District Court 28 2.28
8 Florida Southern District Court 14 2.39
9 Texas Northern District Court 17 2.42
10 Minnesota District Court 11 2.58
11 New York Southern District Court 36 2.65
12 California Northern District Court 33 2.72
13 New Jersey District Court 21 2.73
14 Illinois Northern District Court 34 3.42
15 Massachusetts District Court 26 3.58
Overall (all decisions identified) 636 2.30
Includes only the 15 most active districts for which time-to-trial data was available.
Chart 7c. Median damages based on time-to-trial: 1995 to 2011
Chart 7d. Median time-to-trial by district from 1995 to 2011
$0
$2
$4
$6
$8
$10
$12
$14
$16
$18
129 70121
Median damages are adjusted for inflation and represented in 2011 US dollars.
The number of cases is indicated within the respective column.
Med
ian
dam
ages
(in
MM
)
Time-to-trial in years
0–2 2–4 4+
$3.6
$7.6
$16.9
Since 1995, significant variations have occurred in the median time-to-trial across jurisdictions. To assess the lead time, we focused on the most active districts. Chart 7d summarizes the median time-to-trial among these courts from 1995 to 2011. As indicated, the Virginia Eastern and Wisconsin Western districts boast the shortest time-to-trial. Interestingly, the top five districts and overall median time-to-trial have remained consistent from our last study, with little change in the overall time-to-trial.
PwC 23 2012 Patent Litigation Study
Certain districts are more favorable to patent holders
Chart 8
Chart 8. District Court rankings: 1995 to 2011
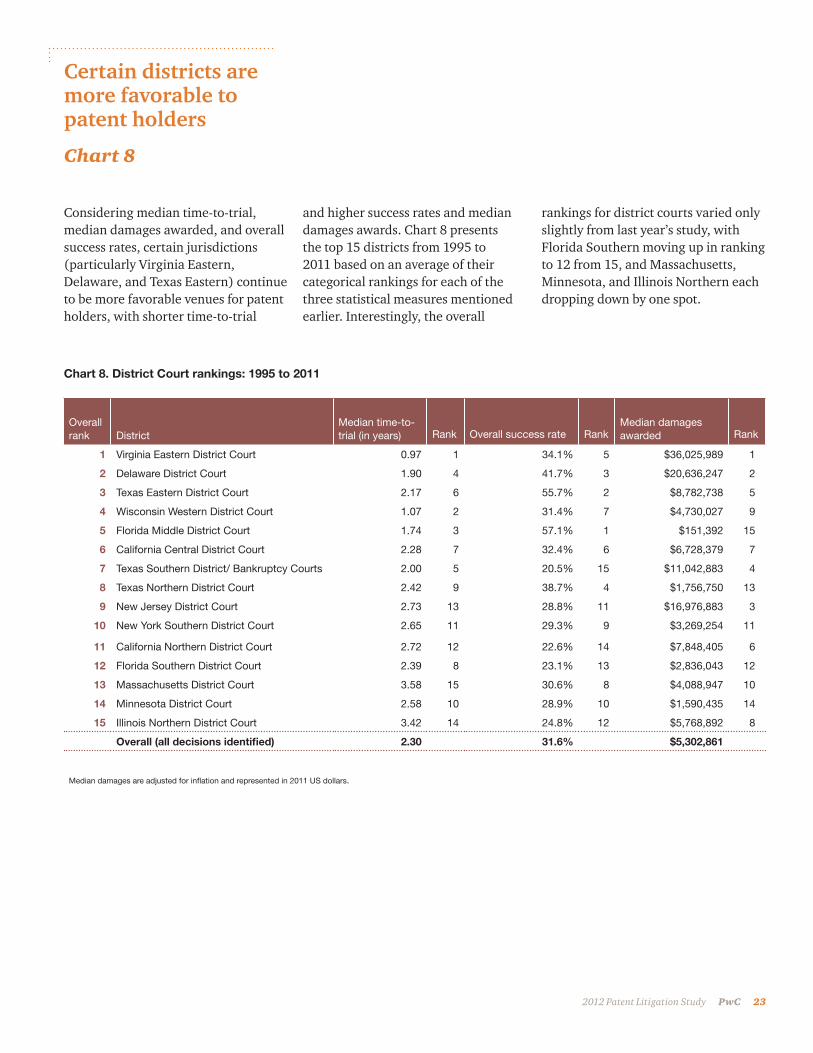
Considering median time-to-trial, median damages awarded, and overall success rates, certain jurisdictions (particularly Virginia Eastern, Delaware, and Texas Eastern) continue to be more favorable venues for patent holders, with shorter time-to-trial
and higher success rates and median damages awards. Chart 8 presents the top 15 districts from 1995 to 2011 based on an average of their categorical rankings for each of the three statistical measures mentioned earlier. Interestingly, the overall
rankings for district courts varied only slightly from last year’s study, with Florida Southern moving up in ranking to 12 from 15, and Massachusetts, Minnesota, and Illinois Northern each dropping down by one spot.
Overall rank District
Median time-to-trial (in years) Rank Overall success rate Rank
Median damages awarded Rank
1 Virginia Eastern District Court 0.97 1 34.1% 5 $36,025,989 1
2 Delaware District Court 1.90 4 41.7% 3 $20,636,247 2
3 Texas Eastern District Court 2.17 6 55.7% 2 $8,782,738 5
4 Wisconsin Western District Court 1.07 2 31.4% 7 $4,730,027 9
5 Florida Middle District Court 1.74 3 57.1% 1 $151,392 15
6 California Central District Court 2.28 7 32.4% 6 $6,728,379 7
7 Texas Southern District/ Bankruptcy Courts 2.00 5 20.5% 15 $11,042,883 4
8 Texas Northern District Court 2.42 9 38.7% 4 $1,756,750 13
9 New Jersey District Court 2.73 13 28.8% 11 $16,976,883 3
10 New York Southern District Court 2.65 11 29.3% 9 $3,269,254 11
11 California Northern District Court 2.72 12 22.6% 14 $7,848,405 6
12 Florida Southern District Court 2.39 8 23.1% 13 $2,836,043 12
13 Massachusetts District Court 3.58 15 30.6% 8 $4,088,947 10
14 Minnesota District Court 2.58 10 28.9% 10 $1,590,435 14
15 Illinois Northern District Court 3.42 14 24.8% 12 $5,768,892 8
Overall (all decisions identified) 2.30 31.6% $5,302,861
Median damages are adjusted for inflation and represented in 2011 US dollars.
24 PwC 2012 Patent Litigation Study
Federal district courts with most NPE cases
Chart 9a
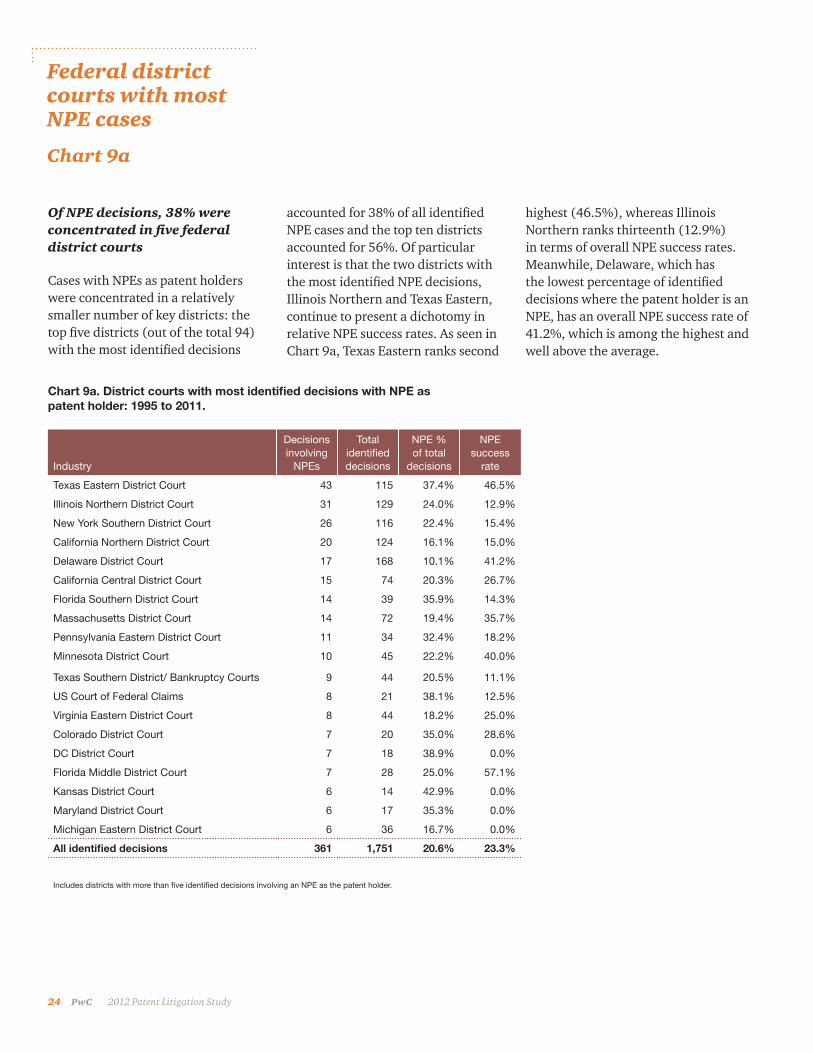
Of NPE decisions, 38% were concentrated in five federal district courts
Cases with NPEs as patent holders were concentrated in a relatively smaller number of key districts: the top five districts (out of the total 94) with the most identified decisions
highest (46.5%), whereas Illinois Northern ranks thirteenth (12.9%) in terms of overall NPE success rates. Meanwhile, Delaware, which has the lowest percentage of identified decisions where the patent holder is an NPE, has an overall NPE success rate of 41.2%, which is among the highest and well above the average.
accounted for 38% of all identified NPE cases and the top ten districts accounted for 56%. Of particular interest is that the two districts with the most identified NPE decisions, Illinois Northern and Texas Eastern, continue to present a dichotomy in relative NPE success rates. As seen in Chart 9a, Texas Eastern ranks second
Industry
Decisions involving
NPEs
Total identified decisions
NPE % of total
decisions
NPE success
rate
Texas Eastern District Court 43 115 37.4% 46.5%
Illinois Northern District Court 31 129 24.0% 12.9%
New York Southern District Court 26 116 22.4% 15.4%
California Northern District Court 20 124 16.1% 15.0%
Delaware District Court 17 168 10.1% 41.2%
California Central District Court 15 74 20.3% 26.7%
Florida Southern District Court 14 39 35.9% 14.3%
Massachusetts District Court 14 72 19.4% 35.7%
Pennsylvania Eastern District Court 11 34 32.4% 18.2%
Minnesota District Court 10 45 22.2% 40.0%
Texas Southern District/ Bankruptcy Courts 9 44 20.5% 11.1%
US Court of Federal Claims 8 21 38.1% 12.5%
Virginia Eastern District Court 8 44 18.2% 25.0%
Colorado District Court 7 20 35.0% 28.6%
DC District Court 7 18 38.9% 0.0%
Florida Middle District Court 7 28 25.0% 57.1%
Kansas District Court 6 14 42.9% 0.0%
Maryland District Court 6 17 35.3% 0.0%
Michigan Eastern District Court 6 36 16.7% 0.0%
All identified decisions 361 1,751 20.6% 23.3%
Includes districts with more than five identified decisions involving an NPE as the patent holder.
Chart 9a. District courts with most identified decisions with NPE as patent holder: 1995 to 2011.
PwC 25 2012 Patent Litigation Study
Practicing entities and NPEs by the numbers
Chart 9b
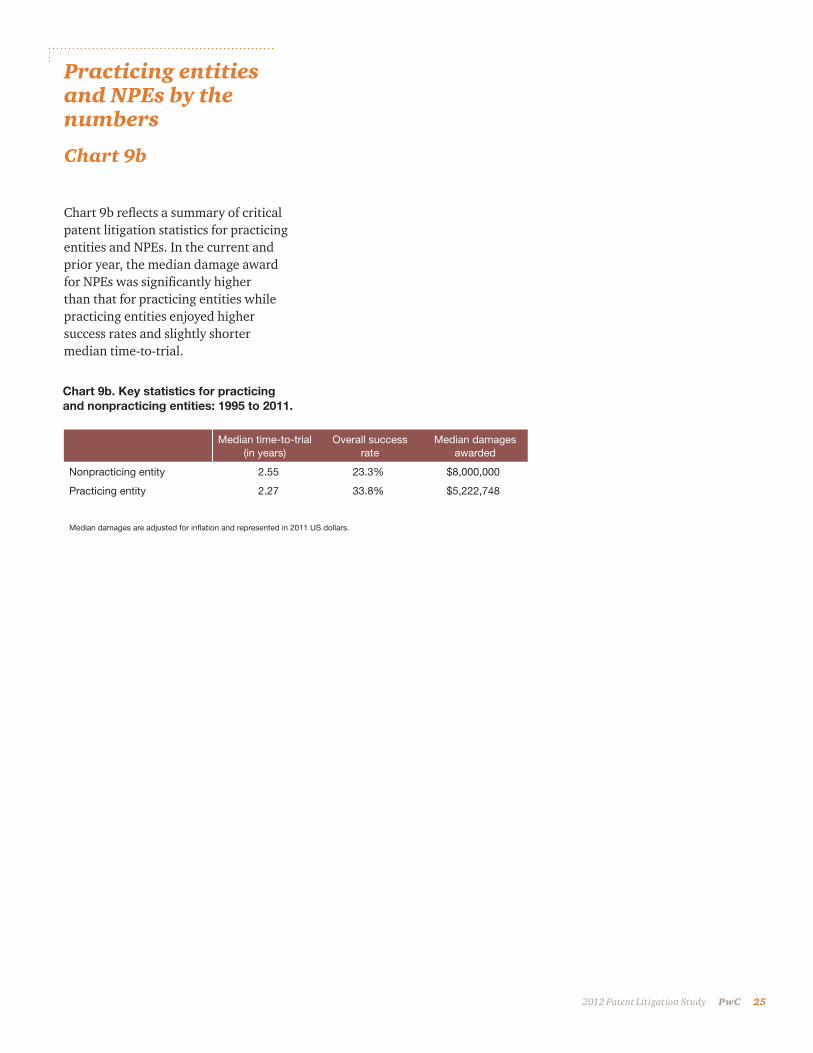
Chart 9b reflects a summary of critical patent litigation statistics for practicing entities and NPEs. In the current and prior year, the median damage award for NPEs was significantly higher than that for practicing entities while practicing entities enjoyed higher success rates and slightly shorter median time-to-trial.
Chart 9b. Key statistics for practicing and nonpracticing entities: 1995 to 2011.
Median time-to-trial (in years)
Overall success rate
Median damages awarded
Nonpracticing entity 2.55 23.3% $8,000,000
Practicing entity 2.27 33.8% $5,222,748
Median damages are adjusted for inflation and represented in 2011 US dollars.
26 PwC 2012 Patent Litigation Study
$0
$2
$4
$6
$8
$10
$12
Med
ian
dam
ages
aw
ard
ed (i
n M
M)
Com
pany
Uni
vers
ity &
non
-pro
fit
Indi
vidu
al
Median damages are adjusted for inflation and represented in 2011 US dollars.
The number of cases is indicated within the respective column.
29743
$10.9
$1.5
$3.2
NPEs see variety in median damages and success rates
Chart 10a
Individual NPEs experience lower success rates
Chart 10b
Median damages awards and success rates vary significantly among NPEs
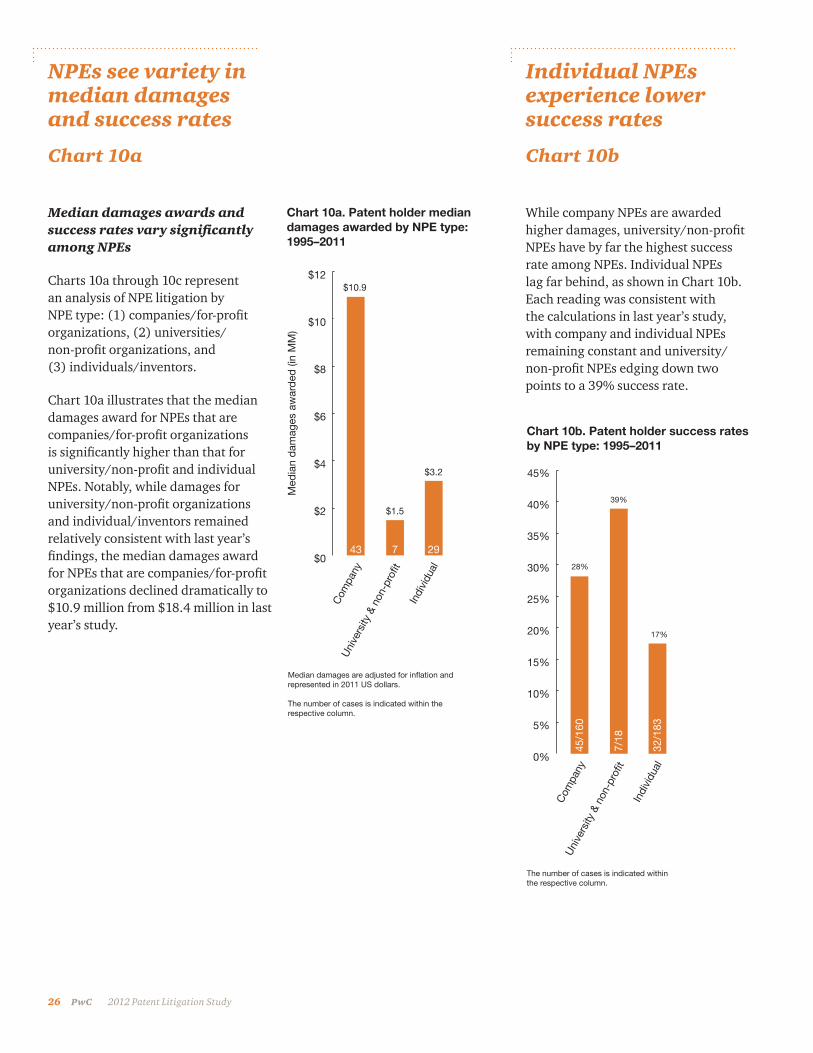
Charts 10a through 10c represent an analysis of NPE litigation by NPE type: (1) companies/for-profit organizations, (2) universities/ non-profit organizations, and (3) individuals/inventors.
Chart 10a illustrates that the median damages award for NPEs that are companies/for-profit organizations is significantly higher than that for university/non-profit and individual NPEs. Notably, while damages for university/non-profit organizations and individual/inventors remained relatively consistent with last year’s findings, the median damages award for NPEs that are companies/for-profit organizations declined dramatically to $10.9 million from $18.4 million in last year’s study.
0%
5%
10%
15%
20%
25%
30%
35%
40%
45%
32/1
83
7/18
45/1
60
Com
pany
Uni
vers
ity &
non
-pro
fit
Indi
vidu
al
The number of cases is indicated within the respective column.
28%
39%
17%
While company NPEs are awarded higher damages, university/non-profit NPEs have by far the highest success rate among NPEs. Individual NPEs lag far behind, as shown in Chart 10b. Each reading was consistent with the calculations in last year’s study, with company and individual NPEs remaining constant and university/non-profit NPEs edging down two points to a 39% success rate.
Chart 10a. Patent holder median damages awarded by NPE type: 1995–2011
Chart 10b. Patent holder success rates by NPE type: 1995–2011
PwC 27 2012 Patent Litigation Study
Vast majority of NPE litigation involves company and individual NPEs
Chart 10c
ANDA litigation trends upward
Chart 11a
0
10
20
30
40
50
60
70
80
1995-2000 2001-2005 2006-2011N
umb
er o
f cas
es
16
37
70
0%
10%
20%
30%
40%
50%
60%
The number of cases is indicated within the respective column.
18318160
Per
cent
of c
ases
Com
pany
Uni
vers
ity &
non
-pro
fit
Indi
vidu
al
44%
5%
51%
Chart 11a. ANDA cases
Chart 10c. Distribution of cases by NPE type: 1995-2011
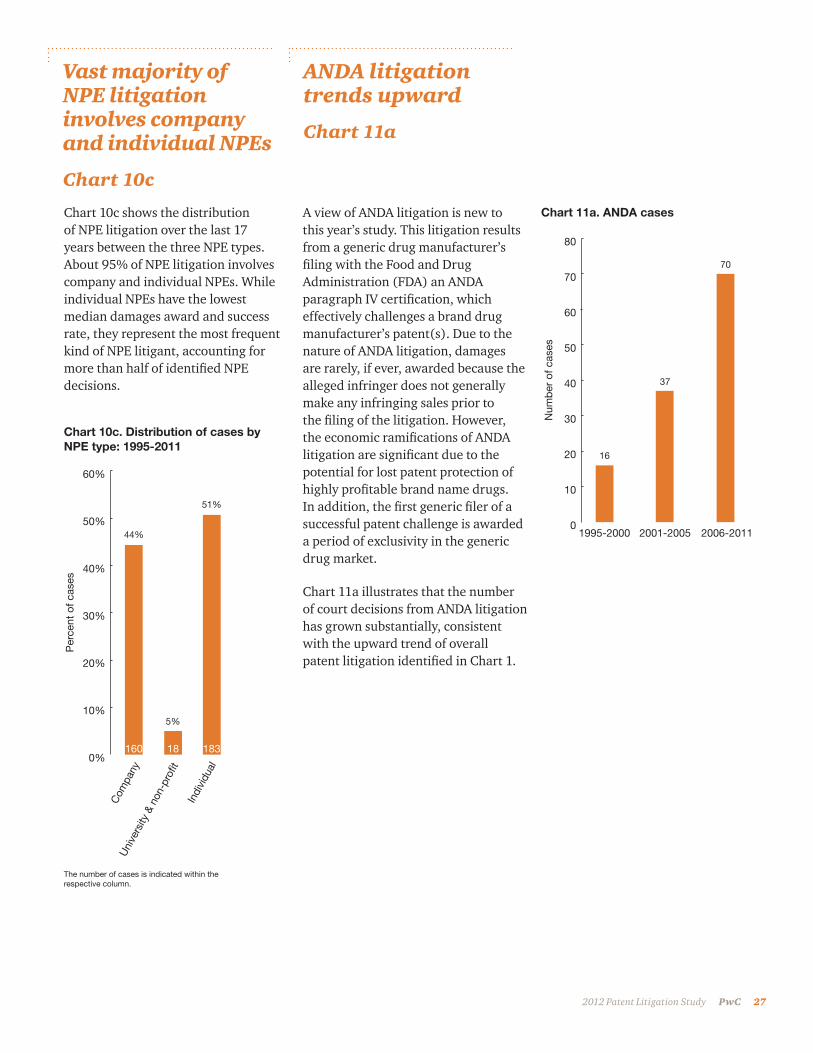
Chart 10c shows the distribution of NPE litigation over the last 17 years between the three NPE types. About 95% of NPE litigation involves company and individual NPEs. While individual NPEs have the lowest median damages award and success rate, they represent the most frequent kind of NPE litigant, accounting for more than half of identified NPE decisions.
A view of ANDA litigation is new to this year’s study. This litigation results from a generic drug manufacturer’s filing with the Food and Drug Administration (FDA) an ANDA paragraph IV certification, which effectively challenges a brand drug manufacturer’s patent(s). Due to the nature of ANDA litigation, damages are rarely, if ever, awarded because the alleged infringer does not generally make any infringing sales prior to the filing of the litigation. However, the economic ramifications of ANDA litigation are significant due to the potential for lost patent protection of highly profitable brand name drugs. In addition, the first generic filer of a successful patent challenge is awarded a period of exclusivity in the generic drug market.
Chart 11a illustrates that the number of court decisions from ANDA litigation has grown substantially, consistent with the upward trend of overall patent litigation identified in Chart 1.
28 PwC 2012 Patent Litigation Study
New Jersey and Delaware are favored ANDA districts
Chart 11b
Historical ANDA success rates have varied significantly
Chart 11c
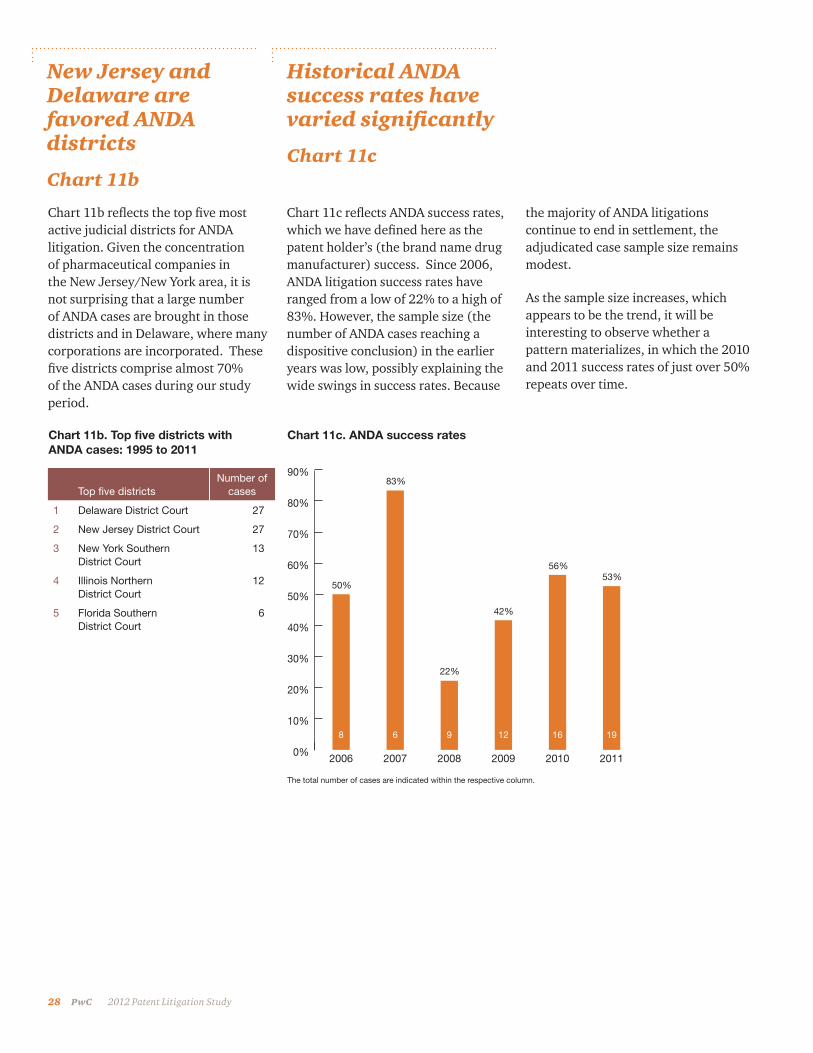
Chart 11b reflects the top five most active judicial districts for ANDA litigation. Given the concentration of pharmaceutical companies in the New Jersey/New York area, it is not surprising that a large number of ANDA cases are brought in those districts and in Delaware, where many corporations are incorporated. These five districts comprise almost 70% of the ANDA cases during our study period.
Top five districtsNumber of
cases
1 Delaware District Court 27
2 New Jersey District Court 27
3 New York Southern District Court
13
4 Illinois Northern District Court
12
5 Florida Southern District Court
6
Chart 11c reflects ANDA success rates, which we have defined here as the patent holder’s (the brand name drug manufacturer) success. Since 2006, ANDA litigation success rates have ranged from a low of 22% to a high of 83%. However, the sample size (the number of ANDA cases reaching a dispositive conclusion) in the earlier years was low, possibly explaining the wide swings in success rates. Because
Chart 11b. Top five districts with ANDA cases: 1995 to 2011
Chart 11c. ANDA success rates
the majority of ANDA litigations continue to end in settlement, the adjudicated case sample size remains modest.
As the sample size increases, which appears to be the trend, it will be interesting to observe whether a pattern materializes, in which the 2010 and 2011 success rates of just over 50% repeats over time.
0%
10%
20%
30%
40%
50%
60%
70%
80%
90%
2006 2007 2008 2009 2010 2011
The total number of cases are indicated within the respective column.
83%
22%
50%
42%
56%53%
8 6 9 12 16 19
PwC 29 2012 Patent Litigation Study
Top ANDA litigants
Chart 11d and 11e
Chart 11d: Top five ANDA Defendants: 1995 to 2011
Chart 11e: Top five ANDA Plaintiffs: 1995 to 2011
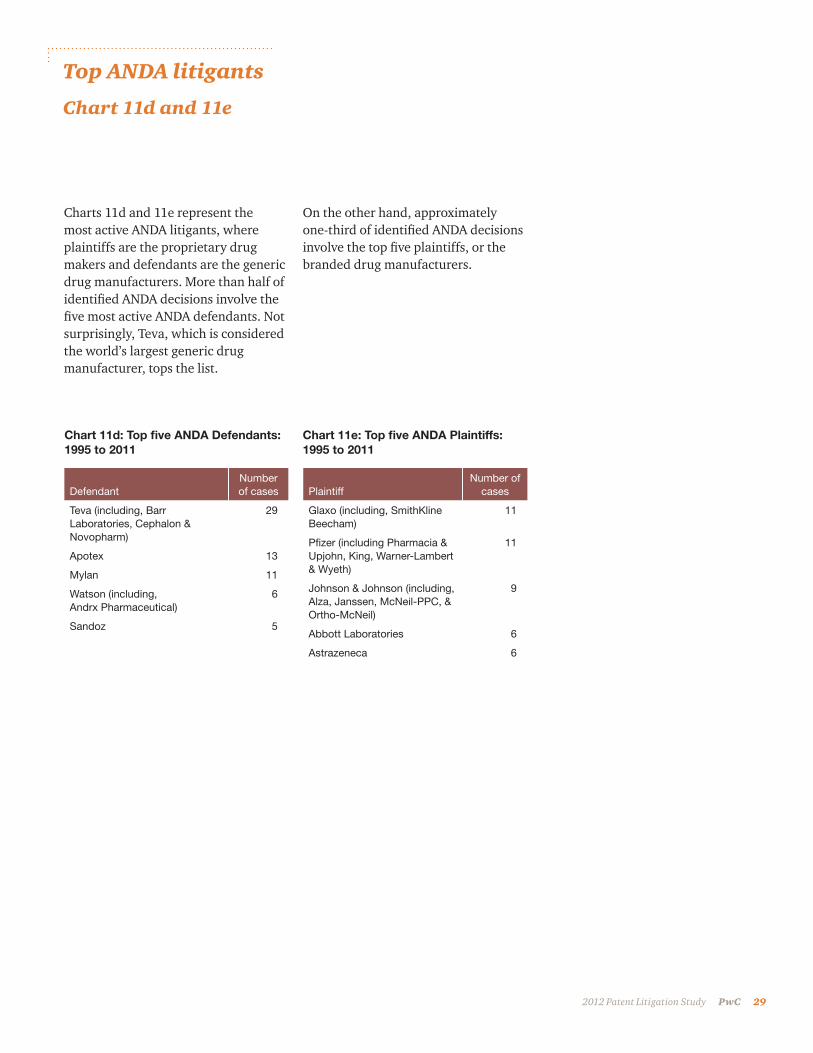
Charts 11d and 11e represent the most active ANDA litigants, where plaintiffs are the proprietary drug makers and defendants are the generic drug manufacturers. More than half of identified ANDA decisions involve the five most active ANDA defendants. Not surprisingly, Teva, which is considered the world’s largest generic drug manufacturer, tops the list.
DefendantNumber of cases
Teva (including, Barr Laboratories, Cephalon & Novopharm)
29
Apotex 13
Mylan 11
Watson (including, Andrx Pharmaceutical)
6
Sandoz 5
PlaintiffNumber of
cases
Glaxo (including, SmithKline Beecham)
11
Pfizer (including Pharmacia & Upjohn, King, Warner-Lambert & Wyeth)
11
Johnson & Johnson (including, Alza, Janssen, McNeil-PPC, & Ortho-McNeil)
9
Abbott Laboratories 6
Astrazeneca 6
On the other hand, approximately one-third of identified ANDA decisions involve the top five plaintiffs, or the branded drug manufacturers.
30 PwC 2012 Patent Litigation Study
Our methodology
To study the trends related to patent decisions, PwC identified final decisions at summary judgment and trial recorded in two WestLaw databases, Federal Intellectual Property – District Court Cases (FIP-DCT) and Combined Jury Verdicts and Settlements (JV-ALL), as well as in corresponding Public Access to Court Electronic Records (PACER) system records.
The study focuses on 1,751 district court patent decisions issued from 1995 to 2011. Definitions for critical terms used throughout the study are listed here.
Cases decided at summary judgment include those district court patent infringement cases where a judge has issued a dispositive opinion regarding invalidity and/or infringement.
Cases decided at trial include those district court patent infringement cases where an opinion was rendered by a judge or jury at trial.
Term definitions
A success includes instances where a liability and damages/permanent injunction (if included) decision was made in favor of the patent holder.
Time-to-trial is calculated from the complaint date to the first day of either the bench or jury trial for each case.
A nonpracticing entity (NPE) is defined as an entity that does not have the capability to design, manufacture, or distribute products with features protected by the patent.
PwC 31 2012 Patent Litigation Study
Our authors
Chris Barry has a 28-year track record in PwC’s Forensic Services practice. Mr. Barry has worked extensively in the intellectual property field, including damage quantification and testimony in infringement actions, determining reasonable royalty rates, valuing IP for transaction and financial reporting purposes, and performing royalty audits for licensors with running rate agreements. Mr. Barry has testified at trial over 50 times as an expert witness. Mr. Barry is a CPA holding the AICPA credential of Certified in Financial Forensics. He earned a BA in accounting from Franklin & Marshall College and an MBA from the University of California at Berkeley.
Ronen Arad is a Director in PwC’s Forensic Services practice in the firm’s Atlanta office. He has been involved in many aspects of economic damages analysis in intellectual property disputes, including providing expert witness services, preparing damages assessments, and analyzing opposing expert claims. Mr. Arad has also assisted with various financial consulting engagements, including licensing examinations of reported royalties, business valuations, and return on investment analyses. Mr. Arad is a Chartered Financial Analyst (CFA) charter-holder and holds a BS degree in Commerce with concentrations in Finance and Accounting from the University of Virginia.
Alex Johnston is a Director with PwC’s Atlanta office. He has been involved in many aspects of economic damages analysis in commercial disputes. His experience includes providing discovery assistance, developing financial models, preparing financial analysis, analyzing opposing expert damage claims, and providing expert testimony in federal court through deposition and trial. Mr. Johnston received his BA degree in Economics from Rollins College and holds an MBA and JD from the University of Florida.
Alison Parent is a Boston-based Manager in PwC’s Forensic Services practice. Her experience includes quantifying damages/claims in disputes involving intellectual property, lost profits, business valuations, purchase price disputes, and breach of contract issues across a wide range of industries. She also has experience in developing financial models in connection with assessing damages and valuation calculations. Ms. Parent, a CPA, holds a BS in Accounting from the University of Massachusetts-Dartmouth.
Landan Ansell is a Senior Associate in PwC’s Forensic Services practice in Atlanta. He specializes in financial analysis and modeling and focuses on the valuation of economic damages for commercial disputes. Mr. Ansell earned a BBA with a concentration in Accounting from Emory University and is a CPA.
Mike Arnold is a Boston-based Senior Associate in PwC’s Forensic Services practice. He focuses on dispute analysis in commercial litigation, including performing IP valuation and damage quantification services in patent matters. He holds a degree in Accounting from Oregon State University and is a CPA and a Certified Licensing Professional.
Additionally, the following individuals contributed significantly to this study: Evan Clark, Amanda Brameister, Amber Yang, Davida Jones, Fareed Yousif, Grace Hwang, Heather Fugate, HyeYun Lee, Jenaye Haddad, Jennifer Beaudoin, Meena Chockalingam, Michelle Davis, Pichon Duplan, Severin Ritchie, and Sonia Mehta.
32 PwC 2012 Patent Litigation Study
Contacts
Chris Barry Partner (617) 530-6304 [email protected]
Kris Swanson Partner (312) 298-6195 [email protected]
Karyl Van Tassel Partner (713) 356-4242 [email protected]
Al Vondra Partner (703) 918-1534 [email protected]
Owen Murray Partner (213) 356-6097 [email protected]
Ronen Arad Director (678) 419-7309 [email protected]

.

www.pwc.com
© 2012 PricewaterhouseCoopers LLP, a Delaware limited liability partnership. All rights reserved. PwC refers to the US member firm, and may sometimes refer to the PwC network. Each member firm is a separate legal entity. Please see www.pwc.com/structure for further details.
This content is for general information purposes only, and should not be used as a substitute for consultation with professional advisors. PwC US helps organizations and individuals create the value they’re looking for. We’re a member of the PwC network of firms with 169,000 people in more than 158 countries. We’re committed to delivering quality in assurance, tax and advisory services. Tell us what matters to you and find out more by visiting us at www.pwc.com/us.
NY-13-0033