Embed Size (px)
DESCRIPTION
2012 Local Market Reports
Citation preview

2011 2012 + / – 2011 2012 + / –
New Listings 3 4 + 33.3% 7 8 + 14.3%
Closed Sales 1 3 + 200.0% 3 4 + 33.3%
Median Sales Price* $28,900 $56,800 + 96.5% $28,900 $65,900 + 128.0%
Percent of Original List Price Received* 100.0% 80.8% - 19.2% 69.7% 79.4% + 13.8%
Days on Market Until Sale 31 137 + 341.9% 325 151 - 53.5%
Inventory of Homes for Sale 26 37 + 42.3% -- -- --
2011 2012 + / – 2011 2012 + / –
New Listings 0 0 -- 0 0 --
Closed Sales 0 0 -- 0 0 --
Median Sales Price* $0 $0 -- $0 $0 --
Percent of Original List Price Received* 0.0% 0.0% -- 0.0% 0.0% --
Days on Market Until Sale 3 3 0.0% -- -- --
Inventory of Homes for Sale 0.0 3.0 -- -- -- --
A RESEARCH TOOL PROVIDED BY THE COASTAL CAROLINAS ASSOCIATION OF REALTORS®
Local Market Update – February 2012
Andrews Change inClosed SalesAll Properties
Change in Inventory of Homes
All Properties
February Year to DateSingle-Family Properties
+ 33.3% + 200.0% + 53.8%Change in
New ListingsAll Properties
Condo PropertiesFebruary Year to Date
y* Does not account for seller concessions. | Activity for one month can sometimes look extreme due to small sample size.
** Each dot represents the change in median sales price from the prior year using a 6-month weighted average. This means that each of the 6 months used in a dot are proportionedaccording to their share of sales during that period. | All data from the Coastal Carolinas Association of REALTORS®. | Sponsored by South Carolina REALTORS®.
Powered by 10K Research and Marketing. | Information deemed reliable but not guaranteed. Consult your agent for market specifics.
Change in Median Sales Price from Prior Year (6-Month Average)**
All MLSAndrewsAndrews
All MLS
- 60%
- 40%
- 20%
0%
+ 20%
+ 40%
+ 60%
+ 80%
1-2008 1-2009 1-2010 1-2011 1-2012
Single-Family Properties
- 25%
- 20%
- 15%
- 10%
- 5%
0%
1-2008 1-2009 1-2010 1-2011 1-2012
Condo Propertiesb
a

2011 2012 + / – 2011 2012 + / –
New Listings 5 6 + 20.0% 7 11 + 57.1%
Closed Sales 2 2 0.0% 3 4 + 33.3%
Median Sales Price* $140,000 $94,000 - 32.9% $123,000 $121,000 - 1.6%
Percent of Original List Price Received* 89.0% 94.8% + 6.5% 91.6% 96.4% + 5.2%
Days on Market Until Sale 128 175 + 36.3% 118 161 + 37.0%
Inventory of Homes for Sale 29 26 - 10.3% -- -- --
2011 2012 + / – 2011 2012 + / –
New Listings 0 0 -- 0 0 --
Closed Sales 0 0 -- 0 0 --
Median Sales Price* $0 $0 -- $0 $0 --
Percent of Original List Price Received* 0.0% 0.0% -- 0.0% 0.0% --
Days on Market Until Sale 0 0 -- -- -- --
Inventory of Homes for Sale 0.0 0.0 -- -- -- --
A RESEARCH TOOL PROVIDED BY THE COASTAL CAROLINAS ASSOCIATION OF REALTORS®
Local Market Update – February 2012
Aynor Change inClosed SalesAll Properties
Change in Inventory of Homes
All Properties
February Year to DateSingle-Family Properties
+ 20.0% 0.0% - 10.3%Change in
New ListingsAll Properties
Condo PropertiesFebruary Year to Date
y* Does not account for seller concessions. | Activity for one month can sometimes look extreme due to small sample size.
** Each dot represents the change in median sales price from the prior year using a 6-month weighted average. This means that each of the 6 months used in a dot are proportionedaccording to their share of sales during that period. | All data from the Coastal Carolinas Association of REALTORS®. | Sponsored by South Carolina REALTORS®.
Powered by 10K Research and Marketing. | Information deemed reliable but not guaranteed. Consult your agent for market specifics.
Change in Median Sales Price from Prior Year (6-Month Average)**
All MLSAynorAynor
All MLS
- 40%
- 30%
- 20%
- 10%
0%
+ 10%
+ 20%
+ 30%
+ 40%
1-2008 1-2009 1-2010 1-2011 1-2012
Single-Family Properties
- 25%
- 20%
- 15%
- 10%
- 5%
0%
1-2008 1-2009 1-2010 1-2011 1-2012
Condo Propertiesb
a

2011 2012 + / – 2011 2012 + / –
New Listings 68 78 + 14.7% 148 135 - 8.8%
Closed Sales 35 18 - 48.6% 70 40 - 42.9%
Median Sales Price* $160,880 $169,900 + 5.6% $155,000 $143,500 - 7.4%
Percent of Original List Price Received* 96.2% 98.3% + 2.1% 96.1% 97.6% + 1.6%
Days on Market Until Sale 141 180 + 27.5% 171 162 - 5.2%
Inventory of Homes for Sale 424 338 - 20.3% -- -- --
2011 2012 + / – 2011 2012 + / –
New Listings 38 18 - 52.6% 55 50 - 9.1%
Closed Sales 8 8 0.0% 18 14 - 22.2%
Median Sales Price* $57,500 $86,500 + 50.4% $70,000 $79,450 + 13.5%
Percent of Original List Price Received* 86.9% 93.2% + 7.2% 89.4% 94.0% + 5.1%
Days on Market Until Sale 183 129 - 29.5% -- -- --
Inventory of Homes for Sale 15.1 8.2 - 45.6% -- -- --
A RESEARCH TOOL PROVIDED BY THE COASTAL CAROLINAS ASSOCIATION OF REALTORS®
Local Market Update – February 2012
Carolina Forest Change inClosed SalesAll Properties
Change in Inventory of Homes
All Properties
February Year to DateSingle-Family Properties
- 9.4% - 39.5% - 21.2%Change in
New ListingsAll Properties
Condo PropertiesFebruary Year to Date
y* Does not account for seller concessions. | Activity for one month can sometimes look extreme due to small sample size.
** Each dot represents the change in median sales price from the prior year using a 6-month weighted average. This means that each of the 6 months used in a dot are proportionedaccording to their share of sales during that period. | All data from the Coastal Carolinas Association of REALTORS®. | Sponsored by South Carolina REALTORS®.
Powered by 10K Research and Marketing. | Information deemed reliable but not guaranteed. Consult your agent for market specifics.
Change in Median Sales Price from Prior Year (6-Month Average)**
All MLSCarolina ForestCarolina Forest
All MLS
- 25%
- 20%
- 15%
- 10%
- 5%
0%
+ 5%
+ 10%
1-2008 1-2009 1-2010 1-2011 1-2012
Single-Family Properties
- 35%
- 30%
- 25%
- 20%
- 15%
- 10%
- 5%
0%
+ 5%
+ 10%
1-2008 1-2009 1-2010 1-2011 1-2012
Condo Propertiesb
a
2011 2012 + / – 2011 2012 + / –
New Listings 143 85 - 40.6% 269 185 - 31.2%
Closed Sales 38 35 - 7.9% 80 76 - 5.0%
Median Sales Price* $132,500 $124,900 - 5.7% $130,000 $126,550 - 2.7%
Percent of Original List Price Received* 95.6% 95.9% + 0.4% 94.0% 96.6% + 2.7%
Days on Market Until Sale 135 142 + 5.2% 179 169 - 5.9%
Inventory of Homes for Sale 751 598 - 20.4% -- -- --
2011 2012 + / – 2011 2012 + / –
New Listings 8 10 + 25.0% 19 25 + 31.6%
Closed Sales 2 1 - 50.0% 8 6 - 25.0%
Median Sales Price* $57,750 $116,500 + 101.7% $85,000 $61,000 - 28.2%
Percent of Original List Price Received* 90.3% 92.5% + 2.5% 88.5% 91.7% + 3.7%
Days on Market Until Sale 79 67 - 15.2% -- -- --
Inventory of Homes for Sale 11.3 11.6 + 2.4% -- -- --
A RESEARCH TOOL PROVIDED BY THE COASTAL CAROLINAS ASSOCIATION OF REALTORS®
Local Market Update – February 2012
Conway Change inClosed SalesAll Properties
Change in Inventory of Homes
All Properties
February Year to DateSingle-Family Properties
- 37.1% - 10.0% - 20.0%Change in
New ListingsAll Properties
Condo PropertiesFebruary Year to Date
y* Does not account for seller concessions. | Activity for one month can sometimes look extreme due to small sample size.
** Each dot represents the change in median sales price from the prior year using a 6-month weighted average. This means that each of the 6 months used in a dot are proportionedaccording to their share of sales during that period. | All data from the Coastal Carolinas Association of REALTORS®. | Sponsored by South Carolina REALTORS®.
Powered by 10K Research and Marketing. | Information deemed reliable but not guaranteed. Consult your agent for market specifics.
Change in Median Sales Price from Prior Year (6-Month Average)**
All MLSConwayConway
All MLS
- 20%
- 15%
- 10%
- 5%
0%
+ 5%
+ 10%
1-2008 1-2009 1-2010 1-2011 1-2012
Single-Family Properties
- 40%
- 30%
- 20%
- 10%
0%
+ 10%
+ 20%
+ 30%
+ 40%
1-2008 1-2009 1-2010 1-2011 1-2012
Condo Propertiesb
a
2011 2012 + / – 2011 2012 + / –
New Listings 17 33 + 94.1% 38 78 + 105.3%
Closed Sales 6 14 + 133.3% 12 37 + 208.3%
Median Sales Price* $265,485 $287,000 + 8.1% $259,000 $219,500 - 15.3%
Percent of Original List Price Received* 87.6% 93.7% + 7.0% 90.6% 93.7% + 3.5%
Days on Market Until Sale 173 140 - 18.8% 209 174 - 17.1%
Inventory of Homes for Sale 187 221 + 18.2% -- -- --
2011 2012 + / – 2011 2012 + / –
New Listings 19 19 0.0% 27 31 + 14.8%
Closed Sales 8 3 - 62.5% 13 8 - 38.5%
Median Sales Price* $200,000 $182,000 - 9.0% $191,310 $156,000 - 18.5%
Percent of Original List Price Received* 90.8% 91.2% + 0.5% 88.9% 92.1% + 3.6%
Days on Market Until Sale 102 118 + 15.7% -- -- --
Inventory of Homes for Sale 15.7 23.2 + 47.9% -- -- --
A RESEARCH TOOL PROVIDED BY THE COASTAL CAROLINAS ASSOCIATION OF REALTORS®
Local Market Update – February 2012
Garden City / Murrells Inlet
Change inClosed SalesAll Properties
Change in Inventory of Homes
All Properties
February Year to DateSingle-Family Properties
+ 44.4% + 21.4% + 20.5%Change in
New ListingsAll Properties
Condo PropertiesFebruary Year to Date
y* Does not account for seller concessions. | Activity for one month can sometimes look extreme due to small sample size.
** Each dot represents the change in median sales price from the prior year using a 6-month weighted average. This means that each of the 6 months used in a dot are proportionedaccording to their share of sales during that period. | All data from the Coastal Carolinas Association of REALTORS®. | Sponsored by South Carolina REALTORS®.
Powered by 10K Research and Marketing. | Information deemed reliable but not guaranteed. Consult your agent for market specifics.
Change in Median Sales Price from Prior Year (6-Month Average)**
All MLSGarden City / Murrells InletGarden City / Murrells Inlet
All MLS
- 40%
- 20%
0%
+ 20%
+ 40%
+ 60%
+ 80%
+ 100%
1-2008 1-2009 1-2010 1-2011 1-2012
Single-Family Properties
- 30%
- 20%
- 10%
0%
+ 10%
+ 20%
+ 30%
+ 40%
1-2008 1-2009 1-2010 1-2011 1-2012
Condo Propertiesb
a

2011 2012 + / – 2011 2012 + / –
New Listings 28 28 0.0% 54 50 - 7.4%
Closed Sales 10 8 - 20.0% 15 15 0.0%
Median Sales Price* $116,000 $175,000 + 50.9% $120,000 $162,500 + 35.4%
Percent of Original List Price Received* 85.3% 88.2% + 3.4% 87.9% 89.4% + 1.8%
Days on Market Until Sale 232 202 - 12.9% 215 262 + 21.9%
Inventory of Homes for Sale 250 222 - 11.2% -- -- --
2011 2012 + / – 2011 2012 + / –
New Listings 3 3 0.0% 6 5 - 16.7%
Closed Sales 0 0 -- 2 1 - 50.0%
Median Sales Price* $0 $0 -- $567,500 $350,000 - 38.3%
Percent of Original List Price Received* 0.0% 0.0% -- 83.2% 73.6% - 11.6%
Days on Market Until Sale 51 40 - 21.6% -- -- --
Inventory of Homes for Sale 35.7 20.0 - 44.0% -- -- --
A RESEARCH TOOL PROVIDED BY THE COASTAL CAROLINAS ASSOCIATION OF REALTORS®
Local Market Update – February 2012
Georgetown Change inClosed SalesAll Properties
Change in Inventory of Homes
All Properties
February Year to DateSingle-Family Properties
0.0% - 20.0% - 15.3%Change in
New ListingsAll Properties
Condo PropertiesFebruary Year to Date
y* Does not account for seller concessions. | Activity for one month can sometimes look extreme due to small sample size.
** Each dot represents the change in median sales price from the prior year using a 6-month weighted average. This means that each of the 6 months used in a dot are proportionedaccording to their share of sales during that period. | All data from the Coastal Carolinas Association of REALTORS®. | Sponsored by South Carolina REALTORS®.
Powered by 10K Research and Marketing. | Information deemed reliable but not guaranteed. Consult your agent for market specifics.
Change in Median Sales Price from Prior Year (6-Month Average)**
All MLSGeorgetownGeorgetown
All MLS
- 40%
- 30%
- 20%
- 10%
0%
+ 10%
+ 20%
+ 30%
+ 40%
+ 50%
1-2008 1-2009 1-2010 1-2011 1-2012
Single-Family Properties
- 200%
0%
+ 200%
+ 400%
+ 600%
+ 800%
+ 1000%
+ 1200%
1-2008 1-2009 1-2010 1-2011 1-2012
Condo Propertiesb
a

2011 2012 + / – 2011 2012 + / –
New Listings 93 75 - 19.4% 158 154 - 2.5%
Closed Sales 24 34 + 41.7% 45 64 + 42.2%
Median Sales Price* $202,338 $180,000 - 11.0% $195,000 $166,750 - 14.5%
Percent of Original List Price Received* 93.8% 94.6% + 0.9% 94.5% 94.1% - 0.4%
Days on Market Until Sale 195 192 - 1.6% 179 184 + 2.4%
Inventory of Homes for Sale 522 434 - 16.9% -- -- --
2011 2012 + / – 2011 2012 + / –
New Listings 62 85 + 37.1% 140 169 + 20.7%
Closed Sales 28 29 + 3.6% 52 50 - 3.8%
Median Sales Price* $100,000 $96,000 - 4.0% $114,000 $109,000 - 4.4%
Percent of Original List Price Received* 92.9% 92.1% - 0.9% 92.9% 91.9% - 1.2%
Days on Market Until Sale 608 580 - 4.6% -- -- --
Inventory of Homes for Sale 18.9 19.0 + 0.9% -- -- --
A RESEARCH TOOL PROVIDED BY THE COASTAL CAROLINAS ASSOCIATION OF REALTORS®
Local Market Update – February 2012
Little River Change inClosed SalesAll Properties
Change in Inventory of Homes
All Properties
February Year to DateSingle-Family Properties
+ 3.2% + 21.2% - 16.2%Change in
New ListingsAll Properties
Condo PropertiesFebruary Year to Date
y* Does not account for seller concessions. | Activity for one month can sometimes look extreme due to small sample size.
** Each dot represents the change in median sales price from the prior year using a 6-month weighted average. This means that each of the 6 months used in a dot are proportionedaccording to their share of sales during that period. | All data from the Coastal Carolinas Association of REALTORS®. | Sponsored by South Carolina REALTORS®.
Powered by 10K Research and Marketing. | Information deemed reliable but not guaranteed. Consult your agent for market specifics.
Change in Median Sales Price from Prior Year (6-Month Average)**
All MLSLittle RiverLittle River
All MLS
- 20%
- 15%
- 10%
- 5%
0%
+ 5%
+ 10%
1-2008 1-2009 1-2010 1-2011 1-2012
Single-Family Properties
- 25%
- 20%
- 15%
- 10%
- 5%
0%
+ 5%
+ 10%
+ 15%
1-2008 1-2009 1-2010 1-2011 1-2012
Condo Propertiesb
a
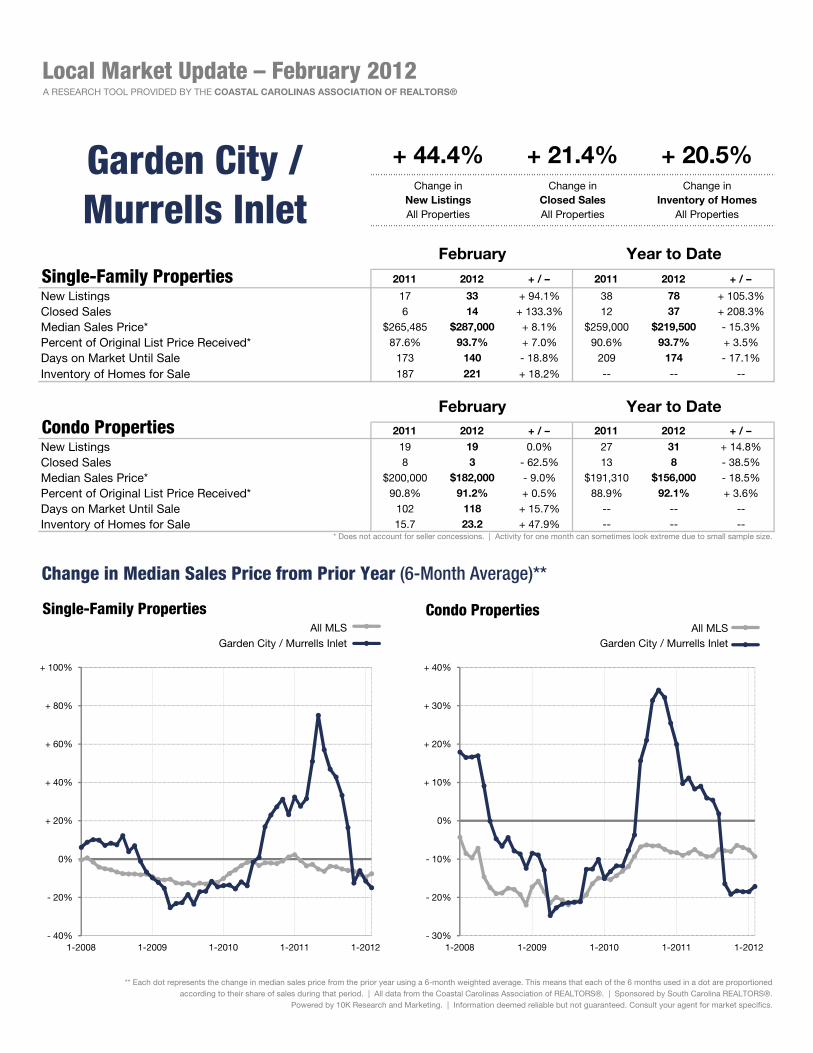
2011 2012 + / – 2011 2012 + / –
New Listings 38 18 - 52.6% 73 46 - 37.0%
Closed Sales 7 6 - 14.3% 14 9 - 35.7%
Median Sales Price* $81,000 $143,450 + 77.1% $111,000 $120,950 + 9.0%
Percent of Original List Price Received* 89.8% 94.5% + 5.2% 92.9% 95.0% + 2.4%
Days on Market Until Sale 121 189 + 56.3% 113 199 + 77.1%
Inventory of Homes for Sale 184 138 - 25.0% -- -- --
2011 2012 + / – 2011 2012 + / –
New Listings 2 0 - 100.0% 3 1 - 66.7%
Closed Sales 0 0 -- 1 0 - 100.0%
Median Sales Price* $0 $0 -- $115,000 $0 - 100.0%
Percent of Original List Price Received* 0.0% 0.0% -- 100.0% 0.0% - 100.0%
Days on Market Until Sale 9 7 - 22.2% -- -- --
Inventory of Homes for Sale 5.3 4.7 - 11.1% -- -- --
A RESEARCH TOOL PROVIDED BY THE COASTAL CAROLINAS ASSOCIATION OF REALTORS®
Local Market Update – February 2012
Loris Change inClosed SalesAll Properties
Change in Inventory of Homes
All Properties
February Year to DateSingle-Family Properties
- 55.0% - 14.3% - 24.6%Change in
New ListingsAll Properties
Condo PropertiesFebruary Year to Date
y* Does not account for seller concessions. | Activity for one month can sometimes look extreme due to small sample size.
** Each dot represents the change in median sales price from the prior year using a 6-month weighted average. This means that each of the 6 months used in a dot are proportionedaccording to their share of sales during that period. | All data from the Coastal Carolinas Association of REALTORS®. | Sponsored by South Carolina REALTORS®.
Powered by 10K Research and Marketing. | Information deemed reliable but not guaranteed. Consult your agent for market specifics.
Change in Median Sales Price from Prior Year (6-Month Average)**
All MLSLorisLoris
All MLS
- 40%
- 30%
- 20%
- 10%
0%
+ 10%
+ 20%
+ 30%
+ 40%
1-2008 1-2009 1-2010 1-2011 1-2012
Single-Family Properties
- 30%
- 20%
- 10%
0%
+ 10%
+ 20%
+ 30%
+ 40%
1-2008 1-2009 1-2010 1-2011 1-2012
Condo Propertiesb
a
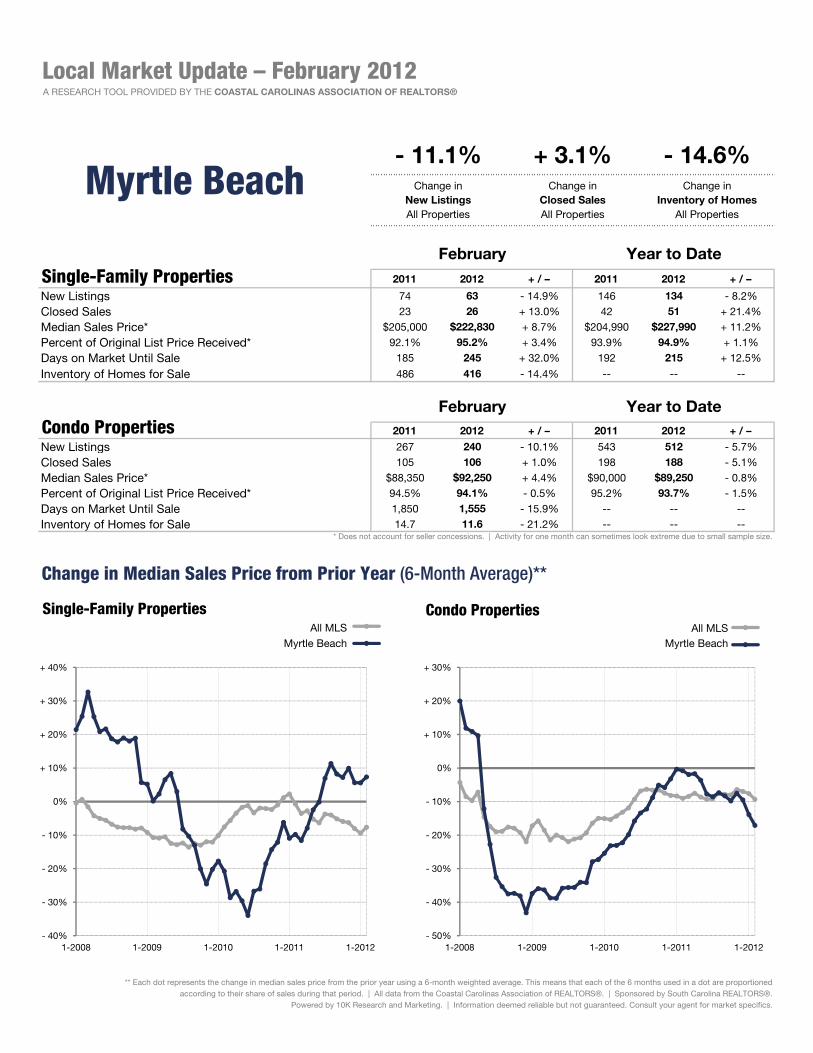
2011 2012 + / – 2011 2012 + / –
New Listings 74 63 - 14.9% 146 134 - 8.2%
Closed Sales 23 26 + 13.0% 42 51 + 21.4%
Median Sales Price* $205,000 $222,830 + 8.7% $204,990 $227,990 + 11.2%
Percent of Original List Price Received* 92.1% 95.2% + 3.4% 93.9% 94.9% + 1.1%
Days on Market Until Sale 185 245 + 32.0% 192 215 + 12.5%
Inventory of Homes for Sale 486 416 - 14.4% -- -- --
2011 2012 + / – 2011 2012 + / –
New Listings 267 240 - 10.1% 543 512 - 5.7%
Closed Sales 105 106 + 1.0% 198 188 - 5.1%
Median Sales Price* $88,350 $92,250 + 4.4% $90,000 $89,250 - 0.8%
Percent of Original List Price Received* 94.5% 94.1% - 0.5% 95.2% 93.7% - 1.5%
Days on Market Until Sale 1,850 1,555 - 15.9% -- -- --
Inventory of Homes for Sale 14.7 11.6 - 21.2% -- -- --
A RESEARCH TOOL PROVIDED BY THE COASTAL CAROLINAS ASSOCIATION OF REALTORS®
Local Market Update – February 2012
Myrtle Beach Change inClosed SalesAll Properties
Change in Inventory of Homes
All Properties
February Year to DateSingle-Family Properties
- 11.1% + 3.1% - 14.6%Change in
New ListingsAll Properties
Condo PropertiesFebruary Year to Date
y* Does not account for seller concessions. | Activity for one month can sometimes look extreme due to small sample size.
** Each dot represents the change in median sales price from the prior year using a 6-month weighted average. This means that each of the 6 months used in a dot are proportionedaccording to their share of sales during that period. | All data from the Coastal Carolinas Association of REALTORS®. | Sponsored by South Carolina REALTORS®.
Powered by 10K Research and Marketing. | Information deemed reliable but not guaranteed. Consult your agent for market specifics.
Change in Median Sales Price from Prior Year (6-Month Average)**
All MLSMyrtle BeachMyrtle Beach
All MLS
- 40%
- 30%
- 20%
- 10%
0%
+ 10%
+ 20%
+ 30%
+ 40%
1-2008 1-2009 1-2010 1-2011 1-2012
Single-Family Properties
- 50%
- 40%
- 30%
- 20%
- 10%
0%
+ 10%
+ 20%
+ 30%
1-2008 1-2009 1-2010 1-2011 1-2012
Condo Propertiesb
a

2011 2012 + / – 2011 2012 + / –
New Listings 29 32 + 10.3% 66 66 0.0%
Closed Sales 16 20 + 25.0% 35 36 + 2.9%
Median Sales Price* $254,900 $232,000 - 9.0% $241,684 $235,000 - 2.8%
Percent of Original List Price Received* 93.8% 91.0% - 2.9% 93.2% 93.0% - 0.2%
Days on Market Until Sale 152 147 - 3.5% 222 164 - 26.0%
Inventory of Homes for Sale 215 210 - 2.3% -- -- --
2011 2012 + / – 2011 2012 + / –
New Listings 106 110 + 3.8% 238 224 - 5.9%
Closed Sales 43 51 + 18.6% 71 84 + 18.3%
Median Sales Price* $152,650 $177,750 + 16.4% $187,250 $165,000 - 11.9%
Percent of Original List Price Received* 94.8% 93.6% - 1.2% 95.2% 92.9% - 2.4%
Days on Market Until Sale 844 855 + 1.3% -- -- --
Inventory of Homes for Sale 16.3 15.2 - 7.1% -- -- --
A RESEARCH TOOL PROVIDED BY THE COASTAL CAROLINAS ASSOCIATION OF REALTORS®
Local Market Update – February 2012
North Myrtle Beach
Change inClosed SalesAll Properties
Change in Inventory of Homes
All Properties
February Year to DateSingle-Family Properties
+ 5.2% + 20.3% - 2.7%Change in
New ListingsAll Properties
Condo PropertiesFebruary Year to Date
y* Does not account for seller concessions. | Activity for one month can sometimes look extreme due to small sample size.
** Each dot represents the change in median sales price from the prior year using a 6-month weighted average. This means that each of the 6 months used in a dot are proportionedaccording to their share of sales during that period. | All data from the Coastal Carolinas Association of REALTORS®. | Sponsored by South Carolina REALTORS®.
Powered by 10K Research and Marketing. | Information deemed reliable but not guaranteed. Consult your agent for market specifics.
Change in Median Sales Price from Prior Year (6-Month Average)**
All MLSNorth Myrtle BeachNorth Myrtle Beach
All MLS
- 30%
- 25%
- 20%
- 15%
- 10%
- 5%
0%
+ 5%
+ 10%
+ 15%
+ 20%
1-2008 1-2009 1-2010 1-2011 1-2012
Single-Family Properties
- 30%
- 25%
- 20%
- 15%
- 10%
- 5%
0%
+ 5%
+ 10%
+ 15%
1-2008 1-2009 1-2010 1-2011 1-2012
Condo Propertiesb
a

2011 2012 + / – 2011 2012 + / –
New Listings 62 38 - 38.7% 118 111 - 5.9%
Closed Sales 7 12 + 71.4% 20 23 + 15.0%
Median Sales Price* $274,000 $329,500 + 20.3% $260,500 $280,000 + 7.5%
Percent of Original List Price Received* 92.0% 93.0% + 1.1% 91.7% 92.0% + 0.4%
Days on Market Until Sale 166 229 + 37.8% 210 220 + 4.7%
Inventory of Homes for Sale 450 427 - 5.1% -- -- --
2011 2012 + / – 2011 2012 + / –
New Listings 34 28 - 17.6% 63 69 + 9.5%
Closed Sales 9 8 - 11.1% 14 18 + 28.6%
Median Sales Price* $143,500 $226,250 + 57.7% $130,250 $186,500 + 43.2%
Percent of Original List Price Received* 92.1% 90.0% - 2.2% 92.4% 91.3% - 1.2%
Days on Market Until Sale 344 336 - 2.3% -- -- --
Inventory of Homes for Sale 32.8 31.3 - 4.6% -- -- --
A RESEARCH TOOL PROVIDED BY THE COASTAL CAROLINAS ASSOCIATION OF REALTORS®
Local Market Update – February 2012
Pawleys Island / Litchfield
Change inClosed SalesAll Properties
Change in Inventory of Homes
All Properties
February Year to DateSingle-Family Properties
- 31.3% + 25.0% - 5.1%Change in
New ListingsAll Properties
Condo PropertiesFebruary Year to Date
y* Does not account for seller concessions. | Activity for one month can sometimes look extreme due to small sample size.
** Each dot represents the change in median sales price from the prior year using a 6-month weighted average. This means that each of the 6 months used in a dot are proportionedaccording to their share of sales during that period. | All data from the Coastal Carolinas Association of REALTORS®. | Sponsored by South Carolina REALTORS®.
Powered by 10K Research and Marketing. | Information deemed reliable but not guaranteed. Consult your agent for market specifics.
Change in Median Sales Price from Prior Year (6-Month Average)**
All MLSPawleys Island / LitchfieldPawleys Island / Litchfield
All MLS
- 50%
- 40%
- 30%
- 20%
- 10%
0%
+ 10%
+ 20%
+ 30%
+ 40%
+ 50%
1-2008 1-2009 1-2010 1-2011 1-2012
Single-Family Properties
- 40%
- 30%
- 20%
- 10%
0%
+ 10%
+ 20%
+ 30%
+ 40%
+ 50%
+ 60%
1-2008 1-2009 1-2010 1-2011 1-2012
Condo Propertiesb
a

2011 2012 + / – 2011 2012 + / –
New Listings 31 36 + 16.1% 66 64 - 3.0%
Closed Sales 15 11 - 26.7% 27 18 - 33.3%
Median Sales Price* $150,000 $122,000 - 18.7% $136,500 $136,600 + 0.1%
Percent of Original List Price Received* 96.6% 97.1% + 0.5% 96.0% 97.9% + 1.9%
Days on Market Until Sale 151 155 + 2.6% 178 166 - 6.6%
Inventory of Homes for Sale 181 164 - 9.4% -- -- --
2011 2012 + / – 2011 2012 + / –
New Listings 6 11 + 83.3% 13 35 + 169.2%
Closed Sales 2 7 + 250.0% 5 11 + 120.0%
Median Sales Price* $36,500 $37,950 + 4.0% $45,000 $37,950 - 15.7%
Percent of Original List Price Received* 86.0% 97.3% + 13.1% 90.2% 96.5% + 6.9%
Days on Market Until Sale 64 69 + 7.8% -- -- --
Inventory of Homes for Sale 14.5 14.8 + 2.0% -- -- --
A RESEARCH TOOL PROVIDED BY THE COASTAL CAROLINAS ASSOCIATION OF REALTORS®
Local Market Update – February 2012
Socastee Change inClosed SalesAll Properties
Change in Inventory of Homes
All Properties
February Year to DateSingle-Family Properties
+ 27.0% + 5.9% - 8.5%Change in
New ListingsAll Properties
Condo PropertiesFebruary Year to Date
y* Does not account for seller concessions. | Activity for one month can sometimes look extreme due to small sample size.
** Each dot represents the change in median sales price from the prior year using a 6-month weighted average. This means that each of the 6 months used in a dot are proportionedaccording to their share of sales during that period. | All data from the Coastal Carolinas Association of REALTORS®. | Sponsored by South Carolina REALTORS®.
Powered by 10K Research and Marketing. | Information deemed reliable but not guaranteed. Consult your agent for market specifics.
Change in Median Sales Price from Prior Year (6-Month Average)**
All MLSSocasteeSocastee
All MLS
- 20%
- 15%
- 10%
- 5%
0%
+ 5%
+ 10%
+ 15%
+ 20%
+ 25%
+ 30%
1-2008 1-2009 1-2010 1-2011 1-2012
Single-Family Properties
- 60%
- 50%
- 40%
- 30%
- 20%
- 10%
0%
+ 10%
+ 20%
+ 30%
+ 40%
+ 50%
1-2008 1-2009 1-2010 1-2011 1-2012
Condo Propertiesb
a
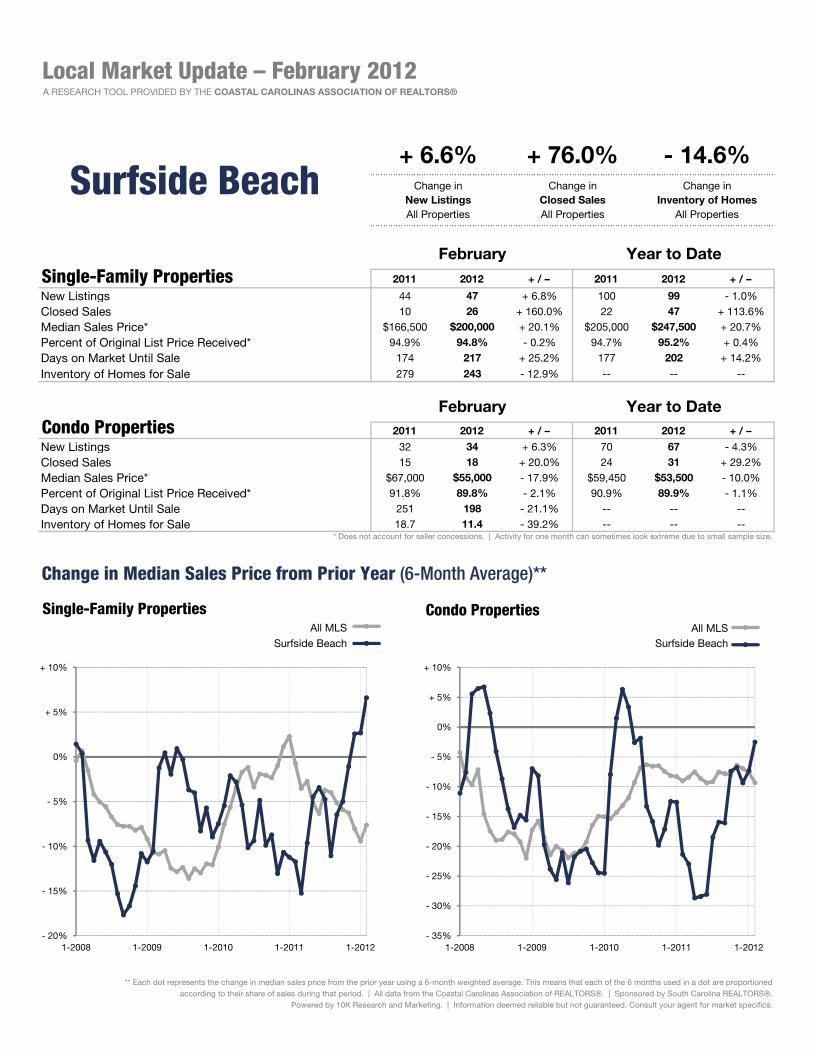
2011 2012 + / – 2011 2012 + / –
New Listings 44 47 + 6.8% 100 99 - 1.0%
Closed Sales 10 26 + 160.0% 22 47 + 113.6%
Median Sales Price* $166,500 $200,000 + 20.1% $205,000 $247,500 + 20.7%
Percent of Original List Price Received* 94.9% 94.8% - 0.2% 94.7% 95.2% + 0.4%
Days on Market Until Sale 174 217 + 25.2% 177 202 + 14.2%
Inventory of Homes for Sale 279 243 - 12.9% -- -- --
2011 2012 + / – 2011 2012 + / –
New Listings 32 34 + 6.3% 70 67 - 4.3%
Closed Sales 15 18 + 20.0% 24 31 + 29.2%
Median Sales Price* $67,000 $55,000 - 17.9% $59,450 $53,500 - 10.0%
Percent of Original List Price Received* 91.8% 89.8% - 2.1% 90.9% 89.9% - 1.1%
Days on Market Until Sale 251 198 - 21.1% -- -- --
Inventory of Homes for Sale 18.7 11.4 - 39.2% -- -- --
A RESEARCH TOOL PROVIDED BY THE COASTAL CAROLINAS ASSOCIATION OF REALTORS®
Local Market Update – February 2012
Surfside Beach Change inClosed SalesAll Properties
Change in Inventory of Homes
All Properties
February Year to DateSingle-Family Properties
+ 6.6% + 76.0% - 14.6%Change in
New ListingsAll Properties
Condo PropertiesFebruary Year to Date
y* Does not account for seller concessions. | Activity for one month can sometimes look extreme due to small sample size.
** Each dot represents the change in median sales price from the prior year using a 6-month weighted average. This means that each of the 6 months used in a dot are proportionedaccording to their share of sales during that period. | All data from the Coastal Carolinas Association of REALTORS®. | Sponsored by South Carolina REALTORS®.
Powered by 10K Research and Marketing. | Information deemed reliable but not guaranteed. Consult your agent for market specifics.
Change in Median Sales Price from Prior Year (6-Month Average)**
All MLSSurfside BeachSurfside Beach
All MLS
- 20%
- 15%
- 10%
- 5%
0%
+ 5%
+ 10%
1-2008 1-2009 1-2010 1-2011 1-2012
Single-Family Properties
- 35%
- 30%
- 25%
- 20%
- 15%
- 10%
- 5%
0%
+ 5%
+ 10%
1-2008 1-2009 1-2010 1-2011 1-2012
Condo Propertiesb
a