Embed Size (px)
Citation preview

2012 INVESTPennsylvania Equity Conference
Black Box CorporationNASDAQ OMX: BBOX

Black Box Corporation
2
Forward-Looking Statements - Any forward-looking statements contained in this presentation are made pursuant to the safe harbor provisions of the Private Securities Litigation Reform Act of 1995 and speak only as of the date of this presentation. You can identify these forward-looking statements by the fact that they use words such as "should," "anticipate," "estimate," "approximate," "expect," "target," "may," "will," "project," "intend," "plan," "believe" and other words of similar meaning and expression in connection with any discussion of future operating or financial performance. Forward-looking statements are inherently subject to a variety of risks and uncertainties that could cause actual results to differ materially from those projected. Risk factors are included in our Annual Report on Form 10-K for the fiscal year ended March 31, 2012 and our other filings with the Securities and Exchange Commission (the “SEC”). We can give no assurance that any goal, plan or target set forth in forward-looking statements can be achieved and readers are cautioned not to place undue reliance on such statements, which speak only as of the date made. We undertake no obligation to release publicly any revisions to forward-looking statements as a result of future events or developments.
GAAP Reconciliation -This presentation also includes, as a supplement to United States Generally Accepted Accounting Principles (“GAAP”), certain non-GAAP financial measures. These non-GAAP financial measures exclude the impact of certain items and, therefore, have not been calculated in accordance with GAAP. Pursuant to the requirements of the SEC’s Regulation G, we provide in our SEC filings additional information regarding these non-GAAP financial measures, including a reconciliation of them to their most comparable GAAP financial measures, management’s explanations regarding the use and usefulness of non-GAAP financial measures and the limitations associated with the use of non-GAAP financial measures. The Company's non-GAAP financial measures are not meant to be considered in isolation or as a substitute for comparable GAAP financial measurements, and should be read only in conjunction with the Company's consolidated financial statements prepared in accordance with GAAP.

Comprehensive Communications System Integrator
3
Financially Strong and Stable• Public company (NASDAQ: BBOX) since 1994
• $1+ billion in annual revenue
• Strong operating profits
• Positive cash flow for 36 consecutive years
• Design• Source• Implement• Maintain
Complex Communications Solutions

Competitive Advantages
Key Differentiators
4
and many more…
» Technology Independent
» Broad Geographic Footprint• 200 offices worldwide• 150 countries
» Deep Organic Resources• 4,000+ team members• 3,000 engineers and technicians

Black Box Platforms
5
CommunicationServices
CommunicationServices
TechnologyProducts
TechnologyProducts
Black Box is comprised of 2 platforms for building growth. Each platform allows us to leverage and evolve current
capabilities to capture market share in the most promising market segments.
Power of the platforms – high barriers to entry» Scale – multi-office, multi-product and diverse skills» Flexibility – capture innovation without increasing risk» Leverage – shared service infrastructure

Technology Products Platform
6
Global sales and distribution Free 24/7/365 tech support
Custom solutions Same day delivery Lifetime warranties
Quality control Global product management & sourcing
Global sales and distribution Free 24/7/365 tech support
Custom solutions Same day delivery Lifetime warranties
Quality control Global product management & sourcing
Virtualization
Digital S
ignage
Cabinets &
Racks
Cabling
Infrastructure
Future Products
Products added to
platform as market is
proven
PLATFORM
PRODUCTS
Wireless N
etworking
Sw
itches & R
outers

Communications Services Platform
7
Services added to
platform as market is
proven
Engineering and design Network Operations Centers
Technical certifications Local & national sales teams
Remote monitoring On-site service teams
Technology Partner Centers of Excellence
Engineering and design Network Operations Centers
Technical certifications Local & national sales teams
Remote monitoring On-site service teams
Technology Partner Centers of Excellence
Com
munications
Lifecycle Services
Unified C
omm
unicationsV
ideo \ AV
Services
In-building Wireless
Data C
enter Services
Future Services
PLATFORM
SERVICES
Structured C
abling

Product / Service Lifecycle
8
Introduction MaturityGrowth Commoditization
TDMSwitches & Routers
Unified Communications
Video Services
In-Building Wireless
Data Center Services
Digital Signage
Cabling
VirtualizationServices
Black Box’s robust platforms allow for a distribution of offerings across all stages of the product/service life cycle.
Mobility Services
Structured Cabling

Strategic Focus
»Strengthen and expand a portfolio of high-value communication solutions
»Leverage centralized expertise with local skills and relationships
»Realign organizational structure and incentives
»Implement a consistent, comprehensive market penetration approach
9

10
Financial Overview
Company Confidential

11
Well-Diversified Revenues
Source: Derived from the Company’s 2012 Annual ReportSource: Derived from the Company’s 2012 Annual Report..

12
(1) (1) Large Companies include those with revenues greater than $1 billion, including federal governmentsLarge Companies include those with revenues greater than $1 billion, including federal governmentsMedium companies include those with revenues between $100 million and $1 billion, including state governmentsMedium companies include those with revenues between $100 million and $1 billion, including state governmentsSmall companies include those with revenues less than $100 million, including local governmentsSmall companies include those with revenues less than $100 million, including local governments
Source: Derived from Company’s 2012 Annual Report.Source: Derived from Company’s 2012 Annual Report.
Well-Diversified Revenues

13
Backlog & Maintenance Revenue
2Q12 3Q12 4Q12 1Q13 2Q13
6 month Backlog (millions) 223$ 208$ 199$ 192$ 203$
Maintenance Revenue as a % of total Revenue 20% 19% 20% 22% 19%
* Backlog represents expected maintenance and project revenue related to executed client purchase orders or contracts that are estimated to be complete within 180 days of quarter end.
Source: Derived from Company data.Source: Derived from Company data.
Company Confidential

14
Revenue & Adjusted Operating Income Margins
$1,017 $1,000 $961 $1,068 $1,088
10.3% 10.3%9.5% 9.7%
8.4%
0.0%
2.0%
4.0%
6.0%
8.0%
10.0%
12.0%
$-
$200
$400
$600
$800
$1,000
$1,200
2008 2009 2010 2011 2012
Ad
jus
ted
Op
era
tin
g I
nc
om
e M
arg
in *
Re
ven
ue
(M
)
Fiscal Year14
* See attached reconciliation
Source: Derived from Company data and Company’s 2012 Form 10-K.
Organic growth (decline) 3% (10%) (13%) 9% (5%)
* Organic growth is determined excluding revenues from acquisition and the impact of foreign currency.

15
GAAP/Non-GAAP Reconciliation
All dollar amounts in millions.
% of % of % of % of % of % of$ Rev. $ Rev. $ Rev. $ Rev. $ Rev. $ Rev.
Operating income 85$ 8.3% 80$ 8.0% 63$ 6.6% 91$ 8.5% (240)$ -22.0% 26$ 5.1%Non-cash reconciling items
Amortization of intangible assetson acquisitions 7 11 15 12 13 7 Asset write-up depreciation expenseon acquisitions 2 2 - - - - Goodwill impairment - - - - 318 -
Cash reconciling itemsEmployee severance and facilityconsolidation costs - 9 5 - - 4 Acquisition integration costs 9 - - - - - Historical stock option grantingpractices investigation and 1 1 5 - - - related matters cost409A expenses 1 - - - - - Other - - 3 - - -
Total pre-tax reconciling items 20 2.0% 23 2.3% 28 2.9% 12 1.2% 331 30.4% 11 2.2%
Adjusted operating income 105$ 10.3% 103$ 10.3% 91$ 9.5% 103$ 9.7% 91$ 8.4% 37$ 7.2%
Revenue 1,017$ 1,000$ 961$ 1,068$ 1,088$ 508$
FY 2010First Six Months
FY 2012FY 2009 FY 2012FY 2008 FY 2011
Company Confidential
Source: Derived from Company data and Company’s 2012 Form 10-K.Source: Derived from Company data and Company’s 2012 Form 10-K.

16
Balance Sheet Metrics
2008 2009 2010 2011 2012
DSO Days 55 53 51 49 52
Inventory Turns 7.1 8.5 8.8 9.2 8.8
Capex (M) $3.2 $2.2 $2.3 $5.1 $7.6
Capex as % of Rev.
0.3% 0.2% 0.2% 0.5% 0.7%
Headcount 4,313 4,542 4,348 4,413 4,302
Debt / Equity .3 to 1 .4 to 1 .3 to 1 .2 to 1 .4 to 1
Company ConfidentialSource: Derived from Company data and Company’s 2012 Form 10-K .Source: Derived from Company data and Company’s 2012 Form 10-K .

Company Confidential
17
Consistent Positive Cash Flow
Source: Derived from Company data and Company’s 2012 Form 10-K.Source: Derived from Company data and Company’s 2012 Form 10-K.

M&A, 43%
Debt Reduction, 41%
Dividends & Repurchases,
16%
18
Deployment of Capital
» 28¢ per share annual dividend - 1.3% yield
17% increase over F2011
» $15M for stock repurchases
» Invested $41M in strategic acquisitions of quality companies in high growth markets
Company Confidential
2010 – 2012 Deployment as a % of Free Cash Flow
Source: Derived from Company data and Company’s 2012 Form 10-K.Source: Derived from Company data and Company’s 2012 Form 10-K.
2012 Cash Flow Highlights

19
Liquidity
At September 30, 2012
» $25 million in cash
» $400 million syndicated line of credit
» $191M drawn down
» Leverage ratio - 2.1, Covenant < 3.5
» Interest Coverage Ratio – 18.6, Covenant > 3.5
»Borrowing rate – LIBOR + 1.125% = 1.7%
»Expires March 2017
Company Confidential
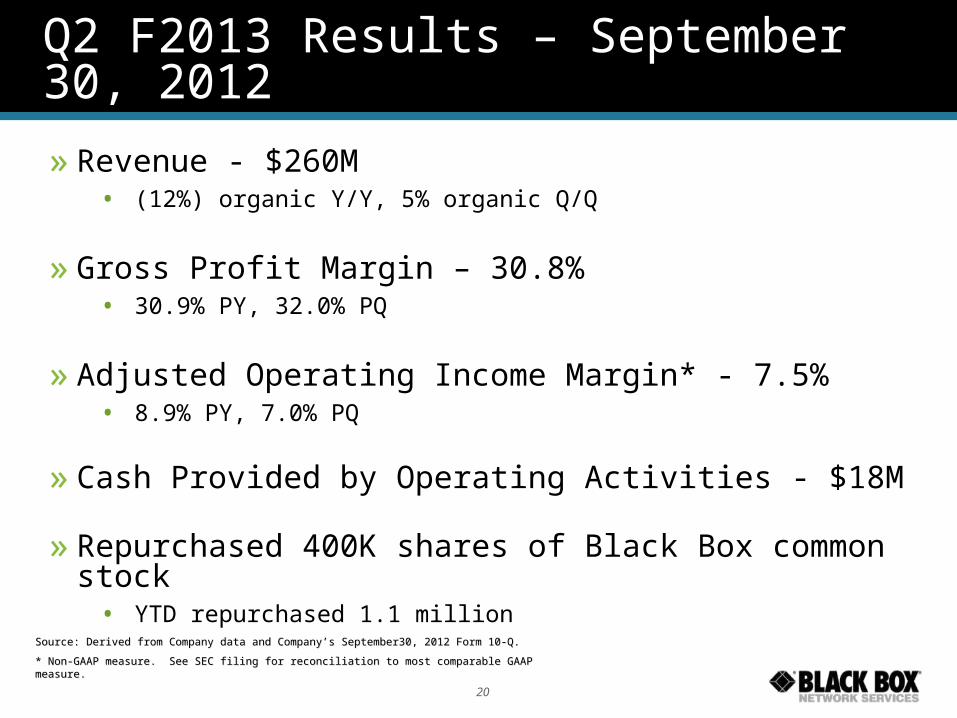
Q2 F2013 Results – September 30, 2012
»Revenue - $260M• (12%) organic Y/Y, 5% organic Q/Q
»Gross Profit Margin – 30.8%• 30.9% PY, 32.0% PQ
»Adjusted Operating Income Margin* - 7.5% • 8.9% PY, 7.0% PQ
»Cash Provided by Operating Activities - $18M
»Repurchased 400K shares of Black Box common stock• YTD repurchased 1.1 million
20
Source: Derived from Company data and Company’s September30, 2012 Form 10-Q. Source: Derived from Company data and Company’s September30, 2012 Form 10-Q.
* Non-GAAP measure. See SEC filing for reconciliation to most comparable GAAP measure.* Non-GAAP measure. See SEC filing for reconciliation to most comparable GAAP measure.

Proposition to shareholders
»Competitive advantage in key differentiators• Technology independent
• Broad geographic footprint
• Deep organic resources
»Robust service and product delivery platforms• Scale
• Flexibility
• Leverage
»Balanced deployment of capital• Investment in business
• Return for shareholders
21

22
Questions
Company Confidential