Embed Size (px)
Citation preview
2012 Half-Yearly Results
US$, except as noted
2
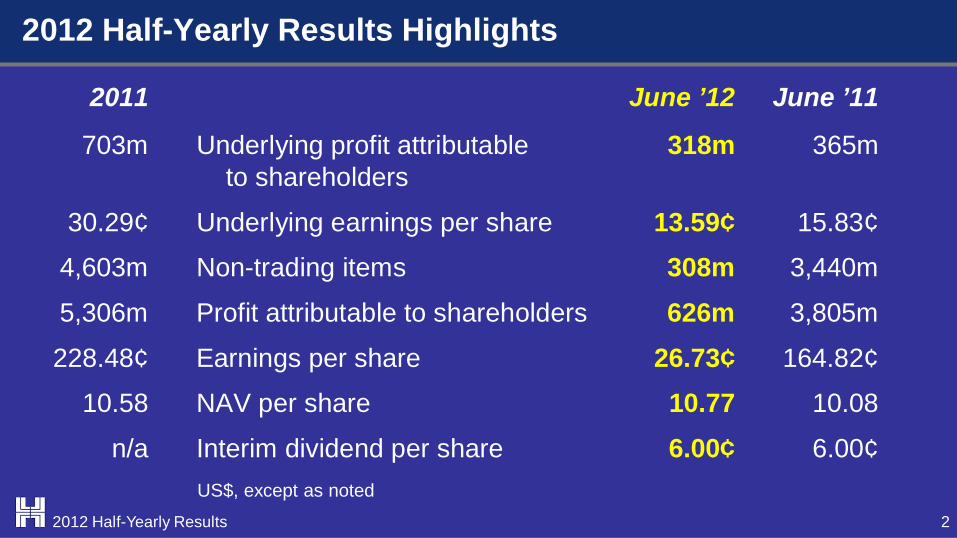
2011 June ’12 June ’11
703m Underlying profit attributable 318m 365m to shareholders
30.29¢ Underlying earnings per share 13.59¢ 15.83¢
4,603m Non-trading items 308m 3,440m
5,306m Profit attributable to shareholders 626m 3,805m
228.48¢ Earnings per share 26.73¢ 164.82¢
10.58 NAV per share 10.77 10.08
n/a Interim dividend per share 6.00¢ 6.00¢
2012 Half-Yearly Results
2012 Half-Yearly Results Highlights
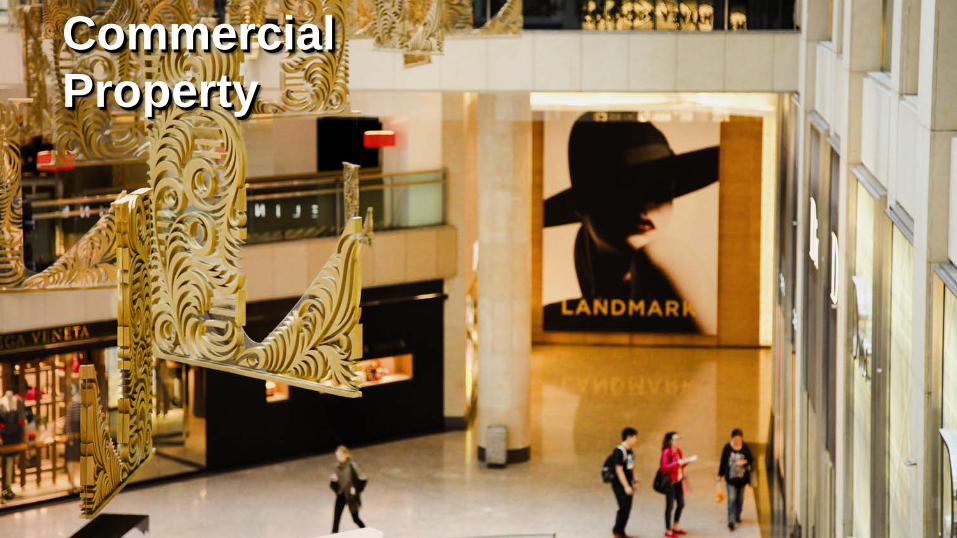
Commercial Property
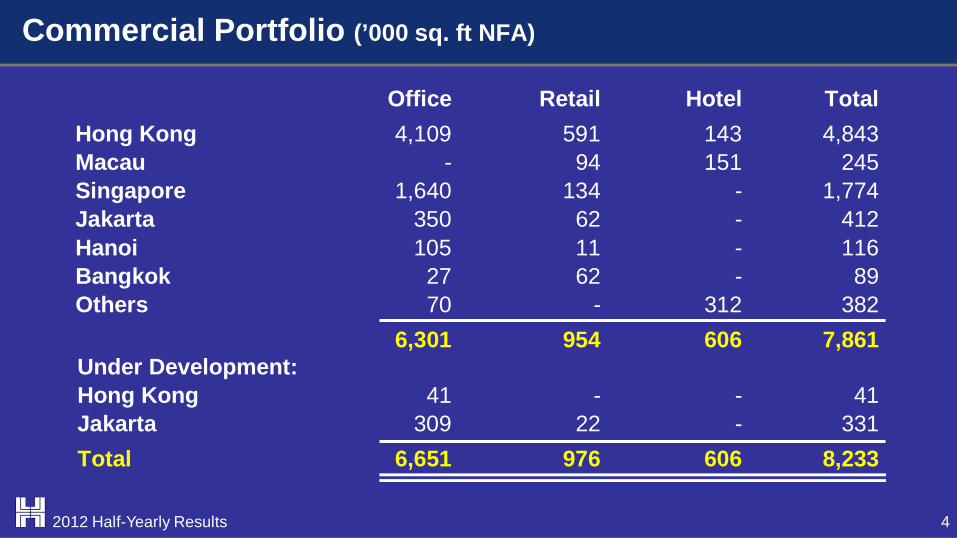
Commercial Portfolio (’000 sq. ft NFA)
Office Retail Hotel Total Hong Kong 4,109 591 143 4,843 Macau - 94 151 245 Singapore 1,640 134 - 1,774 Jakarta 350 62 - 412 Hanoi 105 11 - 116
Bangkok 27 62 - 89 Others 70 - 312 382 6,301 954 606 7,861 Under Development: Hong Kong 41 - - 41 Jakarta 309 22 - 331 Total 6,651 976 606 8,233
4 2012 Half-Yearly Results
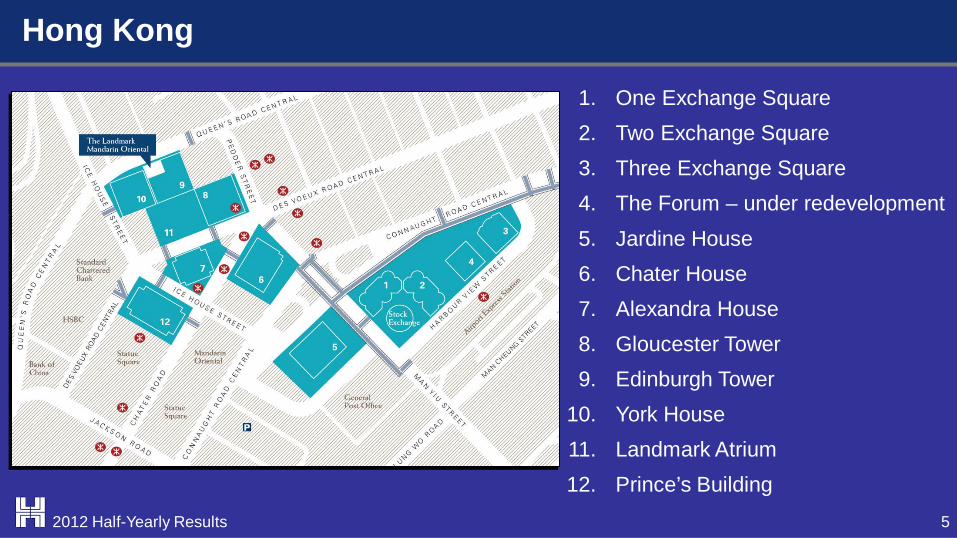
Hong Kong
5
1. One Exchange Square 2. Two Exchange Square 3. Three Exchange Square 4. The Forum – under redevelopment 5. Jardine House 6. Chater House 7. Alexandra House 8. Gloucester Tower 9. Edinburgh Tower
10. York House 11. Landmark Atrium 12. Prince’s Building
2012 Half-Yearly Results
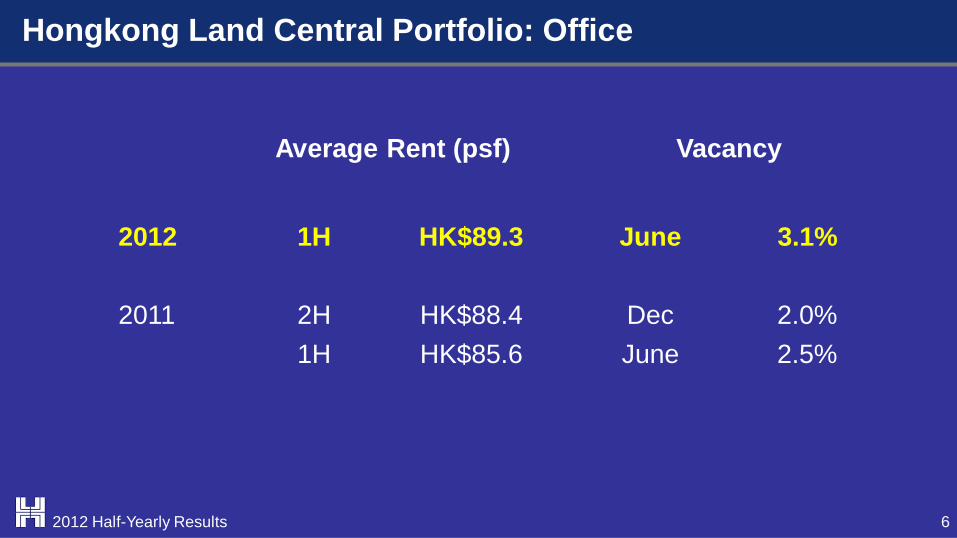
Hongkong Land Central Portfolio: Office
6
Average Rent (psf) Vacancy
2012 1H HK$89.3 June 3.1%
2011 2H HK$88.4 Dec 2.0% 1H HK$85.6 June 2.5%
2012 Half-Yearly Results
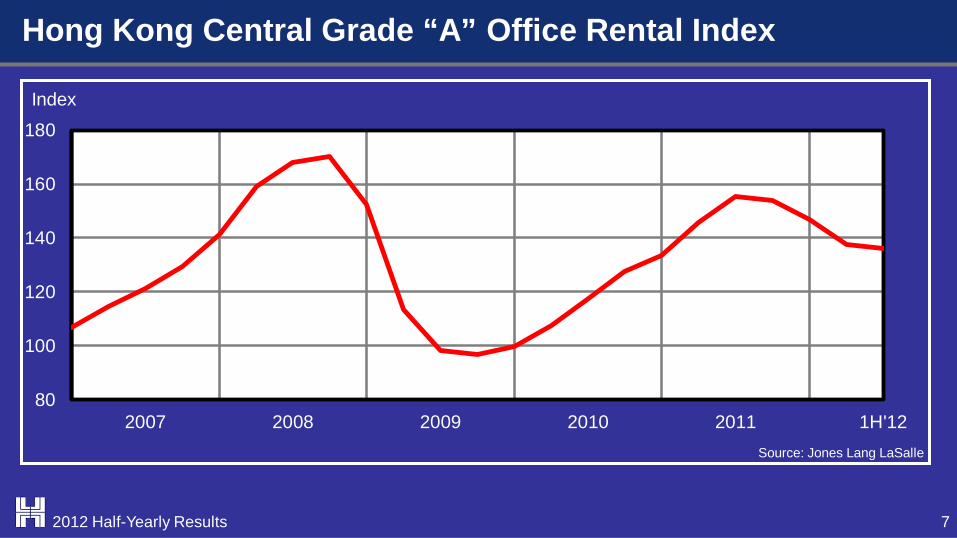
80
100
120
140
160
180
2007 2008 2009 2010 2011 1H'12
Index
Hong Kong Central Grade “A” Office Rental Index
7 2012 Half-Yearly Results
Source: Jones Lang LaSalle
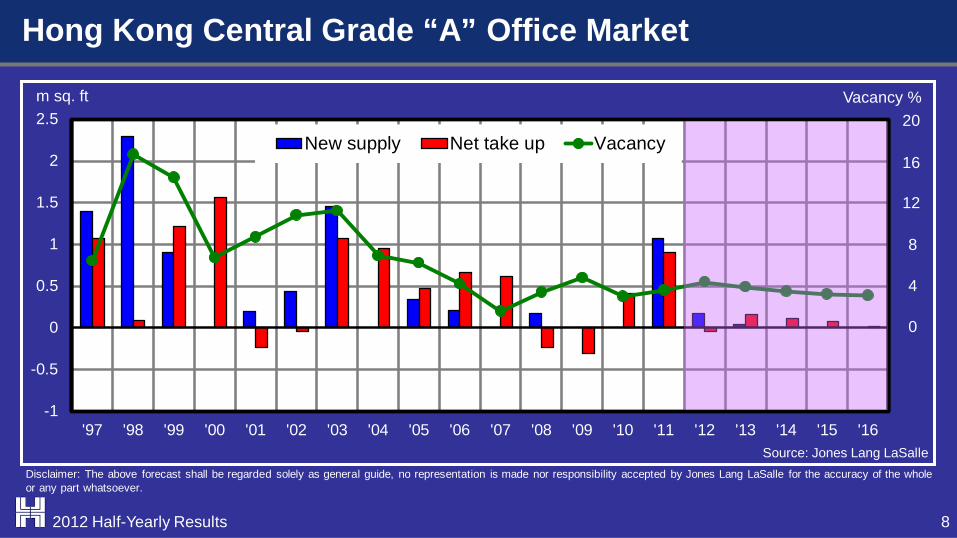
-1
-0.5
0
0.5
1
1.5
2
2.5
'97 '98 '99 '00 '01 '02 '03 '04 '05 '06 '07 '08 '09 '10 '11 '12 '13 '14 '15 '16
Vacancy % m sq. ft
New supply Net take up Vacancy
Source: Jones Lang LaSalle
0
4
8
12
16
20
Hong Kong Central Grade “A” Office Market
8
Disclaimer: The above forecast shall be regarded solely as general guide, no representation is made nor responsibility accepted by Jones Lang LaSalle for the accuracy of the whole or any part whatsoever.
2012 Half-Yearly Results
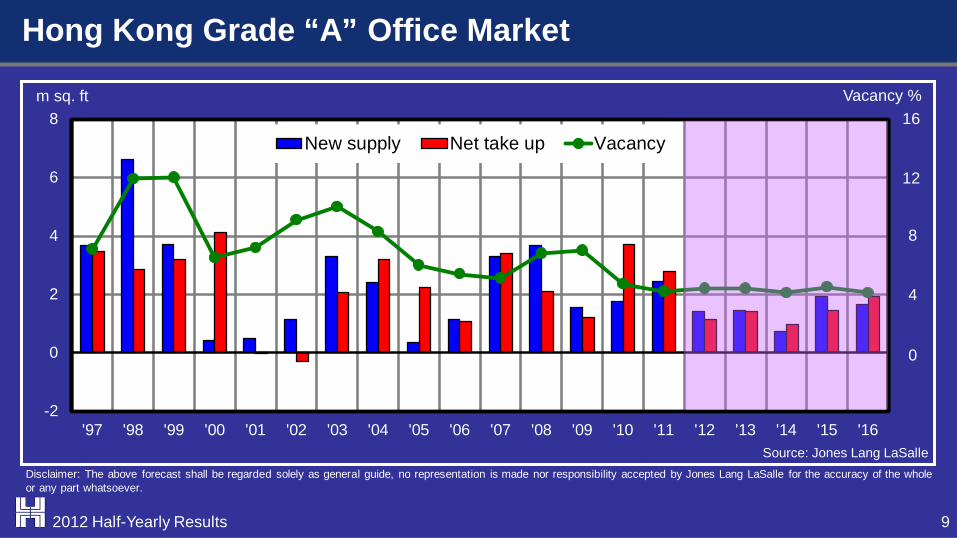
-2
0
2
4
6
8
'97 '98 '99 '00 '01 '02 '03 '04 '05 '06 '07 '08 '09 '10 '11 '12 '13 '14 '15 '16
m sq. ft Vacancy %
New supply Net take up Vacancy
Source: Jones Lang LaSalle
0
4
8
12
16
Hong Kong Grade “A” Office Market
9
Disclaimer: The above forecast shall be regarded solely as general guide, no representation is made nor responsibility accepted by Jones Lang LaSalle for the accuracy of the whole or any part whatsoever.
2012 Half-Yearly Results
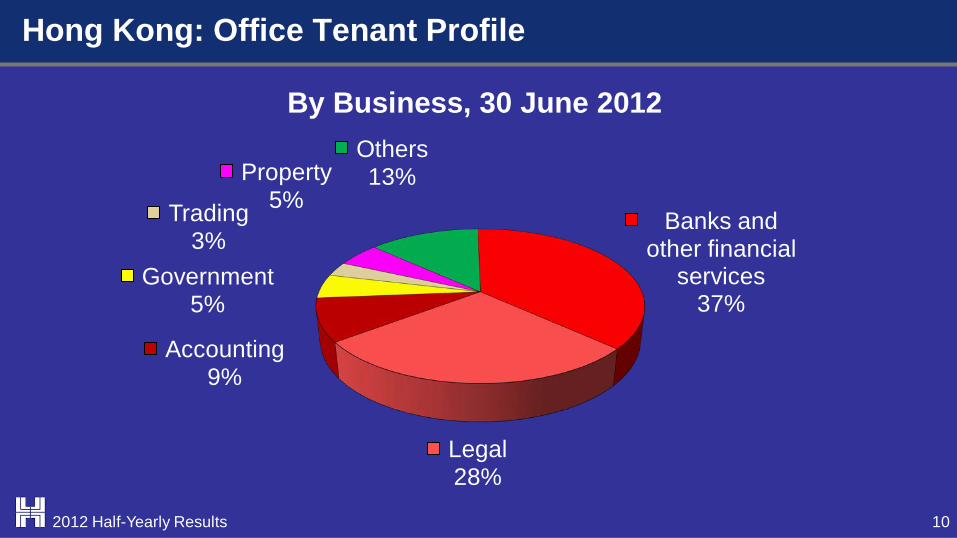
Banks and other financial
services 37%
Legal 28%
Accounting 9%
Government 5%
Trading 3%
Property 5%
Others 13%
10
By Business, 30 June 2012
Hong Kong: Office Tenant Profile
2012 Half-Yearly Results
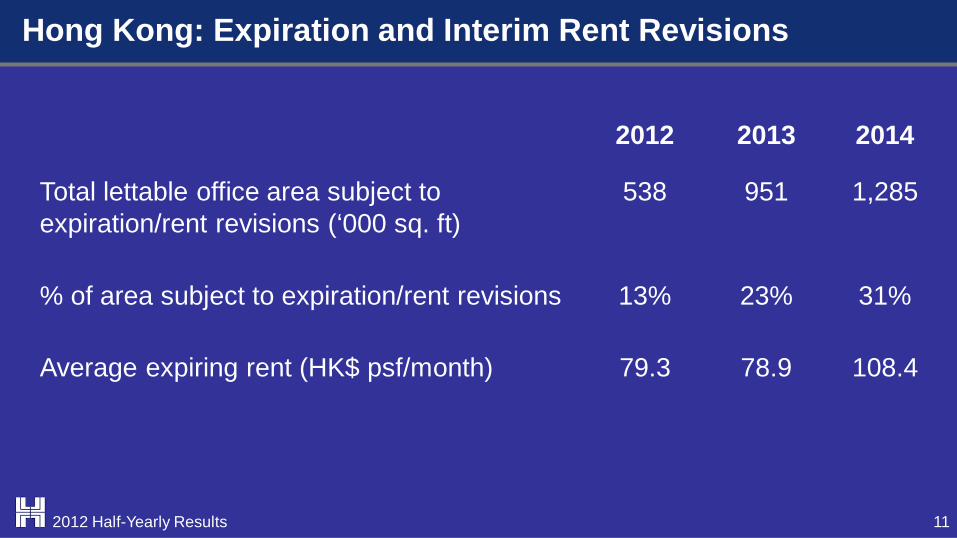
Hong Kong: Expiration and Interim Rent Revisions
2012 2013 2014
Total lettable office area subject to expiration/rent revisions (‘000 sq. ft)
538 951 1,285
% of area subject to expiration/rent revisions 13% 23% 31%
Average expiring rent (HK$ psf/month) 79.3 78.9 108.4
11 2012 Half-Yearly Results
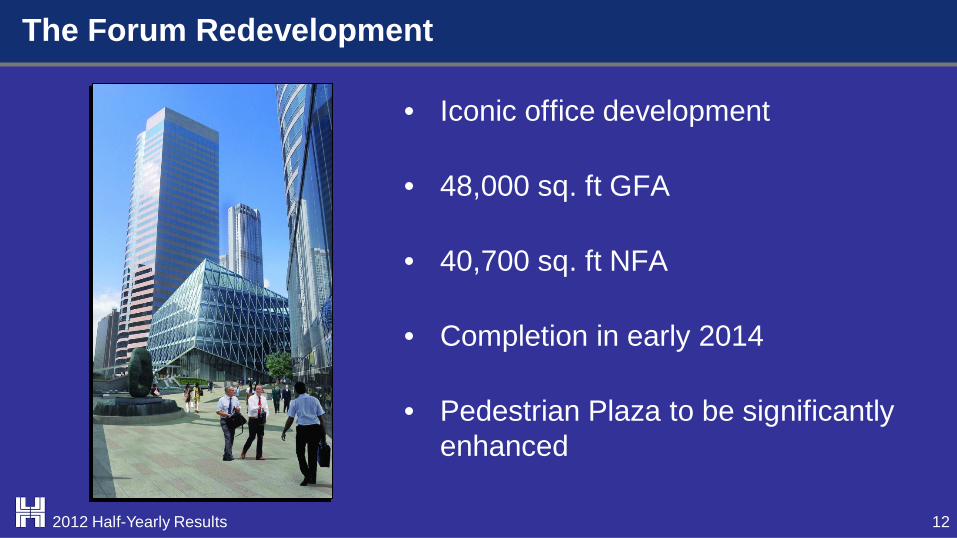
The Forum Redevelopment
• Iconic office development
• 48,000 sq. ft GFA
• 40,700 sq. ft NFA
• Completion in early 2014
• Pedestrian Plaza to be significantly enhanced
12 2012 Half-Yearly Results
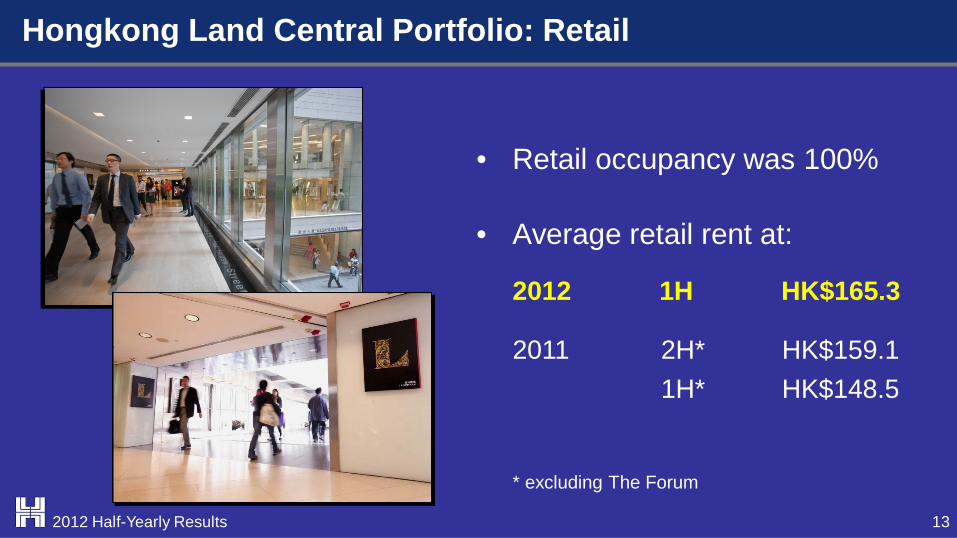
Hongkong Land Central Portfolio: Retail
13
2012 1H HK$165.3
2011 2H* HK$159.1 1H* HK$148.5
• Retail occupancy was 100%
• Average retail rent at:
2012 Half-Yearly Results
* excluding The Forum
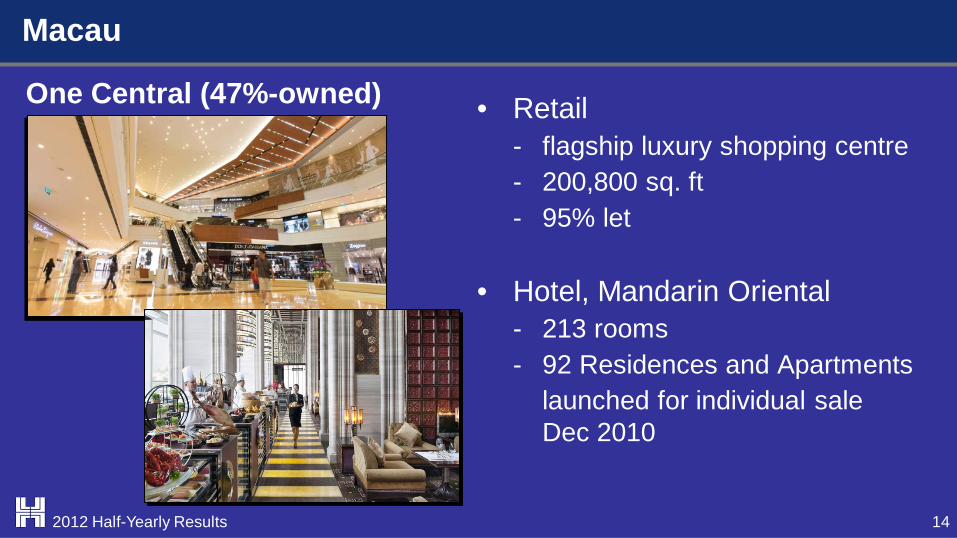
• Retail - flagship luxury shopping centre - 200,800 sq. ft - 95% let • Hotel, Mandarin Oriental - 213 rooms - 92 Residences and Apartments launched for individual sale Dec 2010
One Central (47%-owned)
Macau
14 2012 Half-Yearly Results
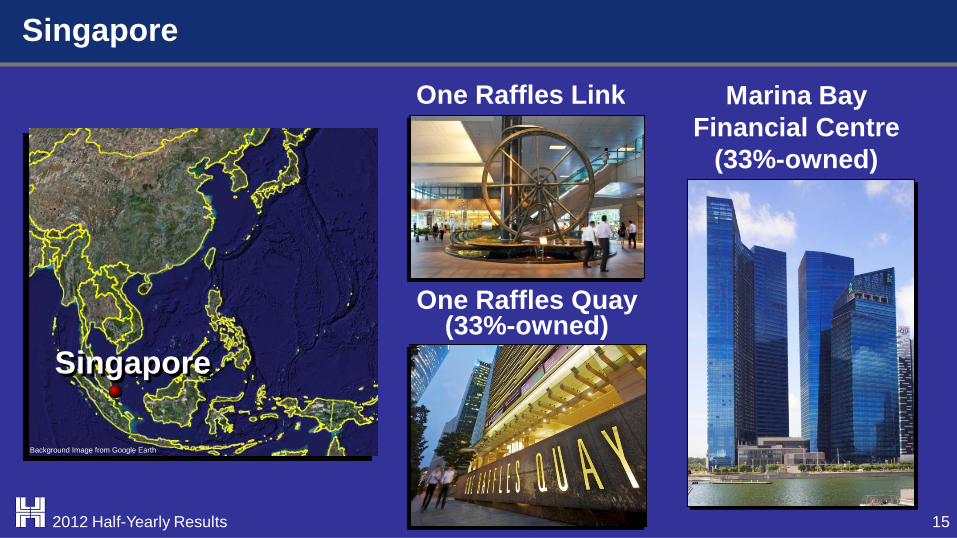
Singapore
15
Background Image from Google EarthBackground Image from Google Earth
Singapore
One Raffles Link Marina Bay Financial Centre
(33%-owned)
One Raffles Quay (33%-owned)
2012 Half-Yearly Results
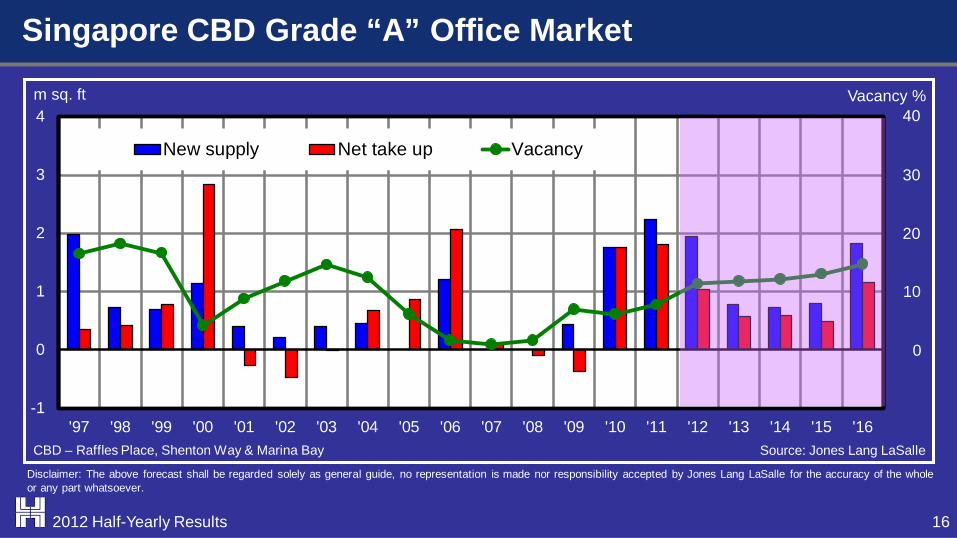
CBD – Raffles Place, Shenton Way & Marina Bay
Singapore CBD Grade “A” Office Market
16
-1
0
1
2
3
4
'97 '98 '99 '00 '01 '02 '03 '04 '05 '06 '07 '08 '09 '10 '11 '12 '13 '14 '15 '16
Vacancy % m sq. ft
New supply Net take up Vacancy
Source: Jones Lang LaSalle
0
10
20
30
40
Disclaimer: The above forecast shall be regarded solely as general guide, no representation is made nor responsibility accepted by Jones Lang LaSalle for the accuracy of the whole or any part whatsoever.
2012 Half-Yearly Results
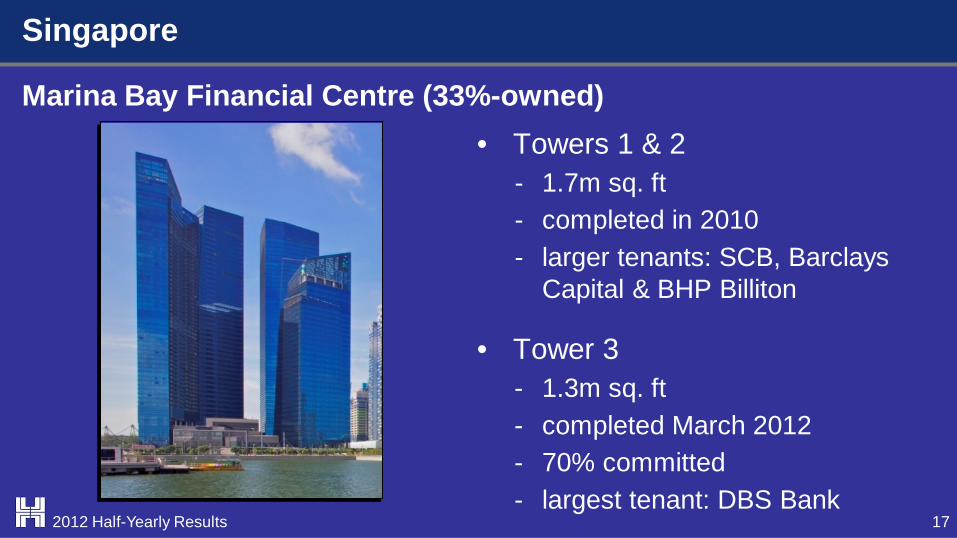
• Towers 1 & 2 - 1.7m sq. ft - completed in 2010 - larger tenants: SCB, Barclays
Capital & BHP Billiton
• Tower 3 - 1.3m sq. ft - completed March 2012 - 70% committed - largest tenant: DBS Bank
Marina Bay Financial Centre (33%-owned)
Singapore
17 2012 Half-Yearly Results
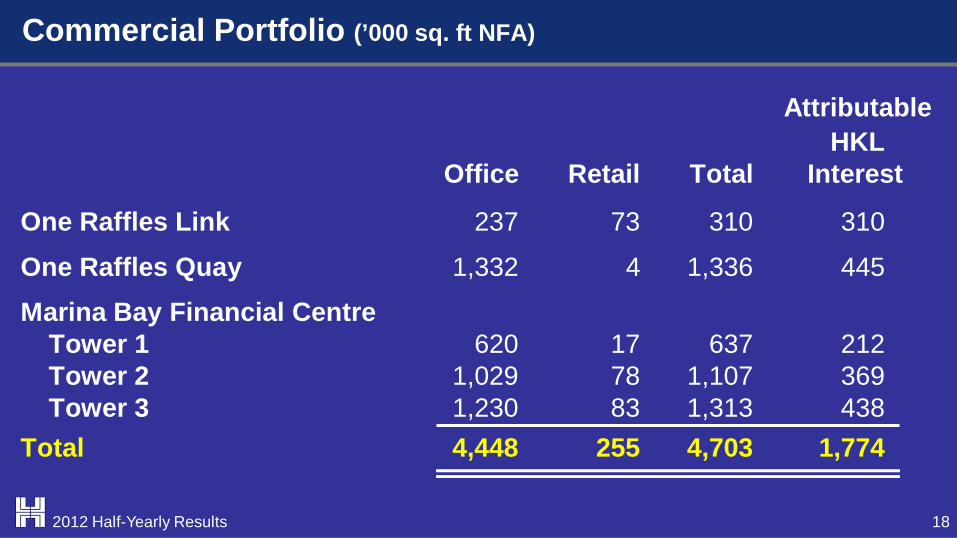
Attributable HKL Office Retail Total Interest
One Raffles Link 237 73 310 310
One Raffles Quay 1,332 4 1,336 445
Marina Bay Financial Centre Tower 1 620 17 637 212 Tower 2 1,029 78 1,107 369 Tower 3 1,230 83 1,313 438 Total 4,448 255 4,703 1,774
Commercial Portfolio (’000 sq. ft NFA)
18 2012 Half-Yearly Results
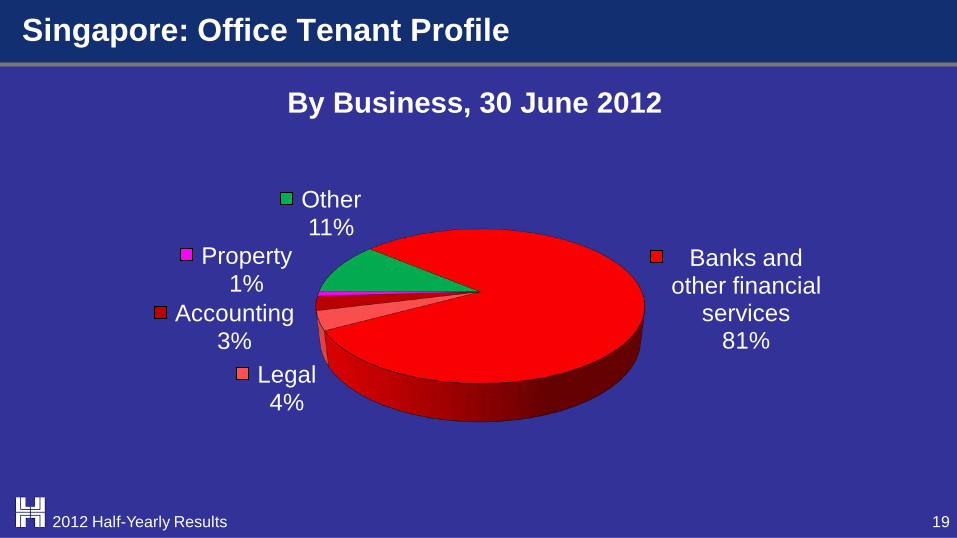
Banks and other financial
services 81%
Legal 4%
Accounting 3%
Property 1%
Other 11%
19
By Business, 30 June 2012
Singapore: Office Tenant Profile
2012 Half-Yearly Results
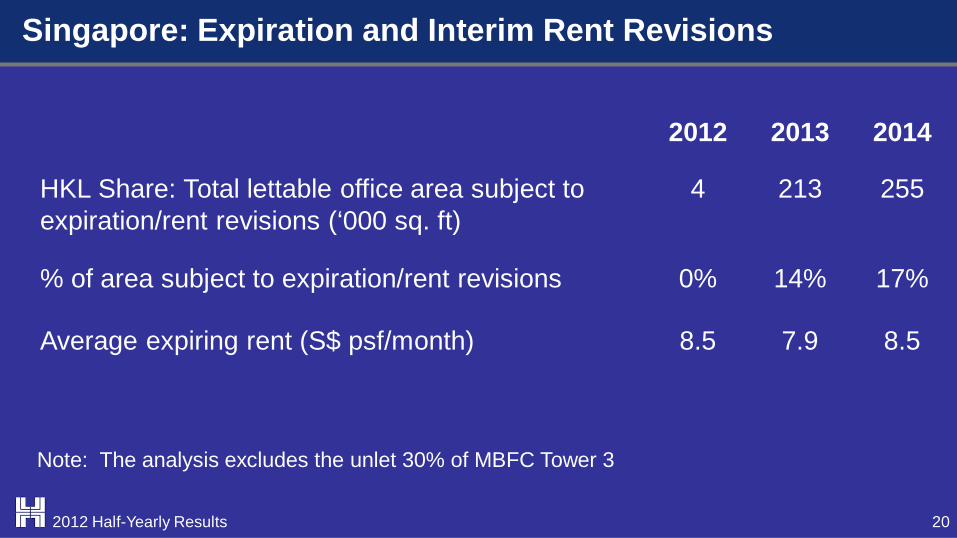
Singapore: Expiration and Interim Rent Revisions
2012 2013 2014
HKL Share: Total lettable office area subject to expiration/rent revisions (‘000 sq. ft)
4 213 255
% of area subject to expiration/rent revisions 0% 14% 17%
Average expiring rent (S$ psf/month) 8.5 7.9 8.5
Note: The analysis excludes the unlet 30% of MBFC Tower 3
20 2012 Half-Yearly Results
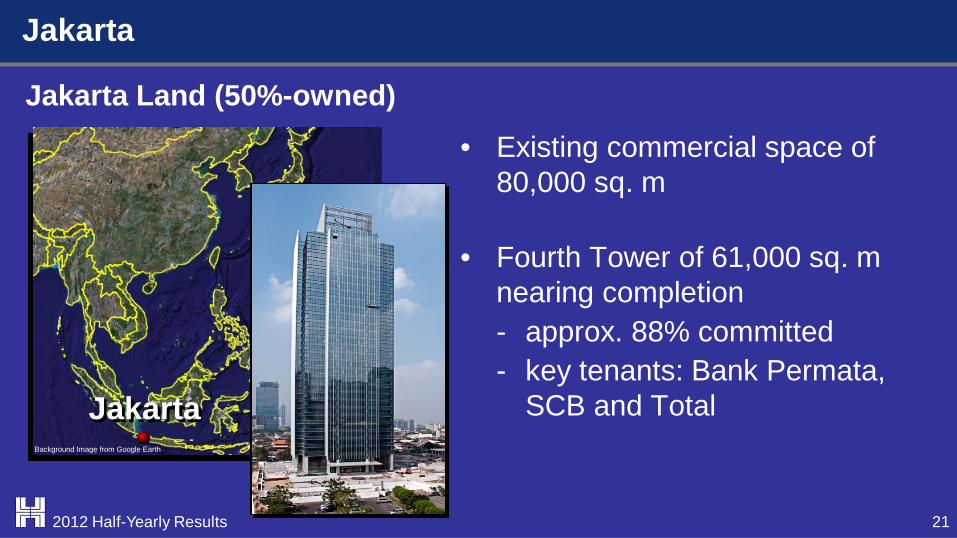
Jakarta Land (50%-owned)
Jakarta
Background Image from Google EarthBackground Image from Google Earth
Jakarta
• Existing commercial space of 80,000 sq. m
• Fourth Tower of 61,000 sq. m nearing completion
- approx. 88% committed - key tenants: Bank Permata,
SCB and Total
21 2012 Half-Yearly Results
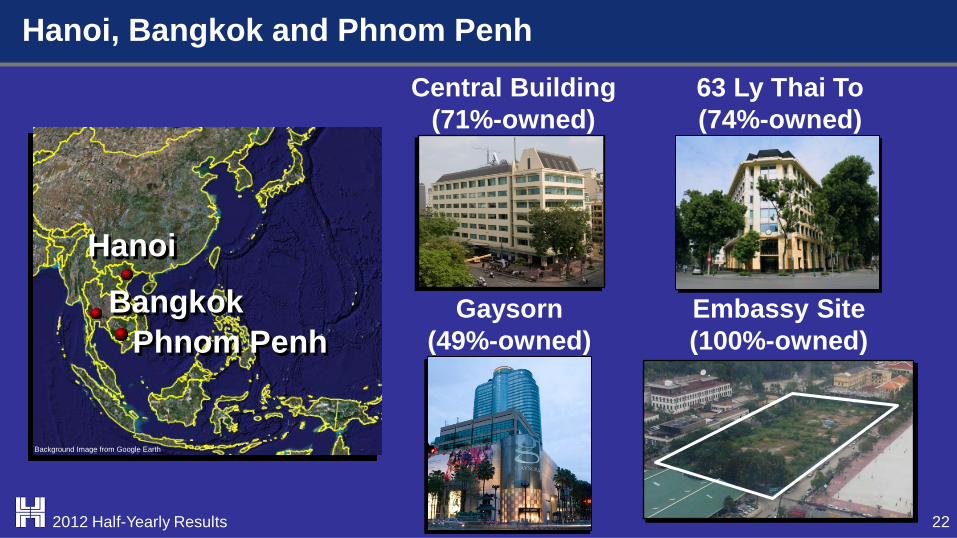
63 Ly Thai To (74%-owned)
Hanoi, Bangkok and Phnom Penh
22
Gaysorn (49%-owned)
Central Building (71%-owned)
2012 Half-Yearly Results
Background Image from Google EarthBackground Image from Google Earth
Hanoi
Bangkok Phnom Penh
Embassy Site (100%-owned)
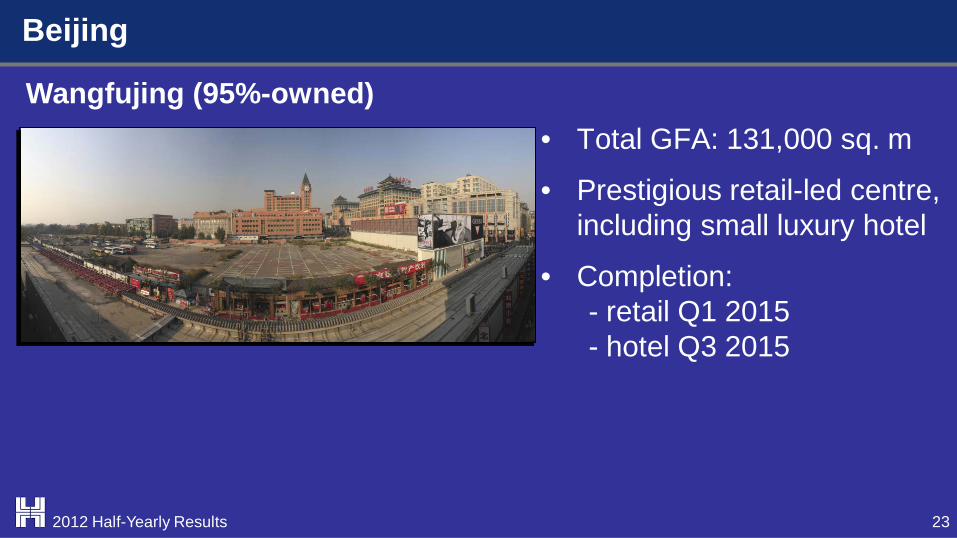
Beijing
23
• Total GFA: 131,000 sq. m
• Prestigious retail-led centre, including small luxury hotel
• Completion: - retail Q1 2015 - hotel Q3 2015
Wangfujing (95%-owned)
2012 Half-Yearly Results
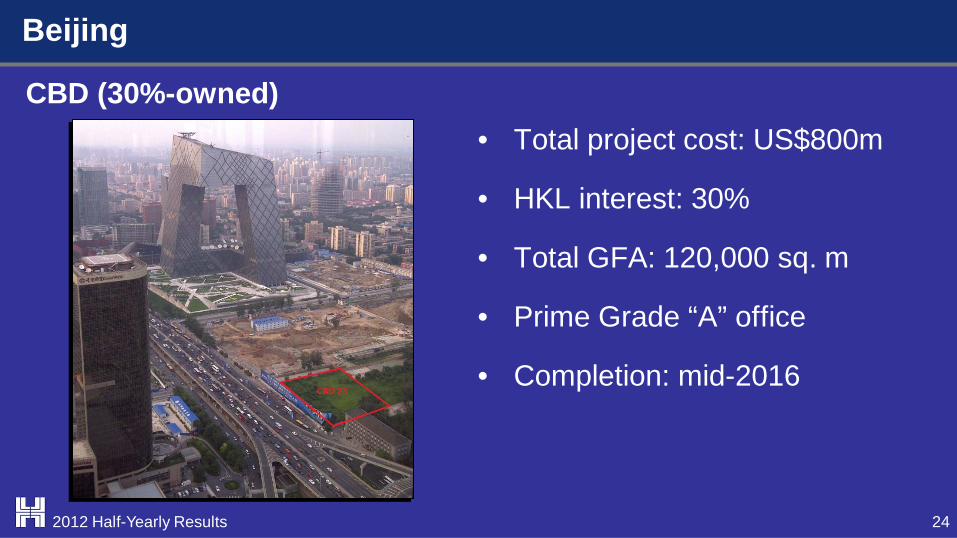
Beijing
24
• Total project cost: US$800m
• HKL interest: 30%
• Total GFA: 120,000 sq. m
• Prime Grade “A” office
• Completion: mid-2016
2012 Half-Yearly Results
CBD (30%-owned)
Residential Property
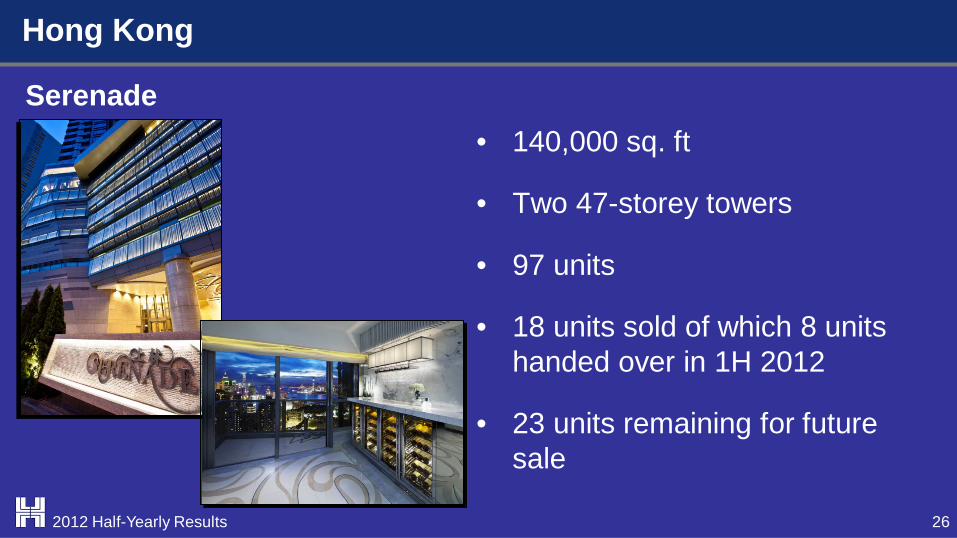
• 140,000 sq. ft
• Two 47-storey towers
• 97 units
• 18 units sold of which 8 units handed over in 1H 2012
• 23 units remaining for future sale
Serenade
26 2012 Half-Yearly Results
Hong Kong
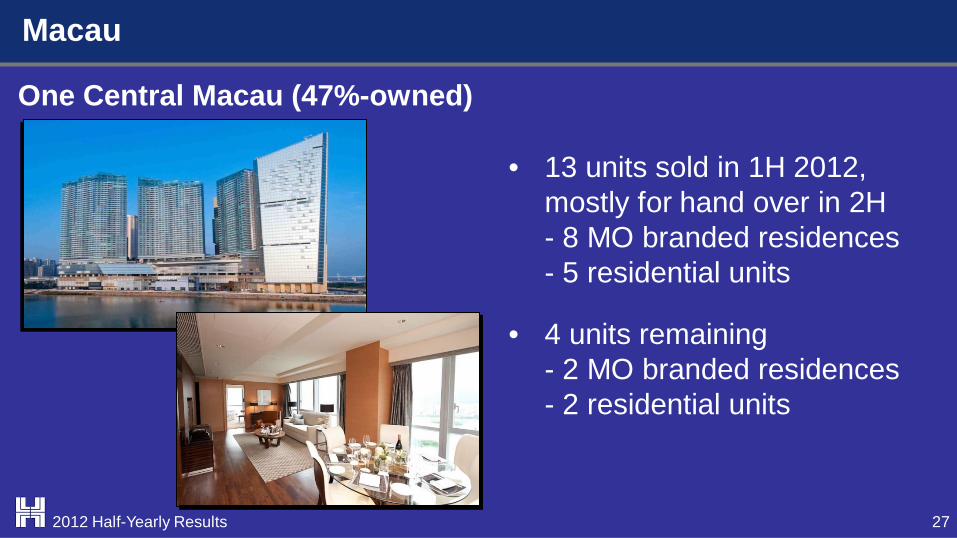
• 13 units sold in 1H 2012, mostly for hand over in 2H
- 8 MO branded residences - 5 residential units
• 4 units remaining - 2 MO branded residences - 2 residential units
One Central Macau (47%-owned)
Macau
27 2012 Half-Yearly Results
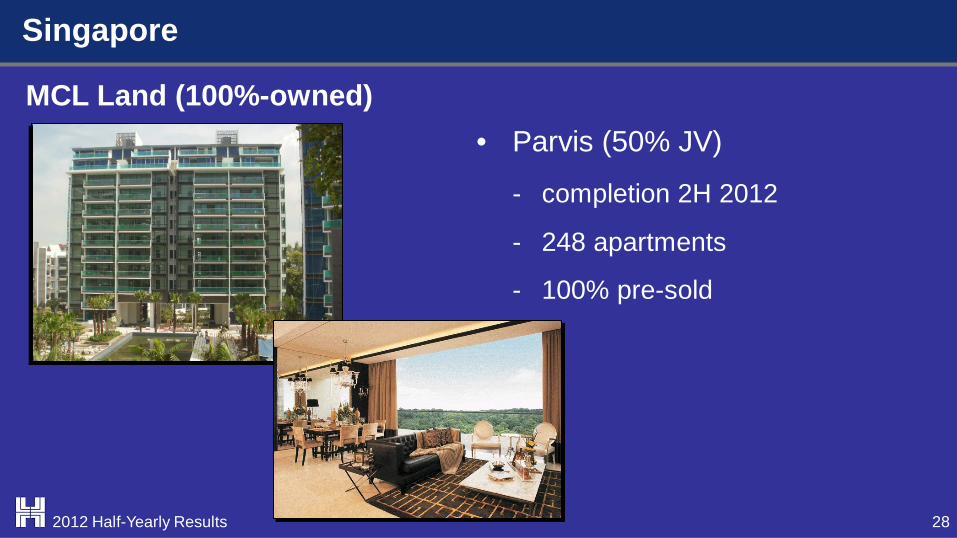
• Parvis (50% JV)
- completion 2H 2012
- 248 apartments
- 100% pre-sold
MCL Land (100%-owned)
Singapore
28 2012 Half-Yearly Results
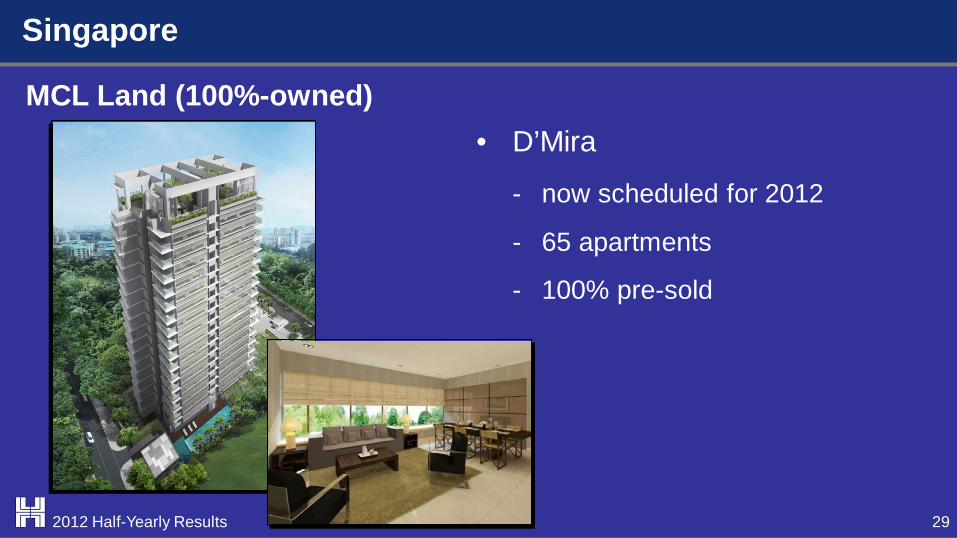
• D’Mira
- now scheduled for 2012
- 65 apartments
- 100% pre-sold
MCL Land (100%-owned)
Singapore
29 2012 Half-Yearly Results
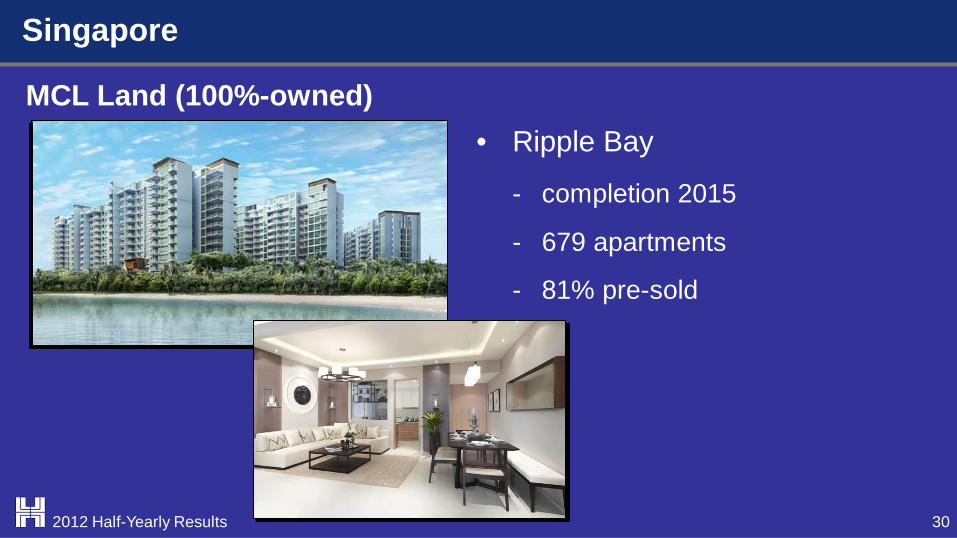
• Ripple Bay
- completion 2015
- 679 apartments
- 81% pre-sold
MCL Land (100%-owned)
Singapore
30 2012 Half-Yearly Results
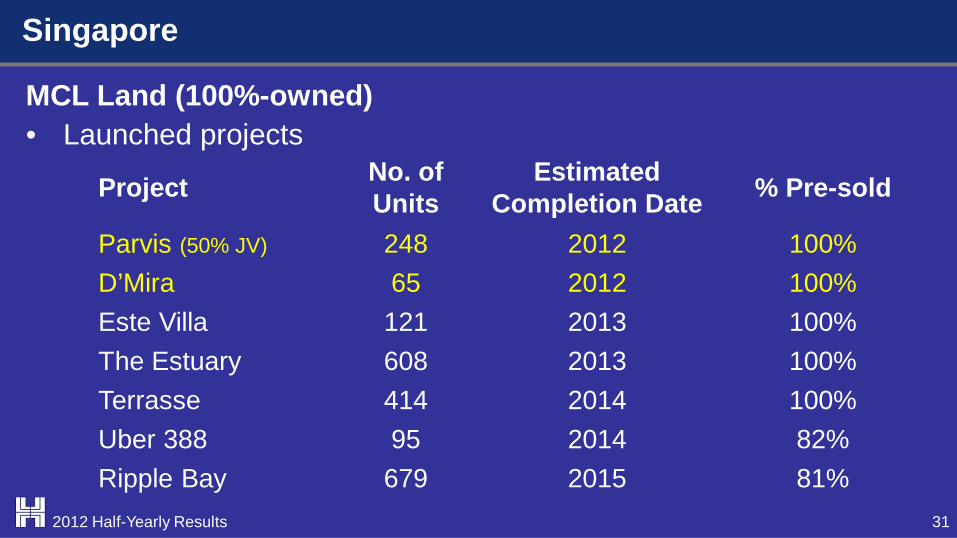
Singapore
Project No. of Units
Estimated Completion Date % Pre-sold
Parvis (50% JV) 248 2012 100% D’Mira 65 2012 100% Este Villa 121 2013 100% The Estuary 608 2013 100% Terrasse 414 2014 100% Uber 388 95 2014 82% Ripple Bay 679 2015 81%
• Launched projects
31
MCL Land (100%-owned)
2012 Half-Yearly Results
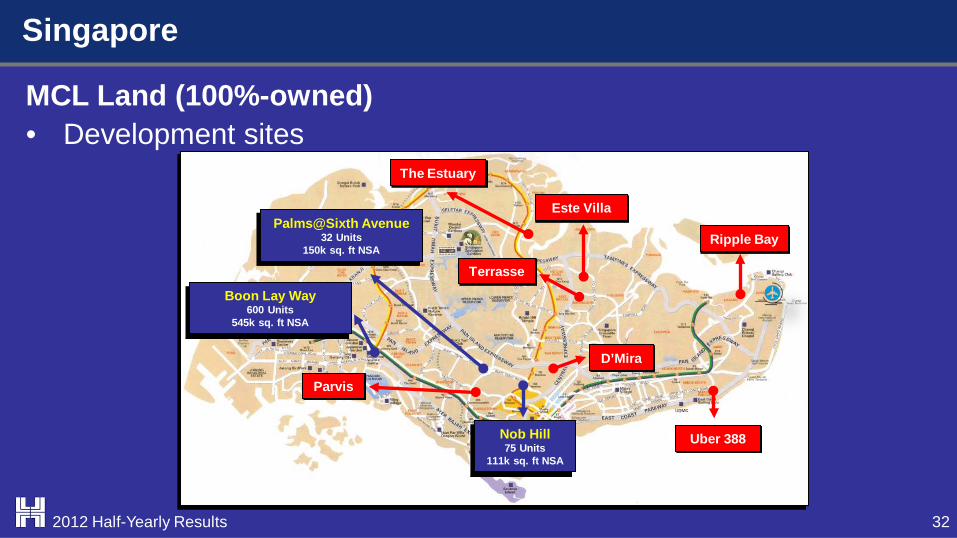
Singapore
• Development sites
32
MCL Land (100%-owned)
2012 Half-Yearly Results
Nob Hill 75 Units
111k sq. ft NSA
Palms@Sixth Avenue 32 Units
150k sq. ft NSA
Boon Lay Way 600 Units
545k sq. ft NSA
D’Mira
Uber 388
Este Villa
Parvis
The Estuary
Terrasse
Ripple Bay
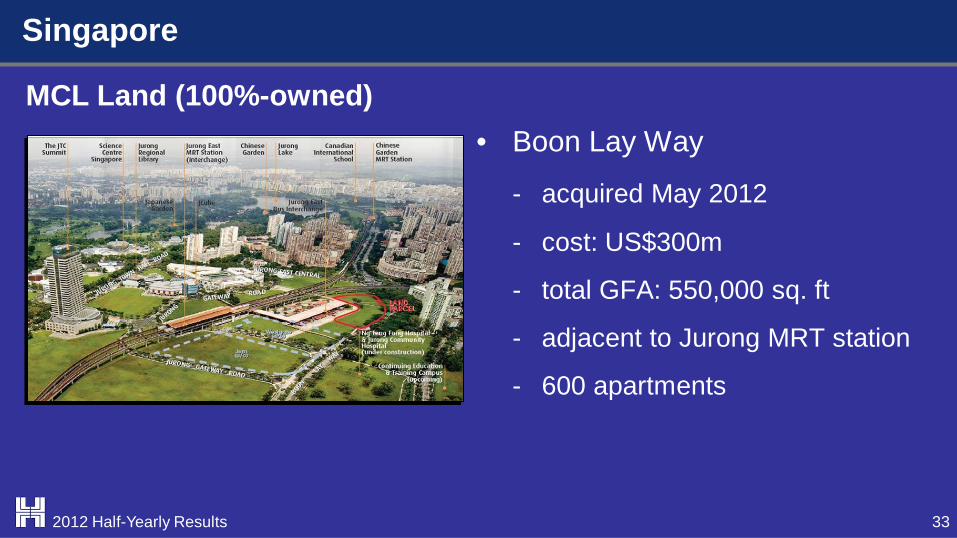
• Boon Lay Way
- acquired May 2012
- cost: US$300m
- total GFA: 550,000 sq. ft
- adjacent to Jurong MRT station
- 600 apartments
MCL Land (100%-owned)
Singapore
33 2012 Half-Yearly Results
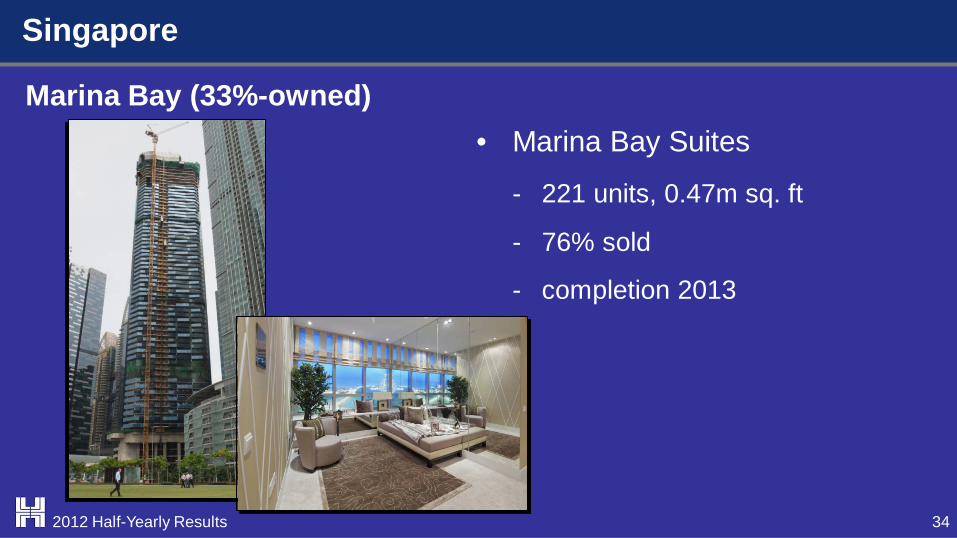
• Marina Bay Suites
- 221 units, 0.47m sq. ft
- 76% sold
- completion 2013
Marina Bay (33%-owned)
Singapore
34 2012 Half-Yearly Results
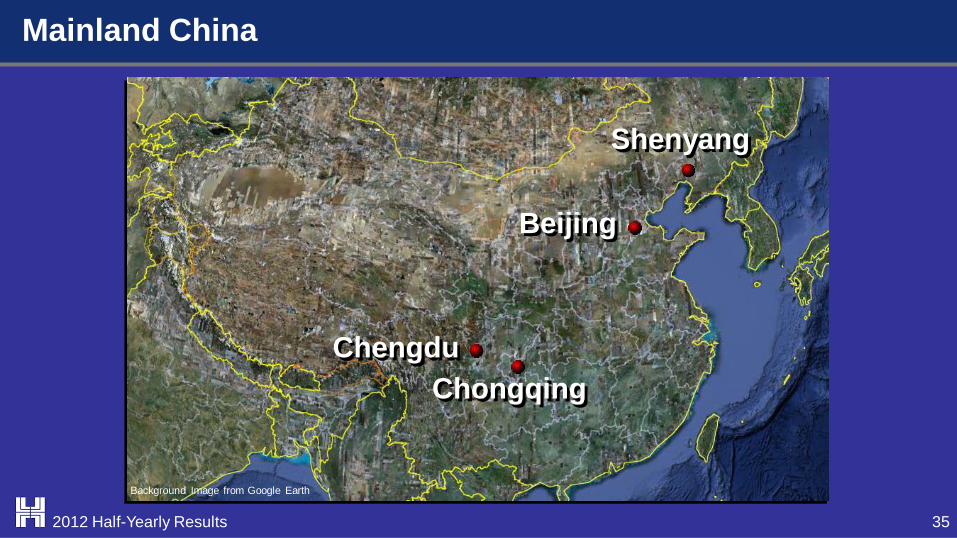
Mainland China
Shenyang
Beijing
Chongqing Chengdu
Background Image from Google Earth
35 2012 Half-Yearly Results
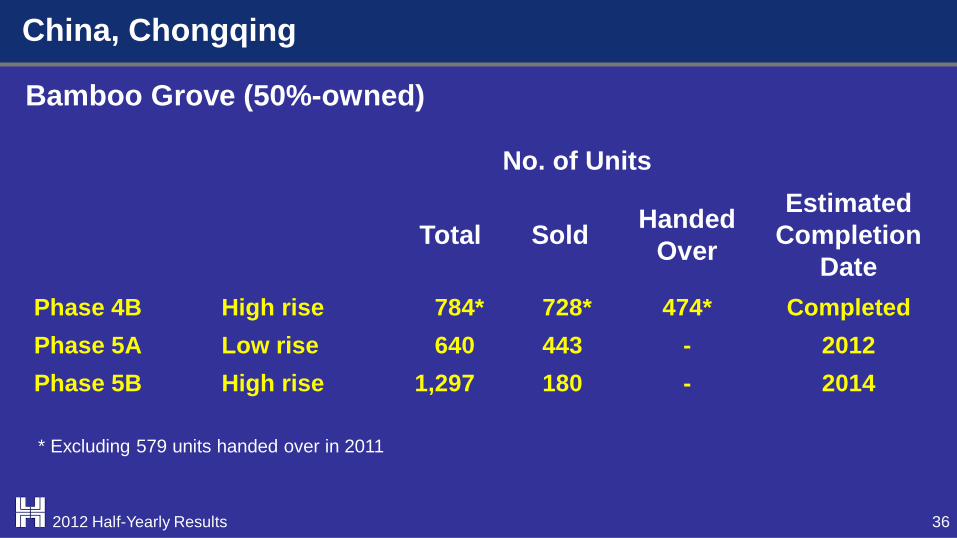
Bamboo Grove (50%-owned)
China, Chongqing
No. of Units
Total Sold Handed Over
Estimated Completion
Date Phase 4B High rise 784* 728* 474* Completed Phase 5A Low rise 640 443 - 2012 Phase 5B High rise 1,297 180 - 2014
36 2012 Half-Yearly Results
* Excluding 579 units handed over in 2011
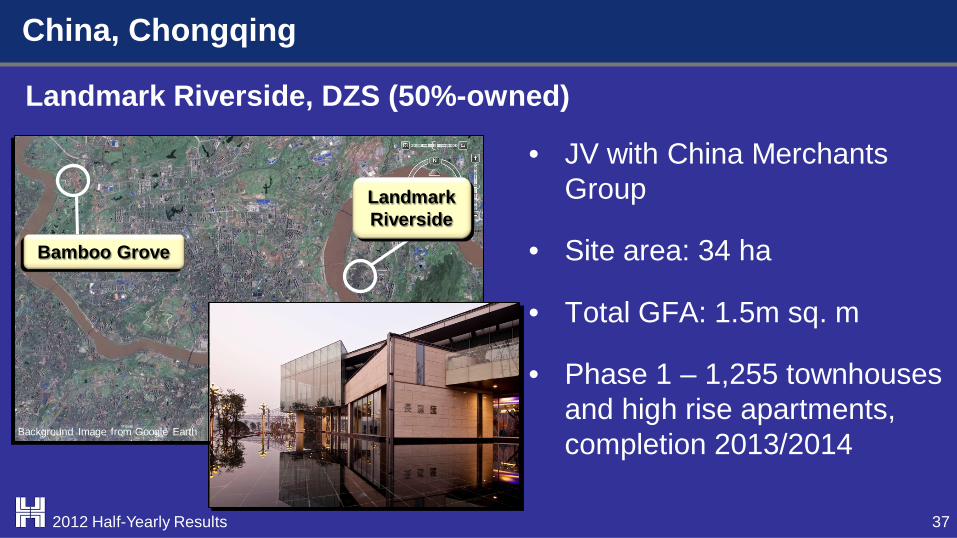
• JV with China Merchants Group
• Site area: 34 ha
• Total GFA: 1.5m sq. m
• Phase 1 – 1,255 townhouses and high rise apartments, completion 2013/2014
Landmark Riverside, DZS (50%-owned)
China, Chongqing
37
Background Image from Google Earth
Bamboo Grove
Jialing River
Landmark Riverside
2012 Half-Yearly Results
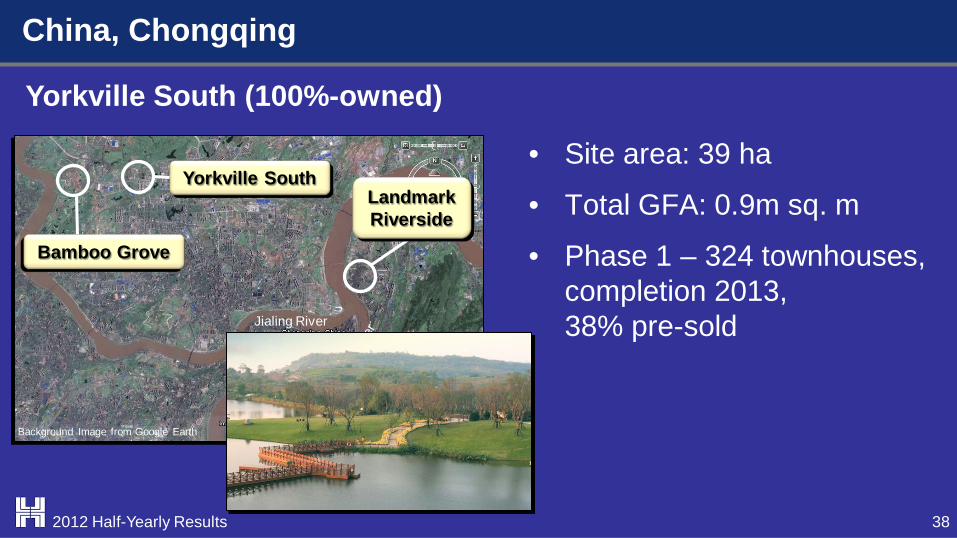
• Site area: 39 ha
• Total GFA: 0.9m sq. m
• Phase 1 – 324 townhouses, completion 2013,
38% pre-sold
Yorkville South (100%-owned)
China, Chongqing
38
Background Image from Google Earth
Bamboo Grove
Jialing River
Yorkville South Landmark Riverside
2012 Half-Yearly Results
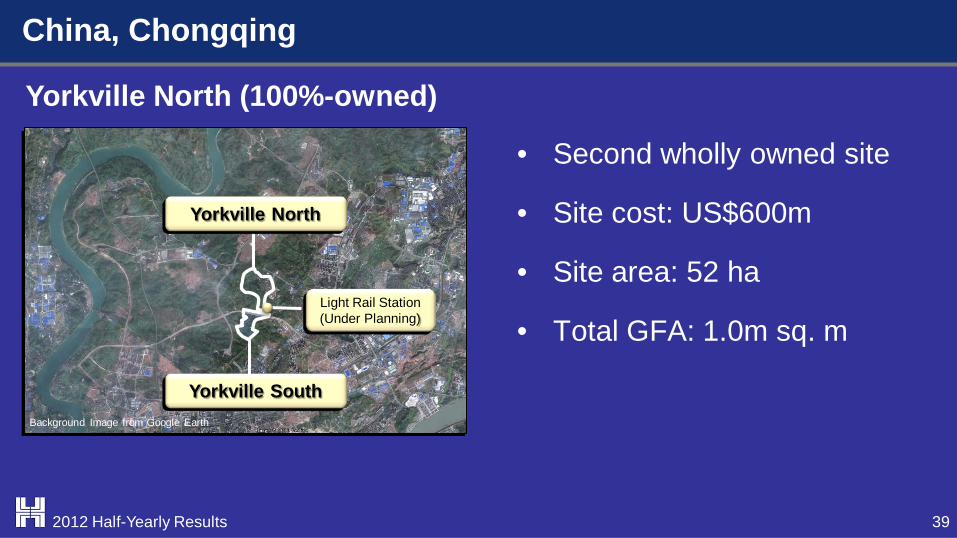
• Second wholly owned site
• Site cost: US$600m
• Site area: 52 ha
• Total GFA: 1.0m sq. m
Yorkville North (100%-owned)
China, Chongqing
39
Yorkville South
Yorkville North
Light Rail Station (Under Planning)
Background Image from Google Earth
2012 Half-Yearly Results
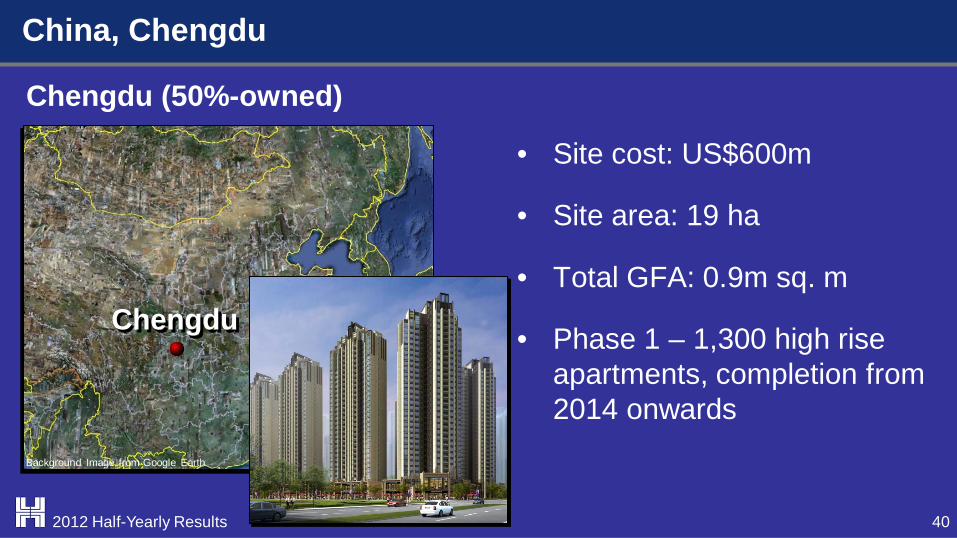
• Site cost: US$600m
• Site area: 19 ha
• Total GFA: 0.9m sq. m
• Phase 1 – 1,300 high rise apartments, completion from 2014 onwards
Chengdu (50%-owned)
China, Chengdu
Chengdu
Background Image from Google Earth
40 2012 Half-Yearly Results
China, Shenyang
41
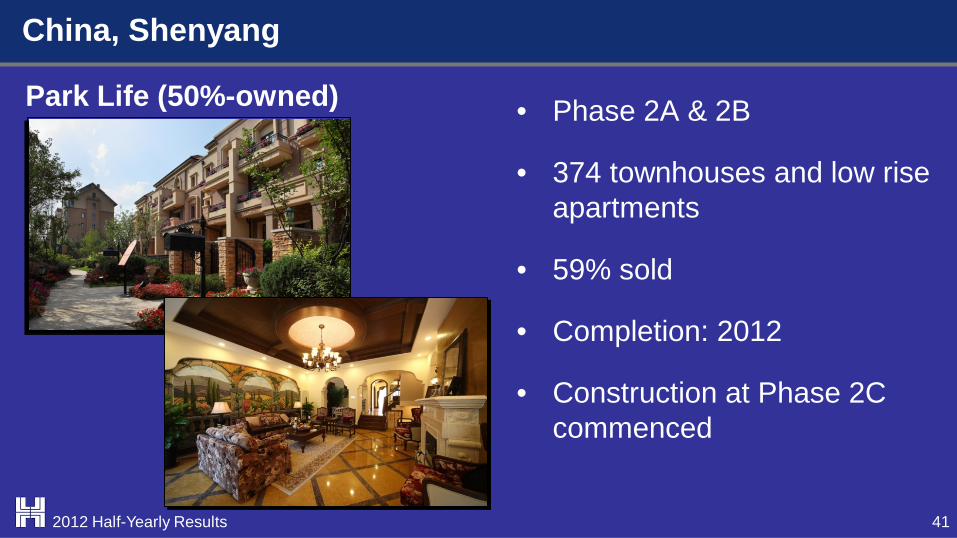
• Phase 2A & 2B
• 374 townhouses and low rise apartments
• 59% sold
• Completion: 2012
• Construction at Phase 2C commenced
Park Life (50%-owned)
2012 Half-Yearly Results
China, Shenyang
42
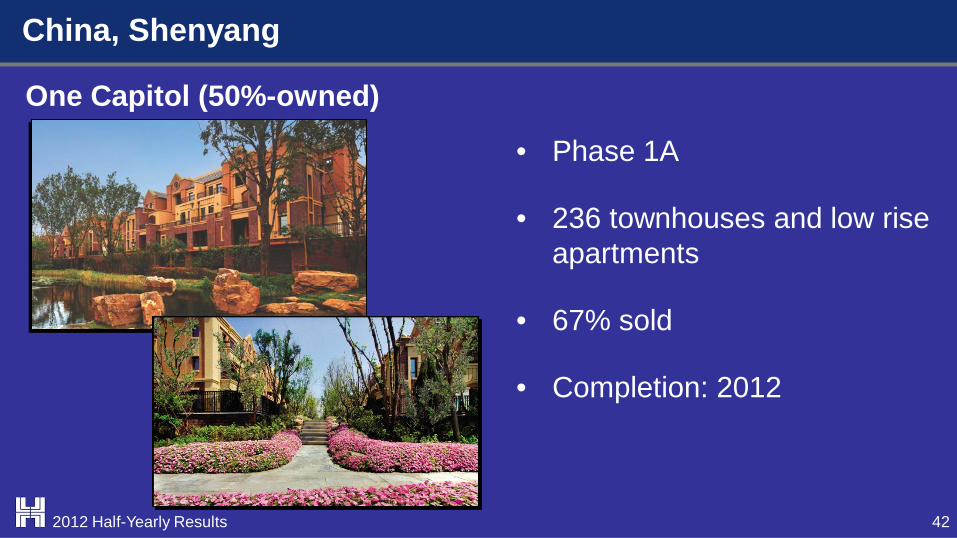
• Phase 1A
• 236 townhouses and low rise apartments
• 67% sold
• Completion: 2012
One Capitol (50%-owned)
2012 Half-Yearly Results
China, Shenyang
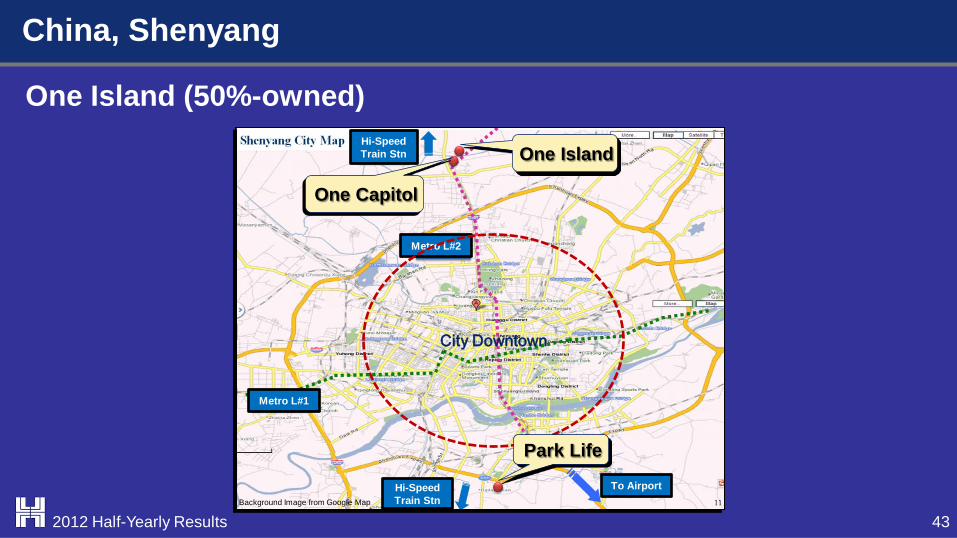
43
One Island
Background Image from Google Map
Hi-Speed Train Stn
One Capitol
Metro L#1
Hi-Speed Train Stn
To Airport
Metro L#2
City Downtown
Park Life
One Island (50%-owned)
2012 Half-Yearly Results
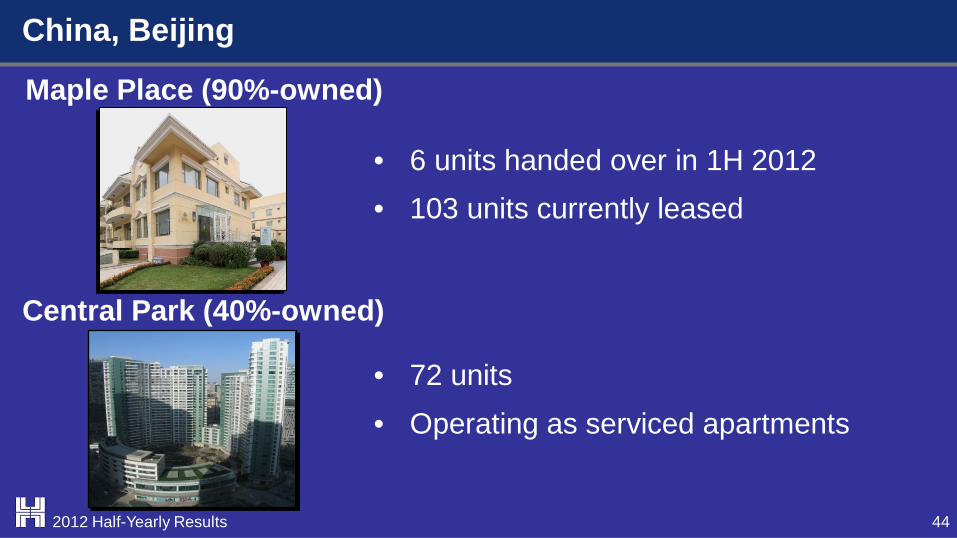
• 72 units • Operating as serviced apartments
• 6 units handed over in 1H 2012 • 103 units currently leased
Maple Place (90%-owned)
China, Beijing
Central Park (40%-owned)
44 2012 Half-Yearly Results
Results
1.
2011 Full Year
2012 Half-Year
2011 Half-Year
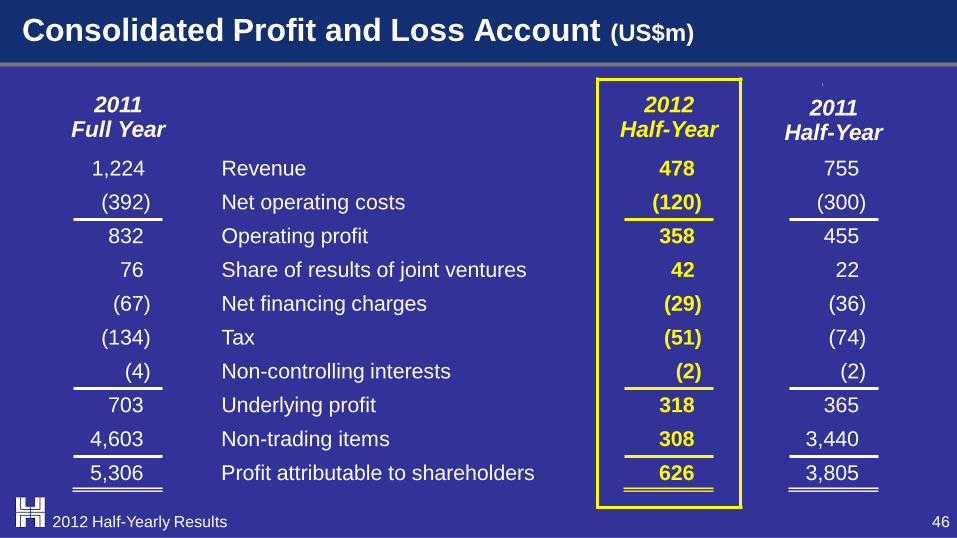
1,224 Revenue 478 755 (392) Net operating costs (120) (300) 832 Operating profit 358 455 76 Share of results of joint ventures 42 22 (67) Net financing charges (29) (36) (134) Tax (51) (74) (4) Non-controlling interests (2) (2) 703 Underlying profit 318 365 4,603 Non-trading items 308 3,440 5,306 Profit attributable to shareholders 626 3,805
46 2012 Half-Yearly Results
Consolidated Profit and Loss Account (US$m)
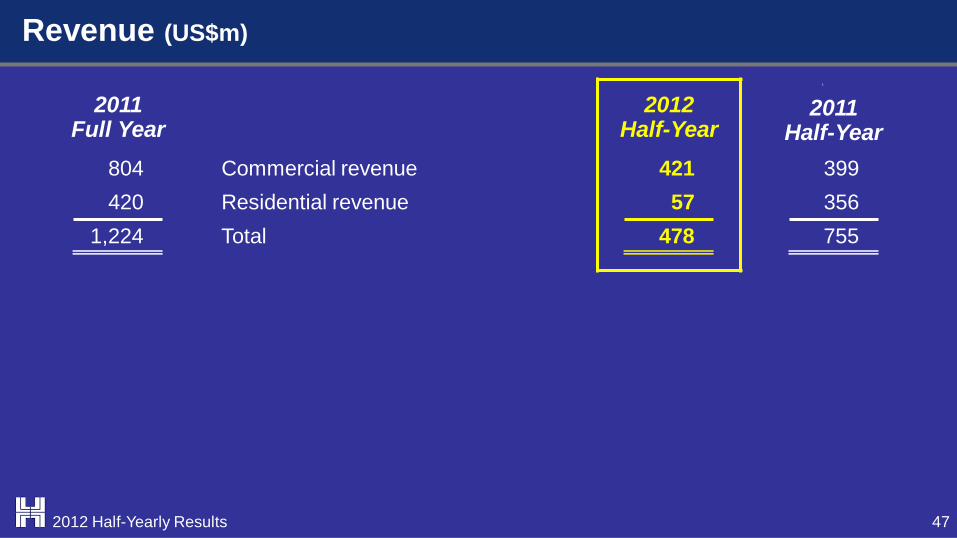
Revenue (US$m)
47 2012 Half-Yearly Results
1.
2011 Full Year
2012 Half-Year
2011 Half-Year
804 Commercial revenue 421 399 420 Residential revenue 57 356 1,224 Total 478 755
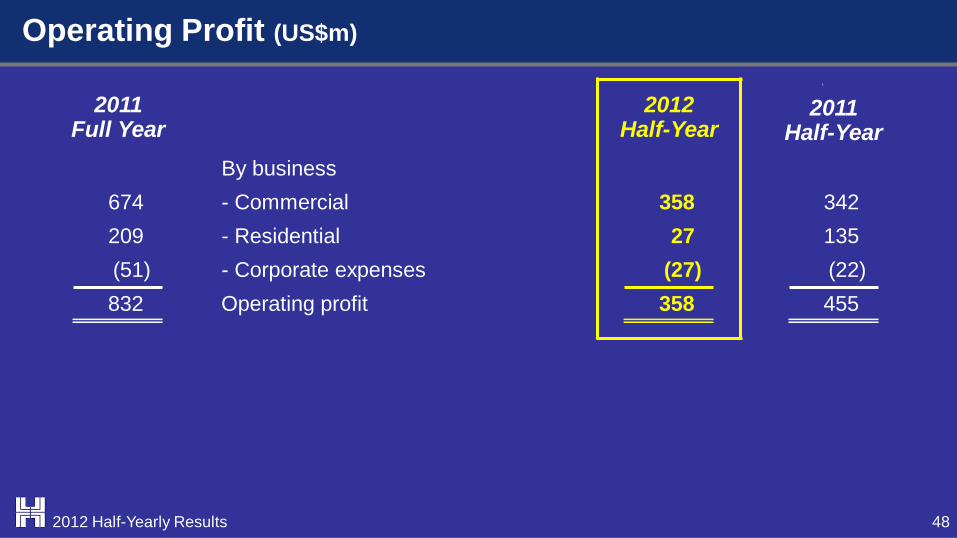
Operating Profit (US$m)
48 2012 Half-Yearly Results
1.
2011 Full Year
2012 Half-Year
2011 Half-Year
By business 674 - Commercial 358 342 209 - Residential 27 135 (51) - Corporate expenses (27) (22)
832 Operating profit 358 455
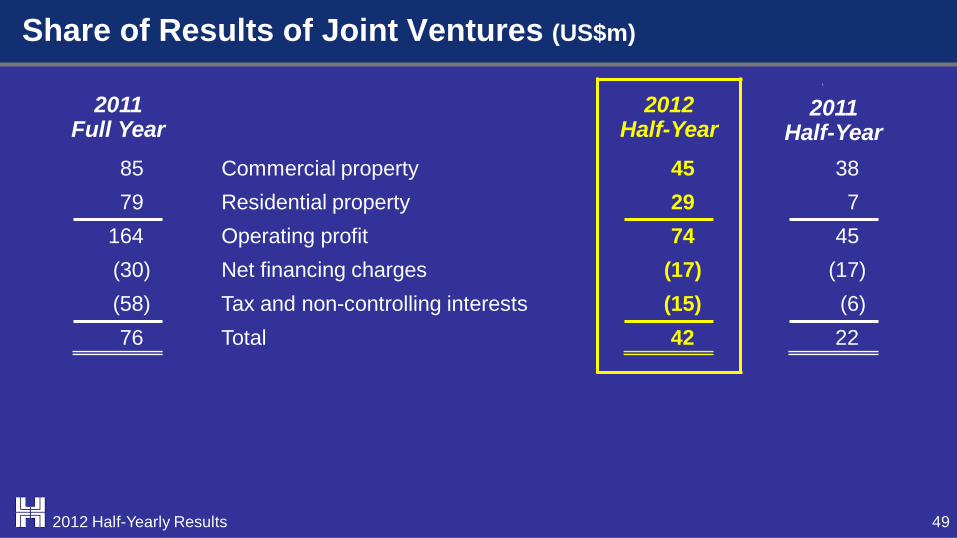
Share of Results of Joint Ventures (US$m)
49 2012 Half-Yearly Results
1.
2011 Full Year
2012 Half-Year
2011 Half-Year
85 Commercial property 45 38 79 Residential property 29 7 164 Operating profit 74 45 (30) Net financing charges (17) (17) (58) Tax and non-controlling interests (15) (6) 76 Total 42 22
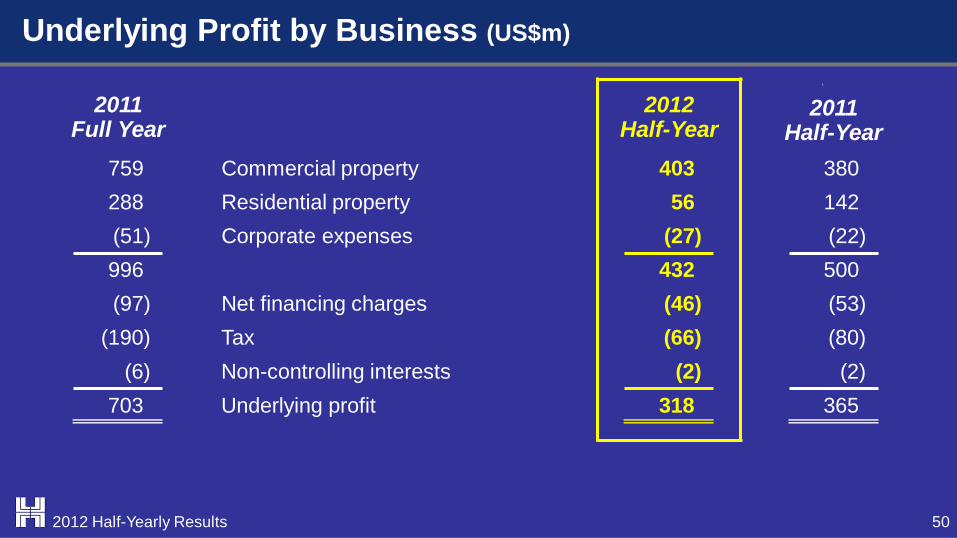
Underlying Profit by Business (US$m)
50 2012 Half-Yearly Results
1.
2011 Full Year
2012 Half-Year
2011 Half-Year
759 Commercial property 403 380 288 Residential property 56 142 (51) Corporate expenses (27) (22) 996 432 500 (97) Net financing charges (46) (53) (190) Tax (66) (80) (6) Non-controlling interests (2) (2) 703 Underlying profit 318 365
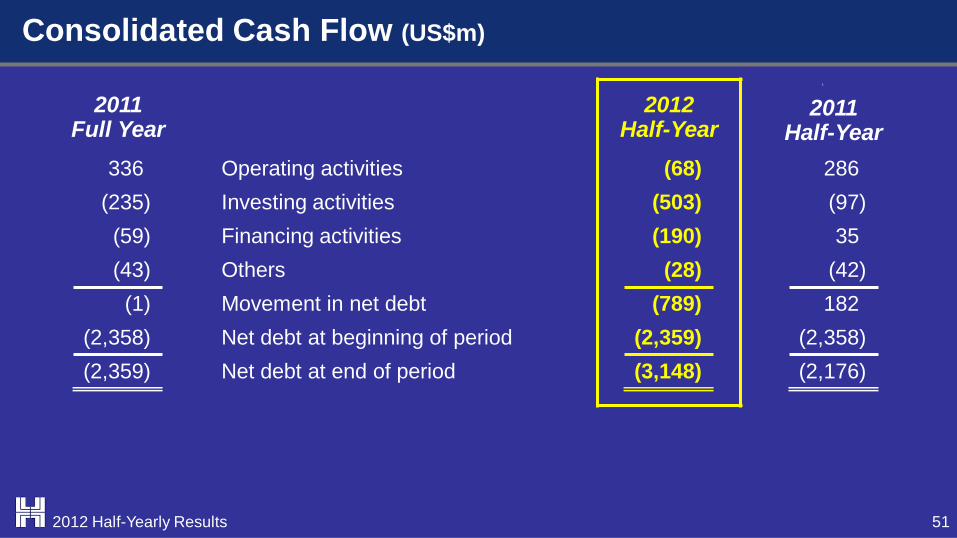
Consolidated Cash Flow (US$m)
51 2012 Half-Yearly Results
1.
2011 Full Year
2012 Half-Year
2011 Half-Year
336 Operating activities (68) 286 (235) Investing activities (503) (97) (59) Financing activities (190) 35 (43) Others (28) (42) (1) Movement in net debt (789) 182 (2,358) Net debt at beginning of period (2,359) (2,358) (2,359) Net debt at end of period (3,148) (2,176)
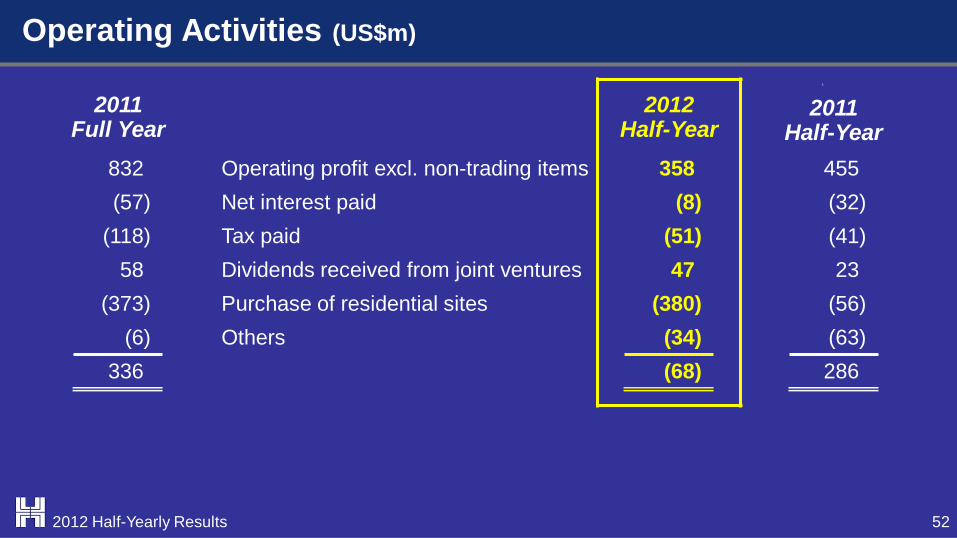
Operating Activities (US$m)
52 2012 Half-Yearly Results
1.
2011 Full Year
2012 Half-Year
2011 Half-Year
832 Operating profit excl. non-trading items 358 455 (57) Net interest paid (8) (32) (118) Tax paid (51) (41) 58 Dividends received from joint ventures 47 23 (373) Purchase of residential sites (380) (56) (6) Others (34) (63) 336 (68) 286
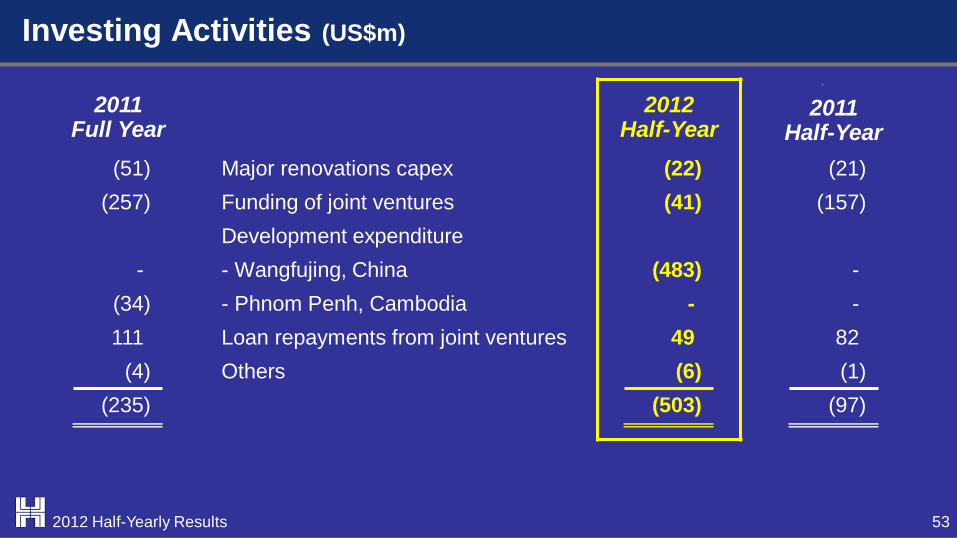
Investing Activities (US$m)
53 2012 Half-Yearly Results
1.
2011 Full Year
2012 Half-Year
2011 Half-Year
(51) Major renovations capex (22) (21) (257) Funding of joint ventures (41) (157) Development expenditure - - Wangfujing, China (483) - (34) - Phnom Penh, Cambodia - - 111 Loan repayments from joint ventures 49 82 (4) Others (6) (1) (235) (503) (97)
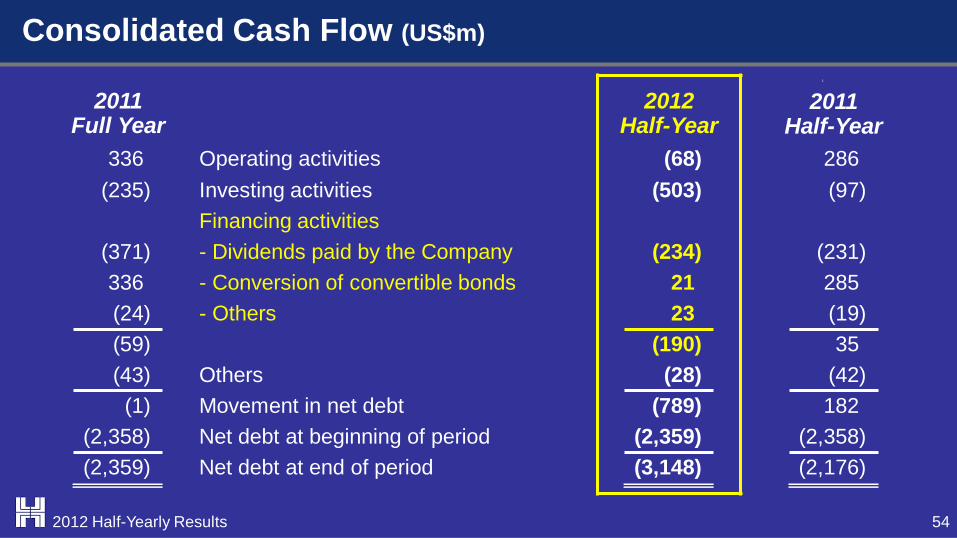
Consolidated Cash Flow (US$m)
54 2012 Half-Yearly Results
1.
2011 Full Year
2012 Half-Year
2011 Half-Year
336 Operating activities (68) 286 (235) Investing activities (503) (97) Financing activities (371) - Dividends paid by the Company (234) (231) 336 - Conversion of convertible bonds 21 285 (24) - Others 23 (19) (59) (190) 35 (43) Others (28) (42) (1) Movement in net debt (789) 182 (2,358) Net debt at beginning of period (2,359) (2,358) (2,359) Net debt at end of period (3,148) (2,176)

Consolidated Balance Sheet (US$m)
55 2012 Half-Yearly Results
2011 Full Year
2012 Half-Year
2011 Half-Year
Investment properties 22,623 - Subsidiaries 23,333 21,380 3,132 - Joint ventures 3,294 3,095 25,755 26,627 24,475 Properties held for sale 1,521 - Subsidiaries 1,910 1,085 1,007 - Joint ventures 1,108 781 2,528 3,018 1,866 (1,160) Others (1,221) (716) 27,123 Gross assets (excl. cash) 28,424 25,625
Financed by: 24,764 - Total equity 25,276 23,449 2,359 - Net debt 3,148 2,176 27,123 28,424 25,625
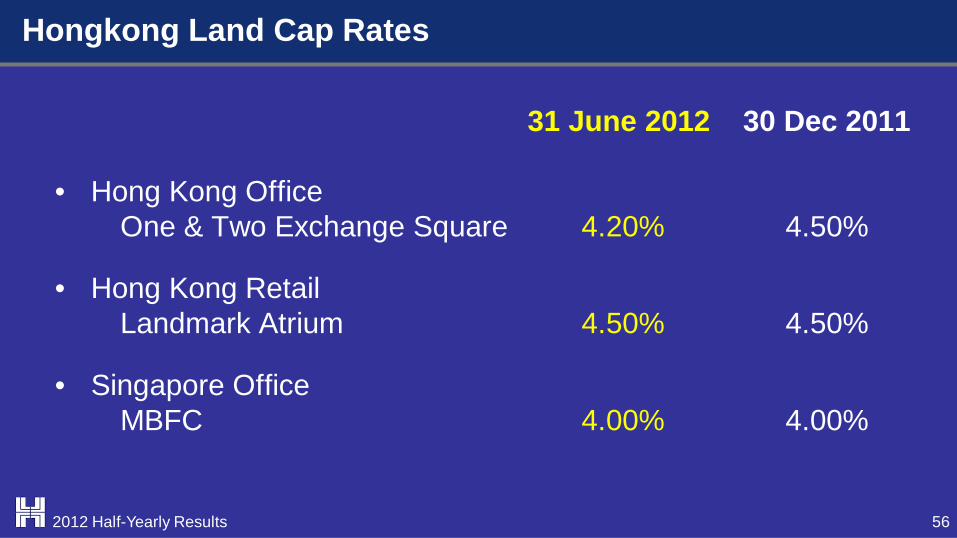
Hongkong Land Cap Rates
31 June 2012 30 Dec 2011
• Hong Kong Office One & Two Exchange Square 4.20% 4.50%
• Hong Kong Retail Landmark Atrium 4.50% 4.50%
• Singapore Office MBFC 4.00% 4.00%
56 2012 Half-Yearly Results
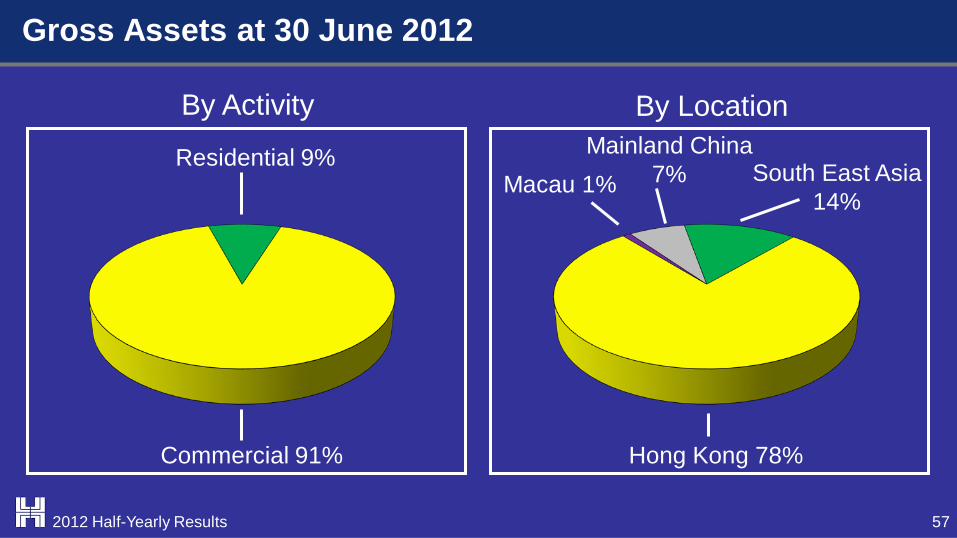
Residential 9%
By Activity
South East Asia 14%
Mainland China 7%
By Location
Commercial 91% Hong Kong 78%
Gross Assets at 30 June 2012
Macau 1%
57 2012 Half-Yearly Results
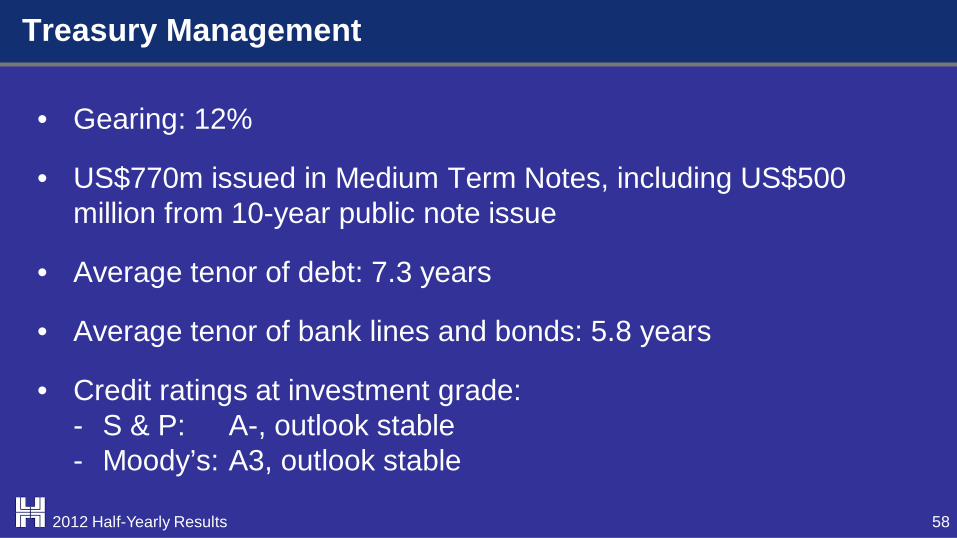
• Gearing: 12%
• US$770m issued in Medium Term Notes, including US$500 million from 10-year public note issue
• Average tenor of debt: 7.3 years
• Average tenor of bank lines and bonds: 5.8 years
• Credit ratings at investment grade: - S & P: A-, outlook stable - Moody’s: A3, outlook stable
Treasury Management
58 2012 Half-Yearly Results
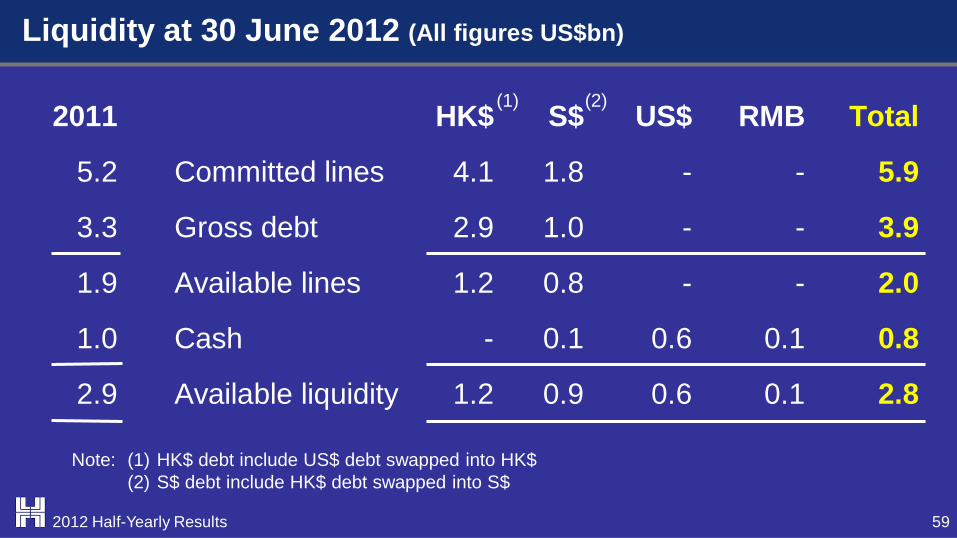
2011 HK$ S$ US$ RMB Total
5.2 Committed lines 4.1 1.8 - - 5.9
3.3 Gross debt 2.9 1.0 - - 3.9
1.9 Available lines 1.2 0.8 - - 2.0
1.0 Cash - 0.1 0.6 0.1 0.8
2.9 Available liquidity 1.2 0.9 0.6 0.1 2.8
Note: (1) HK$ debt include US$ debt swapped into HK$ (2) S$ debt include HK$ debt swapped into S$
Liquidity at 30 June 2012 (All figures US$bn)
(1) (2)
59 2012 Half-Yearly Results
Outlook
60
• Hong Kong portfolio well-positioned, with limited new supply
• 2nd half residential contribution will include profits from the completion of two projects in Singapore and from Serenade completions in Hong Kong
• Prime assets, market experience and strong balance sheet provide firm foundation
2012 Half-Yearly Results

2012 Half-Yearly Results


![RUNO Half Yearly Reporting TEMPLATE 4.3 [LIBERIA] PROJECT ...moj.gov.lr/data/uploads/downloads/half-year... · RUNO Half Yearly Reporting TEMPLATE 4.3 [LIBERIA] PROJECT HALF YEARLY](https://img.pdfslide.us/doc/110x75/5fb2e6765197404e462e00b5/runo-half-yearly-reporting-template-43-liberia-project-mojgovlrdatauploadsdownloadshalf-year.jpg)