Embed Size (px)
Citation preview


Letter from the Director of Research, Monitoring and Evaluation
Measuring program quality and impact
At Room to Read, our success in terms of project expansion and number of children served has been remarkable. Twelve years after setting up a single library in Nepal, we established 1,925 li-braries, published 167 original titles, constructed 437 classrooms and supported 17,741 girls—in 2012 and across ten countries. We are quickly approaching an amazing milestone of eight million children who have benefited from our work.
Our scale is impressive, but it is only through quality programs that we can bring benefits to the children we serve. Just con-sider the difference between a library, bright and brimming with age and level-appropriate books, and one that is inacces-sible, poorly constructed and supplied with books irrelevant to
a child’s needs, interests and reading level. Or consider the difference a well-trained Girls’ Education Social Mobilizer (field-based employee) can make in the life of a girl about to drop out of school when the mobilizer is well resourced to provide the mentorship and quality life skills education that girls need.
We take two approaches to assessing program quality. First, we monitor program delivery with an eye on all the key elements which are indicative of high quality. For example, we track whether training has been provided for our librarians. For the third year in a row, in 2012, more than 98 percent of the librarians at the libraries we supported received training. With our Girls’ Education program, we track parental engagement in each girl’s education, a key factor in her likelihood of educational success. As a measure of this engagement, 88 percent of Girls’ Education program participants were represented at parents’ meetings.
Second, we are increasingly focused on the outcomes of our work. For the first time in our history we are able to report the results of impact evaluations in our monitoring report. For the first time we are able to say – objectively, unequivocally – that our pro-grams are achieving the desired outcomes of improving reading skills and developing the habit of reading among children.
Here are a few of the outcomes we highlight in this year’s report:
• Evaluations in Laos, Bangladesh and Sri Lanka showed that after one year of participation in our Literacy reading skills pro-gram, grade one students read more words per minute than their peers in comparable schools where we were not working.
• Among the libraries receiving our Literacy program support, the average number of books checked out per student each year has steadily increased, from 3.3 in 2008 to 8.2 in 2012. This increase suggests that, on average, each individual student is using our libraries more.
• Of a sample of 785, 73 percent of former Girls’ Education program participants have gone on to pursue university or other tertiary education.
We look forward to continue sharing with you in future years our story of increased scale and quality, in how much we do and how we do it, and more importantly, the difference it makes for the children we serve.
Sincerely,
Dr. Matthew JukesGlobal Director, Research, Monitoring and EvaluationRoom to Read
Contents
Introduction
Highlights
Literacy
Gender Equality in Education
Literacy
Our Reach
Our Outcomes
Our Approach
Gender Equality in Education
Our Reach
Our Outcomes
Our Approach
Conclusion
Appendix I. Additional Indicators
Appendix II. About this Report
5
6
7
8
9
10
11
14
25
26
26
29
33
34
35

Figures
Tables
Textboxes
10
11
12
12
13
13
15
17
17
23
26
27
30
28
31
34
12
16
18
19
20
22
27
28
31
32
1. Cumulative Number of Schools Participating in Literacy Programming
2. Average Number of Books Checked Out per Student Each Year, 2009 to 2012
3. Average Words Read per Minute in Bangladesh
4. Average Words Read per Minute in India
5. Average Words Read per Minute in Laos
6. Average Words Read per Minute in Sri Lanka
7. Number of Book Publishing Authors and Illustrators Trained and Hired, 2010 to 2012
8. Cumulative Number of Original Children’s Books Distributed
9. Average Hours per Week Students Can Access Libraries in Schools Where We Work
10. Percentage of Infrastructure Projects Constructed with Community Co-investment
11. Cumulative Number of Girls’ Education Program Participants, 2001 to 2012 12. Cumulative Number of Secondary School Graduates, 2007 to 2012
13. Percentage of Girls’ Education Program Participants Receiving Life Skills Education
1. Girls’ Education: Retention, Advancement and Transition Rates
2. Girls’ Education: Types of Targeted Support
3. Indicators Not Reported in 2012 Global Monitoring Report
1. Measuring Our Impact through Research and Evaluation
2. Selection of Books We Published in 2012
3. Ensuring Effective Use of the Library Period
4. Teacher Professional Development Transforms Classroom in Rural Nepal
5. What is Repair and Renovation Work?
6. How Do We Engage with Families, Schools and Communities?
7. Meet Our First Zambian Graduates!
8. What is a “Gatekeeping” Exam?
9. Achieving Almost Universal Parent Engagement in Bangladesh
10. Piloting New Monitoring Indicators

South Africa
Zambia
Tanzania
India
Sri Lanka
Bangladesh
Cambodia
Vietnam
Nepal
Laos
Introduction
1 Room to Read. “Envisioning Our Future: A Roadmap for Learning.” http://www.roomtoread.org/document.doc?id=220. (2010).2 For more information about our research and evaluation activities, please visit our website at http://www.roomtoread.org/TrackingResults.
Since 2008, our annual Global Monitoring Report has helped us chart progress toward our goal of improving educational access and opportunity for 10 million children in Asia and Africa by 2015.1 This report focuses on key program outputs and outcomes in 2012 across the ten countries where we work. Taken together with our research and evaluation efforts, these statistics contrib-ute to a detailed story of our program activities, outcomes and long-term impact2. We share this story with our beneficiaries, donors and partners and the broader international education community.
5

Highlights
At Room to Read, we envision a world in which all children can pursue a quality education, reach their full potential and con-tribute to their community and the world. To achieve this goal, we focus on two areas where we believe we can have the great-est impact: literacy and gender equality in education.

Literacy
Our work in literacy dates from 2000, when we first brought books to a rural Nepali school library. Over the past 12 years, we learned that literacy goes far beyond libraries and have supported a total of more than 15,000 schools in ten countries.
Our Literacy program involves the integration of four previously standalone programs—School Libraries, Book Publishing, School Construction and Reading & Writing Instruction. Recognizing that these programs work together towards a greater, common goal, we have begun building an integrated program that develops a child’s reading habit and literacy skills.
Our work has resulted in an improvement in children’s reading habits. The average number of books each child checked out each year has steadily increased since we began tracking this indicator in 2009, from 3.3 in 2009 to 8.2 in 2012. This increase suggests that students are using the library more, which also suggests that their reading habits are developing.
In 2012, our activities resulted in:
• 167 original children’s titles published in 14 languages;
• 41,942 teachers, librarians and other school personnel receiving professional development to sup-port 5,833 libraries and 1,173 reading and writing classes;
• 437 new classrooms constructed and 21 repairs and renovations conducted in 208 schools;
• 100 percent community co-investment, such as labor, materials or cash, in infrastructure projects; and
• Key partnerships with the Ministries of Education in the countries where we work.
7
Gender Equality in Education
Launched in 2001, our Girls’ Education program supports girls to complete secondary school with the skills necessary to negotiate key life decisions. By the end of 2012, a total of 20,375 girls had benefited from our program. In 2012 alone, we supported 17,741 program participants.
Towards our goal of helping girls complete secondary school, our program has supported a cumulative number of 798 young women through graduation as of December 2012. We supported our largest cohort of graduates yet in 2012, with 289 young women across six countries finishing secondary school. And of the 785 graduates for which we have data, 73 percent have continued on to university or other tertiary education.
We achieve these results through integrated academic, material and socio-emotional support to help girls overcome the range of challenges they may encounter in completing their secondary school education.
In 2012, our activities resulted in:
• A continued increase in girls’ participation in life skills education, from 35 percent in 2008 to 86 percent in 2012;
• Continued high engagement with parents and guardians, with 88 percent of girls’ parents and/or guardians attending program meetings; and
• Targeted material, academic, and mentoring support to girls who were found to be at risk of dropout due to needs in one of those areas. Of all program participants in 2012, 65 percent received material support, 84 percent received academic support, and 43 percent received mentoring.

Literacy
We define an “independent reader” as a child who possesses both literacy skills and a habit of reading. We work towards helping children to read fluently and to consider reading exciting and fun.
9
Our Literacy program enables primary school children to become independent readers.

Our Reach 1,296,989
As Figure 1 shows below, since our inception in 2000, our Literacy programming has expanded from five schools in Nepal to over 15,000 schools across ten countries.
Figure 1.
2000 2001 2002 2003 2004 2005 2006 2007 2008 2009 2010 2011 2012
5 93 347 9341,508
2,6603,599
5,219
7,115
9,216
11,245
13,169
15,094
Cumulative Number of Schools Participating in Literacy Programming
children in 5,833 schools participated in the Literacy program in 2012.

Our Outcomes 9.7 millionbooks were checked out across the libraries in schools where we worked in 2012.
As Figure 2 shows below, the average number of books checked out each year has steadily increased since we began tracking this indicator, from 3.3 per student in 2009 to 8.2 per student in 2012. This increase suggests that students are using the library more, which also suggests that their reading habits are developing.
2009year
3.3books
2010
4.9
2011
6.7
2012
8.2
Figure 2. Average Number of Books Checked Out per Student Each Year, 2009 to 2012
11

Measuring Our Impact through Research and Evaluation
Textbox 1.
One important indicator of our Literacy program’s success is the impact we have on children’s reading. We have conducted evaluations to assess our impact on both of the two target outcomes: children’s reading skills and their habit of reading. Key to these evaluations is a comparison of our projects with control schools, which tells us whether or not improvements in children’s reading outcomes is attributable specifically to our work.
Our Impact on Children’s Reading SkillsIn 2012, we conducted evaluations to measure the impact of our Literacy program on reading skills in four countries. In Bangladesh, Laos and Sri Lanka, we evaluated our program in all schools where we were working; in India, we selected a sample of 64 schools from the total of 310 we supported in the 2011-12 school year. Our re-sults show that our Literacy program helps children read more fluently—more quickly and accurately than their peers in comparable schools. Reading fluency is essential for children to understand what they are reading.
The results presented below are not intended for cross-country comparison of program effectiveness. Differ-ences in fluency levels between countries can result from many factors, including language, home environment, context and program scale.
In Bangladesh and India, grade two students who have received two years of our program showed improve-ments in reading fluency (see Figures 3 and 4). In Bangladesh, on average, children at the end of grade two had almost reached our ambitious benchmark of reading at a rate of 60 words-per-minute, which would be consid-ered on-track in high-income countries. In India, the program impact did not emerge until grade two. In 2013
1 min1 min
Early Grade Reading Assessment Tool_Grade2_RTRBD
wk¶v_©x Kwc - wØZxq †kÖwY
PvU© -3
Mí cwo
GK e‡b wQj GK wmsn Avi GK fvjøyK| g½jev‡i GKwU Mv‡Qi wb‡P Zv‡`i †`Lv| Zviv wQj ¶yavZ©| cv‡kB GKwU g„Z nwiY c‡o wQj| `yÕR‡bB nwiYwU †L‡Z Pvw”Qj| ZvB Zv‡`i g‡a¨ SMov jvMj| ZLb Zv‡`i cvk w`‡q hvw”Qj GK aƒZ© †kqvj| my‡hvM ey‡S †kqvj nwiYwU wb‡q cvjvj| gvivgvwi Ki‡Z Ki‡Z Zviv K¬všÍ n‡q coj| †`L‡Z ‡cj `yó †kqvj nwiYwU wb‡q cvwj‡q‡Q|
Grade One
= Schools with Our Literacy Program
Grade Two Grade One Grade Two
= Comparison Schools
= Schools with Our Literacy Program
= Comparison Schools
Average Words Read per Minute - Bangladesh
Average Words Read per Minute - India
36.7
10.23.8 2.8
14.7
4.3
55.8
23.7
Figure 3. Figure 4.

Textbox 1. continued
and 2014, the India program will use these data to improve program design and delivery at scale. The program will emphasize all components of effective reading instruction, add more foundational instruction, increase the pace of instruction through letters and sounds to reach fluency targets by the end of grade two and con-duct continual reading assessments to provide teachers with feedback on the effectiveness of their instruc-tion.
In Laos and Sri Lanka, we saw promising results among grade one students (see Figures 5 and 6). (We will be collecting data on grade two students in 2013.) In Laos, children participating in our program improved their reading in the first year of school by 12 times as much as children in comparable government schools.
Our Impact on Children’s Habit of ReadingIn 2012, we completed data collection for a three-year external evaluation of our libraries’ impact on children’s reading habits in six countries: India, Laos, Nepal, South Africa, Sri Lanka and Zambia. Preliminary analysis indicates that our library program has a positive impact on children’s reading habits. Specifically, children at schools with a Room to Read library spend more time reading and are more likely to read for leisure at school and at home than peers at schools without a Room to Read library. We expect to issue a final report on our libraries’ impact on reading habits in 2014.
Evaluating Sustainability of School LibrariesIn addition to impact evaluations we also reported in 2012 on the sustainability of our libraries. We visited 517 libraries across Cambodia, Nepal and South Africa which had graduated from our support between 2003 and 2010. We found that 98 percent of the libraries visited were still functioning after our support had ended. In 2012 and 2013, we undertook a qualitative study of these libraries to better understand the factors which contribute to sustainability and expect to share a final report in 2014.
For More InformationTo learn more about our research and evaluation activities, please visit our website at http://www.roomtoread.org/TrackingResults.
Figure 5. Figure 6.
1 min1 min
Early Grade Reading Assessment Tool_Grade2_RTRBD
wk¶v_©x Kwc - wØZxq †kÖwY
PvU© -3
Mí cwo
GK e‡b wQj GK wmsn Avi GK fvjøyK| g½jev‡i GKwU Mv‡Qi wb‡P Zv‡`i †`Lv| Zviv wQj ¶yavZ©| cv‡kB GKwU g„Z nwiY c‡o wQj| `yÕR‡bB nwiYwU †L‡Z Pvw”Qj| ZvB Zv‡`i g‡a¨ SMov jvMj| ZLb Zv‡`i cvk w`‡q hvw”Qj GK aƒZ© †kqvj| my‡hvM ey‡S †kqvj nwiYwU wb‡q cvjvj| gvivgvwi Ki‡Z Ki‡Z Zviv K¬všÍ n‡q coj| †`L‡Z ‡cj `yó †kqvj nwiYwU wb‡q cvwj‡q‡Q|
Grade One Grade One
1.5
= Schools with Our Literacy Program
= Comparison Schools
= Schools with Our Literacy Program
= Comparison Schools
17.710.4
2.8
Average Words Read per Minute - Laos
Average Words Read per Minute - Sri Lanka
13

Our Approach
Our work in literacy dates from 2000, when we first brought books to a rural Nepali school library. Over the past 12 years, we learned that literacy goes far beyond libraries. Our Literacy program in-volves the integration of four previously standalone programs—School Libraries, Book Publishing, School Construction and Reading & Writing Instruction. Recognizing that these programs work together towards a greater, common goal, we have begun building an inte-grated program which develops a child’s habit and skill with reading.
We achieve our outcomes through five integrated activities:
1. Providing quality reading materials (previously implemented through our Book Publishing, School Libraries and Reading & Writing Instruction programs);
2. Supporting teacher professional development (previously implemented through our School Libraries and Reading & Writing Instruction programs);
3. Ensuring school infrastructure that is conducive to learning (previously implemented through our School Construction program);
4. Engaging with families, communities and schools (previously implemented across all four programs); and
5. Collaborating with governments, nongovernmental organizations and other key stakeholders (previously implemented across all four programs).

Providing Quality Reading Materials
We publish and provide access to high-quality, developmentally appropriate children’s reading and instructional materials in the local languages of the regions where we work.
Since we began producing children’s books in 2003, we have published 874 titles in 29 languages. Textbox 2 (next page) provides information about a selection of titles we published in 2012 across the ten countries where we work.
Our program emphasizes the development and recruitment of local talent to ensure culturally relevant mate-rial. Since we began reliably collecting these data in 2010, the number of authors and illustrators trained each year to create local language children’s titles has decreased from 371 in 2010 to 305 in 2012; the number of authors and illustrators hired, however has increased from 153 in 2010 to 245 in 2012 (Figure 7). These trends reflect our program’s increasing ability to source previously hired authors and illustrators for multiple titles, demonstrating the program’s success in expanding the pool of local talent.
2010 2011 2012
153182
245
Number of authors andillustrators trained
Number of authors andillustrators hired
371
318 305
Figure 7. Number of Book Publishing Authors and Illustrators Trained and Hired, 2010 to 2012
15
We published 167 original children’s titles in 14 languages in 2012.

Selection of Books We Published in 2012
Textbox 2.
Bangladesh South Africa
CambodiaSri Lanka
IndiaTanzania
LaosVietnam
Nepal Zambia
Ghost of the Tamarind Tree (Bengali)Shares the story of a girl facing her fear of ghost stories and allows beginning readers in grades 1 and 2 to practice decoding words.
The Rabbit’s Plan (Siswati)One of two 2012 titles that we pub-lished in Siswati, an underrepresented language in South African children’s literature.
Chek Chek Wants to Get Married (Khmer) Features unique clay illustrations, a re-sult of collaboration among four artists.
The Clever Tortoise (Tamil)A product of close collaboration between a Tamil author and Sinhalese illustrator that highlights themes of teamwork, friendship and curiosity.
The Squirrel and the Tree (Hindi)Designed to help beginning readers in grades 1 and 2 read on their own through rhymes and large, amply spaced text.
Musa’s Big Day (Kiswahili)Shares the story of a boy who over-comes a disability with hard work to win an athletic competition at school.
Little Caterpillar’s Lost Shoes (Lao)Developed to help teach the Lao lan-guage in the classroom, with rhymes and repetitive text.
The Squirrel’s Journey (Vietnamese)Depicts children in Vietnam’s rural northern mountains, where the pov-erty rates are highest in the country.
What Have I Learned? (Nepali)Features Mithila painting, a centuries-old traditional Nepali art form, to illustrate what a child has learned in one day.
Tama and her Grandmother (Chinyanja)Shares the story of a child growing up with a grandparent after the loss of her parents to AIDS—a real-life situation for many Zambian children.

As Figure 8 shows below, we have distributed almost 6 million copies of the books we published since we began tracking this indicator in 2008. We distribute our children’s books to schools where we work as well as to other organizations, such as public libraries, other nongovernmental organizations or schools where we are not working.
Cumulative Number of Original Children’s Books Distributed
Average Hours per Week Students Can Access Libraries in Schools Where We Work
Figure 8.
Figure 9.
2008
1,000,000
2,000,000
3,000,000
4,000,000
5,000,000
6,000,000
7,000,000
0
2009 2010 2011 2012
Books distributed to schools where Room to Read works
Books distributed to other organizations
2008 2009 2010 2011 2012
In 2012, we provided an average of eight books per student to libraries over the three years of our support, above our minimum standard of five books per student. In addition to publishing children’s books, we also develop materials which help children learn to read, such as workbooks, letter cards, picture cards and rhyme charts. In 2012, 86 percent of schools with our reading skills program also received materials that help chil-dren learn to read.
We work with schools to ensure that children have access to these materials by establishing a regular library period for each grade in each school’s timetable and identifying opportunities for children to access the library outside of the library period, such as during recess or before or after the school day.
As Figure 9 shows below, since we began tracking this indicator, the average amount of time children are able to access libraries in schools we support increased from 3.3 hours per week in 2010 to 4.5 hours per week in 2012.
2010 2011 2012
3.3 hrs 3.6 hrs 4.5 hrs
17

Ensuring Effective Use of the Library Period
Textbox 3.
In 2012, on average, schools held 1.3 hours per week for each grade’s library periods. Last year, we engaged with the teach-ers and librarians at the schools we support on ways to maximize the use of this limited time.
In 2012, we issued global guidelines on ensuring the best use of library and reading periods. After researching the best ways to promote a child’s habit of reading, we identified four key reading activities to promote during the library period:
We recommend extending these primary reading activities with book discussions, story charts and drama or role plays. These activities encourage children to develop a joy of reading and practice reading skills learned in the classroom. As chil-dren share a variety of books and engage in texts together, they are exposed to new themes or genres, develop a sense of story, increase comprehension and grow a sense of community within the library.
reading aloudshared readingpaired reading
independent reading
A teacher or librarian reads to all children in the class
All children in class read with the teacher or librarian
Children read in pairs
Each child in the library reads silently on his or her own

Supporting Teacher Professional Development
We support school personnel to manage a library, conduct reading activities and teach reading skills.
Of the 5,833 libraries we supported in 2012, 99 percent of library programs received personnel training. Our li-brary training is on average, about four-and-a-half days in length each year. The training and follow-up coach-ing have been successful in improving library management and activities. For example, in 2012, the libraries we supported implemented two key library management systems almost universally:
• 96 percent implemented book leveling systems, which allow children, teachers and parents to identify books appropriate for students’ reading levels.
• 99 percent implemented functional checkout systems, which allow children to borrow and take home books from the library.
As Textbox 4 illustrates, we also provided professional development for reading and writing instruction techniques across 1,173 classes in 599 schools. We provided both workshops and on-site coaching at least twice each year and support the use of evidence-based instructional routines and regular student assess-ments to inform and improve classroom instruction. Of the reading and writing classes we supported in 2012, 88 percent received on-site coaching. Reading and writing support is the newest component of our Literacy programming. As this component develops, we aim to provide on-site coaching universally across all reading and writing instructional classes we support.
Textbox 4.
Indra Bhandari is a third-grade teacher at Shree Krishna Nepal Rastriya Primary School in the small community of Pyuthan. She has introduced new activities into the classroom to create a more interactive and lively environment. One example is the pinwheel game, where children line up different letter combi-nations on a pinwheel to create a full word or sentence. She learned these new techniques during her in-service training with Room to Read. The training has led to a fundamental shift in Ms. Bhandari’s teaching methods, and in three short years she has already seen impressive results. “My students are actively participating in class now,” she says. “They are no longer passive listeners as before.”
Teacher Professional Development Transforms Classroom in Rural Nepal
19
41,942 teachers, librarians, and other school personnel attended workshops and training and received personalized on-site coaching to support 5,833 libraries and 1,173 reading and writing classes in 2012.

School Infrastructure Conducive to Learning
We build new classrooms and libraries and repair and renovate existing classrooms to meet the need for ad-equate learning environments for children.
In 2012, we constructed 437 new classrooms and conducted 21 repairs and renovations across 208 schools.
Textbox 5.
What is Repair and Renovation Work?
In 2012, we added repair and renovations to our infra-structure portfolio, which previously only consisted of the construction of new buildings. Our repair and renovation work improves the quality of existing classrooms to meet our standards for appropriate learning environments. Ex-amples of repair and renovation activities include roof and ceiling improvements, which reduce noise and heat in the classroom, and door and window improvements, which increase lighting and ventilation.
One example of our repair and renovation work is in Basegathi Government Primary School, located about four hours from the capital of Bangladesh. During our initial site survey, we found an overcrowded classroom block requiring repairs to the floor, roof, windows and ceiling. We partnered with the community, who contributed 23 percent of the project’s total cost, to repair the floors and plastering; to replace the roof, doors, windows and false ceiling; and to repaint the renovated building.
Above: Before repairs and renovations
Below: After repairs and renovations
We constructed 437 new classrooms and repaired and renovated 21 class-rooms in 208 schools in 2012.

Though our formal support to each infrastructure project ends after construction is completed, each year we conduct monitoring visits to all projects constructed in the previous three years. We monitor our previously completed projects to (1) identify and repair any projects with major structural damage and (2) learn more about the sustainability of our projects. For 2012 reporting, we visited 588 projects constructed in 2009, 2010 and 2011. Of these projects,
• 95 percent were still in use as classrooms or libraries,
• 19 percent showed no damage,
• 81 percent showed minimal, non-structural damage which would occur in the normal “wear-and-tear” of a building, and
• Two projects showed signs of major structural damage, which we are currently working with the communities to repair. We found that the sites were at risk of partial collapse if not repaired, although neither was at risk of immediate danger of collapse at the time of the visit.
Engaging with Families, Communities and Schools
We envision a school that, with the support of families and communities, takes full responsibility and account-ability for sustaining children’s reading habits and skills.
As Textbox 6 illustrates on the following page, we work collaboratively with families, communities and schools to support the development of literacy skills and the habit of reading in students because communi-ties are the most effective advocates for sustained literacy skills and reading habit.
21
100% of new infrastructure projects were completed with a signicant amount of community co-investment for the third year in a row.

Textbox 6.
Where we implement infrastructure projects, we also ask schools to create a School Construction Committee to oversee the community contribution to construction projects. We provide training to committee members on project and finan-cial management and construction monitoring. In 2012, we trained 4,271 School Construction Committee members across eight countries.
In some communities, we also ask the school to identify a community volunteer who is willing to mobilize the commu-nity around reading. The community volunteer visits the homes of parents and caregivers to practice ways to support children’s reading at home. The community volunteer also reminds community members of upcoming parents meetings and literacy events.
In some instances, we encourage the school to recruit one or more community volunteers to support the program and ultimately expand its impact. For example, our South Africa program encouraged Nkadimeng Primary School to recruit a volunteer librarian. The school found Mouma Mokubjane, a lifelong resident of the community (pictured above with two students). Her first task was to help teachers and students become acquainted with the new resources. In the beginning, she collected a set of books and brought them to each classroom to help the teacher understand how they could be used to enhance the existing curriculum. “Once they saw how helpful the books were,” she says, “teachers started bringing their classes to the library more and more.”
How Do We Engage with Families, Schools and Communities?
Family and community engagement activities take place over the life span of each project we support. Before we select a project site, we meet with parents, school and community leaders and other community members as appropriate to en-sure support and collaboration for our work. When we begin our support, we ask schools to create a Literacy Committee, or designate an existing committee, to be responsible for coordinating literacy activities in the school and community.

One measure of our engagement with families, communities and schools is the percentage of communities where we implement our infrastructure projects which contribute “community co-investment”—donations of labor, materials or cash that comprise at least 15 percent of the total project cost. As Figure 10 shows below, for the third year in a row, 100 percent of our infrastructure projects were constructed with community co-investment in 2012.
Percentage of Infrastructure Projects Constructed with Community Co-investment
Collaborating with Government, Nongovernmental Organizations and Other Key Stakeholders
We work with governments, nongovernmental organizations and other key stakeholders to share our best prac-tices and encourage ownership and sustainability of our principles and activities.
In 2012, we had a number of successes in partnering with government, nongovernmental organizations and other key stakeholders:
• In Zambia, we participated in the government’s National Literacy Steering Committee—a group of nongovernmental organizations which has a Memorandum of Understanding with the Ministry of Education to support educational goals, including literacy. Through this participation, we have made significant contributions to the development of a national literacy framework. Specifically, we provided technical support for the content and material aspects of effective literacy instruction for grades one to seven.
Figure 10.
0% 100%
2008 80%
89%2009
2010
2011
2012
100%
100%
100%
23

• In Laos, we provided input into the government’s Lao Education Sector Development Plan. The Min-istry of Education’s Research Institute of Educational Sciences has also assigned two staff to work with us on our program revisions in 2013.
• After seeing the impact of libraries under our support on students in government schools, Vietnam’s Ministry of Education adopted our practice of instituting a dedicated period for children to read during the school day. In addition to acting as an endorsement of our work, this decision extends benefits of our program to 92,120 students at 230 schools that have not received any direct support from us to date.

Gender Equality in Education
We focus on girls in, or transitioning to, secondary school because that is where the biggest, most persistent gaps in gender equality in education arise. We recognize that the challenges girls face with their education go beyond poverty, and we provide a package of academic, material and socio-emotional support tailored to each girl’s needs.
Our Girls’ Education program sup-ports girls to complete secondary school with the skills necessary to negotiate key life decisions.
25
Our Reach
Our Outcomes
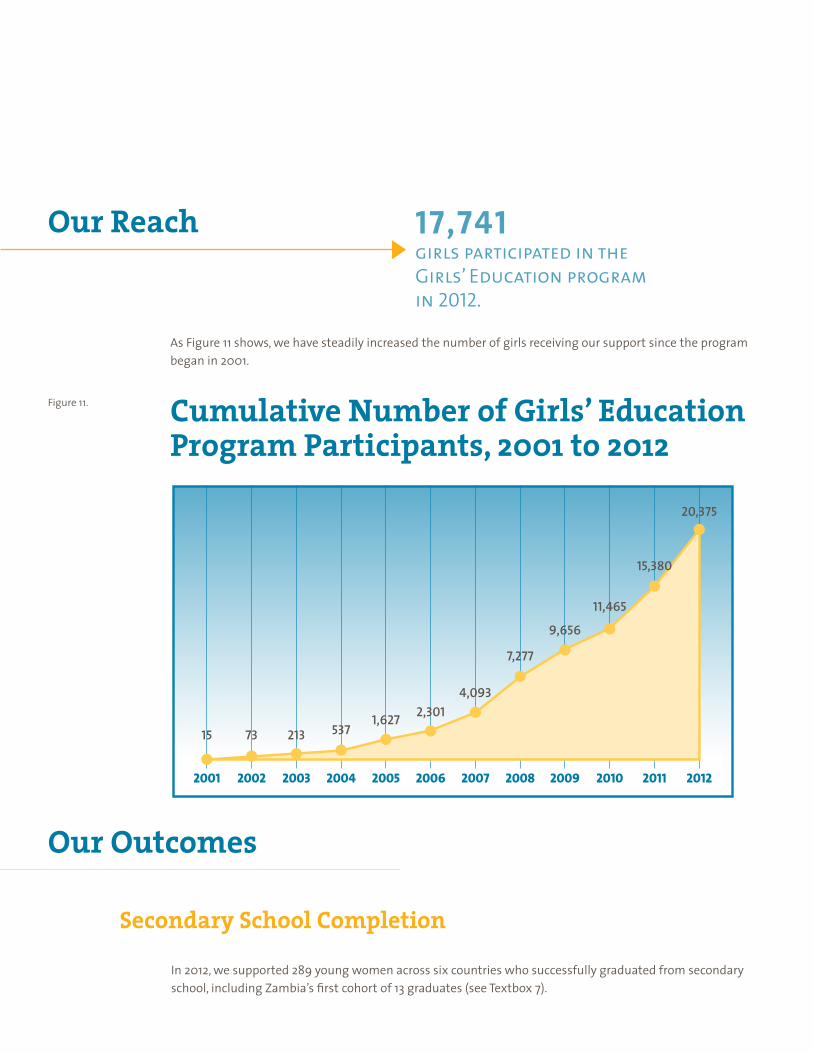
17,741girls participated in the Girls’ Education program in 2012.
As Figure 11 shows, we have steadily increased the number of girls receiving our support since the program began in 2001.
Cumulative Number of Girls’ Education Program Participants, 2001 to 2012
Secondary School Completion
In 2012, we supported 289 young women across six countries who successfully graduated from secondary school, including Zambia’s first cohort of 13 graduates (see Textbox 7).
Figure 11.
2001 2002 2003 2004 2005 2006 2007 2008 2009 2010 2011 2012
15 73 213 5371,627 2,301
4,093
7,277
9,656
11,465
15,380
20,375

Textbox 7.
Meet Our First Zambian Graduates!
Meet our first class of secondary school graduates from Zambia—and the first among our African countries! Our Zambia program began in 2008, with the oldest girls completing their fourth year of secondary school in 2012.
Our recent graduates celebrated their success with Makenzi, a Girls’ Education Program Associate. Makenzi joined Room to Read as a Social Mobilizer—a field-based employee who meets regularly with girls to connect them with the support they need through secondary school graduation. Promoted to Program Associate in 2012, Makenzi now trains other Social Mobilizers to support more girls through graduation.
As Figure 12 shows to the right, we have helped almost 800 girls com-plete secondary school since our first class of graduates in 2007.
We expect this indicator to increase in coming years, as a higher percent-age of the girls we support reach graduation age.
Figure 12.
2007200820092010
2011
2012
616
85
234
509
798
Cumulative Number of Secondary School Graduates, 2007 to 2012
27

Academic Progression
Three additional indicators—retention rate, advancement rate and transition rate—provide us with further information about our progress towards our goal of helping girls complete secondary school. Table 1 provides definitions and results for each of these indicators.
Program Retention Rate
Definition 2008 2010 2012
Advancement Rate
Transition Rate
Percentage of all participants staying in the Girls’ Education program.
97% 95% 94%
98% 97% 94%
98% 96% 85%
Percentage of all participants who successfully com-pleted one grade and advanced the following year.(Does not include dropouts, who are tracked separately.)
Percentage of all participants successfully transition-ing school levels (such as primary to lower secondary school or lower to upper secondary school.)(Does not include dropouts, who are tracked separately.)
Table 1. Girls’ Education: Retention, Advancement and Transition Rates
These three statistics have slightly decreased since we began tracking them consistently in 2008. As the average age of GEP participants increases, they face increasing challenges to staying and advancing in school, such as “gatekeeping” exams (see Textbox 8). We currently address these challenges with remedial tutoring and exami-nation preparation in the subjects where girls struggle. In 2013, we will begin to assess all program participants for academic need at least twice a year to identify those girls requiring support as early as possible.
A “gatekeeping” exam is a challenging national exam that students must pass to advance to the next school grade or level. For example, in Nepal, only 42 percent of students across the country passed the national grade 10 exam, which allows students to transition from secondary school to the Advanced level. Similarly, in Zambia, only about one third of all students passed the national grade nine exam, which allows students to transition from lower to upper secondary school. We support girls to tackle the challenges they face with these exams due to gaps in basic skills, such as literacy. In many countries, students advance automatically from one grade to the next, despite poor literacy levels, until they encounter the “gatekeeping” exam.
Textbox 8.
What is a “Gatekeeping” Exam?

The program retention and advancement rates were above or on par with national advancement rates in most cases. In contrast, transition rates were below national averages. In some cases, national rates may not be accurate comparisons for our program. We work in areas with demonstrated socioeconomic disadvantage and gender disparity, inequity and inequality, whereas national rates include regions of all socioeconomic status. Nevertheless, this is an area for continued focus and improvement over time.
Transitions to Tertiary Education
Though we end our formal support to each girl after she completes her secondary school education, we stay in touch with our program alumnae to (1) learn how schooling has contributed to their lives and (2) inspire the girls who we are currently helping to meet their goal of completing secondary school. Of the 785 alum-nae for which we have data, 73 percent have pursued university or other tertiary education. This figure is far above the graduation rates in many of our countries. For example, in Bangladesh, the nationwide secondary school graduation rate was 39 percent in 2011.3 In Zambia, the nationwide secondary school graduation rate was 21 percent in 2008.4
We work toward our goal—a girl’s completion of secondary school with the skills needed to negotiate key life decisions—through a multifaceted approach, combining life skills education, parental engagement activities and targeted academic, material and mentoring support.
We provide girls with life skills education to help them realize the full benefits of formal education and allow her to develop the skills she needs to succeed in school and after graduation.
Life skills education includes camps, workshops and experiential training on topics such as self-awareness and empathy, communication and interpersonal skills, decision-making and problem-solving, critical and creative thinking, and coping with stress and emotions. As Figure 13 shows, the percentage of girls receiving life skills education has steadily increased since we began tracking this indicator in 2008.
3 “South Asia Regional Brief.” http://www.worldbank.org/en/news/feature/2013/04/17/south-asia-regional-brief. Accessed August 15, 2013.4 International Labour Office (2012). “Decent Work Country Profile: Zambia.” http://www.ilo.org/public/english/region/afpro/lusaka/download/home/zd-wcp2013.pdf. p. 5.
Our Approach
Providing Life Skills Education
29

Percentage of Girls’ Education Program Participants Receiving Life Skills Education
Engaging Parents and Guardians
Parents’ and guardians’ engagement in their daughters’ education is essential for program sustainability and larger program transformation.
One way our Girls’ Education program seeks to engage parents is through parents’ meetings, which allow parents and guardians the opportunity to learn from each other in supporting their daughters. Since we be-gan tracking this indicator in 2008, the percentage of parents and guardians attending parents’ meetings has remained consistently high, hovering between 86 and 91 percent each year.
Figure 13.
2008 2009 2010 2011 2012
35%
50%
62%
74%
86%
88% of Girls’ Education program participants’ parents and guardians attended parents’ meetings in 2012.

Almost all (97 percent) of the girls participating in our Bangladesh program had at least one parent or guardian attend parents’ meetings in 2012. The program focuses on running well-planned meetings and scheduling them when parents and guard-ians could most likely attend. In addition, the program created a special manual, shown to the right, with guidelines on effective facilitation and topics to cover during the meeting. The team also conducts home visits and provides opportunities for parents to volunteer at program events.
Textbox 9.
Achieving Almost Universal Parent Engagement in Bangladesh 2012
Room to Read Bangladesh
7/19/2012
Parenting Session Module Part-1
Developed By:
Farida Akhater
Chief Excuative-Inner Force
Translated By:
Md. Tajul Islam Chowdhary
Targeting Material, Academic and Mentoring Support
We recognize that each girl has her own challenges to education and we tailor the support we provide to her needs.
We assess each girl for material, academic and mentoring needs that place her at risk of dropping out of school and target both our support and level of support as appropriate. For example, a girl whose family has few resources but is performing well academically may receive material support but not academic support. Table 2 below provides definitions for these different types of support.
Material Support
Definition How need is determined % of girls receivingsupport
Academic Support
Mentoring
Coverage of school-related and non-school-related costs. School-related costs include school and exam fees or the costs of textbooks, school supplies, and uniforms. Non-school-related costs include board-ing fees, feminine hygiene products or transporta-tion costs, such as bicycles or bus fare.
Need is determined in collaboration with local partners according to locally developed standards. Reassessed on an annual basis.
65%
Need is determined in collaboration with the school through regular academic assessments and exams.
84%
Need is determined through observation and continuous interaction among girls, teachers and field staff. Assessed on an ongoing basis.
43%
Supplementary tutoring, remedial support, and/or exam preparation.
Formal support and guidance provided to girls dur-ing a critical time in their emotional development.
Table 2. Girls’ Education: Types of Targeted Support
31

Textbox 10.
One step toward continually improving the quality of our monitoring is designing and evaluating new indicators. In 2012, we began to build more sophisticated indicators that go beyond measuring outputs. We experimented with three new indicators to examine the outcomes of our targeted support for girls who joined our Girls’ Educa-tion program since 2011:
• Percentage of girls receiving academic support who advanced in school• Percentage of girls receiving material support who stayed in school• Percentage of girls receiving mentoring who stayed in school
Academic, material and mentoring supports are targeted to girls who have been assessed and found to be at risk of dropping out due to academic failure, material need or other challenges.
We found that:
• Among those targeted for academic support, 96 percent advanced one or more grades.• Among those targeted for material support, 100 percent stayed in school.• Among those targeted for mentoring, 100 percent stayed in school.
Given that the girls targeted for need-based support are at highest risk for dropout, these early results appear promising. We recognize, however, that these indicators present an incomplete picture of the success of our targeted support. First, these girls joined the program at the beginning of secondary school. These statistics may decrease as girls advance in their academic careers and encounter more challenges to staying in school. Second, it is unclear whether our support led to these high results or whether we targeted our support toward girls who were likely to advance or stay in school. For these reasons, we will continue to monitor the information provided by these indicators in future years.
Piloting New Monitoring Indicators

Conclusion
Twelve years ago, we began with a simple desire to bring books to the children of Nepal. Today, we are a global organization, working in ten countries in Asia and Africa, that helps millions of children in the developing world gain access to quality education.
We would not have been able to make such progress in our reach, results and approach without being a “learning organization.” This monitoring report is an important step in our learning process. Each year, the data we collect help us identify what we are doing well and what can be improved. We use this feedback to advance the next year’s programming in both scale and quality. And each year, we share this information with external audiences to be transparent about our work and accountable to our beneficiaries, donors and other key stakeholders.
We will continue to monitor program implementation and to increase our focus on program outcomes. We look forward to sharing these results in next year’s report and beyond.
33

Appendix I. Additional IndicatorsWe have reported on all indicators that we collected in 2012 in the primary report, except those listed in Table 3 below. We list the results for omitted indicators with an explanation for excluding them from the primary report.
Indicator Rationale for Not Reporting 2012 Result
Percentage of libraries that we supported implementing book classification systems
This indicator is superseded by “percentage of libraries we supported implementing book leveling systems,” reported on page 19.
100%
We have concerns about the reliability of this indicator, as the data were highly variable in quality and consistency during collection. In 2013, we plan to clarify this indicator’s definition for better data reliability.
22%
The purpose of this indicator is to inform our future water and sanitation guidelines. We collect these data across all toilets at our infrastructure sites, even where we have not built the toilets. We do not report this indicator because it is not derived solely from our own projects.
85%
Percentage of infrastructure projects built in previous three years where communities performed basic maintenance
Percentage of functional toilets at infrastructure projects con-structed in the previous three years
Table 3. Indicators Not Reported in 2012 Global Monitoring Report
Appendix II. About This Report
This report is based on data that our country-based staff collected across almost 7,000 projects—every book published, building constructed and girl, classroom and library supported in 2012. We collect data during ongoing monitoring and support to our programs so that our programs can learn from the regular data they collect. After data collection, our country teams enter the data into a common web-based database. We use this database to provide real-time analysis of the data. In the first quarter of the following year, each country’s Research, Monitoring and Evaluation team leads a reflection process with all programs to examine trends in the data and identify areas for program improvement. The team is responsible for documenting these discussions and ensuring that they feed into the next programmatic annual planning cycle.
We welcome your feedback on this report. Please e-mail your questions and comments to [email protected] with “2012 Global Monitoring Report” in the subject line.
Many individuals contributed to this report. Theresa Chen led worldwide data collection, analysis and report-ing. Shauna Carey, Cory Heyman, Matthew Jukes, Kevin Simmonds and Karen Yu provided valuable editorial feedback. Olivia Byler, Peter Cooper, Stacey Dixson, Monica Griffith, Thomas Henry, Kerri Higby, Kristin McKen-non and Kerri Thomsen provided programmatic review. Emily Witt provided database support. Heather Grates provided design assistance.
Our worldwide Research, Monitoring and Evaluation team led in-country data collection, entry, analysis and reflection. The team consisted of Md. Sarwar Basher, Chantou Heng, Prakash GUS, Madoda Hlongwane, Mini Joshi, Victor Kabwe, Badruzzaman Khan, Anil Kumar, Khanthanouphone Mixaykone, Kelly Mulenga, Neha Nag-pal, Thuy Nguyen, Chanthaneth Phakaysone, Md. Tahseen Qadeer, Thinh Nguyen Quang, Vijay Sastry, Tonin Soeun, Viet Ta, Prashanta Thapa, Dileesh Varghese, Soulinthone Vilayphanh and Jagath Wasantha.
Finally, we would like to offer a special thank you to our Literacy and Girls’ Education staff across the world for providing us with the opportunity to report on their excellent work. We are grateful to all of you.
Data Collection
Feedback?
Acknowledgments
35
Published September 2013